Article

Evaluation of the MODIS C6 Aerosol Optical Depth Products over Chongqing, China

1
Research Center for Atmospheric Environment, Chongqing Institute of Green and Intelligent Technology, Chinese Academy of Sciences, Chongqing 400714, China
2
Center for Excellence in Regional Atmospheric Environment, Institute of Urban Environment, Chinese Academy of Sciences, Xiamen 361021, China
3
Chongqing Environmental Monitoring Center, Chongqing 401147, China
4
Coordinated Center of Excellence for Green Development in Wuling Region, Yangtze Normal University, Chongqing 408100, China
*
Author to whom correspondence should be addressed.
Atmosphere 2017, 8(11), 227; https://doi.org/10.3390/atmos8110227
Submission received: 21 October 2017 / Revised: 16 November 2017 / Accepted: 16 November 2017 / Published: 20 November 2017
(This article belongs to the Section Aerosols)

Abstract

:
The Moderate Resolution Imaging Spectroradiometer (MODIS) Collection 6 (C6) aerosol optical depth (AOD) products from the 10/3 km Dark Target (DT) and Deep Blue (DB) algorithms are firstly evaluated using ground observed AODs by the sun photometer in Chongqing, a mountainous mega-city in southwest China. The validation results show that MODIS AODs from 10/3 km DT algorithm are comparable with those of the sun photometer, although there are slight overestimations. However, the DB algorithm substantially underestimates MODIS AODs when comparing with those of the sun photometer. Error analyses imply that the bias of surface reflectance estimation is the main error source for both algorithms. The cloud screening scheme of the DT algorithm is more effective than the DB algorithm. The cloud vicinity effect should be considered in the quality control processes for both of the algorithms. A sensitivity test suggests that in complex terrain area, like Chongqing, the collocation method in the validation of satellite products should be carefully selected according to local circumstances. When comparing the monthly mean AODs of MODIS products with sun photometer observations, it shows that the Terra MODIS AOD products are valid to represent the mean statuses in summer and autumn, but the monthly mean of Aqua MODIS AODs are limited in Chongqing.

1. Introduction

Atmospheric aerosols draw tremendous attention due to their important role in the radiative budget [1], cloud processes [2], air quality and visibility variation [3], and human health [4]. Acquiring the spatial distribution of aerosol characteristics is essential for better understanding the climate and the environmental effect of aerosols. Satellite remote sensing is the most efficient way to achieve this mission. A variety of satellite sensors are applied to monitor the aerosol distribution on global and regional scales, such as the Moderate Resolution Imaging Spectroradiometer (MODIS) [5], the Multi-angle Imaging Spectroradiometer (MISR) [6], and the Polarization and Directionality of the Earth’s Reflectances (POLDER) [7,8]. Among the level-2 aerosol products of these sensors, aerosol optical depth (AOD) products from MODIS are considered to be the most accurate datasets according to global validation against ground based sun photometer observations [9]. Two MODIS onboard Terra and Aqua measure the earth system in multiple bands since 1999 and 2002, respectively. The Visible Infrared Imaging Radiometer Suite (VIIRS) that is onboard the National Polar-orbiting Partnership (Suomi-NPP) with similar device configuration is expected to be the successor of MODIS [10]. These long-term continuous multi-spectral measurements provide a great opportunity for aerosol studies.
The main sources of anthropogenic aerosols are distributed over continents and the aerosol particles over land directly affect the living environment and human health. Hence, obtaining AOD distribution over land areas is crucial to investigate the relationship between atmospheric pollution and human activities. While aerosol properties are much harder to be retrieved over continents than over oceans due to the inhomogeneity of the land surface reflectance, the land retrieval was firstly achieved over vegetated areas using the Dark Target (DT) algorithm by MODIS science team [11]. Subsequently, the Deep Blue (DB) algorithm was developed to fill the data gaps over scarce vegetated surfaces [12]. The DB algorithm was implemented routinely and the retrieved results were distributed in the operational MODIS products since Collection 5.1 (C5.1). In the latest released collection (Collection 6, C6), several upgrades were conducted for both DT and DB algorithms, along with improvements in radiometric calibration [13]. Particularly, the implementation of the DB algorithm has been extended to all of the land areas except for cloud or snow covered surfaces [14]. Combining MODIS DT and DB algorithms, global covering products of aerosol properties are available over most of the land areas. Moreover, the AOD distributions at relatively higher resolution (3 km in nadir) are reported in C6 products to meet the demand of regional air quality research [13].
In spite of the great success of applying DT and DB algorithms over continents, an evaluation of retrieved aerosol properties is necessary to determine the feasibility of application in relevant climate and environmental studies. Global validation of the MODIS C5 and C6 aerosol products has been performed adequately both over ocean and land by comparing MODIS AODs with ground based AOD measurements [15,16,17,18]. The Expected Error (EE) envelope, containing at least 67% of the AOD matchups, was always used to describe the accuracy of retrieved AODs [15]. Global validation against the Aerosol Robotic NETwork (AERONET) observations revealed that the EE of retrieved 550 nm AODs over continents is about ± ( 0.05   +   15 % ) for both the C5 and C6 DT algorithm [13,15]. More detailed analyses of DB AOD products were conducted and the EE were related to the observation geometry as ± ( 0.086   +   56 % ) / ( μ 0   +   μ ) , where μ 0 and μ were the cosine of solar zenith angle and satellite viewing zenith angle, respectively [16]. In China, the number of nationwide or regional validations of MODIS AOD products has been conducted. Ground based sun photometer measurements that were used in the validations were from both stand-alone site [19] and networks, including AERONET [20,21,22], the Chinese Sun Hazemeter Network (CSHNET) [23,24], and the China meteorological administration Aerosol Remote Sensing NETwork (CARSNET) [25,26]. Most of the already implemented validations focused on the developed regions of China, such as North China Plain, Pearl River Delta, and Yangtze River Delta. Some aimed at special circumstances, such as arid or semi-arid areas and the mountain regions in central China. However, validation over Sichuan Basin is sparse, despite the severely polluted air quality in this region. The only available preliminary validations were conducted in the plain areas, such as the Chengdu site of CARSNET [27,28] and Yanting site of CSHNET [23].
Chongqing is a megacity that is located in the mountainous region of the eastern margin of the Sichuan Basin. The city proper covers around 5500 km2 with a population of about 8.5 million. Because of the high pollutants emissions from intense human activities [29] and unfavorable meteorological conditions, air pollution events occurred frequently, especially in winter [30]. The observed visibility [31], ground based AOD measurements [32], and satellite derived AODs [33,34,35,36] show that Chongqing has long been faced with severe air pollution problems. One way to monitor air quality is by constructing ground-level stations and making continuous observations. But the high cost of observational instruments and facilities limits the spatial coverage of ground-level stations. Moreover, most stations were constructed in recent years in Chongqing. Hence, ground-level stations cannot provide long-term continuous monitoring with high spatial coverage in Chongqing. Satellite remote sensing might be an effective method to fill these gaps because of its abilities of monitoring air quality [37,38,39], providing long-term trends [40,41], and assessing human health effects [42]. In Chongqing and surrounding areas, MODIS AOD products have been widely used in studying the spatial-temporal variations of AODs [33,43] and establishing AOD climatology [35,44]. These products have great potentials to serve air quality monitoring and research. However, MODIS AOD products have not been validated yet in Chongqing, which is characterized by frequent cloud coverage, high surface pollutant emissions, and complex topographical and meteorological conditions. Hence, in this paper, we use the sun photometer observations to evaluate the applicability of MODIS AODs at Chongqing.

2. Experiments

2.1. Sun Photometer AOD

A CE318 sun photometer is deployed at the rooftop of Chongqing Monitoring Center (29°37′ N, 106°30′ E), which is surrounded by typical residential areas. Thus, the monitoring site represents the urban environment in Chongqing. The sun photometer started routinely automatic operation in March 2010 and reported AODs every 15 min. Because of instrument maintenance and quality control, discontinuity of the measured AOD frequently occurred. In total, 20 months between March 2010 and December 2015 were collected for validating MODIS retrieved AODs.
The deployed CE318 sun photometer measured direct sun spectral radiances and derived AODs at several wavelengths between 340 and 1640 nm every 15 min. The clear sky AODs were reported after rigorous cloud screening according to the method described by Smirnov et al. [45]. In order to validate the MODIS AODs at 550 nm, the sun photometer AODs at 440 and 650 nm were interpolated to 550 nm based on the Angstrom Exponent ( α ) using formula τ 550   =   τ 650 ( 550 650 ) α , where α   =   ln ( τ 440 / τ 650 ) ln ( 440 / 650 ) .

2.2. MODIS AOD

In total, three MODIS C6 AOD products at 550 nm, DB/DT AODs at 10 km resolution and DT AODs at 3 km resolution, are validated against the sun photometer measurements. The DT algorithm derives AOD from observed top-of-atmosphere (TOA) reflectance at several visible (VIS) and shortwave infrared (SWIR) bands. A parameterization of the VIS-SWIR surface reflectance relationships reduces the required dimensions to describe the spectrally dependent surface reflectance [5,46,47]. As a result, the released dimensions make the retrieval of aerosol properties possible. Predefined aerosol models, including three spherical fine models and a non-spherical coarse model, and their optical properties were built by cluster analysis of AERONET inversion products [48]. During the retrieving process, one fine model is selected according to geographic location and season. A mixture of the coarse model and the selected fine model is implemented to generate the lookup table (LUT) of calculated spectral TOA reflectance [13]. The mixing ratios and AODs are optimally determined by comparing the LUT and the observed spectral TOA reflectance [5]. The 3 km and 10 km versions of DT algorithm are based on the same inversion theorem, but differ in the principle of selecting useful pixels [13]. In the DB algorithm, pixels over continents are classified into three categories (arid/semi-arid, general vegetation, and urban/built-up and transitional regions) based on the land cover types. Over the arid/semi-arid regions, surface reflectance is determined from a dynamic database depending on location, season, normalized difference vegetation index, and solar/sensor geometry. Over general vegetation regions, as in the DT algorithm, the relationship between VIS and SWIR surface reflectance is parameterized. Over the urban/built-up and transitional regions, a hybrid of these two methods is used to assume the surface reflectance. The optical properties of dust and smoke aerosol models are prescribed as a function of location and season. Analogous to the DT algorithm, the mixing ratios of these models are determined while deriving AODs. In heavy dust cases, a maximum likelihood method is used to pick from a suite of aerosol optical models with different spectral single scattering albedo (SSA) in VIS bands, namely “whiter” or “redder” color [14].
Different quality assurance schemes are used in the DT and DB algorithms. In the DT algorithm, the used TOA reflectances in a 10/3 km pixel are aggregated from 500-m pixels within it. After removing 500-m pixels with the highest 50% and lowest 20% reflectance, cloudy pixels, and pixels failed the dark target test, the remaining 500-m pixels are used to make average TOA reflectance as the inputs for retrieving. The quality assurance flag of the DT algorithm (QA_DT) is determined mainly based on the number of used 500-m pixels and absence of thin cirrus. For the 3 km DT algorithm, the same quality assurance flag is defined [5,13]. The DB algorithm retrieves spectral AODs first at 1 km clear-sky and snow-free pixels. Then, average all of the available 1 km AODs to produce 10 km AOD. The quality assurance flag (QA_DB) is calculated from the total number and standard deviation of 1 km AODs [14]. On the basis of previous studies, retrieved AODs marked as QA_DT = 3 or QA_DB ≥ 2 are reliable [17]. In this study, MODIS AODs are grouped into several datasets according to satellite platforms, algorithms, and QA flags. These datasets were named as P-AA-Q, where P is ‘T’ for Terra or ‘A’ for Aqua, AA is ‘DT’/‘DB’ for 10 km DT/DB algorithms or ‘3K’ for the 3 km DT algorithm, Q is ‘B’ for good quality (QA_DT = 3 or QA_DB ≥ 2), or ‘A’ for all quality (QA_DT ≥ 0 or QA_DB ≥ 1). For instance, ‘T-DT-B’ stands for retrieved 550 nm AODs from MODIS onboard Terra at 10 km resolution using DT algorithm with QA_DT = 3. Besides 550 nm AOD datasets, the cloud fractions are used to assess the sub-pixel clouds contamination in the retrieving processes. For the 10 km DT algorithm, the average distances from cloudy pixel are extracted to further examine the influences of vicinal clouds.

2.3. Comparison Method

Following the spatio-temporal collocation technique of Ichoku, et al. [49], the MODIS AODs surrounding ground site are averaged and compared with the sun photometer AODs averaged within a time window. The size of spatial averaging box is associated with the time window by aerosol diffusion speeds. A widely used collocation method is 50 km by 50 km box with the ground site in the center and corresponding ±30 min of MODIS overpass assuming that the aerosol diffusion speed is 50 km/h. But the relatively large averaging box may reduce the representativeness of averaged MODIS AODs because of topographic and/or aerosol type heterogeneity [15,21,25]. As shown in Figure 1, the ground site is located in a trough valley that is surrounded by mountains exceeding 500 m in height. Hence, we select a 20 km by 20 km averaging box as the inner dashed box in Figure 1. The MODIS pixels across the east or west boundary of this box are discarded to ensure the averaged AODs representing the state in valley floor. Because of the complicated terrain in this region, the wind speed is relatively low (the annual mean wind speed is about 2 m/s) and its vertical gradient is small [50]. Therefore, a low aerosol diffusion speed is expected and is assumed to be 30 km/h in this study. Hence, a 20 km by 20 km box and a ±20 min time window are selected to collocate the MODIS and sun photometer observations.
The averaged MODIS AODs ( τ M ) are evaluated by comparing with sun photometer AODs ( τ S ) using linear correlation regression analysis. Several evaluation metrics are considered, including the number of matchups (N), the linear correlation coefficient (R), the slope (S) and intercept (I) of the linear regression, the median bias error (MBE) and root mean square error (RMSE) between τ M and τ S , and the fraction of matchups (f) in agreement within the EE of the DT algorithm, ( ± ( 0.05   +   15 % ) ). Although the DB algorithm defines EE in a different manner and the 3 km DT algorithm has a less stringent EE, we choose EE of the 10 km DT algorithm as a unified criterion. These metrics represent different aspects of MODIS performance. N gives an estimation of the sampling rate. R is related to the ability of capturing AOD variations. S and I primarily provide evaluations of the prescribed assumptions in the algorithm. Non-zero I mean errors in calibration or surface reflectance assumption. Non-one S means systematic bias, which is mainly caused by improper aerosol models. MBE stands for the overall systematic bias and indicates whether or not MODIS algorithms overestimate AODs. RMSE denotes the random errors, such as sub-pixel clouds contamination and variations of surface and aerosol properties [15,21]. MBE and RMSE are defined in the same way, as presented in de Miguel and Bilbao [51]. The definition of f is according to the description in Levy, et al. [15].

3. Results and Discussion

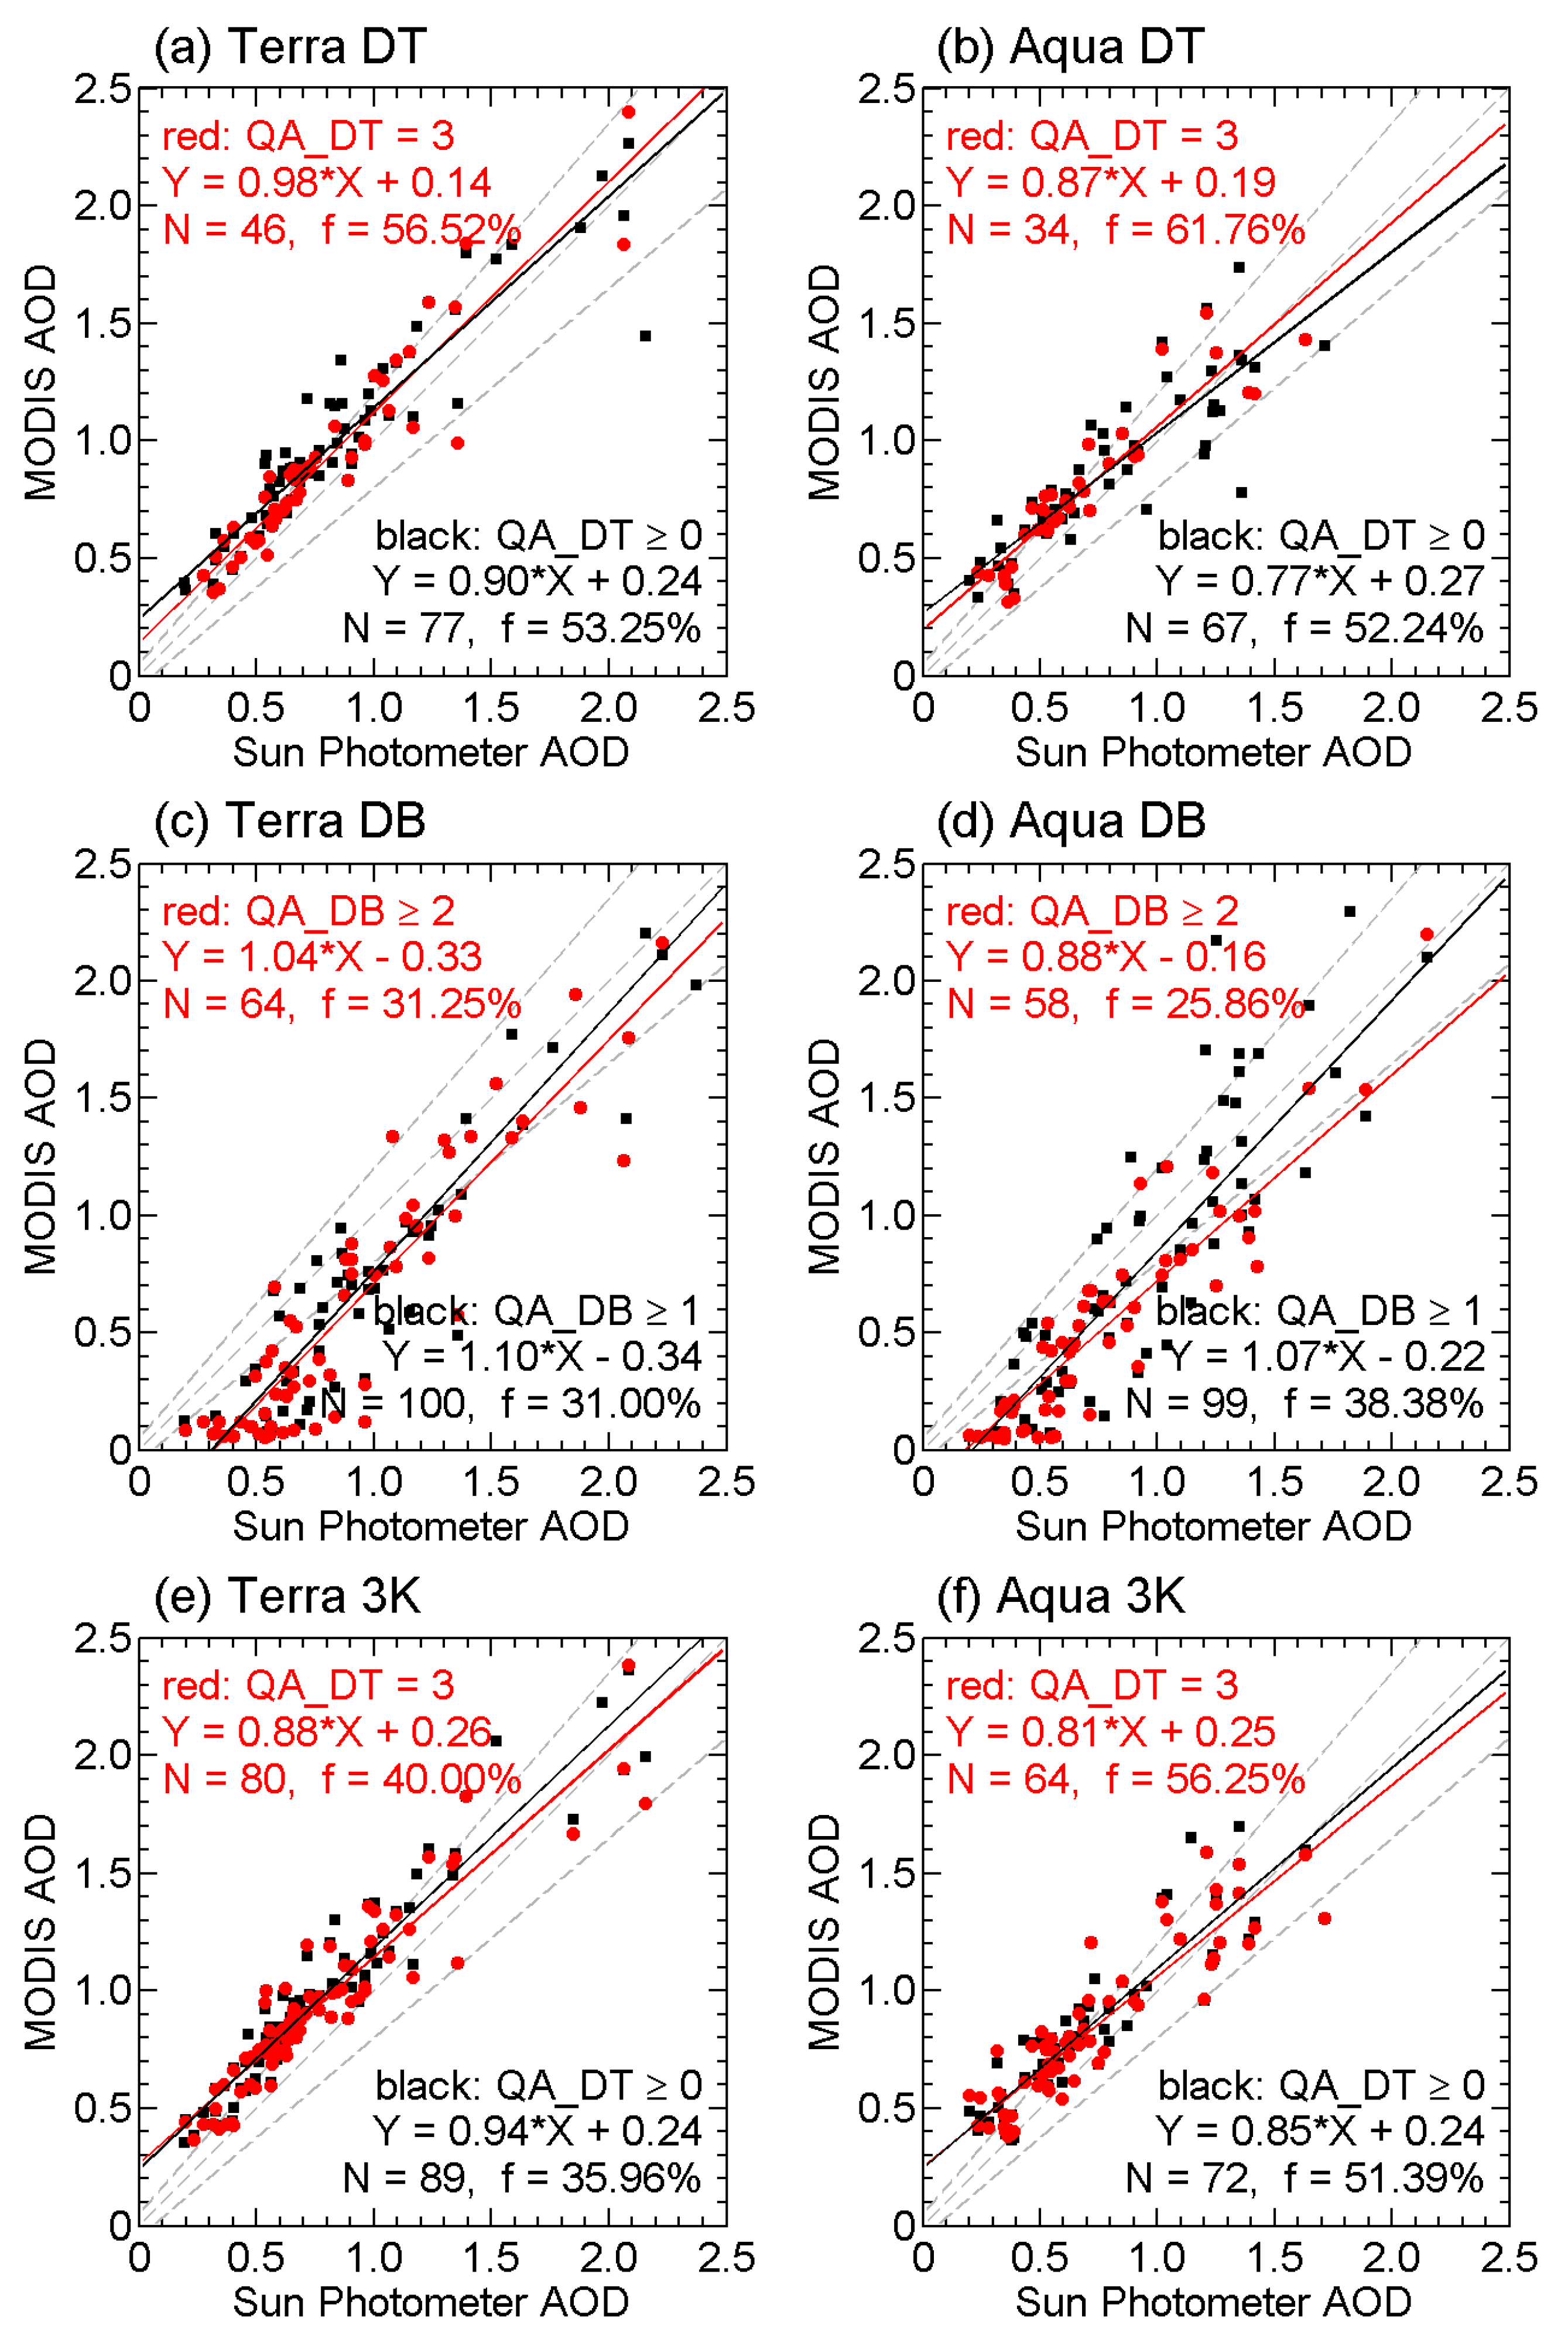
3.1. Validation Results
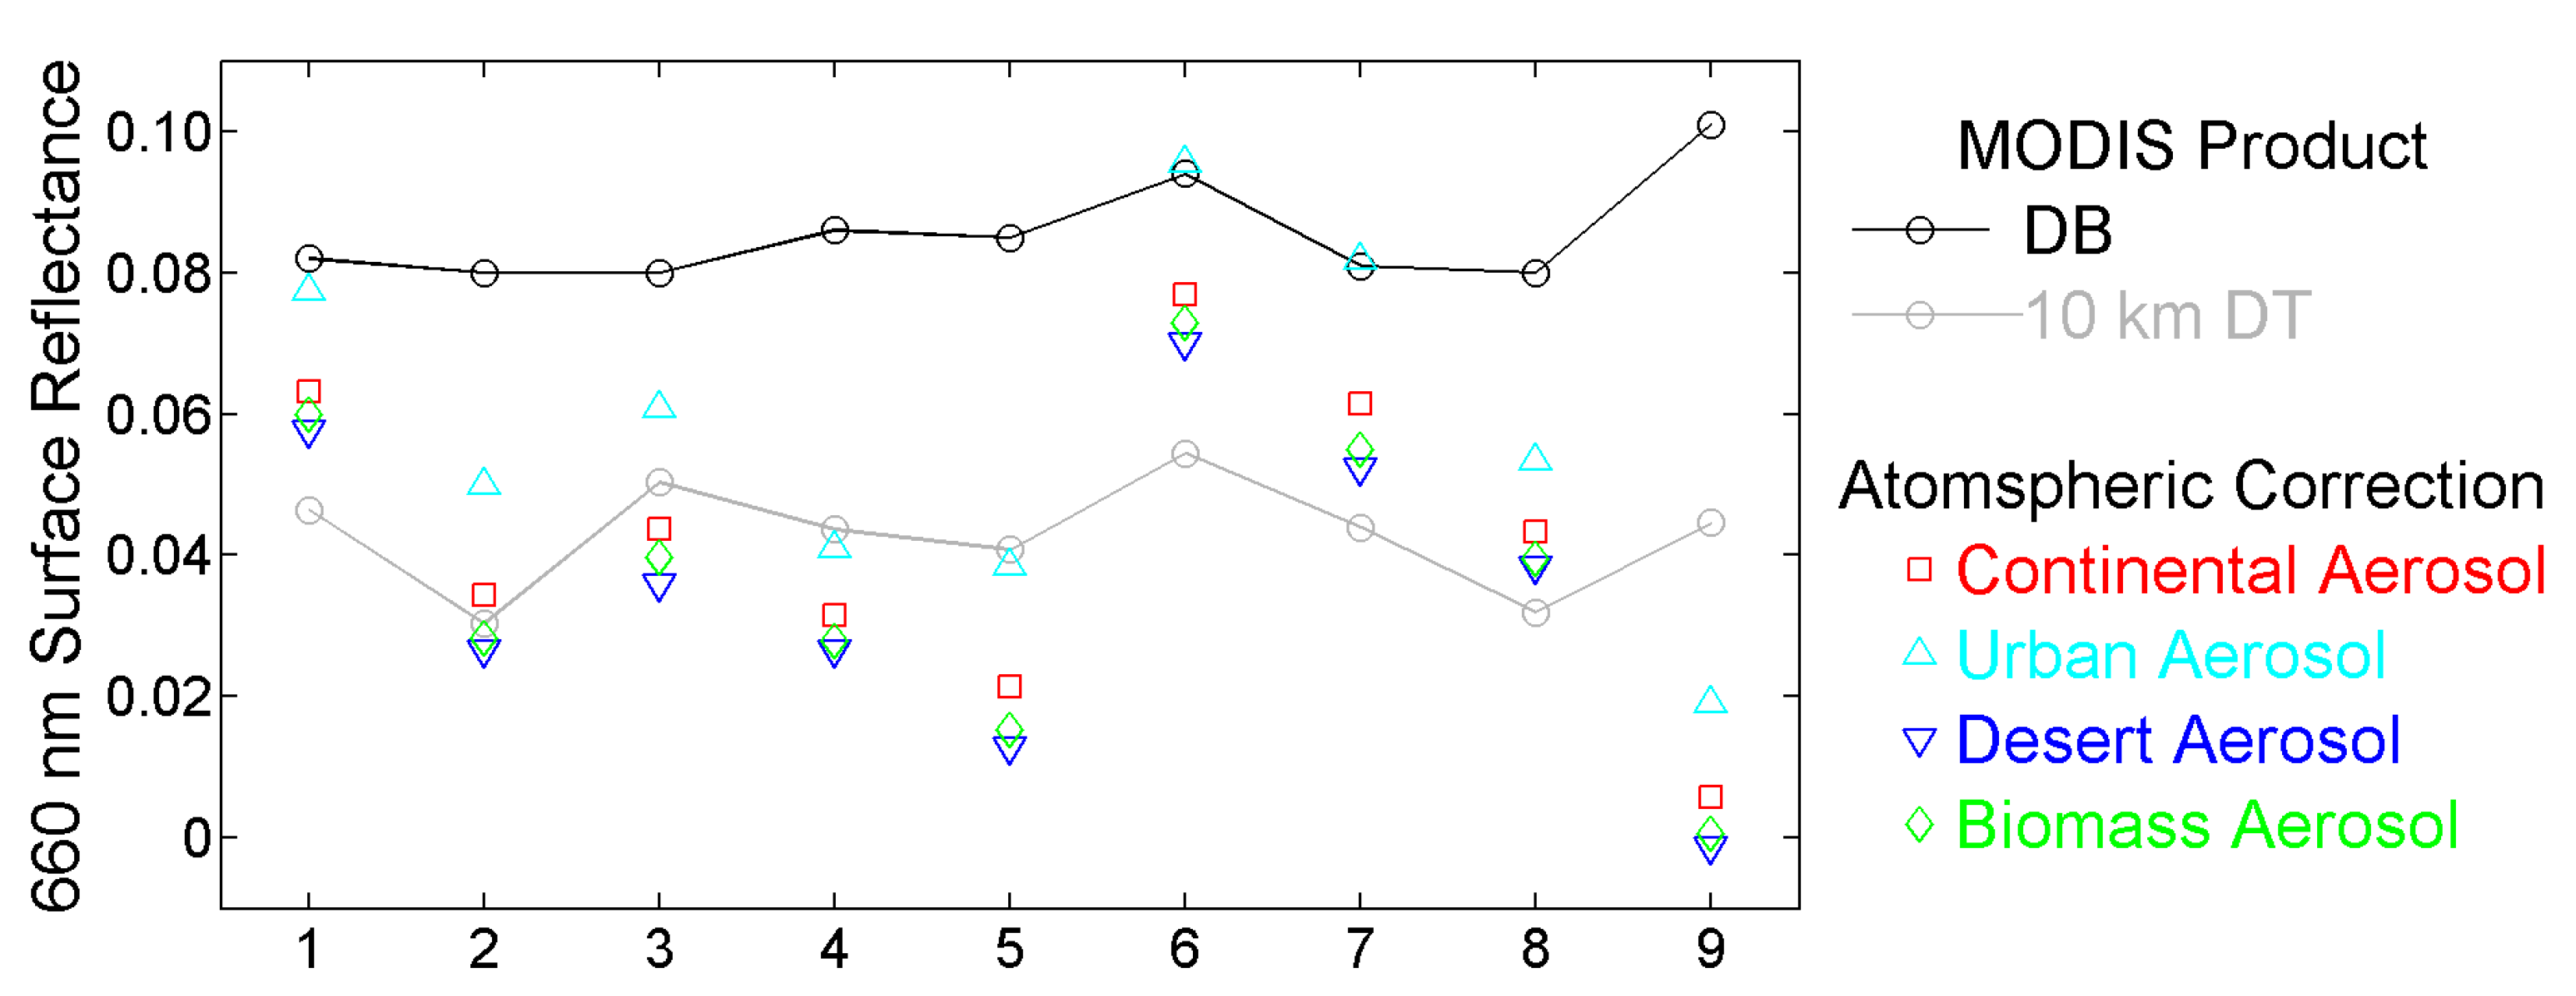
The validation results of MODIS AOD products against sun photometer measurements are presented in Figure 2 and Table 1. Figure 2 shows the scatterplots with sun photometer AODs and MODIS AODs from the 10/3 km DT and DB algorithms for both Terra and Aqua. The statistical values of evaluation metrics are summarized in Table 1.
In general, MODIS AOD products are well correlated with ground observations but there are obvious biases against sun photometer AODs. The minimum of the correlation coefficients for the considered datasets is 0.88 and most of them are larger than 0.90. The remarkably high correlation indicates that the 10/3 km DT and DB algorithms are all capable of capturing the AOD variations in Chongqing. The RMSE for the DT (both 10 km and 3 km versions) and DB algorithms are about 0.20 and 0.35, respectively. The DT algorithms slightly overestimate AODs with the MBE between 0.1 and 0.2. On the contrary, the MBE for DB AODs are between −0.19 and −0.31, suggesting that the DB algorithm significantly underestimates AODs in Chongqing. As a result of random and systematic errors, none of these algorithms can provide more than 66% of retrieved AODs within EE. The maximum f for the DT and DB algorithms are only 61.76% and 38.38%, respectively. Even though considering a relaxed EE ( ± ( 0.05   +   20 % ) ), the f for the DT algorithm does not exceed 64% (not showing in Table 1). When comparing with validations of MODIS C6 products in other regions of China [19,22,52], the correlation coefficients are relatively higher for both of the validated algorithms in Chongqing. The RMSE for the DT algorithm are lower than those in most of the other regions, while higher RMSE are identified for the DB algorithm. AODs from the 10/3 km DT algorithm have comparable accuracy in Chongqing than that in most of the other regions of China. But poorer performance of the DB algorithm is verified.
In Chongqing, the complex terrain and high cloud cover [50] make the quality control procedures extremely important in AOD retrieving. As shown in Figure 2 and Table 1, the number of matchups for the 10 km DT and DB algorithms are increased by half if we turn the rigorous quality control to slack one. But, the 3 km DT algorithm does not show such enormous increase of N. The retrieved AODs with lower confidence are more possible to be influenced by unscreened cloudy pixels. Thus, in Figure 2 the MODIS AODs with good quality (red dots) are apparently smaller than those with all of the quality (black squares). As a result, the overestimations of the DT algorithm gets slightly worse while relaxing the quality control. Including potential cloud contaminated pixels may remedy the underestimations of the DB algorithm to some extent. Therefore, the improvement in terms of RMSE and MBE should be unreal. By synthesizing the sampling rate and accuracy, the DT AODs with QA_DT ≥ 0 are acceptable in Chongqing. But, for the DB algorithm, even the most confident AOD seems unreliable in quantitative analysis applications.
The retrievals from MODIS onboard Terra and Aqua estimate the clear-sky AODs at different times of the day. The overpass of Terra and Aqua are around 11:00 a.m. and 14:00 p.m. local time (UTC+08:00) in Chongqing, respectively. Due to the enhanced cloud formation in the afternoon, there are fewer matchups for Aqua than Terra [25]. However, comparisons of the statistical results demonstrate that Aqua MODIS performs better than Terra MODIS. For the DT algorithms, the RMSE and MBE of Aqua AODs are smaller, and f are higher. The RMSE, MBE, and f of Aqua AODs from the 3 km DT algorithm are close on magnitude to those of Terra AODs from the 10 km DT algorithm. For the DB algorithm, the RMSE and MBE of Aqua AODs are closer to 0 than those of Terra AODs. But, the f of Terra AODs are higher. Overall, Aqua MODIS provides fewer matchups with sun photometer measurements but more accurate AOD products.
As shown in Figure 2, the DT algorithm seems to be superior over the DB algorithm in Chongqing. However, because more matchups are included in the evaluation of the DB algorithm, it is insufficient to conclude that the assumptions and retrieving methods of the DT algorithm are better. In order to eliminate the potential influences of different matchups, such as diversities of sun/sensor geometry and aerosol properties, we compare the retrieved AODs with sun photometer AODs for the cases when both of the algorithms provided retrievals with good quality. The scatterplots are presented in Figure 3 and statistical results are listed with parentheses in Table 1. After removing the sampling bias, the number of remaining matchups for the 10 km DT AODs does not decrease significantly and the other evaluation metrics (R, RMSE, MBE, and f) vary slightly. For the 3 km, DT AODs that are exceeding half of the matchups are discarded. Small changes are added to R, RMSE, MBE, and f. In these picked cases, statistical results for the 3 km DT AODs are robust and are quite close to those for the 10 km DT AODs. This consistency meets the expectation because these two products share identical theoretical basis. However, for the DB algorithm, the retrieved AODs after discarding are less correlated with and more underestimating the sun photometer AODs. This implies that the relatively poor performance of the DB algorithm, as shown in Figure 2, is not caused by extra samples. Thus, the DT algorithm does prevail over the DB algorithm in Chongqing. Careful inspecting and improving of the DB algorithm are requisite.

3.2. Error Analysis

The inversion algorithm retrieves AODs from observed spectral TOA reflectance. Processes contributing to the TOA reflectance include the scattering of incident solar energy by atmospheric constituents and reflecting of the direct and scattered solar radiation by underlying surface. Hence, the aerosol optical assumptions and surface reflectance determination are important error sources in the MODIS AOD retrieval procedures. We conduct linear regression analysis between MODIS AODs and sun photometer AODs for both of the algorithms to investigate the accuracy of their assumptions about aerosol models and surface reflectance. The regression lines are shown in Figure 2, and the resulting slopes and intercepts are listed in Table 1. The slope of the linear regression tends to be associated with the assumptions of aerosol models (specifically the SSA of aerosol particles). The intercept is related to the accuracy of surface reflectance estimation [15,16].
From Figure 2 and Table 1, we can infer that the slopes of regression for 10/3 km DT datasets with good quality are less than 1, while it is larger and less than 1 for T-DB-B and A-DB-B, respectively. The absolute departure of S from 1 for A-3K-B is the largest among all of the datasets with good quality. The other S are within the EE, namely 0.85–1.15. This indicates that the aerosol models used in the DT and DB algorithms are applicable in Chongqing despite the existing deviations. A slope smaller than 1 means that the prescribed aerosol model scatters more incident radiation to the observing direction than that in reality, or overestimate the SSA of aerosol particles, and vice versa. Hence, in Chongqing, a more absorbing aerosol model should be used for the DT algorithm in order to further improving AOD products. For both of the algorithms, the diurnal variations of SSA should be taken into consideration while implementing retrieval for Terra and Aqua. Kuang, et al. [53] suggested that the enhanced hygroscopic growth due to higher relative humidity caused higher SSA in the morning than in the afternoon. This is consistent with the result that S for Aqua datasets are less than those for Terra. Therefore, importing different aerosol models for Terra and Aqua could potentially improve the AOD products. However, seldom studies on the aerosol microphysical properties and corresponding optical properties in Chongqing have been reported in the literatures.
Intercepts of the regression imply that the DT algorithm slightly underestimates the surface reflectance and the DB algorithm is on the opposite. When considering only the datasets with good quality, the minimum (maximum) absolute values of the intercepts for the 10 km DT, 3 km DT and DB algorithms are 0.14 (0.16), 0.25 (0.26) and −0.16 (−0.33), respectively. The 3 km DT algorithm provides poorer estimations of surface reflectance. The cloud masking and AOD retrieving schemes of the 10/3 km DT algorithm are the same. But, the 3 km DT algorithm uses some 500-m pixels, which are discarded by the 10 km DT algorithm. Including some of more potential unsuitable pixels can explain the larger intercept for the 3 km DT algorithm. When including only the intersection matchups of the DT algorithm, their regression coefficients are almost the same, as shown in Figure 3, and parenthesized I values in Table 1. For the DB algorithm, the surface reflectance is overestimated to a greater extent. The intercepts are −0.33 and −0.16 for Terra and Aqua, respectively. Tao et al. [22] gave regression coefficients for the 10 km DT and DB algorithm when the two algorithms both provided matchup. The intercepts for the 10 km DT algorithm were about 0.13 at Beijing (in northern China), 0.09 at Hangzhou (in eastern China), and 0.05 at Hong Kong (in southern China). Their absolute departures from 0 were less than 0.05 for the DB algorithm in these three cities. By comparing with the parenthesized I in Table 1, we find that in Chongqing, the DT algorithm estimates surface reflectance at similar accuracy with that in the urban area of northern China. But the DB algorithm terribly overestimates the surface reflectance, although it was robust in Beijing, Hangzhou, and Hong Kong. Another feature is that all of the intercepts and MBE are positive for the DT algorithm and negative for the DB algorithm. The absolute values of the intercepts for all datasets with good quality are larger than the absolute values of relevant RMSE and MBE except RMSE for T-DT-B, RMSE for T-DB-B, and RMSE and MBE for A-DB-B. This implies that the offsets of AODs that are caused by errors of surface reflectance are the major contributors to the overestimations/underestimations of the DT/DB algorithms and influences from other factors compensated these biases to some extent. To verify this, the TOA reflectance at 0.66 μm was extracted from MODIS products as inputs of the 6SV radiative transfer model to calculate the surface reflectance by conducting atmospheric corrections [54]. Because no information on aerosol models are available, we used four built-in models of 6SV to represent the possible variation ranges, including the Continental, Urban, Desert, and Biomass models. The SSA of these four models are 0.89, 0.68, 0.97, and 0.92, respectively. The atmospheric correction was conducted only for cases with CE318 AODs less than 0.5. In total, nine cases were found. The surface reflectance from the DB/DT algorithms and atmospheric corrections are presented in Figure 4. Because aerosols in the real atmosphere are a mixture of different types, the atmospheric corrected surface reflectance using the Urban and Desert aerosol models might be close to the possible upper and lower limits. The results show that the surface reflectances from the DB algorithm were obviously overestimated and those from the DT algorithm were much lower. Hence, adjusting the surface reflectance assumptions for both algorithms is crucial to improving the accuracy of MODIS AODs in Chongqing.

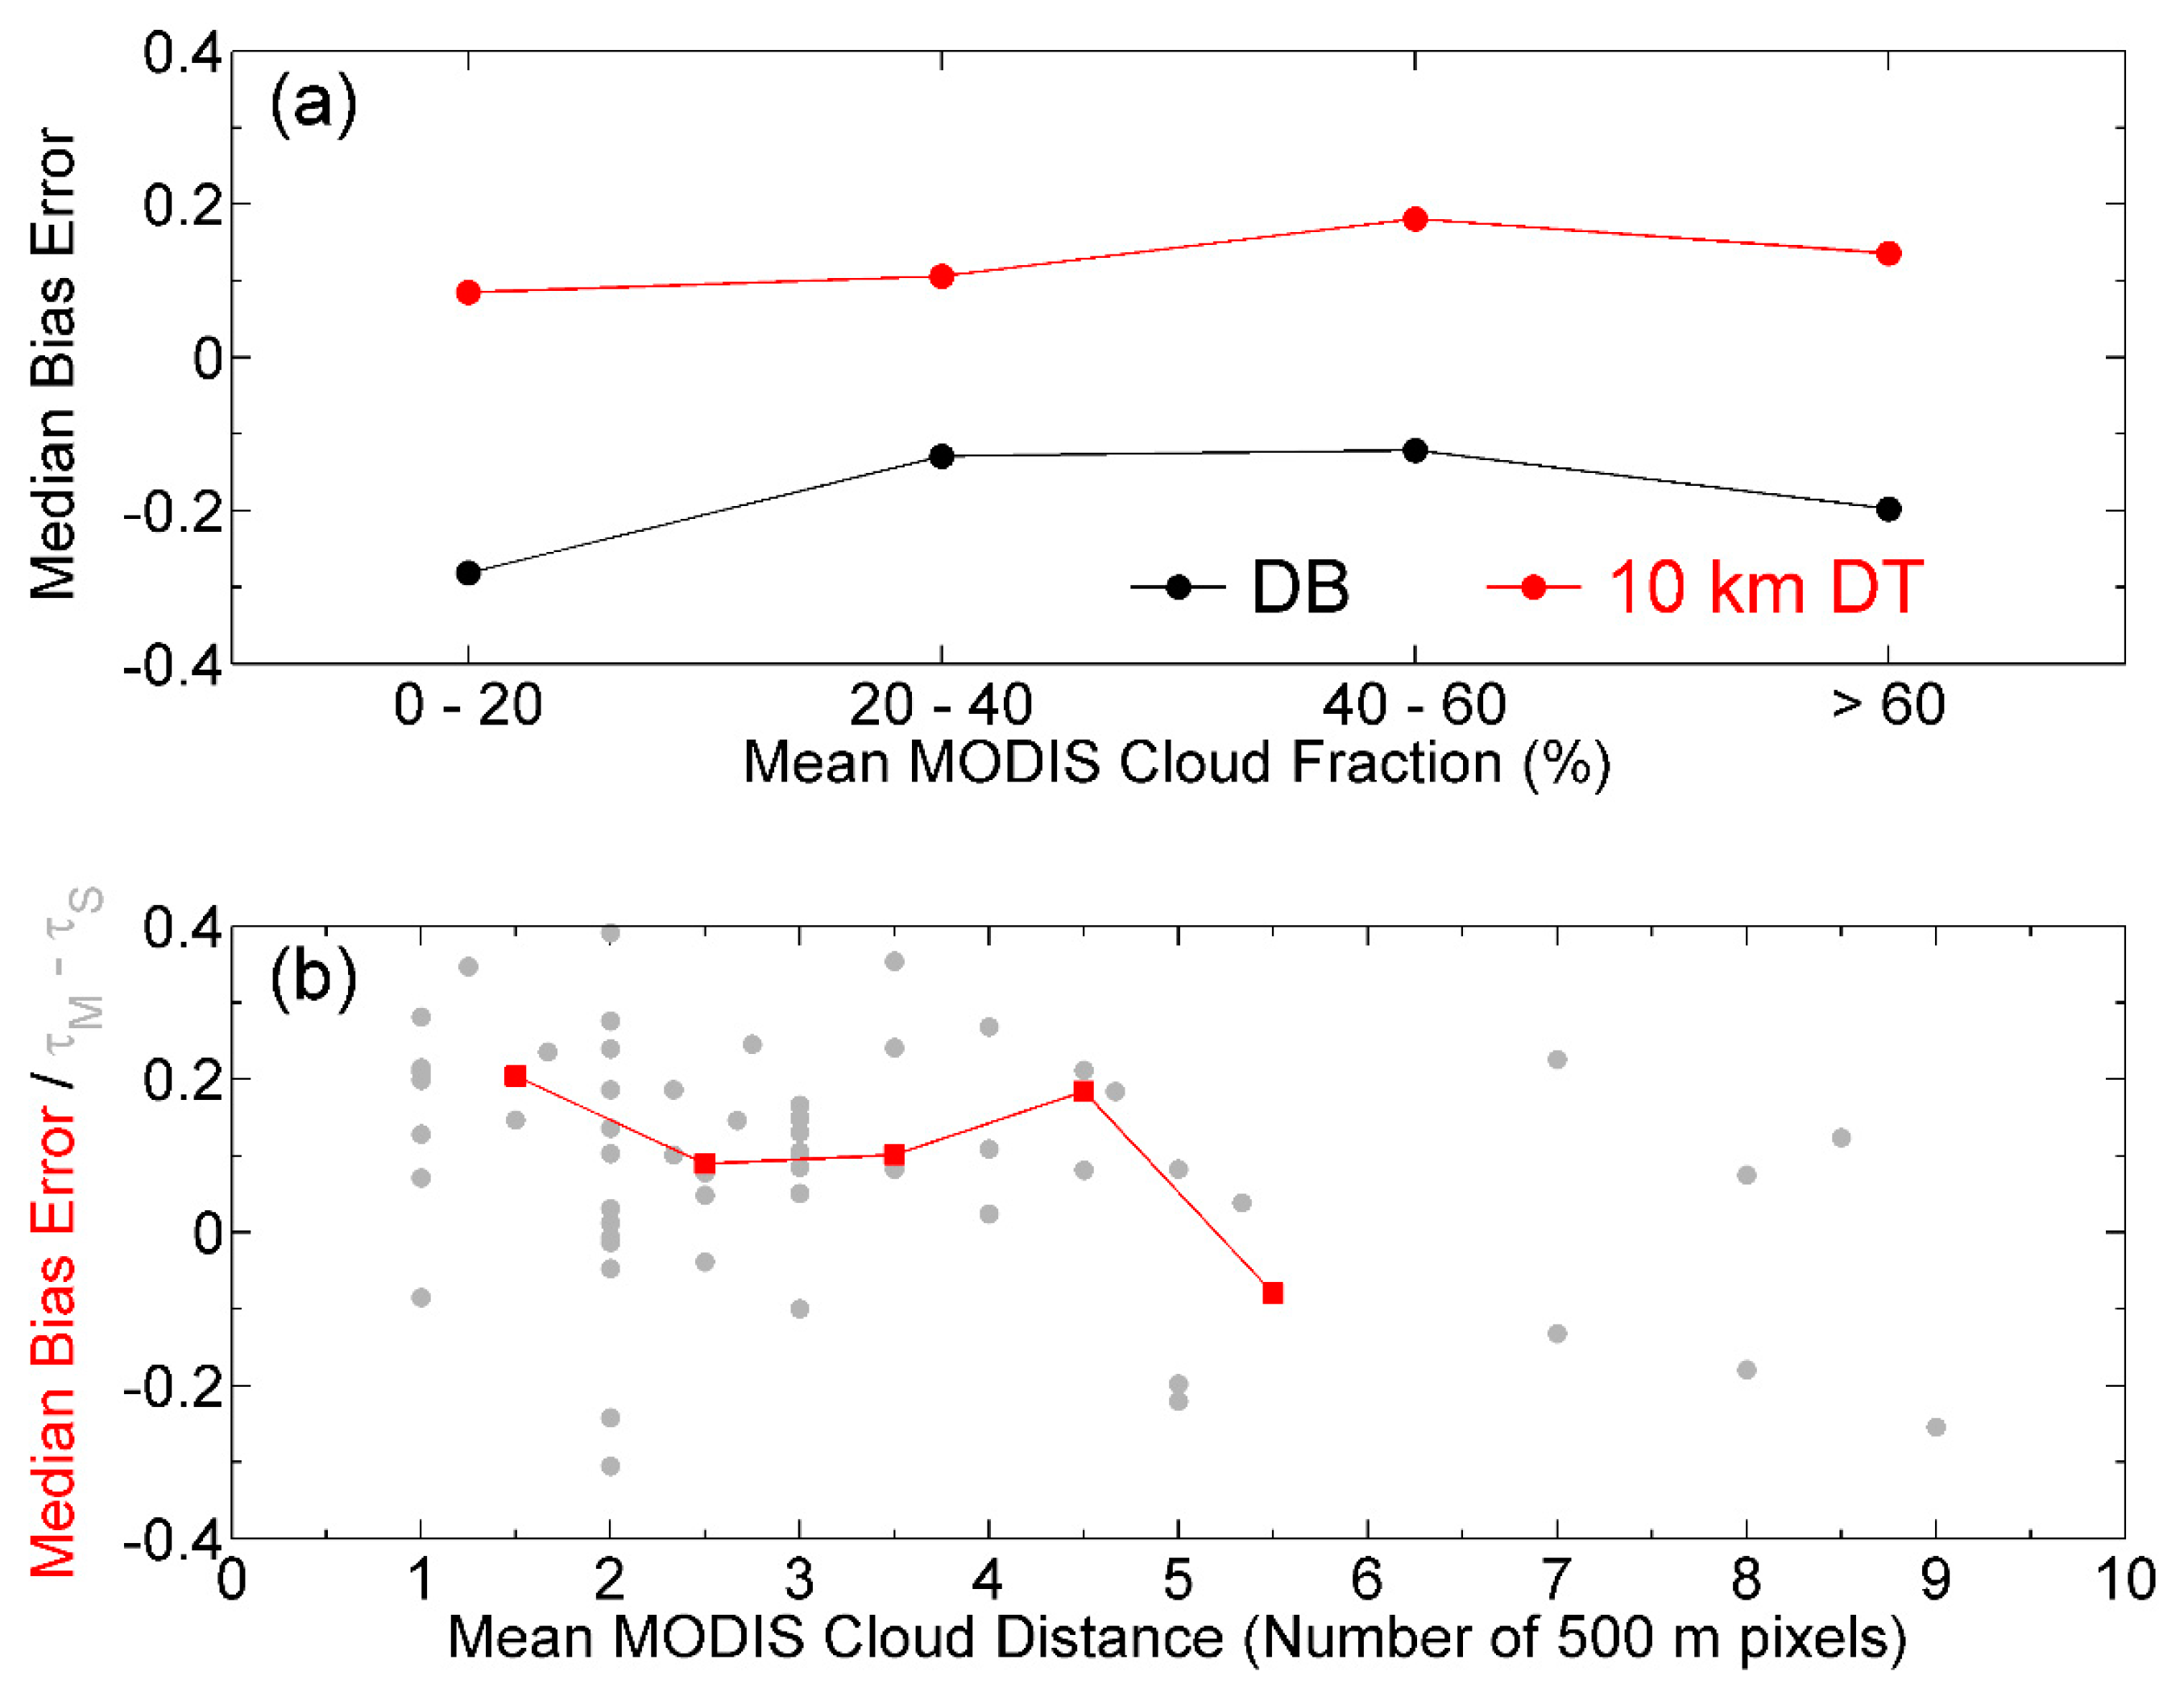
3.3. Influence of Cloud Contamination

Successful cloud screening is critical in retrieving aerosol properties from satellite observed TOA reflectance. In Figure 5a, the median biases between the MODIS and sun photometer AODs in different bin of the mean cloud fractions for the DB and 10 km DT algorithms are presented. In low cloud fraction cases (i.e., cloud fraction < 60%), the median biases for the 10 km DT algorithm increase as the mean cloud fractions. But, there is a decreasing tail when the cloud fraction is greater than 60%. The variation trends of the median biases for the DB algorithm are similar to that for the 10 km DT algorithm but with a stronger fluctuation. The differences between the maximum and minimum biases for A-DT-A and A-DB-A datasets are less than 0.1 and near 0.2, respectively. In clear-sky cases (with cloud fraction between 0% and 20%), the median bias of the 10 km DT algorithm is close to the overall median bias (0.1, as shown in Table 1). However, for the DB algorithm, the median bias in the clear-sky cases is more negative than the overall bias (−0.19). This indicates that the 10 km DT algorithm could efficiently reduce the cloud contamination in aerosol retrieving process. But, the DB algorithm includes more potential cloudy pixels and leads to higher retrieved AOD, which compensates part of the offsets that are caused by improper surface reflectance estimations.
In the 10 km DT algorithm, the cloud pixels are screened at 500 m resolution. The distance from the nearest cloudy pixel for each 500-m pixel is also reported. The biases between the A-DT-A dataset and sun photometer AODs as a function of the mean cloud distances are presented in Figure 5b. The median biases in different bin of mean cloud distance are plotted as well. The median biases decreases as the mean cloud distance increases when the cloud distances are less than 4. There are too few matchups in cases with larger cloud distances to decide the trends. The maximum median bias occurs at the clouds vicinity (with a cloud distance less than 2) and much larger than the overall bias for A-DT-A dataset. This may be caused by the more potential sub-pixel cloud contaminations and three-dimensional scattering of the clouds [55]. The relatively high biased retrieval in clouds vicinity suggests that in order to remedy the cloud influence to the greatest extent, it is of equal importance to consider the cloud distance besides cloud fraction in the quality control processes. A distance of 1 km (two 500-m pixels) away from the cloudy 500-m pixel is recommended.

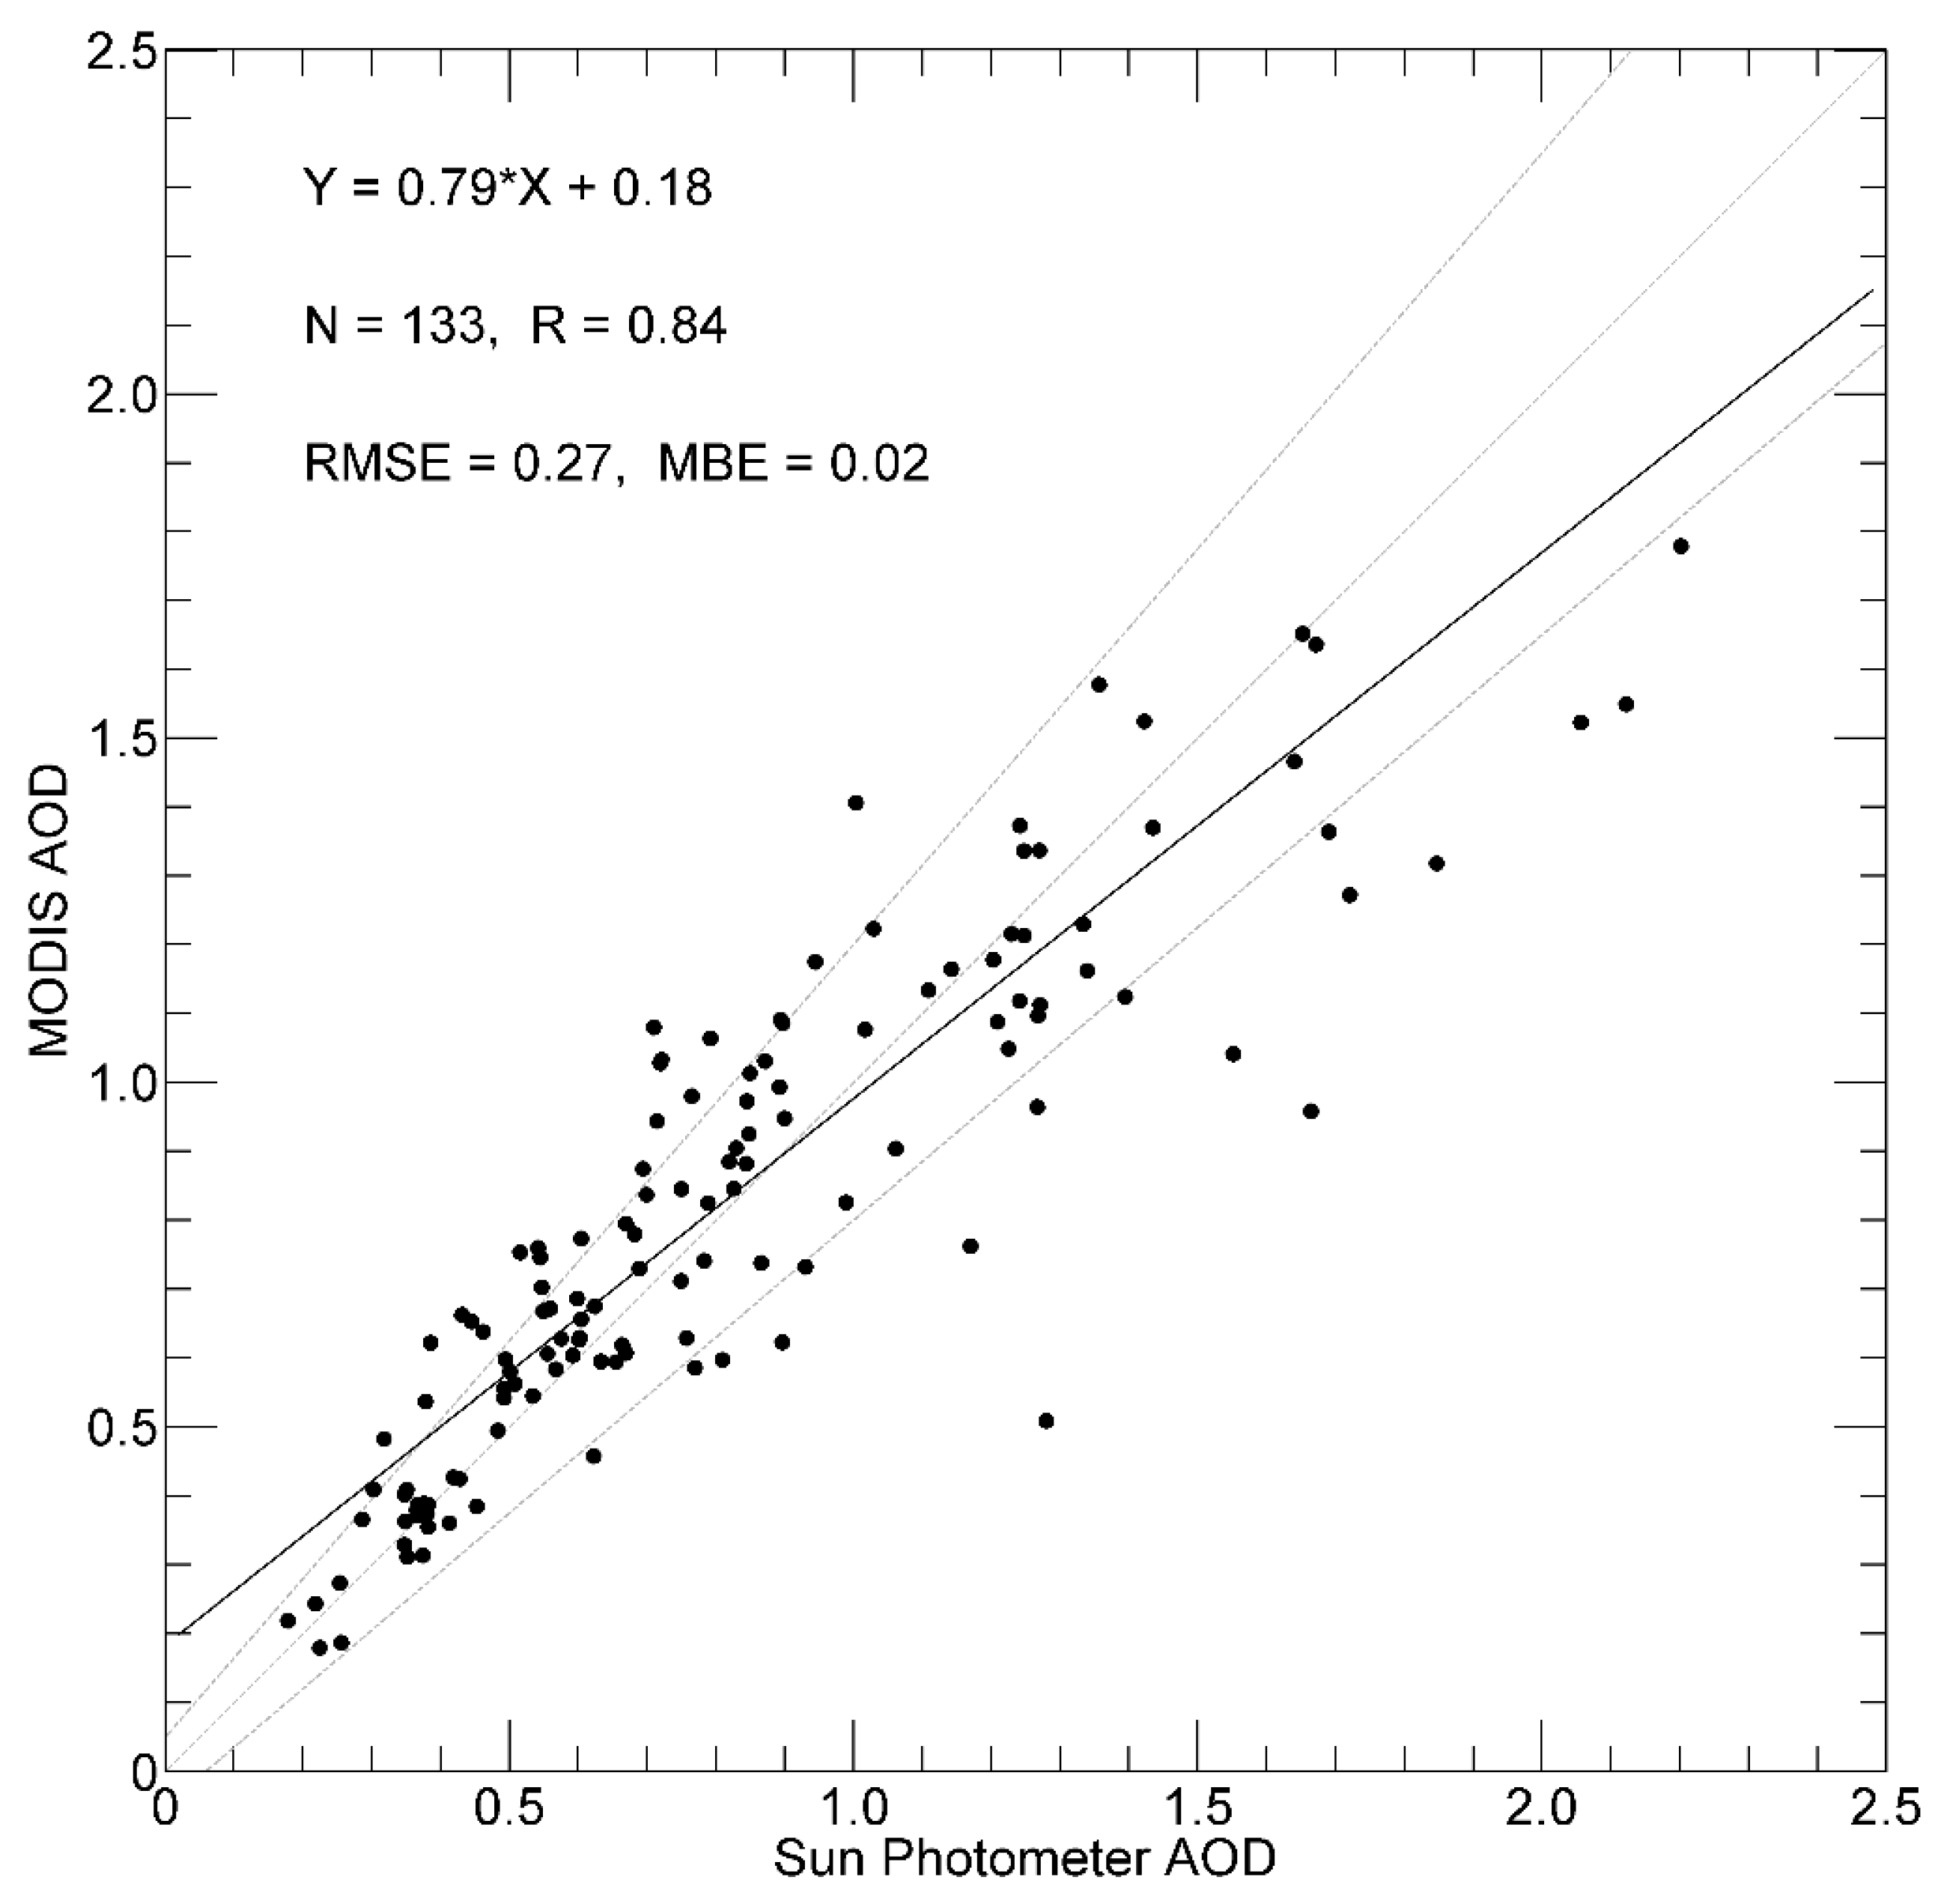
3.4. Influence of Collocation Method

The collocation method, the spatial averaging box, and the temporal averaging time window, is essential to make a comparison between the satellite and ground observations [49]. In previous studies, several factors that could produce occasional large AOD differences had been identified, including topography [15], land use [25], and gradients of AOD or aerosol optical properties [21]. In Chongqing, the terrain is quite complicated, as shown in Figure 1. The resulting clustered emission sources and poor diffusion conditions lead to severe variations of AODs and aerosol properties at different locations. Most of the emission sources are concentrated in the same valley floor where the ground site is located in. The AODs in the surrounding areas are smaller in most cases. Hence, in this study, we choose the inner dashed box in Figure 1 as the spatial averaging boundaries to make sure that the pixels in hilly areas or vicinal valleys are excluded. To show the effect of the collocation method, we select a 50 km by 50 km box (the outer dashed box in Figure 1) to validate the Aqua MODIS 3 km AODs with good quality. The result is shown in Figure 6. When comparing with Figure 2f and Table 1, the number of matchups is doubled with no surprise. Because that lower AODs are included in the spatial average, the MODIS AODs in Figure 6 are lower especially in the high AOD cases. As the surface reflectance estimations of the DT algorithm are more suitable in non-urban areas, the intercept for 50 km by 50 km box is more close to 0 than that for 20 km by 20 km box. The difference between the statistical results indicates that in complex terrain region, the size of the averaging box should be regulated according to the local circumstances.

3.5. Representativeness of MODIS AOD

As mentioned above, Chongqing is one of the most frequently cloudy areas in China. The sampling rate of MODIS AODs is expected to be lower than most of the other regions. Hence, the representativeness of MODIS AOD products is questionable and needs to be testified. In Figure 7, we present the time series of the monthly mean AODs of MODIS products and sun photometer observations from 2010 to 2015. All of the averaged MODIS AOD products are with good quality and the available retrievals have to cover at least 20% of the days of the entire month (about six days), the same sampling rate criteria implemented for sun photometer AODs. The median, 25% and 75% percentiles, minimum, and maximum of the sun photometer AODs are shown as well. In the cases when the mean of MODIS and sun photometer simultaneously exist, the mean AODs of the DT and DB algorithms are higher and lower than the mean sun photometer AODs, respectively. This is consistent with the validation results in Figure 2. None of the monthly mean AODs from November to February passed the sampling rate test during 2010 and 2015. As a result, the MODIS AOD products are unable to provide seasonal variations in Chongqing. The Terra MODIS provides more valid monthly mean AODs than the Aqua MODIS. Hence, the Terra MODIS is suitable to provide the monthly mean AODs in summer and autumn, and the Aqua MODIS is only useful in limited months. In conclusion, both the accuracy and coverage of the monthly mean AODs from MODIS are very poor in Chongqing.
The discrepancy between the monthly mean AODs of MODIS and sun photometer may be caused by biases of cloud screening processes, the uncertainty of retrieval algorithms, and the diurnal variation of the AODs. The cloud screening of CE318 and MODIS might remove some cases of high aerosol loading. Conversely, some unscreened clouds could cause overestimates of AOD [13,45,56]. The total influence of cloud screening biases is complicated and needs more careful investigation. In the error analysis we address the main causes of algorithm uncertainties are the errors of surface reflectance estimations, especially for the DB algorithm. Therefore, the accuracy of the retrieved AODs is expected to be improved after revising the surface reflectance schemes. Because the AODs at MODIS overpass are related to the daily mean AODs, the gaps between MODIS monthly mean AODs and daily mean AODs could be adjusted. So, the biases between the monthly mean AODs from MODIS and sun photometer may not be a serious issue. The low sampling rate of MODIS in Chongqing is primarily caused by high cloud cover. Meanwhile, the 3 km DT algorithm could provide more coverage of monthly mean AODs than the 10 km DT algorithm with tiny AOD differences. This indicates that retrieving at 3 km resolution may capture more clear-sky pixels between cloudy pixels. In the discussions on cloud contamination, we find that the cloud detection of the DT algorithm is quite effective and a distance of two 500-m pixels away from the cloudy pixel is recommended to remedy the cloud vicinity effects. Hence, it is meaningful to make a trial of retrieving AOD at a finer resolution, e.g., 1 km [57] or 500 m [58], using the DT algorithm after adjusting the surface reflectance determination and taking into account the cloud distances.

3.6. Discussion

Although this study is focused on local issues, several findings are expected to inspire concerns in other regions. Firstly, besides the commonly conducted validation of MODIS AOD products, the representativeness is included in the evaluation as an aspect of the product quality. This is critical in the application of the long-term average of these products. For instance, according to the results of representativeness tests, the annually mean AODs should be biased toward summer and autumn in Chongqing. Hence, cautions should be taken while comparing these annual means with those in other regions. Secondly, the overestimation of surface reflectance in the DB algorithm reduced the confidence of the surface reflectance assumptions, as verified in several cities of China [22]. This evokes the demand of validating the DB AOD products in wider regions carefully. The reasons causing surface reflectance errors need to be further investigated. Thirdly, future research is expected to quantitatively examine the impact of SSA diurnal variations on the retrieval accuracies.

4. Conclusions

In this study, we evaluate the MODIS AOD products by comparing with ground based sun photometer observations in Chongqing. The validation results show that MODIS AOD products are well correlated with ground observations but obvious biases exist as well. Aqua MODIS provides less retrieval than Terra MODIS because of the different overpass time. The DT algorithm has comparable accuracy in Chongqing than that in most other regions of China. But, the DB algorithm significantly underestimates AODs, even for the most confident retrievals. After discarding the extra matchups for the DB algorithm, the underestimations still exist. Based on the results of validation and analyzing the impact of quality control and sampling rate differences, we conclude that the DT algorithm prevails over the DB algorithm in Chongqing.
The error analyses identify that the deviation of surface reflectance estimation is the main error sources for both DT and DB algorithms. In the DT algorithm, the surface reflectance at visible wavelengths in urban areas is slightly underestimated. In the DB algorithm, the surface reflectance is overestimated to a greater extent. Hence, it is crucial to adjusting the surface reflectance assumptions for both of the algorithms in Chongqing. Besides, correction on the prescribed aerosol models is also needed to further improving the AOD products. A more absorbing aerosol model should be used for the DT algorithm. For both algorithms, the diurnal variations of SSA should be taken into consideration while implementing retrieval for Terra and Aqua.
Influences of some other factors, such as cloud contamination and collocation method, are also examined. The results indicate that the cloud screening of the DT algorithm is quite successful in Chongqing. But, the DB algorithm makes a poorer cloud masking. Both the cloud fraction and cloud vicinity effects are very important to remedy the cloud influence. A distance of 1 km (two 500-m pixels) away from the cloudy 500-m pixel is recommended. The collocation method used for finding satellite-ground matchups could also leads to occasional discrepancy. The selection of the spatial averaging box should be regulated according to the local circumstances, especially in complex terrain areas.
The monthly mean of MODIS AOD products and sun photometer observations are compared to check the representativeness of MODIS AOD products in Chongqing. The Terra MODIS AOD products are valid to represent the mean status in summer and autumn, but failed to describe the seasonal variations because of the lacking of samples from November to February. Meanwhile, the monthly means of Aqua MODIS AODs are quite limited in Chongqing. Integrating the results of error analysis and cloud contamination examining, we suggest that the representativeness of the DT algorithm may be improved if we retrieve AOD at a finer resolution, e.g., 1 km or 500 m, after adjusting the surface reflectance determination and taking into account the cloud distance.

Acknowledgments

This study is partially supported by the National Key R&D Program of China (2016YFC0200400), the “Light of West China” Program and the “Strategic Priority Research” Program (KJZD-EW-TZ-G06) of the Chinese Academy of Sciences, the National Natural Science Foundation of China (41375123), and Chongqing Science and Technology Commission (cstc2014yykfC20003, cstckjcxljrc13).

Author Contributions

Fumo Yang conceived and designed this study; Ruiling Liu undertook the calibration and maintenance of the sun photometer; Guangming Shi and Ding Yi Wang analyzed the data; Guangming Shi, Fumo Yang and Ding Yi Wang wrote the paper.

Conflicts of Interest

The authors declare no conflict of interest.

Abbreviations

AERONETthe Aerosol Robotic NETwork
AODAerosol Optical Depth
CARSNETthe China meteorological administration Aerosol Remote Sensing NETwork
CSHNETthe Chinese Sun Hazemeter Network
DBDeep Blue
DTDark Target
EEExpected Error
LUTLook-Up Table
MBEMedian Bias Error
MISRthe Multi-angle Imaging Spectroradiometer
MODISthe Moderate Resolution Imaging Spectroradiometer
POLDERthe Polarization and Directionality of the Earth’s Reflectances
QAQuality Assurance
RMSERoot Mean Square Error
Suomi-NPPthe National Polar-orbiting Partnership
SWIRShortwave Infrared
TOATop of Atmosphere
VIIRSthe Visible Infrared Imaging Radiometer Suite
VISVisible

References

  1. Fuzzi, S.; Baltensperger, U.; Carslaw, K.; Decesari, S.; van Der Gon, H.D.; Facchini, M.C.; Fowler, D.; Koren, I.; Langford, B.; Lohmann, U.; et al. Particulate matter, air quality and climate: Lessons learned and future needs. Atmos. Chem. Phys. 2015, 15, 8217–8299. [Google Scholar] [CrossRef] [Green Version]
  2. Fan, J.; Wang, Y.; Rosenfeld, D.; Liu, X. Review of aerosol-cloud interactions: Mechanisms, significance and challenges. J. Atmos. Sci. 2016, 73, 4221–4252. [Google Scholar] [CrossRef]
  3. Li, J.; Li, C.C.; Zhao, C.S.; Su, T.N. Changes in surface aerosol extinction trends over china during 1980–2013 inferred from quality-controlled visibility data. Geophys. Res. Lett. 2016, 43, 8713–8719. [Google Scholar] [CrossRef]
  4. Kim, K.H.; Kabir, E.; Kabir, S. A review on the human health impact of airborne particulate matter. Environ. Int. 2015, 74, 136–143. [Google Scholar] [CrossRef] [PubMed]
  5. Levy, R.C.; Remer, L.A.; Mattoo, S.; Vermote, E.F.; Kaufman, Y.J. Second-generation operational algorithm: Retrieval of aerosol properties over land from inversion of Moderate Resolution Imaging Spectroradiometer spectral reflectance. J. Geophys. Res. Atmos. 2007, 112. [Google Scholar] [CrossRef]
  6. Martonchik, J.V.; Diner, D.J. Retrieval of aerosol optical-properties from multi-angle satellite imagery. IEEE Trans. Geosci. Remote 1992, 30, 223–230. [Google Scholar] [CrossRef]
  7. Herman, M.; Deuze, J.L.; Marchand, A.; Roger, B.; Lallart, P. Aerosol remote sensing from POLDER/ADEOS over the ocean: Improved retrieval using a nonspherical particle model. J. Geophys. Res. Atmos. 2005, 110. [Google Scholar] [CrossRef]
  8. Tanre, D.; Breon, F.M.; Deuze, J.L.; Dubovik, O.; Ducos, F.; Francois, P.; Goloub, P.; Herman, M.; Lifermann, A.; Waquet, F. Remote sensing of aerosols by using polarized, directional and spectral measurements within the A-Train: The PARASOL mission. Atmos. Meas. Tech. 2011, 4, 1383–1395. [Google Scholar] [CrossRef] [Green Version]
  9. Breon, F.M.; Vermeulen, A.; Descloitres, J. An evaluation of satellite aerosol products against sunphotometer measurements. Remote Sens. Environ. 2011, 115, 3102–3111. [Google Scholar] [CrossRef]
  10. Jackson, J.M.; Liu, H.Q.; Laszlo, I.; Kondragunta, S.; Remer, L.A.; Huang, J.F.; Huang, H.C. Suomi-NPP VIIRS aerosol algorithms and data products. J. Geophys. Res. Atmos. 2013, 118, 12673–12689. [Google Scholar] [CrossRef]
  11. Kaufman, Y.J.; Tanre, D.; Remer, L.A.; Vermote, E.F.; Chu, A.; Holben, B.N. Operational remote sensing of tropospheric aerosol over land from EOS moderate resolution imaging spectroradiometer. J. Geophys. Res. Atmos. 1997, 102, 17051–17067. [Google Scholar] [CrossRef]
  12. Hsu, N.C.; Tsay, S.-C.; King, M.D.; Herman, J.R. Aerosol properties over bright-reflecting source regions. IEEE Trans. Geosci. Remote 2004, 42, 557–569. [Google Scholar] [CrossRef]
  13. Levy, R.C.; Mattoo, S.; Munchak, L.A.; Remer, L.A.; Sayer, A.M.; Patadia, F.; Hsu, N.C. The Collection 6 MODIS aerosol products over land and ocean. Atmos. Meas. Tech. 2013, 6, 2989–3034. [Google Scholar] [CrossRef]
  14. Hsu, N.; Jeong, M.J.; Bettenhausen, C.; Sayer, A.; Hansell, R.; Seftor, C.; Huang, J.; Tsay, S.C. Enhanced Deep Blue aerosol retrieval algorithm: The second generation. J. Geophys. Res. Atmos. 2013, 118, 9296–9315. [Google Scholar] [CrossRef]
  15. Levy, R.C.; Remer, L.A.; Kleidman, R.G.; Mattoo, S.; Ichoku, C.; Kahn, R.; Eck, T.F. Global evaluation of the Collection 5 MODIS dark-target aerosol products over land. Atmos. Chem. Phys. 2010, 10, 10399–10420. [Google Scholar] [CrossRef] [Green Version]
  16. Sayer, A.M.; Hsu, N.C.; Bettenhausen, C.; Jeong, M.J. Validation and uncertainty estimates for MODIS Collection 6 “Deep Blue” aerosol data. J. Geophys. Res. Atmos. 2013, 118, 7864–7872. [Google Scholar] [CrossRef]
  17. Sayer, A.M.; Munchak, L.A.; Hsu, N.C.; Levy, R.C.; Bettenhausen, C.; Jeong, M.J. MODIS Collection 6 aerosol products: Comparison between Aqua’s e-Deep Blue, Dark Target, and “merged” data sets, and usage recommendations. J. Geophys. Res. Atmos. 2014, 119, 13965–13989. [Google Scholar] [CrossRef]
  18. Shi, Y.; Zhang, J.; Reid, J.S.; Holben, B.; Hyer, E.J.; Curtis, C. An analysis of the Collection 5 MODIS over-ocean aerosol optical depth product for its implication in aerosol assimilation. Atmos. Chem. Phys. 2011, 11, 557–565. [Google Scholar] [CrossRef] [Green Version]
  19. Ma, Y.; Li, Z.Q.; Li, Z.Z.; Xie, Y.S.; Fu, Q.Y.; Li, D.H.; Zhang, Y.; Xu, H.; Li, K.T. Validation of MODIS aerosol optical depth retrieval over mountains in central China based on a sun-sky radiometer site of SONET. Remote Sens. 2016, 8, 111. [Google Scholar] [CrossRef]
  20. Mi, W.; Li, Z.Q.; Xia, X.G.; Holben, B.; Levy, R.; Zhao, F.S.; Chen, H.B.; Cribb, M. Evaluation of the Moderate Resolution Imaging Spectroradiometer aerosol products at two Aerosol Robotic Network stations in China. J. Geophys. Res. Atmos. 2007, 112. [Google Scholar] [CrossRef]
  21. He, Q.S.; Li, C.C.; Tang, X.; Li, H.L.; Geng, F.H.; Wu, Y.L. Validation of MODIS derived aerosol optical depth over the Yangtze River Delta in China. Remote Sens. Environ. 2010, 114, 1649–1661. [Google Scholar] [CrossRef]
  22. Tao, M.H.; Chen, L.F.; Wang, Z.F.; Tao, J.H.; Che, H.Z.; Wang, X.H.; Wang, Y. Comparison and evaluation of the MODIS Collection 6 aerosol data in China. J. Geophys. Res. Atmos. 2015, 120, 6992–7005. [Google Scholar] [CrossRef]
  23. Li, Z.Q.; Niu, F.; Lee, K.H.; Xin, J.Y.; Hao, W.M.; Nordgren, B.; Wang, Y.S.; Wang, P.C. Validation and understanding of Moderate Resolution Imaging Spectroradiometer aerosol products (C5) using ground-based measurements from the handheld Sun photometer network in China. J. Geophys. Res. Atmos. 2007, 112. [Google Scholar] [CrossRef]
  24. Wang, L.L.; Wang, Y.S.; Xin, J.Y.; Li, Z.Q.; Wang, X.Y. Assessment and comparison of three years of Terra and Aqua MODIS Aerosol Optical Depth Retrieval (C005) in Chinese terrestrial regions. Atmos. Res. 2010, 97, 229–240. [Google Scholar] [CrossRef]
  25. Xie, Y.; Zhang, Y.; Xiong, X.X.; Qu, J.J.; Che, H.Z. Validation of MODIS aerosol optical depth product over China using CARSNET measurements. Atmos. Environ. 2011, 45, 5970–5978. [Google Scholar] [CrossRef]
  26. Li, X.; Xia, X.G.; Wang, S.L.; Mao, J.T.; Liu, Y. Validation of MODIS and Deep Blue aerosol optical depth retrievals in an arid/semi-arid region of northwest China. Particuology 2012, 10, 132–139. [Google Scholar] [CrossRef]
  27. Xu, H.; Guang, J.; Xue, Y.; de Leeuw, G.; Che, Y.; Guo, J.; He, X.; Wang, T. A consistent aerosol optical depth (AOD) dataset over mainland china by integration of several AOD products. Atmos. Environ. 2015, 114, 48–56. [Google Scholar] [CrossRef]
  28. Liu, X.; Chen, Q.; Che, H.; Zhang, R.; Gui, K.; Zhang, H.; Zhao, T. Spatial distribution and temporal variation of aerosol optical depth in the Sichuan basin, China, the recent ten years. Atmos. Environ. 2016, 147, 434–445. [Google Scholar] [CrossRef]
  29. Zhang, Q.; Streets, D.G.; Carmichael, G.R.; He, K.; Huo, H.; Kannari, A.; Klimont, Z.; Park, I.; Reddy, S.; Fu, J. Asian emissions in 2006 for the NASA INTEX-B mission. Atmos. Chem. Phys. 2009, 9, 5131–5153. [Google Scholar] [CrossRef] [Green Version]
  30. Wang, H.; Shi, G.; Tian, M.; Zhang, L.; Chen, Y.; Yang, F.; Cao, X. Aerosol optical properties and chemical composition apportionment in Sichuan basin, China. Sci. Total Environ. 2017, 577, 245–257. [Google Scholar] [CrossRef] [PubMed]
  31. Chen, Y.; Xie, S.D. Long-term trends and characteristics of visibility in two megacities in southwest China: Chengdu and Chongqing. J. Air Waste Manag. Assoc. 2013, 63, 1058–1069. [Google Scholar] [CrossRef] [PubMed]
  32. Che, H.; Zhang, X.Y.; Xia, X.; Goloub, P.; Holben, B.; Zhao, H.; Wang, Y.; Zhang, X.C.; Wang, H.; Blarel, L.; et al. Ground-based aerosol climatology of China: Aerosol optical depths from the China aerosol remote sensing network (CARSNET) 2002–2013. Atmos. Chem. Phys. 2015, 15, 7619–7652. [Google Scholar] [CrossRef]
  33. Guo, J.P.; Zhang, X.Y.; Wu, Y.R.; Zhaxi, Y.Z.; Che, H.Z.; La, B.; Wang, W.; Li, X.W. Spatio-temporal variation trends of satellite-based aerosol optical depth in China during 1980–2008. Atmos. Environ. 2011, 45, 6802–6811. [Google Scholar] [CrossRef]
  34. Meng, F.; Cao, C.Y.; Shao, X. Spatio-temporal variability of Suomi-NPP VIIRS-derived aerosol optical thickness over China in 2013. Remote Sens. Environ. 2015, 163, 61–69. [Google Scholar] [CrossRef]
  35. Xu, X.F.; Qiu, J.H.; Xia, X.G.; Sun, L.; Min, M. Characteristics of atmospheric aerosol optical depth variation in China during 1993–2012. Atmos. Environ. 2015, 119, 82–94. [Google Scholar] [CrossRef]
  36. Zhang, X.Y.; Wang, L.; Wang, W.H.; Cao, D.J.; Wang, X.; Ye, D.X. Long-term trend and spatiotemporal variations of haze over China by satellite observations from 1979 to 2013. Atmos. Environ. 2015, 119, 362–373. [Google Scholar] [CrossRef]
  37. Li, C.; Mao, J.; Lau, A.K.; Yuan, Z.; Wang, M.; Liu, X. Application of MODIS satellite products to the air pollution research in Beijing. Sci. China Ser. D 2005, 48, 209–219. [Google Scholar]
  38. Lin, C.; Li, Y.; Yuan, Z.; Lau, A.K.; Li, C.; Fung, J.C. Using satellite remote sensing data to estimate the high-resolution distribution of ground-level PM 2.5. Remote Sens. Environ. 2015, 156, 117–128. [Google Scholar] [CrossRef]
  39. van Donkelaar, A.; Martin, R.V.; Brauer, M.; Kahn, R.; Levy, R.; Verduzco, C.; Villeneuve, P.J. Global estimates of ambient fine particulate matter concentrations from satellite-based aerosol optical depth: Development and application. Environ. Health Persp. 2010, 118, 847–855. [Google Scholar] [CrossRef] [PubMed]
  40. Li, Y.; Lin, C.; Lau, A.K.; Liao, C.; Zhang, Y.; Zeng, W.; Li, C.; Fung, J.C.; Tse, T.K. Assessing long-term trend of particulate matter pollution in the Pearl River Delta Region using satellite remote sensing. Environ. Sci. Technol. 2015, 49, 11670–11678. [Google Scholar] [CrossRef] [PubMed]
  41. Zheng, S.; Pozzer, A.; Cao, C.; Lelieveld, J. Long-term (2001–2012) concentrations of fine particulate matter (PM 2.5) and the impact on human health in Beijing, China. Atmos. Chem. Phys. 2015, 15, 5715–5725. [Google Scholar] [CrossRef]
  42. Lu, X.; Lin, C.; Li, Y.; Yao, T.; Fung, J.C.; Lau, A.K. Assessment of health burden caused by particulate matter in southern China using high-resolution satellite observation. Environ. Int. 2017, 98, 160–170. [Google Scholar] [CrossRef] [PubMed]
  43. Li, C.C.; Mao, J.T.; Lau, K.H. Characteristics of the aerosol optical depth distributions over Sichuan Basin derived from MODIS data. J. Appl. Meteorol. Sci. 2003, 14, 1–7. [Google Scholar]
  44. Luo, Y.X.; Zheng, X.B.; Zhao, T.L.; Chen, J. A climatology of aerosol optical depth over China from recent 10 years of MODIS remote sensing data. Int. J. Climatol. 2014, 34, 863–870. [Google Scholar] [CrossRef]
  45. Smirnov, A.; Holben, B.N.; Eck, T.F.; Dubovik, O.; Slutsker, I. Cloud-screening and quality control algorithms for the AERONET database. Remote Sens. Environ. 2000, 73, 337–349. [Google Scholar] [CrossRef]
  46. Kaufman, Y.J.; Wald, A.E.; Remer, L.A.; Gao, B.C.; Li, R.R.; Flynn, L. The MODIS 2.1-μm channel—Correlation with visible reflectance for use in remote sensing of aerosol. IEEE Trans. Geosci. Remote 1997, 35, 1286–1298. [Google Scholar] [CrossRef]
  47. Kaufman, Y.J.; Gobron, N.; Pinty, B.; Widlowski, J.L.; Verstraete, M.M. Relationship between surface reflectance in the visible and mid-IR used in MODIS aerosol algorithm-heory. Geophys. Res. Lett. 2002, 29. [Google Scholar] [CrossRef]
  48. Levy, R.C.; Remer, L.A.; Dubovik, O. Global aerosol optical properties and application to Moderate Resolution Imaging Spectroradiometer aerosol retrieval over land. J. Geophys. Res. Atmos. 2007, 112. [Google Scholar] [CrossRef]
  49. Ichoku, C.; Chu, D.A.; Mattoo, S.; Kaufman, Y.J.; Remer, L.A.; Tanre, D.; Slutsker, I.; Holben, B.N. A spatio-temporal approach for global validation and analysis of MODIS aerosol products. Geophys. Res. Lett. 2002, 29. [Google Scholar] [CrossRef]
  50. Wang, S.W.; Li, W.J. Climate of China; China Meteorological Press: Beijing, China, 2007. [Google Scholar]
  51. De Miguel, A.; Bilbao, J. Test reference year generation from meteorological and simulated solar radiation data. Sol. Energy 2005, 78, 695–703. [Google Scholar] [CrossRef]
  52. Nichol, J.E.; Bilal, M. Validation of MODIS 3 km resolution aerosol optical depth retrievals over Asia. Remote Sens. 2016, 8, 328. [Google Scholar] [CrossRef]
  53. Kuang, Y.; Zhao, C.S.; Tao, J.C.; Ma, N. Diurnal variations of aerosol optical properties in the north China plain and their influences on the estimates of direct aerosol radiative effect. Atmos. Chem. Phys. 2015, 15, 5761–5772. [Google Scholar] [CrossRef]
  54. Kotchenova, S.Y.; Vermote, E.F. Validation of a vector version of the 6S radiative transfer code for atmospheric correction of satellite data. Part II. Homogeneous Lambertian and anisotropic surfaces. Appl. Opt. 2007, 46, 4455–4464. [Google Scholar] [CrossRef] [PubMed]
  55. Wen, G.Y.; Marshak, A.; Levy, R.C.; Remer, L.A.; Loeb, N.G.; Varnai, T.; Cahalan, R.F. Improvement of MODIS aerosol retrievals near clouds. J. Geophys. Res. Atmos. 2013, 118, 9168–9181. [Google Scholar] [CrossRef]
  56. Li, S.; Chen, L.; Xiong, X.; Tao, J.; Su, L.; Han, D.; Liu, Y. Retrieval of the haze optical thickness in North China Plain using MODIS data. IEEE Trans. Geosci. Remote 2013, 51, 2528–2540. [Google Scholar] [CrossRef]
  57. Li, C.C.; Lau, A.K.H.; Mao, J.T.; Chu, D.A. Retrieval, validation, and application of the 1-km aerosol optical depth from MODIS measurements over Hong Kong. IEEE Trans. Geosci. Remote 2005, 43, 2650–2658. [Google Scholar]
  58. Bilal, M.; Nichol, J.E.; Bleiweiss, M.P.; Dubois, D. A simplified high resolution MODIS aerosol retrieval algorithm (SARA) for use over mixed surfaces. Remote Sens. Environ. 2013, 136, 135–145. [Google Scholar] [CrossRef]
Figure 1. The location of the ground site (black dot) and topography of surrounding areas (pseudo-color background). The inner and outer dashed boxes are 20 km by 20 km and 50 km by 50 km boundaries for satellite-ground collocation.
Atmosphere 08 00227 g001
Figure 2. Scatterplots with the sun photometer AODs and (a) Terra 10 km Dark Target (DT) AODs; (b) Aqua 10 km DT AODs; (c) Terra Deep Blue (DB) AODs; (d) Aqua DB AODs; (e) Terra 3 km DT AODs; (f) Aqua 3 km DT AODs. The red dots (black squares) represent MODIS AODs with good (all) quality. The gray dashed lines are the expected errors (EE) of ±(0.05 + 15%) and 1:1 line. The red (black) solid lines are the linear regressions of red dots (black squares). The regression equations, number of matchups (N) and fractions of matchups falling in EE (f) are presented in texts.
Atmosphere 08 00227 g002
Figure 3. Scatterplots with the sun photometer AODs and MODIS AODs for (a) Terra and (b) Aqua. Only those AODs when both algorithms give retrievals with good quality are included. The red/blue/black dots represent MODIS AODs from the 10/3 km DT/DB algorithms. Corresponding linear regression lines and equations are present in red/blue/black solid lines and texts. The gray dashed lines are the expected errors (EE) of ±(0.05 + 15%) and 1:1 line.
Atmosphere 08 00227 g003
Figure 4. Comparisons between the 660 nm surface reflectance from MODIS products and atmospheric corrections using different aerosol types.
Atmosphere 08 00227 g004
Figure 5. The median biases between the MODIS and sun photometer AODs in different bin of (a) the mean cloud fractions for the DB and 10 km DT algorithms and (b) the mean cloud distances for the 10 km DT algorithm. In the lower panel, the AOD differences of individual matchup are presented as gray dots and the red squares are median biases for the mean cloud distances less than 2, within 2–3, 3–4, 4–5 and equal to or larger than 5. Only the datasets with all quality of Aqua are included.
Atmosphere 08 00227 g005
Figure 6. Scatterplots with the sun photometer AODs and Aqua MODIS 3 km DT AODs with all quality. The solid line is the linear regression line. The texts are some evaluation metrics. The gray dashed lines are the expected errors (EE) of ±(0.05 + 15%) and 1:1 line.
Atmosphere 08 00227 g006
Figure 7. Time series of the monthly mean AODs of (a) Terra and (b) Aqua MODIS products with good quality and the sun photometer observations from 2010 to 2015. The gray, red, blue and black dots are the monthly mean of AODs from the sun photometer, 10 km DT, 3 km DT, and DB algorithms. In the box-whisker plots, the horizontal bars, upper and lower limits of the boxes are the medians, 25% and 75% percentiles. The whiskers are the minimum and maximum sun photometer AODs.
Atmosphere 08 00227 g007
Table 1. Statistical results for the validations of Moderate Resolution Imaging Spectroradiometer (MODIS) aerosol optical depth (AOD) products against ground based sun photometer AODs. Numbers in parentheses are the results when both algorithms provide retrievals.
DatasetNSIRRMSEMBEf (%)
T-DT-B460.980.140.940.190.1156.52
(38)(0.94)(0.15)(0.95)(0.18)(0.10)(60.53)
T-DT-A770.900.240.930.220.1753.25
T-DB-B641.04−0.330.910.37−0.3131.25
(38)(0.82)(−0.24)(0.88)(0.42)(−0.35)(15.79)
T-DB-A1001.10−0.340.910.36−0.2531.00
T-3K-B800.880.260.940.220.1940.00
(38)(0.94)(0.19)(0.96)(0.19)(0.15)(44.74)
T-3K-A890.940.240.950.240.2035.96
A-DT-B340.870.190.920.170.1061.76
(31)(0.87)(0.18)(0.92)(0.16)(0.10)(64.52)
A-DT-A670.770.270.880.200.1052.24
A-DB-B580.88−0.160.920.32−0.2425.86
(31)(0.79)(−0.14)(0.85)(0.32)(−0.27)(22.58)
A-DB-A991.07−0.220.880.33−0.1938.38
A-3K-B640.810.250.910.200.1256.25
(31)(0.89)(0.18)(0.94)(0.16)(0.11)(61.29)
A-3K-A720.850.240.900.210.1451.39

