Inter-Comparison of Carbon Content in PM2.5 and PM10 Collected at Five Measurement Sites in Southern Italy

 ,
,  , , ,
, , ,  , ,
, , 
Abstract
:
1. Introduction
2. Method
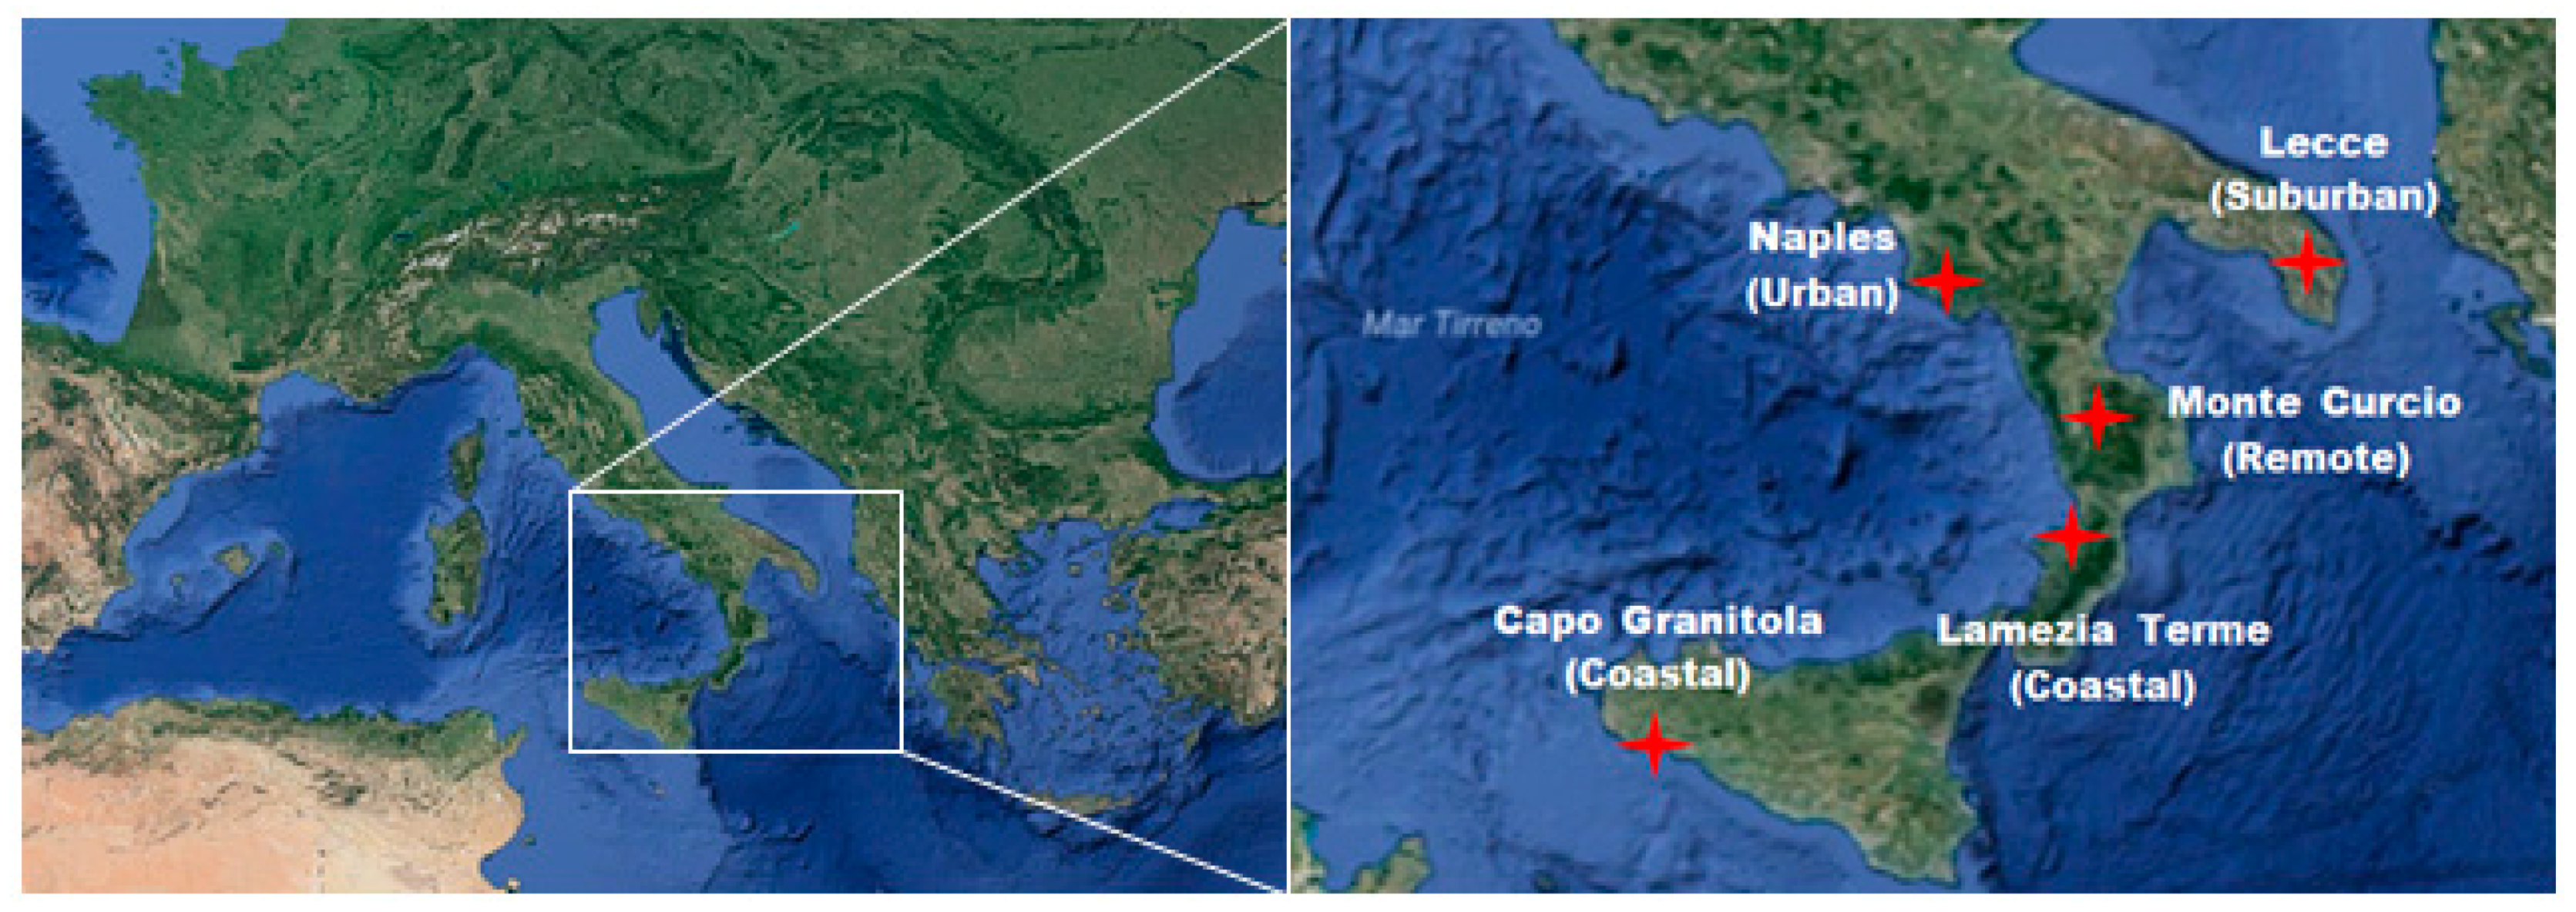
2.1. Sampling Sites
2.2. Sample Collection and Analysis
3. Results
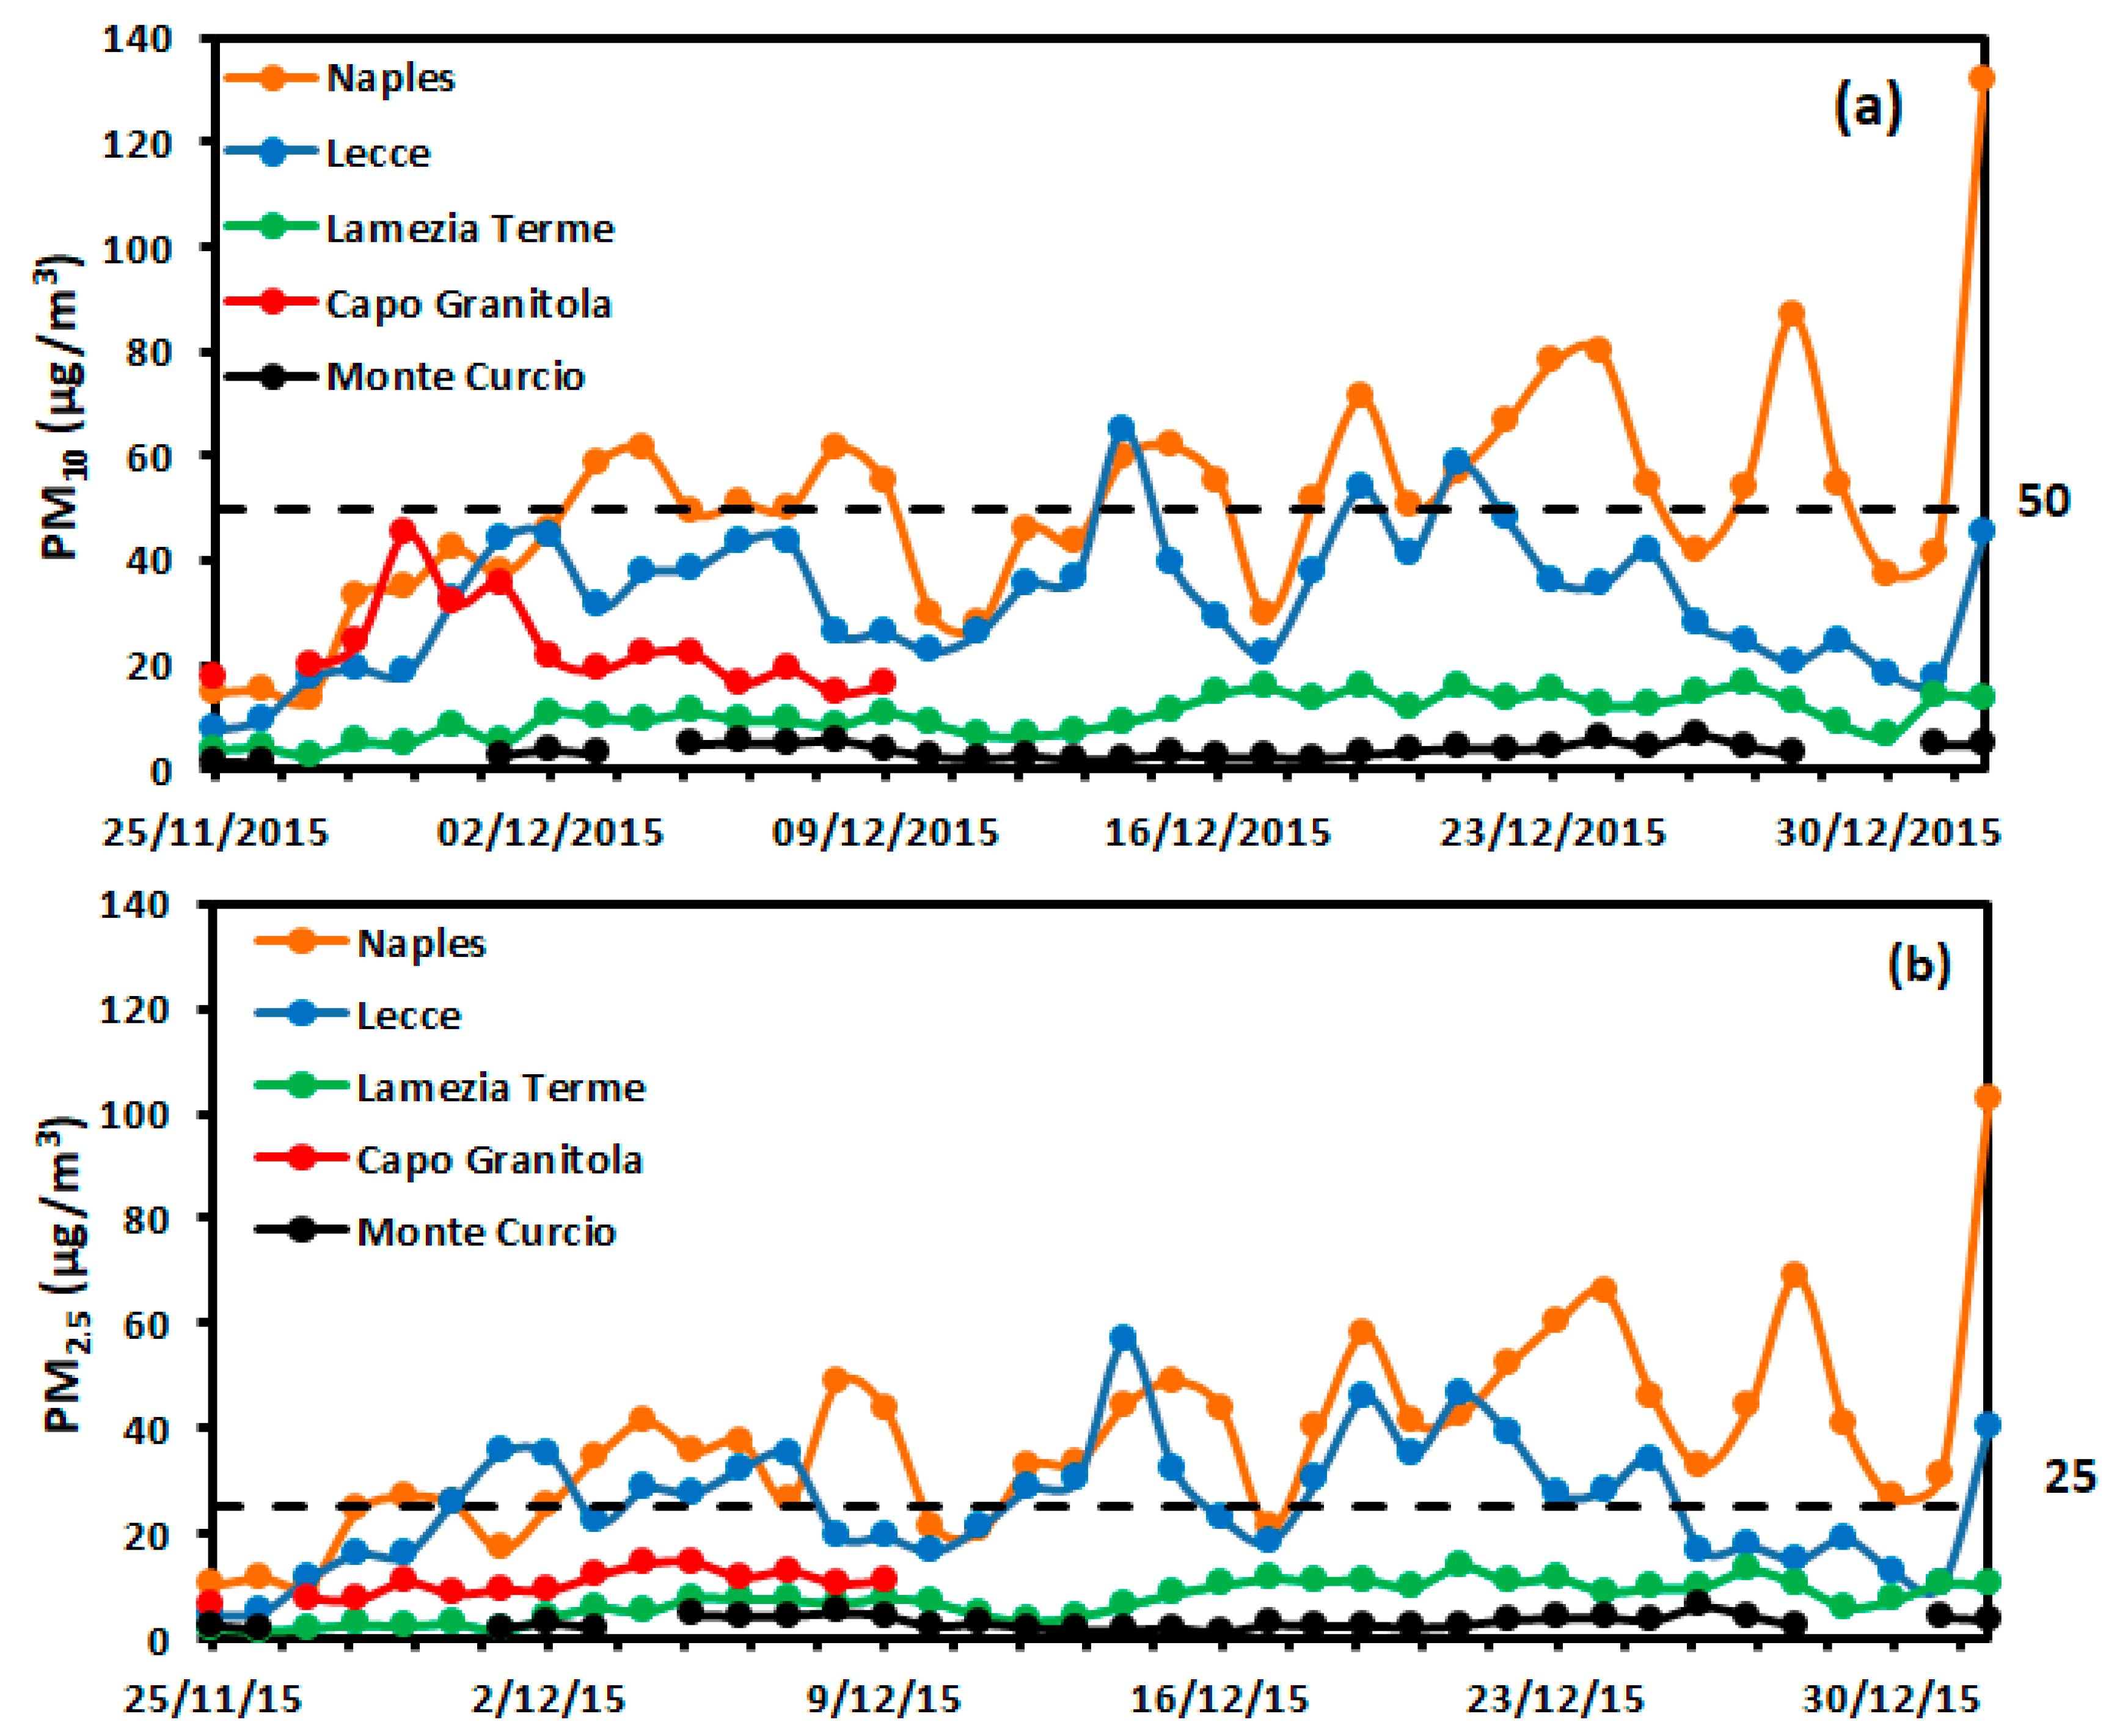
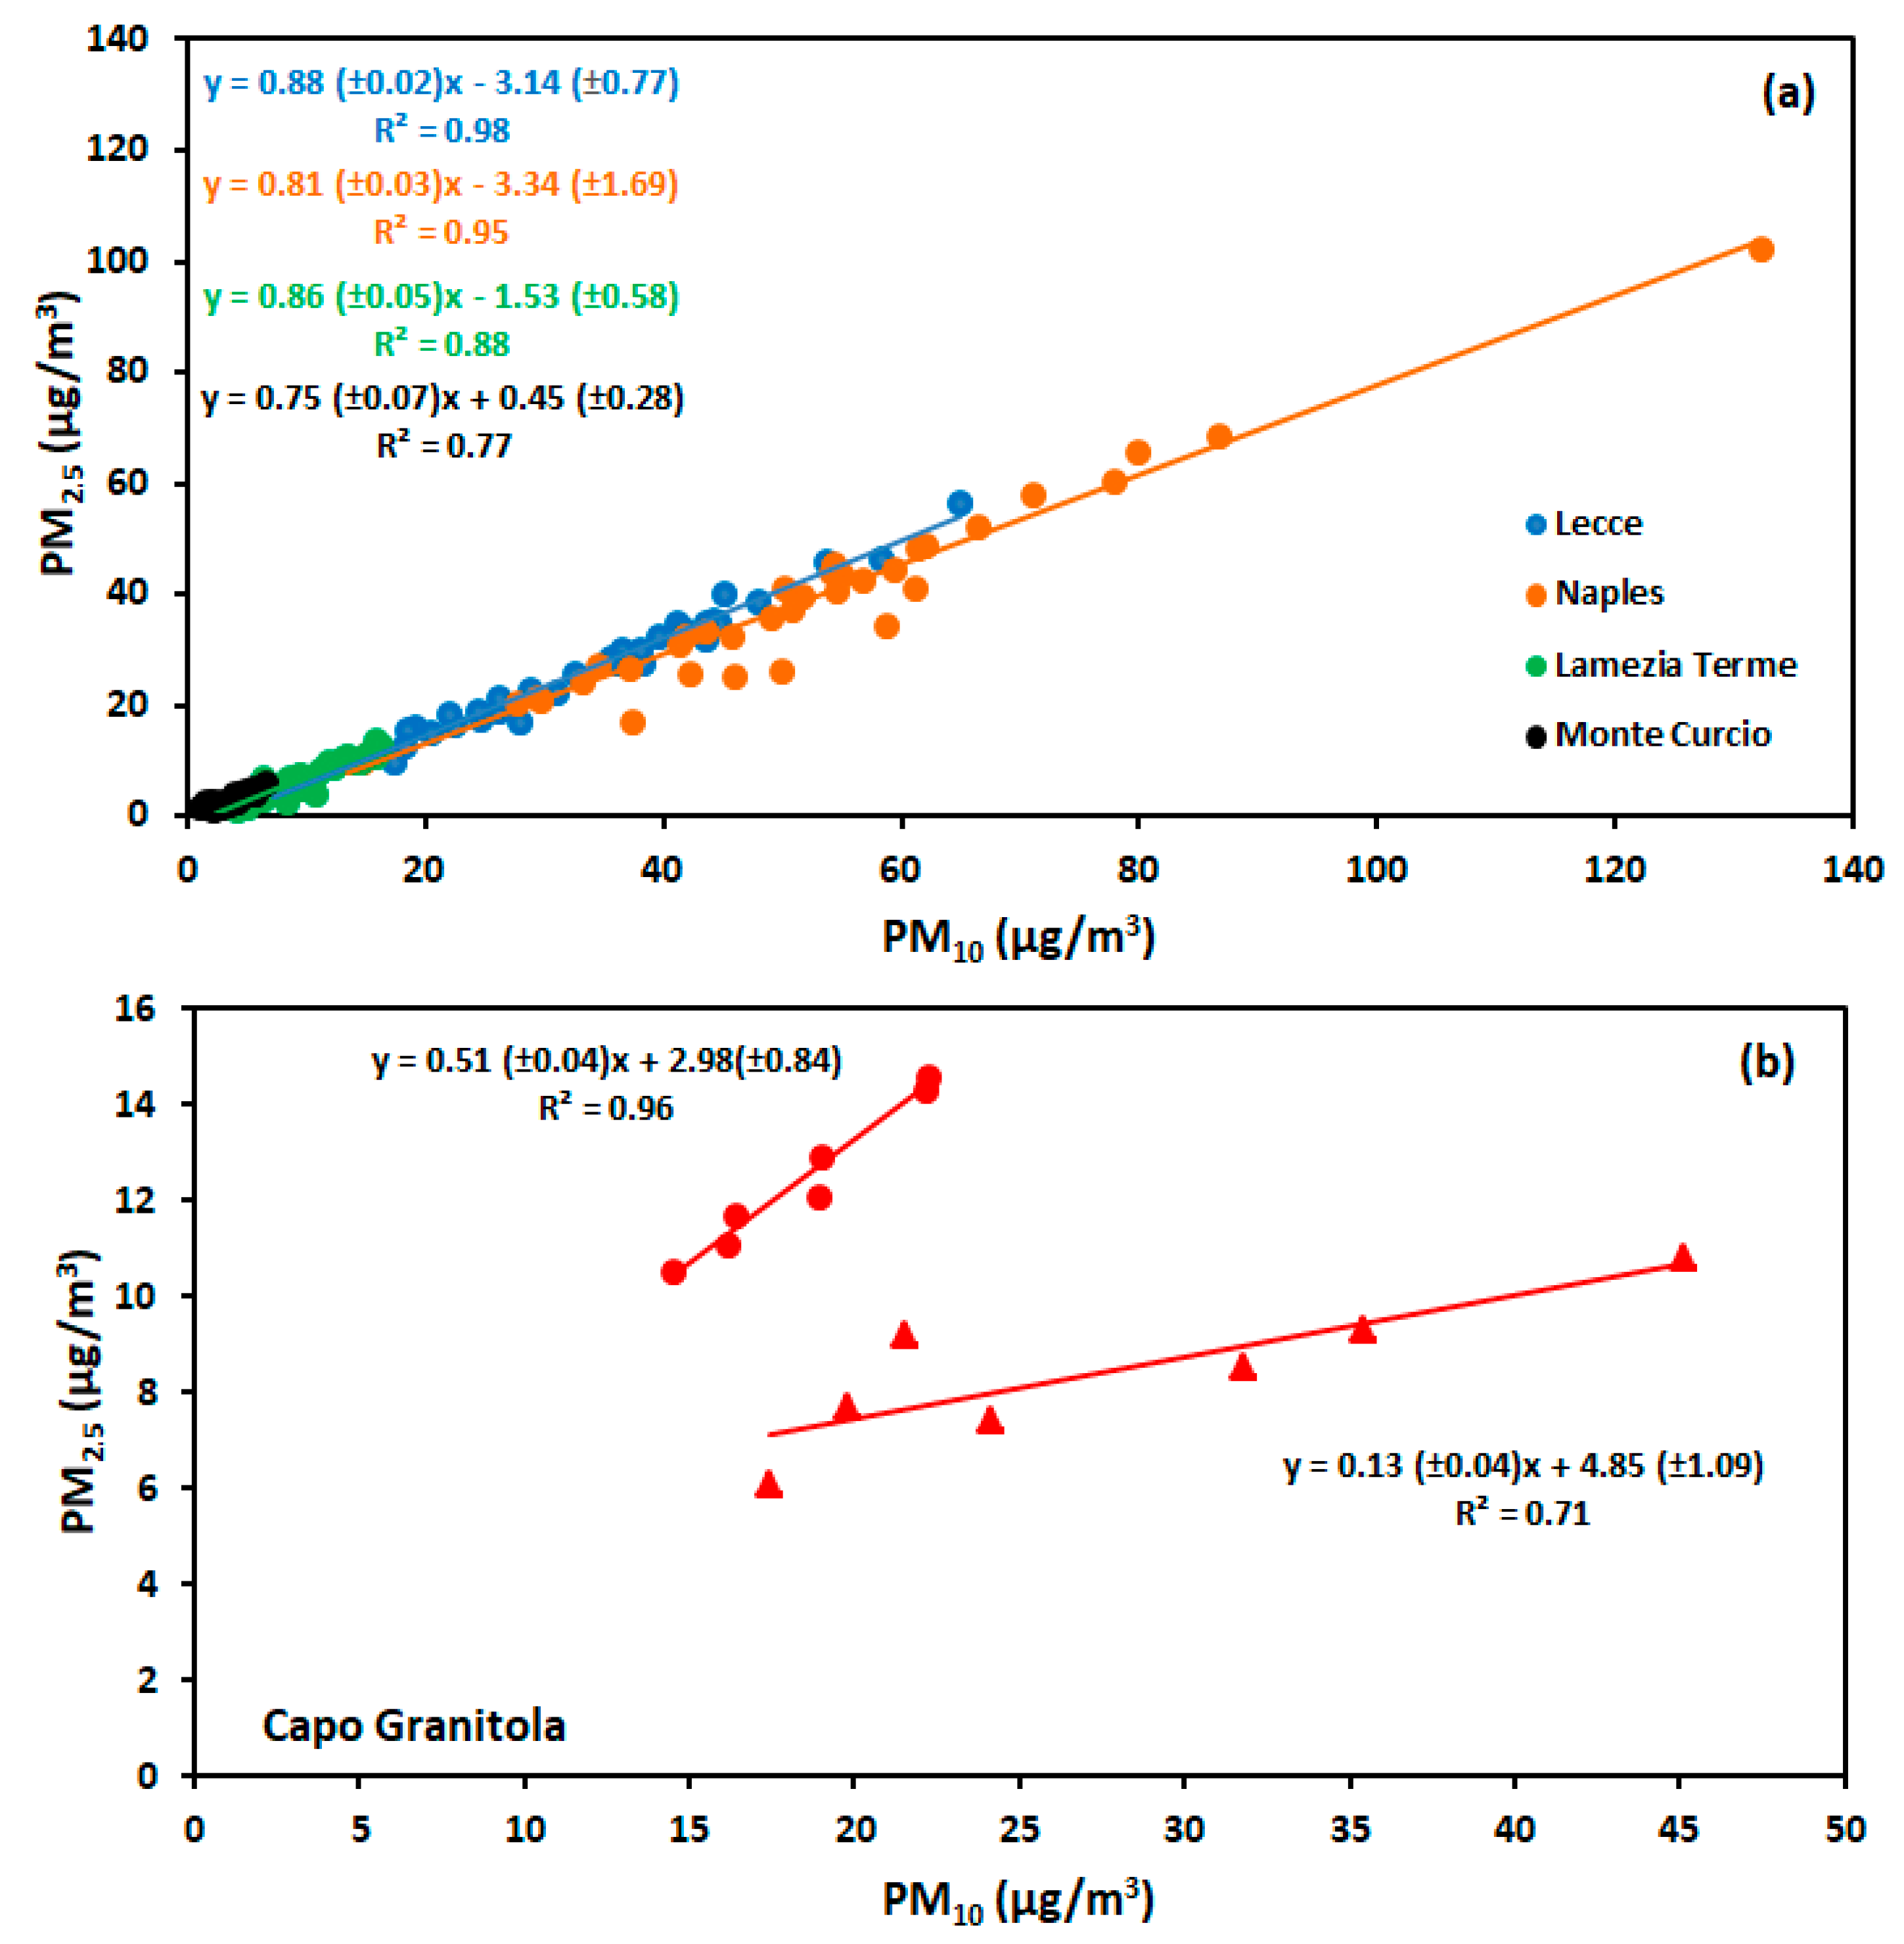
3.1. PM10 and PM2.5 Concentrations
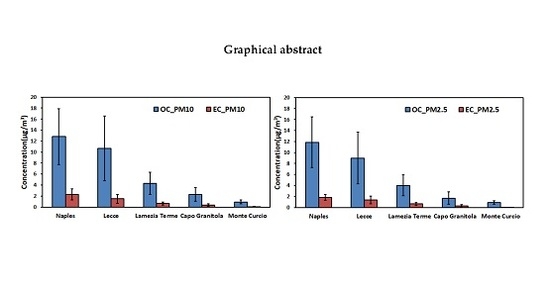
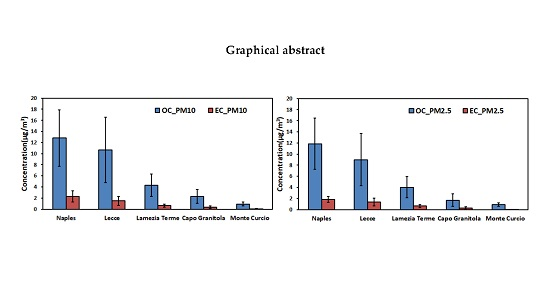
3.2. Concentration Levels of OC and EC
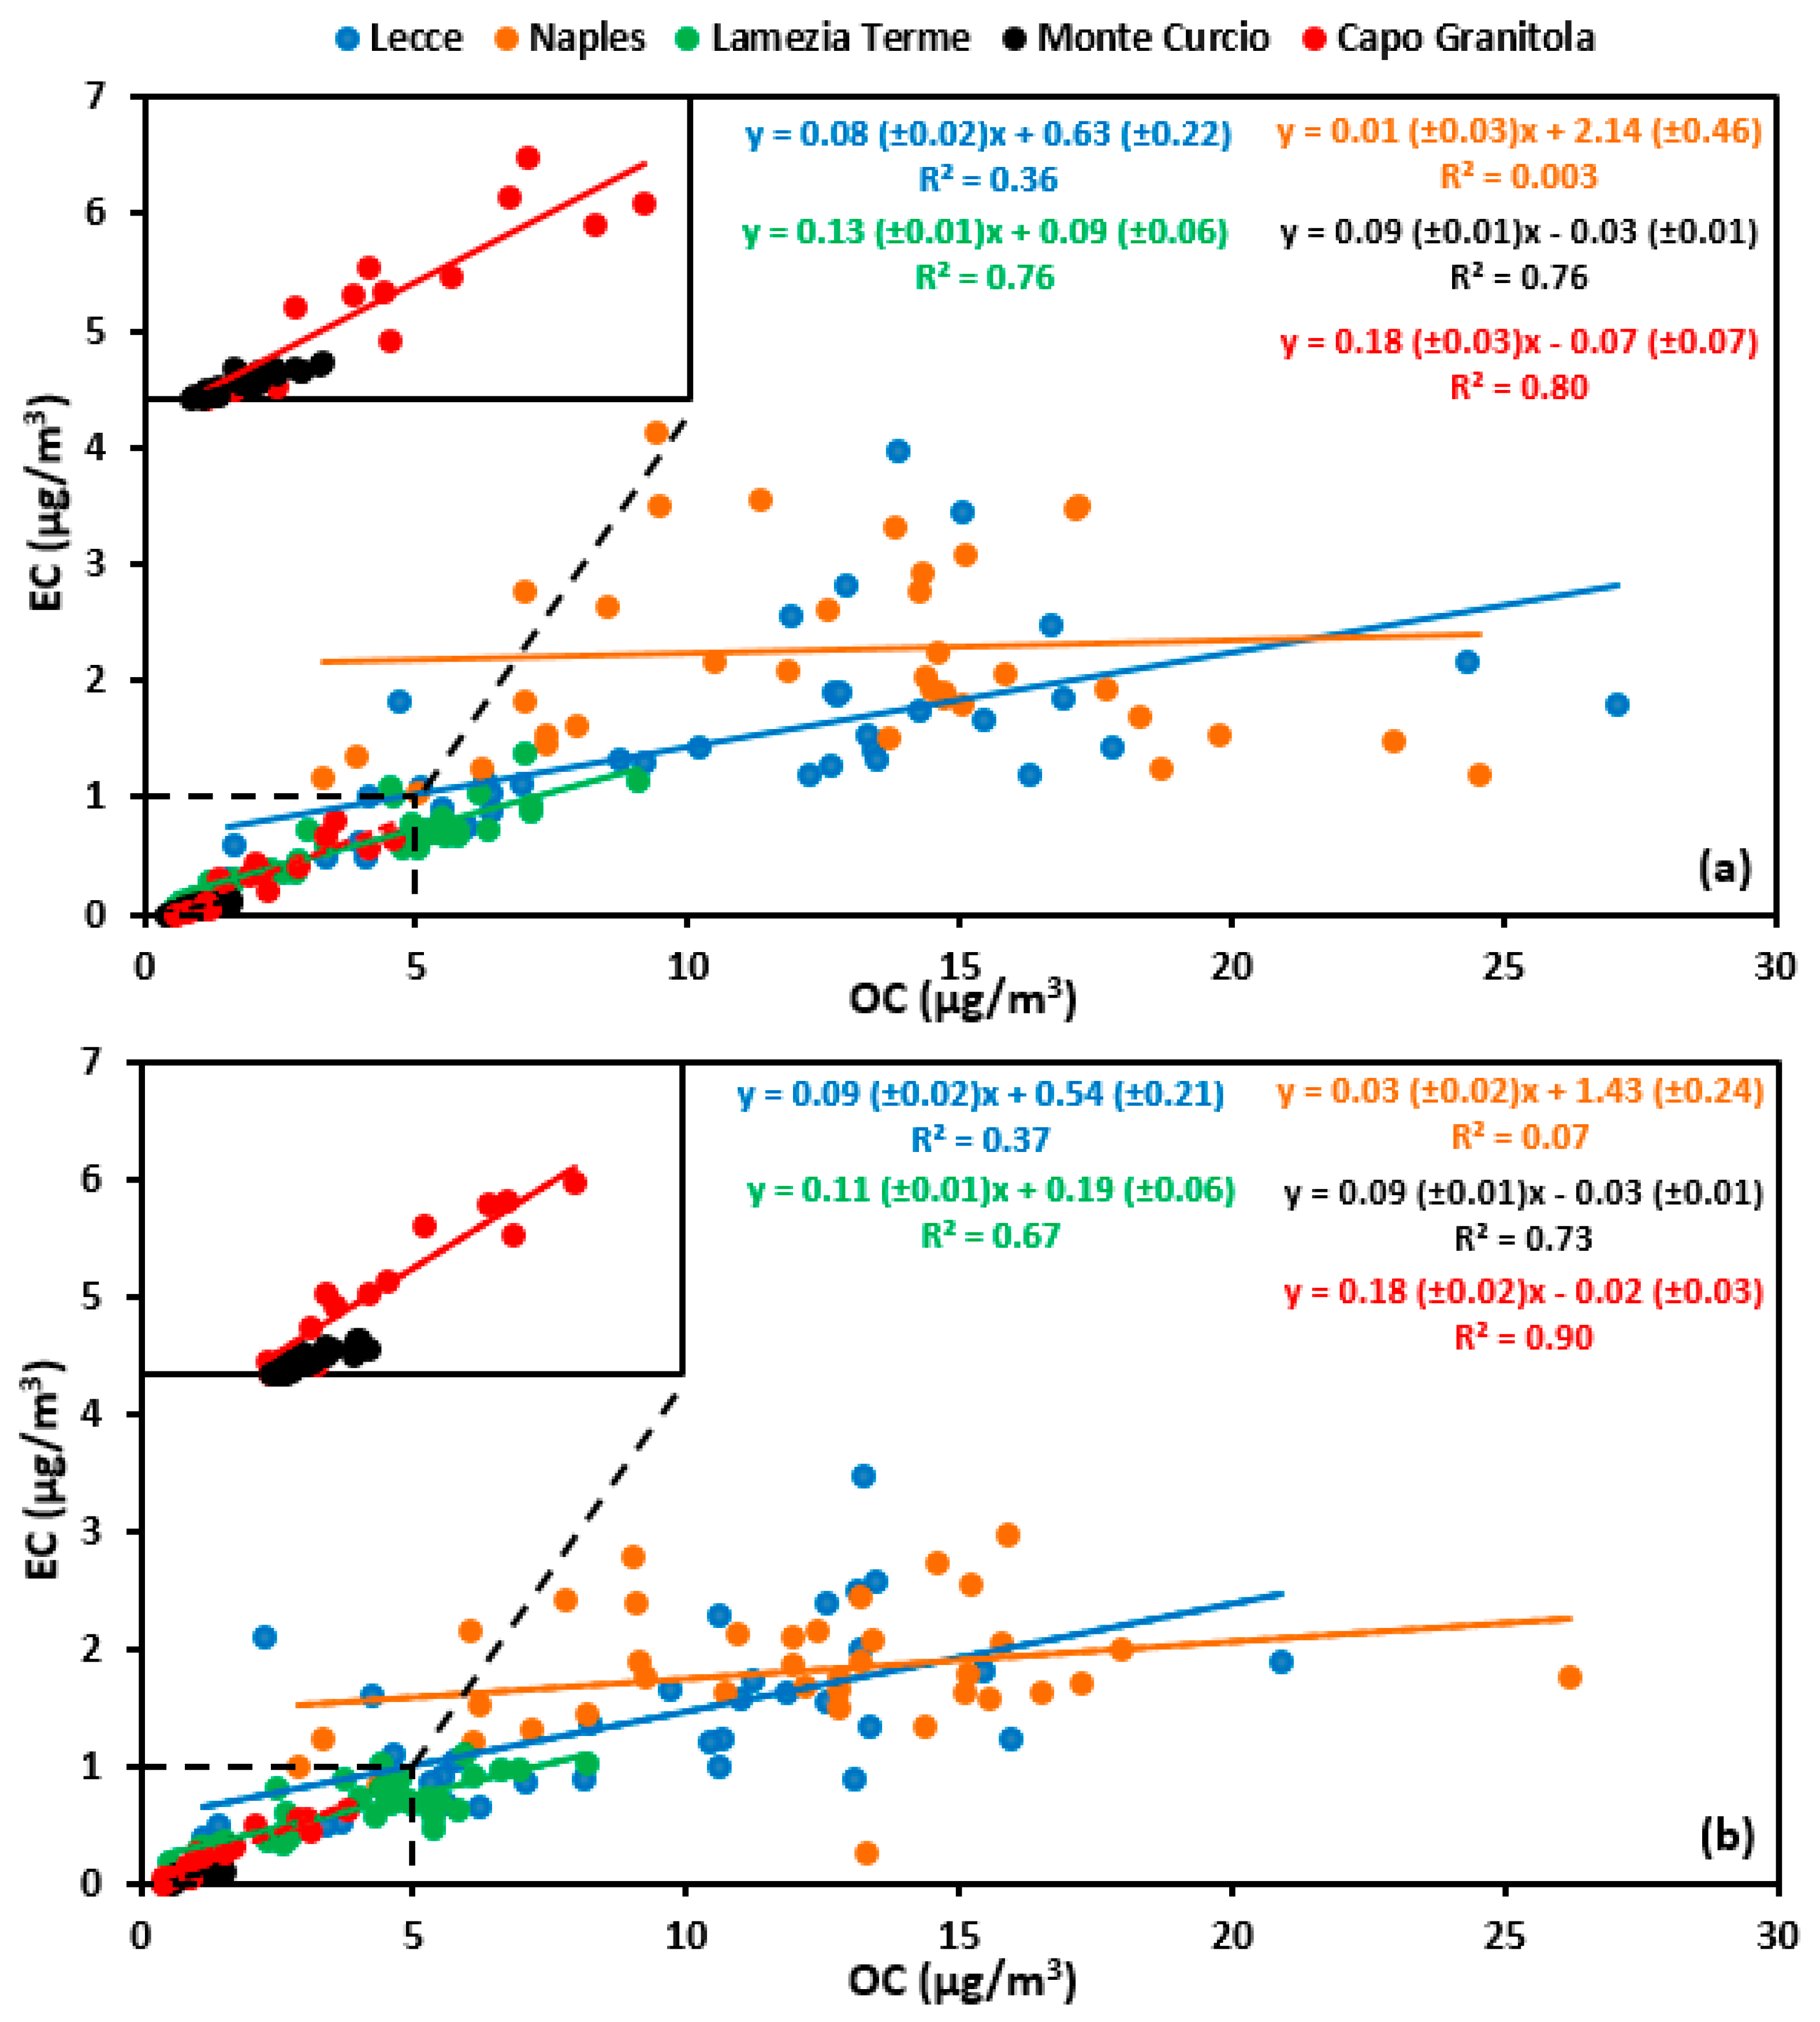
3.3. Relationship between OC and EC Concentrations
3.4. Estimation of SOC Concentrations
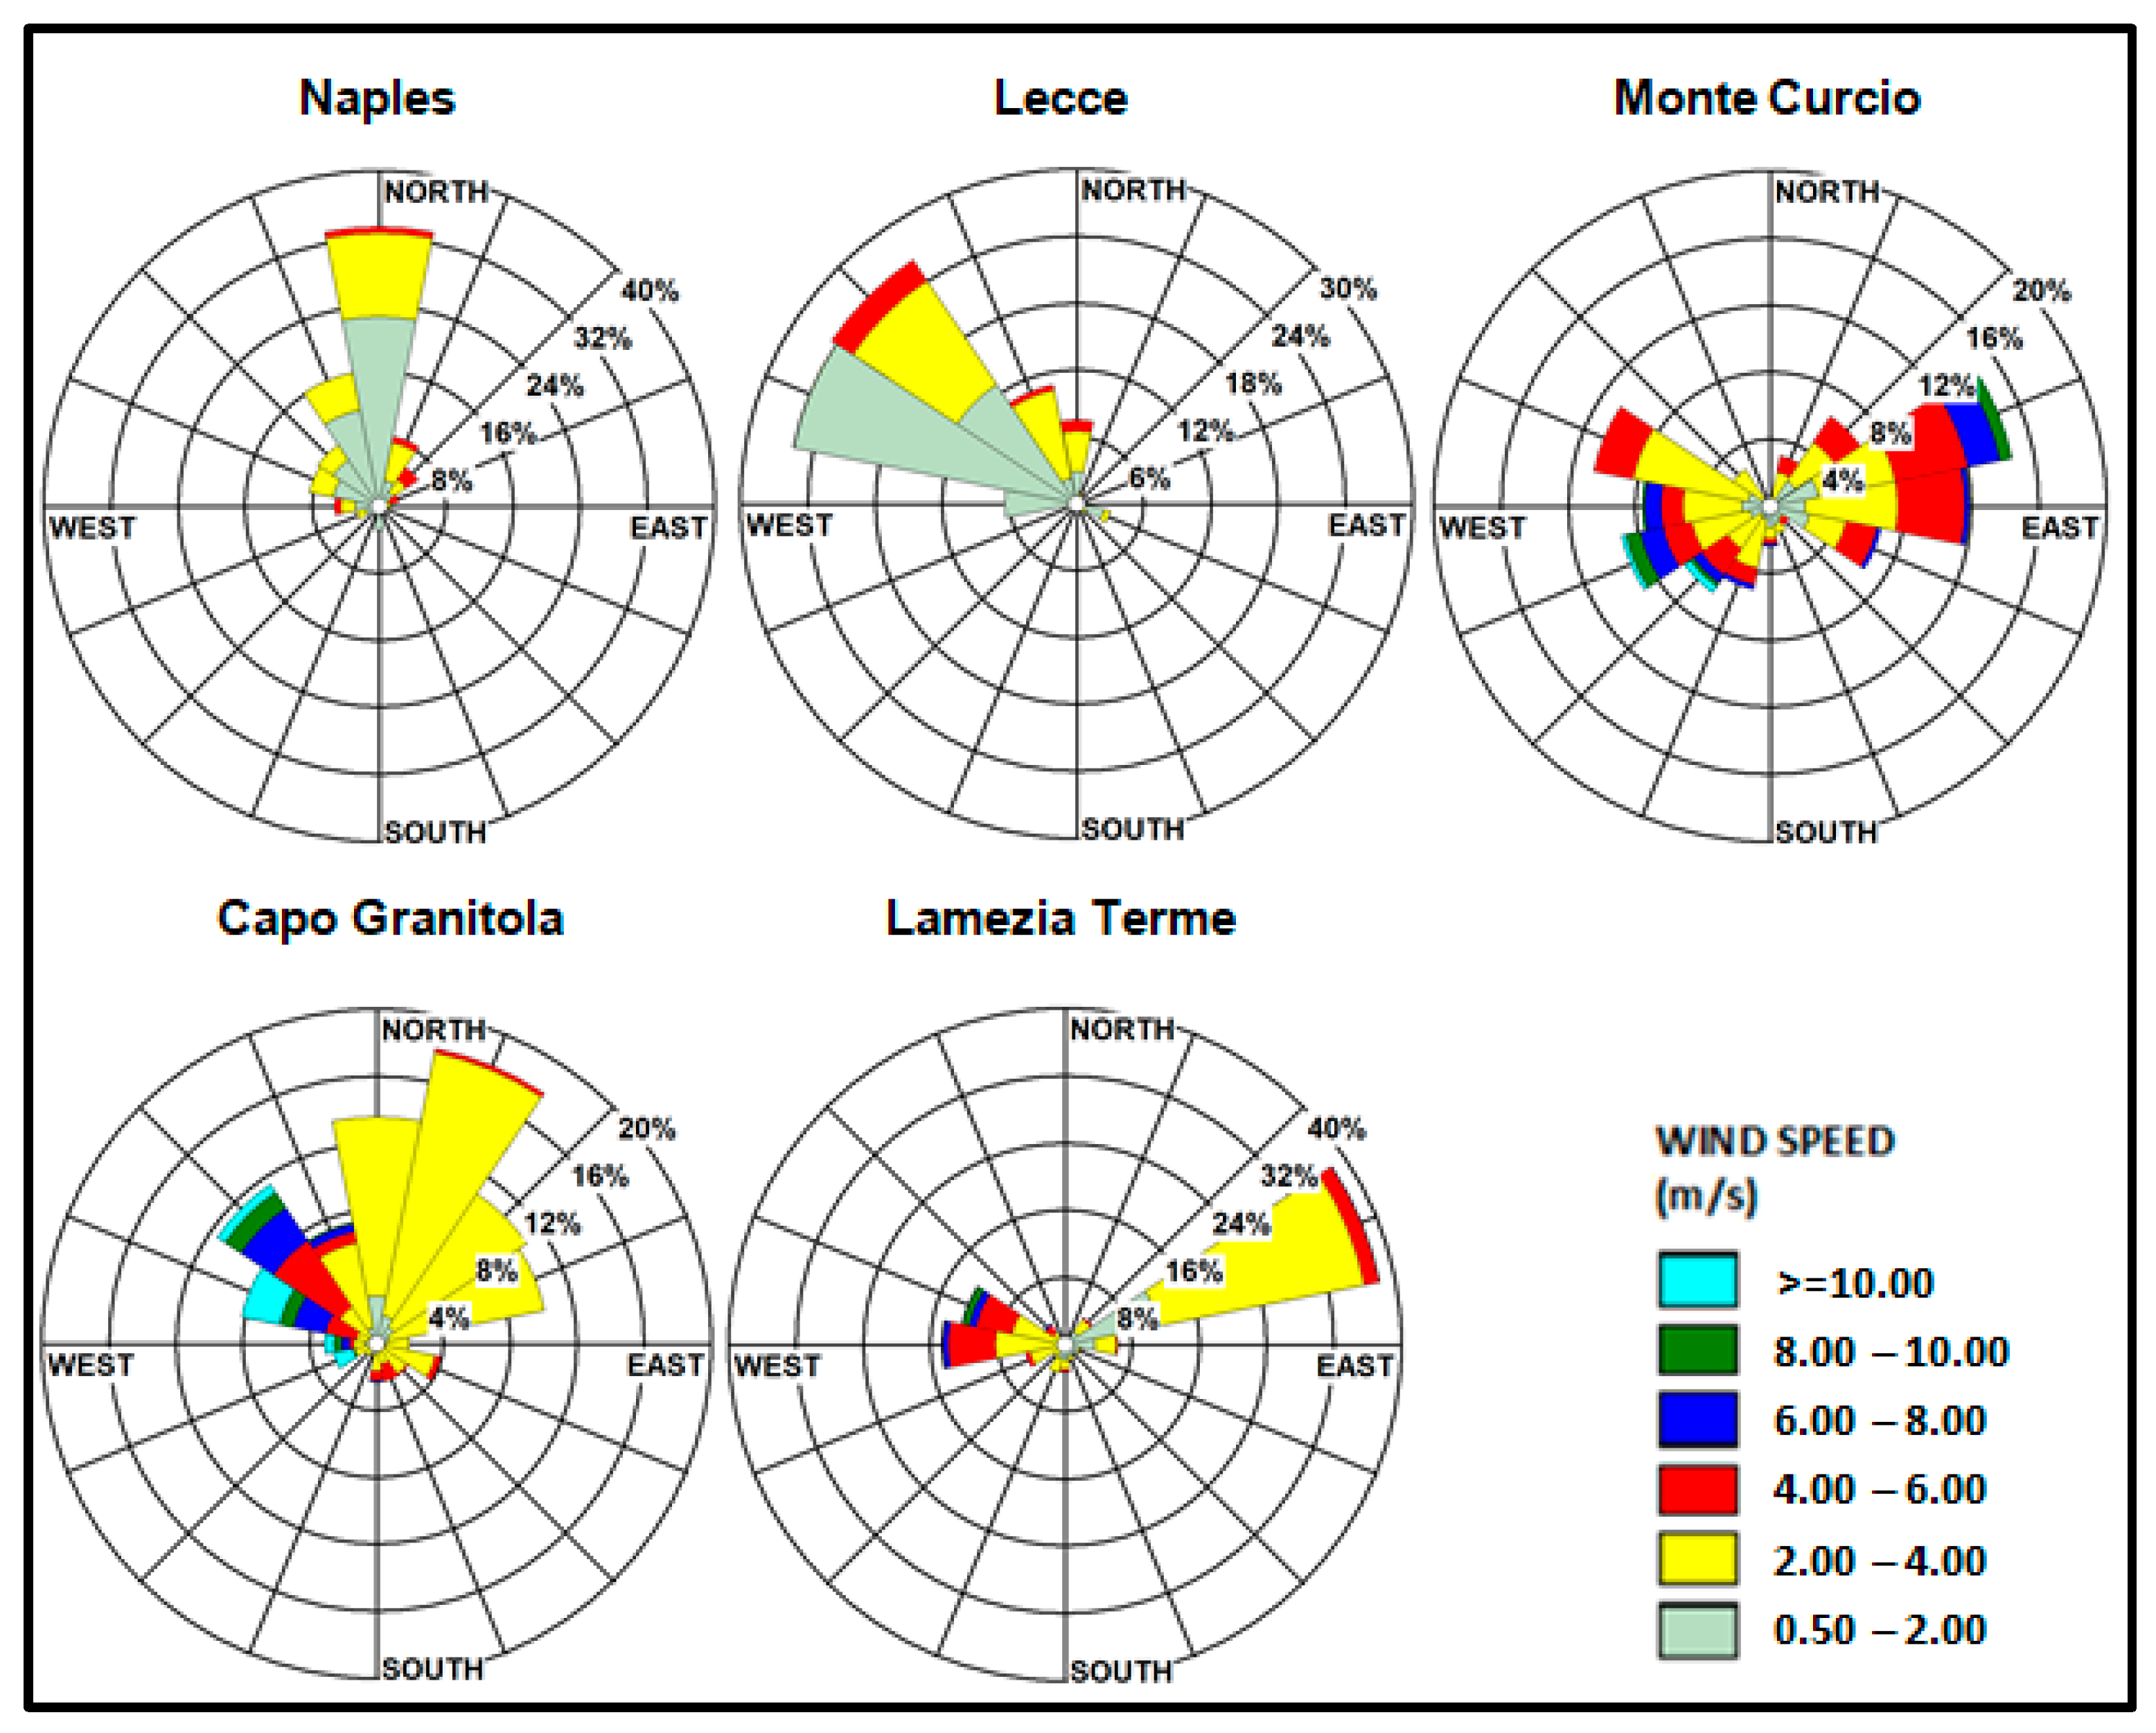
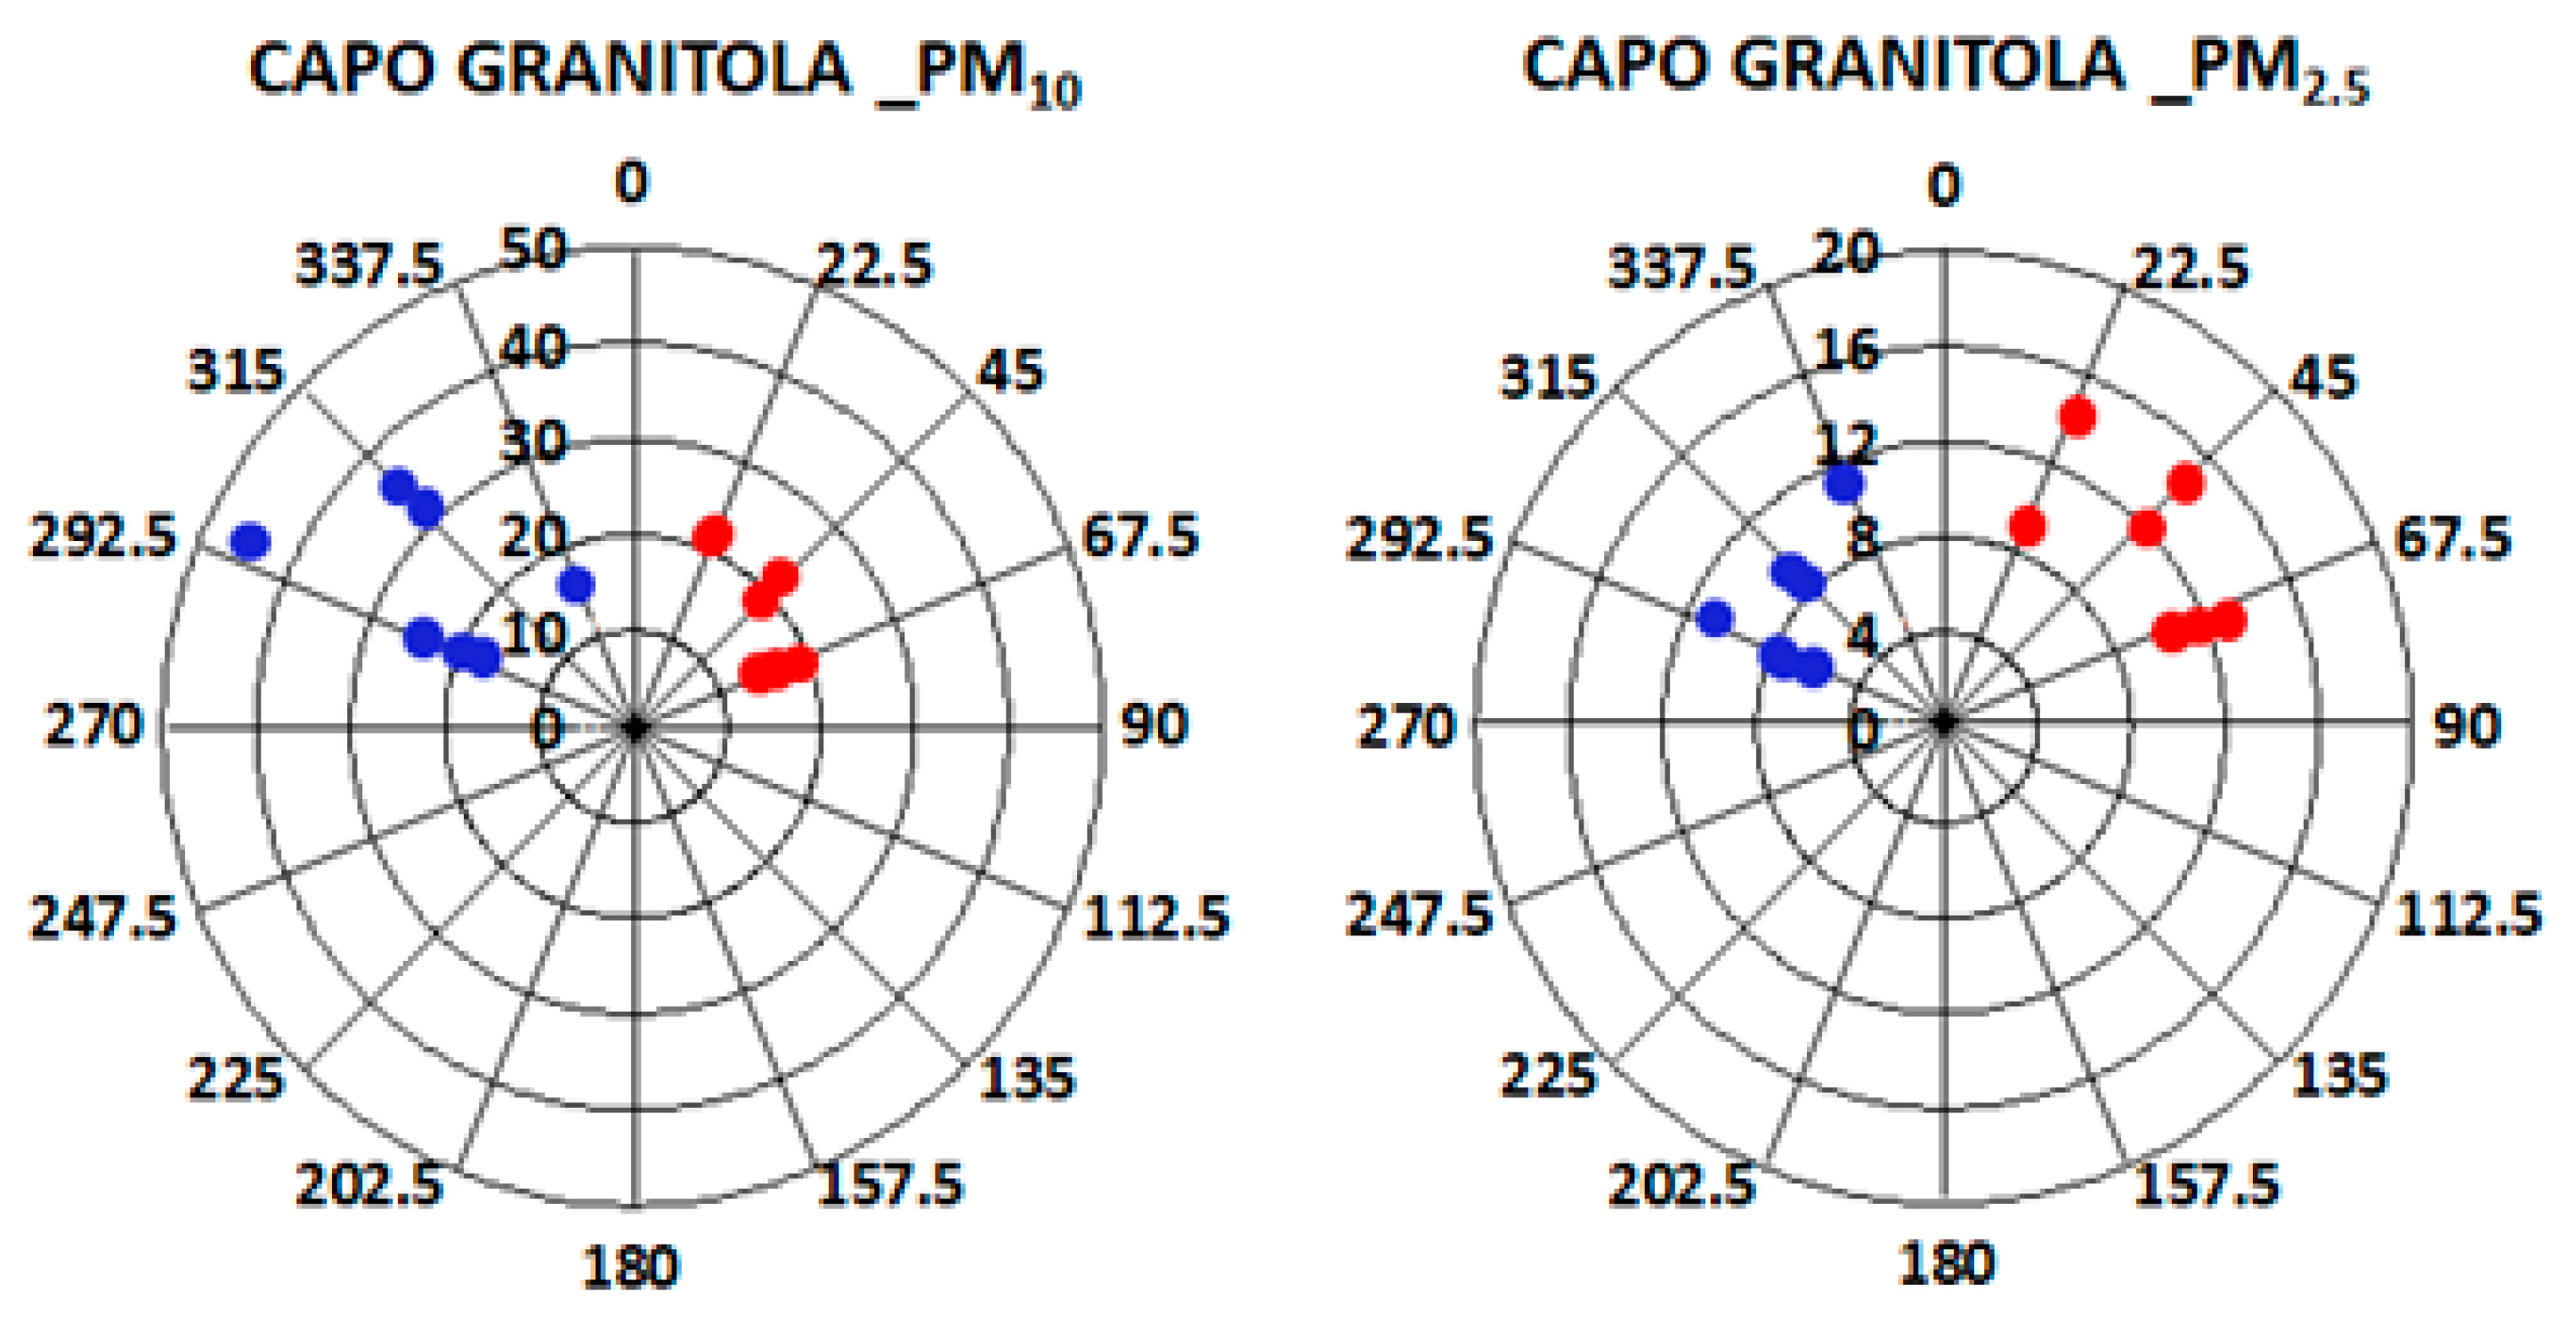
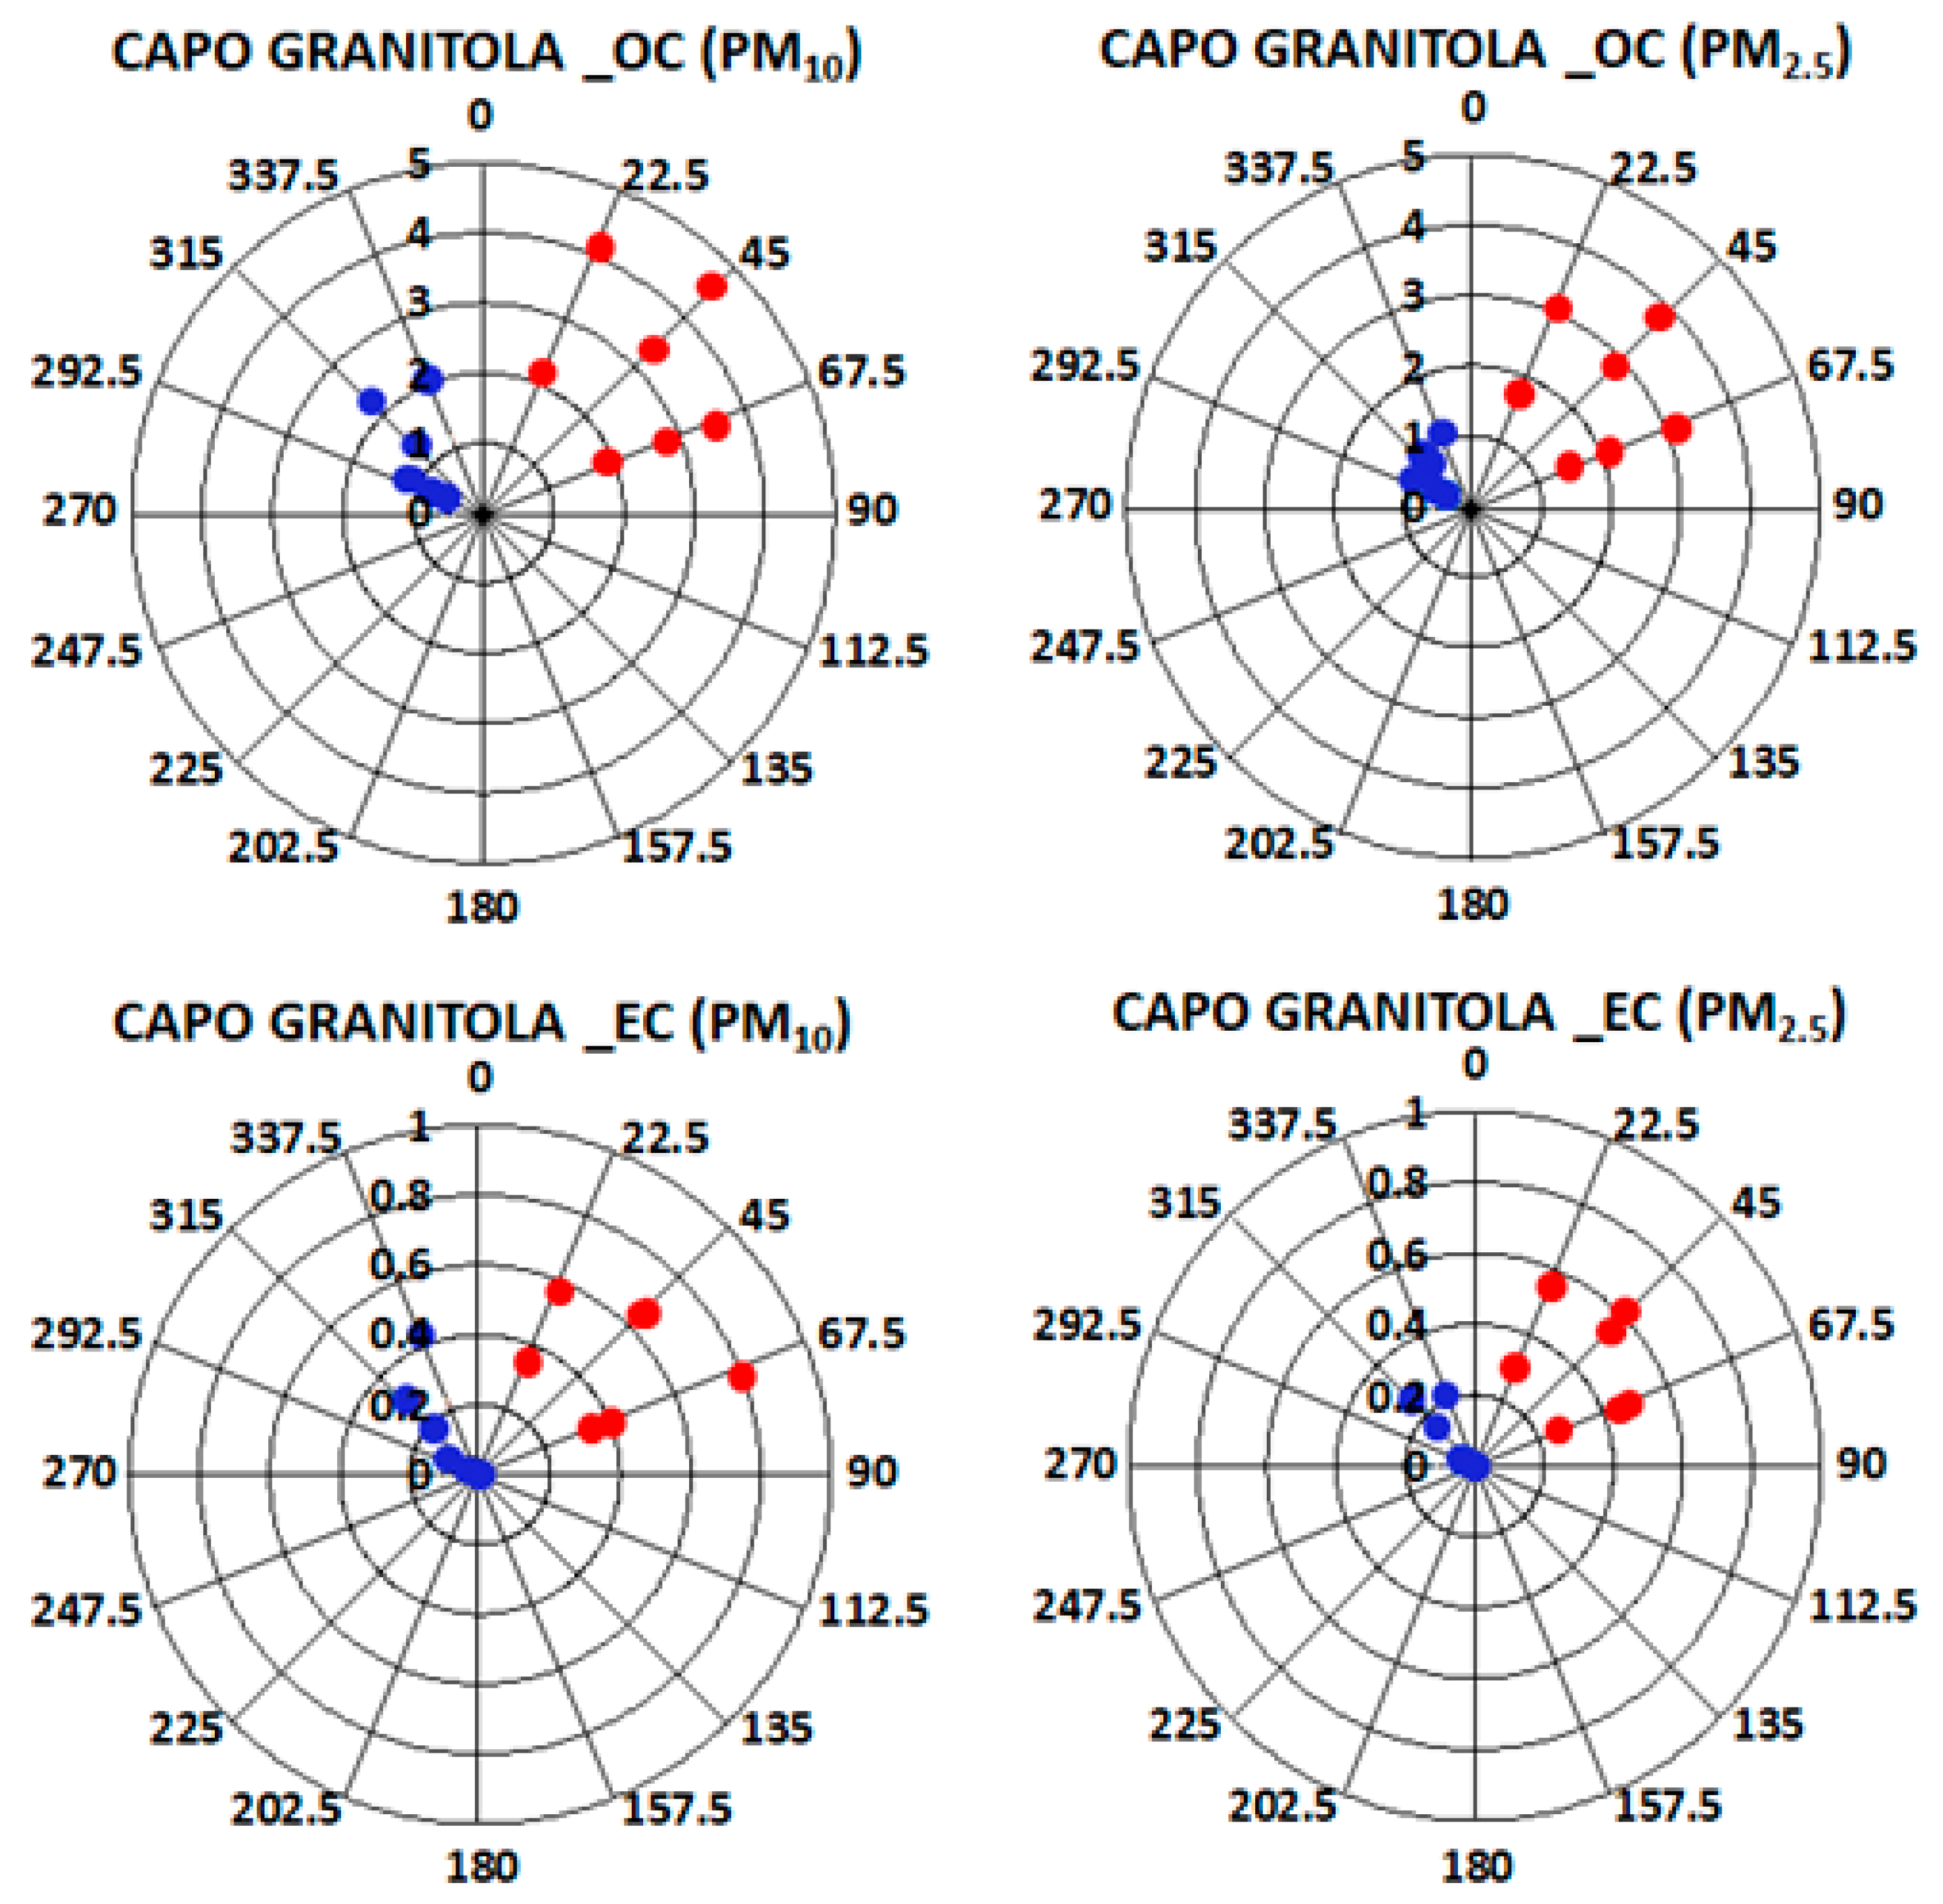
3.5. Influence of Meteorological Parameters on Measured Concentrations
4. Conclusions
Acknowledgments
Author Contributions
Conflicts of Interest
References
- Putaud, J.P.; Van Dingenen, R.; Alastuey, A.; Bauer, H.; Birmili, W.; Cyrys, J.; Flentje, H.; Fuzzi, S.; Gehrig, R.; Hansson, H.C.; et al. A European aerosol phenomenology-3: Physical and chemical characteristics of particulate matter from 60 rural, urban, and kerbside sites across Europe. Atmos. Environ. 2010, 44, 1308–1320. [Google Scholar] [CrossRef]
- Yttri, K.E.; Aas, W.; Bjerke, A.; Cape, J.N.; Cavalli, F.; Ceburnis, D.; Dye, C.; Emblico, L.; Facchini, M.C.; Forster, C.; et al. Elemental and organic carbon in PM10: A one year measurement campaign within the European Monitoring and Evaluation Programme EMEP. Atmos. Chem. Phys. 2007, 7, 5711–5725. [Google Scholar] [CrossRef]
- Aasestad, K. Emissions of Black Carbon and Organic Carbon in Norway 1990–2011. Available online: https://www.ssb.no/natur-og-miljo/artikler-og-publikasjoner/_attachment/107884?_ts=13dfd568678 (accessed on 1 December 2017).
- Xiao, Z.; Zhang, Y.; Hong, S.; Bi, X.; Jiao, L.; Feng, Y.; Wang, Y. Estimation of the Main Factors Influencing Haze, Based on a Long-term Monitoring Campaign in Hangzhou, China. Aerosol Air Qual. Res. 2011, 11, 873–882. [Google Scholar] [CrossRef]
- Kim, K.; Sekiguchi, K.; Kudo, S.; Sakamoto, K. Characteristics of Atmospheric Elemental Carbon (Char and Soot) in Ultrafine and Fine Particles in a Roadside Environment, Japan. Aerosol Air Qual. Res. 2011, 11, 1–12. [Google Scholar] [CrossRef]
- Turpin, B.J.; Huntzicker, J.J. Identification of secondary organic aerosol episodes and quantitation of primary and secondaryorganic aerosol concentrations during SCAQ. Atmos. Environ. 1995, 29, 3527–3544. [Google Scholar] [CrossRef]
- Cao, J.J.; Lee, S.C.; Ho, K.F.; Zhang, X.Y.; Zou, S.C.; Fung, K.K.; Chow, J.C.; Watson, J.G. Characteristics of carbonaceous aerosol in Pearl River Delta region, China during 2001 winter period. Atmos. Environ. 2006, 37, 1451–1460. [Google Scholar] [CrossRef]
- Seinfeld, J.H.; Pandis, S.N. Atmospheric chemistry and physics: From air pollution to climate change. In Hoboken, 2nd ed.; John Wiley and Sons: New York, NY, USA, 2006. [Google Scholar]
- Forster, P.; Ramaswamy, V.; Artaxo, P.; Berntsen, T.; Betts, R.; Fahey, D.W.; Haywood, J.; Lean, J.; Lowe, D.C.; Myhre, G.; et al. Changes in atmospheric constituents and in radiative forcing. In Climate Change 2007: The Physical Science Basis, Contribution of Working Group I to the Fourth Assessment Report of the Intergovernmental Panel on Climate Change; Solomon, S., Ed.; Cambridge University Press: Cambridge, UK; New York, NY, USA, 2007; pp. 129–234. [Google Scholar]
- Houghton, J.T.Y.; Ding, D.J.; Griggs, M.; Noguer, P.J.; van der Linden, D.; Xiaosu, K.; Johnson, C.A. Intergovernmental Panel on Climate Change (IPCC): Climate Change; Cambridge University Press: New York, NY, USA, 2001. [Google Scholar]
- Li, W.; Bai, Z. Characteristics of organic and elemental carbon in atmospheric fine particles in Tianjin, China. Particuology 2009, 7, 432–437. [Google Scholar] [CrossRef]
- Bond, T.C. Spectral dependence of visible light absorption by carbonaceous particles emitted from coal combustion. Geophys. Res. 2001, 28, 4075–4078. [Google Scholar] [CrossRef]
- Bond, T.C. Bounding the role of black carbon in the climate system: A scientific assessment. J. Geophys. Res. 2013, 118, 5380–5552. [Google Scholar] [CrossRef] [Green Version]
- Integrated Assessment of Black Carbon and Tropospheric Ozone: Summary for Decision Makers. Available online: http://wedocs.unep.org/handle/20.500.11822/19899 (accessed on 1 December 2017).
- Aruna, K.; Lakshmi Kumar, T.V.; Narayana Rao, D.; Krishna Murthy, B.V.; Suresh Babu, S.; Krishna Moorthy, K. Black carbon aerosols in a tropical semi-urban coastal environment: Effects of boundary layer dynamics and long range transport. J. Atmos. Sol.-Terr. Phy. 2013, 104, 116–125. [Google Scholar] [CrossRef]
- Sandrini, S.; Fuzzi, S.; Piazzalunga, A.; Prati, P.; Bonasoni, P.; Cavalli, F.; Bove, M.C.; Calvello, M.; Cappelletti, D.; Colombi, C.; et al. Spatial and seasonal variability of carbonaceous aerosol across Italy. Atmos. Environ. 2014, 99, 587–598. [Google Scholar] [CrossRef]
- Dinoi, A.; Perrone, M.R.; Burlizzi, P. Application of MODIS products for air quality studies over southeastern Italy. Remote Sens. 2010, 2, 1767–1796. [Google Scholar] [CrossRef]
- Contini, D.; Cesari, D.; Donateo, A.; Chirizzi, D.; Belosi, F. Characterization of PM10 and PM2.5 and Their Metals Content in Different Typologies of Sites in South-Eastern Italy. Atmosphere 2014, 5, 435–453. [Google Scholar] [CrossRef]
- EEA. Air Quality in Europe 2017 Report. Technical Report. European Environment Agency. 2017. Available online: https://www.eea.europa.eu/publications/air-quality-in-europe-2017 (accessed on 1 December 2017).
- Riccio, A.; Chianese, E.; Agrillo, G.; Esposito, C.; Ferrara, L.; Tirimberio, G. Source apportion of atmospheric particulate matter: A joint Eulerian/Lagrangian approach. Environ. Sci. Pollut. Res. 2014, 21, 13160–13168. [Google Scholar] [CrossRef] [PubMed]
- Riccio, A.E.; Chianese, D.; Monaco, M.A.; Costagliola, G.; Perretta, M.V.; Prati, G. Real-world automotive particulate matter and PAH emission factors and profile concentrations: Results from an urban tunnel experiment in Naples, Italy. Atmos. Environ. 2016, 141, 379–387. [Google Scholar] [CrossRef]
- Riccio, A.; Chianese, E.; Tirimberio, G.; Prati, M.V. Emission factors of inorganic ions from road traffic: A case study from the city of Naples (Italy). Transp. Res. D Transp. Environ. 2017, 54, 239–249. [Google Scholar] [CrossRef]
- Chirizzi, D.; Cesari, D.; Guascito, M.R.; Dinoi, A.; Giotta, L.; Donateo, A.; Contini, D. Influence of Saharan dust outbreaks and carbon content on oxidative potential of water-soluble fractions of PM2.5 and PM10. Atmos. Environ. 2017, 163, 1–8. [Google Scholar] [CrossRef]
- Cesari, D.; De Benedetto, G.E.; Bonasoni, P.; Busetto, M.; Dinoi, A.; Merico, E.; Chirizzi, D.; Cristofanelli, P.; Donateo, A.; Grasso, F.M.; et al. Seasonal variability of PM2.5 and PM10 composition and sources in an urban background site in Southern Italy. Sci. Total Environ. 2018, 612, 202–213. [Google Scholar] [CrossRef] [PubMed]
- Cristofanelli, P.; Busetto, M.; Calzolari, F.; Ammoscato, I.; Gullì, D.; Dinoi, A.; Calidonna, C.R.; Contini, D.; Sferlazzo, D.; Di Iorio, T.; et al. Investigation of reactive gases and methane variability in the coastal boundary layer of the central Mediterranean basin. Elem. Sci. Anth. 2017, 5, 12. [Google Scholar] [CrossRef]
- Bencardino, M.; Sprovieri, F.; Cofone, F.; Pirrone, N. Variability of atmospheric aerosol and ozone concentrations at marine, urban, and high-altitude monitoring stations in southern Italy during the 2007 summer Saharan dust outbreaks and wildfire episodes. J. Air Waste Manag. Assoc. 2011, 61, 952–967. [Google Scholar] [CrossRef] [PubMed]
- Dinoi, A.; Donateo, A.; Belosi, F.; Conte, M.; Contini, D. Comparison of atmospheric particle concentration measurements using different optical detectors: Potentiality and limits for air quality applications. Measurement 2017, 106, 274–282. [Google Scholar] [CrossRef]
- Cavalli, F.; Viana, M.; Yttri, K.E.; Genberg, J.; Putaud, J.-P. Toward a standardised thermal-optical protocol for measuring atmospheric organic and elemental carbon: The EUSAAR protocol. Atmos. Meas. Tech. 2010, 3, 79–89. [Google Scholar] [CrossRef] [Green Version]
- Cesari, D.; Donateo, A.; Conte, M.; Merico, E.; Giangreco, A.; Giangreco, F.; Contini, D. An inter-comparison of PM2.5 at urban and urban background sites: Chemical characterization and source apportionment. Atmos. Res. 2016, 174–175, 106–119. [Google Scholar] [CrossRef]
- Van Dingenen, R.; Raes, F.; Putaud, J.P.; Baltensperger, U.; Charron, A.; Facchini, M.C.; Decesari, S.; Fuzzi, S.; Gehrig, R.; Hansson, H.C. A European aerosol phenomenology-1: Physical characteristics of particulate matter at kerbside, urban, rural and background sites in Europe. Atmos. Environ. 2004, 38, 2561–2577. [Google Scholar] [CrossRef]
- Perrone, M.R.; Piazzalunga, A.; Prato, M.; Carofalo, I. Composition of fine and coarse particles in a coastal site of the central Mediterranean: Carbonaceous species contributions. Atmos. Environ. 2011, 45, 7470–7477. [Google Scholar] [CrossRef]
- Nicolas, J.F.; Galindo, N.; Yubero, E.; Pastor, C.; Esclapez, R.; Crespo, J. Aerosol Inorganic Ions in a Semiarid Region on the Southeastern Spanish Mediterranean Coast. Water Air Soil Pollut. 2009, 201, 149–159. [Google Scholar] [CrossRef]
- Chen, Z.H.; Cheng, S.Y.; Li, J.B.; Guo, X.R.; Wang, W.H.; Chen, D.S. Relationship between atmospheric pollution processes and synoptic pressure patterns in northern China. Atmos. Environ. 2008, 42, 6078–6087. [Google Scholar] [CrossRef]
- Bohnenstengel, S.I.; Belcher, S.E.; Barlow, J.; Coceal, O.; Halios, C.H.; McConnell, J.; Lean, H.; Fleming, Z.L.; Williams, L.; Helfter, C.; et al. The impact of boundary layer height on air pollution concentrations in London-early results from the ClearfLo project. In Proceedings of the 13th EMS Annual Meeting, Reading, UK, 9–13 September 2013. [Google Scholar]
- Durant, J.L.; Ash, C.A.; Wood, E.C.; Herndon, S.C.; Jayne, J.T.; Knighton, W.B.; Canagaratna, M.R.; Trull, J.B.; Brugge, D.; Zamore, W.; et al. Short-term variation in near-highway air pollutant gradients on a winter morning. Atmos. Chem. Phys. 2010, 10, 5599–5626. [Google Scholar] [CrossRef] [PubMed]
- Zhu, Y.; Kuhn, T.; Mayo, P.; Hinds, W.C. Comparison of daytime and nighttime concentration profiles and size distributions of ultrafine particles near a major highway. Environ. Sci. Technol. 2006, 40, 2531–2536. [Google Scholar] [CrossRef] [PubMed]
- Hu, S.; Fruin, S.; Kozawa, K.; Mara, S.; Paulson, S.E.; Winer, A.M. A wide area of air pollutant impact downwind of a freeway during pre-sunrise hours. Atmos. Environ. 2009, 43, 2541–2549. [Google Scholar] [CrossRef] [PubMed]
- Coulter, R.L. A comparison of three methods for measuring mixing-layer height. J. Appl. Meteorol. 1979, 8, 1495–1499. [Google Scholar] [CrossRef]
- Moroni, B.; Castellini, S.; Crocchianti, S.; Piazzalunga, A.; Fermo, P.; Scardazza, F.; Cappelletti, D. Ground-based measurements of long-range transported aerosol at the rural regional background site of Monte Martano (Central Italy). Atmos. Res. 2014, 155, 26–36. [Google Scholar] [CrossRef]
- Okamoto, S.; Tanimoto, H. A review of atmospheric chemistry observations at mountain sites. Prog. Earth Planet. Sci. 2016, 3, 34. [Google Scholar] [CrossRef]
- Cavalli, F.; Alastuey, A.; Areskoug, H.; Ceburnis, D.; Cech, J.; Genberg, J.; Harrison, R.M.; Jaffrezo, J.L.; Kiss, G.; Laj, P. A European aerosol phenomenology-4: Harmonized concentrations of carbonaceous aerosol at 10 regional background sites across Europe. Atmos. Environ. 2016, 144, 133–145. [Google Scholar] [CrossRef]
- Vecchi, R.; Chiari, M.; D’Alessandro, A.; Fermo, P.; Lucarelli, F.; Mazzei, F.; Nava, S.; Piazzalunga, A.; Prati, P.; Silvani, F. A mass closure and PMF source apportionment study on the sub-micron sized aerosol fraction at urban sites in Italy. Atmos. Environ. 2008, 42, 2240–2253. [Google Scholar] [CrossRef]
- Turpin, B.J.; Huntzicker, J.J.; Hering, S.V. Investigation of organic aerosol sampling artifacts in the Los Angeles basin. Atmos. Environ. 1994, 28, 3061–3071. [Google Scholar] [CrossRef]
- Pongpiachan, S.; Kudo, S.; Sekiguchi, K. Chemical characterization of carbonaceous PM10 in BangkoPM10 in Bangkok, Thailand. Asian J. Appl. Sci. 2014, 7, 325–342. [Google Scholar] [CrossRef]
- Lonati, G.; Ozgen, S.; Giugliano, M. Primary and secondary carbonaceous species in PM2.5 samples in Milan (Italy). Atmos. Environ. 2007, 41, 4599–4610. [Google Scholar] [CrossRef]
- Samara, C.; Voutsa, D.; Kouras, A.; Eleftheriadis, K.; Maggos, T.; Saraga, D.; Petrakakis, M. Organic and elemental carbon associated to PM10 and PM2.5 at urban sites of northern Greece. Environ. Sci. Pollut. Res. 2014, 21, 1769–1785. [Google Scholar] [CrossRef] [PubMed]
- Yang, F.; Huang, L.; Duan, F.; Zhang, W.; He, K.; Ma, Y.; Brook, J.R.; Tan, J.; Zhao, Q.; Cheng, Y. Carbonaceous species in PM2.5 at a pair of rural/urban sites in Beijing, 2005–2008. Atmos. Chem. Phys. 2011, 11, 7893–7903. [Google Scholar] [CrossRef]
- Kokkola, H.; Yli-Pirilä, P.; Vesterinen, M.; Korhonen, H.; Keskinen, H.; Romakkaniemi, S.; Hao, L.; Kortelainen, A.; Joutsensaari, J.; Worsnop, D.R.; et al. The role of low volatile organics on secondary organic aerosol formation. Atmos. Chem. Phys. 2014, 14, 1689–1700. [Google Scholar] [CrossRef]
- Handler, M.; Puls, C.; Zbiral, J.; Marr, I.; Puxbaum, H.; Limbeck, A. Size and composition of particulate emissions from motor vehicles in the Kaisermuhlen-Tunnel, Vienna. Atmos. Environ. 2008, 42, 2173–2186. [Google Scholar] [CrossRef]
- Cesari, D.; Merico, E.; Dinoi, A.; Marinoni, A.; Bonasoni, P.; Contini, D. Seasonal variability of carbonaceous aerosols in an urban background area in Southern Italy. Atmos. Res. 2018, 200, 97–108. [Google Scholar] [CrossRef]
- Kim, Y.P.; Moon, K.C.; Lee, J.H. Organic and elemental carbon in fine particles at Kosan, Korea. Atmos. Environ. 2000, 34, 3309–3317. [Google Scholar] [CrossRef]
- Braniš, M.; Domasová, M.; Řezáčová, P. Particulate air pollution in a small settlement: The effect of local heating. Appl. Geochem. 2007, 22, 1255–1264. [Google Scholar] [CrossRef]
- Seguel, R.A.; Rau, G.E.; Morales, S.; Manuel, A.; Leiva, G. Estimations of primary and secondary organic carbon formation in PM2.5 aerosols of Santiago City, Chile. Atmos. Environ. 2009, 43, 2125–2131. [Google Scholar] [CrossRef]
- Kroll, J.H.; Seinfeld, J.H. Chemistry of secondary organic aerosol: Formation and evolution of low-volatility organics in the atmosphere. Atmos. Environ. 2008, 42, 3593–3624. [Google Scholar] [CrossRef]
- Castro, L.M.; Pio, C.A.; Harrison, R.M.; Smith, D.J.T. Carbonaceous Aerosol in Urban and Rural European Atmospheres: Estimation of Secondary Organic Carbon Concentrations. Atmos. Environ. 1999, 33, 2771–2781. [Google Scholar] [CrossRef]
- Na, K.; Sawant, A.A.; Song, C.; Cocker, D.R., III. Primary and secondary carbonaceous species in the atmosphere of Western Riverside County, California. Atmos. Environ. 2004, 38, 1345–1355. [Google Scholar] [CrossRef]
- Cesari, D.; Donateo, A.; Conte, M.; Contini, D. Inter-comparison of source apportionment of PM10 using PMF and CMB in three sites nearby an industrial area in central Italy. Atmos. Res. 2016, 182, 282–293. [Google Scholar] [CrossRef]
- Khan, B.; Masiol, M.; Formenton, G.; Di Gilio, A.; De Gennaro, G.; Agostinelli, C.; Pavoni, B. Carbonaceous PM2.5 and secondary organic aerosol across the Veneto region (NE Italy). Sci. Total Environ. 2016, 542, 172–181. [Google Scholar] [CrossRef] [PubMed]
- Harrison, R.M.; Yin, J. Sources and processes affecting carbonaceous aerosol in central England. Atmos. Environ. 2008, 42, 1413–1423. [Google Scholar] [CrossRef]
- Dan, M.; Zhuang, G.; Li, X.; Tao, H.; Zhuang, Y. The characteristics of carbonaceous species and their sources in PM2.5 in Beijing. Atmos. Environ. 2004, 38, 3443–3452. [Google Scholar] [CrossRef]
- Mkoma, S.L.; Mjemah, I.C. Influence of Meteorology on the Ambient Air Quality in Morogoro, Tanzania. Int. J. Environ. Sci. 2011, 1, 1107–1115. [Google Scholar]
- Weli, V.E. Spatial and Seasonal Influence of Meteorological Parameters on the Concentration of Suspended Particulate Matter in an Industrial City of Port Harcourt. Available online: http://www.iiste.org/Journals/index.php/DCS/article/viewFile/12868/13448 (accessed on 1 December 2017).
- Draxler, R.R.; Rolph, G.D. HYSPLIT (Hybrid Single-Particle Lagrangian Integrated Trajectory) Model. Available online: http://www.arl.noaa.gov/ready/hysplit4.html (accessed on 1 December 2017).


| Sites | PM10 (μg/m3) | PM2.5 (μg/m3) | PM2.5/PM10 | ||||||
|---|---|---|---|---|---|---|---|---|---|
| N | Avg ± Std | Min | Max | N | Avg ± Std | Min | Max | ||
| Naples | 37 | 50.8 ± 21.7 | 13.5 | 132.1 | 38 | 37.8 ± 18.0 | 10.1 | 102.5 | 0.74 |
| Lecce | 38 | 32.7 ± 13.0 | 7.4 | 64.9 | 36 | 25.7 ± 11.6 | 4.4 | 56.6 | 0.77 |
| Lamezia Terme | 38 | 10.1 ± 3.8 | 2.5 | 16.1 | 38 | 7.2 ± 3.5 | 1.4 | 13.8 | 0.68 |
| Capo Granitola | 14 | 23.2 ± 8.6 | 14.5 | 45.1 | 14 | 10.4 ± 2.6 | 6.1 | 14.6 | 0.50 |
| Monte Curcio | 31 | 3.4 ± 1.4 | 1.1 | 6.5 | 31 | 3.0 ± 1.2 | 1.2 | 6.1 | 0.82 |
| Sites | TC | OC | EC | TC/PM | OC/PM | EC/PM | OC/EC | SOC | SOC/OC |
|---|---|---|---|---|---|---|---|---|---|
| (μg/m3) | (μg/m3) | (μg/m3) | % | % | % | (min) | (μg/m3) | % | |
| Naples | 15.1 ± 5.2 | 12.8 ± 5.1 | 2.3 ± 1.0 | 31 | 26 | 5 | 6.4 (2.6) | 7.6 ± 5.3 | 52 |
| Lecce | 12.2 ± 6.4 | 10.7 ± 5.9 | 1.5 ± 0.8 | 35 | 31 | 5 | 7.3 (2.8) | 6.9 ± 4.8 | 59 |
| Lamezia Terme | 4.9 ± 2.3 | 4.3 ± 2.0 | 0.6 ± 0.3 | 48 | 42 | 6 | 6.9 (4.1) | 1.7 ± 1.1 | 37 |
| Capo Granitola | 2.6 ± 1.5 | 2.3 ± 1.2 | 0.3 ± 0.3 | 13 | 11 | 2 | 10.0 (4.4) | 0.7 ± 0.6 | 41 |
| Monte Curcio | 1.0 ± 0.4 | 0.9 ± 0.3 | 0.06 ± 0.04 | 30 | 28 | 2 | 15.9 (10.0) | 0.4 ± 0.1 | 47 |
| Sites | TC | OC | EC | TC/PM | OC/PM | EC/PM | OC/EC | SOC | SOC/OC |
|---|---|---|---|---|---|---|---|---|---|
| (μg/m3) | (μg/m3) | (μg/m3) | % | % | % | (min) | (μg/m3) | % | |
| Naples | 13.7 ± 4.8 | 11.8 ± 4.6 | 1.8 ± 0.5 | 39 | 33 | 6 | 6.4 (2.6) | 7.2 ± 4.4 | 54 |
| Lecce | 10.4 ± 5.1 | 9.0 ± 4.7 | 1.4 ± 0.7 | 40 | 34 | 6 | 6.9 (2.6) | 5.7 ± 3.6 | 57 |
| Lamezia Terme | 4.7 ± 2.1 | 4.0 ± 2.0 | 0.6 ± 0.3 | 67 | 57 | 10 | 6.5 (3.0) | 2.1 ± 1.3 | 47 |
| Capo Granitola | 2.0 ± 1.3 | 1.7 ± 1.1 | 0.3 ± 0.2 | 17 | 15 | 2 | 8.0 (4.0) | 0.6 ± 0.4 | 40 |
| Monte Curcio | 0.9 ± 0.3 | 0.9 ± 0.3 | 0.05 ± 0.03 | 33 | 31 | 2 | 15.5 (10.0) | 0.4 ± 0.2 | 48 |
| Sites | Wind Velocity (m/s) | Temperature (°C) | Relative Humidity (%) |
|---|---|---|---|
| Naples | 1.8 (0.5–5.7) | 10.8 (8.7–14.2) | -------- |
| Lecce | 1.5 (0.2–5.3) | 10.0 (4.7–12.5) | 79.3 (50.0–87.1) |
| Lamezia Terme | 2.8 (0.8–10.2) | 12.6 (9.1–16.6) | 70.4 (54.3–84.8) |
| Capo Granitola | 3.6 (0.6–13.7) | 13.0 (10.6–15.2) | 76.2 (64.2–85.8) |
| Montecurcio | 3.2 (0.2–13.4) | 2.8 (−2.2–8.2) | 70.9 (29.9–99.0) |
© 2017 by the authors. Licensee MDPI, Basel, Switzerland. This article is an open access article distributed under the terms and conditions of the Creative Commons Attribution (CC BY) license (http://creativecommons.org/licenses/by/4.0/).
Share and Cite
Dinoi, A.; Cesari, D.; Marinoni, A.; Bonasoni, P.; Riccio, A.; Chianese, E.; Tirimberio, G.; Naccarato, A.; Sprovieri, F.; Andreoli, V.; et al. Inter-Comparison of Carbon Content in PM2.5 and PM10 Collected at Five Measurement Sites in Southern Italy. Atmosphere 2017, 8, 243. https://doi.org/10.3390/atmos8120243
Dinoi A, Cesari D, Marinoni A, Bonasoni P, Riccio A, Chianese E, Tirimberio G, Naccarato A, Sprovieri F, Andreoli V, et al. Inter-Comparison of Carbon Content in PM2.5 and PM10 Collected at Five Measurement Sites in Southern Italy. Atmosphere. 2017; 8(12):243. https://doi.org/10.3390/atmos8120243
Chicago/Turabian StyleDinoi, Adelaide, Daniela Cesari, Angela Marinoni, Paolo Bonasoni, Angelo Riccio, Elena Chianese, Giuseppina Tirimberio, Attilio Naccarato, Francesca Sprovieri, Virginia Andreoli, and et al. 2017. "Inter-Comparison of Carbon Content in PM2.5 and PM10 Collected at Five Measurement Sites in Southern Italy" Atmosphere 8, no. 12: 243. https://doi.org/10.3390/atmos8120243