Article

Use of Combined Observational- and Model-Derived Photochemical Indicators to Assess the O3-NOx-VOC System Sensitivity in Urban Areas

by
Edson R. Carrillo-Torres
,
Iván Y. Hernández-Paniagua
and
Alberto Mendoza
*
School of Engineering and Sciences, Tecnologico de Monterrey, Av. Eugenio Garza Sada 2501, Monterrey, NL 64849, Mexico
*
Author to whom correspondence should be addressed.
Atmosphere 2017, 8(2), 22; https://doi.org/10.3390/atmos8020022
Submission received: 10 December 2016 / Revised: 14 January 2017 / Accepted: 20 January 2017 / Published: 26 January 2017
(This article belongs to the Special Issue Tropospheric Ozone and Its Precursors)

Abstract

:
Tropospheric levels of O3 have historically exceeded the official annual Mexican standards within the Monterrey Metropolitan Area (MMA) in NE Mexico. High-frequency and high-precision measurements of tropospheric O3, NOy, NO2, NO, CO, SO2, PM10 and PM2.5 were made at the Obispado monitoring site near the downtown MMA from September 2012 to August 2013. The seasonal cycles of O3 and NOy are driven by changes in meteorology and to a lesser extent by variations in primary emissions. The NOy levels were positively correlated with O3 precursors and inversely correlated with O3 and wind speed. Recorded data were used to assess the O3-Volatile Organic Compounds (VOC)-NOx system’s sensitivity through an observational-based approach. The photochemical indicator O3/NOy was derived from measured data during the enhanced O3 production period (12:00–18:00 Central Daylight Time (CDT), GMT-0500). The O3/NOy ratios calculated for this time period showed that the O3 production within the MMA is VOC sensitive. A box model simulation of production rates of HNO3 (PHNO3) and total peroxides (Pperox) carried out for O3 episodes in fall and spring confirmed the VOC sensitivity within the MMA environment. No significant differences were observed in O3/NOy from weekdays to weekends or for PHNO3/Pperox ratios, confirming the limiting role of VOCs in O3 production within the MMA. The ratified photochemical regime observed may allow the environmental authorities to revise and verify the current policies for air quality control within the MMA.

1. Introduction

Increased tropospheric levels of O3 can be harmful for human health, vegetation and built infrastructure [1,2,3]. In the troposphere, O3 is produced by photochemical reactions between volatile organic compounds (VOCs) and nitrogen oxides (NOx = NO + NO2) in a non-linear O3-VOC-NOx system not fully unraveled yet [3]. Due to the non-linearity of the O3-VOC-NOx system, O3 production can be VOC sensitive when controlled by the input of VOCs and increase in response to increased VOC emissions, but constant NOx levels. Conversely, O3 production can be NOx-sensitive when NOx emissions govern the system, and O3 mixing ratios increase in response to increased NOx emissions, but remain constant to variations of VOCs [4,5,6]. Typical VOC/NOx ratios for VOC-sensitive regimes are <4, while those for NOx-sensitive regimes are >15 [5]. However, existing studies report changes in O3 production during the daytime and from weekdays to weekends from VOC- to NOx-sensitive regimes and vice versa within the same region as a result of changes in the emissions of precursors and meteorology [7,8,9,10,11]. Because the majority of existing policies to reduce the tropospheric levels of O3 within urban areas focus on reducing the emissions of precursors, their success depends strongly on untangling, with accuracy, the sensitivity of O3 production. The sensitivity of the O3 production system has been traditionally assessed using either photochemical box models or 3D chemistry/transport models to predict changes under different control scenarios of VOCs and NOx emissions or observational-based approaches (Table 1). Models are run frequently with recorded data for ambient air pollutants as input to infer the processes that govern the O3 production. However, the accuracy of the results generated by emissions-driven models also depends on multiple assumptions in the input data (including the emission rates), which can be highly uncertain and could lead to contradictory results [5]. It has also been reported that different modeling systems applied to the same air basin can yield different results [12,13]. In addition, as exemplified in Table 1, modeling studies tend to cover short-term episodes, given the amount of resources needed to model large periods of time. Thus, an effort has to be made to choose modeling episodes that are representative of the phenomena being addressed.
The observational methods to assess the O3 production sensitivity based on datasets of robust measurements for involved species in the O3-VOC-NOx system represent a feasible alternative to the traditional modeling approach. One advantage of this approach over pure modeling studies is that larger time frames (several months or more worth of data) can be used (Table 1). Some of the typical photochemical indicators used in the observational approach are hydrogen peroxide (H2O2) [5,18,20], nitric acid (HNO3) [5,18,20], total odd nitrogen (NOy = NO + NO2 + peroxyacetyl nitrate (PAN) + HNO3 + other inorganic and organic nitrates) [12,21,22] and the O3/NOy ratio [23,24,25]. For example, from a numerical assessment conducted for six polluted regions in the U.S., O3/NOy ratios ≤ 6 and ≥8 were determined for VOC- and NOx-sensitive regimes, respectively, when mixing ratios of O3 are >100 ppb; and O3/NOy ratios ≤ 11 and ≥15 in VOC- and NOx-sensitive conditions, respectively, in environments of O3 mixing ratios < 80 ppb [25]. In Southern Taiwan, two VOC-sensitive urban areas with O3/NOy ratios < 6 and one NOx-sensitive area with O3/NOy ratios > 7 were observed during 2003–2004 [18]. O3/NOy average ratios of 5.1 ± 3.2 and 13.6 ± 4.7 for VOC- and partially NOx-sensitive O3 production, respectively, at two sites in Valencia, Spain, were observed during 2010–2011 [26]. The observed variations in the O3/NOy ratios both for VOC- and NOx-sensitive regimes arise from different behaviors of the indicator relative to the environmental conditions (clean, moderately polluted or highly polluted environments) [25].
The photochemical indicators that have been used arise from the analysis of the main reaction pathways of the O3-VOC-NOx system. In a simplified manner, the initial steps of the oxidation of VOCs in the atmosphere can be represented by the following reactions [25]:
VOC + HO → RO2
(where R is a general hydrocarbons chain)
RO2 + NO → NO2 + HO2 + R’
(where R’ is an intermediate VOC)
HO2 + NO → HO + NO2
NO2 + hv → NO + O3
HO2 + HO2 → H2O2
HO2 + RO2 → ROOH
HO + NO2 → HNO3
O3 accumulates in the atmosphere as NO is transformed to NO2 (through Reaction 2) without destroying O3; i.e., as the NO + O3 → NO2 + O2 reaction becomes less relevant because of the presence of VOCs that provide a source of odd hydrogen radicals that foster other reactions. Thus, the prevalence of a given photochemical regime is driven by the chemistry of hydrogen radicals. For example, it has been shown that the chain terminating steps that involve the formation of peroxides (Reactions 5 and 6) and nitric acid (Reaction 7) compete as radical sinks, and if peroxides dominate, then a NOx-sensitive condition will occur [5,25]. Similar theoretical arguments are provided to justify the use of NOy as a photochemical indicator: the split between regimes can be established from the strength of odd nitrogen sources against odd hydrogen sources. Further details can be found elsewhere [5,25].
In Mexico City, a VOC-sensitive regime was determined for most of the urban area using the O3/NOy, O3/NOz and NOy indicators derived from tropospheric measurements made at three monitoring sites within the city [12]. In addition, a numerical simulation carried out by a 3D photochemistry/transport model was used to estimate the transition values of the indicators between regimes for a two-week period in April 2004; the transition value was ~8.1, and the average O3/NOy at the studied site was 2.6. Besides Mexico City, other large metropolitan areas in the country also experience frequent O
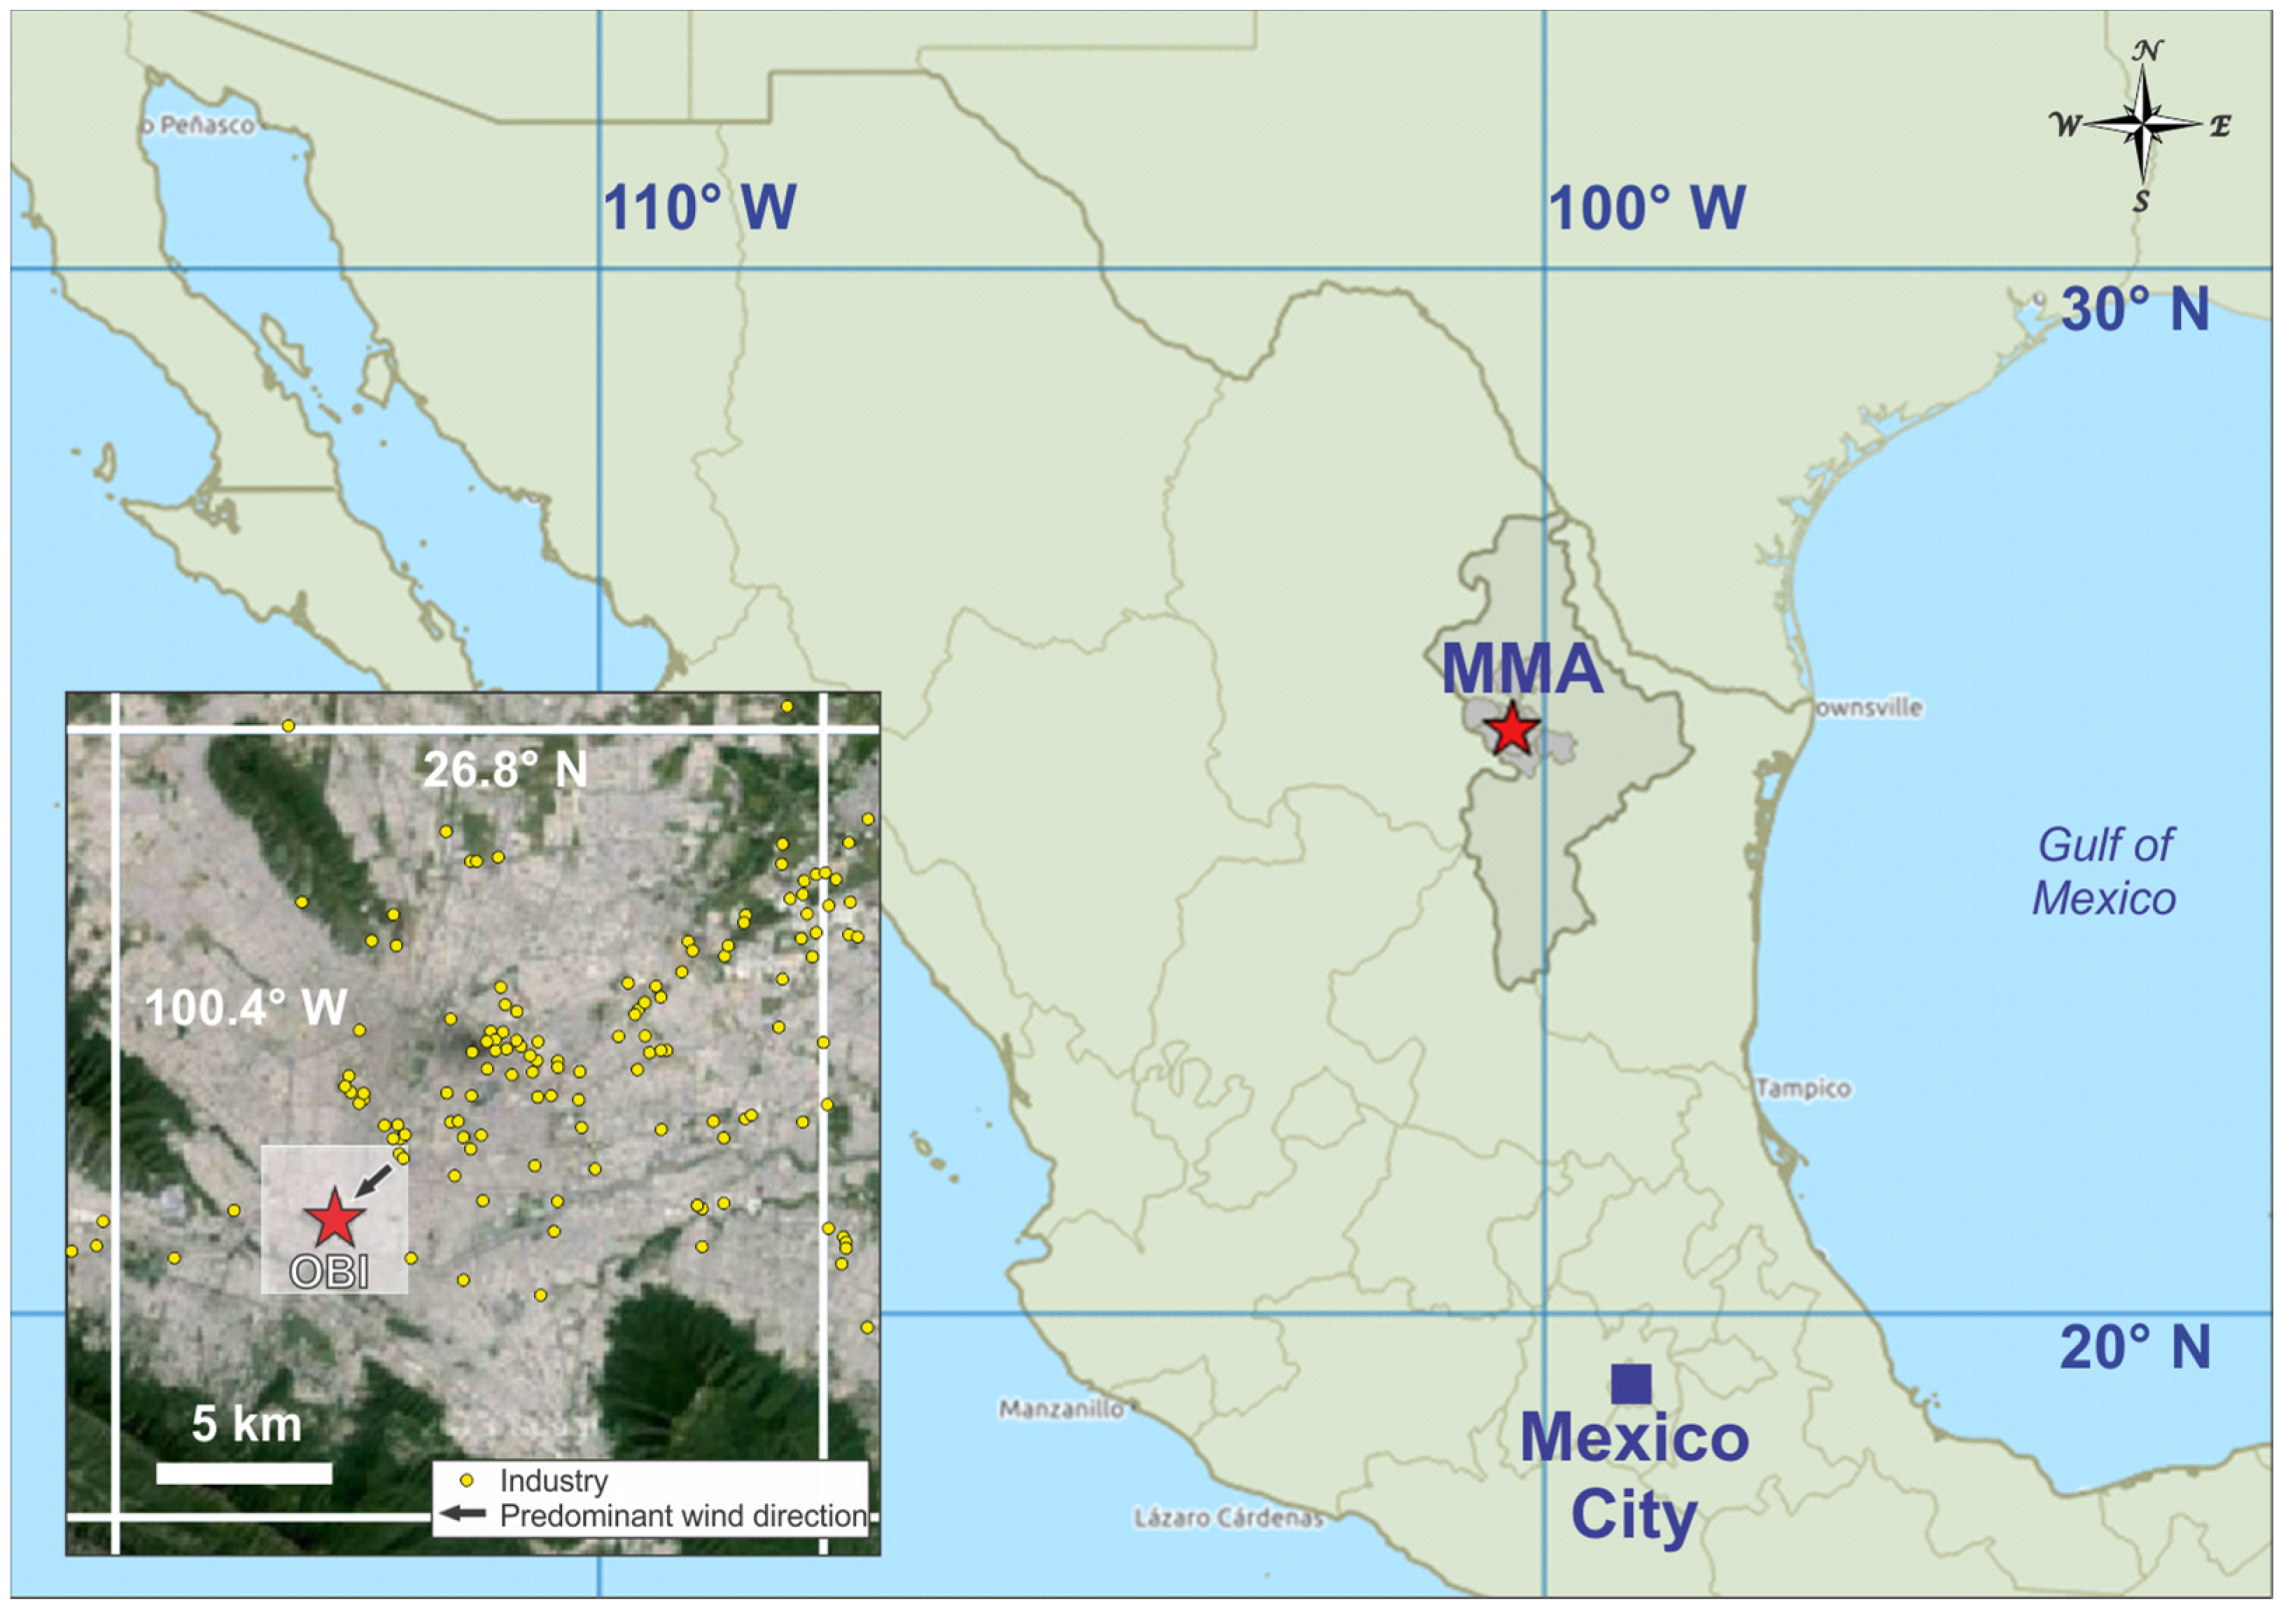
3 episodes, although they have received relatively little attention. For instance, the Monterrey Metropolitan Area (MMA; Figure 1), which is the third-largest metropolitan area in Mexico, has historically experienced high levels of O3, PM10 and PM2.5. Official reports show that within the MMA, breaches of the 1 h 110 ppb and running 8 h 80 ppb O3 official Mexican standards (Norma Oficial Mexicana or NOM, in Spanish) were frequent during 2000–2013 [27].
At the Obispado monitoring site (OBI) located near the downtown area of Monterrey (Figure 1), the O3 1 h NOM was exceeded annually between two and 17 times during 2000–2013, whereas the O3 running 8 h NOM was breached between four and 38 times during the same period. Furthermore, an increase in the frequency of breaches of both the O3 1 h average and the O3 running 8 h average is expected due to the introduction of lower standard values of 95 and 70 ppb, respectively, applicable since October 2014. This highlights the importance of untangling the O3 production sensitivity system to introduce effective emission controls, which can lead to an improvement in the air quality within the MMA. To date, only one study has recently assessed the O3 production sensitivity system within the MMA [19]; a VOC-sensitive regime was observed based on numerical simulations performed with the Community Multi-scale Air Quality (CMAQ) model. However, those results come from a six-day O3 episode during summer 2005, which may not be representative of the environmental conditions prevailing the rest of the year [19].
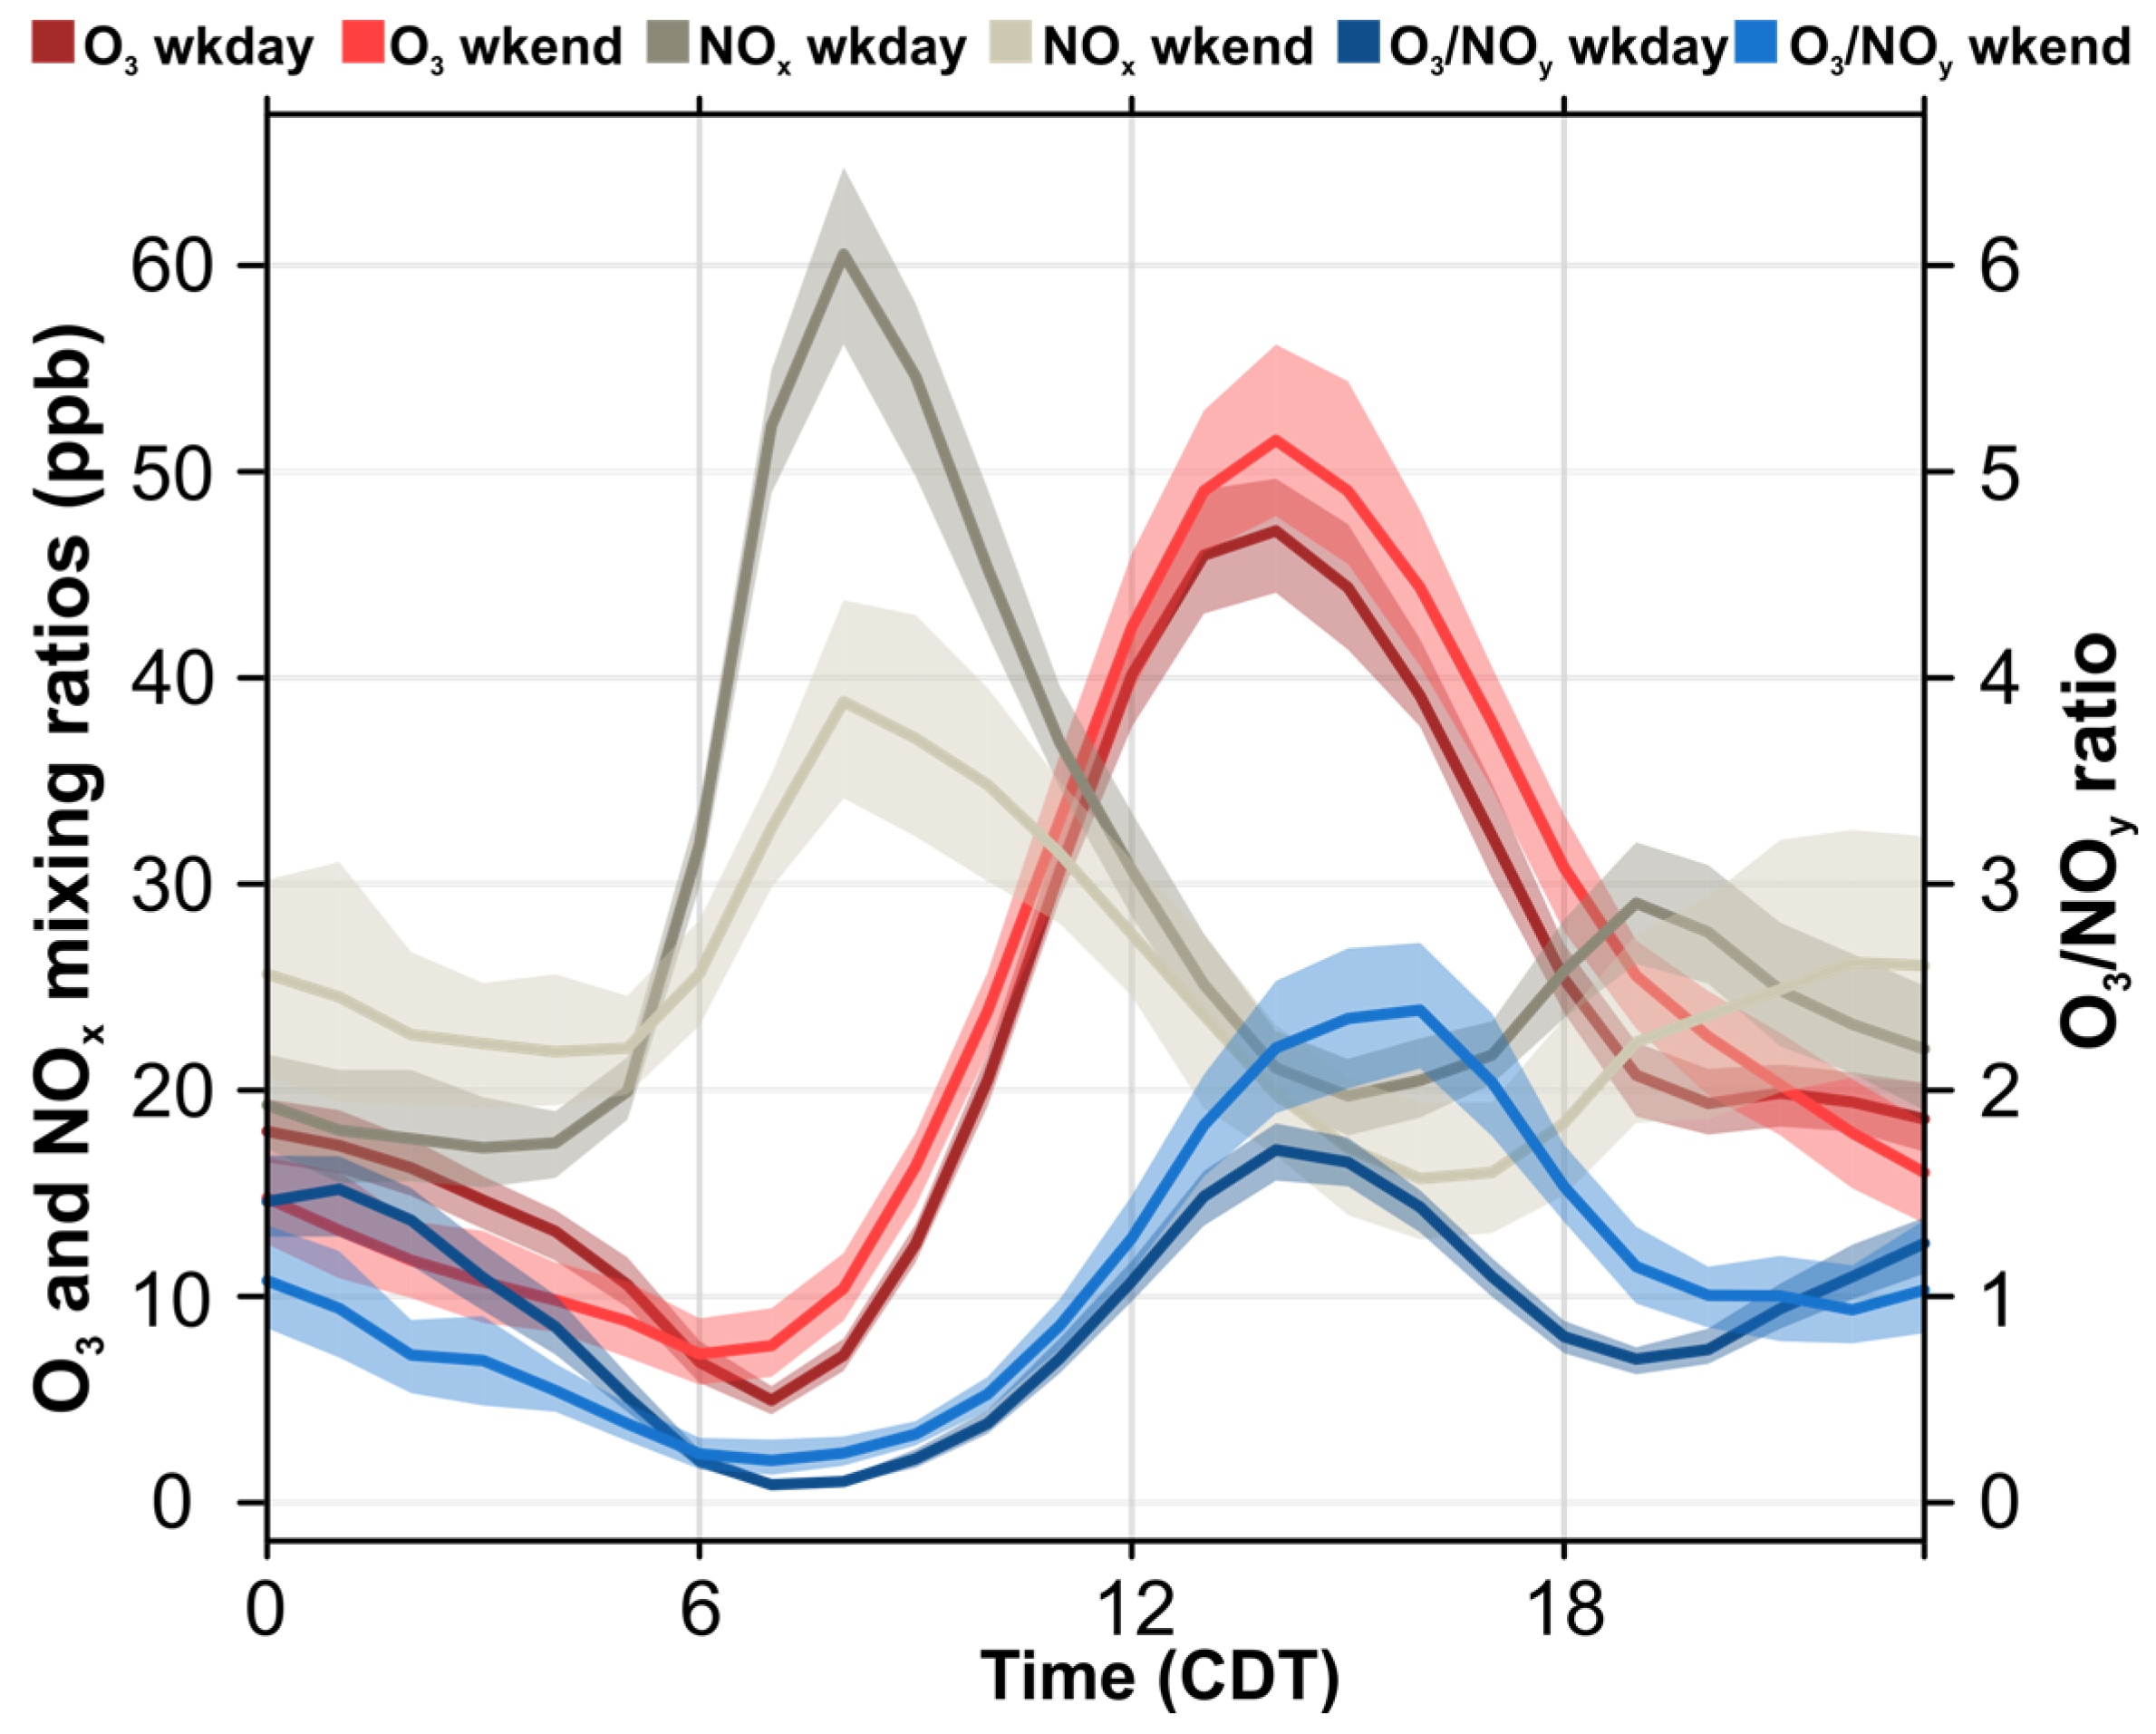
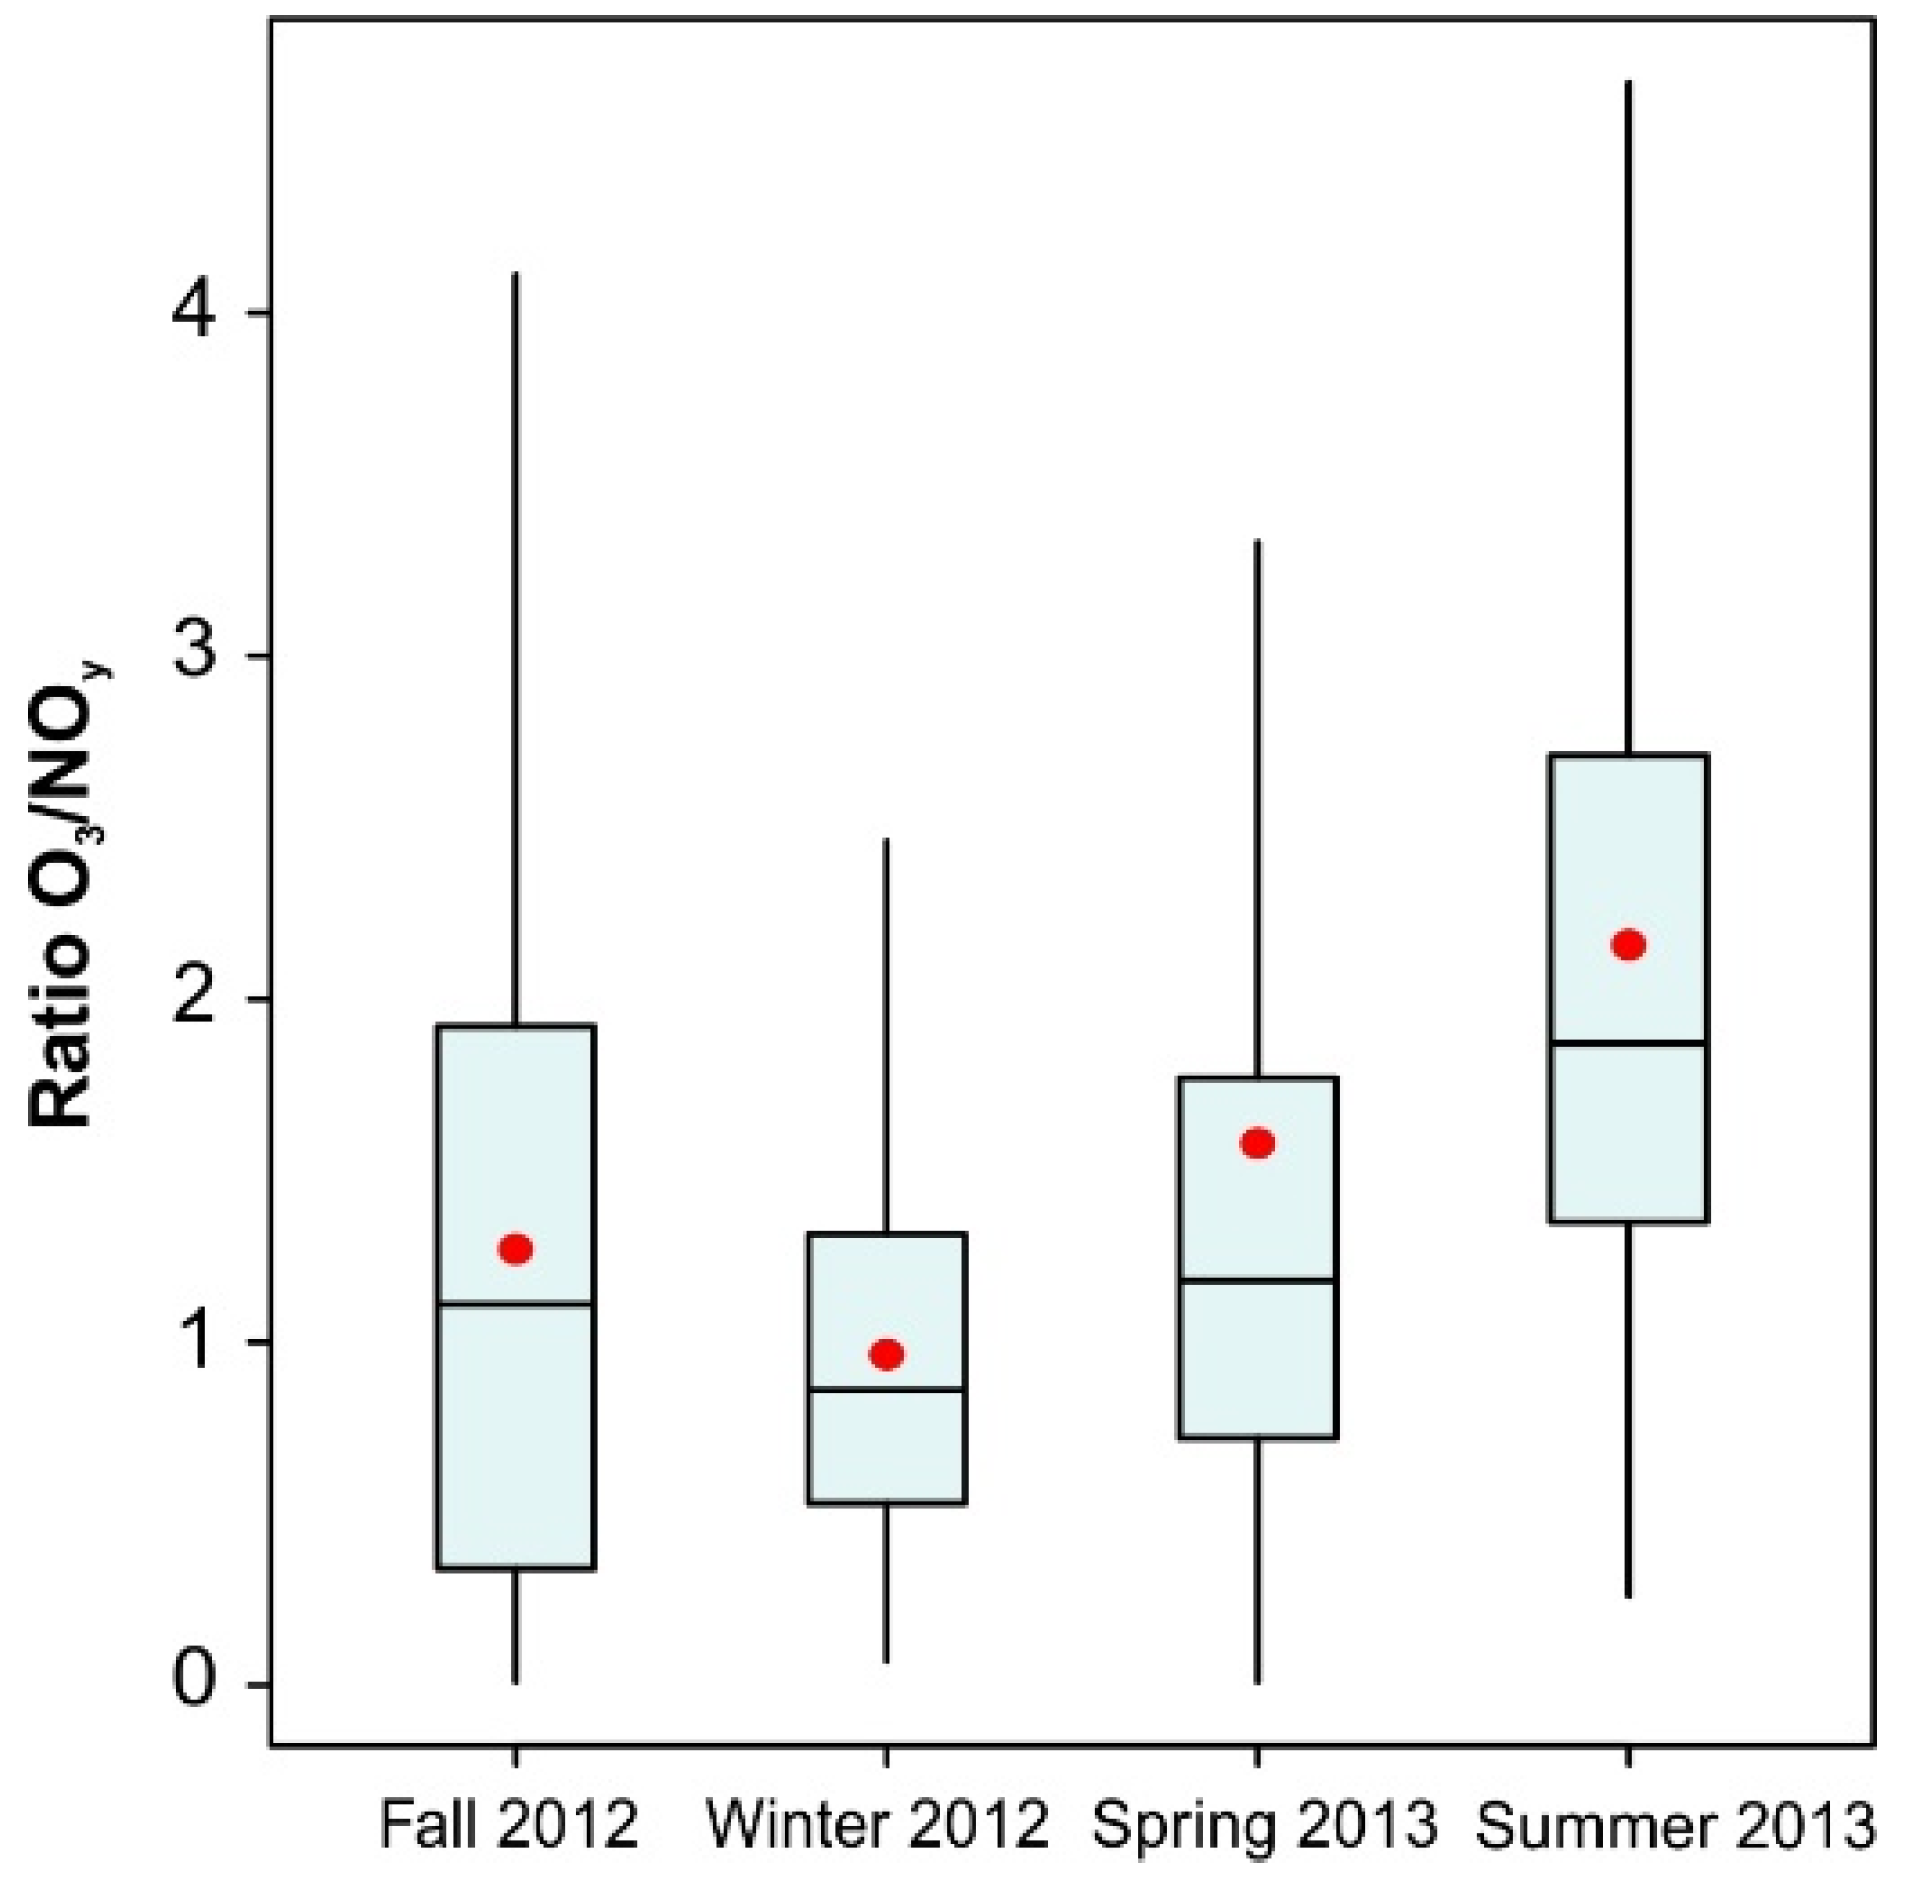
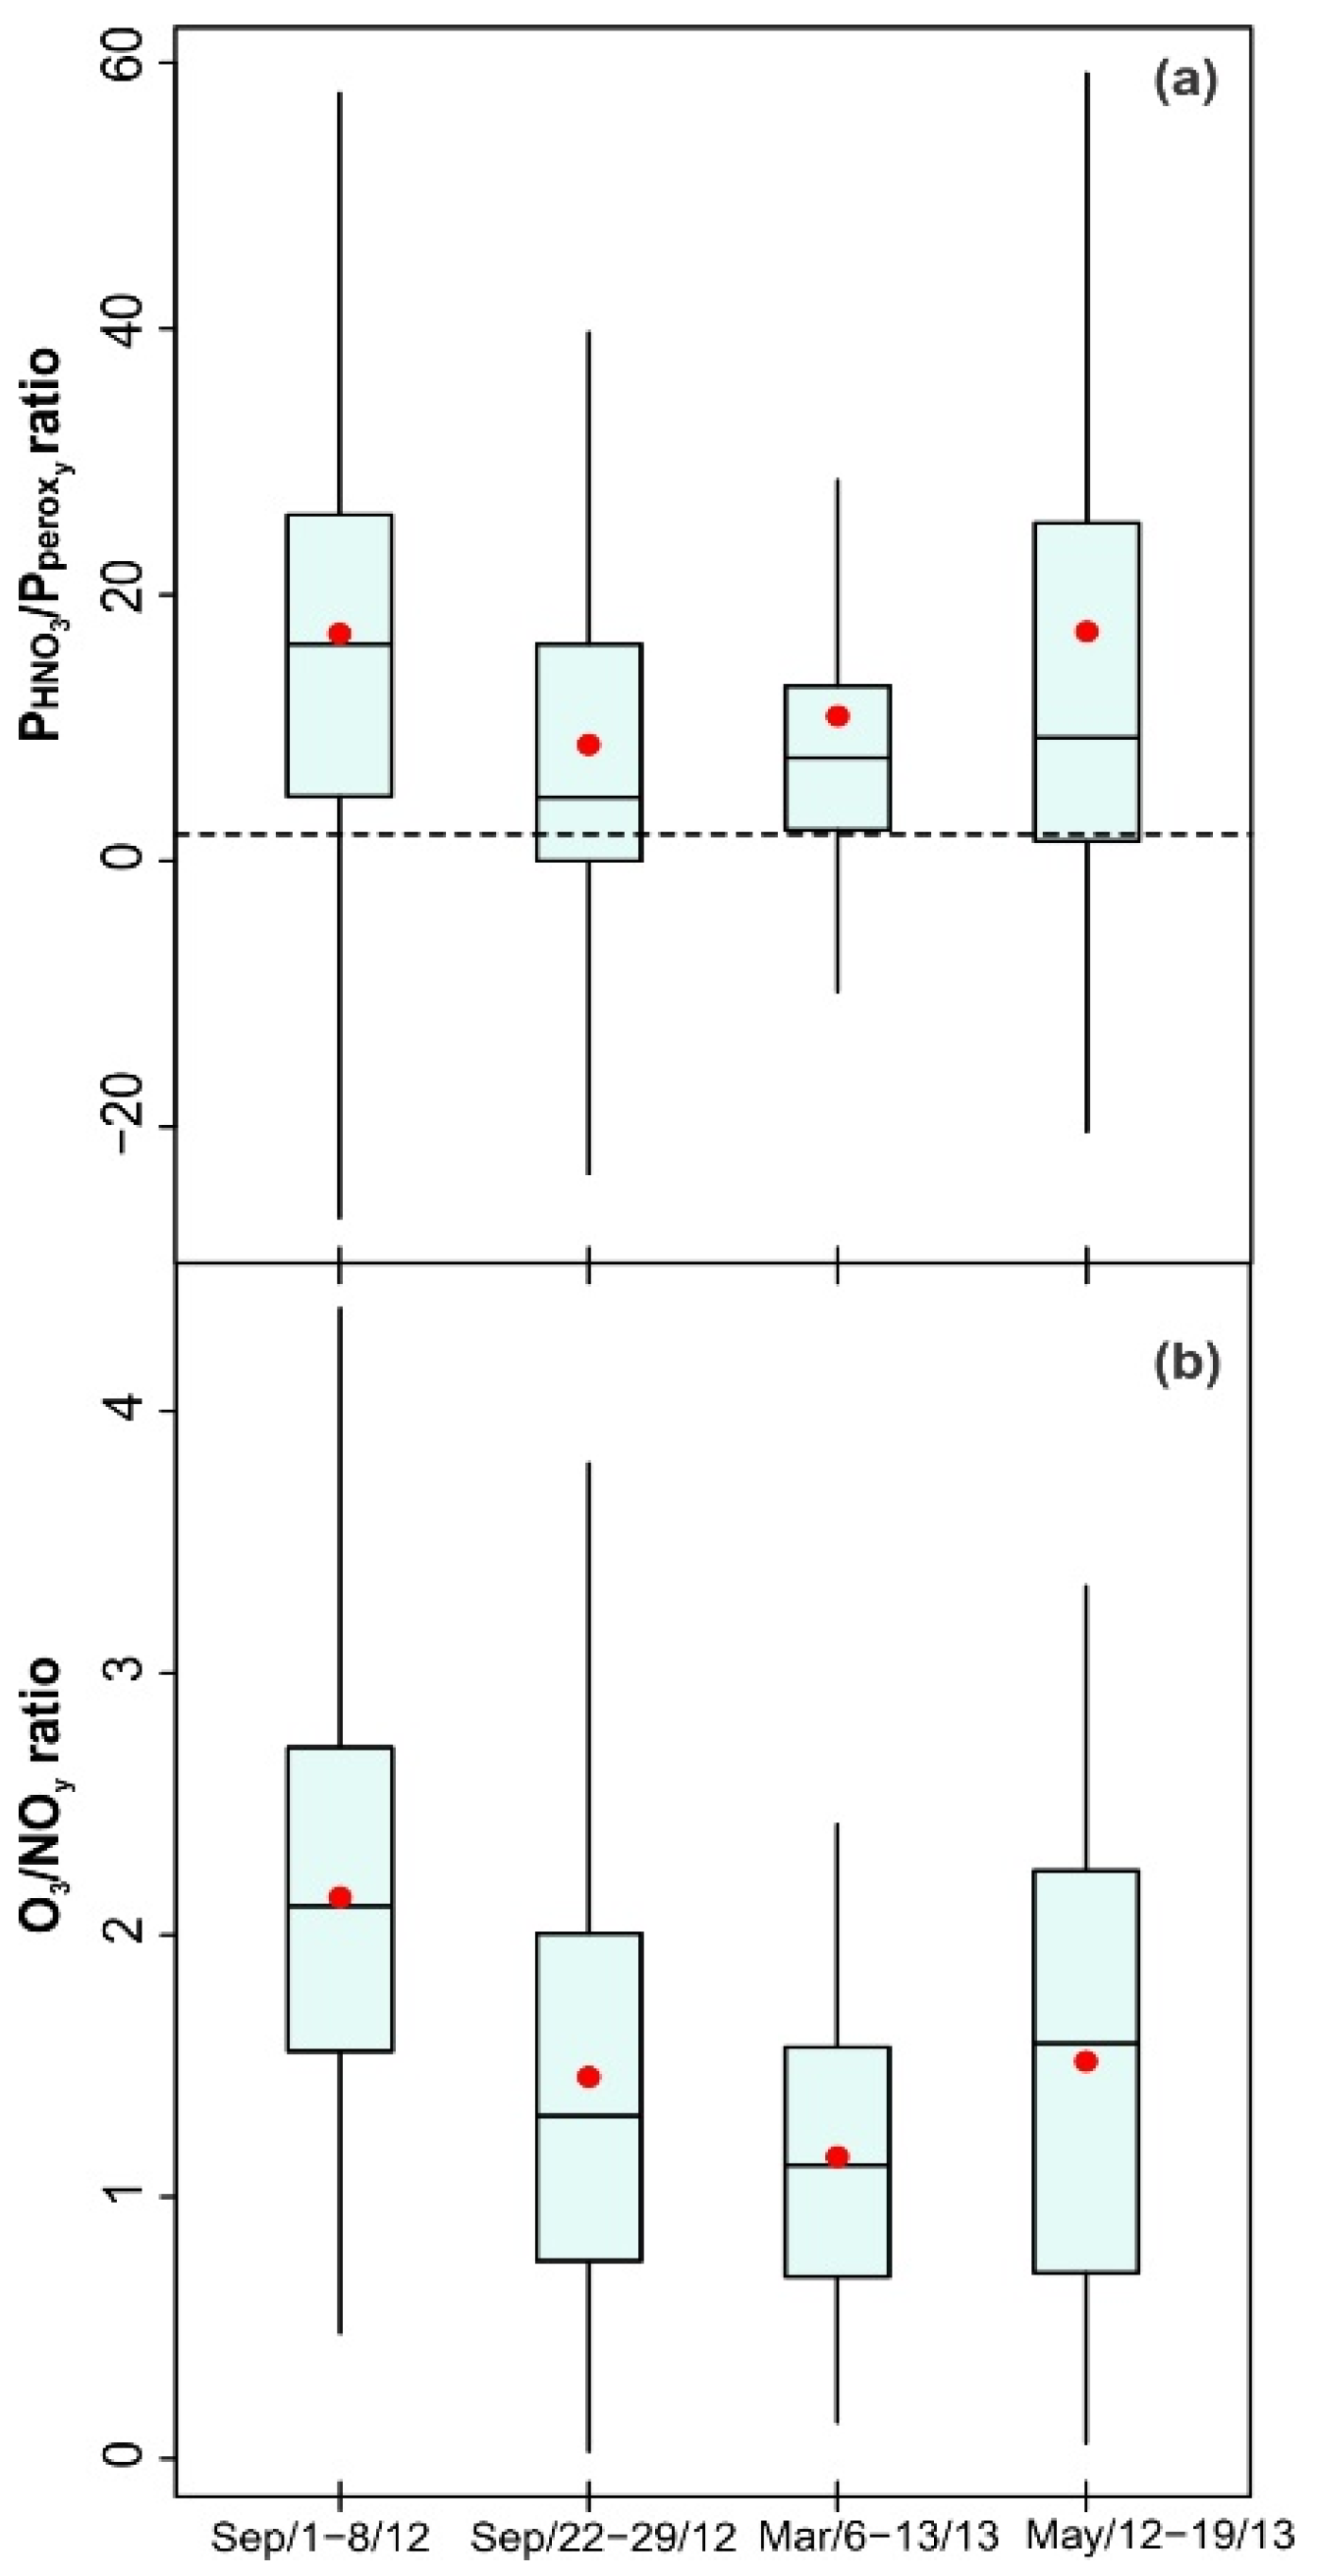
This study presents the assessment of the O3 photochemical production regime within the MMA over a one-year period carried out by combining box-modeling and observational approaches to analyze the behavior of two photochemical indicators. The photochemical indicator O3/NOy was derived from recorded data within the MMA for tropospheric air pollutants from September 2012 to August 2013, which was used to analyze the O3 production system. Ratios of the HNO3 and total peroxide production rates (PHNO3/Pperox) were computed using a box-model and were subsequently employed to evaluate the results derived from the recorded ambient data. Additionally, the existence of a weekend effect in the O3 production within the MMA was evaluated using the O3/NOy and PHNO3/Pperox ratios.

2. Methods

2.1. Study Site Description and Air Pollutant Monitoring

The MMA is located in northeast Mexico, some 230 km S of the United States border, and lies at an average altitude of 550 m a.s.l. (Figure 1). It is the third-most populous urban area in the country with around 5.12 million inhabitants and the second-largest industrial region [28]. The MMA also has the highest vehicle motorization index in Mexico of around 0.5 vehicles per inhabitant. Continuous measurements of typical criteria air pollutants (O3, NO, NO2, CO, SO2 and PM10) and meteorological parameters (wind speed (WS), wind direction (WD), relative humidity (RH), pressure, solar radiation (SR) and temperature) have been made since November 1992 at five monitoring sites that form part of the Integral Environmental Monitoring System (SIMA) of the Nuevo Leon Government. PM2.5 measurements began in 2003.
Additionally, NOy measurements were conducted at the OBI site from July 2012 to August 2013 using a Thermo Scientific chemiluminescence analyzer 42i-Y, in accordance with the United States Environmental Protection Agency (EPA), RFNA-1289-074. The OBI site location near the MMA downtown (25°40′33″ N, 100°20′18″ W; Figure 1) is ideal to record emissions from the industrial, domestic and mobile sources depending on air masses’ trajectories. Table 2 shows the instrumentation used to measure air pollutants and meteorological parameters at OBI. Calibration and maintenance procedures were carried out according to official protocols established in the Mexican standards NOM-036-SEMARNAT-1993 and NOM-156-SEMARNAT-2012.

2.2. Capture Rate and Seasonal and Wind Sector Analyses

Figure 2 shows the data capture of validated 1 h averages of air pollutants and meteorological data recorded at OBI from September 2012 to August 2013. Data capture for air pollutants and meteorological parameters ranged from 84.6% (SO2) to 96.0% (CO) and from 96.0% (RH) to 98.8% (pressure), respectively. To perform seasonal analyses, 4 seasons were defined according to temperature records in the northern hemisphere: fall (September–November 2012), winter (December 2012–February 2013), spring (March–May 2013) and summer (June–August 2013). Wind-sector analyses were carried out by diving the dataset into 8 wind sectors of 45° starting from 0° ± 22.5°. The lower bound of wind each sector was established by adding 0.5° to avoid the duplication of data.

2.3. Meteorology at the MMA

The climate at the MMA is semi-arid, with an annual average temperature of around 23 °C. Figure 3a shows that at OBI, the monthly temperature averages in summer are higher than 25 °C, whereas temperatures in winter are typically below 20 °C. Similarly, the SR exhibits the highest monthly averages in summer and the lowest ones by late fall-early winter. The RH varies drastically during the year, with the lowest and highest averages typically observed in spring and fall, respectively. The rainfall within the MMA is frequent by late summer-early fall and scarce in the winter [29].
Figure 3b shows the frequency of the counts of WD occurrence at OBI by season from September 2012 to August 2013. Overall, the predominant WD is NE with frequencies of 34%–38% in spring and summer, respectively, although in winter, the greatest frequency of around 26% is observed for the E sector. Calm conditions (1 h averages) with a WS of less than 0.36 km·h−1 occurred <1% of the time. A high WS (>15 km·h−1) is typically observed in spring and summer for the E sector with frequencies > 2% of the time. By contrast, a WS < 3 km·h−1 shows the highest frequency in winter, mostly for the W and SW sectors.

2.4. Statistical Analyses

To have a better understanding of the O3/NOy photochemical indicator data obtained here, statistical tests were performed to analyze and interpret the observed pollutants’ dynamics. Descriptive statistics and seasonal profiles of data recorded at OBI from September 2012 to August 2013 were calculated using the openair package [30] for R software [31]. Correlations among air pollutants and meteorological data recorded were tested using a multiple linear regression analysis. A principal component analysis (PCA) was carried out to isolate the variables that govern the O3 production within the MMA. The variables identified as drivers of the O3 production were subject to a cluster analysis (CA) to select daytime periods of enhanced photochemical activity. O3/NOy ratios calculated for the selected photochemical periods were analyzed by season, and a wind sector analysis was carried out to identify spatial variations in the photochemical processing of air masses arriving at OBI during September 2012–August 2013. Finally, the presence of a weekend effect in the diurnal production of O3 was tested using an ANOVA analysis for O3/NOy ratios during the enhanced photochemical activity period. Data correlations, PCA, CA and ANOVA were carried out using IBM SPSS Statistics software v.19.0 (IBM, Armonk, NY, USA) for Windows.

2.5. Box Model Description and Simulations

Ratios of the HNO3 and total peroxide production rates (PHNO3/Pperox) during high photochemical activity periods can be used to assess the O3 production regime [25]. For example, typical VOC-sensitive regimes exhibit PHNO3/Pperox ratios > 2. For periods of enhanced photochemical activity within the MMA from September 2012 to August 2013, PHNO3 and Pperox were calculated using the California/Carnegie Institute of Technology (CIT) 3D air quality model [32,33,34] in a box-model configuration [35]. Hourly-average PHNO3/Pperox ratios were calculated from the reaction rates constants estimated by the CIT model (i.e., the SAPRC90 photochemical mechanism [36]):
P x = i k i [ A i ] [ B i ] j k j [ C j ] [ x ]
where Px is the rate of the production of pollutant x and ki and kj are the reaction rate constants for the corresponding production and consumption reactions, respectively. Thus, ∑ki[Ai][Bi] accounts for the production of chemical species x from all relevant reactions ([Ai] and [Bi] are the concentrations of the corresponding reactants in the i-th reaction). Similarly, ∑kj[Cj][x] accounts for the consumption of species x ([Cj] is the concentration of the species that reacts with x in the j-th reaction, and [x] is the concentration of x).
The model domain comprised a box of 16 km2, centered at the OBI site (Figure 1). The model vertical structure is analogous to that used by Young et al. [35] to account for the evolution of the mixing layer, setting the top of the domain at 3100 m a.g.l. Emissions data were obtained from the National Emissions Inventory of Mexico 2005 (NEI) [37]. Emission rates for CO, NOx, VOCs, SOx and NH3 were derived following the methodology reported by Mendoza and García [38] to obtain temporally-distributed and chemically-speciated emission rates. The chemical speciation profiles for NOx and VOC emissions were obtained from the U.S. EPA SPECIATE database for sources of emissions included in the NEI [39]. Meteorology inputs (temperature, humidity, WS and WD, SR and mixing layer height) were derived from 1-h average data recorded at the OBI site. SIMA 1-h averages of CO, NO, NO2, O3 and SO2, together with 4-h average diurnal data for reactive hydrocarbons (RHCs), ketone, formaldehyde, acetaldehyde and isoprene data were used to constrain the model. The average RHC and individual VOC species data were obtained during sampling campaigns carried out within the MMA in the spring and fall of 2011 and 2012 [40,41]. Additionally, the CIT model was modified to include speciated NOz (NOy–NOx) data in the initial conditions, which was calculated from NOx and NOy measurements made at the OBI site. NOz was speciated using the average contributions of the 3 main species that typically form most of the NOz produced in urban centers: 55% HNO3, 40% PAN and 5% nitrous acid (HONO) [42,43].
Table 3 shows the modeled periods, which were chosen because the O3 levels breached the 110 ppb 1 h NOM applicable during 2012–2013. The modeled periods include weekends and weekdays in the fall and spring, when O3 typically exceeds the official air quality standards.

3. Results and Discussion

3.1. Air Pollutants Annual Profiles

The recorded air pollutants exhibit an annual profile as a result of changes in precursor emissions and meteorology. Figure 4 shows the annual profile for O3, NOy, NO, NO2 and CO recorded at the OBI site from September 2012 to August 2013. The O3 exhibits the highest mixing ratios in spring 2013 as result of high photochemistry between NOx and VOCs and the lowest ones in winter 2012 in antiphase with NO2 as a result of the reduced SR and low temperatures (Figure 3a). A downward spike in the O3 mixing ratios is observed by mid-summer 2013, which is likely caused by a high WS typical of early summer. The decrease in O3 during summer causes another peak in the annual cycle, which is observed by early fall. However, frequent rainfall leads to lower monthly averages of O3 during fall than those in spring. The highest mixing ratios of NOy are observed during winter as a result of the low SR and low temperature, which increase the NO2 and NO build-up [23]. In contrast, the lowest mixing ratios of NOy are observed during summer due to enhanced dispersion, large mixing height depths and high photochemical activity of O3 precursors.
Table 4 shows the results of linear correlation analyses between NOy and NO2, NO, O3, CO, SR, temperature and WS. A strong correlation between NO2 and NOy (R = 0.819) is observed in winter as a result of the low photolysis rates of NO2, which suggests that NO2 is the main component of NOy. Figure 5 shows the annual profiles of the NOy−NO difference and the NOx/NOy ratio. The NOy−NO difference exhibits the maxima and minima in winter and summer, respectively, which are in antiphase with the observed mixing ratios of O3 from September 2012 to August 2013. In contrast, the NOx/NOy ratio exhibits the maxima by late fall-early winter and minima in early spring. The high values in the NOx/NOy ratio observed during winter confirm a build-up of NO2 and NO, which implies that NOz is a low fraction of the total NOy due to low photochemical processing [22]. During spring, low NOx/NOy ratios indicate an enhancement of the photochemical processing of the air masses, which could confirm the high O3 mixing ratios observed in the season (Figure 4). The presumed high contribution of NOz to NOy during spring could also explain the weak correlation between NOy and NO2 (R2 < 0.411) and between NOy and NO (R2 < 0.275) (Table 4). Finally, very weak correlations between NOy and O3 (R2 < 0.151) are seen during the whole year due to their antiphase annual cycle, this is underlined during spring and summer when the photo-dissociation of NO2 to produce O3 is enhanced [44].

3.2. Wind Sector Analysis

Figure 6a shows pollution roses of the O3 mixing ratios at OBI by WS. Overall, the mixing ratios of O3 > 50 ppb are frequent in air masses arriving from the NE and E sectors at a WS > 5 km·h−1 and an increase in frequency at a WS > 10 km·h−1, likely due to the local transport of O3 and precursors from the upwind dense industrial area [40,45]. Similar to the MMA, an increase in the O3 mixing ratios caused by upwind precursor emissions was observed at the Shangdianzi site near Beijing, China [22]. In that site, it was observed that large emissions of VOCs enhance the production of O3 linked with an increase in the NOz levels. Such an increase in NOz levels (>50 ppb) is also observed at OBI when the WS ranged from 1–5 km·h−1 for all wind sectors (Figure 6b), and for a WS > 5 km·h−1 in air masses from the N-NE-E sectors, the location of major industrial sources of NOx and VOC emissions.
In contrast, mixing ratios of O3 < 25 ppb at OBI are typical during winter and show the highest frequency at a WS < 1 km·h−1 and a reduced frequency at a WS < 5 km·h−1 for all wind sectors, except for NE and E sectors. Similar to O3, the NOz exhibits low mixing ratios (<25 ppb) at a WS > 10 km·h−1; however, at a low WS, mixing ratios of NOz > 50 ppb are common for the SW and E sectors, which is likely due to the photochemical processing of NOx emissions from mobile sources under stagnant conditions.

3.3. The Enhanced Photochemical Period

Photochemical indicators around the period of maximum photochemical activity for the chemical species involved in the O3 production system may reflect daytime variations in photochemistry within the planetary boundary layer, and therefore, such indicators can be used to assess the photochemical regime of O3 production [5,26]. For example, O3/NOy ratios were estimated from data recorded in the period of 13:00–17:00 Central Daylight Time (CDT, GMT-0500) during April 2004 at a downwind receptor site of photo-chemically-aged air masses within Mexico City [12]. Likewise, O3/NOy ratios from measurements made during 13:00–16:00 CET at two sampling sites in Valencia, Spain, during August 2010–May 2011 and May–October 2011 were calculated [26]. In the current study, the variables that govern the O3 production within the MMA were isolated using a PCA for NOy, NO2, NO, O3, CO, SO2, PM10, PM2.5 and temperature, WS, WD and SR data recorded from September 2012 to August 2013.
Table 5 shows that three components designated as PC1-3 are significant, which accounted for 67.2% of the total variability. The PC1 revealed a positive correlation among the precursors of O3; NOy, NO, NO2 and CO. The PC2 correlates positively with O3 and SR, which is explained by the photolysis of NO2 during the daytime. The PC3 correlates positively with WD and temperature, which comprise the effect of the air mass origin and planetary boundary layer height that influences the dispersion of O3. Dendrograms for the O3 and SR data recorded within the MMA (PC2) were constructed to identify the hours of enhanced photochemistry, the period of maximum O3 production. Figure 7 shows the annual average period of enhanced O3 production from 12:00 to 18:00 CDT and O3 depletion from 19:00 to 11:00, respectively.

3.4. Use of the O3/NOy Photochemical Indicator

The photochemical indicator O3/NOy was derived from measurements made during the period of 12:00–18:00 CDT at OBI during September 2012–August 2013. Figure 8 shows a box plot by season for O3/NOy ratios at OBI. Overall, the O3/NOy ratio ranged from 0.1 in fall 2012 to 4.8 in summer 2013, while medians and averages in O3/NOy ranged from 0.8 and from 0.9 in winter 2012 to 2.2 and to 2.3 in summer, respectively. The low O3/NOy ratios calculated at OBI during winter result from low O3 levels and high NOy levels, whereas the high O3/NOy ratios during summer derive from moderate O3 levels, but low NOy levels. The O3/NOy ratios observed in all seasons suggest that the O3 production within the MMA is VOC sensitive throughout the entire year. This is in good agreement with prior results of O3 production being VOC sensitive within the MMA based on numerically-modeled O3/NOy ratios that ranged between 2.9 and when the highest 3.5 for the OBI site [19] and that are within the range of those calculated in the current study. The differences observed between the current and the referred prior results may arise from the fact that their modeled ratios were provided exclusively for 13:00 CDT and limited to a pollution episode in summer 2005.
The O3/NOy ratios calculated from 12:00 to 18:00 CDT at OBI were used to construct pollution roses by WS, which are shown in Figure 9. Overall, O3/NOy ratios < 2 are predominant at a WS < 5 km·h−1 for all wind sectors and increased proportionally to WS, at a WS > 5 km·h−1, although, this is only seen for the NE, E and SE sectors. The highest O3/NOy ratios observed (>4) were recorded in air masses arriving from the easterly sectors, NE-E-SE at a WS > 5 km·h−1, and exhibit the highest frequency in line with the highest WS observed. Low O3/NOy ratios are typical in winter as result of low temperatures and low WS occurrence. A low WS may influence the formation and local transport of O3 by limiting the horizontal and vertical mixing and the reactions of O3 precursor emissions, which can also occur during other seasons. Moreover, at a low WS, the observed high values of NOx/NOy in Figure 5 suggest a low contribution of NOz to NOy, which is typical of low photochemical processing commonly seen in VOC-sensitive regimes [46]. By contrast, a high WS may enhance the photochemical processing of O3 precursors and the transport of air masses travelling over rural areas located east of the MMA that typically have NOx-sensitive regimes.
No weekend effect (significant differences, p > 0.05) was observed in the O3 mixing ratios and O3/NOy ratios between weekdays and weekends of all seasons (Table 6; Figure 10), despite the lower average O3/NOy ratios during weekdays. This lack of a weekend effect in the O3 mixing ratios and the average O3/NOy ratios arise from the limiting role of VOCs in the weekday O3 production, while reduced vehicular NOx emissions during weekends increase the VOC/NOy emission during weekends [47,48]. This decrease has counteracting effects on the O3 production leading to similar O3 mixing ratios (±5%) during weekdays and weekends, which was also reported for Mexico City between 1986 and 2007 [49]. By contrast, a weekend effect in O3 levels was observed between 2007 and 2009 within the urban areas of Oporto and Lisbon in Portugal and London, which was ascribed to changes in meteorology [9]. Within the MMA, the lowest difference between weekdays and weekends in the O3/NOy ratios is seen in winter, when the lowest O3/NOy is also observed and contrasts with the largest difference seen in summer when the highest O3/NOy was calculated. The higher O3/NOy ratios observed during summer are likely due to a combination of low NOx emissions and meteorological conditions that foster the fast dispersion of air pollutants, limiting the presence of photochemically-processed air masses in the MMA [47].

3.5. Box Modeling

The Pperox was calculated by summing the production rates of H2O2 (PH2O2), hydroperoxides and other peroxides, although PH2O2 represents by far the largest contribution to Pperox. The PHNO3 was estimated from the reaction rate of the HO + NO2 → HNO3 reaction. Figure 11a shows the distribution of the hourly average PHNO3/Pperox ratios calculated between 12:00 and 18:00 CDT for each modeled period. The modeled PHNO3/Pperox ratios are consistently >2 for all selected periods, which correspond to a VOC-sensitive regime and are in good agreement with the results derived from the observational approach described here. Negative values of PHNO3/Pperox ratios account for 5.6% of the total data and are observed mostly between 12:00 and 13:00 CDT due to peroxide consumption at the beginning of the period of enhanced O3 production. Figure 11b shows that the O3/NOy ratios calculated for the whole modelling period were consistently < 6, which confirms the VOC-sensitive regime in O3 production within the MMA suggested by the PHNO3/Pperox results.
Additionally, to confirm the lack of a weekend effect in O3 production within the MMA determined from the observational approach, an ANOVA analysis was performed to compare the modeled PHNO3/Pperox and O3/NOy ratios for weekdays and weekends of the modeled periods. Table 7 shows that no significant differences (p > 0.05) are observed between the average PHNO3/Pperox ratios during weekdays and weekends and between the average O3/NOy ratios during weekdays and weekends as shown in Table 6, which confirms the limiting role of VOC in production within the MMA.
The O3 sensitivity results presented here are relevant in the context of new energy-oriented projects that are under development in the northeast of Mexico, some of them located east of the MMA. Such projects include new natural gas combined-cycle power plants that are projected to start operations by late 2016, which could have an accumulated installed capacity of up to +1.3 GW. Currently, electric utilities already installed east of the MMA add up to a total capacity of +2.1 GW, all of those being natural gas combined-cycle plants. The new facilities are projected to be supplied with natural gas imported from Texas and with shale gas expected to be exploited from the Cuenca de Burgos Basin that is also located east of the MMA. The Burgos Basin represents around two-thirds of the estimated 550 trillion cubic feet of shale gas recoverable in Mexico, which is the sixth largest reservoir in the world [50]. The introduction of shale gas extraction and energy production will likely increase the regional emissions of VOCs and NOx, impacting the photochemistry of the MMA airshed during events of enhanced regional transport [51]. Increasing NOx levels upwind of the MMA could foster higher O3 levels.
Finally, from the perspective of control strategies that could be put into place to help alleviate the air pollution problem that the MMA faces, it is relevant to match the results obtained here with the local emissions inventory. According to the latest comprehensive official inventory published for the MMA [37], 47% of the VOC emissions come from mobile sources and 43% from area sources; only 8% come from point sources. In contrast, the contribution of NOx emissions is led by mobile (48%) and point (33%) sources. From a mass-basis perspective, one could argue that control strategies should target VOC emissions from mobile sources, in particular light-duty vehicles, which account for more than 70% of these emissions, and area sources. For the latter, the main contributions are from domestic use of solvents (34%), surface cleaning (13%), liquefied petroleum gas (LPG) leaks (16%), building painting activities (9%), industrial painting processes (9%) and fugitive emissions from gasoline distribution and handling in service stations (9%). However, it has to be recognize that the composition of these VOC mixtures changes from source to source, making their ozone-forming potential different. Further studies are needed to compare the reactivity of these mixtures to establish the real benefits of reducing the emissions of one source or another. If NOx emission control strategies are explored, these should be accompanied with VOC control strategies to ensure O3 reductions [19].

4. Conclusions

Continuous measurements of tropospheric O3 and NOy were made at the OBI site near the downtown MMA and used to assess the sensitivity of the O3 production system from September 2012 to August 2013. Within the MMA, O3 exhibits maxima in spring in response to the enhanced photolysis of NO2, whereas the minima are observed in winter due to the reduced SR. The highest mixing ratios of O3 were observed in easterly air masses at a WS of 5–10 km·h-1, and the lowest ones were recorded in calm winds throughout the entire year. The NOy peaks during winter and decreases during summer, which suggests that during summer, the photochemical production is oriented to O3 rather than to NOy. During winter, the recorded data revealed that NO and NO2 are the major components of NOy.
The O3 production is enhanced between 12:00 and 18:00 CDT in line with the period of maximum SR. O3/NOy ratios <6 were observed during the year studied, suggesting that O3 production within the MMA is VOC sensitive. Modeled PHNO3/Pperox ratios > 2 for periods of O3 episodes in fall and spring confirm the VOC-sensitive environment within the MMA derived from the observational analysis performed. The non-significant differences observed in O3/NOy and in PHNO3/Pperox between weekdays and weekends suggest the lack of a weekend effect in O3 production. The lack of an O3 weekend effect within the MMA confirms the limiting role of VOCs in O3 production during weekdays. This study demonstrates the usefulness of high-precision measurements of O3 and NOy to assess the O3-VOC-NOx system’s sensitivity and to independently test the accuracy of box chemical models. The results presented here allow the wholly independent validation of current air quality policies directed to reduce tropospheric O3 levels and, if required, the design and implementation of new ones.

Acknowledgments

This study was supported by the Mexican Council for Science and Technology (CONACYT) (Grant Number CB-2010-1-154122) and by the Tecnologico de Monterrey through its Energy and Climate Change Research Group. E. Carrillo received a scholarship from the CONACYT (Scholarship Number 342028). We appreciate SIMA’s support during the field campaigns conducted in this study.

Author Contributions

Alberto Mendoza and Edson R. Carrillo-Torres conceived of and designed the experiments. Edson R. Carrillo-Torres performed the experiments. Edson R. Carrillo-Torres and Iván Y. Hernández-Paniagua analyzed the data. Edson R. Carrillo-Torres, Iván Y. Hernández-Paniagua and Alberto Mendoza contributed reagents/materials/analysis tools. Edson R. Carrillo-Torres, Iván Y. Hernández-Paniagua and Alberto Mendoza wrote the paper.

Conflicts of Interest

The authors declare no conflict of interest. The founding sponsors had no role in the design of the study; in the collection, analyses or interpretation of data; in the writing of the manuscript; nor in the decision to publish the results.

References

  1. Kampa, M.; Castanas, E. Human health effects of air pollution. Environ. Pollut. 2008, 151, 362–367. [Google Scholar] [CrossRef] [PubMed]
  2. Ainsworth, E.A.; Yendrek, C.R.; Sitch, S.; Collins, W.J.; Emberson, L.D. The Effects of Tropospheric Ozone on Net Primary Productivity and Implications for Climate Change. Annu. Rev. Plant Biol. 2012, 63, 637–661. [Google Scholar] [CrossRef] [PubMed]
  3. Monks, P.S.; Archibald, A.T.; Colette, A.; Cooper, O.; Coyle, M.; Derwent, R.; Fowler, D.; Granier, C.; Law, K.S.; Mills, G.E.; et al. Tropospheric ozone and its precursors from the urban to the global scale from air quality to short-lived climate forcer. Atmos. Chem. Phys. 2015, 15, 8889–8973. [Google Scholar] [CrossRef] [Green Version]
  4. National Research Council. Rethinking the Ozone Problem in Urban and Regional Air Pollution; The National Academies Press: Washington, DC, USA, 1991. [Google Scholar]
  5. Sillman, S. The relation between ozone, NOx and hydrocarbons in urban and polluted rural environments. Atmos. Environ. 1999, 33, 1821–1845. [Google Scholar] [CrossRef]
  6. Trail, M.; Tsimpidi, A.P.; Liu, P.; Tsigaridis, K.; Rudokas, J.; Miller, P.; Nenes, A.; Hu, Y.; Russell, A.G. Sensitivity of air quality to potential future climate change and emissions in the United States and major cities. Atmos. Environ. 2014, 94, 552–563. [Google Scholar] [CrossRef]
  7. Geng, F.; Tie, X.; Xu, J.; Zhou, G.; Peng, L.; Gao, W.; Tang, X.; Zhao, C. Characterizations of ozone, NOx, and VOCs measured in Shanghai, China. Atmos. Environ. 2008, 42, 6873–6883. [Google Scholar] [CrossRef]
  8. Chou, C.C.K.; Tsai, C.Y.; Chang, C.C.; Lin, P.H.; Liu, S.C.; Zhu, T. Photochemical production of ozone in Beijing during the 2008 Olympic Games. Atmos. Chem. Phys. 2011, 11, 9825–9837. [Google Scholar] [CrossRef] [Green Version]
  9. Pires, J.C.M. Ozone Weekend Effect Analysis in Three European Urban Areas. CLEAN—Soil Air Water 2012, 40, 790–797. [Google Scholar] [CrossRef]
  10. Pusede, S.E.; Cohen, R.C. On the observed response of ozone to NOx and VOC reactivity reductions in San Joaquin Valley California 1995–present. Atmos. Chem. Phys. 2012, 12, 8323–8339. [Google Scholar] [CrossRef]
  11. Wałaszek, K.; Kryza, M.; Werner, M.; Ojrzyńska, H. Sensitivity of Ground-Level Ozone to NOx Emission During a High Ozone Episode in SW Poland. In Air Pollution Modeling and Its Application XXIV; Steyn, G.D., Chaumerliac, N., Eds.; Springer International Publishing: Cham, Switzerland, 2016; pp. 339–343. [Google Scholar]
  12. Torres-Jardón, R.; García-Reynoso, J.A.; Jazcilevich, A.; Ruiz-Suárez, L.G.; Keener, T.C. Assessment of the Ozone-Nitrogen Oxide-Volatile Organic Compound Sensitivity of Mexico City through an Indicator-Based Approach: Measurements and Numerical Simulations Comparison. J. Air Waste Manag. Assoc. 2009, 59, 1155–1172. [Google Scholar] [CrossRef] [PubMed]
  13. Cai, C.; Kelly, J.T.; Avise, J.C.; Kaduwela, A.P.; Stockwell, W.R. Photochemical Modeling in California with Two Chemical Mechanisms: Model Intercomparison and Response to Emission Reductions. J. Air Waste Manag. Assoc. 2011, 61, 559–572. [Google Scholar] [CrossRef] [PubMed]
  14. Hammer, M.U.; Vogel, B.; Vogel, H. Findings on H2O2/HNO3 as an indicator of ozone sensitivity in Baden-Württemberg, Berlin-Brandenburg, and the Po valley based on numerical simulations. J. Geophys. Res. 2002, 107. [Google Scholar] [CrossRef]
  15. Shon, Z.H.; Lee, G.; Song, S.K.; Lee, M.; Han, J.; Lee, D. Characteristics of reactive nitrogen compounds and other relevant trace gases in the atmosphere at urban and rural areas of Korea during May–June, 2004. J. Atmos. Chem. 2007, 58, 203–218. [Google Scholar] [CrossRef]
  16. Kondo, Y.; Morino, Y.; Fukuda, M.; Kanaya, Y.; Miyazaki, Y.; Takegawa, N.; Tanimoto, H.; McKenzie, R.; Johnston, P.; Blake, D.R.; et al. Formation and transport of oxidized reactive nitrogen, ozone, and secondary organic aerosol in Tokyo. J. Geophys. Res. 2008, 113. [Google Scholar] [CrossRef]
  17. Chou, C.C.K.; Tsai, C.-Y.; Shiu, C.-J.; Liu, S.C.; Zhu, T. Measurement of NOy during Campaign of Air Quality Research in Beijing 2006 (CAREBeijing-2006): Implications for the ozone production efficiency of NOx. J. Geophys. Res. 2009, 114. [Google Scholar] [CrossRef]
  18. Peng, Y.P.; Chen, K.S.; Wang, H.K.; Lai, C.H. In Situ Measurements of Hydrogen Peroxide, Nitric Acid and Reactive Nitrogen to Assess the Ozone Sensitivity in Pingtung County, Taiwan. Aerosol Air Qual. Res. 2011, 11, 59–69. [Google Scholar] [CrossRef]
  19. Sierra, A.; Vanoye, A.Y.; Mendoza, A. Ozone sensitivity to its precursor emissions in northeastern Mexico for a summer air pollution episode. J. Air Waste Manag. Assoc. 2013, 63, 1221–1233. [Google Scholar] [CrossRef] [PubMed]
  20. Peng, Y.P.; Chen, K.S.; Lai, C.H.; Lu, P.J.; Kao, J.H. Concentrations of H2O2 and HNO3 and O3-VOC-NOx sensitivity in ambient air in southern Taiwan. Atmos. Environ. 2006, 40, 6741–6751. [Google Scholar] [CrossRef]
  21. Castell, N.; Stein, A.F.; Mantilla, E.; Salvador, R.; Millán, M. Evaluation of the use of photochemical indicators to assess ozone—NOx-VOC sensitivity in the Southwestern Iberian Peninsula. J. Atmos. Chem. 2009, 63, 73–91. [Google Scholar] [CrossRef]
  22. Ge, B.Z.; Xu, X.B.; Lin, W.L.; Lie, J.; Wang, Z.F. Impact of the regional transport of urban Beijing pollutants on downwind areas in summer: Ozone production efficiency analysis. Tellus B 2012, 64, 17348. [Google Scholar] [CrossRef]
  23. Trainer, M.; Parrish, D.D.; Buhr, M.P.; Norton, R.B.; Fehsenfeld, F.C.; Anlauf, K.G.; Bottenheim, J.W.; Tang, Y.Z.; Wiebe, H.A.; Roberts, J.M.; et al. Correlation of ozone with NOy in photochemically aged air. J. Geophys. Res. 1993, 98, 2917–2925. [Google Scholar] [CrossRef]
  24. Milford, J.B.; Gao, D.; Sillman, S.; Blossey, P.; Russell, A.G. Total reactive nitrogen (NOy) as an indicator of the sensitivity of ozone to reductions in hydrocarbon and NOx emissions. J. Geophys. Res. 1994, 99, 3533–3542. [Google Scholar] [CrossRef]
  25. Sillman, S.; He, D. Some theoretical results concerning O3-NOx-VOC chemistry and NOx-VOC indicators. J. Geophys. Res. 2002, 107. [Google Scholar] [CrossRef]
  26. Miñarro, M.D.; Castell-Balaguer, N.; Téllez, L.; Mantilla, E. The use of experimental data and their uncertainty for assessing ozone photochemistry in the Eastern Iberian Peninsula. Chemosphere 2012, 89, 796–804. [Google Scholar] [CrossRef] [PubMed]
  27. SEMARNAT. Informe Nacional de la Calidad del Aire 2013, Mexico. Available online: http://www.inecc.gob.mx/descargas/calaire/2014_inf_nal_calaire_mex.pdf (accessed on 20 September 2016).
  28. National Institute of Information, Statistics and Geography. México en Cifras. Available online: http://www3.inegi.org.mx/sistemas/mexicocifras/default.aspx?e=19 (accessed on 22 May 2016).
  29. Servicio Meteorologico Nacional. Available online: http://smn.cna.gob.mx/es (accessed on 21 May 2016).
  30. Carslaw, D.C.; Ropkins, K. Openair—An R package for air quality data analysis. Environ. Model. Softw. 2012, 27–28, 52–61. [Google Scholar] [CrossRef]
  31. R Core Team. R: A language and Environment for Statistical Computing. Available online: http://www.R-project.org/ (accessed on 15 February 2015).
  32. Harley, R.A.; Russell, A.G.; McRae, G.J.; Cass, G.R.; Seinfeld, J.H. Photochemical modeling of the Southern California air quality study. Environ. Sci. Technol. 1993, 27, 378–388. [Google Scholar] [CrossRef]
  33. Sánchez-Ccoyllo, O.R.; Ynoue, R.Y.; Martins, L.D.; de Fátima Andrade, M. Impacts of ozone precursor limitation and meteorological variables on ozone concentration in São Paulo, Brazil. Atmos. Environ. 2006, 40, 552–562. [Google Scholar] [CrossRef]
  34. Ying, Q.; Lu, J.; Kleeman, M. Modeling air quality during the California Regional PM10/PM2.5 Air Quality Study (CPRAQS) using the UCD/CIT source-oriented air quality model—Part III. Regional source apportionment of secondary and total airborne particulate matter. Atmos. Environ. 2009, 43, 419–430. [Google Scholar] [CrossRef]
  35. Young, A.T.; Betterton, E.A.; De Rueda, L.S. Photochemical box model for Mexico City. Atmósfera 1997, 10, 161–178. [Google Scholar]
  36. Carter, W.P.L. A detailed mechanism for the gas-phase atmospheric reactions of organic compounds. Atmos. Environ. Part A Gen. Top. 1990, 24, 481–518. [Google Scholar] [CrossRef]
  37. SEMARNAT. National Emissions Inventory 2005-Inventario Nacional de Emisiones 2005 (NEI). Available online: http://sinea.semarnat.gob.mx/sinae.php?process=UkVQT1JURUFET1I=&categ=1 (accessed on 22 May 2016).
  38. Mendoza, A.; García, M.R. Aplicación de un modelo de calidad del aire de segunda generación a la zona metropolitana de Guadalajara, México. Rev. Int. Contam. Ambient. 2009, 25, 73–85. [Google Scholar]
  39. Hsu, Y.; Strait, R.; Roe, S.; Holoman, D. SPECIATE 4.0 Speciation Database Development Documentation: Final Report; EPA/6007R-06/161; US Environmental Protection Agency: Research Triangle Park, NC, USA, 2006.
  40. Menchaca-Torre, H.L.; Mercado-Hernández, R.; Mendoza-Domínguez, A. Diurnal and seasonal variation of volatile organic compounds in the atmosphere of Monterrey, Mexico. Atmos. Pollut. Res. 2015, 6, 1073–1081. [Google Scholar] [CrossRef]
  41. Menchaca-Torre, H.L.; Mercado-Hernández, R.; Rodríguez-Rodríguez, J.; Mendoza-Domínguez, A. Diurnal and seasonal variations of carbonyls and their effect on ozone concentrations in the atmosphere of Monterrey, Mexico. J. Air Waste Manag. Assoc. 2015, 65, 500–510. [Google Scholar] [CrossRef] [PubMed]
  42. Luecken, D.J.; Tonnesen, G.S.; Sickles, I.J.E. Differences in NOy speciation predicted by three photochemical mechanisms. Atmos. Environ. 1999, 33, 1073–1084. [Google Scholar] [CrossRef]
  43. Luke, W.T.; Kelley, P.; Lefer, B.L.; Flynn, J.; Rappenglück, B.; Leuchner, M.; Dibb, J.E.; Ziemba, L.D.; Anderson, C.H.; Buhr, M. Measurements of primary trace gases and NOy composition in Houston, Texas. Atmos. Environ. 2010, 44, 4068–4080. [Google Scholar] [CrossRef]
  44. Atkinson, R. Atmospheric chemistry of VOCs and NOx. Atmos. Environ. 2000, 34, 2063–2101. [Google Scholar] [CrossRef]
  45. Cerón-Bretón, J.G.; Cerón-Bretón, R.M.; Kahl, J.D.W.; Ramírez-Lara, E.; Guarnaccia, C.; Aguilar-Ucán, C.A.; Montalvo-Romero, C.; Anguebes-Franseschi, F.; López-Chuken, U. Diurnal and seasonal variation of BTEX in the air of Monterrey, Mexico: Preliminary study of sources and photochemical ozone pollution. Air Qual. Atmos. Health 2015, 8, 469–482. [Google Scholar] [CrossRef]
  46. Slowik, J.G.; Brook, J.; Chang, R.Y.W.; Evans, G.J.; Hayden, K.; Jeong, C.H.; Li, S.M.; Liggio, J.; Liu, P.S.K.; McGuire, M.; et al. Photochemical processing of organic aerosol at nearby continental sites: Contrast between urban plumes and regional aerosol. Atmos. Chem. Phys. 2011, 11, 2991–3006. [Google Scholar] [CrossRef]
  47. Hernández Paniagua, I.Y.; Clemitshaw, K.C.; Mendoza, A. Impact of emissions of VOCs and NOx on trends of ground-level O3 in Mexico during 1993–2014: Comparison of Monterrey with Mexico City and Guadalajara. Atmos. Chem. Phys. Discuss. 2016, 2016, 1–36. [Google Scholar] [CrossRef]
  48. Song, J.; Lei, W.; Bei, N.; Zavala, M.; de Foy, B.; Volkamer, R.; Cardenas, B.; Zheng, J.; Zhang, R.; Molina, L.T. Ozone response to emission changes: A modeling study during the MCMA-2006/MILAGRO Campaign. Atmos. Chem. Phys. 2010, 10, 3827–3846. [Google Scholar] [CrossRef] [Green Version]
  49. Stephens, S.; Madronich, S.; Wu, F.; Olson, J.B.; Ramos, R.; Retama, A.; Muñoz, R. Weekly patterns of México City’s surface concentrations of CO, NOx, PM10 and O3 during 1986–2007. Atmos. Chem. Phys. 2008, 8, 5313–5325. [Google Scholar] [CrossRef]
  50. US Energy Information Administration. Technically Recoverable Shale Oil and Shale Gas. Resources: Mexico; United States Department of Energy: Washington, DC, USA, 2015.
  51. Pacsi, A.P.; Kimura, Y.; McGaughey, G.; McDonald-Buller, E.C.; Allen, D.T. Regional Ozone Impacts of Increased Natural Gas Use in the Texas Power Sector and Development in the Eagle Ford Shale. Environ. Sci. Technol. 2015, 49, 3966–3973. [Google Scholar] [CrossRef] [PubMed]
Figure 1. The Monterrey Metropolitan Area (MMA) in the national context in northeast Mexico and the location of the Obispado (OBI) site within the MMA. The shadowed white square surrounding the OBI site represents the 4 km × 4 km domain used for modeling purposes.
Atmosphere 08 00022 g001
Figure 2. Data capture of 1 h averages for air pollutants and meteorological parameters recorded at the OBI site from September 2012 to August 2013.
Atmosphere 08 00022 g002
Figure 3. (a) Annual profile of the temperature, solar radiation (SR) and relative humidity (RH); (b) frequency of the counts of recorded wind direction occurrences at the OBI site during September 2012–August 2013. The horizontal black line shows monthly medians, and the red dots show monthly averages.
Atmosphere 08 00022 g003
Figure 4. Annual profile of air pollutants recorded at the OBI site during September 2012 to August 2013. The horizontal black line shows monthly medians, and the red dots show monthly averages.
Atmosphere 08 00022 g004
Figure 5. (a) Annual profile of the difference NOy–NO for data recorded at the OBI site from September 2012–August 2013; (b) NOx/NOy ratios during the same period. The horizontal black line shows monthly medians, and the red dots show monthly averages.
Atmosphere 08 00022 g005
Figure 6. (a) Pollution roses of 1-h O3 averages and (b) pollution roses of NOz by wind speed (WS) recorded at the OBI site from September 2012–September 2013.
Atmosphere 08 00022 g006
Figure 7. Dendrogram derived from the cluster analysis (CA) performed for 1-h averages of O3 and SR data recorded at the OBI site from September 2012 to August 2013. The red cluster shows the period of enhanced photochemical activity.
Atmosphere 08 00022 g007
Figure 8. O3/NOy ratios by season derived from observations made at the OBI site during September 2012–August 2013. Ratios below six are typical of VOC-sensitive regimes.
Atmosphere 08 00022 g008
Figure 9. Pollution roses by WS of 1 h O3/NOy ratios calculated between 12:00 and 18:00 Central Daylight Time (CDT, GMT-0500) at the OBI site from September 2012 to August 2013.
Atmosphere 08 00022 g009
Figure 10. Average daily cycles for O3 and NOx mixing ratios and O3/NOy ratios during weekdays and weekends from September 2012 to August 2013. The shading represents the 95% confidence intervals estimated through the bootstrap resampling.
Atmosphere 08 00022 g010
Figure 11. (a) PHNO3/Pperox ratios derived from box modeling for periods of O3 mixing ratios exceeding the 110 ppb 1 h official Mexican standard in early-fall 2012 and spring 2013. Ratios greater than two, indicated by the horizontal dotted line, are typical of VOC-sensitive regimes; (b) O3/NOy ratios derived from observations made at the OBI site during the same periods. O3/NOy ratios lower than six are typically observed in VOC-sensitive regimes.
Atmosphere 08 00022 g011
Table 1. Summary of previous assessments of the O3 production sensitivity system using photochemical indicators.
ReferenceLocationAltitude (m a.s.l.)MethodologyChemical SpeciesPeriodPhotochemical Regime
[14]Baden-Württemberg and Berlin-Brandenburg, Germany; Po Valley, Italy~245; ~34ModelingO3, H2O2, HNO3, NOx, VOC, and NOyMay 1998Berlin-Brandenburg and Po Valley: VOC-sensitive. Baden-Württemberg: NOx sensitive
[15]Seoul and Gyeonggi, Korea44ObservationsNOx, NOy, H2O2, O3, CO, HCHO, and PAN *1 May–30 June 2004; 15 May–17 June 2004VOC sensitive
[16]Tokyo, Japan37ObservationsNOy and NOy, and PM1024 July–13 August 2003; 1–15 October 2003NOx-sensitive regime during 12–14 August
[17]Beijing, China44ObservationsNO, NOx, and NOy1 August–9 September 2006VOC sensitive
[18]Pingtung, Chao-Chou, Kenting, Taiwan~17Modeling and observationsH2O2, HNO3, and NOy5-day period by season during 2003–2004Pingtung, Chao-Chou: both regimes. Kenting: NOx sensitive
[19]Monterrey, México540ModelingO3 and NOy22–27 August 2005VOC sensitive
* Peroxyacetyl nitrate.
Table 2. Instrumentation used to measure air pollutants and meteorological parameters during July 2012–August 2013 at the Obispado (OBI) site. WS, wind speed; WD, wind direction; SR, solar radiation.
ParameterInstrument ModelDetectorEPA Equivalent Method NumberStated Precision (±)
O3Thermo Environmental 49CUV photometryEQOA-0880-0471 ppb
NO-NO2-NOxThermo Environmental 42CChemiluminescenceRFNA-1289-0740.4 ppb
NO-DIF-NOyThermo Environmental 42i NOyChemiluminescenceRFNA-1289-07450 ppb
PM10Met One BAM 1020Beta attenuationEQPM-0798-1225 µg·m−3
COThermo Environmental 48CNon-dispersive IRRFCA-0981-0541 ppm
SO2Thermo Environmental 43CFluorescenceEQSA-0486-0601 ppb
WSMet One 010CAnemometern.a.1%
WDMet One 020CPotentiometern.a.
TemperatureMet One 060AMulti-stage thermistorn.a.0.5 °C
PressureMet One 090DBarometric sensorn.a.1.35 mbar
RHMet One 083ECapacitance sensorn.a.2%
SRMet One 095Pyranometern.a.1%
n.a.: not applicable.
Table 3. Selected time periods to assess the O3 production sensitivity using the California/Carnegie Institute of Technology (CIT) photochemical box model.
PeriodDateSeason
11–8 September 2012Fall
222–29 September 2012Fall
36–13 March 2013Spring
412–19 March 2013Spring
Table 4. Correlation coefficients (R2) between NOy and air pollutants and meteorological parameters recorded at the OBI site from September 2012 to August 2013.
ParameterFall 2012Winter 2012Spring 2013Summer 2013
O3 (ppb)0.1060.1510.0650.070
NO2 (ppb)0.6760.8190.4110.783
NO (ppb)0.6100.6610.2750.615
CO (ppm)0.4200.6640.2270.712
Solar radiation (kW·m−2)0.001 *0.0040.001 *0.009
Temperature (°C)0.0240.0220.0050.063
Wind speed (km·h−1)0.2470.2030.1120.225
* No significant correlation, p > 0.05.
Table 5. Results of the PCA performed using observations for air pollutants and meteorological data recorded at the OBI site from September 2012 to August 2013.
ComponentPC1PC2PC3
NOy0.4810.055−0.009
NO20.3870.087−0.123
NO0.3750.0290.151
O3−0.2260.4470.075
CO0.4000.1100.081
SO20.2060.339−0.348
PM100.2300.354−0.062
PM2.50.2610.2340.129
SR−0.0900.4970.031
Temperature−0.1970.3700.411
WS−0.2880.2760.084
WD0.1750.3390.794
Cumulative variance (%)39.559.567.2
Table 6. Results of the ANOVA carried out for the average O3/NOy ratios calculated between 12:00 and 18:00 CDT at the OBI site during weekdays and weekends from September 2012 to August 2013.
SeasonO3/NOy *
WeekdaysWeekends
Fall 20121.31 ± 1.071.81 ± 1.45
Winter 20121.17 ± 0.671.29 ± 0.85
Spring 20131.41 ± 1.251.77 ± 1.08
Summer 20132.13 ± 1.162.85 ± 1.65
* Significance level α = 0.05.
Table 7. Results of the ANOVA performed for the averages of modeled PHNO3/Pperox ratios and O3/NOy ratios between 12:00 and 18:00 CDT at the OBI site during the weekdays and weekends of September 2012 and March 2013.
PeriodPHNO3/Pperox *O3/NOy *
Weekdays13.14 ± 21.591.33 ± 0.78
Weekends14.38 ± 19.522.01 ± 0.95
* Significance level α = 0.05.

