1. Introduction
According to the authors of the Fifth IPCC Assessment Report [
1], an increase in the mean global temperature between 1880 and 2012 amounted to 0.85 °C, and the period 1983–2012 in the Northern Hemisphere was probably the warmest 30-year period during the last 1400 years. As Rodríguez-Puebla et al. [
2] showed, the averaged decadal increase in the maximum temperature in the Iberian Peninsula between 1950 and 2006 fluctuated around 0.2 °C ± 0.05 °C. In Portugal, decadal changes in the maximum temperature of 1976–2006 multiannual period oscillated around 0.49 °C [
3]. A similar direction of changes was also observed in Spain, and this increase was approximately 0.11 °C per decade in the period 1850–2005 [
4], while in the period 1961–2006 it was about 0.32 °C [
5]. On the other hand, in France, the maximum temperature decadal changes fluctuated around 0.35 °C in the period 1958–2008 [
6]. In conclusion, the trends of changes in maximum temperature ranged from 0.11 °C to 0.49 °C per decade, depending on the period and region.
A manifestation of the observed warming is the increasing frequency of days with extreme temperatures and at the same time the increasing frequency, duration and severity of heat waves in many regions of Europe and around the world [
7,
8,
9,
10]. The heat waves of 2003 and 2010, defined as “mega heat waves,” broke 500-year period air temperature records in approximately 50% of Europe [
11]. The heat waves of 2003 in Western and Southern Europe caused over 35,000 confirmed fatalities, including 14,000 in France [
12,
13]. In Paris, the greatest number of deaths was recorded on 13 August 2003, which exceeded the average daily number by 600% [
14]. Apart from the fatalities, the extreme air temperatures caused tremendous economic losses, mainly in the power sector, agriculture and health care [
15,
16].
Atmospheric circulation is one of the most important factors influencing weather and climate conditions, including the occurrence of extreme events. An increase in the stability of the atmospheric circulation is considered one of the main factors explaining the more frequent extreme air temperatures in Europe [
17,
18]. More stable blocking circulation types in the summer contribute to the occurrence of more intense and longer HWs [
19]. Porębska and Zdunek [
20] proved that a longer persistence of high-pressure blocking events in summer escalates the occurrence of thermal anomalies. In recent decades, the frequency of blocking systems over Europe has increased, and the number of low-pressure systems south of 55° N has decreased [
21,
22,
23]. Previous research works concerning Western Europe and the Iberian Peninsula have, in most cases, been focused on the analysis of the social results of particular heat waves, namely on the number of deaths caused by extreme heat waves in 2003 and 2006 [
12,
13,
24]. There is a lack of complex statistics on heat waves’ occurrence in Southwest Europe. This article analyses changes in the occurrence of heat waves between 1976 and 2015 in this region. However, the main objective of the article is to define atmospheric circulation conducive to the occurrence of heat waves, which is an important issue and gives a chance to explain the origins of these extreme events. Specific types of pressure patterns at sea level and at the geopotential height of 500 hPa, which lead to extreme values of air temperature, are distinguished and characterized. In order to find out the pressure and thermal conditions in the middle and higher troposphere accompanying heat waves, the vertical structure of geopotential height anomalies and corresponding anomalies of air temperature at an appropriate geopotential height during the episodes of surface highest temperature are identified and described. This kind of research has not been carried out yet for this region. Recognizing the circulation patterns governing the occurrence and duration of heat waves may help to forecast these events.
2. Data and Methods
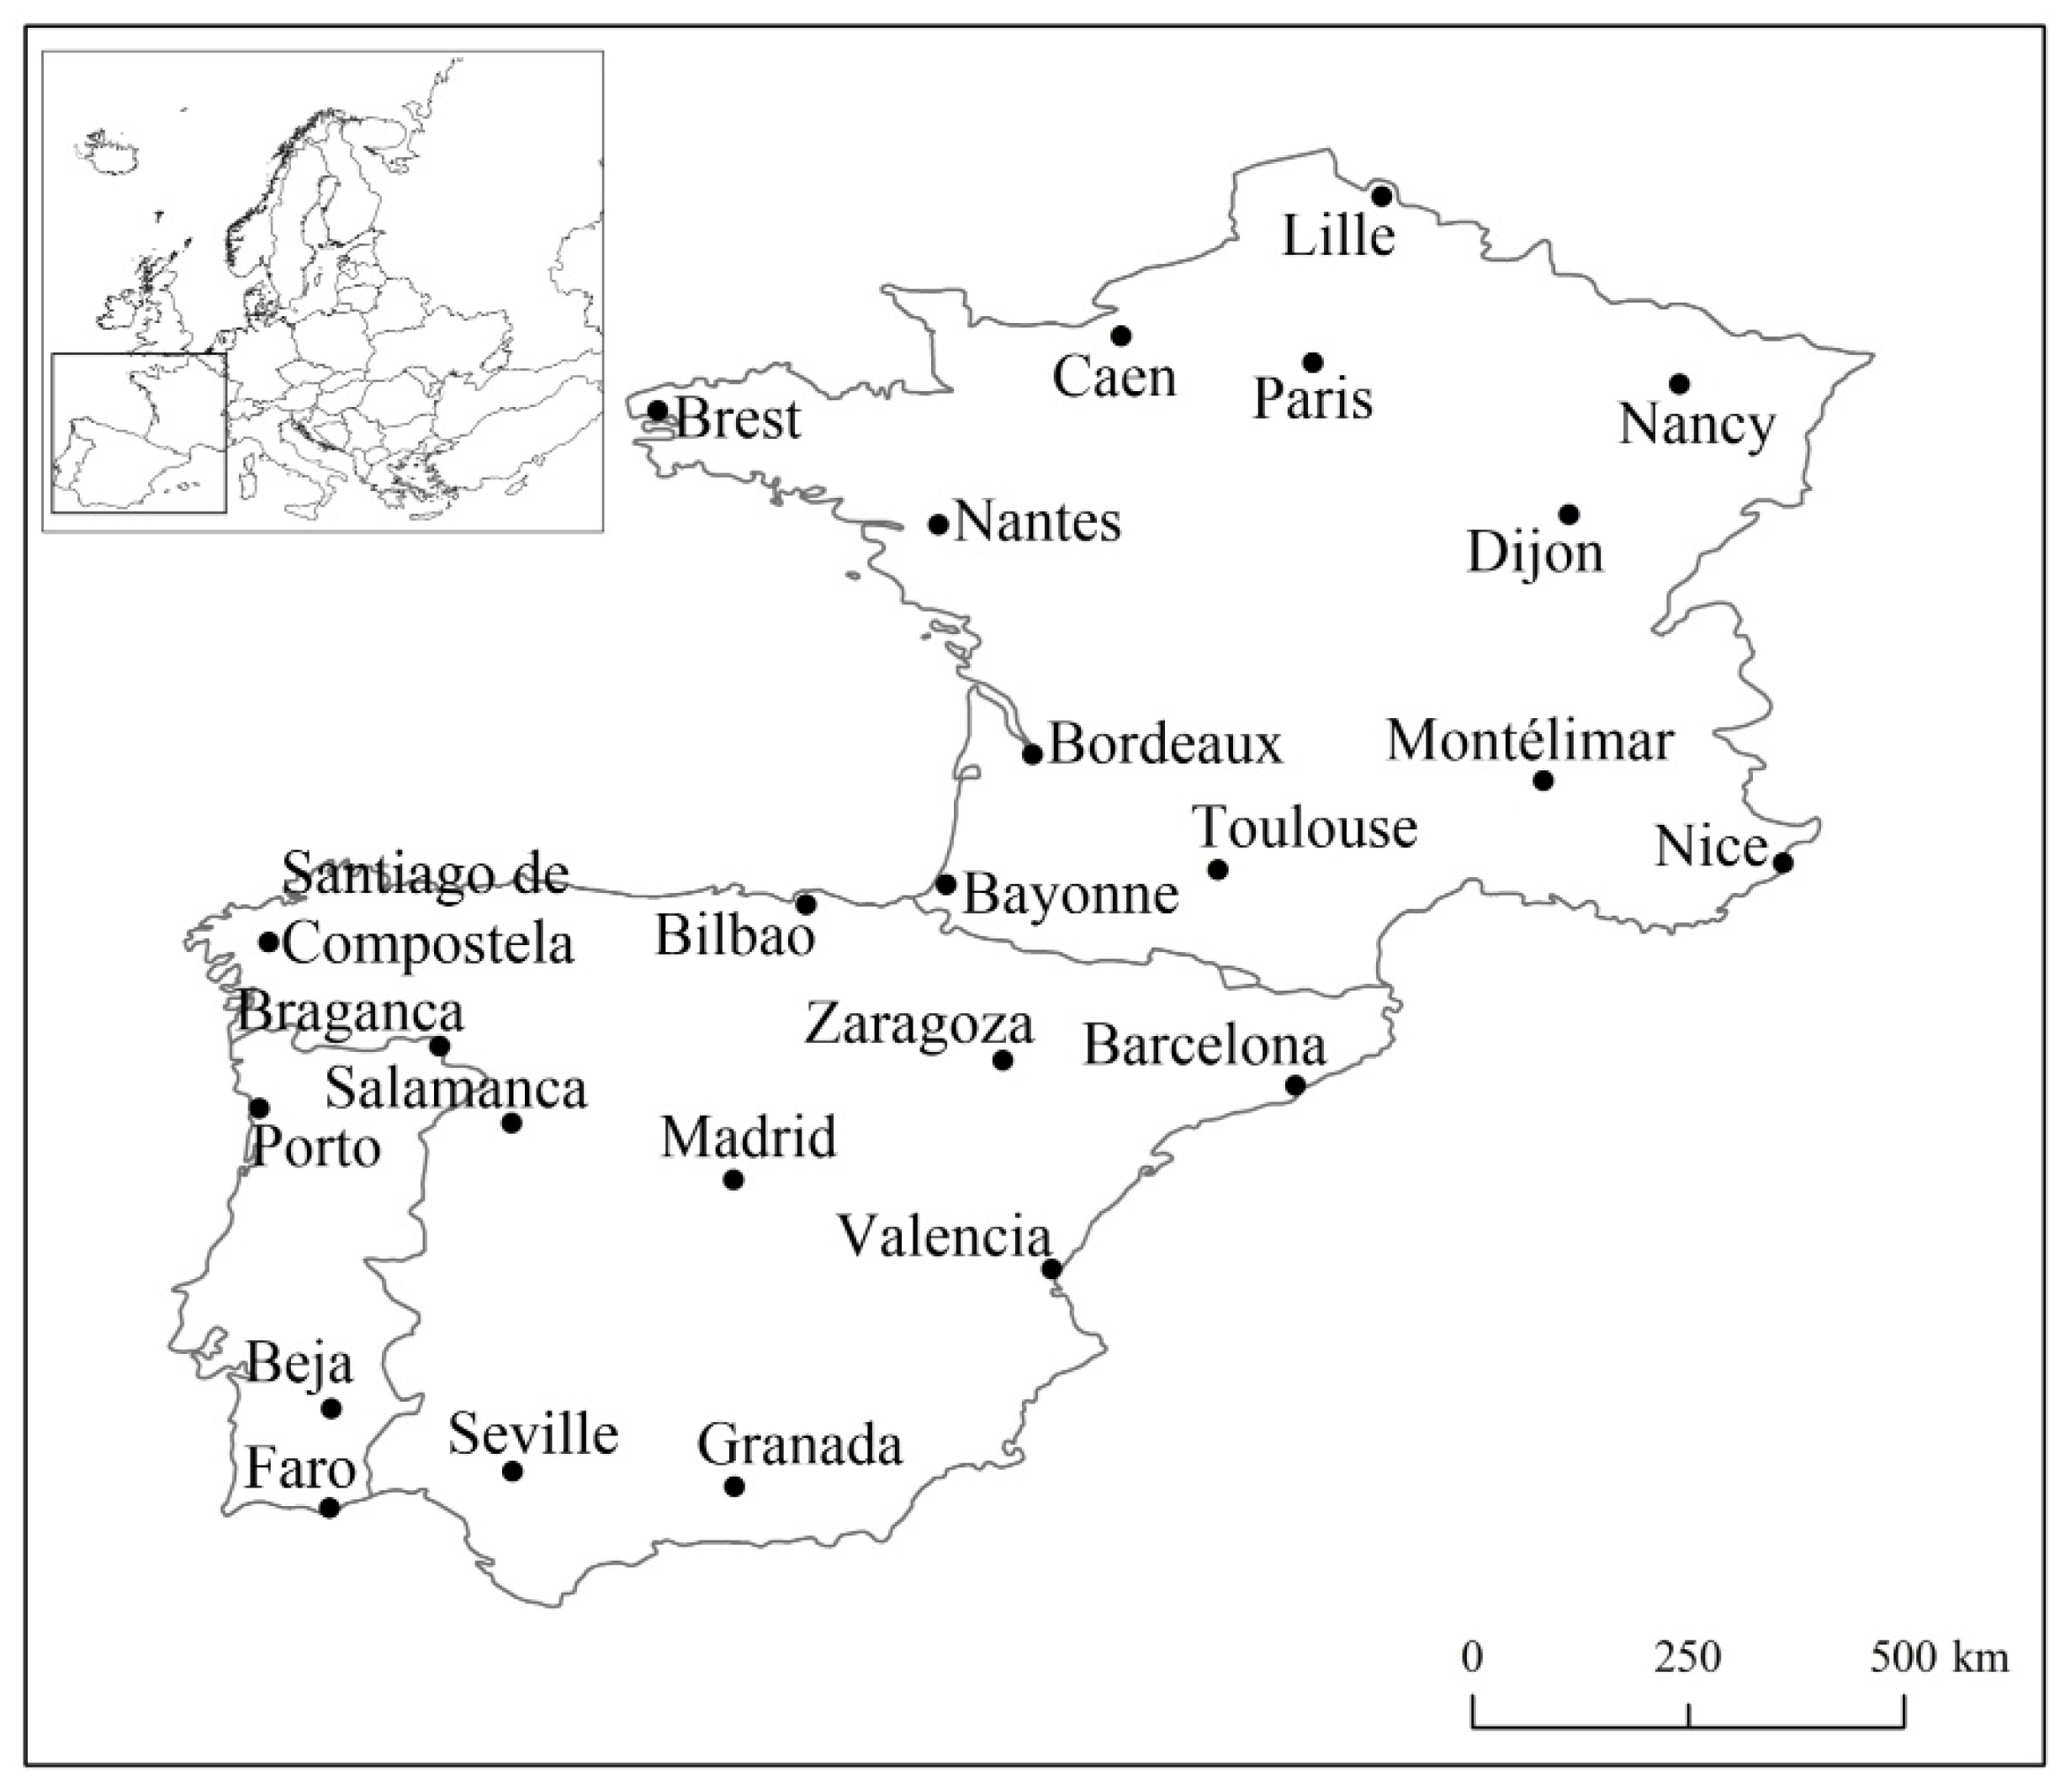
This study was conducted on the basis of daily values of the maximum (Tmax) air temperature from 25 stations located in France, Portugal and Spain from the period 1976–2015 (
Figure 1). These data are derived from the databases of the National Oceanic and Atmospheric Administration (NOAA) (available at:
https://www7.ncdc.noaa.gov/CDO/dataproduct).
There is no universally acceptable definition of heat waves. The magnitude of heat waves is usually computed based on an index or set of indices of thermal condition(s) exceeding certain threshold(s). Such a thermal index can be as simple as one meteorological element (i.e., Tmax) or as complicated as a combined index by multiple variables such as temperature, humidity or even wind speed [
25]. Heat waves are relative to a location’s climate; the same meteorological conditions can constitute a heat wave in one place but not another. Therefore, the commonly used threshold value is based on the probability statistics and defined as air temperatures above the 95th/90th percentile in a given location [
26,
27,
28]. As for the duration, the WMO advice is that a heat wave should be considered a hot period “persisting [for] at least two consecutive days” [
25]. Different duration thresholds are chosen, from ≥2 consecutive days in Canada [
29], ≥3 days in France [
27], Greece [
30], Hungary [
31], ≥5 days in Ukraine [
7], China [
9], Australia [
32] up to ≥6 consecutive days in Bulgaria [
33].
In human biometeorology defining heat waves is usually more complex. It is strongly focused on the reactions of human physiology to the sustained heat load, namely persistent excessively hot weather. In this approach, apart from air temperature, humidity also appears as an important factor enhancing the thermal sensibility [
34].
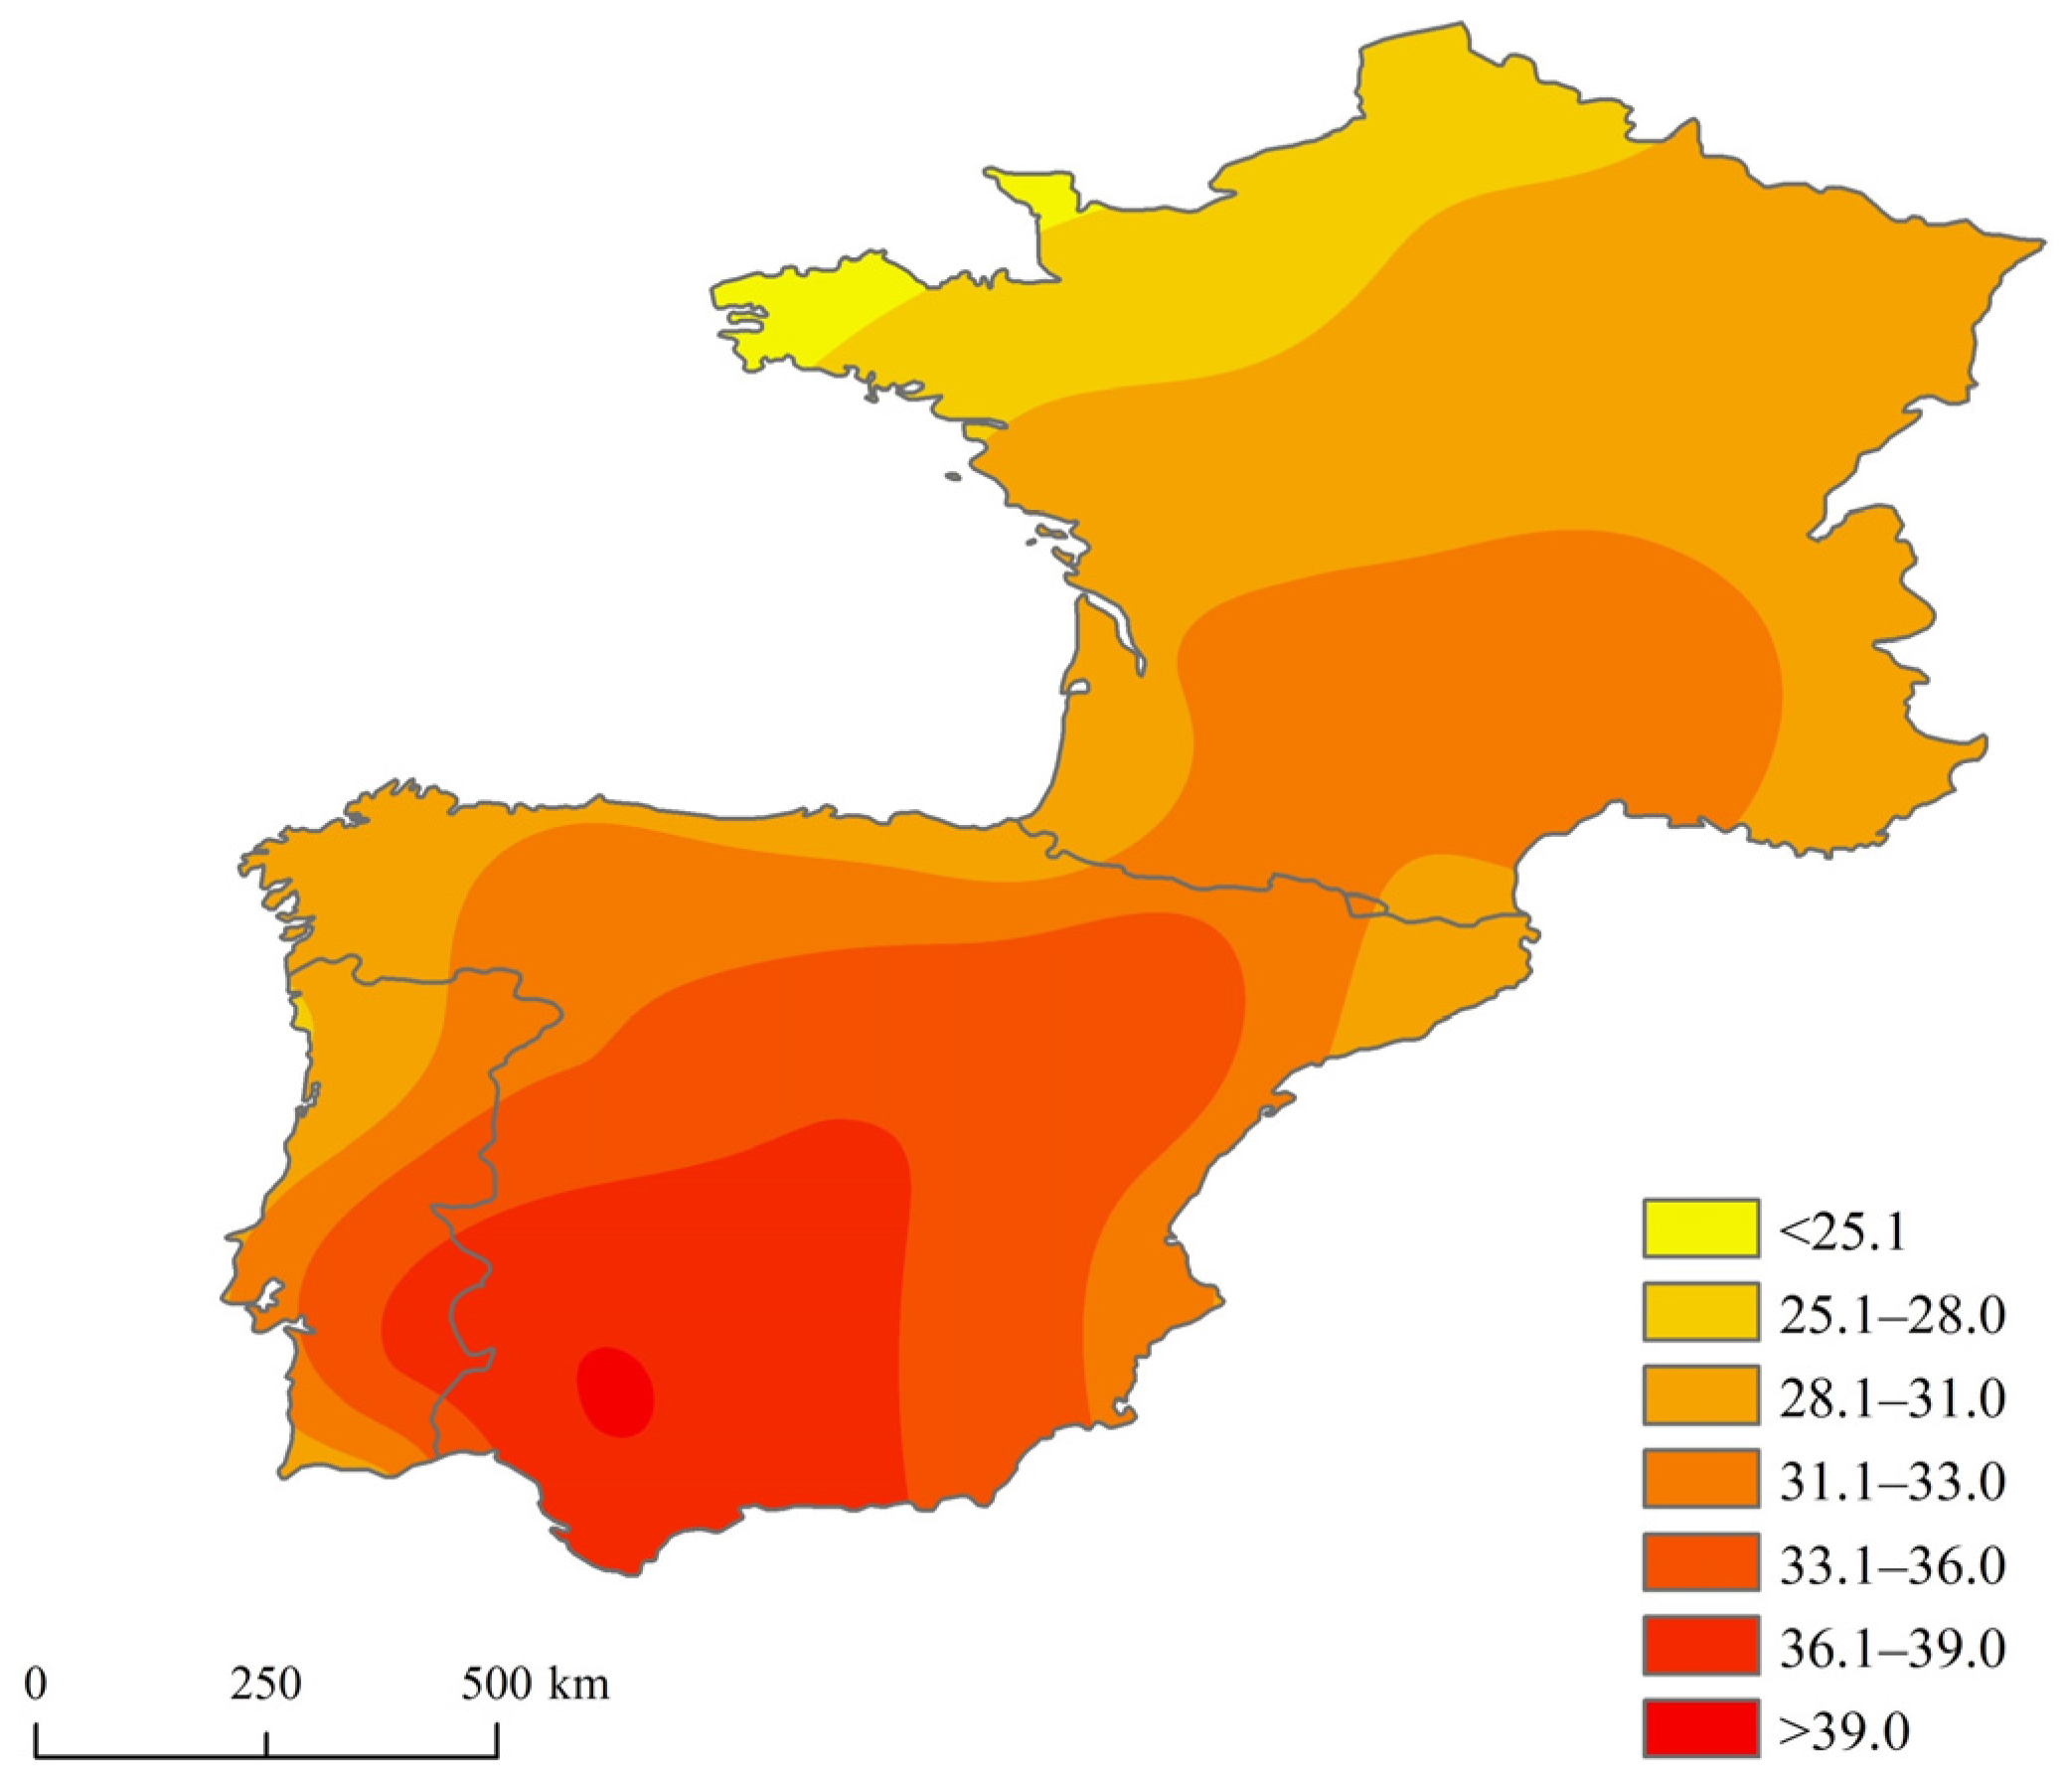
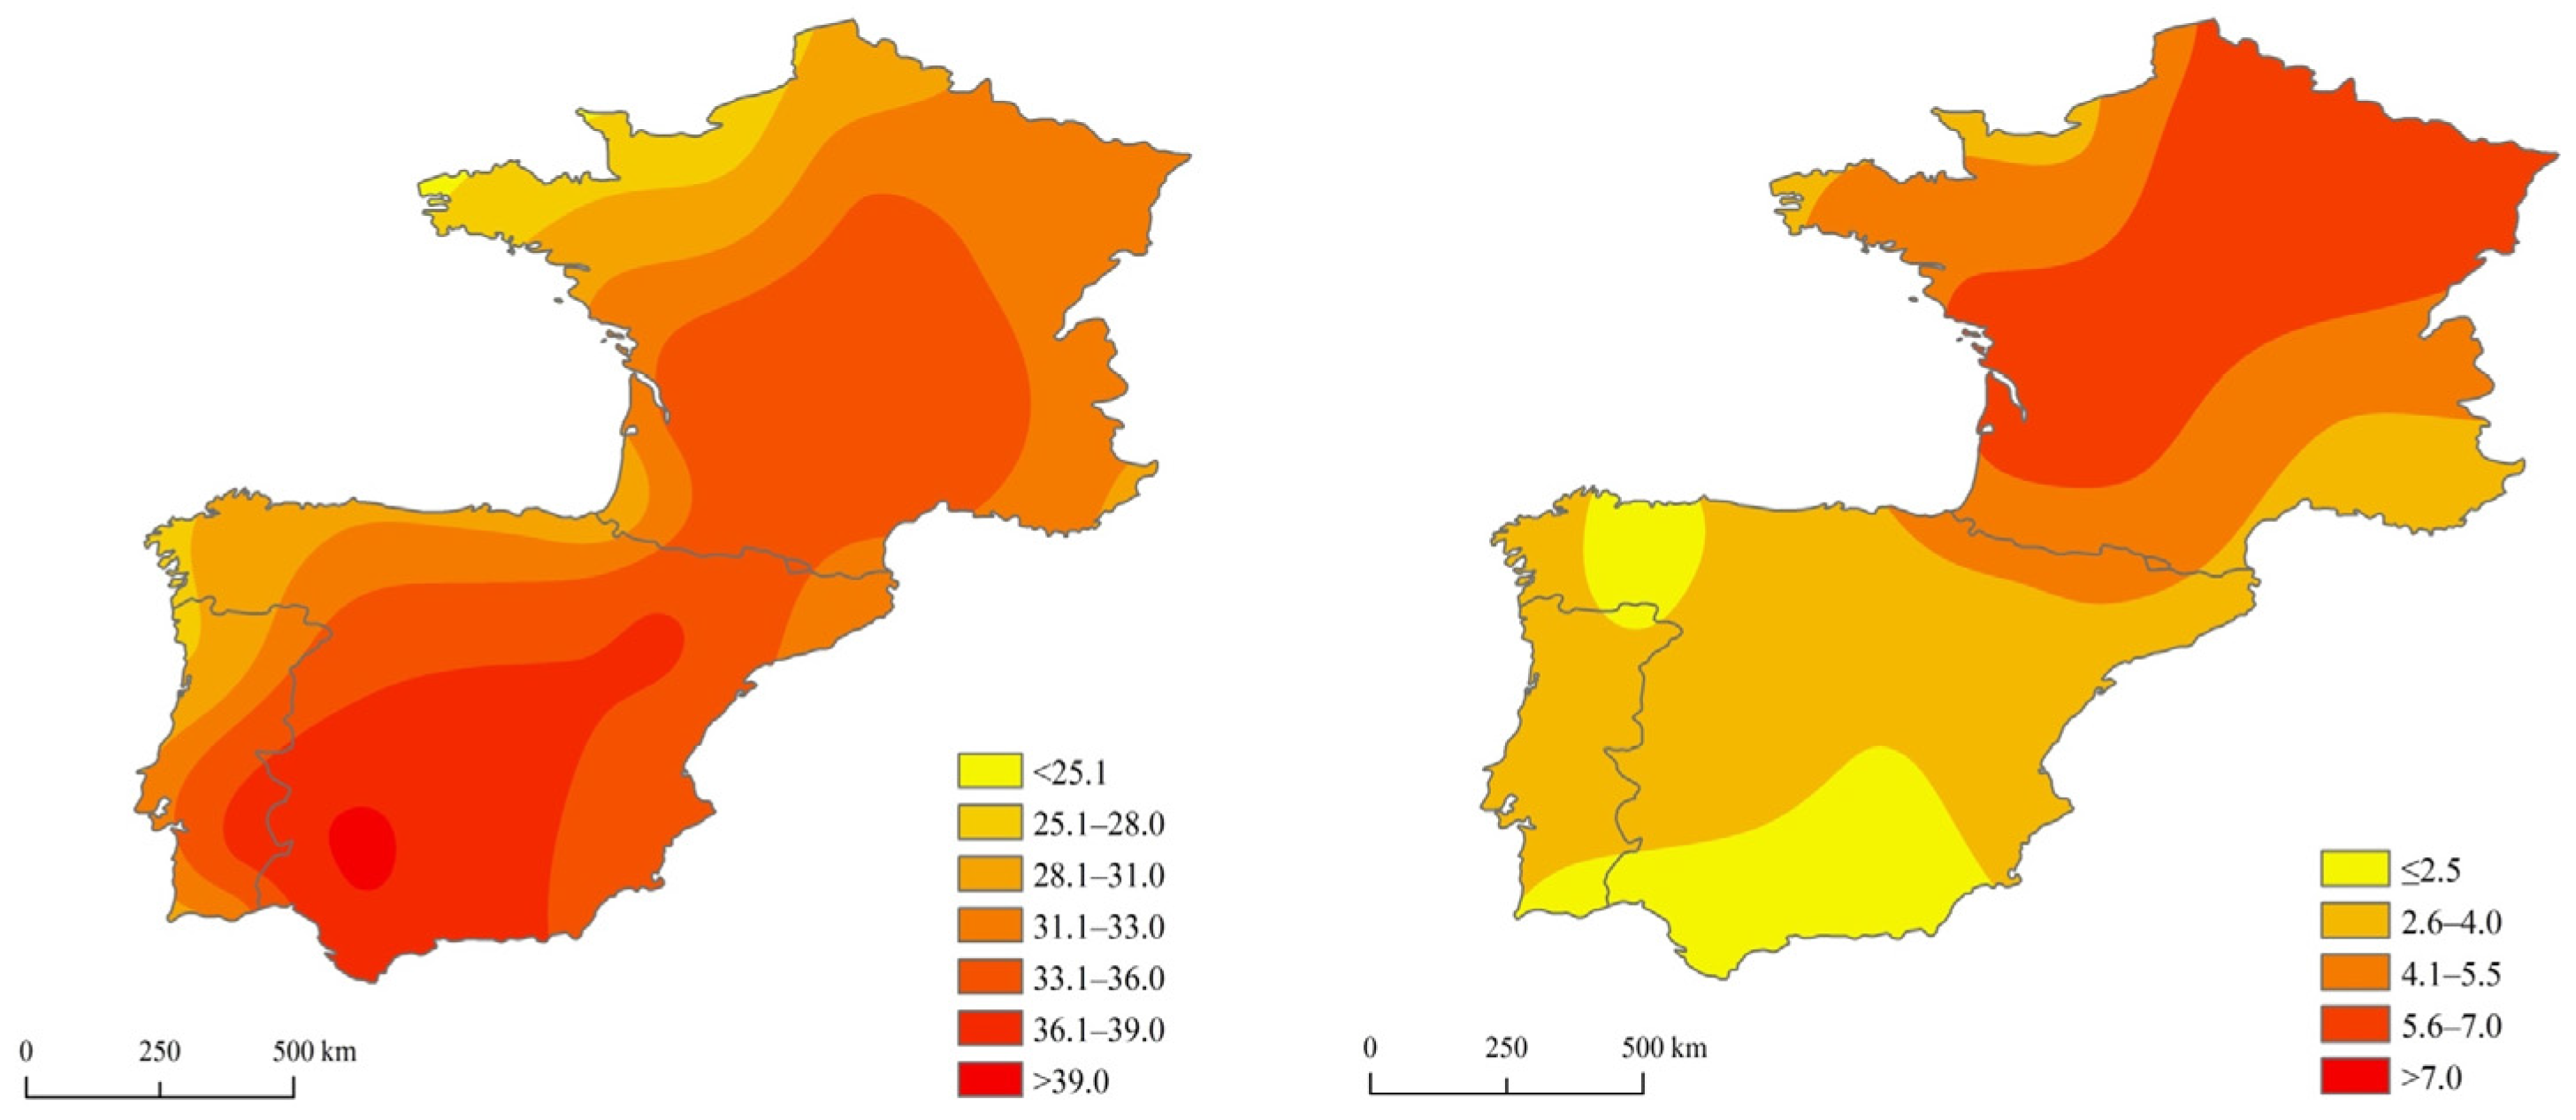
Taking into consideration the abovementioned arguments, the article defined a hot day as a day with Tmax above the value of 95th annual percentile (derived from the daily values in °C for each station separately) and a heat wave (HW) was considered a period of at least five subsequent days of that kind. The study was carried out for the entire year; however, the final results indicated months from April to September.
The value of the 95th percentile of Tmax ranged from 23.5 °C in Brest, France to 38.9 °C in Seville, Spain (
Figure 2). The aforementioned assumption was based on the definition of an extreme weather event included in IPCC reports [
35]. According to the report, a weather phenomenon that is so rare within the particular area that it lies within the 10th or 90th percentile range of an observed probability density function is defined as an extreme weather event. The abovementioned threshold is commonly used in research studies concerning HWs [
10,
36,
37]. Within the analysed area, other threshold values for distinguishing HWs were established; for example, a maximum temperature of >36.5 °C or 41 °C in Spain [
38,
39], or >32 °C in Portugal [
40]. The assumption of the aforementioned thresholds was justified with a substantial increase in the number of deaths. On the other hand, in France, the adopted Tmax threshold was 30 °C, which corresponds to values above the 95th percentile [
27].
The obtained data were used to select hot days, from which HWs were distinguished. Next, a number of HWs and their duration in particular decades were analysed. For the determined climatological characteristics, their variability and statistical significance of trends (p ≤ 0.05) in the multiannual period were determined. The trends were determined by the linear regression method. The mean Tmax and its anomalies were computed for the selected HWs. The anomalies were calculated as the difference between Tmax values on the particular days and the Tmax mean value on the particular day in the multiannual period.
To determine the pressure conditions causing the occurrence of HWs, the daily values of sea level pressure, and 13 geopotential heights (1000, 925, 850, 700, 600, 500, 400, 300, 250, 200, 150, 100 and 70 hPa) and air temperature at the listed heights were used. These data with horizontal resolution 2.5° × 2.5° were obtained from the National Centre for Environmental Prediction/National Centre for Atmospheric Research (NCEP/NCAR) Reanalysis [
41], available at the NOAA ESRL PSD (Earth System Research Laboratory Physical Science Division) resources (
http://www.esrl.noaa.gov/psd/data/gridded/data.ncep.reanalysis.html). On the basis of the aforementioned data, the sea level pressure (SLP), geopotential height of 500 hPa (z500 hPa) and air temperature on 850 hPa (T850) geopotential height maps were drawn up for the summer season (June–August) together with composite and anomaly maps for hot days forming HWs. All of the maps in this study were constructed using kriging interpolation method. The anomalies were calculated as a difference between the average values of SLP, z500 hPa and T850 for HWs and the corresponding multiannual summer averages. Only days on which the maximum temperature met the criterion of a hot day in at least six stations were selected for the synoptic analysis. In order to recognize the variability of pressure patterns causing HWs, different circulation types accompanying HWs were distinguished. To this end, the clustering method was applied. Clustering was made by grouping the HW days with regard to SLP values by means of the minimum variance method, known as Ward’s method [
42]. This method is based on Euclidean distances, and its essence is merging the pair of clusters A and B, which, after merging, provide the minimum of the sum of squares of all objects’ deviations from the newly created cluster’s centre of gravity [
43]. In order to achieve that, standardised SLP values were used. The standardisation proceeded using the common equation (value of variable—mean)/standard deviation and was made to deseasonalize the observations, simultaneously maintaining the intensity of the pressure field [
44]. The aforementioned method is often applied in order to determine climatic seasons and regions, as well as weather types [
45]. For the determined circulation types, composite and anomaly maps of SLP, z500 hPa and T850 were constructed. To find the specific pressure and thermal conditions in the middle and higher troposphere during HWs, vertical sections along the meridian 5° W and 2.5° E and along the parallel 40° N and 47.5° N were constructed for the hottest days. The anomalies of air temperature and geopotential height, computed as differences between values on the specific day and the 40-year mean values on the particular day, were marked at the vertical sections.
3. Results
3.1. Occurrence of Heat Waves
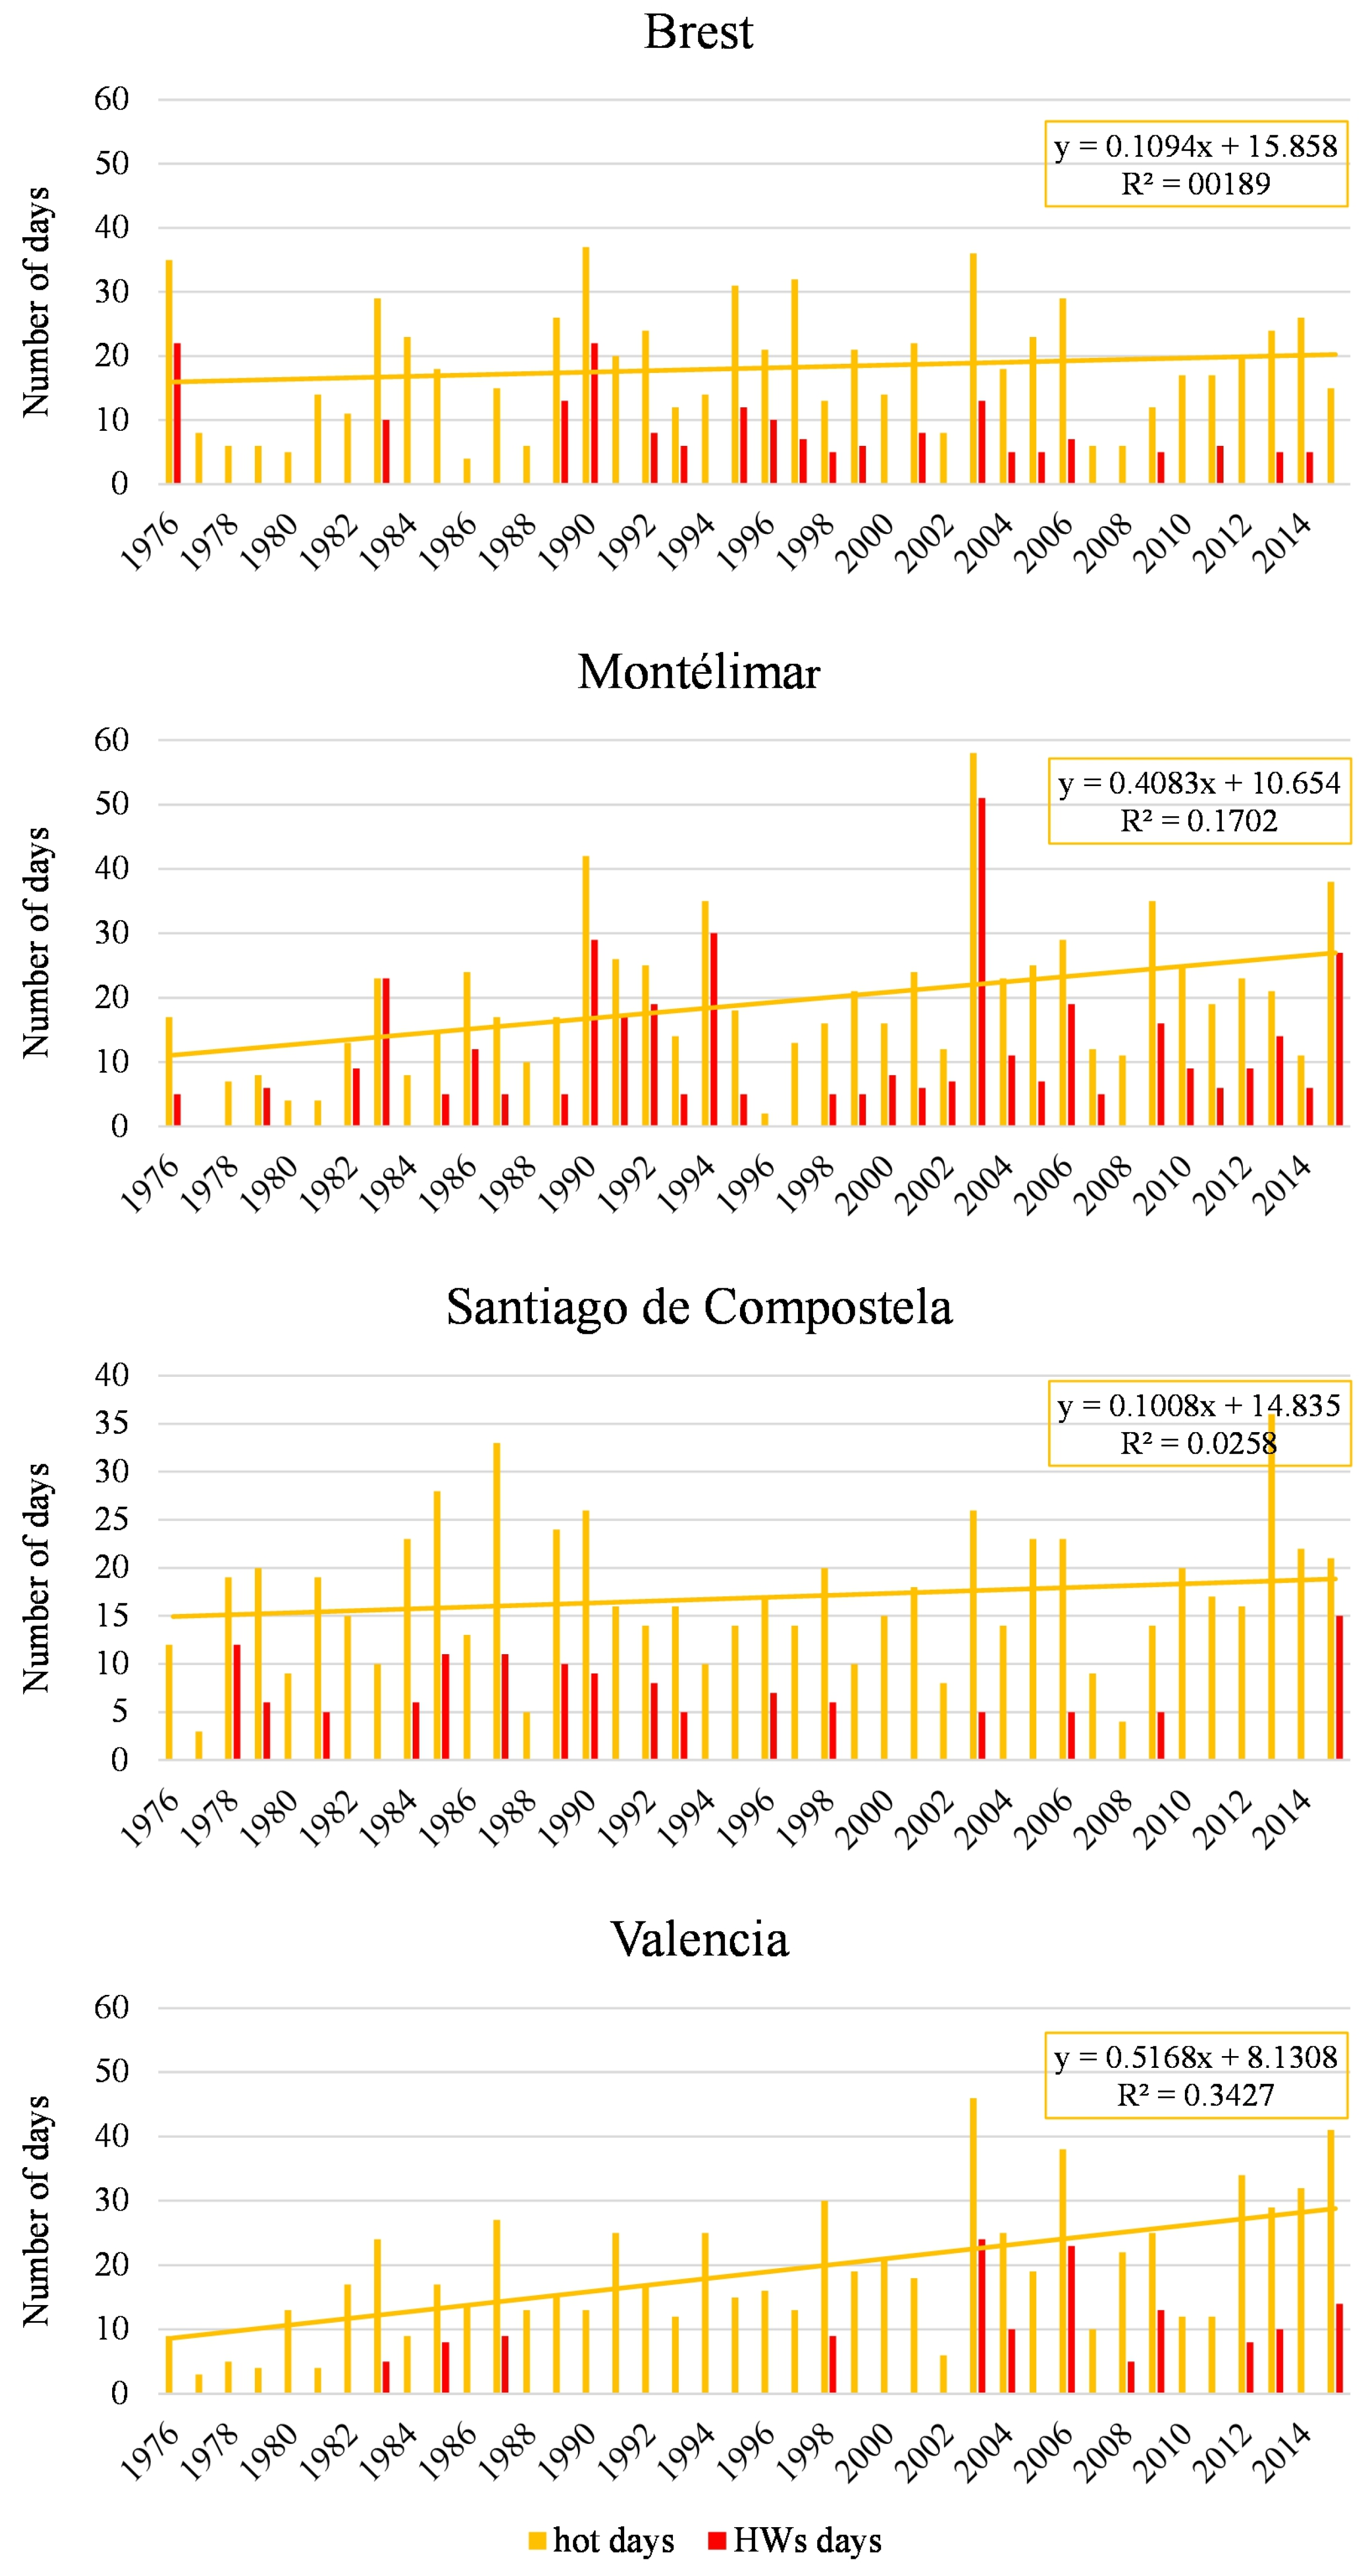
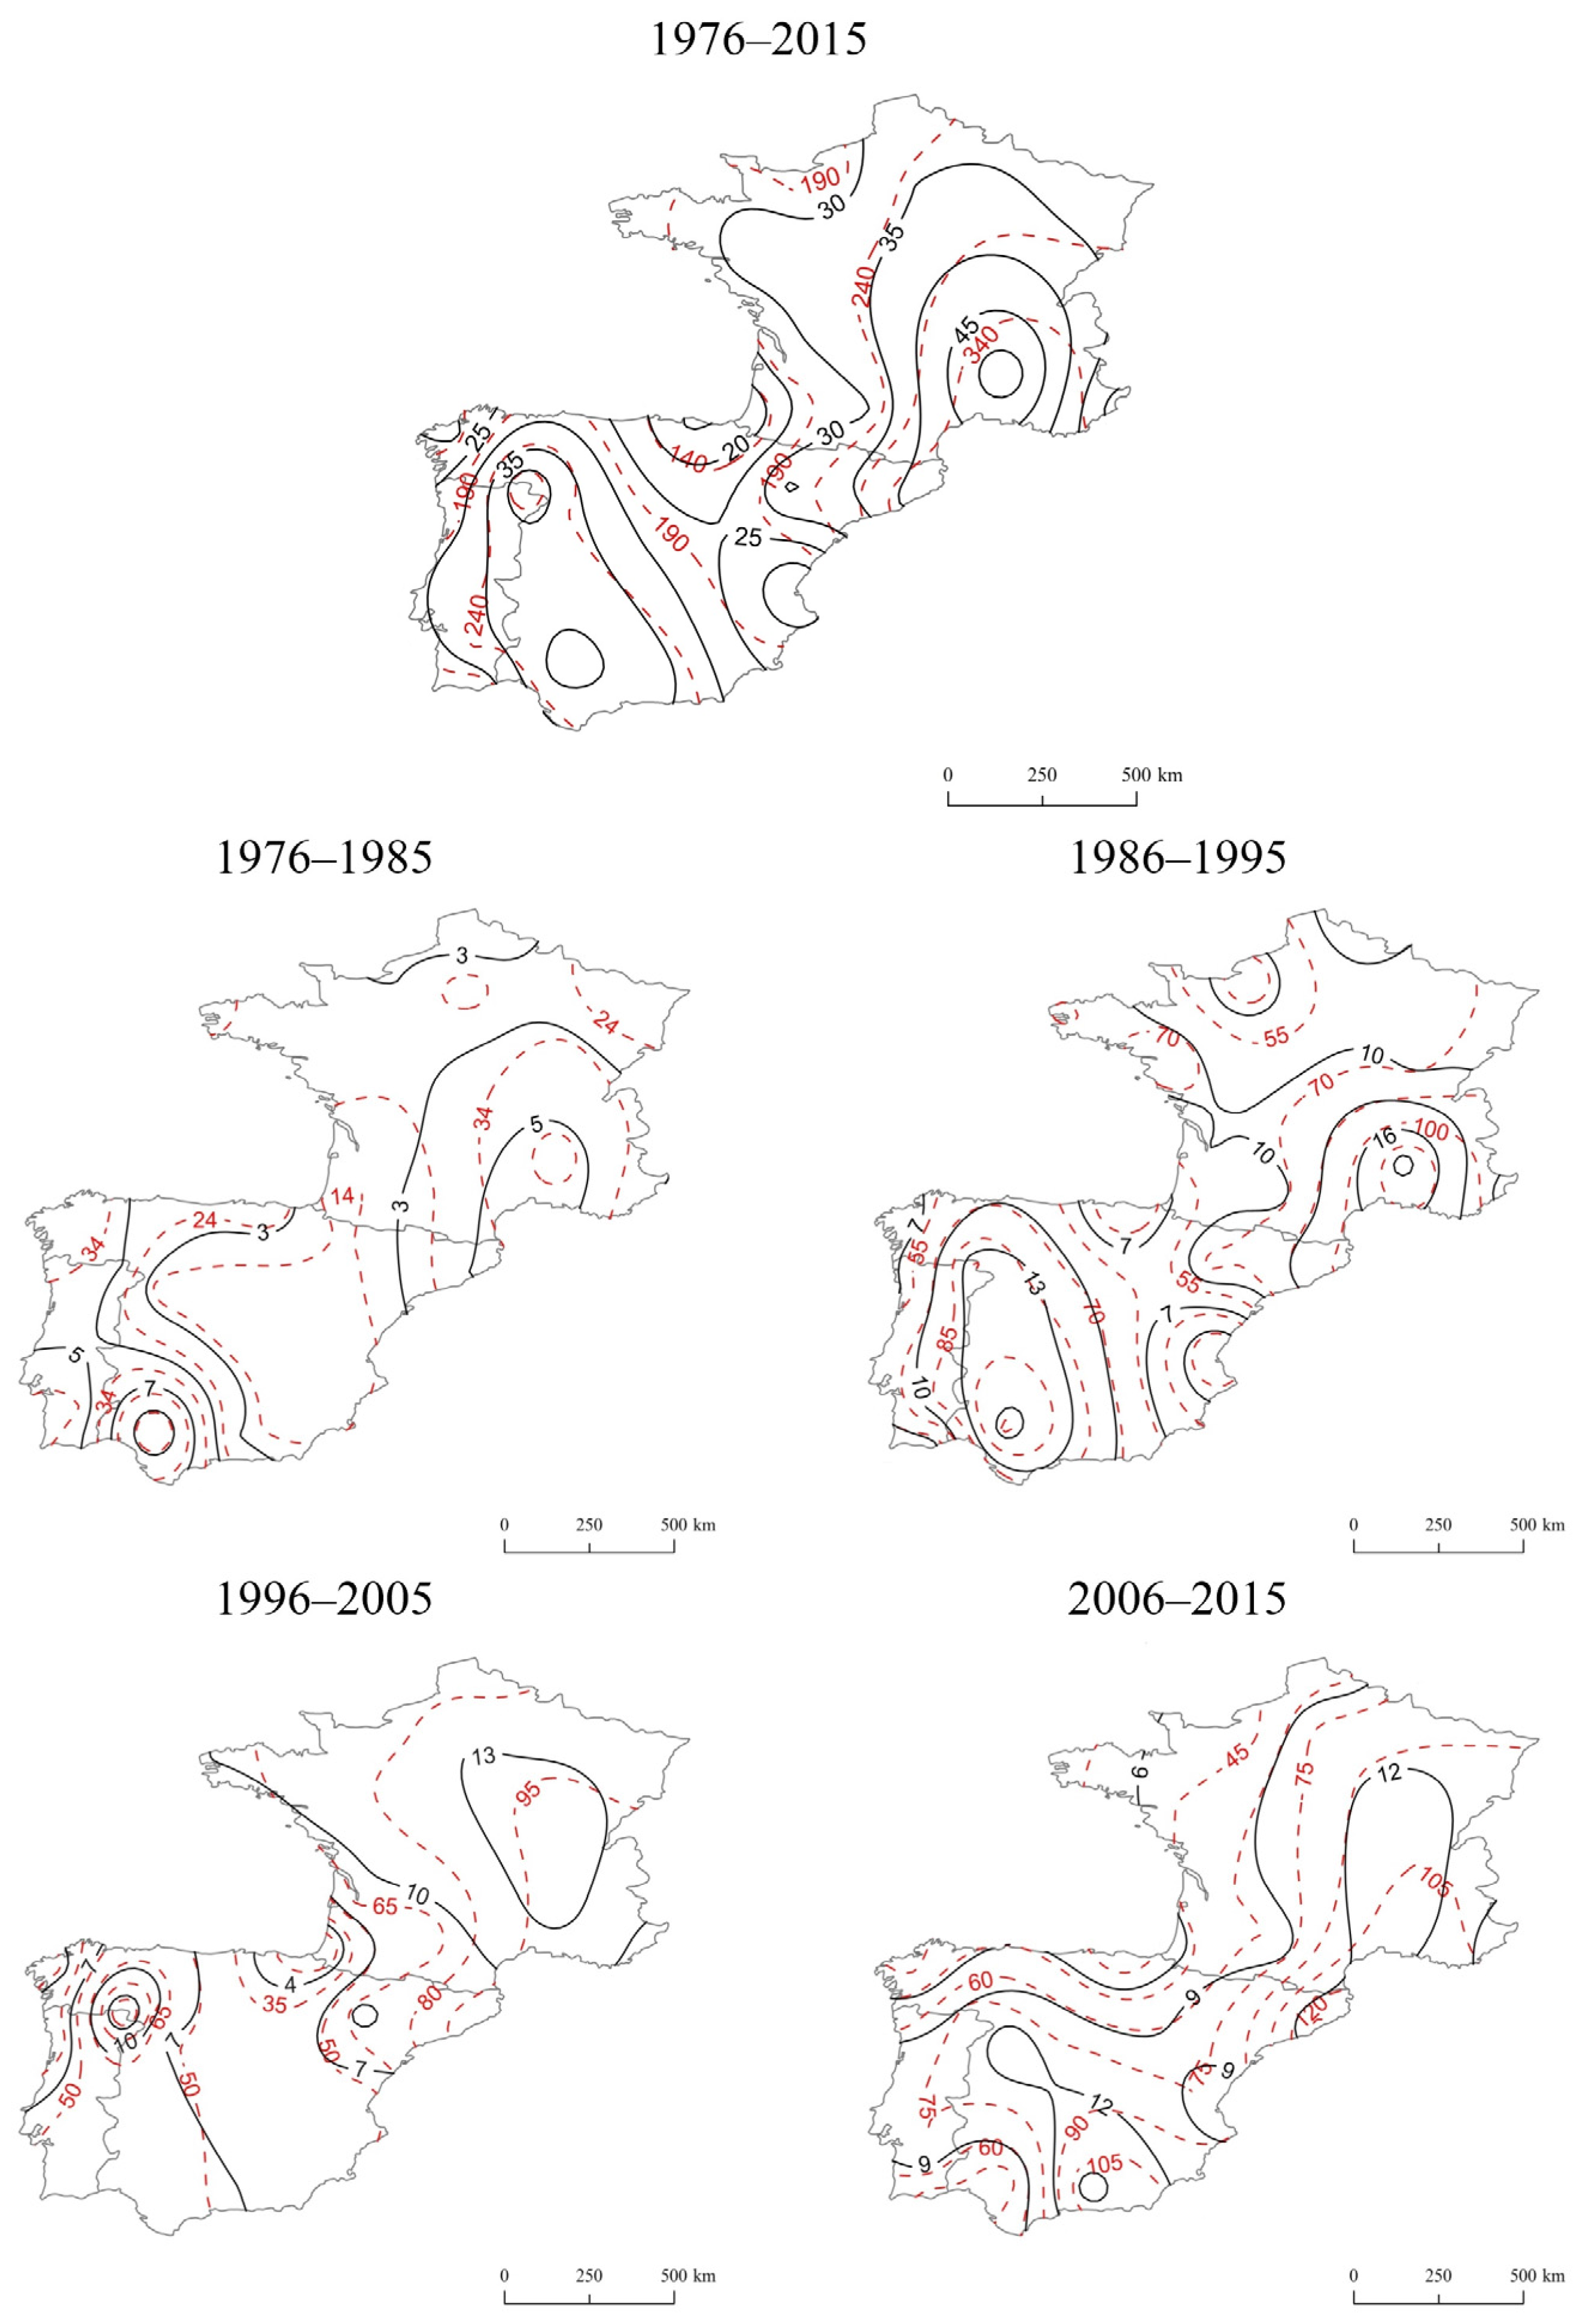
In Western and Southwestern Europe, there were between 15 and 20 hot days observed on average annually in 1976–2015. During this period an increase in a number of hot days was observed in 96% of the stations, and in 72% of the stations the positive trend was statistically significant (
p < 0.05). Lower trends (increase by <2.5 hot days per decade) were observed in western parts of the studied area (Lille, Caen, Brest, Nantes, Bilbao, Santiago de Compostela, Porto, Beja, Faro), while in eastern parts the increase in number of hot days exceeded four per decade (Nancy, Montélimar, Nice, Barcelona, Zaragoza, Valencia, Granada) (examples in
Figure 3). The consequence of the rising number of hot days was an increase in the frequency of HW occurrence.
Within the analysed area, the lowest number of HWs (14 waves) during the entire 40-year period was recorded in Bilbao (
Figure 4). The stations in Bayonne and Valencia were characterised by a similar number of HWs (15 waves). On the other hand, the highest number of HWs occurred in Montélimar—as many as 54 HWs. The shortest duration of HWs (computed as the total duration of all HWs in the entire period 1976–2015) was found for Bayonne (96 days) and Bilbao (98 days), while the longest duration was observed in Montélimar (386 days) and Barcelona (374 days). In 76% of the stations, the lowest number of HWs was recorded during the first 20 years (1976–1985). In this period, the number of HWs ranged from one in Nancy, Bordeaux and Madrid to 11 in Seville. On the other hand, in 40% of the stations, the highest number of HWs was recorded between 1986 and 1995, and in 8% the same number appeared in 1986–1995 and 1996–2005. This was related to the occurrence of exceptionally warm summer seasons in the first half of the 1990s. There were numerous HWs recorded in 1991, 1992, 1994 and 1995. In the decade 1985–1996, a number of HWs ranged from 1 in Valencia to 20 in Montélimar.
In general in Western and Southwestern Europe, HWs occurred from the end of April to October. In 60% of the stations, the highest number of HWs was recorded in July, while for two stations (Bayonne and Dijon) the same number of waves was observed in July and August. Only in Bilbao did the highest number of HWs occur in September (36%). In May, HWs were recorded in only six stations (Brest, Lille, Bordeaux, Bayonne, Porto and Santiago de Compostela), while in October they occurred in three stations (Porto, Santiago de Compostela and Bilbao). Within the investigated area, the beginning of the earliest HW ranged from 30 April in Brest to 10 July in Valencia. On the other hand, the last day of the latest HW ranged from 27 August in Paris to 15 October in Santiago de Compostela. The duration of the period of the potential occurrence of HWs (i.e., from the earliest to the latest occurrence) ranged from 52 days in Valencia to 156 days in Brest. This period also exceeded 100 days in Lille, Bordeaux, Nantes, Caen, Bayonne, Porto, Santiago de Compostela and Bilbao.
In 76% of the stations, most numerous were the shortest HWs, that is, five-day waves, while in 8% of the stations these were six-day heat waves. In 8% of the stations there was the same number of five- and six-day heat waves recorded. Only in Bayonne were seven-day heat waves the most frequent, and in Nice these were six- and seven-day heat waves. The longest HW occurred in 2003 in Nice and lasted 49 days, from 14 July to 31 August. A heat wave of over 40 days was also recorded in Barcelona in 2003, lingering from 18 July to 30 August (
Table 1).
3.2. Impact of the Circulation on the Occurrence of Heat Waves
The mean sea level pressure in the summer season (June–August) in the Euro-Atlantic sector reached the highest value in the area of the Azores Islands (>1024 hPa) and dropped gradually in the northerly direction (
Figure 5). The centre of low pressure was located in the southwest of Iceland (<1010 hPa). Between the mentioned pressure centres over the ocean, considerable horizontal pressure gradients were observed and lower gradients were found over the continent. In warmer air masses, air pressure is dropping slower with height than in cooler ones; therefore, z500 hPa in warmer masses is higher. Therefore, the 500 hPa mean geopotential height was inclined towards the north. Its maximum height was recorded over the Mediterranean Sea (>5880 gpm), and the minimum was found over the northern Atlantic (<5500 gpm). Air temperature on the geopotential height of 850 hPa decreased from the south (>20 °C) to the northwest (<0 °C). The aforementioned pressure system caused western circulation, both in the middle and lower troposphere typical for Europe and mid-latitudes in general.
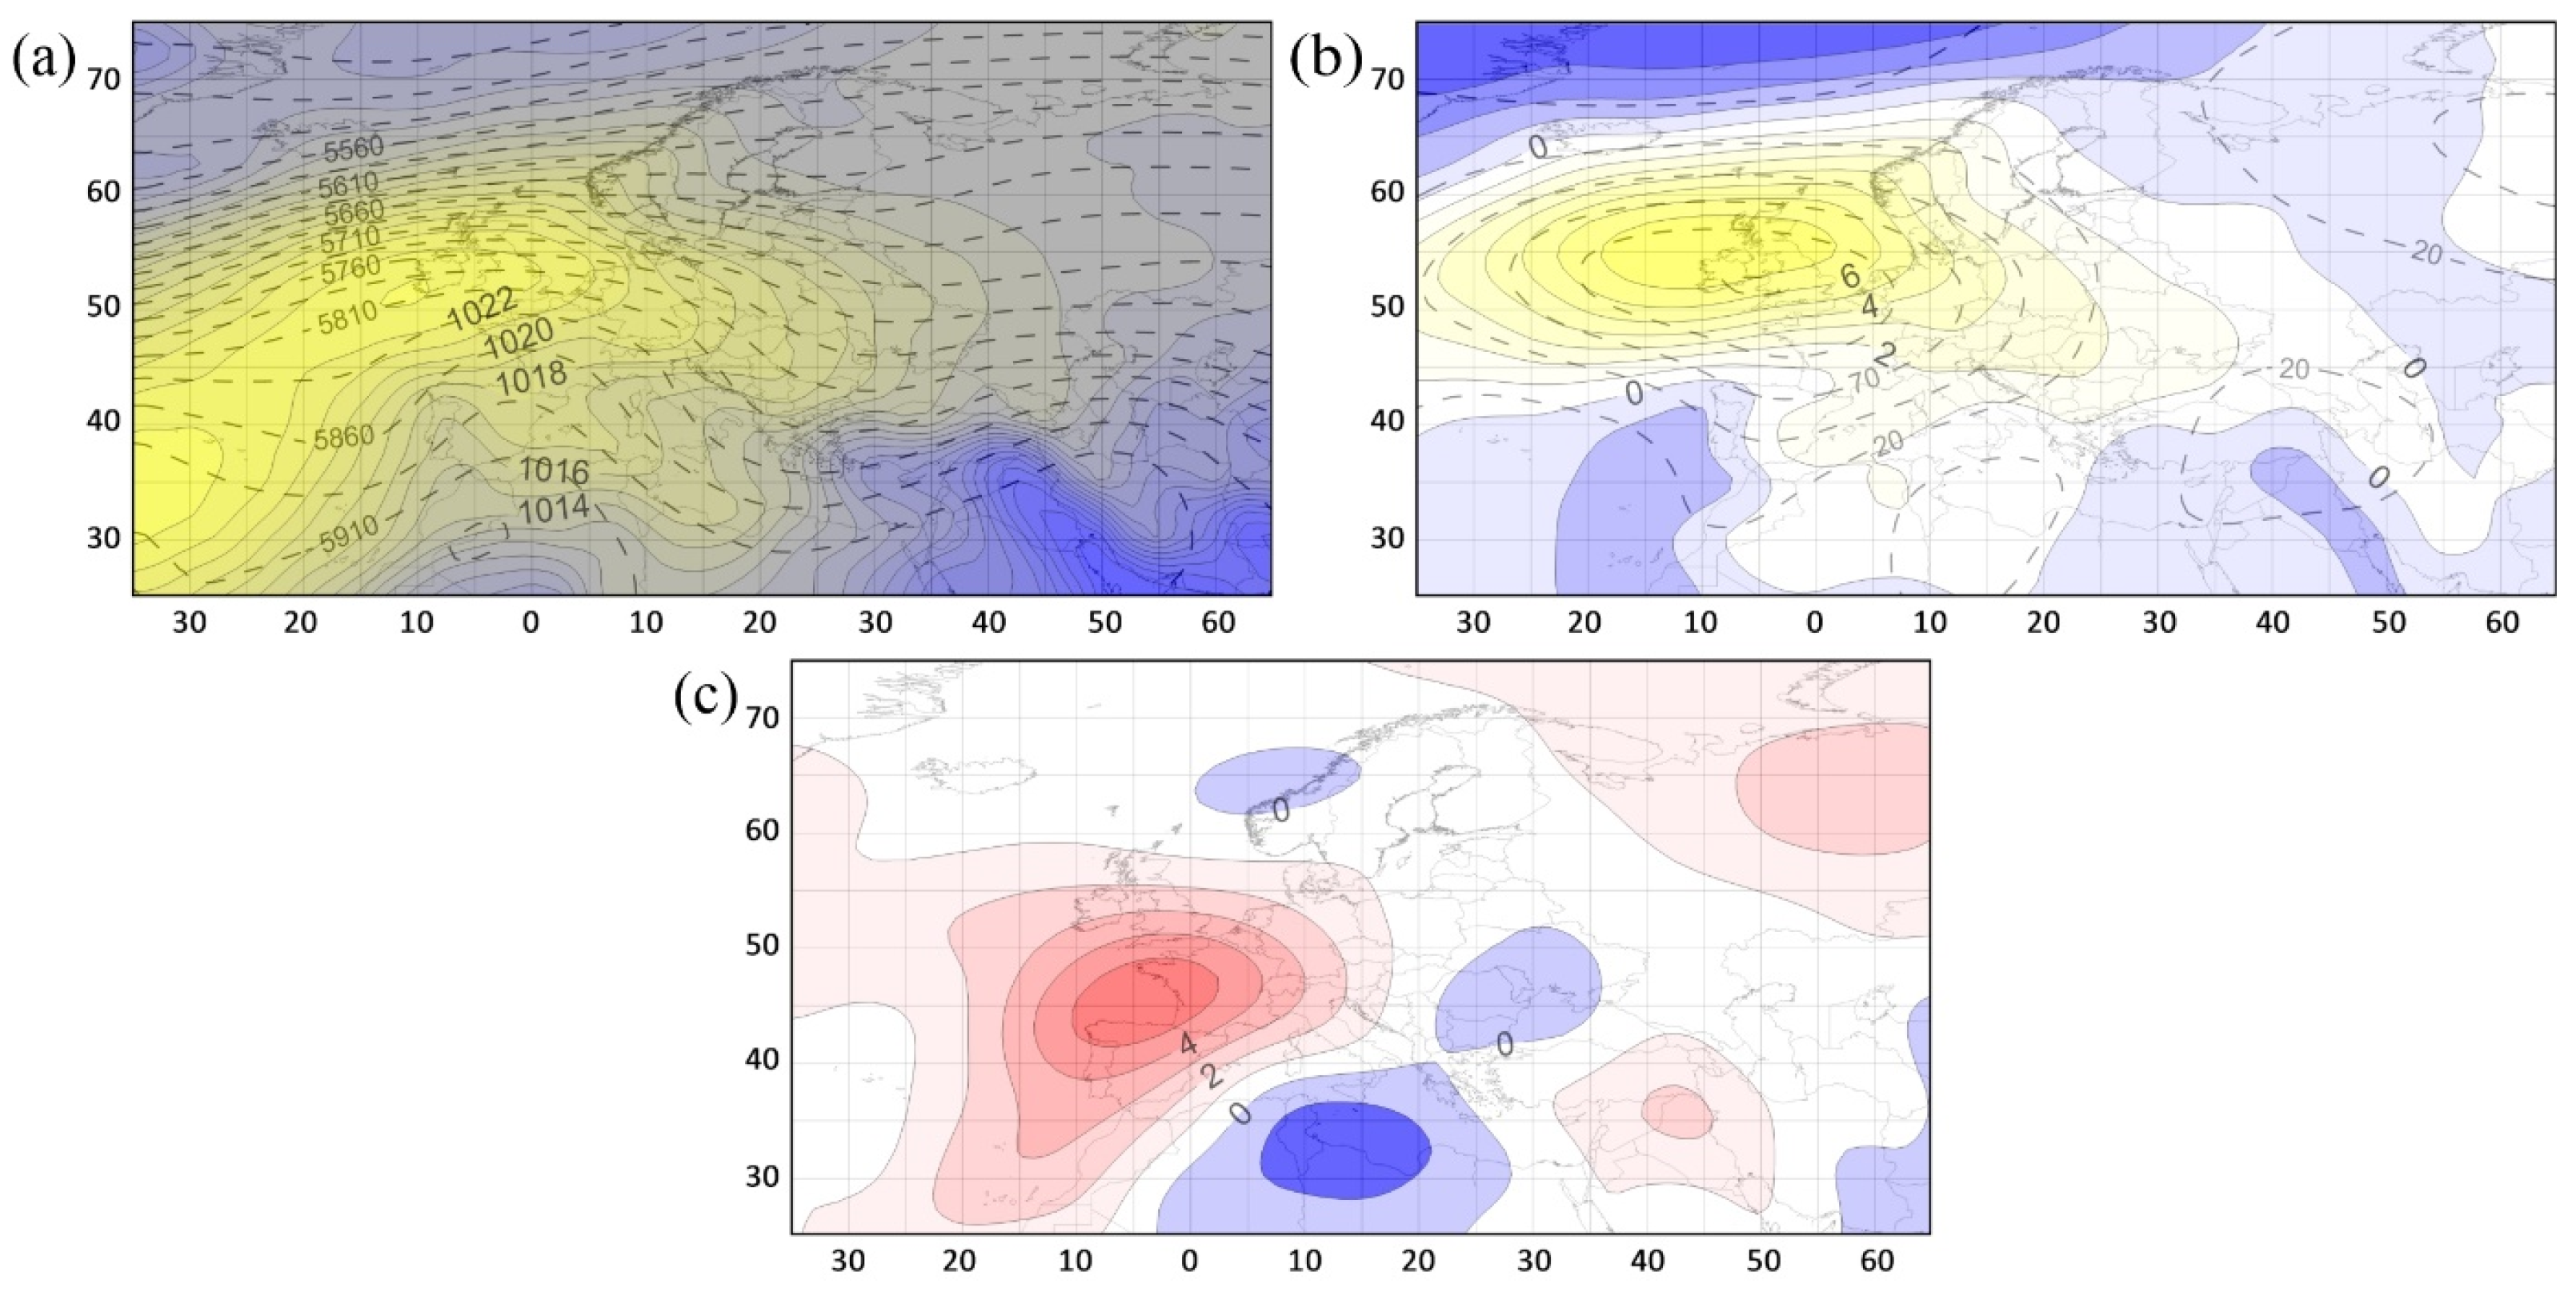
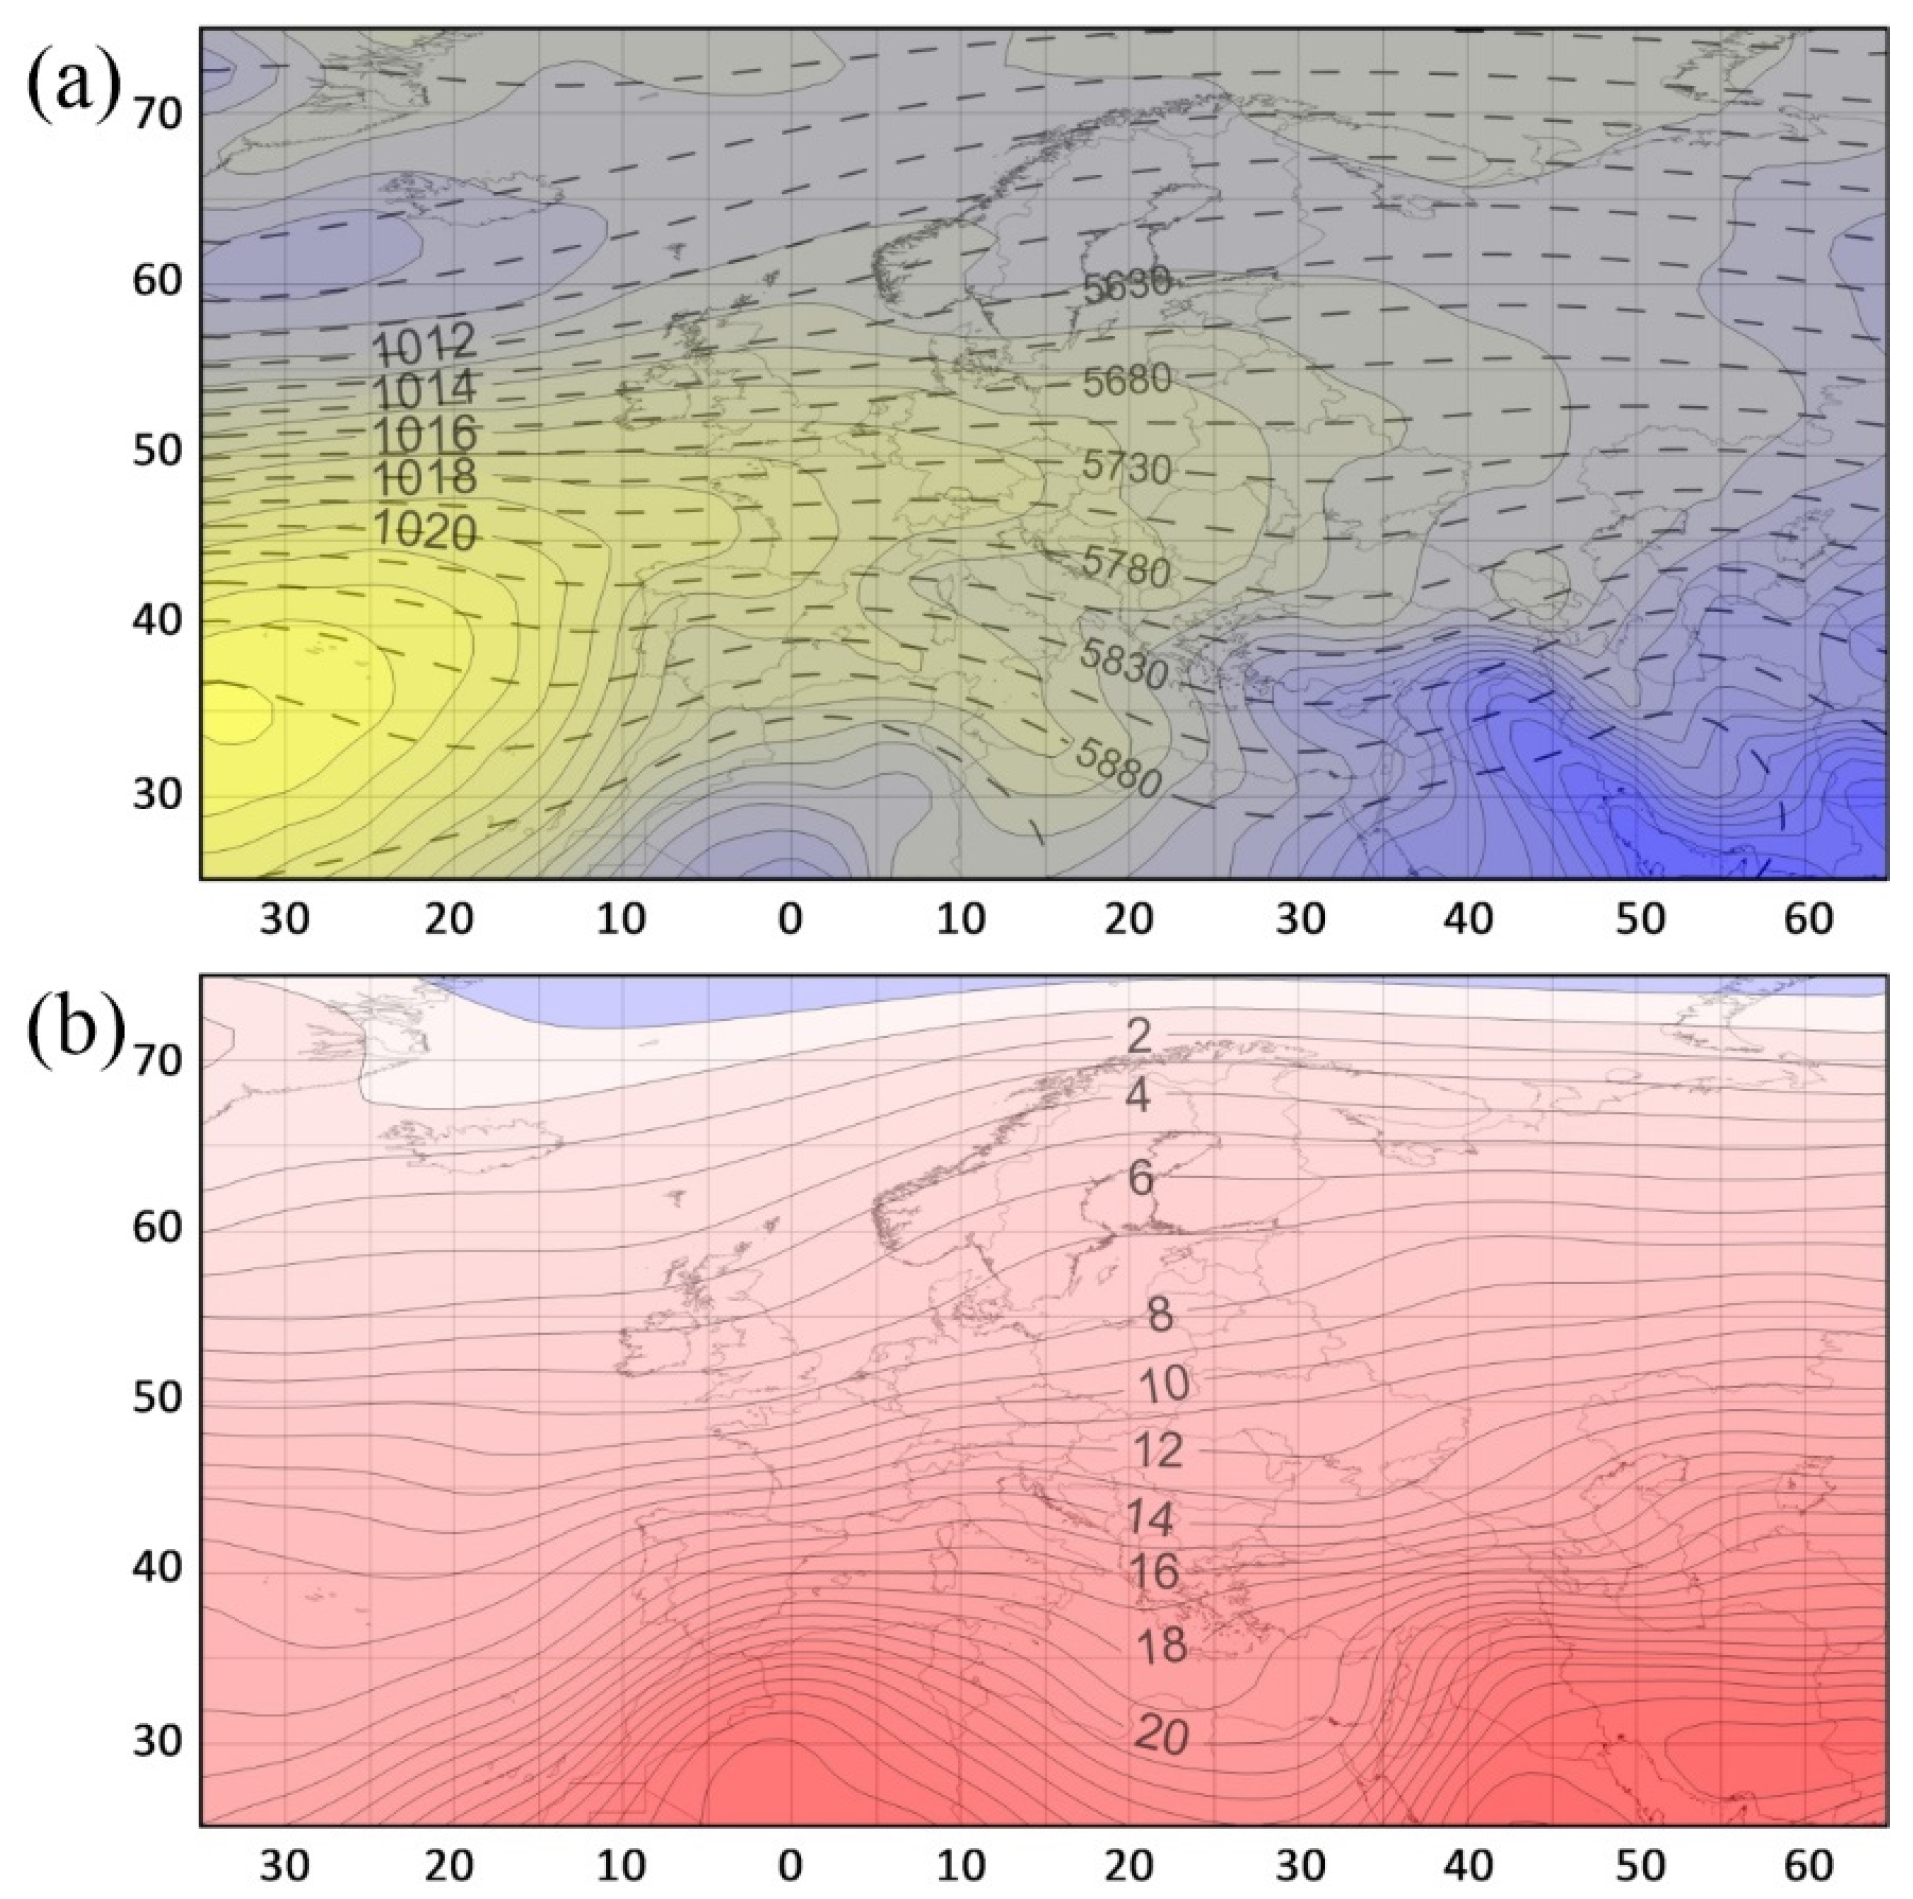
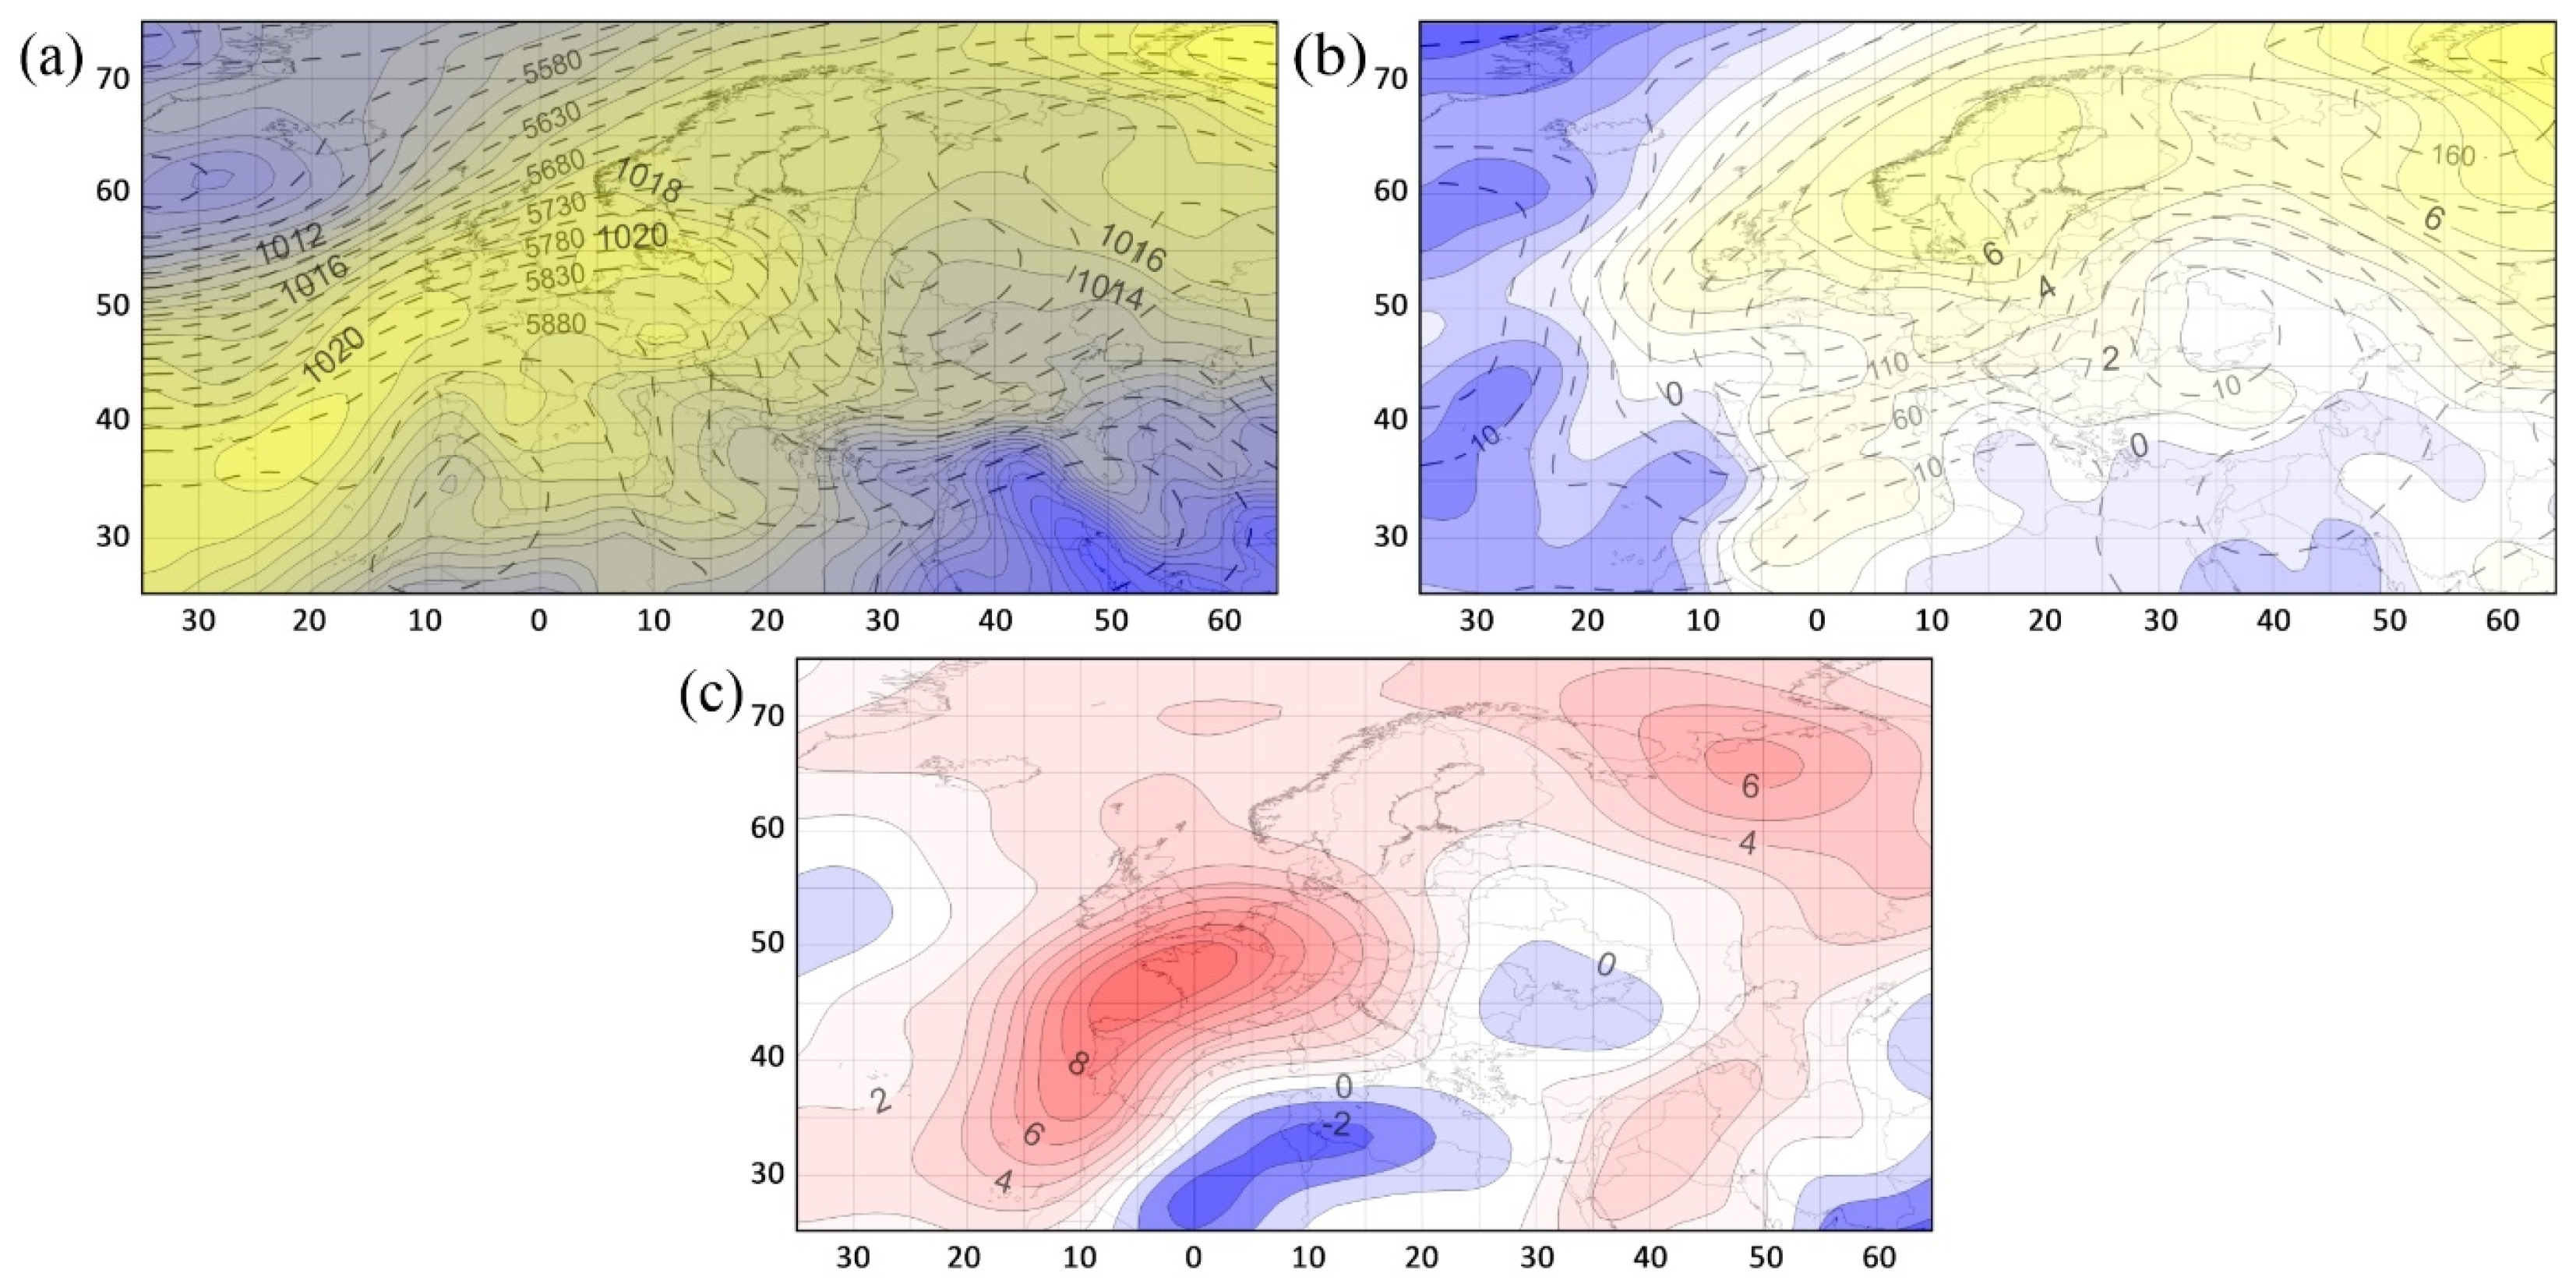
The occurrence of HWs in Western and Southwestern Europe was accompanied by positive anomalies of z500 hPa and SLP over Western Europe. The centre of z500 hPa anomalies (>80 m) was located between France, Germany and southern parts of British Isles (
Figure 6). The research area stayed within the reach of z500 hPa anomalies, which ranged from 30 to >80 m. The centre of positive SLP anomalies (>4 hPa) shifted northward to the centre of z500 hPa anomalies and it was located over the North Sea. Higher-than-normal SLP over Western Europe formed a wedge of high pressure joined with the semi-permanent anticyclone called Azores High. The contour lines of geopotential height of 500 hPa over the analysed area bent northwards, creating a clear elevation that confirms the presence of warm air masses on the analysed HW days. The pattern of z500 hPa contour lines shows southwestern air flow over the research area in the middle troposphere layer. Over the majority of Northern, Southern and Eastern Europe, T850 was similar to the average conditions in summer, while over Western and Southwestern Europe it was considerably higher. The centre of positive T850 anomalies was recorded over western France and the Bay of Biscay (>5 °C). Apart from southwestern inflow, the described anticyclonic conditions over the studied area due to subsidence of air masses provided cloudless weather and therefore an intensive flux of solar radiation.
In
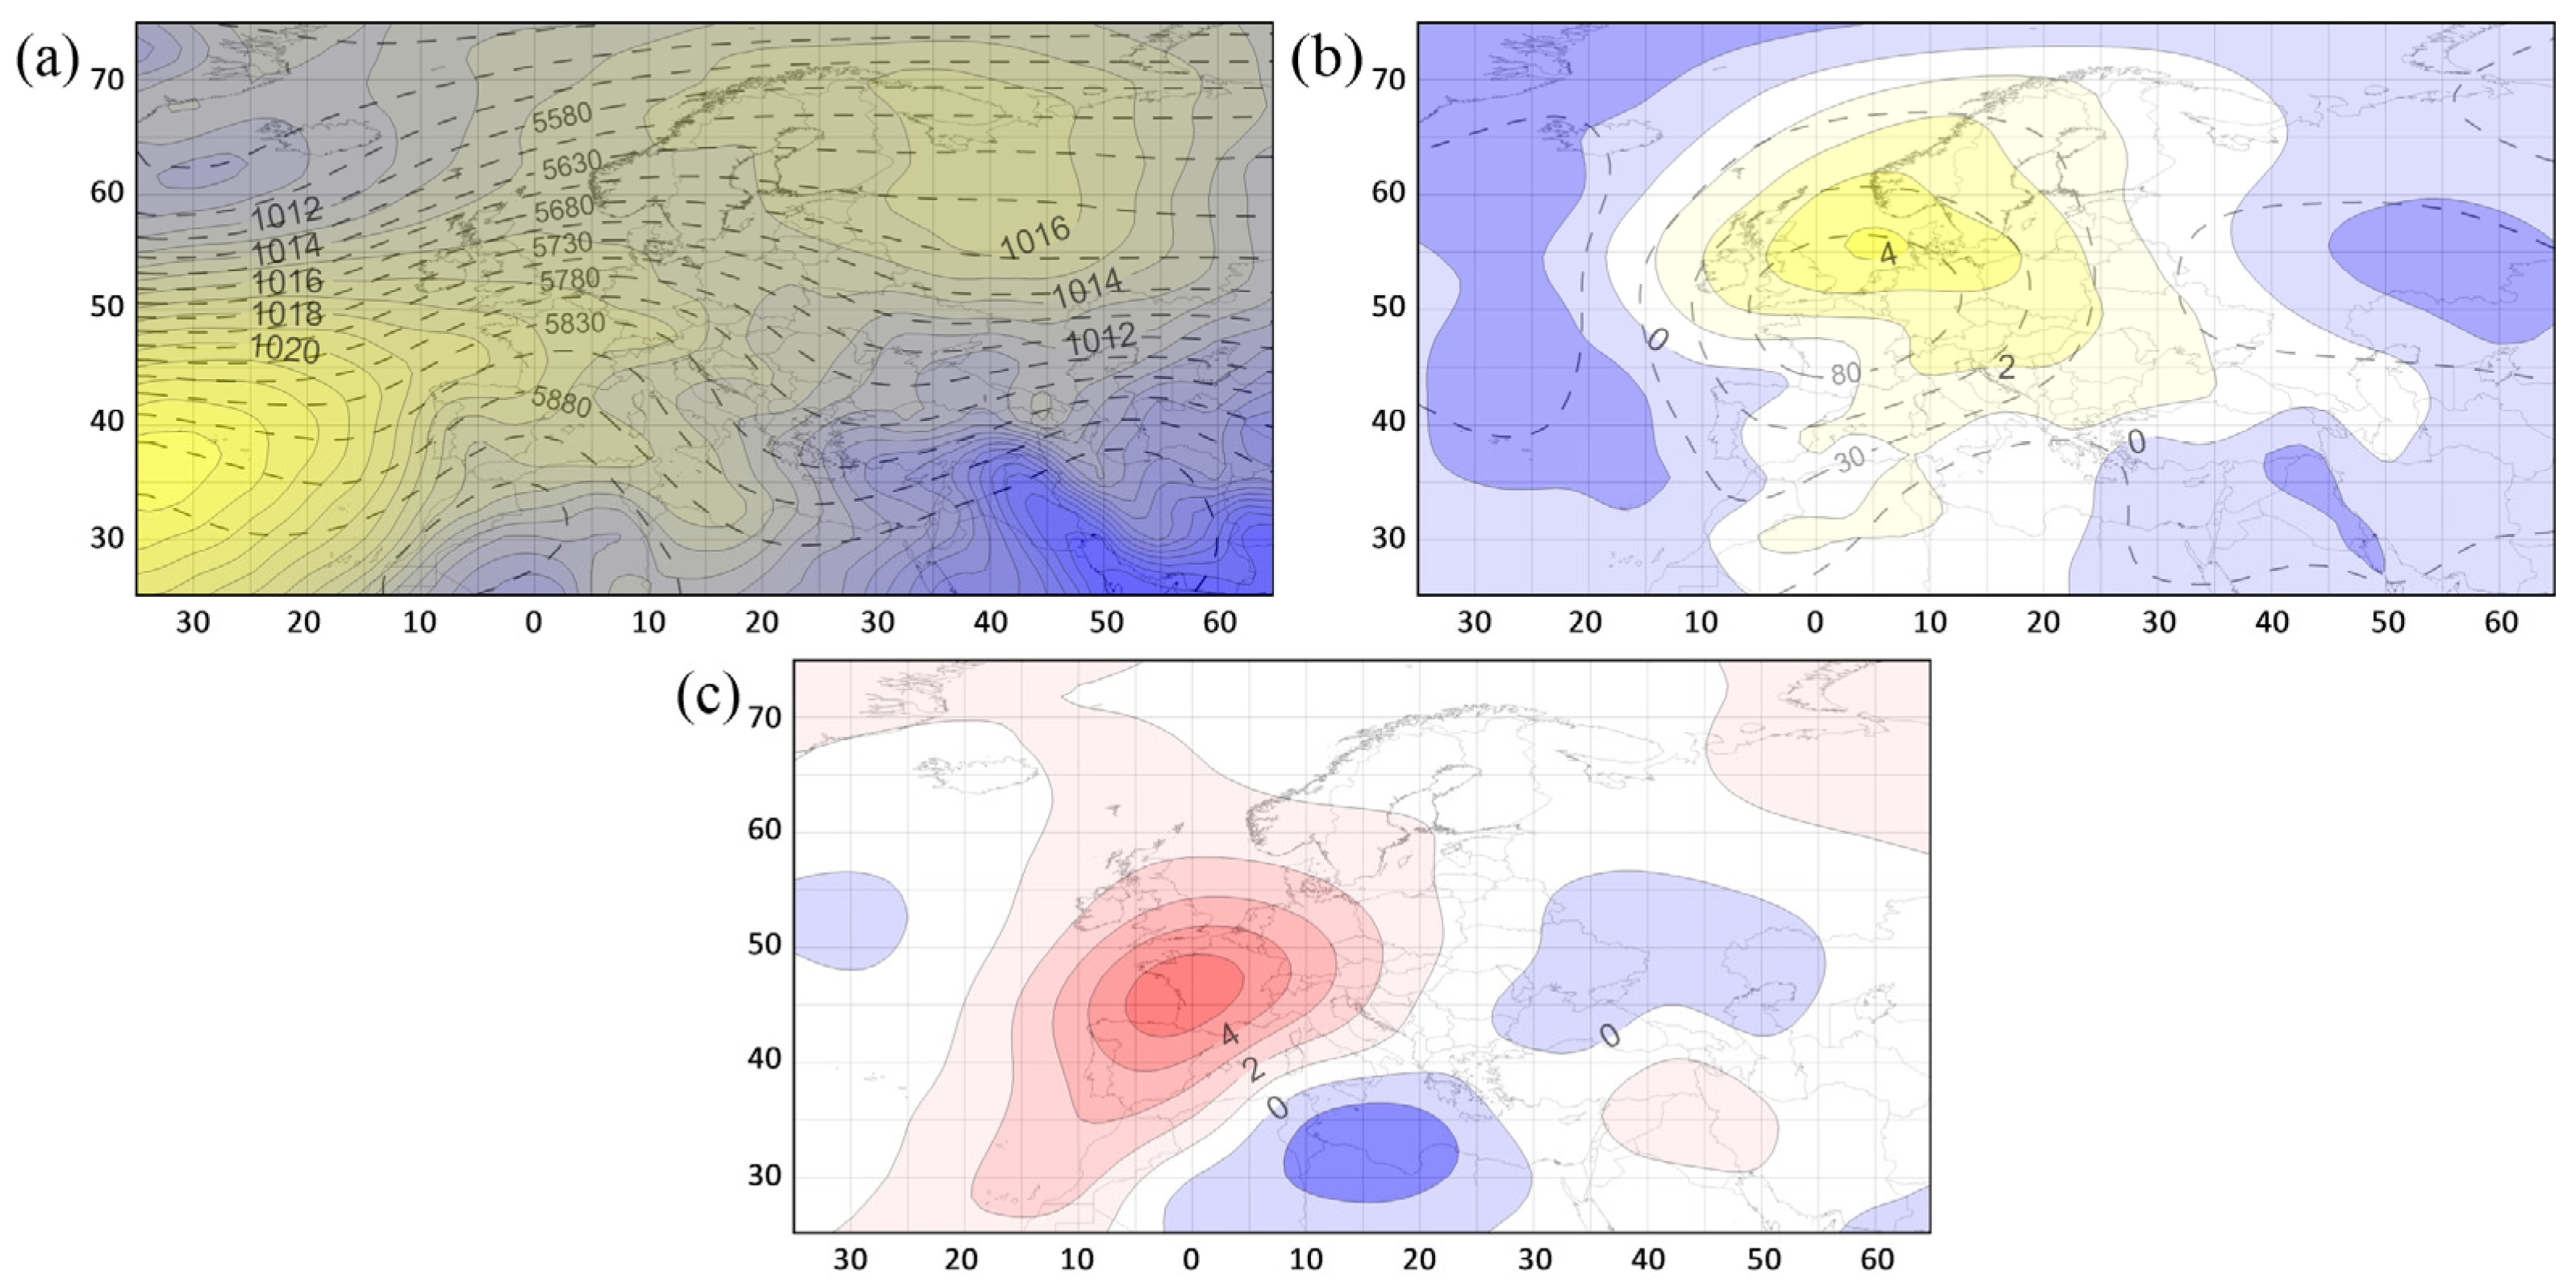
Figure 6, only the average baric conditions that cause HWs in Western and Southwestern Europe are presented. The particular HWs may be caused by various and different synoptic situations; thus, the next step was distinguishing the different pressure patterns accompanying the HWs’ occurrence. Clustering the days of HWs with regard to standardized SLP field allowed for setting apart two types of synoptic situations. The first type, which consisted of 167 days, revealed the anticyclone blocking system extending over Western Europe (
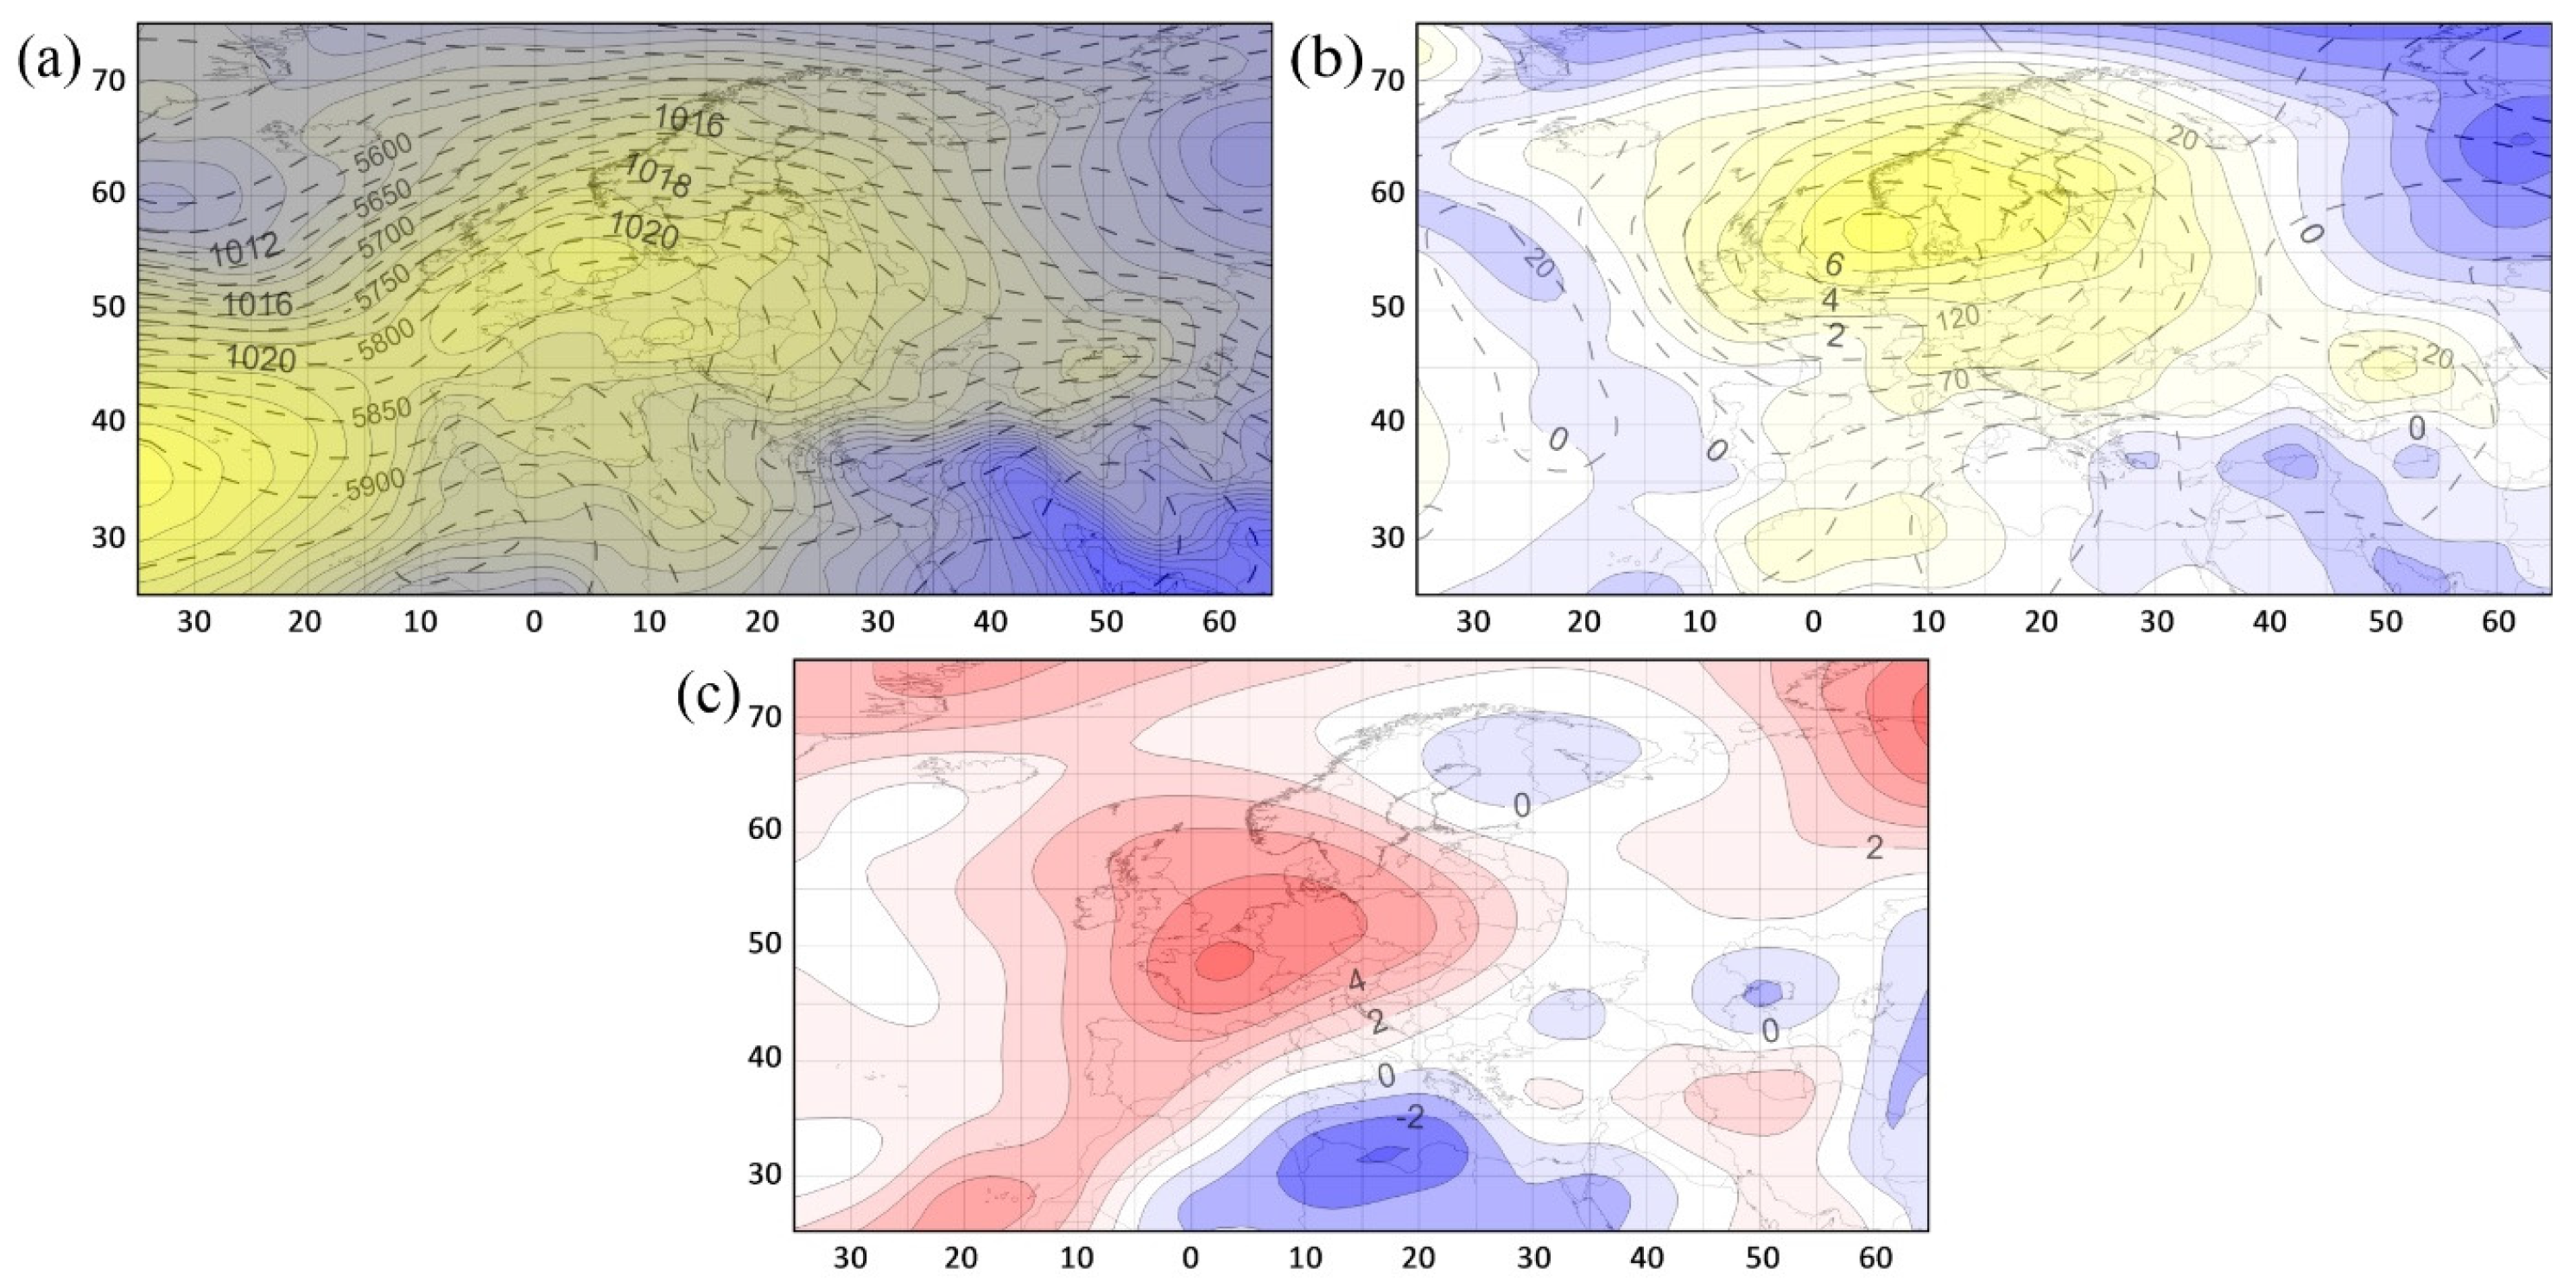
Figure 7). It was expressed by the pattern of z500 hPa and SLP anomalies, which were positive over Western Europe and negative westward and eastward to the centre (exceeding –5 hPa and –2 hPa, respectively). In this type a local high-pressure area formed over southern Germany and the Czech Republic (>1018 hPa) within the ridge of high pressure extending from the Azores to Eastern Europe. At the same time, over the North Atlantic, there was a low-pressure area with its centre (<1007 hPa) located in the southwest of Iceland. Over the research area, a weak horizontal pressure gradient was observed. Positive anomalies covered the majority of the continent, which exceeded 3 hPa in the centre. Warm air masses over the western part of the continent separated the cooler air masses settling over the ocean and the eastern part of the continent, as is shown by the pattern of T850 anomalies. Synoptic conditions represented by the first type indicate the southwestern airflow in both the low and middle troposphere.
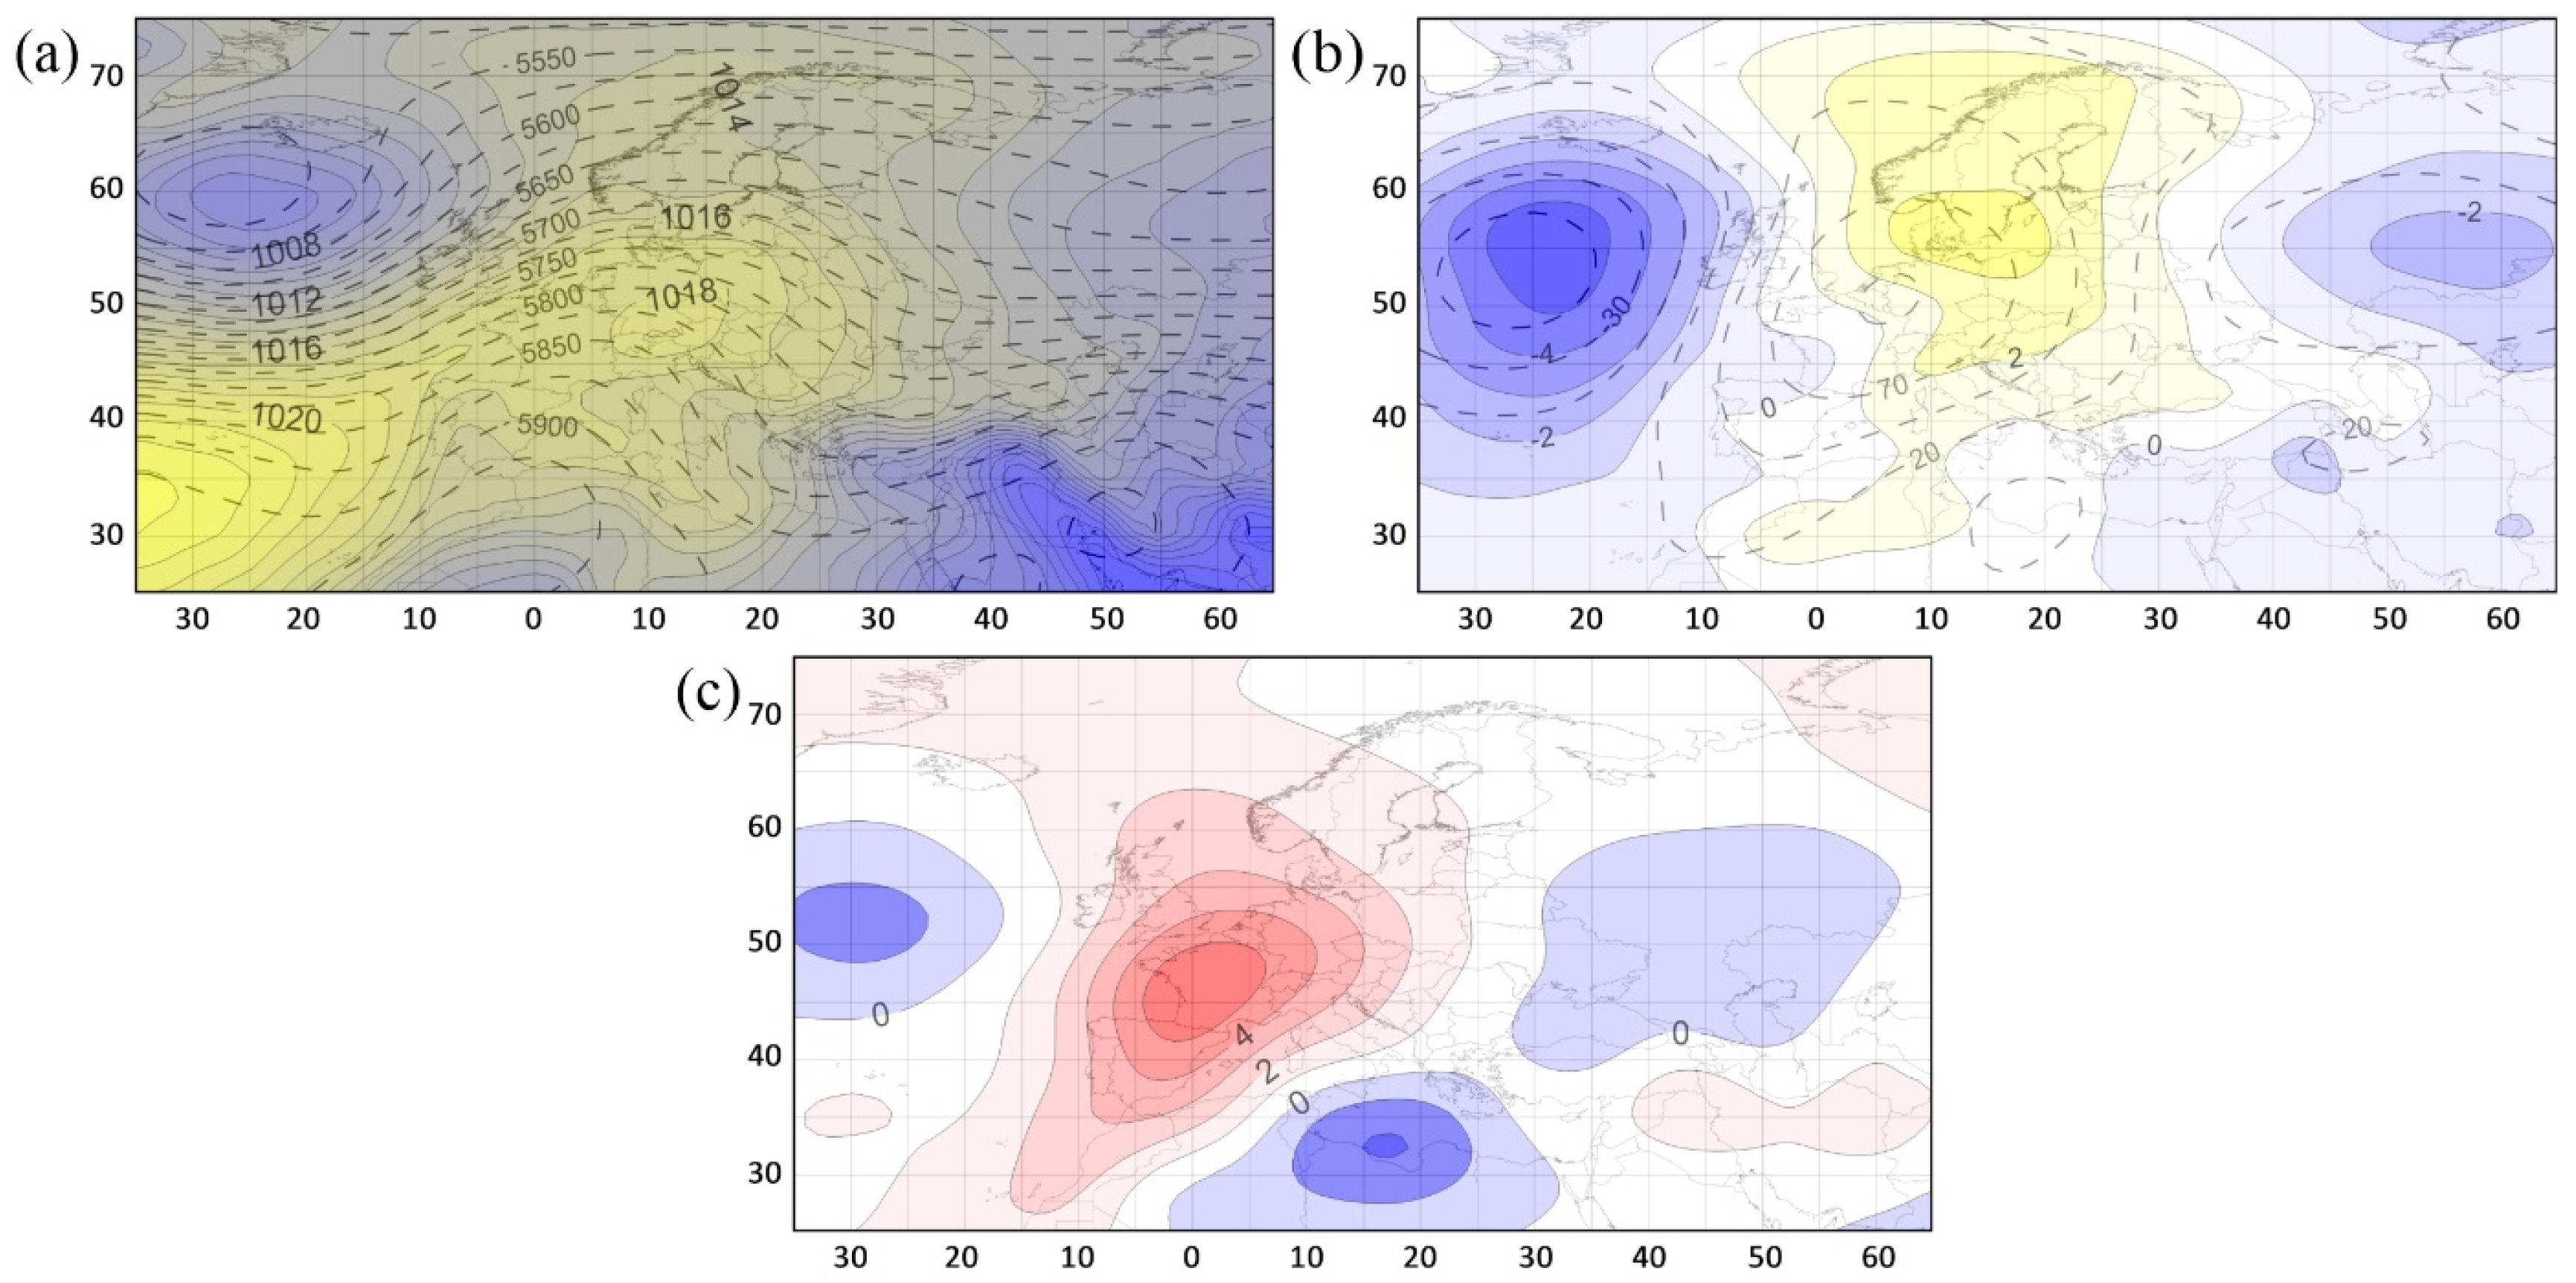
Type 2 including 119 days reveals a different pattern of z500 hPa and SLP anomalies. The most considerable positive anomalies were recorded over the British Isles (>150 m, >7 hPa) and they extended zonally westward and eastward. In type 2 a ridge of high pressure laying over Europe was shifted more to the northwest than in type 1, and there was a bigger horizontal gradient of pressure over the research area (
Figure 8). The majority of the continent was within reach of positive T850 anomalies and their maximum was observed over the research area (in the centre >5 °C). This system caused the inflow of air masses from the east and southeast.
Higher T850 anomalies over the entire research area are observed in type 1 (>5 °C), while in type 2 the centre of positive anomalies is shifted westwards; therefore, over most of the research area, T850 anomalies range from 2 °C to 5 °C. Therefore, the most severe and longest HWs in Western and Southwestern Europe are caused by synoptic type 1. Two examples of severe HWs are described in detail in the next section.
3.3. Case Studies of the Most Severe Heat Waves of 2003 and 2006
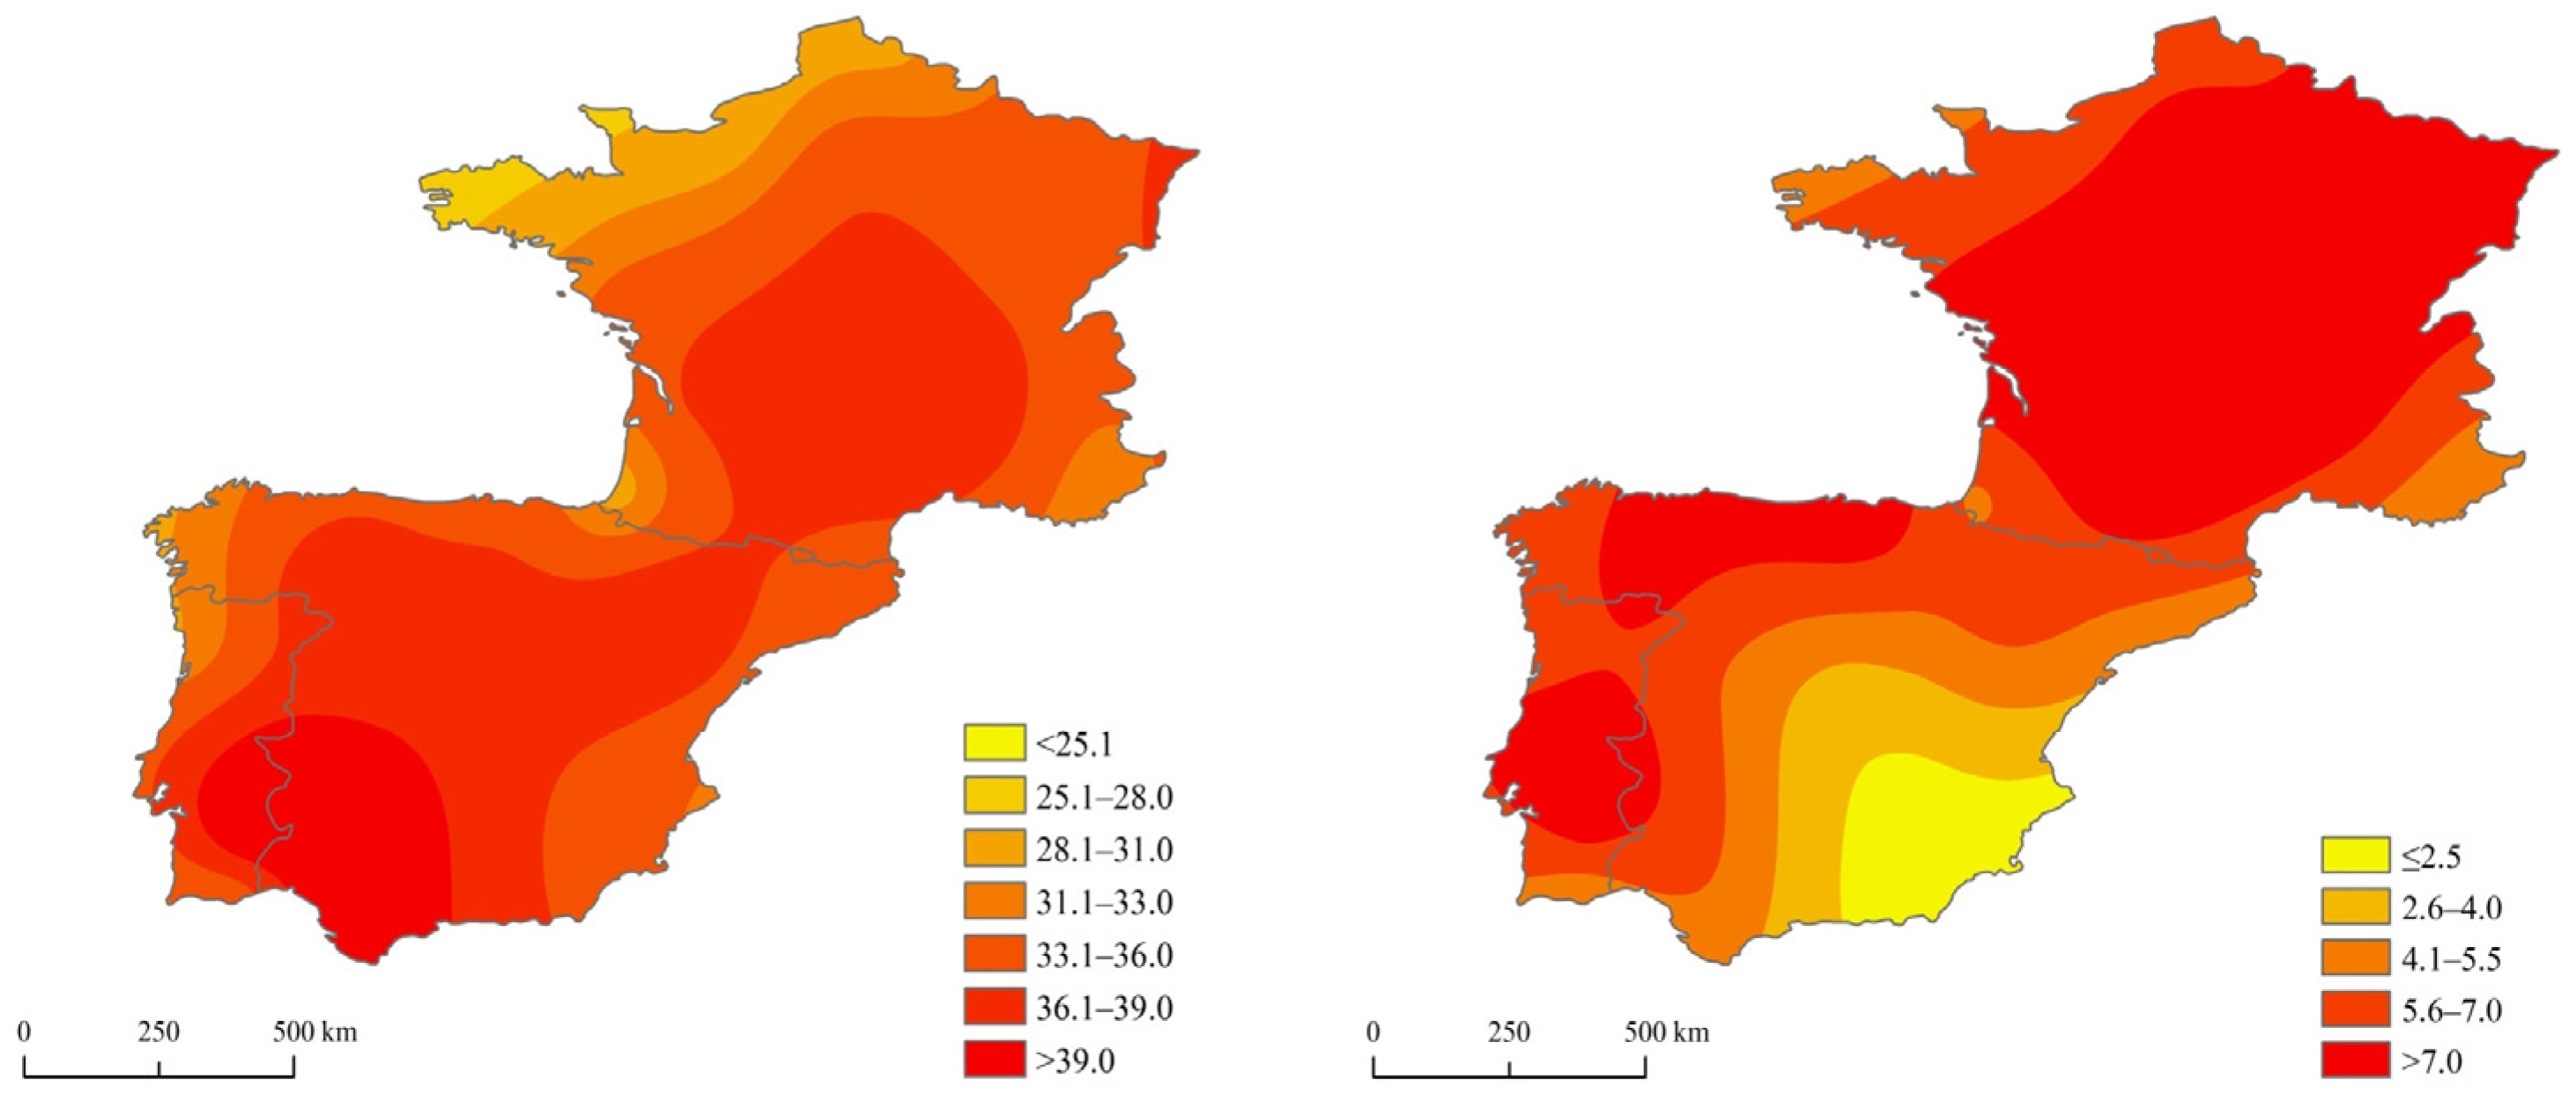
The HW of 2003 was observed within the research area from 29 July to 14 August. The longest HW in the aforementioned year occurred in Nice and lasted from 14 July to 31 August (49 days). An HW of similar length was observed in Barcelona, where it lasted from 18 July to 30 August (44 days). Considering the real HW length in particular stations, the highest mean Tmax was recorded in Seville (42.0 °C) and in Beja (40.9 °C), while the lowest was in Brest (29.1 °C) and Nice (30.8 °C) (
Figure 9). On the other hand, when taking the mean Tmax of the period 29 July–14 August into consideration, it ranged from 26.1 °C in Brest to 42.3 °C in Seville. On the abovementioned days, the Tmax was on average higher by 6.2 °C than the mean for this period within the analysed period 1976–2015. The highest anomalies were recorded in central and eastern France, with the maximum in Nancy (9.1 °C), Dijon and Paris (8.6 °C), and Toulouse (8.2 °C).
The HW of 2003 was accompanied with strong positive anomalies of z500 hPa over the whole of Europe (
Figure 10). They exceeded 135 m in the centre located over France, southern Germany and the southern part of the British Isles. The centre of positive SLP anomalies was shifted to the north and located over Scandinavia. Higher-than-normal SLP over Western Europe formed a ridge of high pressure encompassing most of the continent.
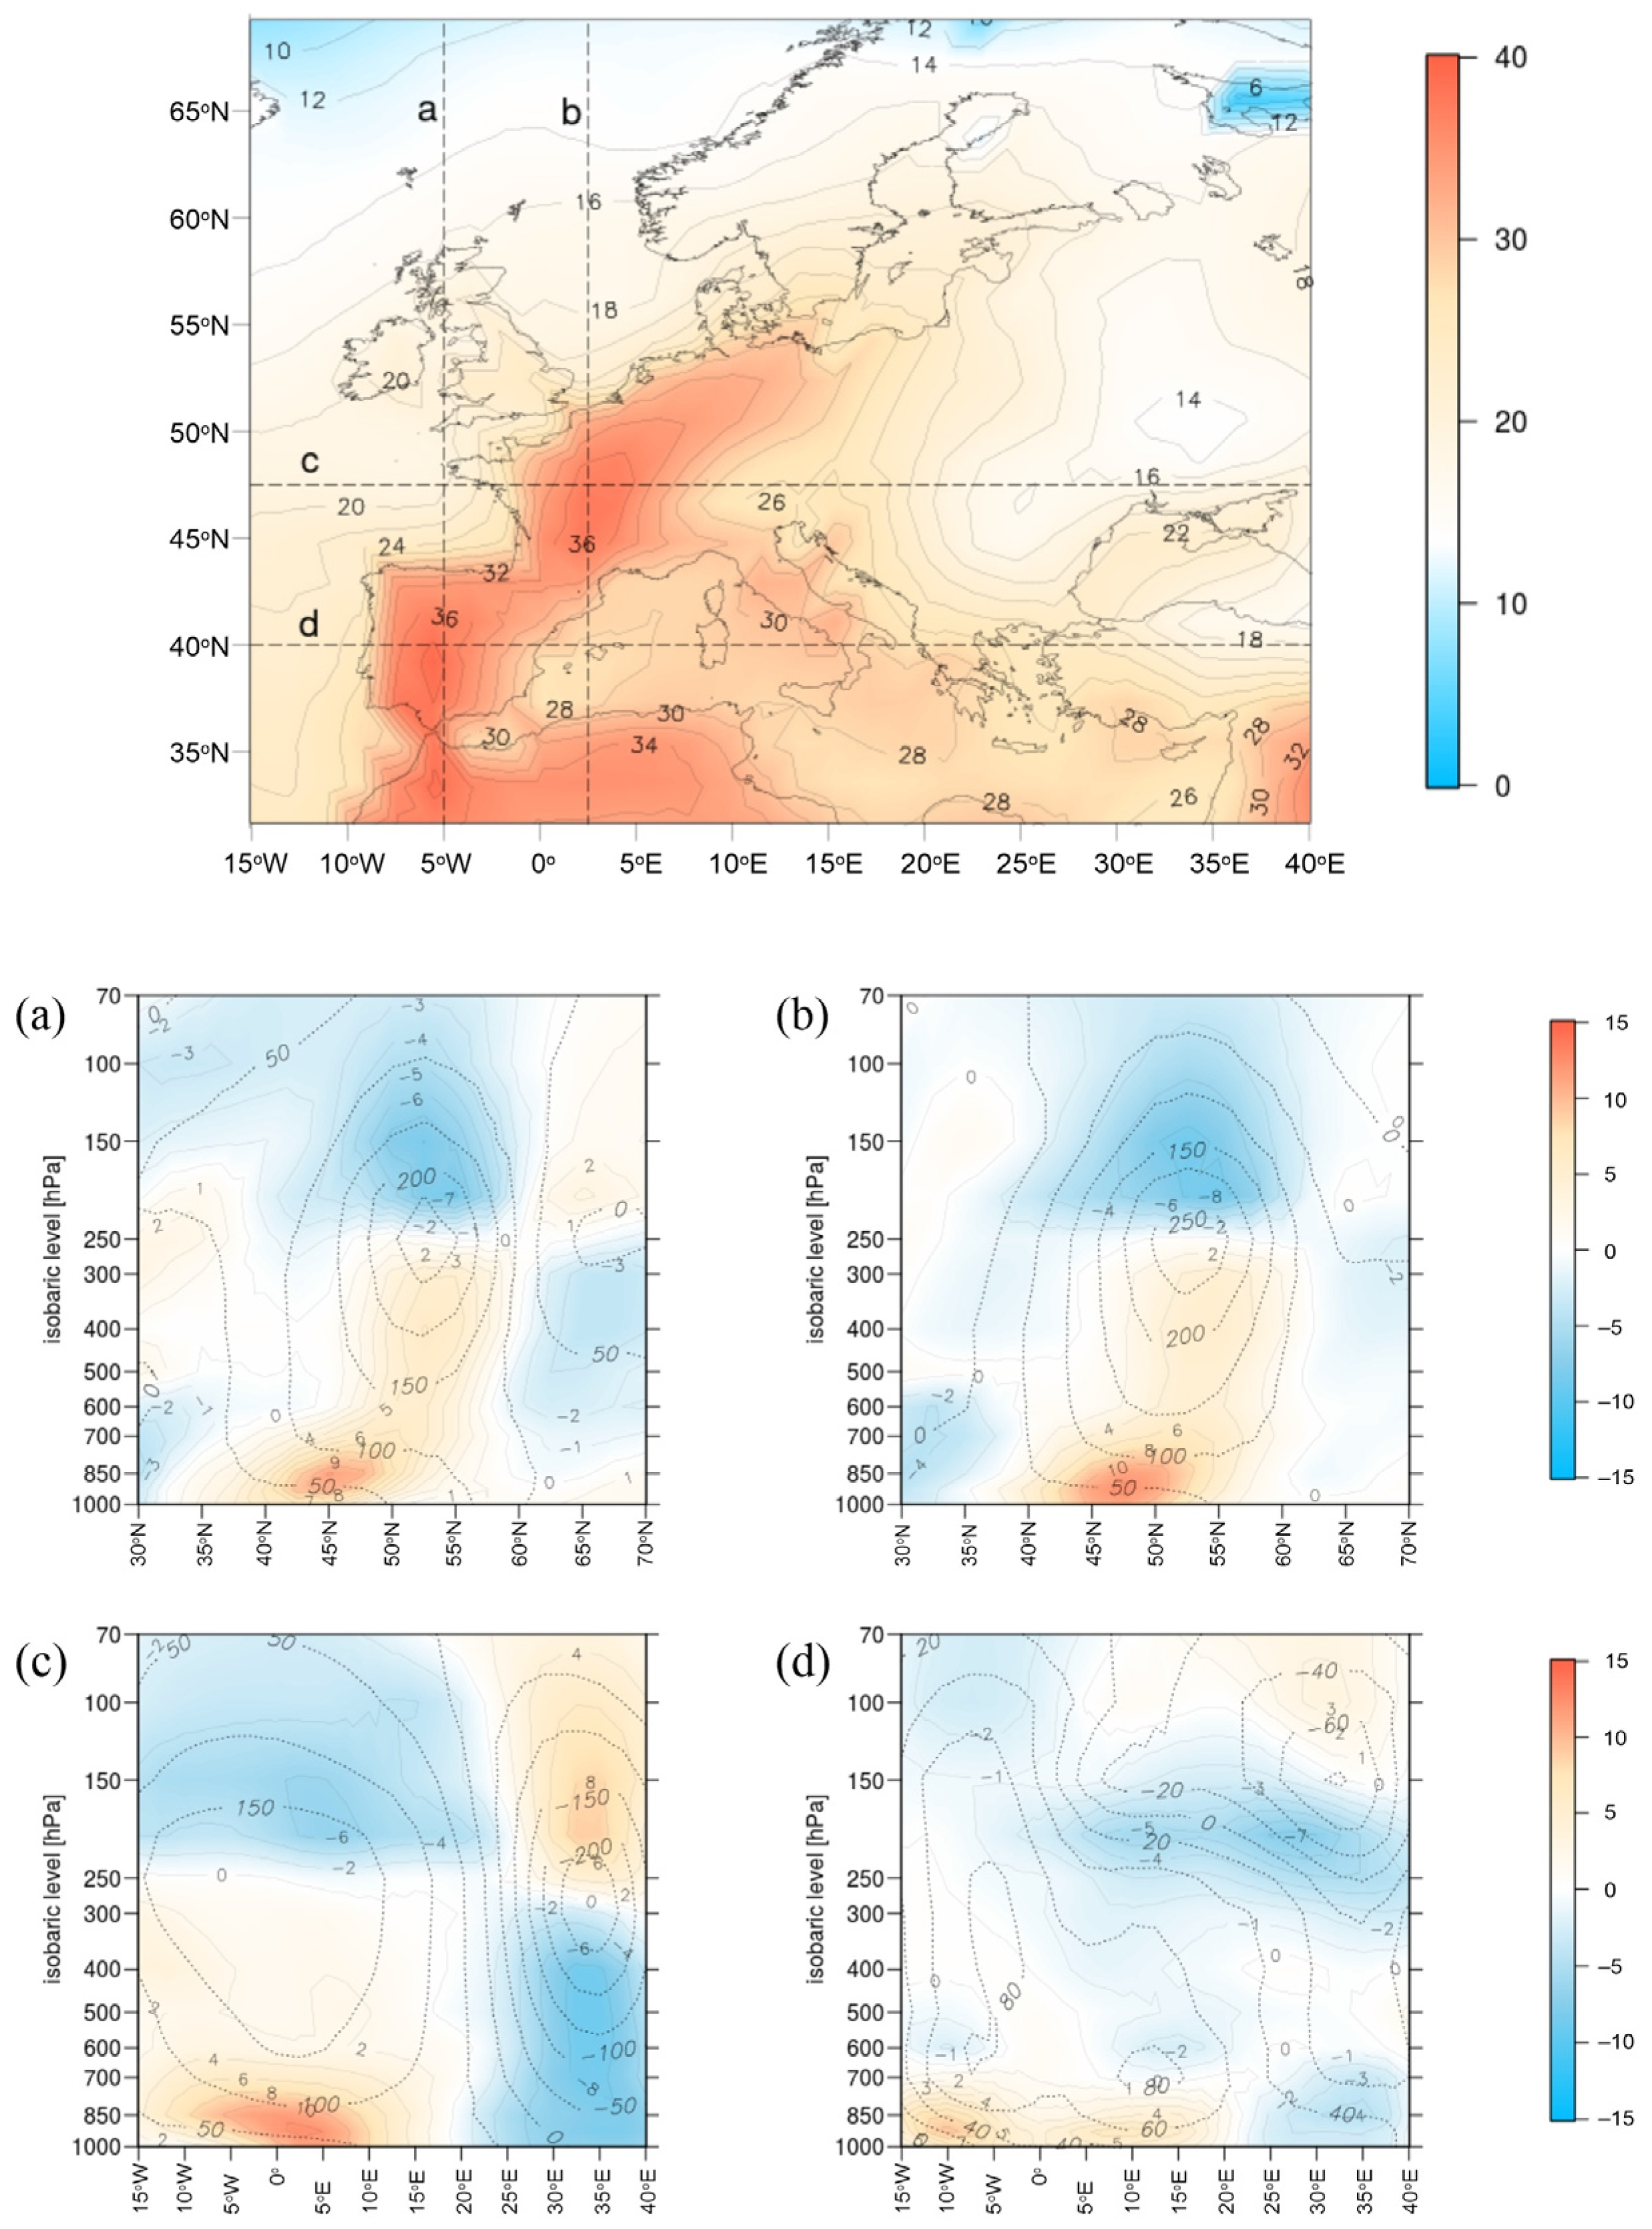
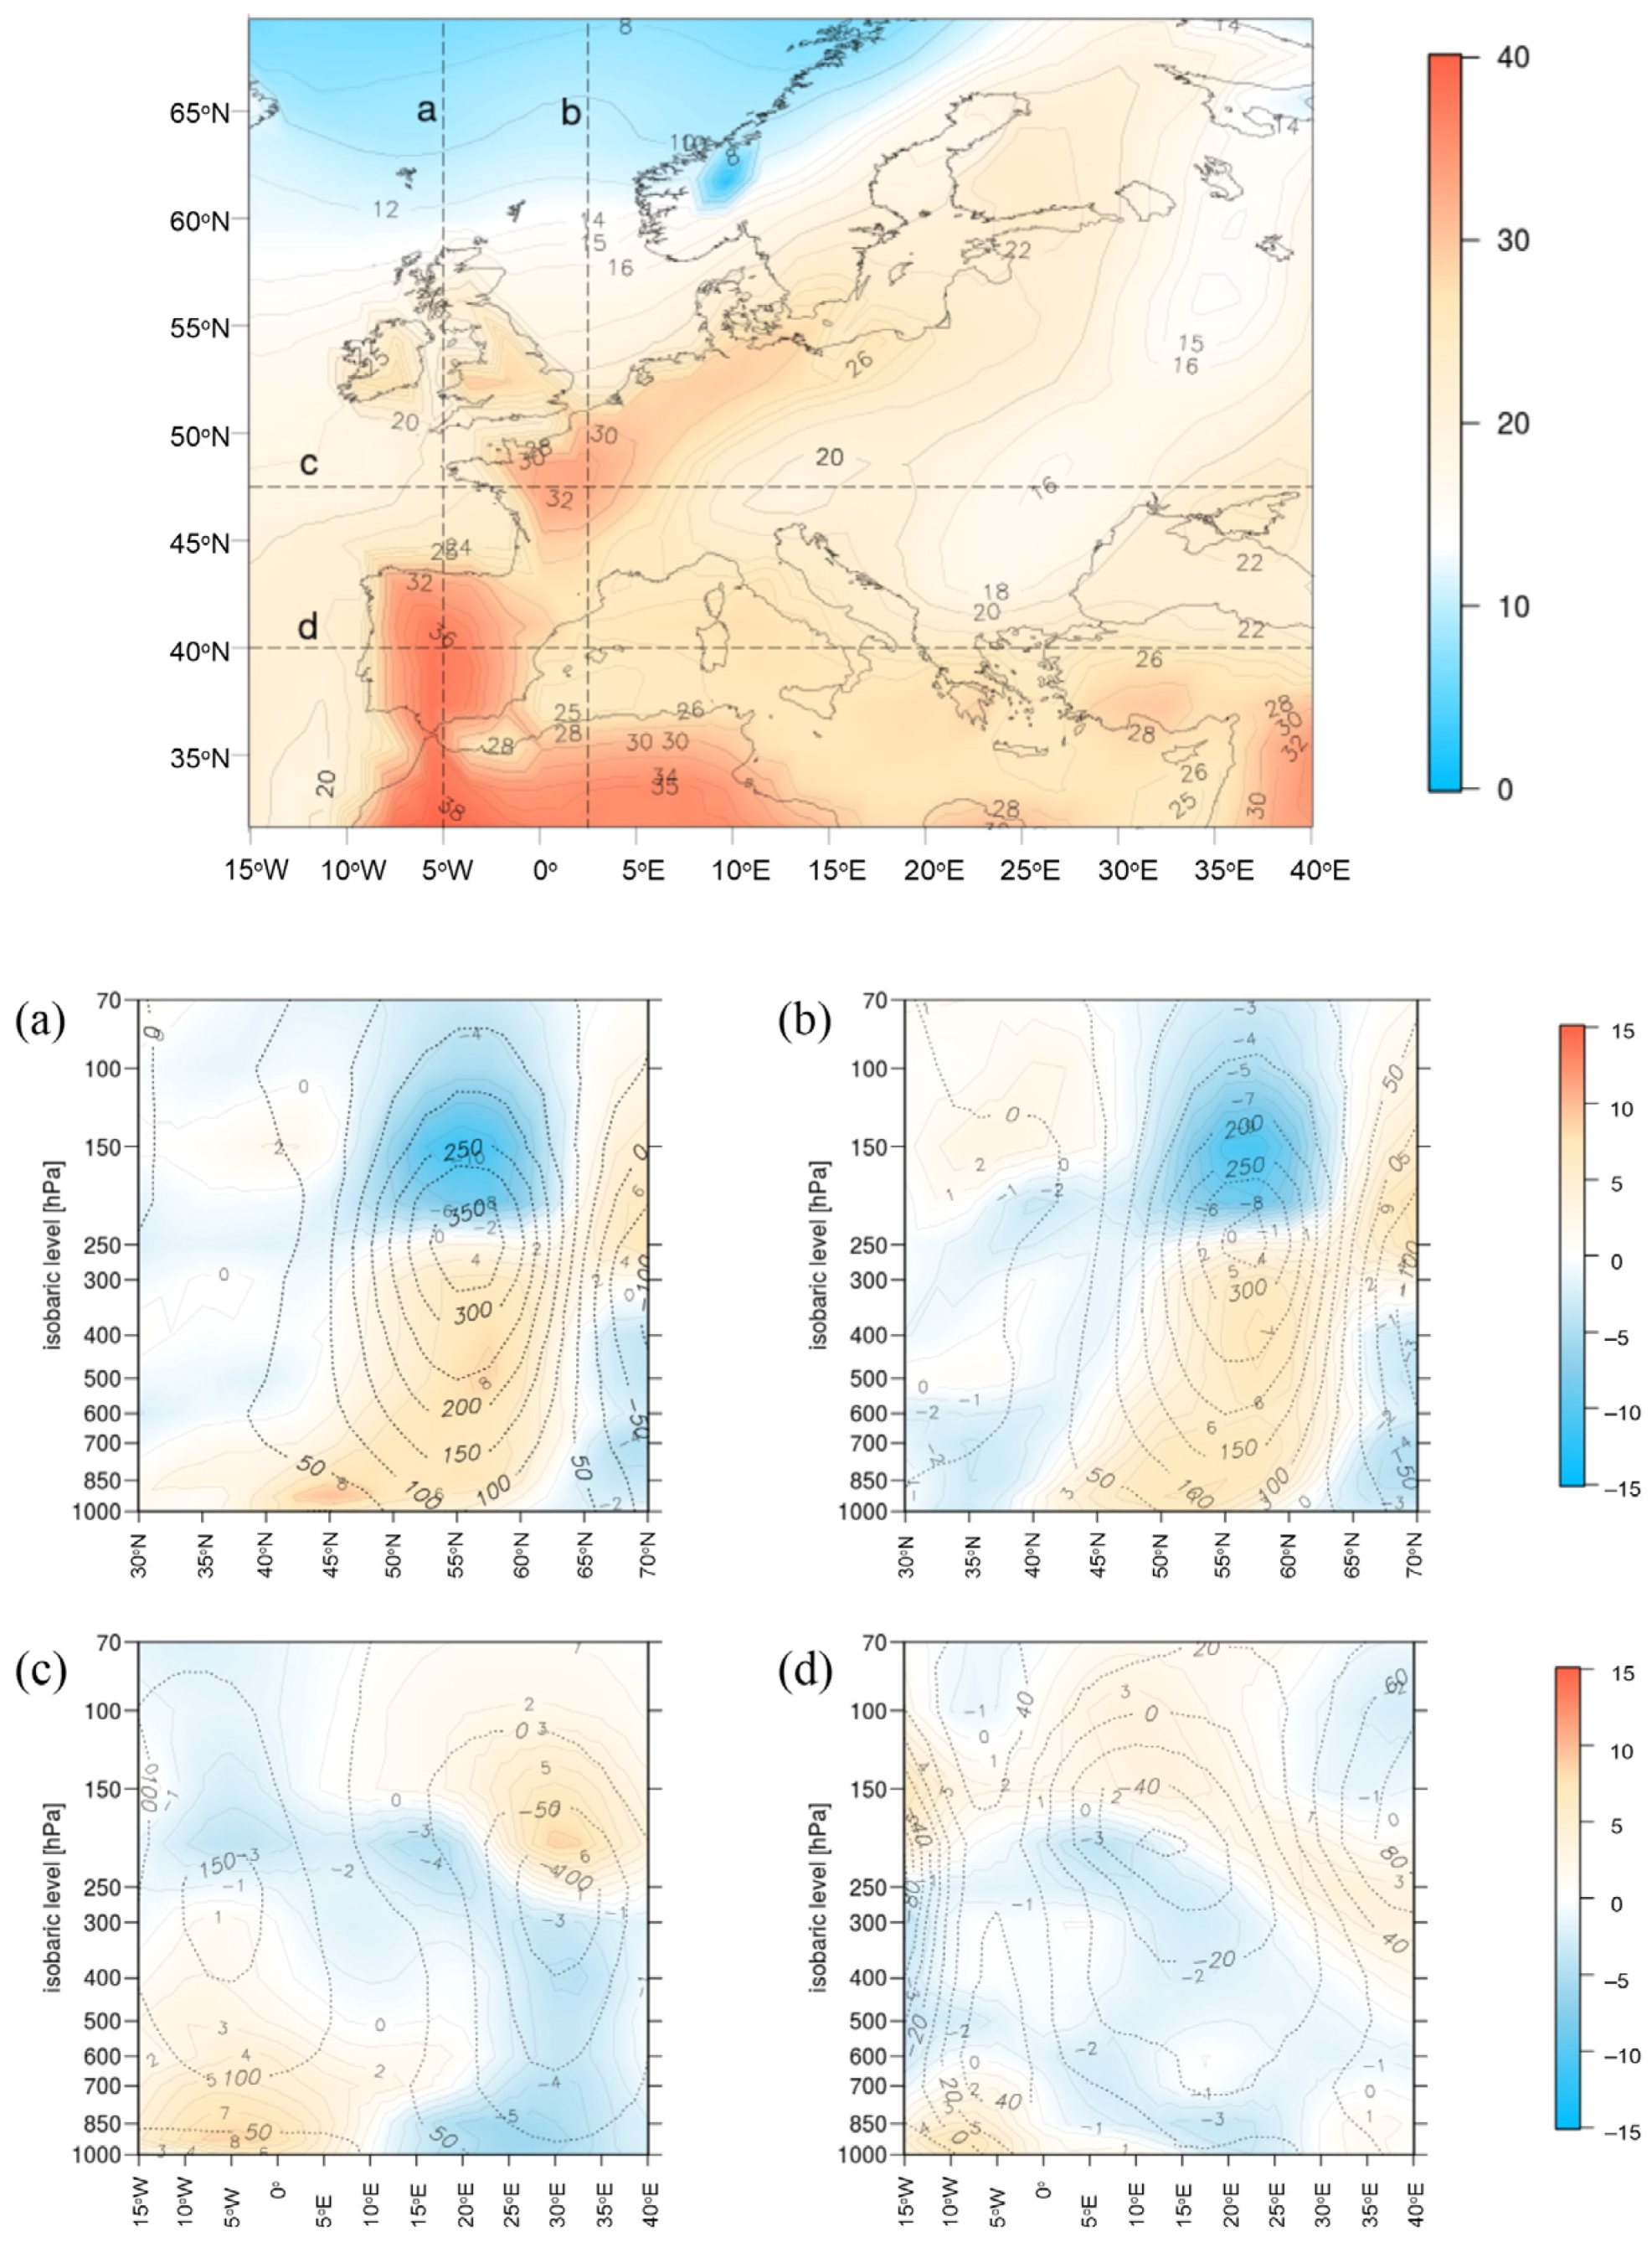
The vertical sections through the troposphere constructed for 12 August, which was one of the hottest day during the 2003 HW, show positive height anomalies occurring at every isobaric level over the areas of HW occurrence. The maximum values, exceeding 250 m, were observed for 300–250 hPa geopotential height (
Figure 11). This means that the strongest signal of HW presence, concerning anomalies in the pressure field, was detected in the upper troposphere at an approximate height of 10 km. The highest positive T850 anomalies were recorded over northwestern France (exceeding 9.5°C). In the parallel and meridional tropospheric sections, the most considerable air temperature positive anomalies were observed at the lowest isobaric levels 1000–850 hPa (maximum >12 °C). Opposite anomalies of air temperature were observed in the upper troposphere, where the geopotential heights were shifted upward. Positive anomalies of the geopotential height mean lower air temperature is at an appropriate geopotential level. Therefore, the strongest negative anomalies of the air temperature (even <−8°C) were found right over the maximum positive anomalies of geopotential heights. The described pattern of air temperature anomalies can be explained by the scheme of the anticyclonic dynamic. In its upper part, the horizontal convergence of air masses that are initially cold results in negative temperature anomalies. Positive anomalies in the lower part are caused by the process of subsidence during the vertical motions activating strong adiabatic heating. Between the areas of negative and positive temperature anomalies a clear border area, corresponding to the maximum geopotential anomaly, occurs.
The HW of 2006, on average, occurred in the analysed area between 10 and 28 July. Its longest duration was 26 days (from 10 July to 4 August), in Barcelona and in Nice 25 days (from 10 July to 3 August). Considering the real HW length in the particular stations, the highest mean Tmax was recorded in Seville (40.8 °C) and Beja (39 °C), while the lowest was in Brest (28.4 °C) and Caen (29.7 °C) (
Figure 12). On the other hand, taking the mean Tmax from the period 10–28 July into consideration, it ranged from 24.7 °C in Brest to 38.8 °C in Seville. During the discussed HW, Tmax was on average higher by 4 °C than the mean for this period in the analysed years. The most considerable anomalies were observed in northeastern and central France, with the maximum in Nancy (6.6 °C), Paris (6.5 °C), Dijon (6.2 °C) and Lille (6.1 °C).
During the HW of 2006, the centres of positive both z500 hPa and SLP anomalies were located over the North Sea, exceeding 145 m and 7 hPa, respectively. In consequence, a local anticyclone formed in this region, exceeding 1021 hPa in the centre (
Figure 13).
Positive height anomalies computed for the hottest day (17 July 2006) were found at all the analysed isobaric levels over the area witnessing a HW. The most considerable positive anomalies occurred at 300–200 hPa, and they amounted to 350 m (
Figure 14). Over the majority of the continent, there were positive T850 anomalies observed, and they reached the highest values over Western and Southwestern Europe. The centre of these anomalies was located over northern France (>6 °C). In the parallel and meridional tropospheric sections, the most considerable air temperature positive anomalies were observed at the lowest isobaric levels (maximum >8 °C). On the other hand, at the upper limit of the troposphere, temperature anomalies were negative (as many as <−10 °C) and—similarly to 12 August 2003—they appeared over the maximum positive anomalies of geopotential.
4. Discussion and Summary
The warming observed in Western and Southwestern Europe during the last 40 years translated into an increase in the number of hot days and, consequently, an increase in the frequency of HWs. The recorded changes are similar to the ones mentioned in previous research studies conducted in the Iberian Peninsula, where the mean gain in warm days between 1950 and 2006 oscillated around 1.6% ± 0.3% days per decade [
2] and was higher than the average increase in the global scale, which was 0.71% ± 0.35% days per decade [
46]. The indicated changes are concordant with the ones occurring in Central [
10], Northern [
47] and Southern Europe [
48]. Similar trends were shown by other authors carrying out their studies within particular countries, e.g., Czech Republic [
49], Portugal [
3], Serbia [
8] and Ukraine [
7].
The occurrence of HWs in Western and Southwestern Europe was related to positive anomalies of z500 hPa and SLP over Western Europe. Anticyclonic conditions over the studied area, due to subsidence of air masses, provided cloudless weather, which intensified solar radiation flux. Over the majority of the research areas, there were positive T850 anomalies. The research studies concerning circulation conditions causing the occurrence of HWs in many regions of Europe have shown that these occur mainly with anticyclonic weather conditions, which are conducive to strong insolation [
8,
20,
23,
50,
51,
52,
53]. The proved increase in the frequency and duration of heat waves may be related to more frequent high-pressure blocking situations in the first decade of the 21st century in Europe [
10,
20].
The occurrence of the most severe HWs of 2003 and 2006 was accompanied by strong positive anomalies of z500 hPa over Northwest Europe. In this area, positive SLP anomalies were also observed. In the case of both waves, the biggest T850 anomalies occurred over France. Similar patterns of z500 hPa and T850 anomalies were shown by Trigo et al. [
54], who analysed the HW of 2003. The detailed analysis of pressure conditions, namely identifying the vertical structure of geopotential height and temperature anomalies for the selected days, showed that strong positive anomalies of geopotential heights occurred in the middle and upper troposphere. On the other hand, the most considerable positive air temperature anomalies were recorded at the lowest isobaric levels. At the same time, negative temperature anomalies appeared in the upper troposphere right over the maximum positive anomalies of geopotentials. The described pattern of the air temperature anomalies can be explained by the scheme of the anticyclonic dynamic. In its upper part the horizontal convergence of air masses that are initially cold resulted in negative temperature anomalies. Positive anomalies in the lower part were caused by the process of subsidence during the vertical motions, activating strong adiabatic heating.
Similar results were obtained by Chen et al. [
9], who investigated atmospheric circulation during the selected HWs in China between 1981 and 2013. They proved that a strong signal of positive geopotential height anomalies in the upper troposphere is responsible for the surface heat wave and indicated the possibility of predicting the occurrence of HWs on the basis of observations of disturbances in the higher layers of the troposphere.


