
Temporal Variability of Source-Specific Solvent-Extractable Organic Compounds in Coastal Aerosols over Xiamen, China


Abstract
:1. Introduction
2. Experimental Methods
2.1. Aerosol Samples, Collections and Preparations
2.2. Bulk Analysis
2.3. Lipid Isolation and Analysis
2.4. Statistical Methods
3. Results
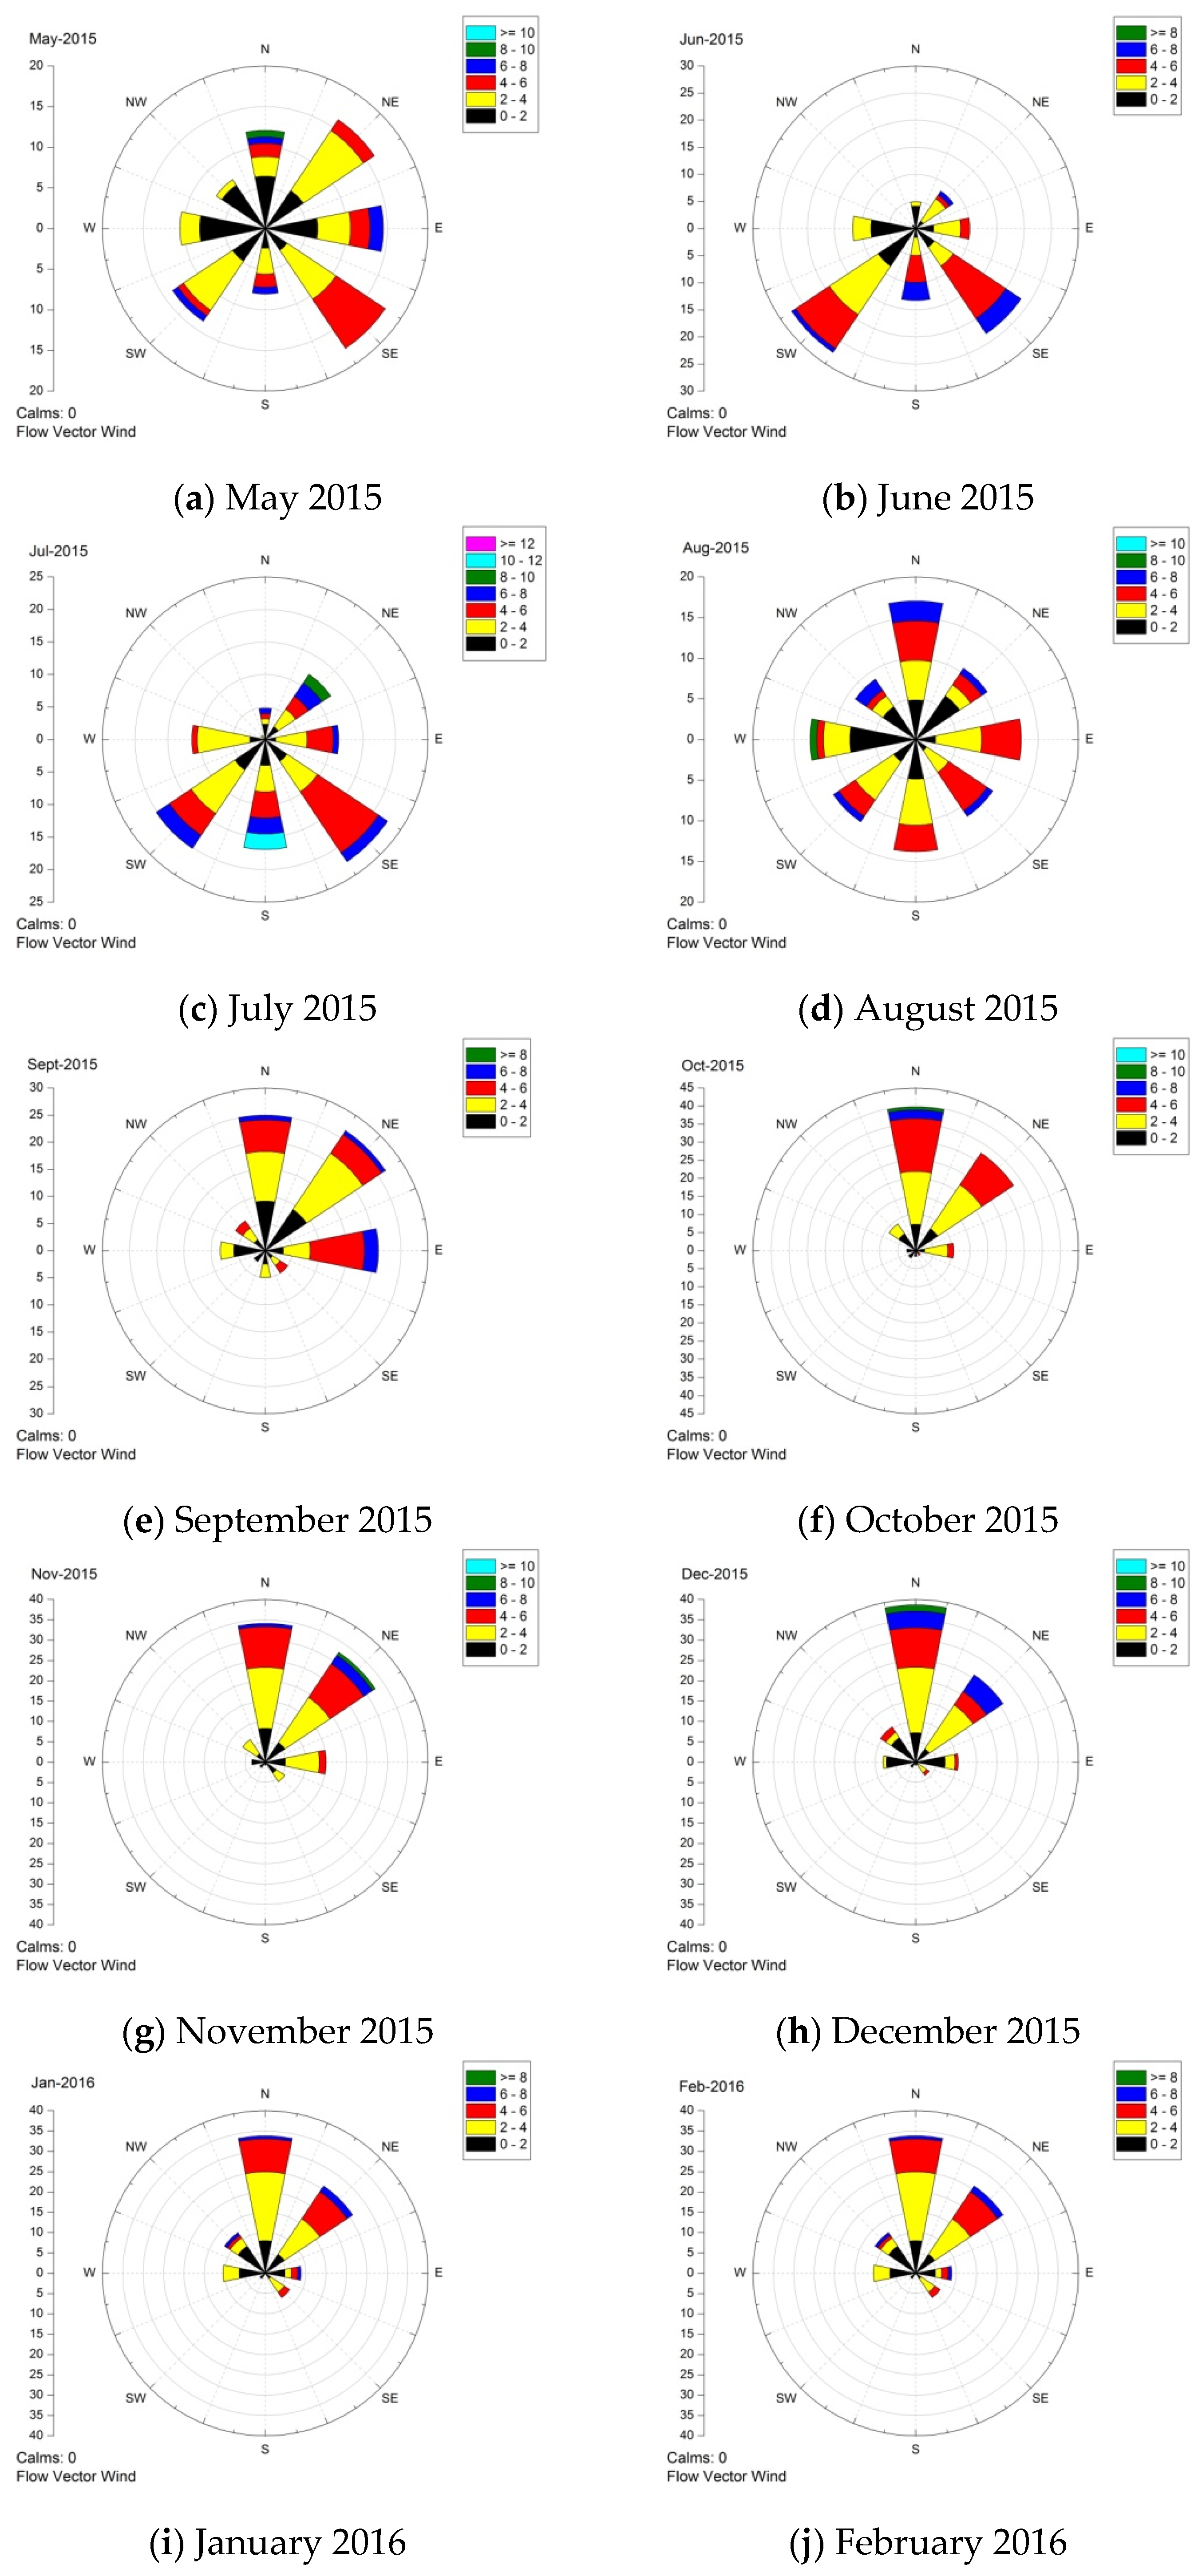
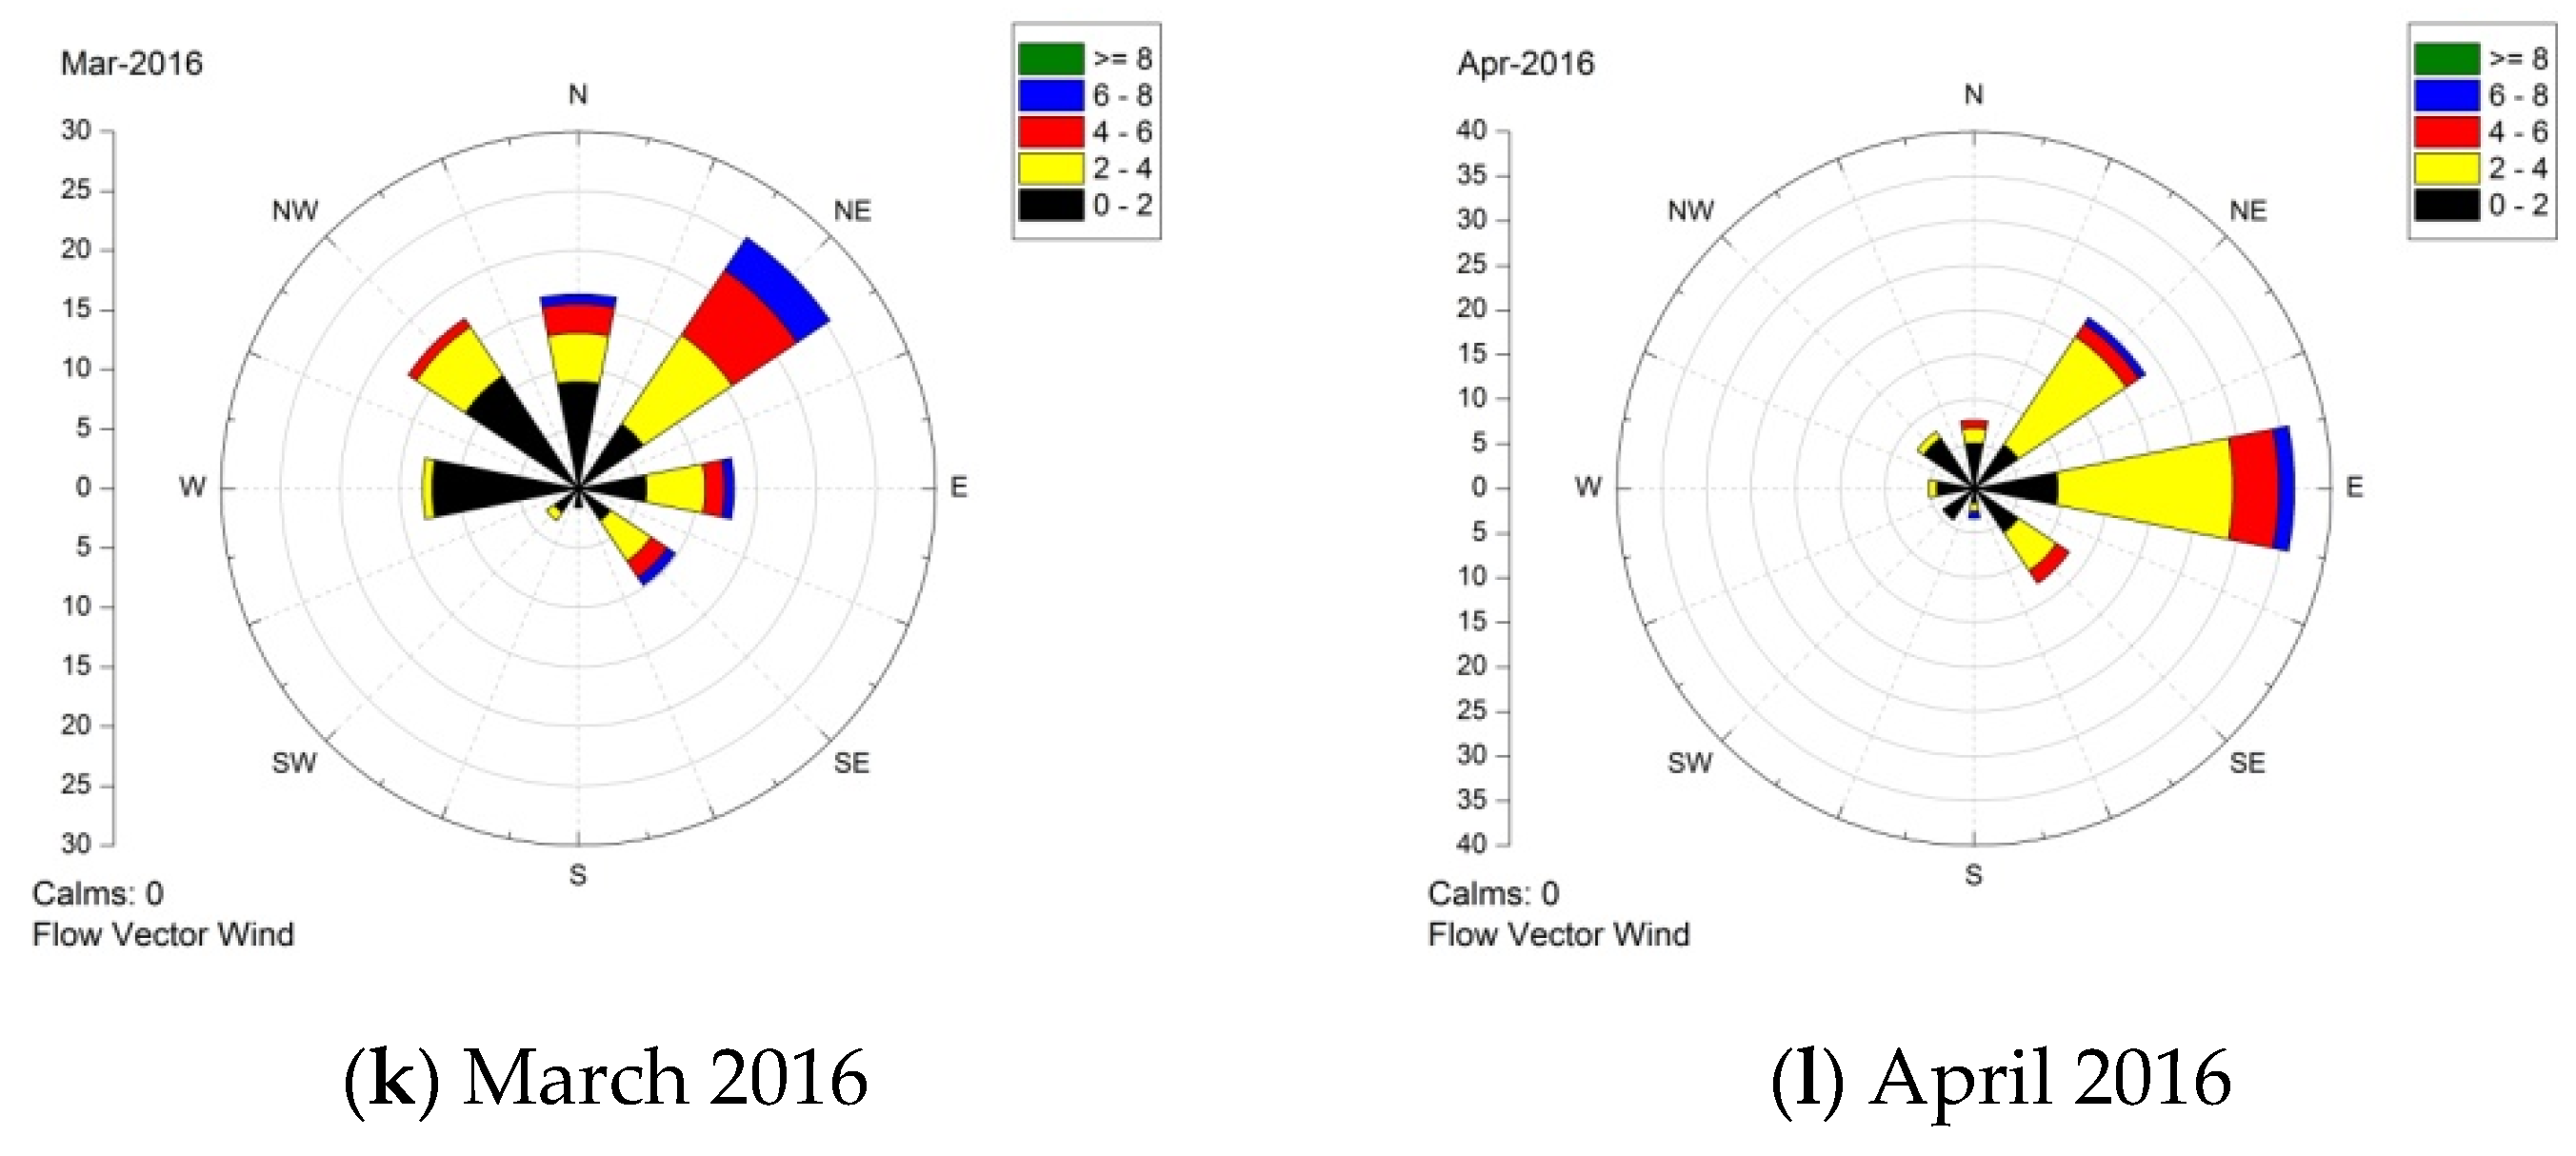
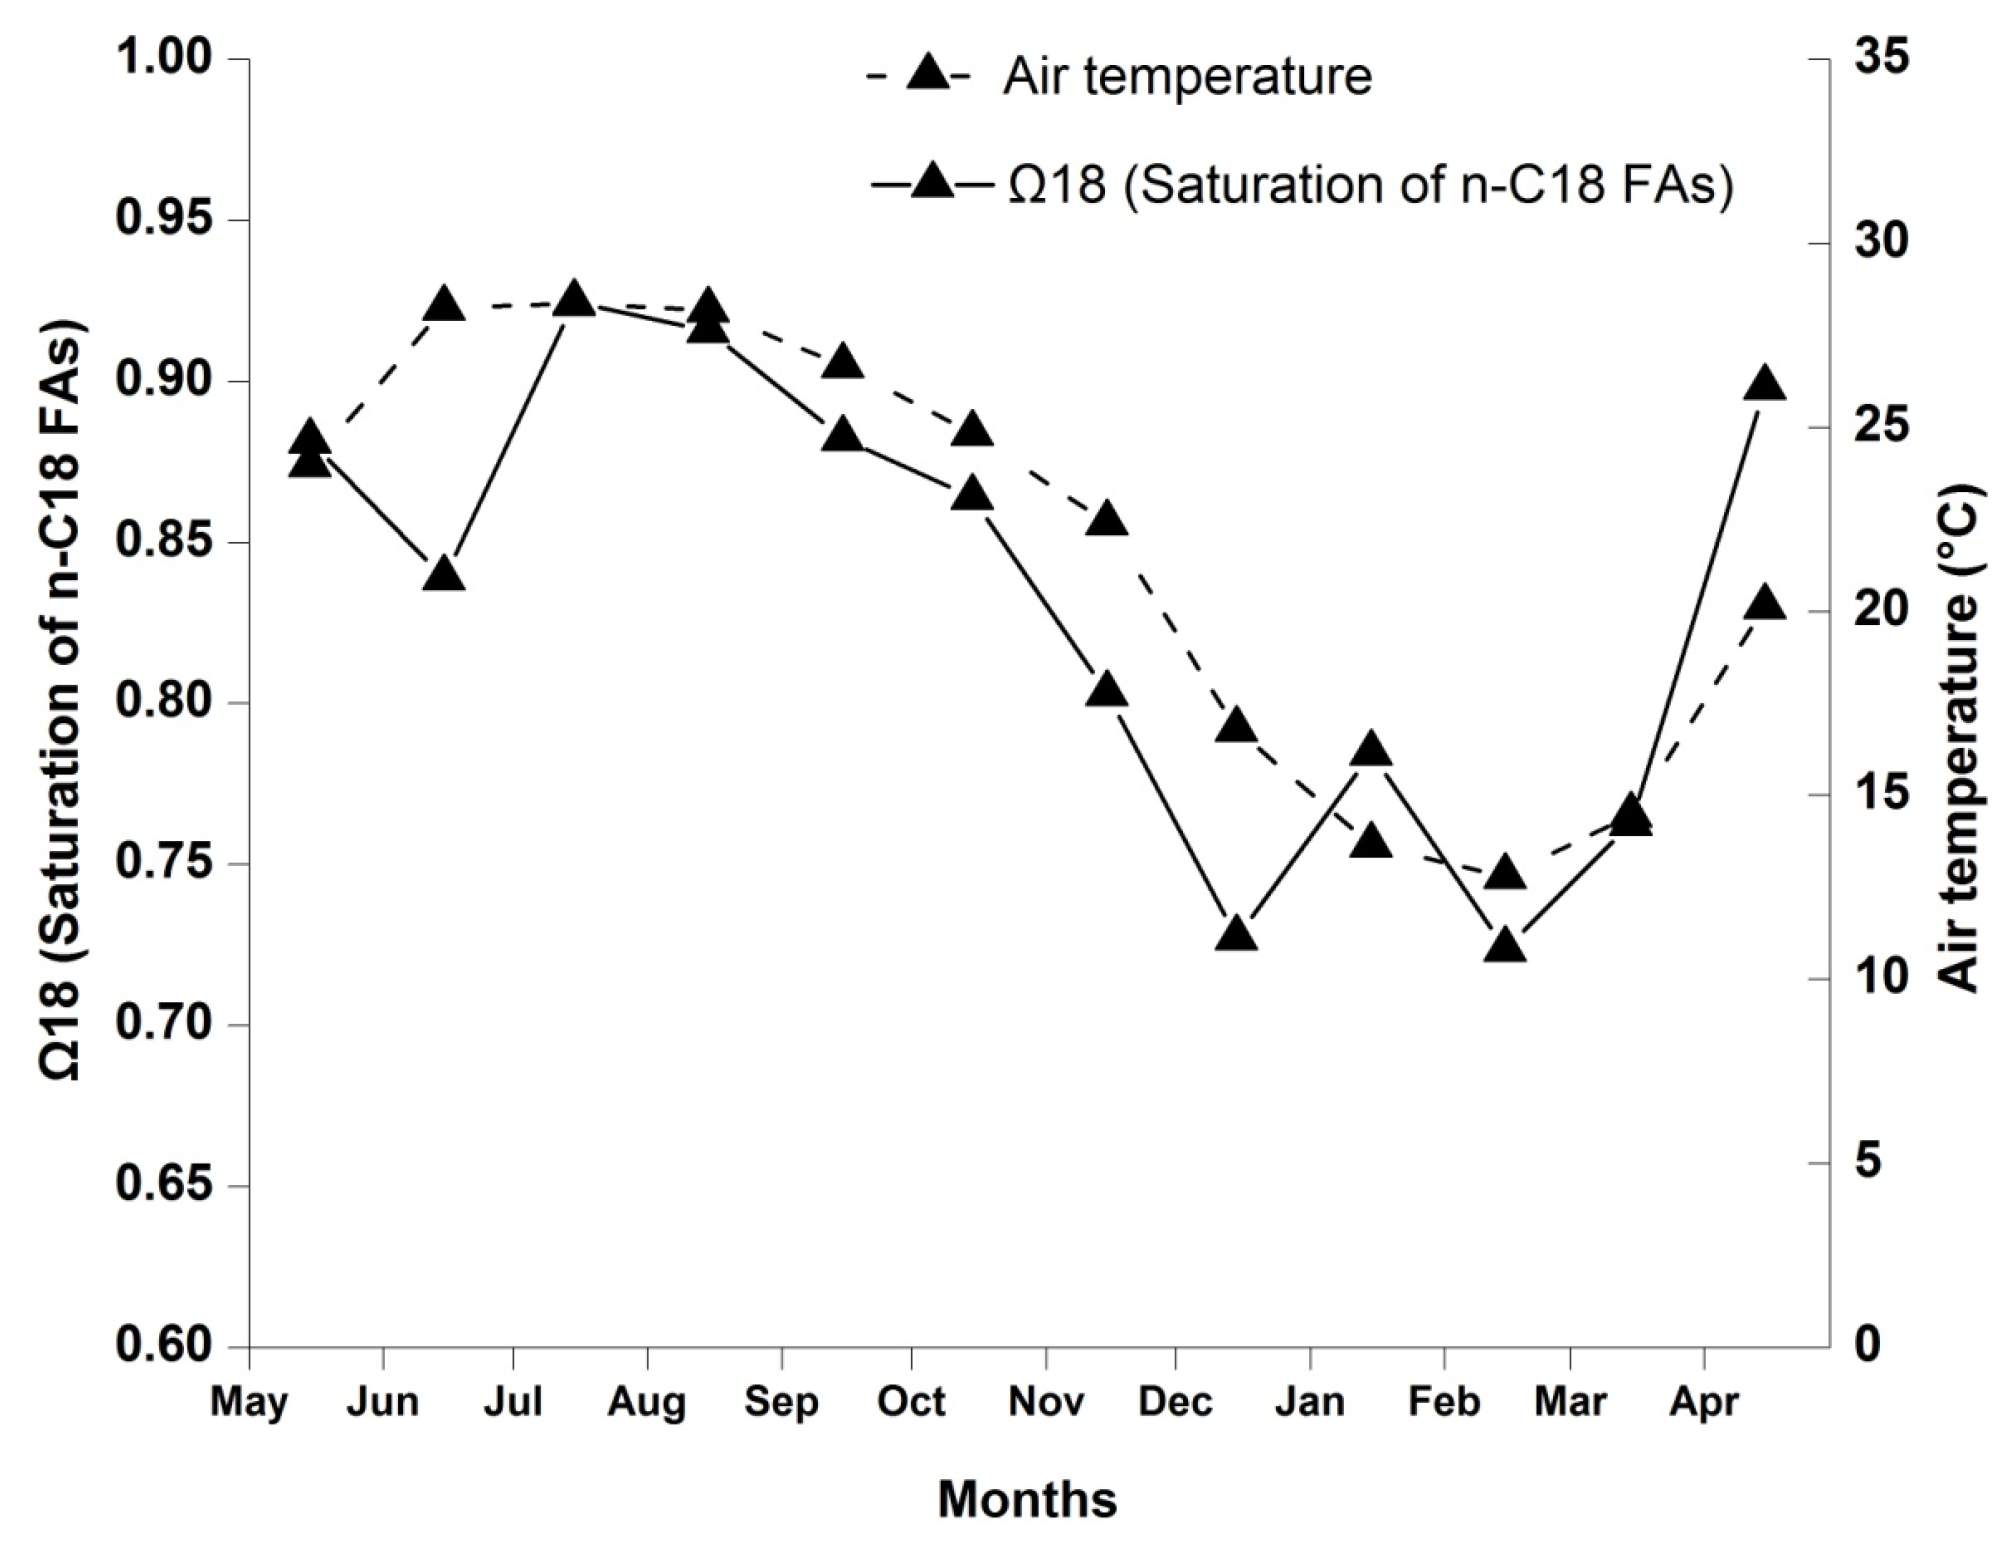
3.1. Meteorological Characteristics
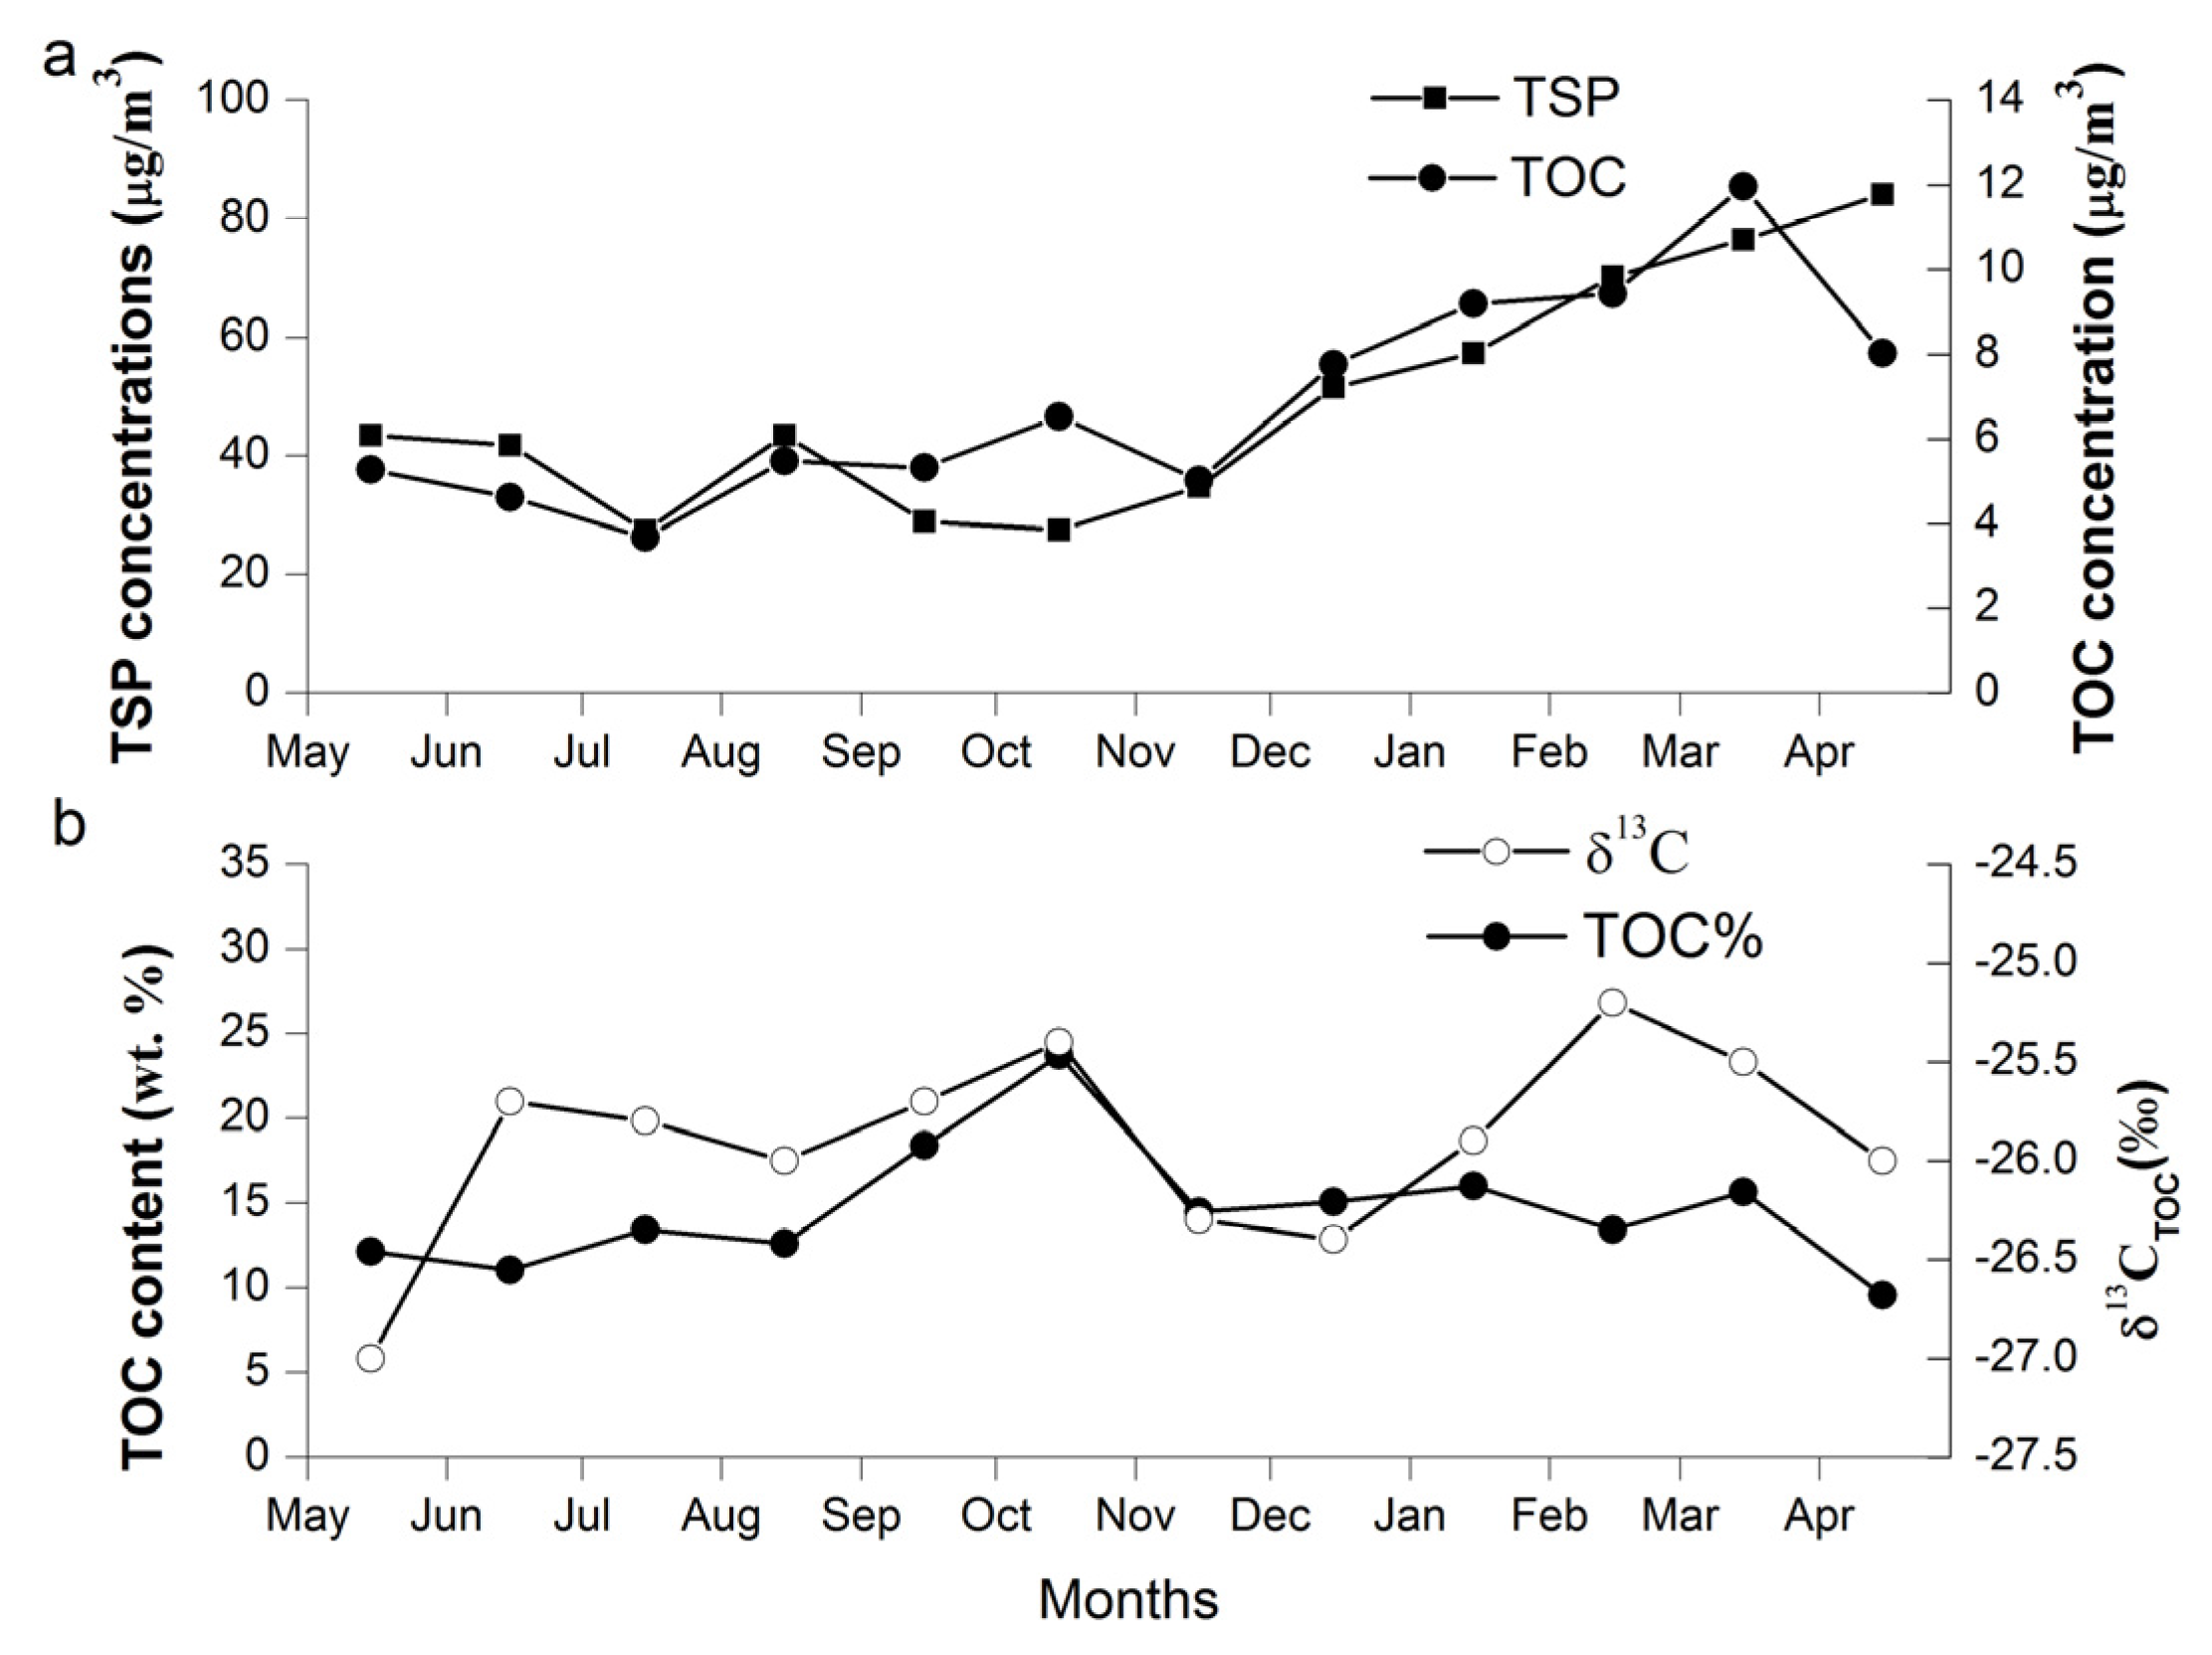
3.2. TSP and Bulk OC Yeilds
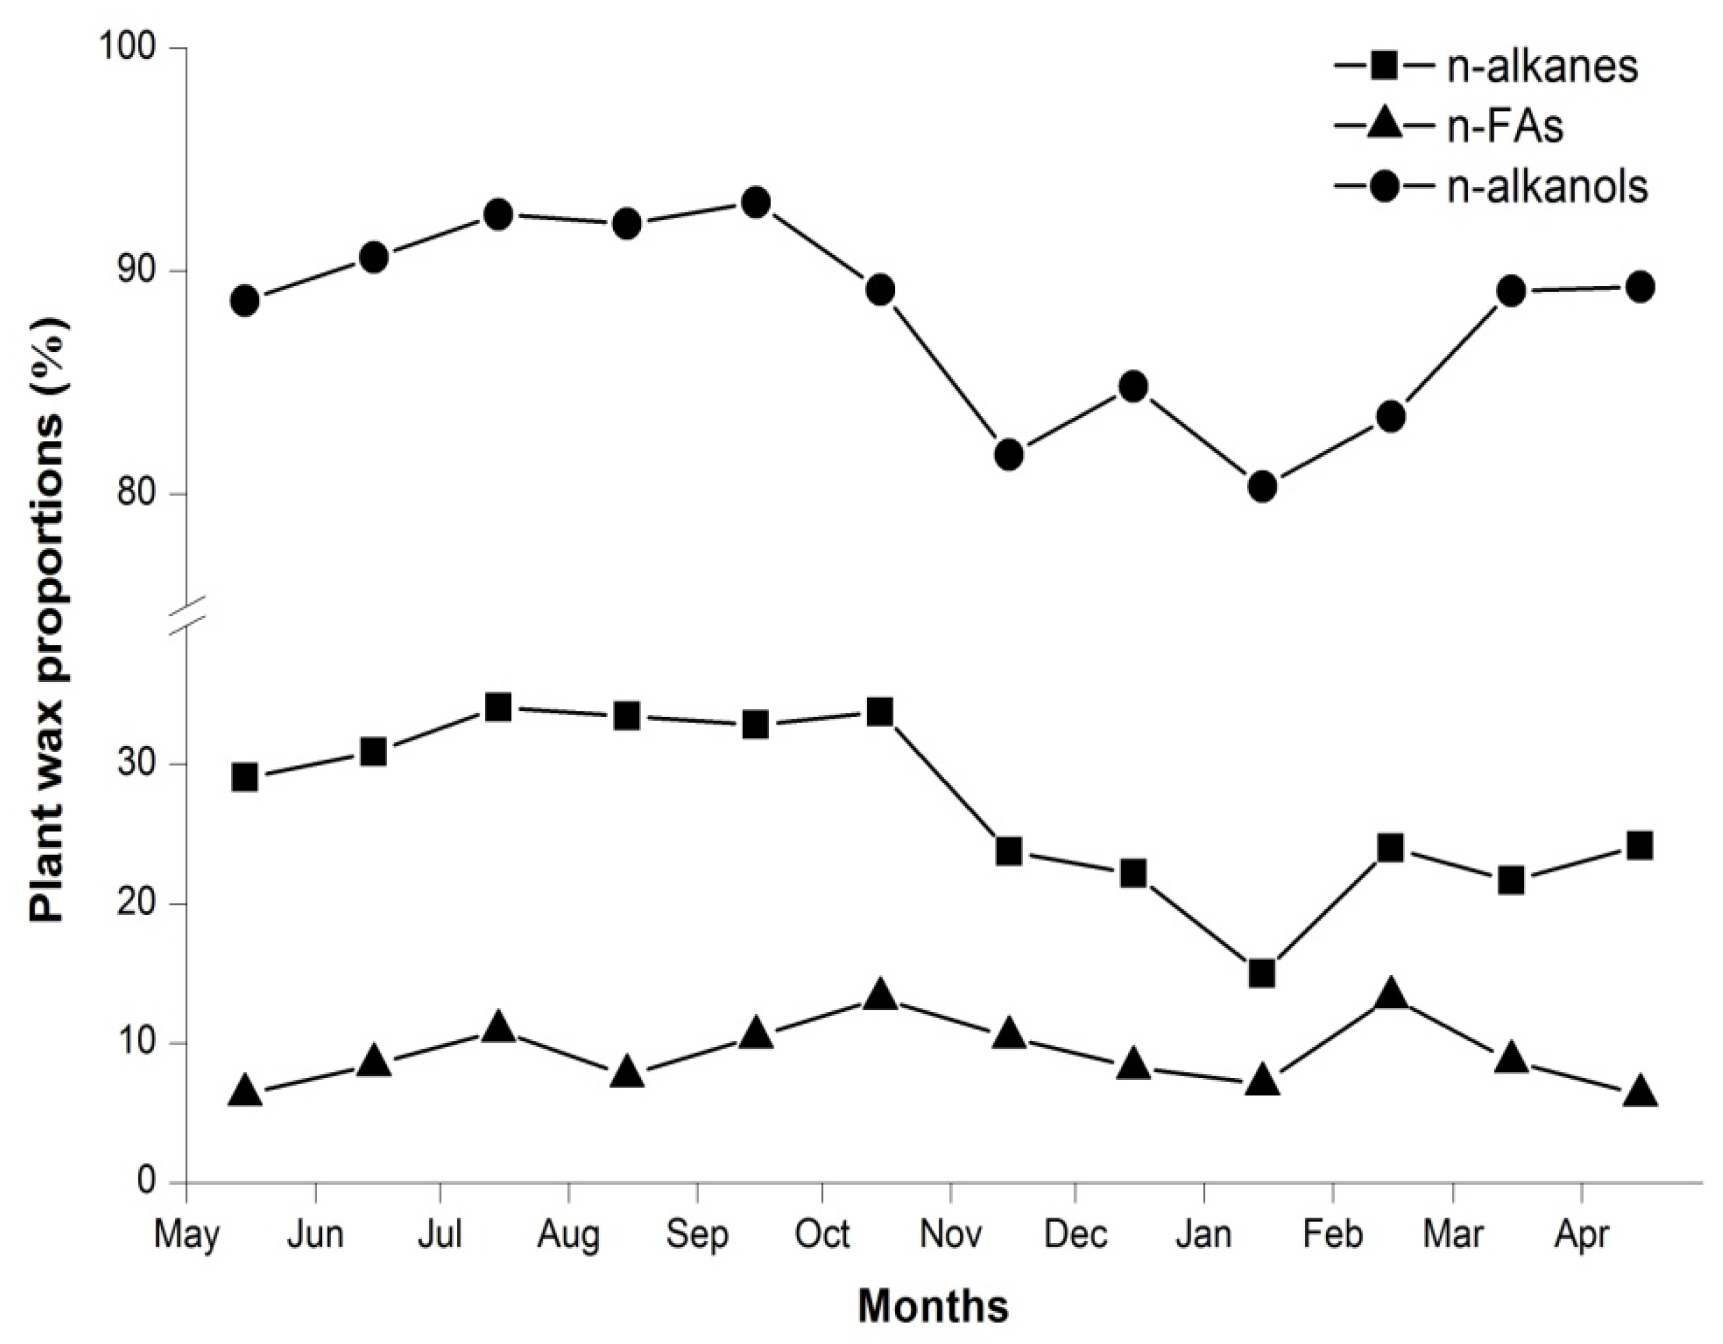
3.3. Various Lipid Biomarker Yields
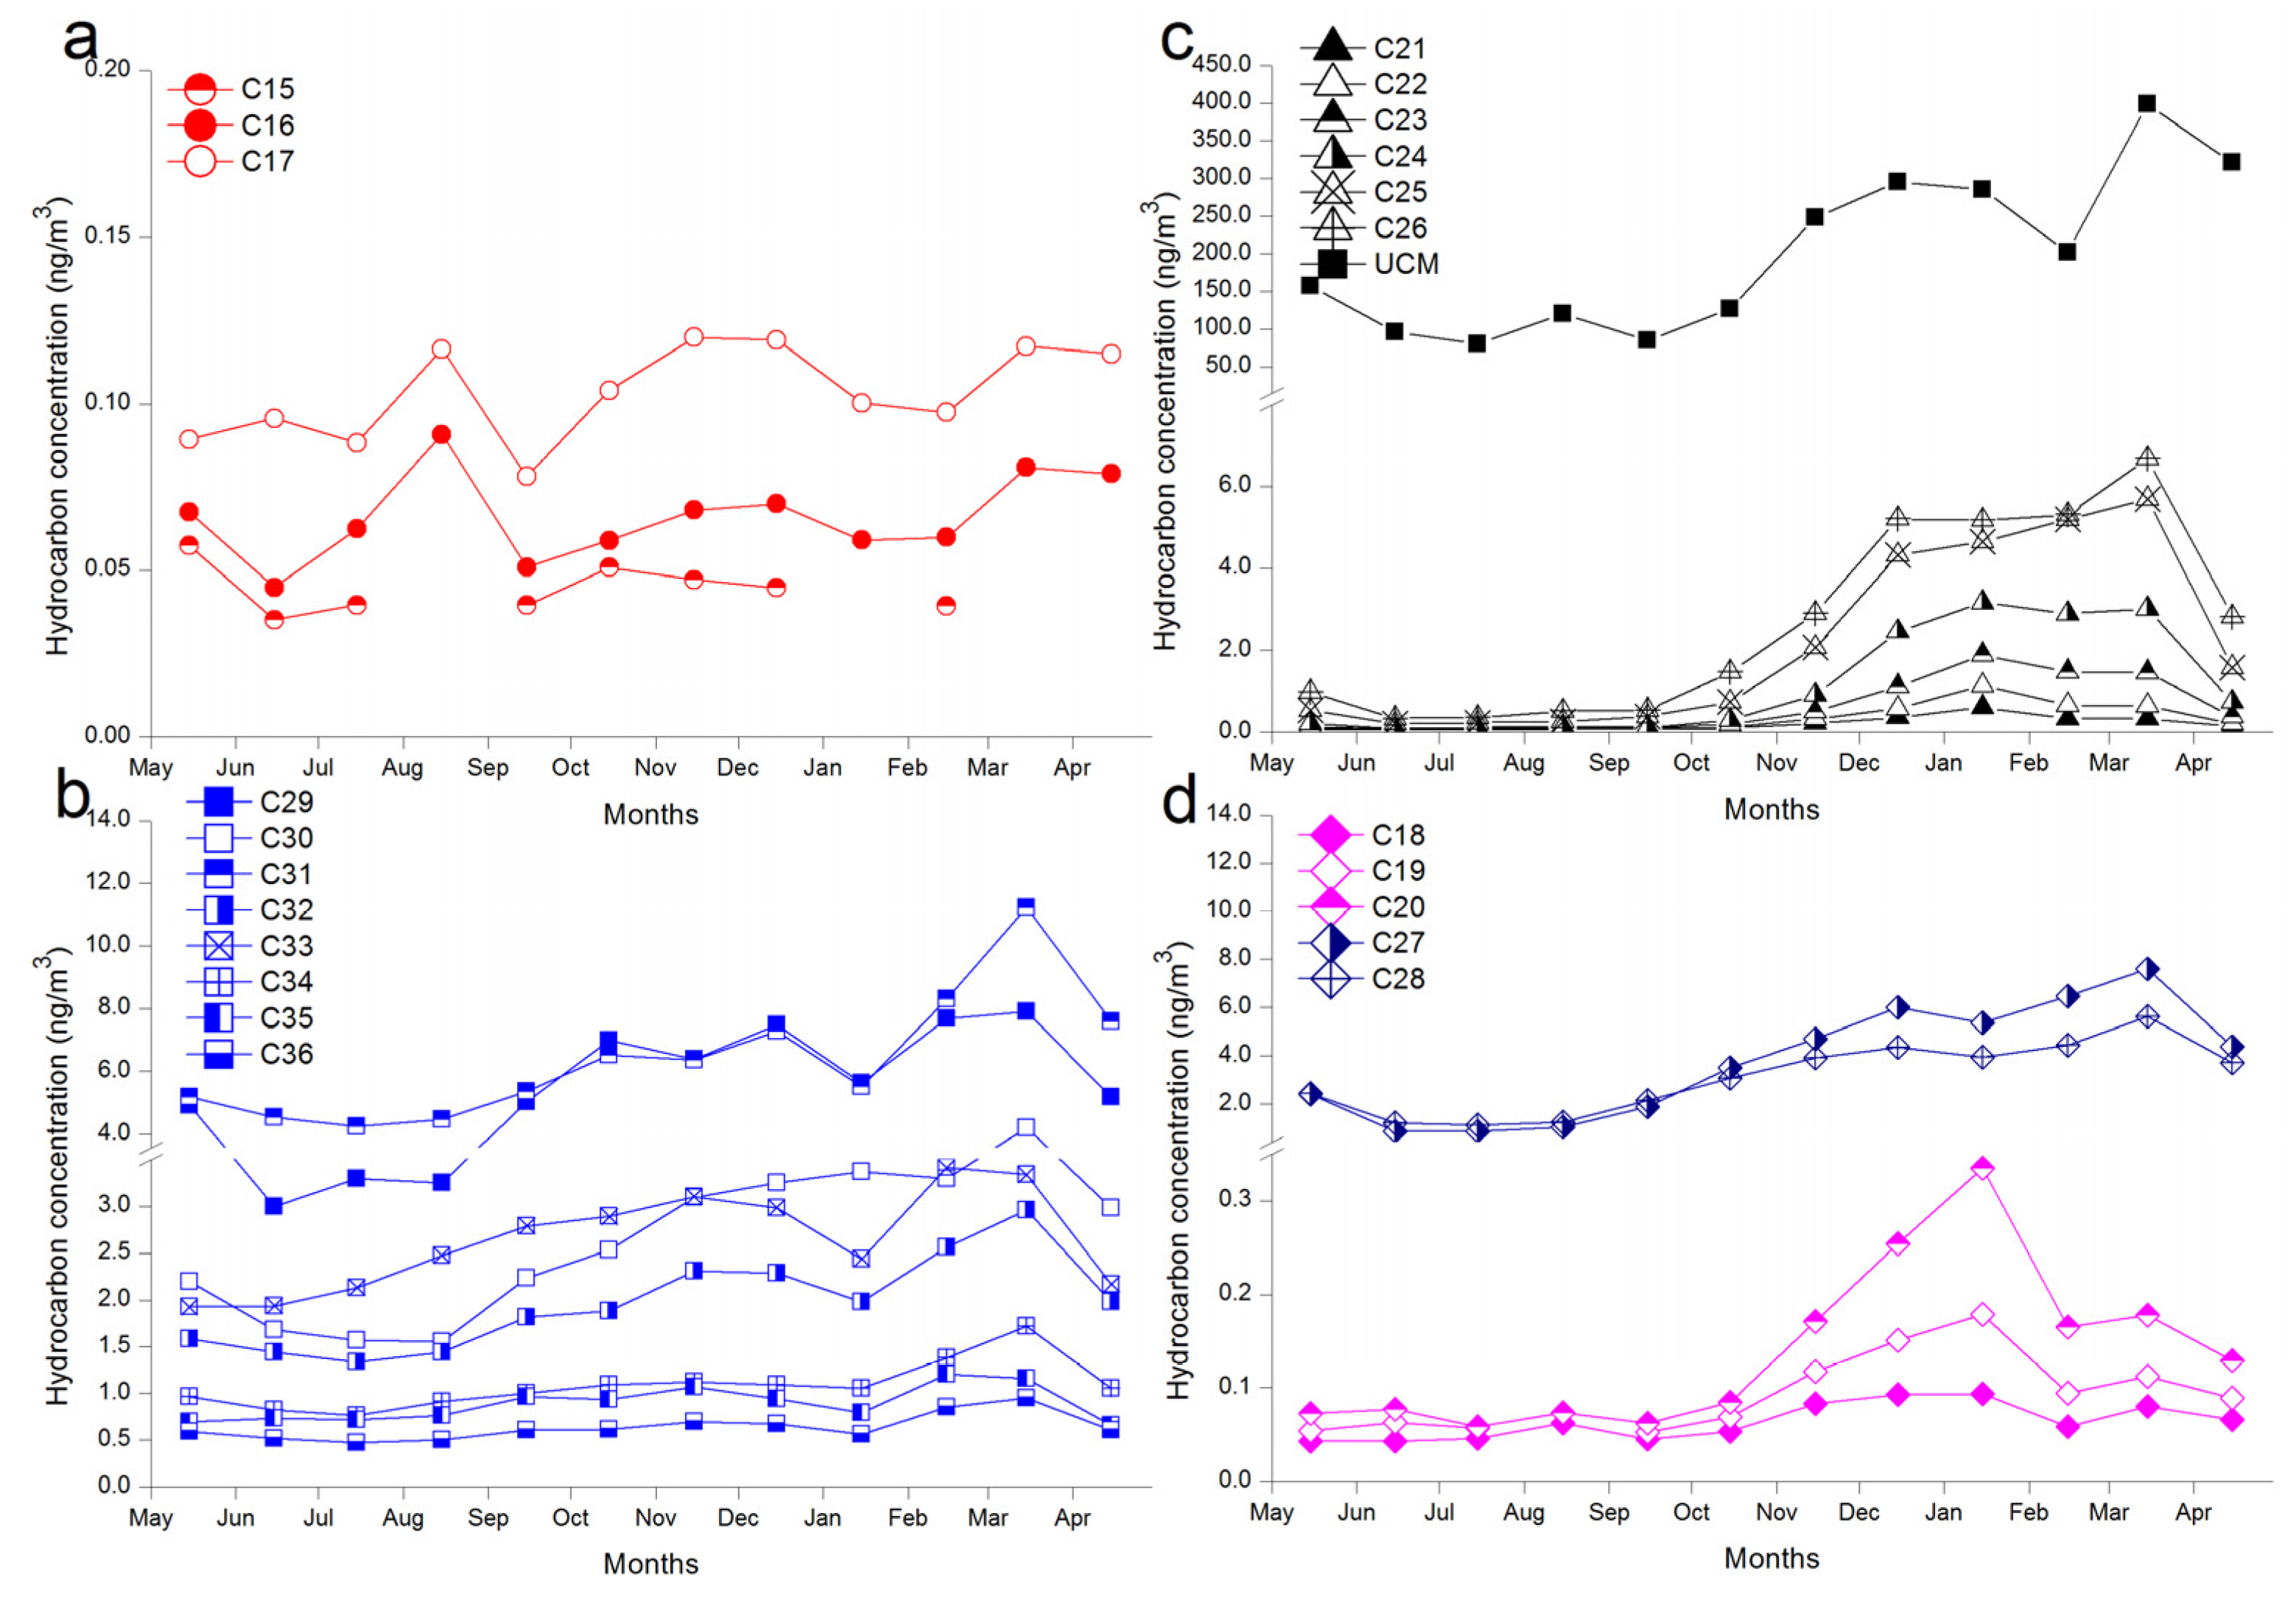
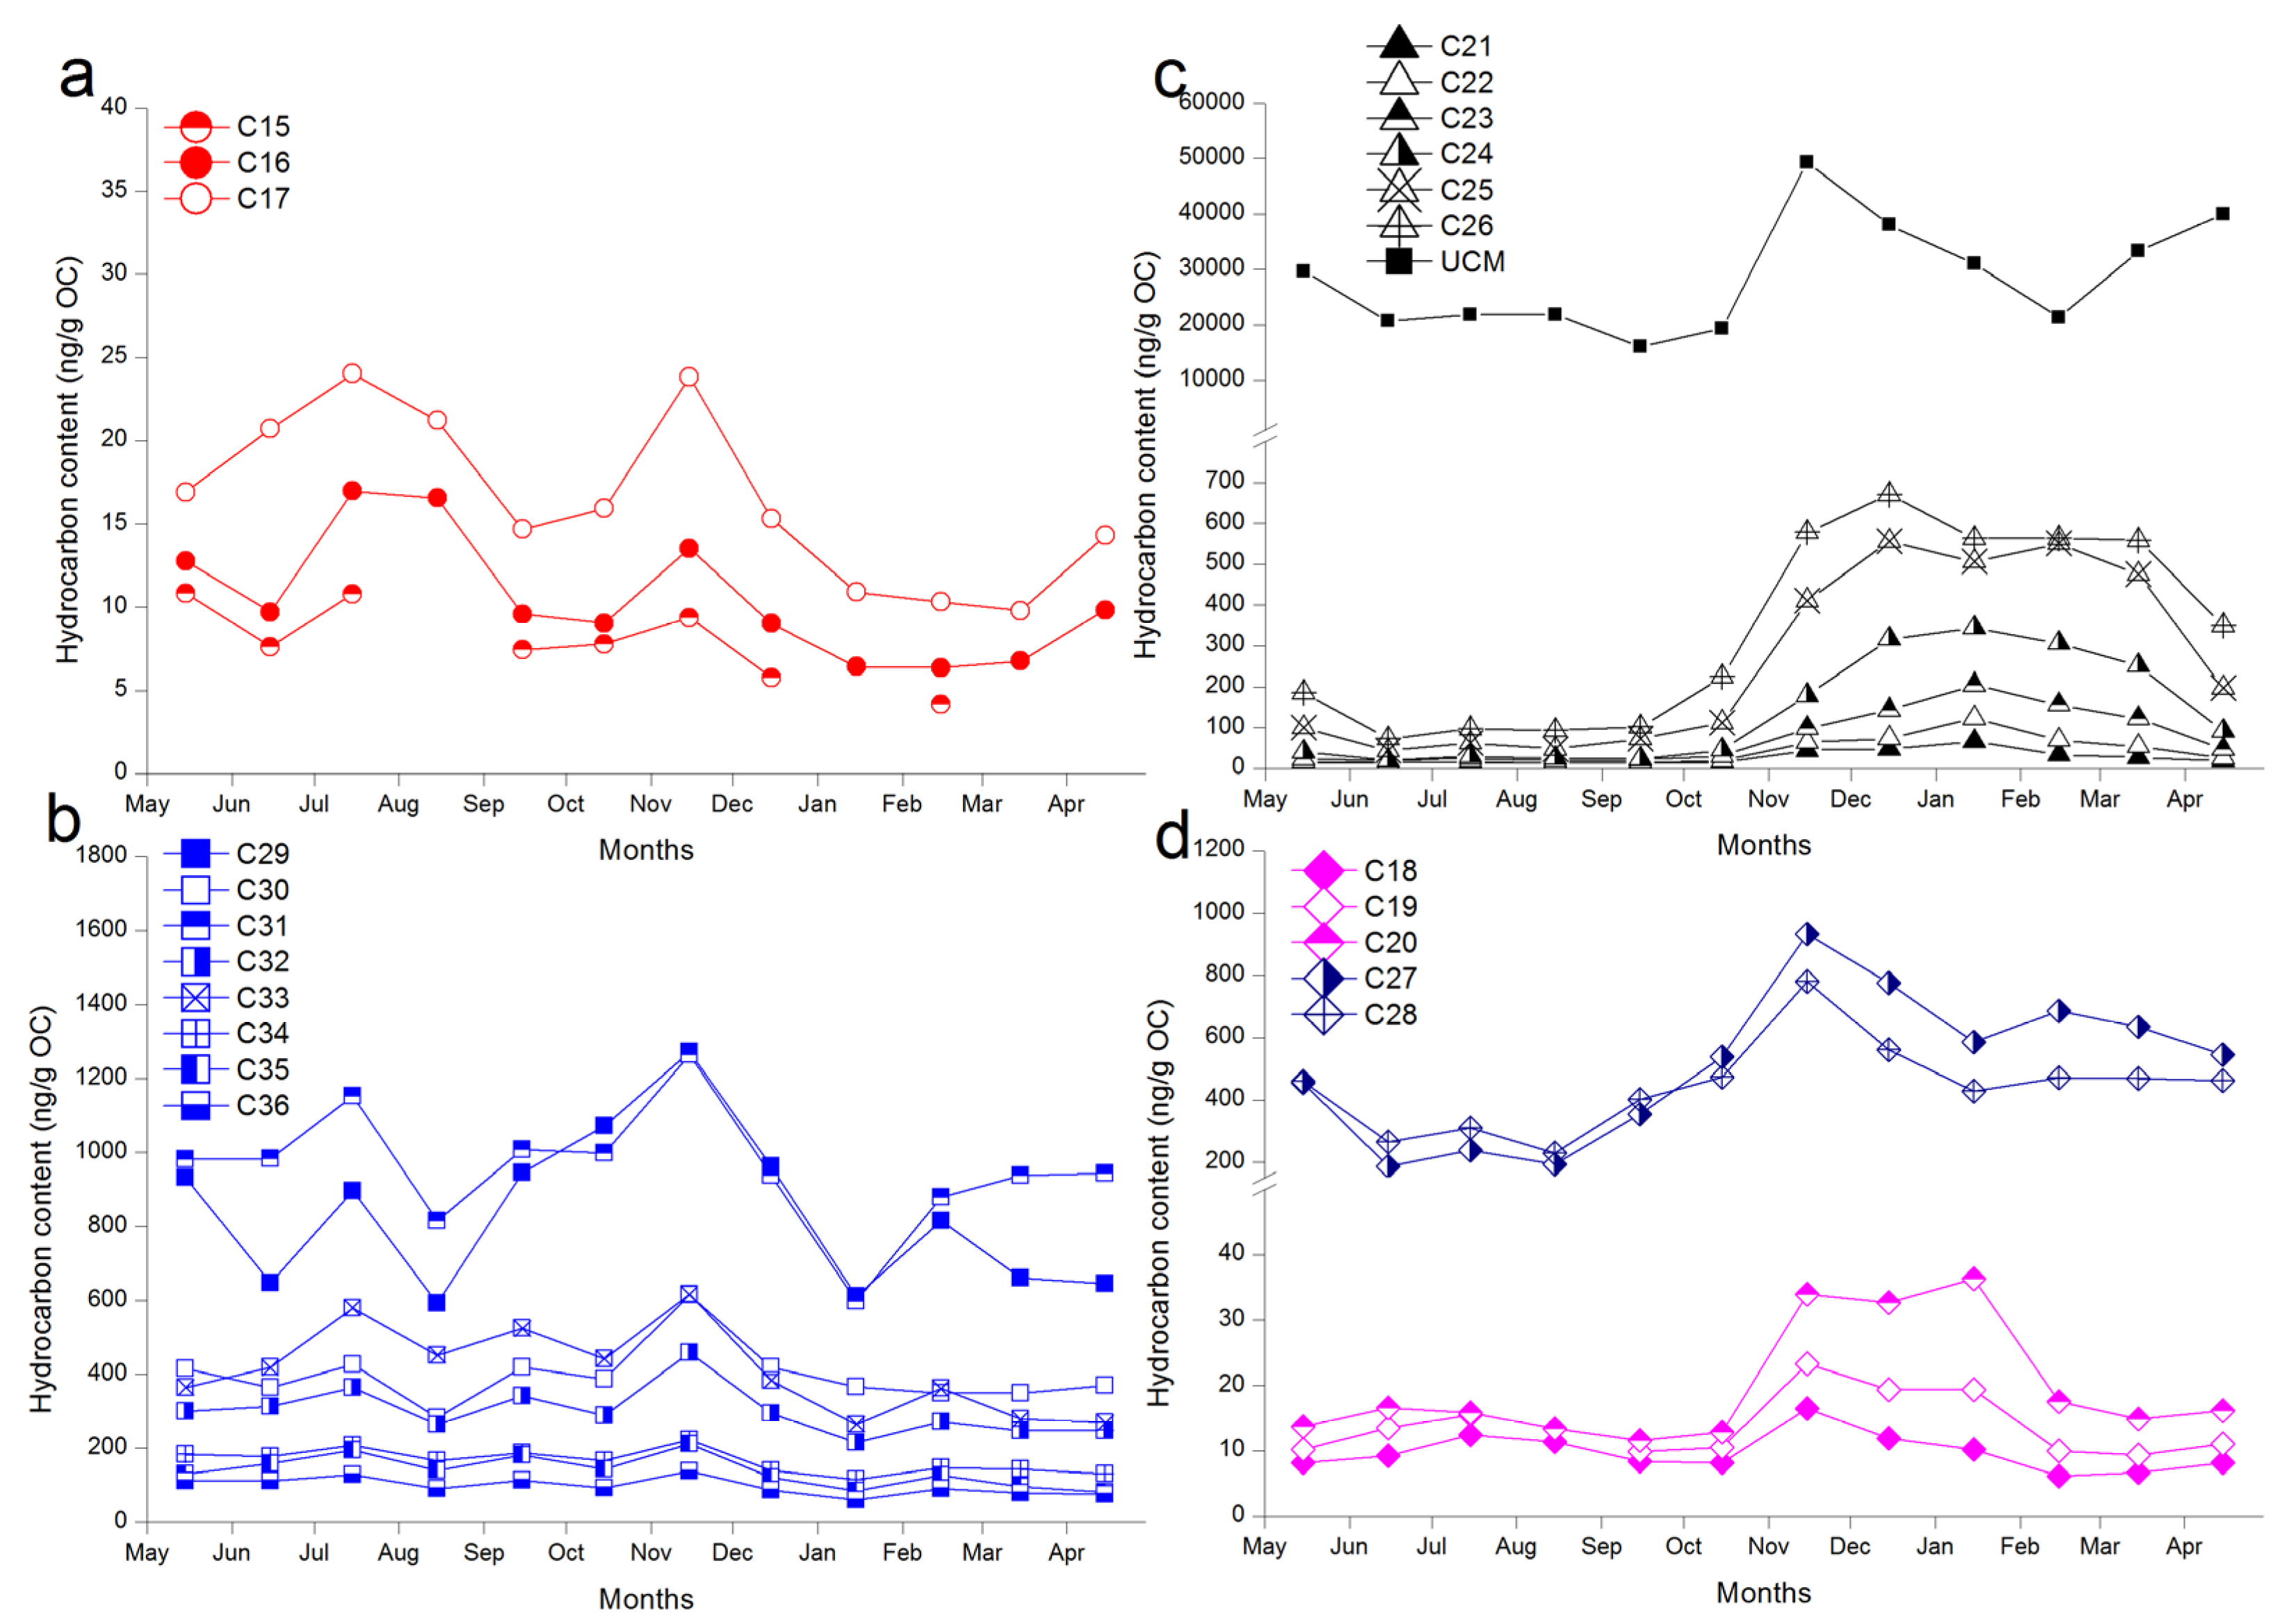
3.3.1. Hydrocarbons
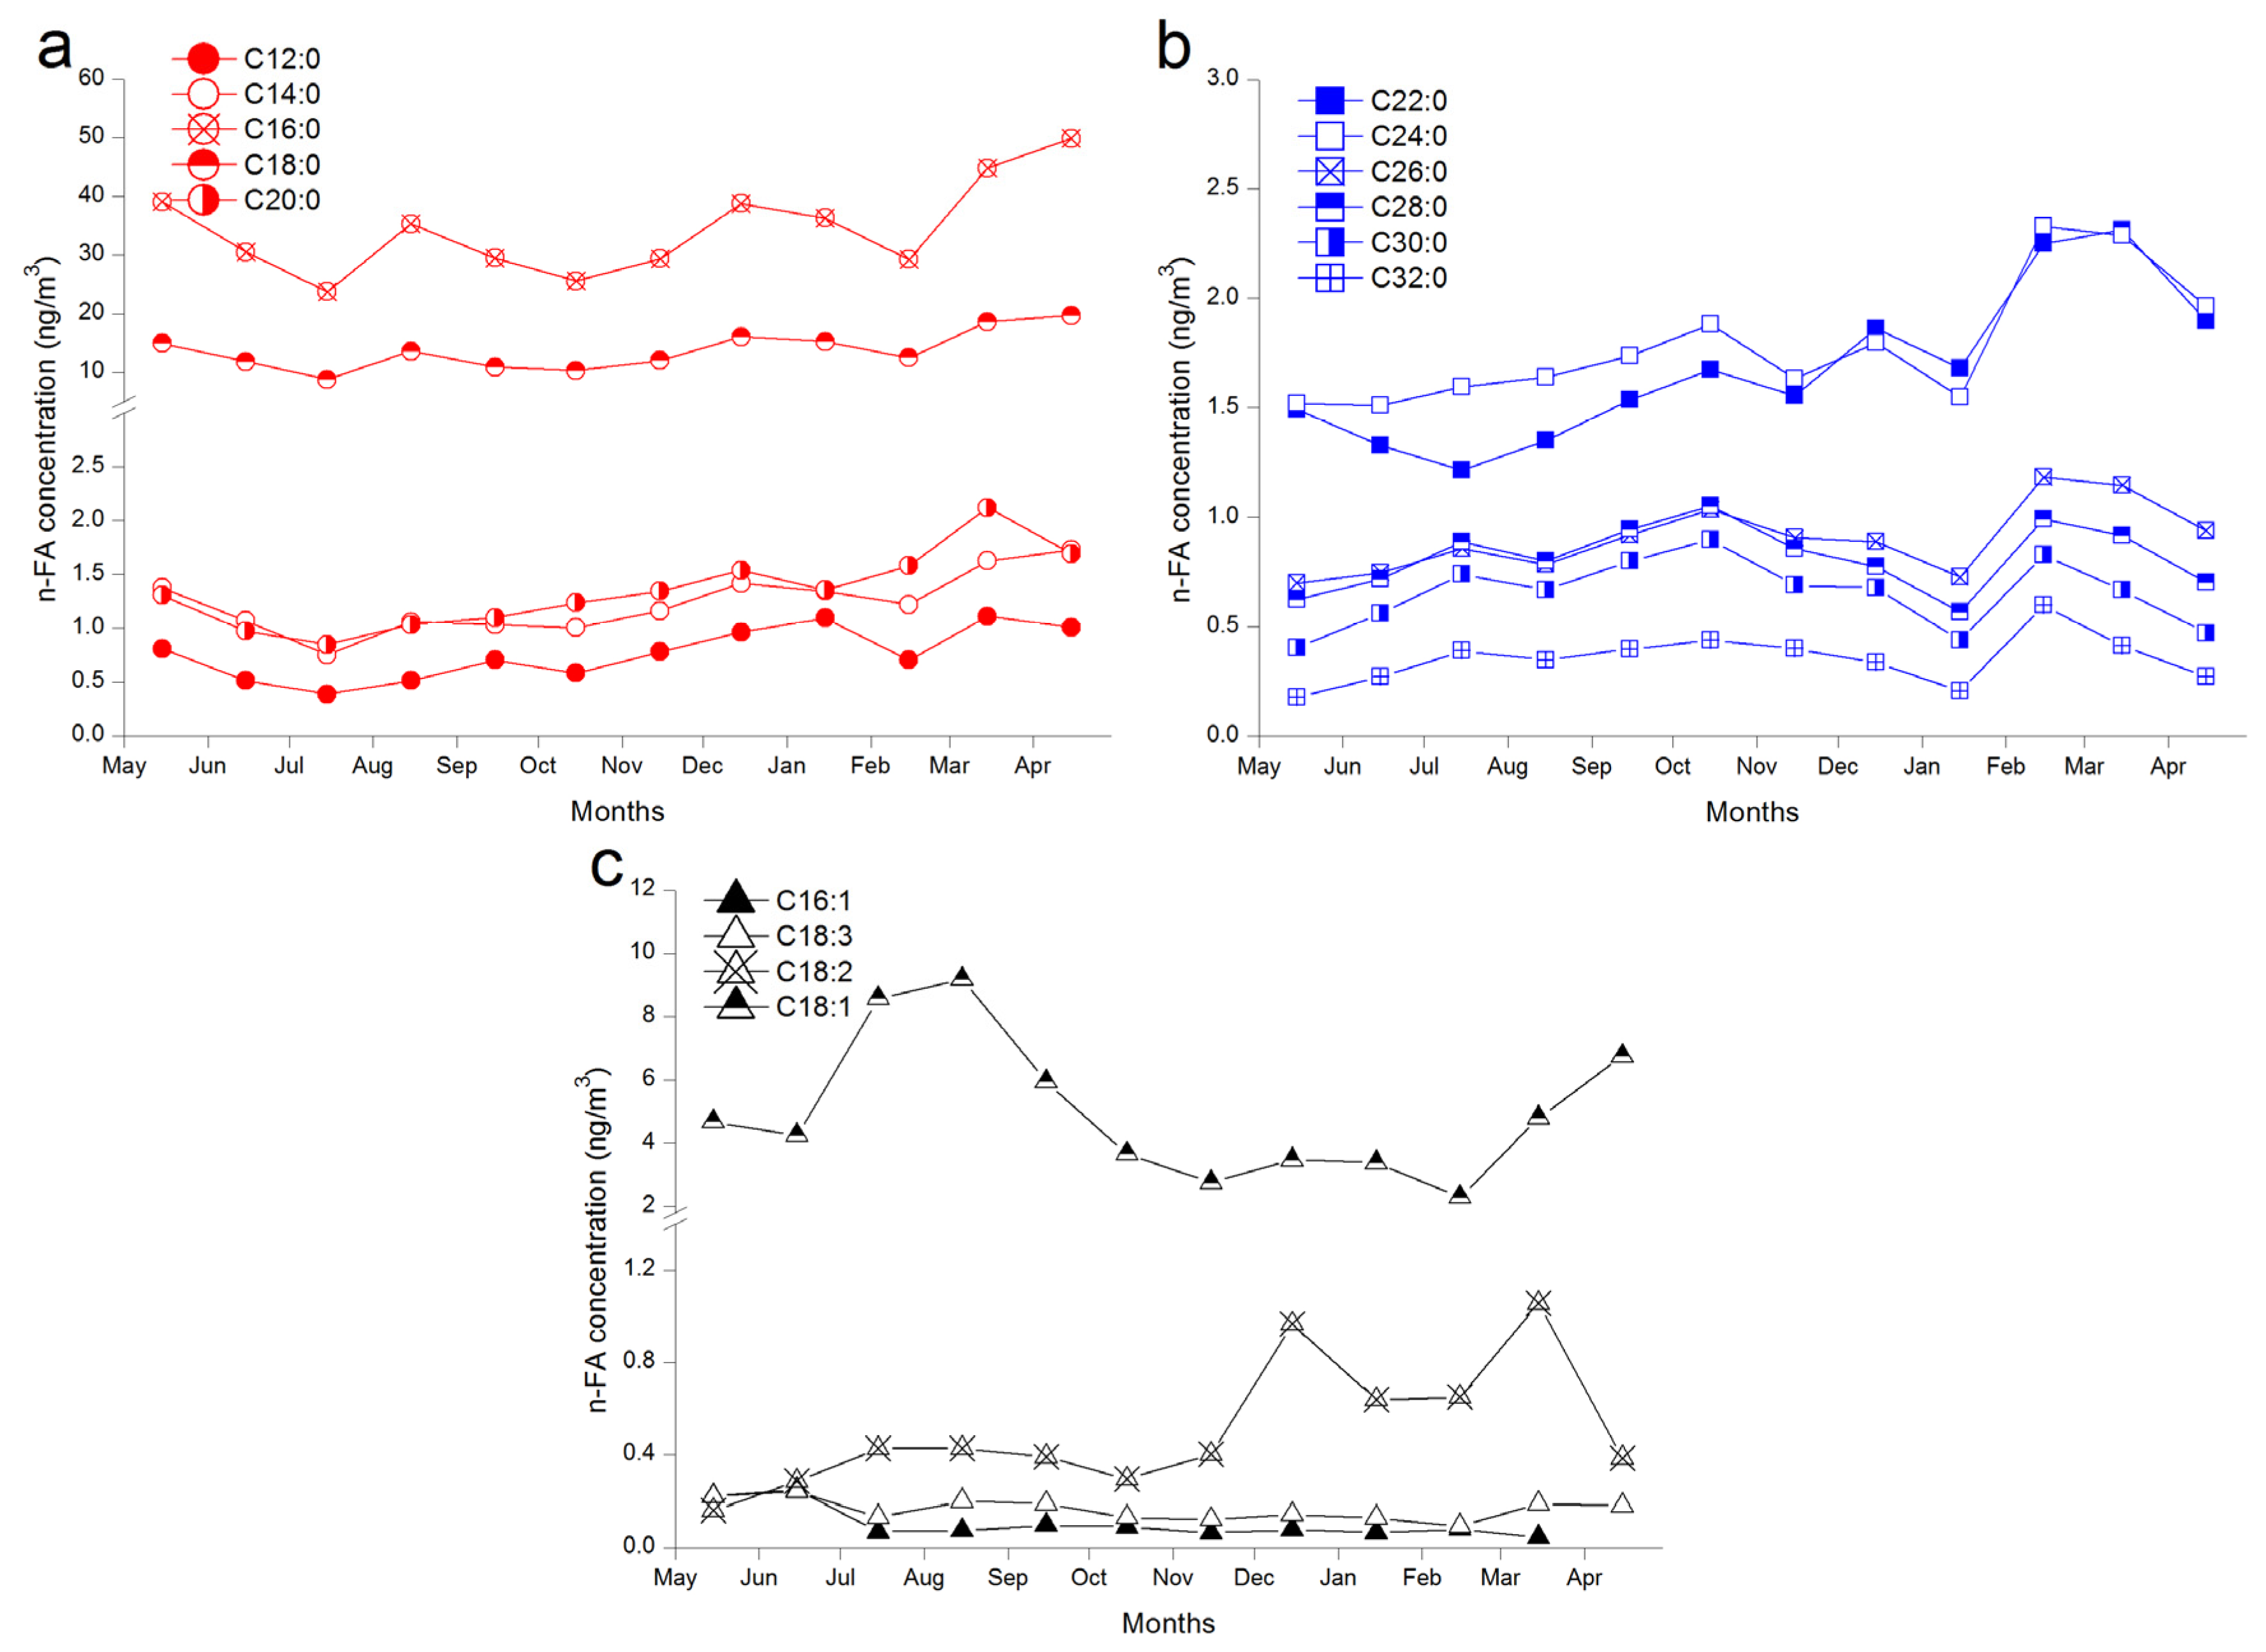
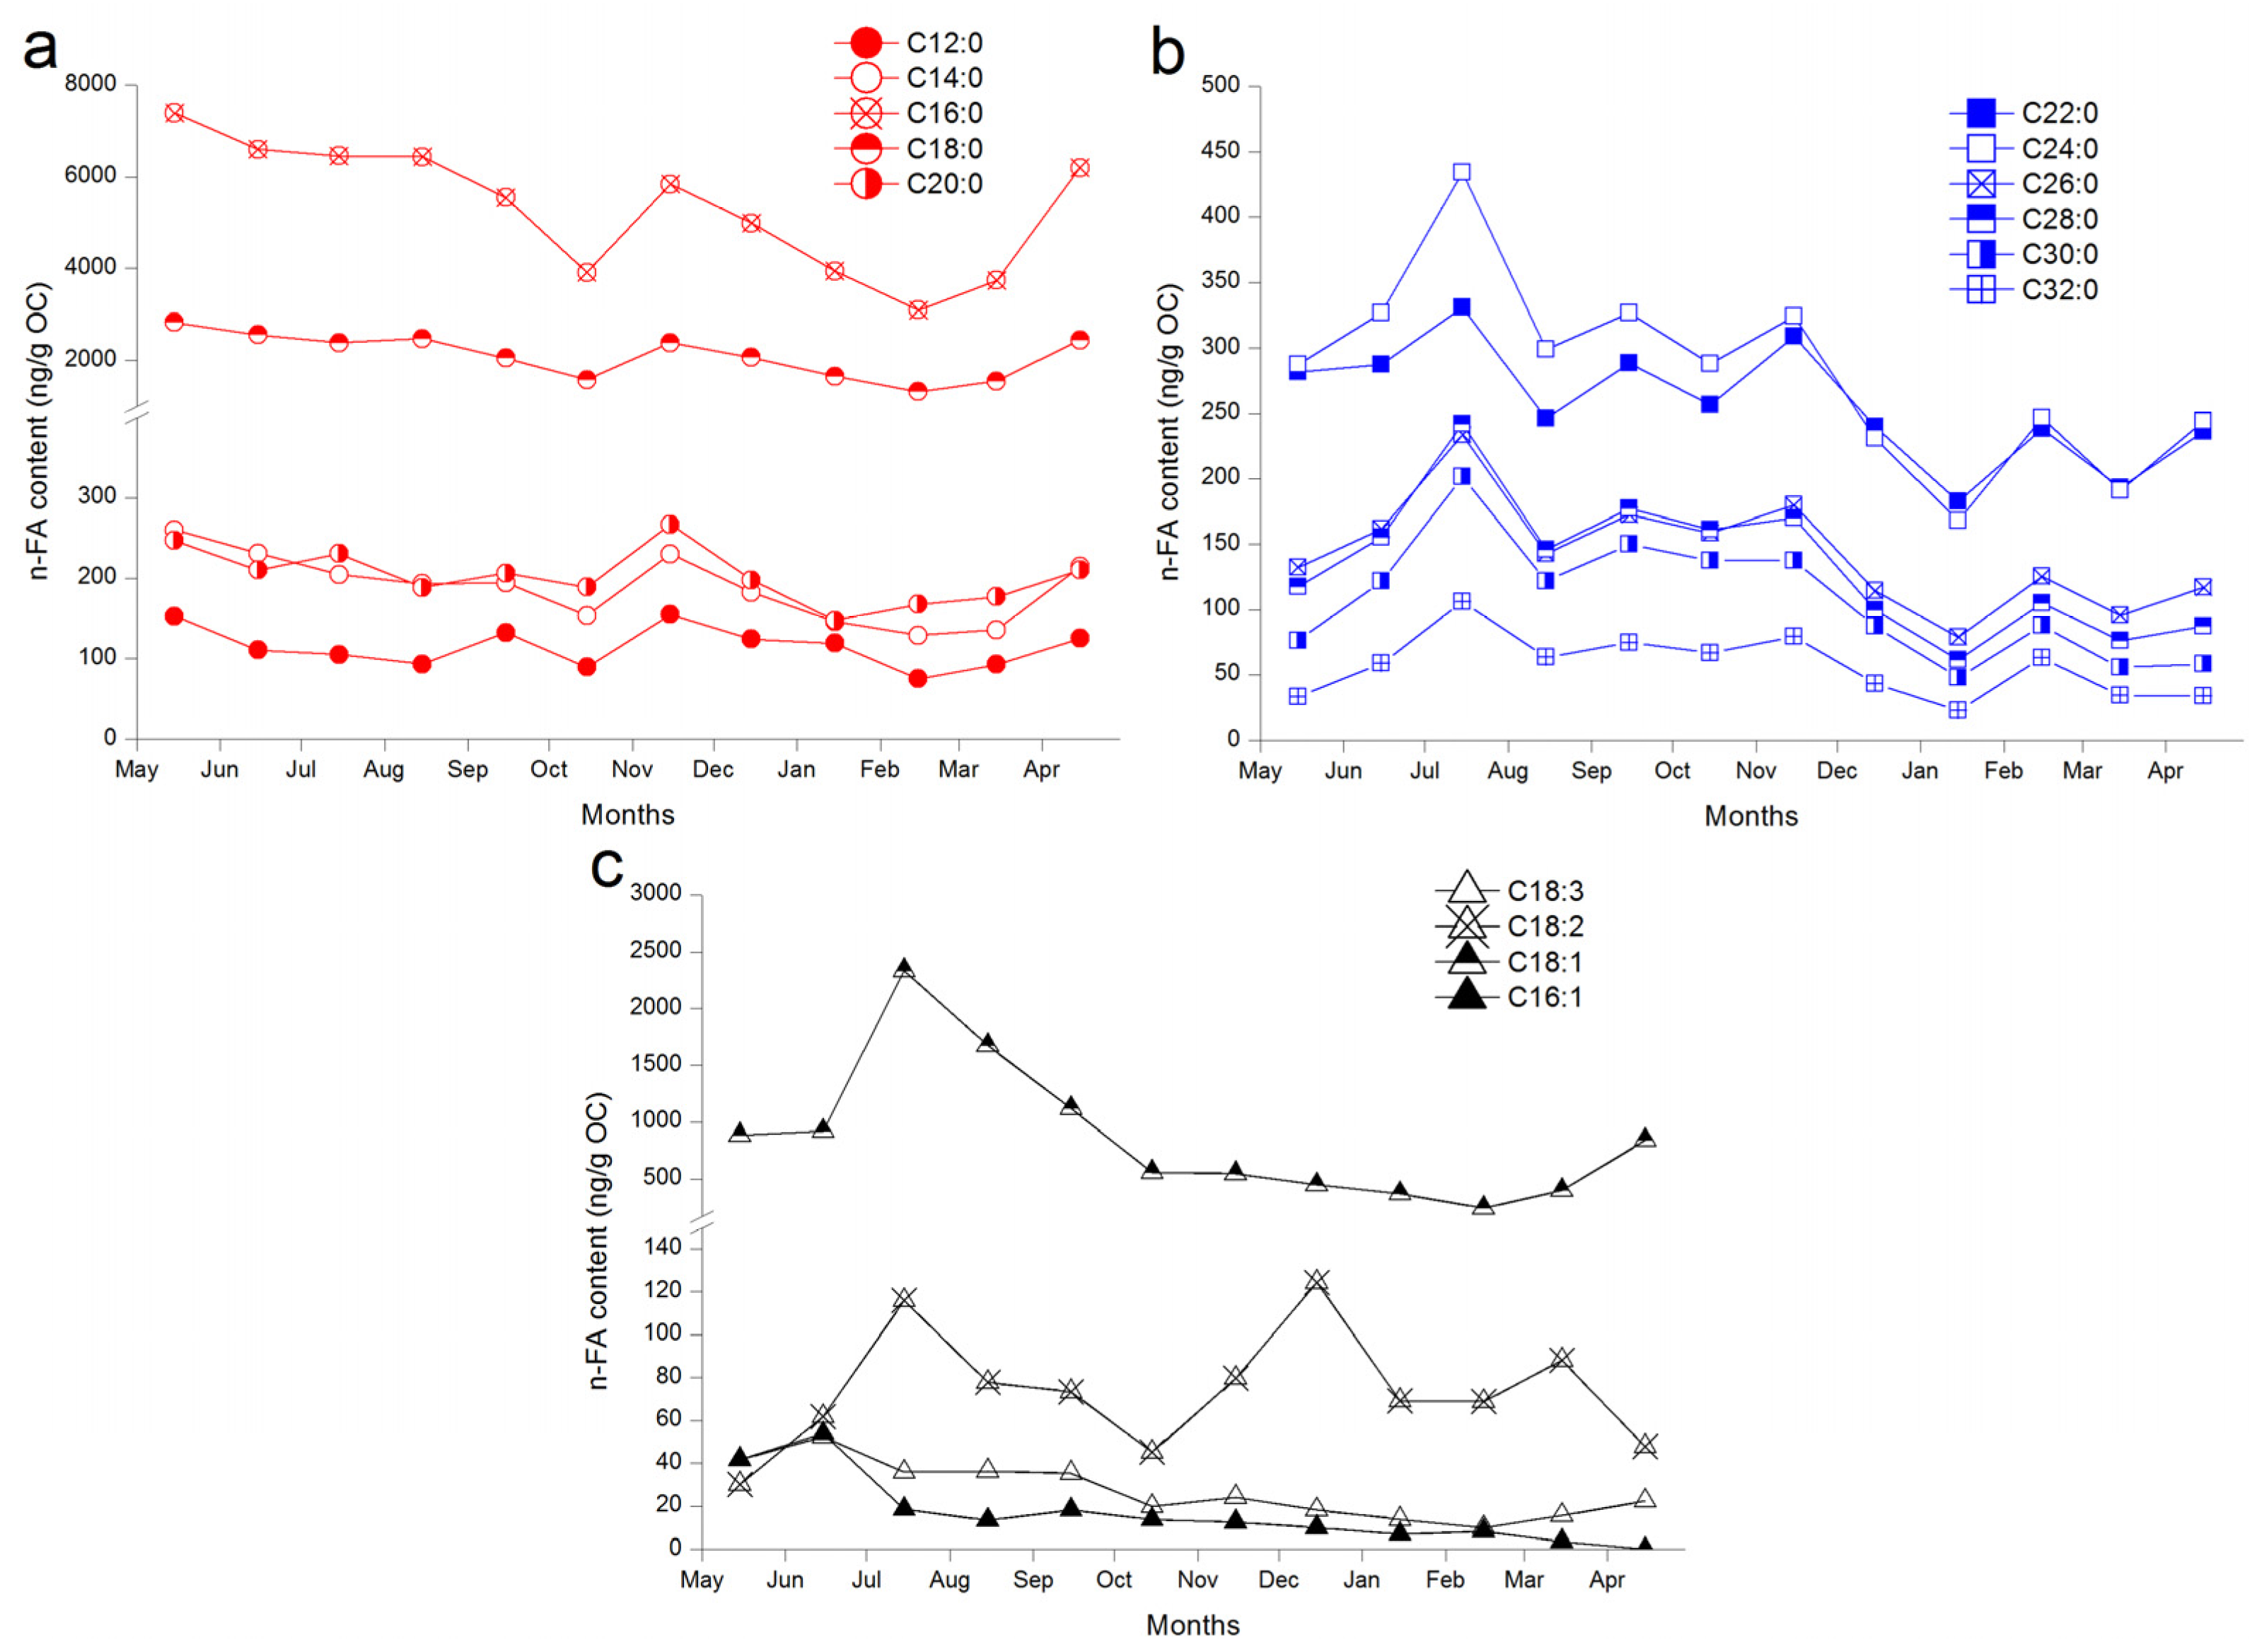
3.3.2. n-FAs
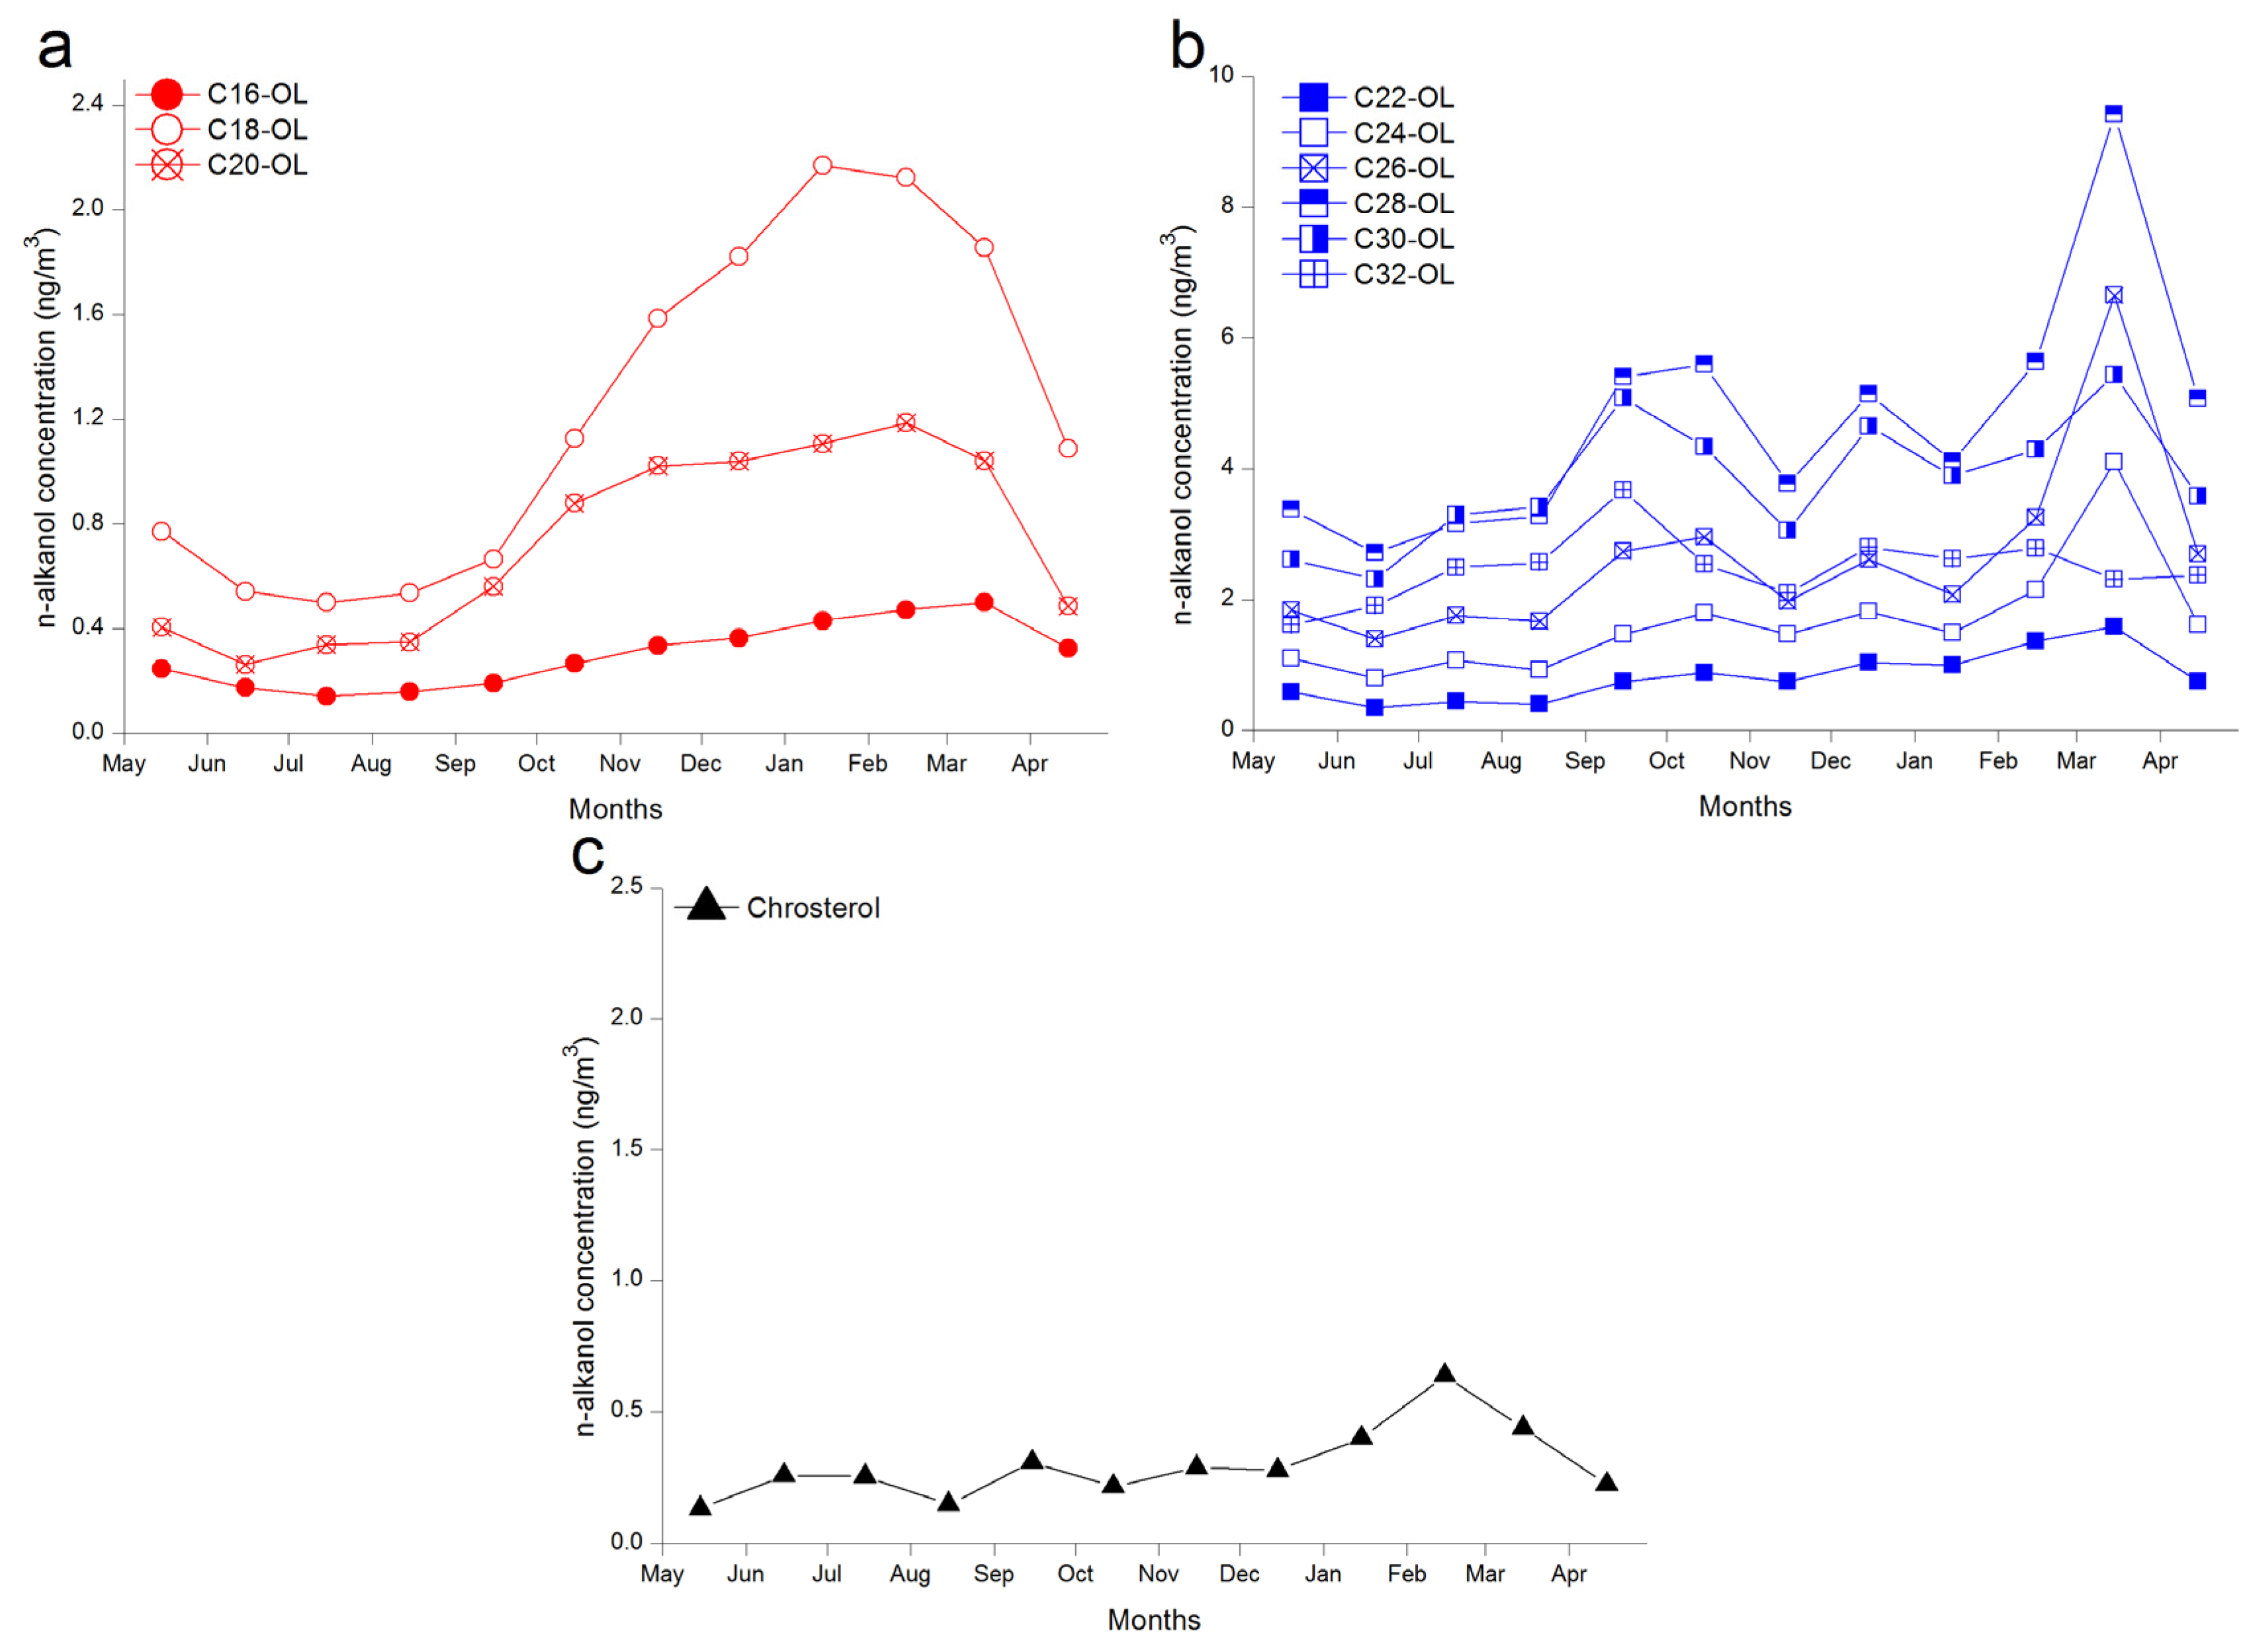
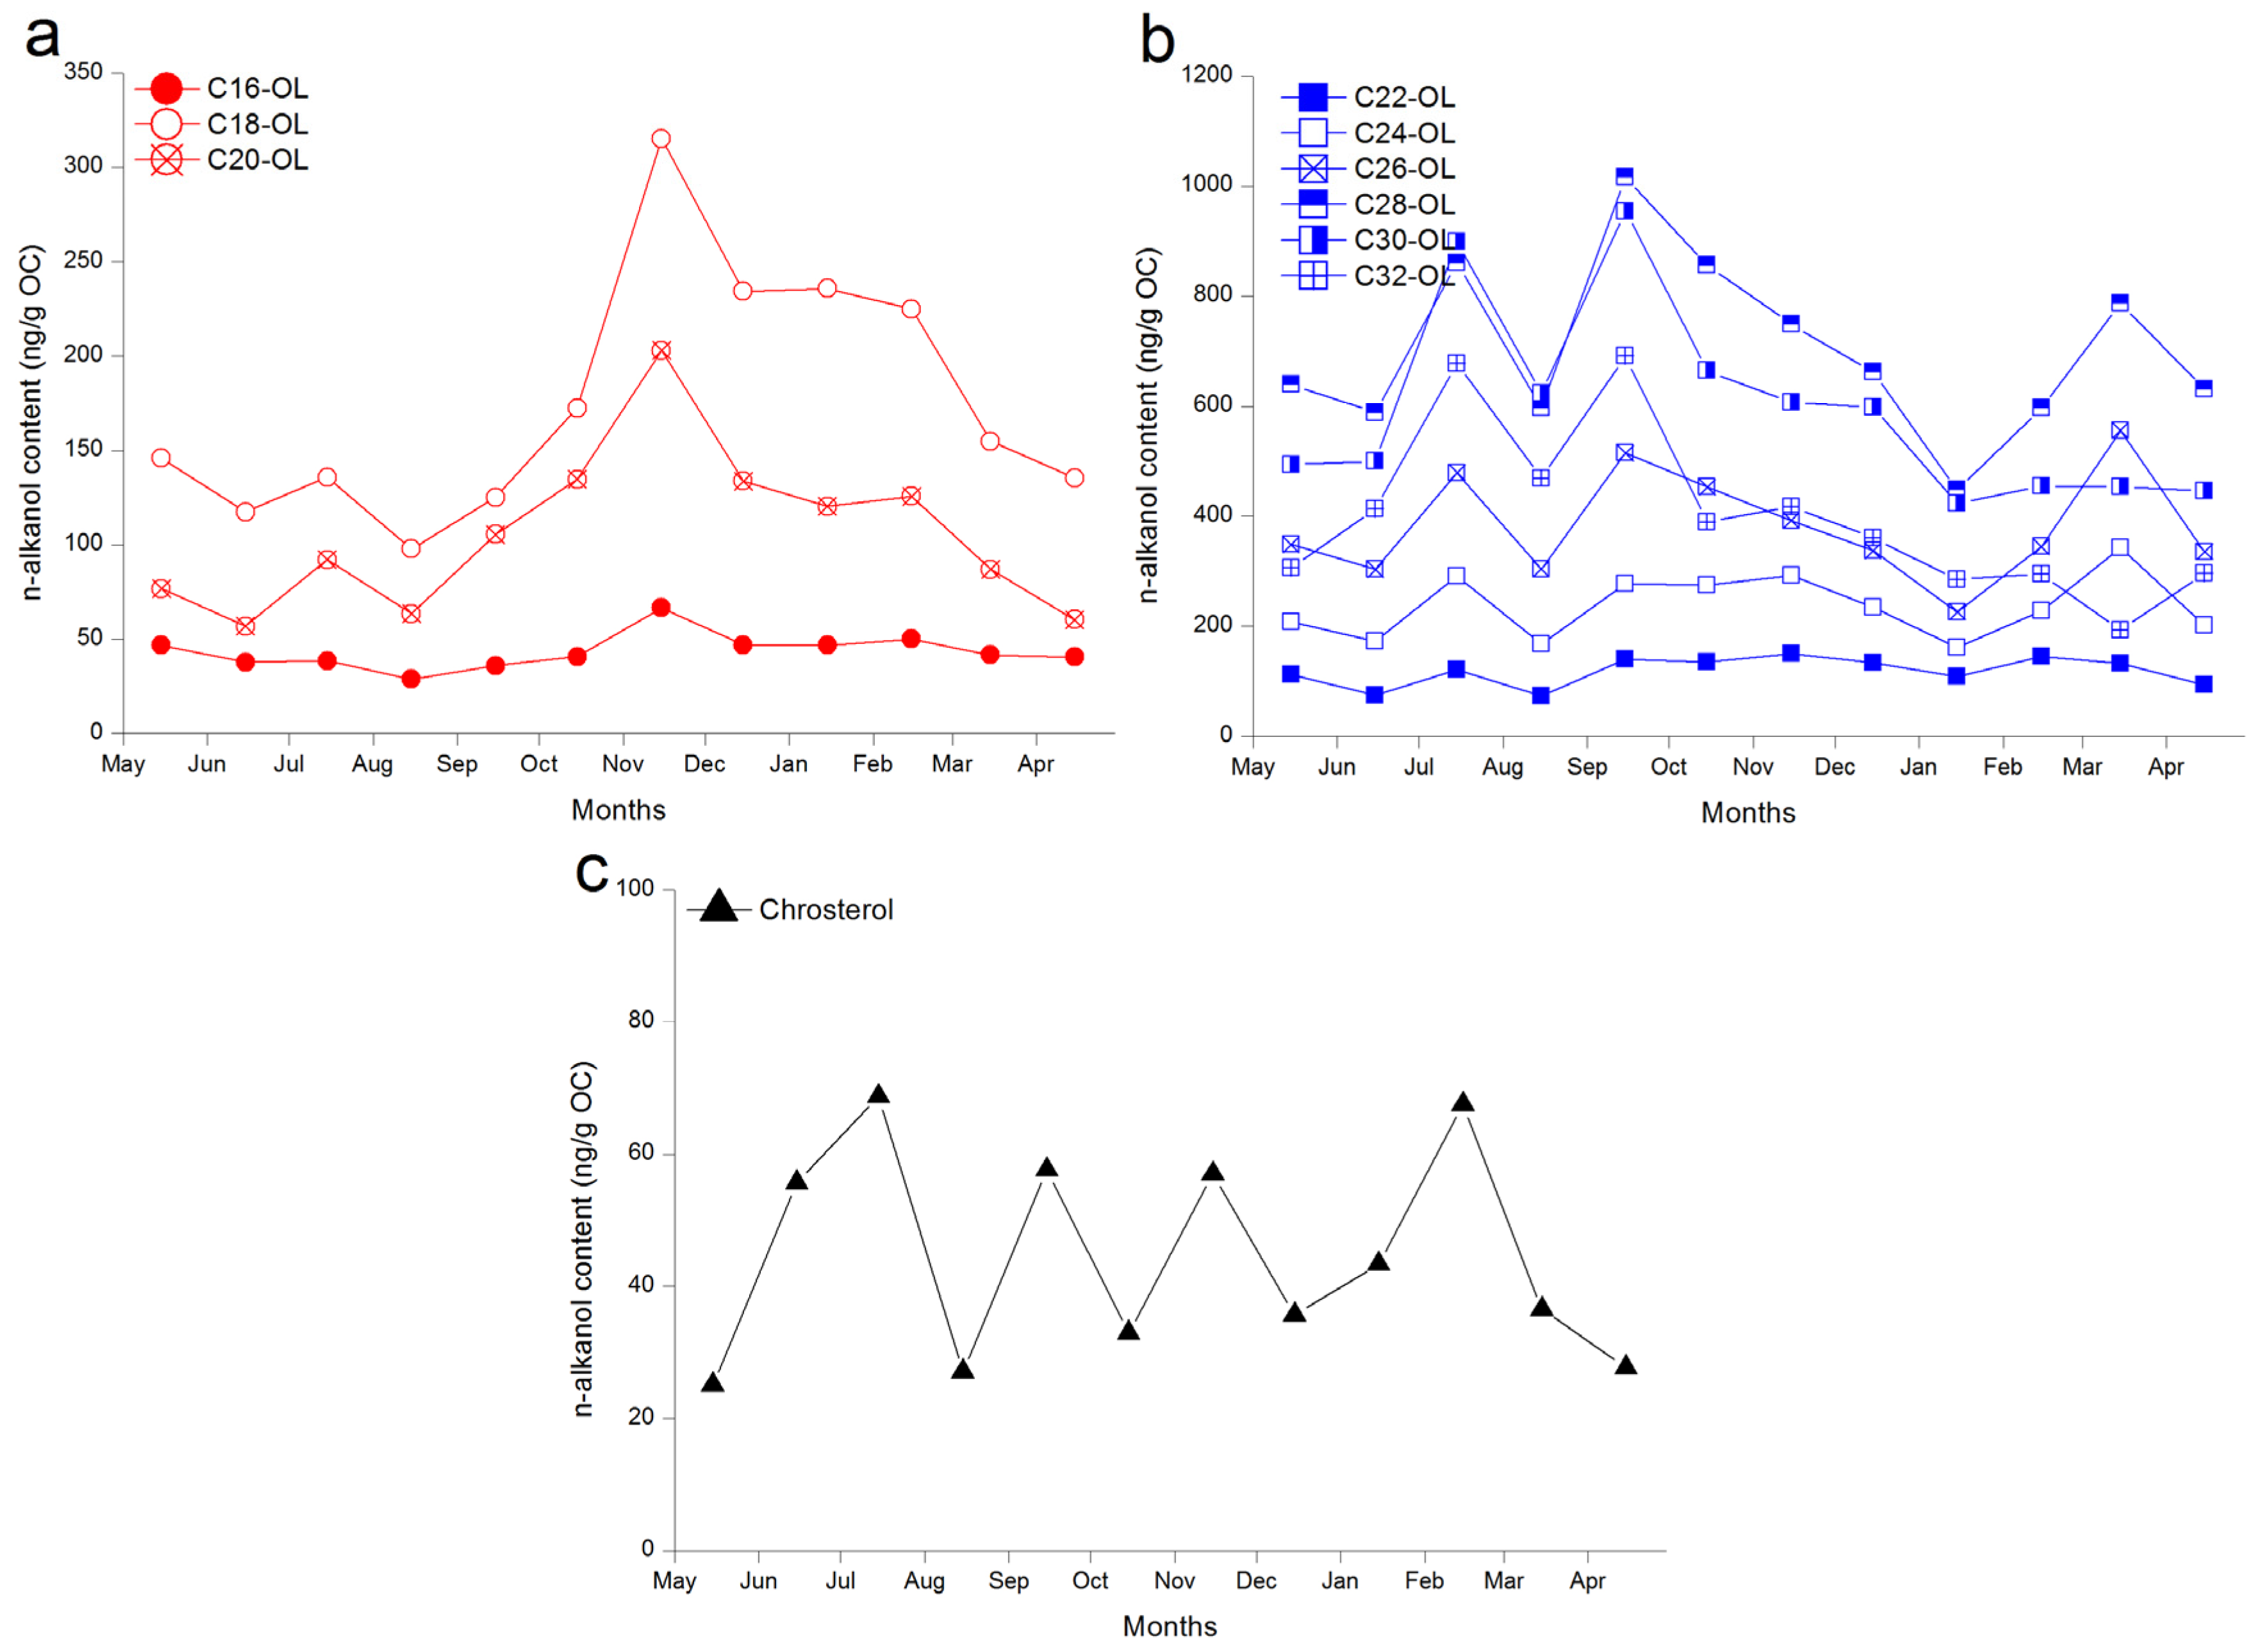
3.3.3. Alkanols
4. Discussion
4.1. Organic Aerosols Provenance
4.1.1. Insight from Bulk Characteristics
4.1.2. Insight from Lipid Biomarker Composition
Plant Wax Lipids
Anthropogenic Activities and Fossil Fuel Lipids
Marine and Microbial Lipids
4.2. Temporal Variability on Different Sources of Organic Aerosols
4.3. Comparison of Organic Aerosol with other Major Coastal Cities
5. Conclusions
Supplementary Materials
Acknowledgments
Author Contributions
Conflicts of Interest
References
- Wendy Hsiao, W.L.; Mo, Z.-Y.; Fang, M.; Shi, X.-M.; Wang, F. Cytotoxicity of PM2.5 and PM2.5–10 ambient air pollutants assessed by the MTT and the comet assays. Mutat. Res. 2000, 471, 45–55. [Google Scholar] [CrossRef]
- Huang, R.-J.; Zhang, Y.; Bozzetti, C.; Ho, K.-F.; Cao, J.-J.; Han, Y.; Daellenbach, K.R.; Slowik, J.G.; Platt, S.M.; Canonaco, F.; et al. High secondary aerosol contribution to particulate pollution during haze events in China. Nature 2014, 514, 218–222. [Google Scholar] [CrossRef] [PubMed]
- Zhang, Z.; Friedlander, S.K. A comparative study of chemical databases for fine particle Chinese aerosols. Environ. Sci. Technol. 2000, 34, 4687–4694. [Google Scholar] [CrossRef]
- Jimenez, J.L.; Canagaratna, M.R.; Donahue, N.M.; Prevot, A.S.H.; Zhang, Q.; Kroll, J.H.; DeCarlo, P.F.; Allan, J.D.; Coe, H.; Ng, N.L.; et al. Evolution of organic aerosols in the atmosphere. Science 2009, 326, 1525–1529. [Google Scholar] [CrossRef] [PubMed]
- Simoneit, B.R.T.; Mazurek, M.A. Organic matter of the troposphere—II. Natural background of biogenic lipid matter in aerosols over the rural western United States. Atmos. Environ. 1982, 16, 2139–2159. [Google Scholar] [CrossRef]
- Guo, Z.; Li, J.; Feng, J.; Fang, M.; Yang, Z. Compound-specific carbon isotope compositions of individual long-chain n-alkanes in severe Asian dust episodes in the north China coast in 2002. Chin. Sci. Bull. 2006, 51, 2133–2140. [Google Scholar] [CrossRef]
- Guo, Z.; Sheng, L.; Feng, J.; Fang, M. Seasonal variation of solvent extractable organic compounds in the aerosols in Qingdao, China. Atmos. Environ. 2003, 37, 1825–1834. [Google Scholar] [CrossRef]
- Simoneit, B.R.; Sheng, G.; Chen, X.; Fu, J.; Zhang, J.; Xu, Y. Molecular marker study of extractable organic matter in aerosols from urban areas of China. Atmos. Environ. 1991, 25, 2111–2129. [Google Scholar] [CrossRef]
- Fu, P.Q.; Kawamura, K.; Chen, J.; Charrière, B.; Sempéré, R. Organic molecular composition of marine aerosols over the arctic ocean in summer: Contributions of primary emission and secondary aerosol formation. Biogeosciences 2013, 10, 653–667. [Google Scholar] [CrossRef]
- Fu, P.Q.; Kawamura, K.; Pavuluri, C.M.; Swaminathan, T. Molecular characterization of urban organic aerosol in tropical India: Contributions of biomass/biofuel burning, plastic burning, and fossil fuel combustion. Atmos. Chem. Phys. 2009, 7, 129–137. [Google Scholar] [CrossRef]
- Schmittkopplin, P.; Ligerbelair, G.; Koch, B.P.; Flerus, R. Dissolved organic matter in sea spray: A transfer study from marine surface water to aerosols. Biogeosciences 2011, 9, 1571–1582. [Google Scholar] [CrossRef]
- Lee, J.S.; Weon, B.M.; Park, S.J.; Je, J.H.; Fezzaa, K.; Lee, W.K. Size limits the formation of liquid jets during bubble bursting. Nat. Commun. 2011, 2, 2555–2559. [Google Scholar] [CrossRef] [PubMed]
- Eglinton, T.I.; Eglinton, G.; Dupont, L.; Sholkovitz, E.R.; Montluçon, D.; Reddy, C.M. Composition, age, and provenance of organic matter in NW African dust over the Atlantic Ocean. Geochem. Geophys. Geosyst. 2002, 3, 1–27. [Google Scholar] [CrossRef]
- Simoneit, B.R.T.; Crisp, P.T.; Mazurek, M.A.; Standley, L.J. Composition of extractable organic matter of aerosols from the Blue Mountains and southeast coast of Australia. Environ. Int. 1991, 17, 405–419. [Google Scholar] [CrossRef]
- Lim, H.-J.; Turpin, B.J. Origins of primary and secondary organic aerosol in Atlanta: Results of time-resolved measurements during the Atlanta supersite experiment. Environ. Sci. Technol. 2002, 36, 4489–4496. [Google Scholar] [CrossRef] [PubMed]
- Samara, C.; Voutsa, D.; Kouras, A.; Eleftheriadis, K.; Maggos, T.; Saraga, D.; Petrakakis, M. Organic and elemental carbon associated to PM10 and PM2.5 at urban sites of northern Greece. Environ. Sci. Pollut. Res. 2014, 21, 1769–1785. [Google Scholar] [CrossRef] [PubMed]
- Zhang, F.; Zhao, J.; Chen, J.; Xu, Y.; Xu, L. Pollution characteristics of organic and elemental carbon in PM2.5 in Xiamen, China. J. Environ. Sci. 2011, 23, 1342–1349. [Google Scholar] [CrossRef]
- Bernardoni, V.; Calzolai, G.; Chiari, M.; Fedi, M.; Lucarelli, F.; Nava, S.; Piazzalunga, A.; Riccobono, F.; Taccetti, F.; Valli, G.; et al. Radiocarbon analysis on organic and elemental carbon in aerosol samples and source apportionment at an urban site in northern Italy. J. Aerosol. Sci. 2013, 56, 88–99. [Google Scholar] [CrossRef]
- Matsumoto, K.; Kawamura, K.; Uchida, M.; Shibata, Y.; Yoneda, M. Compound specific radiocarbon and δ13C measurements of fatty acids in a continental aerosol sample. Geophys. Res. Lett. 2001, 28, 4587–4590. [Google Scholar] [CrossRef]
- Schlag, P.; Kiendlerscharr, A.; Blom, M.J.; Canonaco, F.; Sebastiaan Henzing, J.; Moerman, M.; Prévôt, A.S.H.; Holzinger, R. Aerosol source apportionment from 1-year measurements at the CESAR tower in Cabauw, the Netherlands. Atmos. Chem. Phys. 2016, 16, 8831–8847. [Google Scholar] [CrossRef]
- China Environmental State Bulletin in 2015. Available online: http://www.zhb.gov.cn/gkml/hbb/qt/201606/t20160602_353078.htm (accessed on 11 January 2017).
- Fan, X.; Sun, Z. Analysis on features of haze weather in Xiamen city during 1953–2008. Trans. Atmos. Sci 2009, 604–609. (In Chinese) [Google Scholar]
- Komada, T.; Anderson, M.R.; Dorfmeier, C.L. Carbonate removal from coastal sediments for the determination of organic carbon and its isotopic signatures, δ13C and δ14C: Comparison of fumigation and direct acidification by hydrochloric acid. Limnol. Oceanogr. 2008, 6, 254–262. [Google Scholar] [CrossRef]
- Pearson, A.; Eglinton, T.I. The origin of n-alkanes in Santa Monica basin surface sediment: A model based on compound-specific δ14C and δ13C data. Org. Geochem. 2000, 31, 1103–1116. [Google Scholar] [CrossRef]
- Hedges, J.I.; Keil, R.G.; Benner, R. What happens to terrestrial organic matter in the ocean? Org. Geochem. 1997, 27, 195–212. [Google Scholar] [CrossRef]
- Collister, J.W.; Rieley, G.; Stern, B.; Eglinton, G.; Fry, B. Compound-specific δ13C analyses of leaf lipids from plants with differing carbon dioxide metabolisms. Org. Geochem. 1994, 21, 619–627. [Google Scholar] [CrossRef]
- Eglinton, G.; Hamilton, R.J. Leaf epicuticular waxes. Science 1967, 156, 1322–1335. [Google Scholar] [CrossRef] [PubMed]
- Rommerskirchen, F.; Eglinton, G.; Dupont, L.; Rullkötter, J. Glacial/interglacial changes in Southern Africa: Compound-specific δ13C land plant biomarker and pollen records from southeast Atlantic continental margin sediments. Geochem. Geophys. Geosyst. 2006, 7, Q08010. [Google Scholar] [CrossRef]
- Freeman, K.H.; Colarusso, L.A. Molecular and isotopic records of C4 grassland expansion in the late Miocene. Geochim. Cosmochim. Acta 2001, 65, 1439–1454. [Google Scholar] [CrossRef]
- Drenzek, N.J.; Montluçon, D.B.; Yunker, M.B.; Macdonald, R.W.; Eglinton, T.I. Constraints on the origin of sedimentary organic carbon in the Beaufort sea from coupled molecular 13C and 14C measurements. Mar. Chem. 2007, 103, 146–162. [Google Scholar] [CrossRef]
- Kusch, S.; Rethemeyer, J.; Schefuß, E.; Mollenhauer, G. Controls on the age of vascular plant biomarkers in black sea sediments. Geochim. Cosmochim. Acta 2010, 74, 7031–7047. [Google Scholar] [CrossRef]
- Lichtfouse, É.; Eglinton, T.I. 13C and 14C evidence of pollution of a soil by fossil fuel and reconstruction of the composition of the pollutant. Org. Geochem. 1995, 23, 969–973. [Google Scholar] [CrossRef]
- Collister, J.W.; Lichtfouse, E.; Hieshima, G.; Hayes, J.M. Partial resolution of sources of n-alkanes in the saline portion of the Parachute Creek Member, Green River Formation (Piceance Creek Basin, Colorado). Org. Geochem. 1994, 21, 645–659. [Google Scholar] [CrossRef]
- Wiesenberg, G.L.B.; Schwarzbauer, J.; Schmidt, M.W.I.; Schwark, L. Source and turnover of organic matter in agricultural soils derived from n-alkane/n-carboxylic acid compositions and C-isotope signatures. Org. Geochem. 2004, 35, 1371–1393. [Google Scholar] [CrossRef]
- Schouten, S.; Klein Breteler, W.C.M.; Blokker, P.; Schogt, N.; Rijpstra, W.I.C.; Grice, K.; Baas, M.; Sinninghe Damsté, J.S. Biosynthetic effects on the stable carbon isotopic compositions of algal lipids: Implications for deciphering the carbon isotopic biomarker record. Geochim. Cosmochim. Acta 1998, 62, 1397–1406. [Google Scholar] [CrossRef]
- Volkman, J.K.; Revill, A.T.; Holdsworth, D.G.; Fredericks, D. Organic matter sources in an enclosed coastal inlet assessed using lipid biomarkers and stable isotopes. Org. Geochem. 2008, 39, 689–710. [Google Scholar] [CrossRef]
- Zelles, L. Fatty acid patterns of phospholipids and lipopolysaccharides in the characterisation of microbial communities in soil: A review. Biol. Fertil. Soils 1999, 29, 111–129. [Google Scholar] [CrossRef]
- Otto, A.; Simpson, M. Degradation and preservation of vascular plant-derived biomarkers in grassland and forest soils from western Canada. Biogeochemistry 2005, 74, 377–409. [Google Scholar] [CrossRef]
- Van Dongen, B.E.; Zencak, Z.; Gustafsson, Ö. Differential transport and degradation of bulk organic carbon and specific terrestrial biomarkers in the surface waters of a sub-arctic brackish bay mixing zone. Mar. Chem. 2008, 112, 203–214. [Google Scholar] [CrossRef]
- Meyers, P.A.; Ishiwatari, R. The Early Diagenesis of Organic Matter in Lacustrine Sediments; Springer: New York, NY, USA, 1993; pp. 185–209. [Google Scholar]
- Chinese Air Quality On-Line Monitoring Platform. Available online: http://www.aqistudy.cn/historydata/monthdata.php?city=xiamen (accessed on 12 November 2016).
- 2003Undergraduates. Characteristic and sources of n-alkanes bound to PM10 in the air of Xiamen. J. Xiamen Univ. 2007, 46, 99–102. (In Chinese) [Google Scholar]
- Gong, D.Y.; Wang, W.; Yun, Q.; Bai, W.; Guo, Y.; Rui, M. Observed holiday aerosol reduction and temperature cooling over East Asia. J. Geophys. Res. 2014, 119, 6306–6324. [Google Scholar] [CrossRef]
- Volkman, J.K.; Barrett, S.M.; Blackburn, S.I.; Mansour, M.P.; Sikes, E.L.; Gelin, F. Microalgal biomarkers: A review of recent research developments. Org. Geochem. 1998, 29, 1163–1179. [Google Scholar] [CrossRef]
- Blair, N.; Leu, A.; Muñoz, E.; Olsen, J.; Kwong, E.; Des Marais, D. Carbon isotopic fractionation in heterotrophic microbial metabolism. Appl. Environ. Microb. 1985, 50, 996–1001. [Google Scholar]
- McCallister, S.; Bauer, J.E.; Cherrier, J.E.; Ducklow, H.W. Assessing sources and ages of organic matter supporting river and estuarine bacterial production: A multiple-isotope (δ14C, δ13C, and δ15N) approach. Limnol. Oceanogr. 2004, 49, 1687–1702. [Google Scholar] [CrossRef]
- Yan, Y.; Jiang, L.; Liu, H.; Shen, H. Analysis of the monitoring results on flu pathogen over Xiamen during 2004–2013. Chin. Med. Stat. 2014, 5, 369–370. (In Chinese) [Google Scholar]
- Sinensky, M. Temperature control of phospholipid biosynthesis in Escherichia coli. J. Bacteriol. 1971, 106, 449–455. [Google Scholar] [PubMed]
- Fang, M.; Zheng, M.; Wang, F.; Chim, K.S.; Kot, S.C. The long-range transport of aerosols from northern China to Hong Kong—A multi-technique study. Atmos. Environ. 1999, 33, 1803–1817. [Google Scholar] [CrossRef]
- Azevedo, D.D.A.; Moreira, L.S.; Siqueira, D.S.D. Composition of extractable organic matter in aerosols from urban areas of Rio de Janeiro city, Brazil. Atmos. Environ. 1999, 33, 4987–5001. [Google Scholar] [CrossRef]
- Tao, S.; Eglinton, T.I.; Montluçon, D.B.; McIntyre, C.; Zhao, M. Diverse origins and pre-depositional histories of organic matter in contemporary Chinese marginal sea sediments. Geochim. Cosmochim. Acta 2016, 191, 70–88. [Google Scholar] [CrossRef]
- Tao, S.; Eglinton, T.I.; Montluçon, D.B.; McIntyre, C.; Zhao, M. Pre-aged soil organic carbon as a major component of the yellow river suspended load: Regional significance and global relevance. Earth Planet. Sci. Lett. 2015, 414, 77–86. [Google Scholar] [CrossRef]


| Sampling Time | TSP | TOC | n-Alkanes | UCM 1 | n-FAs | Alkanols | ||||||||||||||
|---|---|---|---|---|---|---|---|---|---|---|---|---|---|---|---|---|---|---|---|---|
| Yield μg/m3 | Yield μg/m3 | Content wt % | δ13CTOC ‰ | Yield ng/m3 | CPIΣ15–36 | CPIΣ21–26 | CPIΣ29–36 | Cmax | Yield ng/m3 | U/R | Yield ng/m3 | CPIΣ12–32 | CPIΣ22–32 | Cmax | Unsaturated | C18:1/C18:0 | Yield ng/m3 | CPIΣ22–32 | Cmax | |
| May 2015 | 43.5 | 5.28 | 12.1 | −27.0 | 23.1 | 1.7 | 0.6 | 2.4 | C31 | 156.9 | 5.9 | 70.4 | 28.6 | 3.9 | C16 | 5.6 | 0.34 | 13.6 | 10.9 | C28 |
| Jun. 2015 | 41.8 | 4.62 | 11.1 | −25.7 | 16.1 | 1.8 | 0.7 | 2.3 | C31 | 95.6 | 5.0 | 58.0 | 23.2 | 3.9 | C16 | 5.7 | 0.42 | 11.3 | 11.1 | C28 |
| Jul. 2015 | 27.4 | 3.67 | 13.4 | −25.8 | 15.9 | 2.0 | 0.7 | 2.5 | C31 | 80.1 | 4.3 | 51.9 | 20.2 | 4.1 | C16 | 9.6 | 1.01 | 14.2 | 11.3 | C30 |
| Aug. 2015 | 43.5 | 5.48 | 12.6 | −26.0 | 17.2 | 1.9 | 0.6 | 2.5 | C31 | 120.0 | 5.9 | 69.7 | 26.3 | 4.2 | C16 | 10.3 | 0.71 | 14.3 | 11.8 | C30 |
| Sept. 2015 | 28.9 | 5.32 | 18.4 | −25.7 | 23.1 | 1.9 | 0.8 | 2.5 | C31 | 85.1 | 3.2 | 59.1 | 21.0 | 3.8 | C16 | 6.9 | 0.57 | 22.1 | 11.6 | C28 |
| Oct. 2015 | 27.6 | 6.53 | 23.7 | −25.4 | 30.6 | 2.0 | 0.5 | 2.8 | C29 | 126.5 | 3.6 | 53.3 | 16.9 | 3.4 | C16 | 4.8 | 0.41 | 22.5 | 8.3 | C28 |
| Nov. 2015 | 34.7 | 5.03 | 14.5 | −26.3 | 37.3 | 1.6 | 0.7 | 2.3 | C29 | 247.9 | 5.9 | 57.3 | 19.0 | 3.3 | C16 | 3.9 | 0.27 | 17.4 | 10.6 | C28 |
| Dec. 2015 | 51.6 | 7.77 | 15.1 | −26.4 | 48.4 | 1.5 | 0.7 | 2.6 | C29 | 295.7 | 5.6 | 73.5 | 21.5 | 3.2 | C16 | 5.3 | 0.25 | 23.2 | 9.9 | C28 |
| Jan. 2016 | 57.4 | 9.20 | 16.0 | −25.9 | 45.9 | 1.3 | 0.8 | 2.1 | C29 | 285.0 | 5.8 | 68.2 | 21.6 | 3.1 | C16 | 4.8 | 0.25 | 20.7 | 9.2 | C28 |
| Feb. 2016 | 70.2 | 9.43 | 13.4 | −25.2 | 53.7 | 1.6 | 0.8 | 2.5 | C31 | 201.5 | 3.4 | 61.0 | 13.7 | 3.0 | C16 | 3.5 | 0.22 | 25.8 | 8.3 | C28 |
| Mar. 2016 | 76.5 | 11.97 | 15.6 | −25.5 | 61.8 | 1.5 | 0.7 | 2.4 | C31 | 398.3 | 5.9 | 86.8 | 18.6 | 3.0 | C16 | 6.5 | 0.27 | 35.1 | 15.5 | C28 |
| Apr. 2016 | 84.1 | 8.04 | 9.6 | −26.0 | 34.0 | 1.6 | 0.6 | 2.4 | C31 | 321.3 | 8.5 | 91.6 | 25.9 | 3.6 | C16 | 8.1 | 0.38 | 19.5 | 10.7 | C28 |
| Cities | The Adjacent Sea | Hydrocarbons | n-FAs | n-Alkanols | ||
|---|---|---|---|---|---|---|
| n-Alkanes Concentrations | UCM Concentration | U/R | Concentrations | Concentrations | ||
| Xiamen | East China Sea | ave. 33.9; 15.9~61.8 | ave. 201.2; 80.1~398.3 | ave. 5.3; 3.2~8.5 | ave. 66.8; 51.9~91.6 | ave. 20.0; 11.3~35.1 |
| Qingdao | Yellow Sea | ave. 217.1; 52.8~371.4 | ave. 653.6; 247.3~925.2 | |||
| Hongkong | South China Sea | 235.5 | 208.7 | 40.5 | ||
| SE coast of Australia | South Pacific Ocean | ave. 43.6; 1.6~80 * | ave. 2.7; 1.1~5.3 | ave. 37.3; 2.8~110 | ave. 97.2; 1.7~380 | |
| Rio de Janeiro, Brazil | Atlantic Ocean | ave. 243.4; 58.3~581.2 * | ave. 3.2; 1.9~4.6 | |||
| Urban Los Angeles | East of North Pacific Ocean | 294.1 * | ave. 4.6; 0.6~13.0 | 379.3 | 1045.3 | |
| A range of data represents a temporal variability for Xiamen and Qingdao, and a spatial variability for the rest of cities. | ||||||
© 2017 by the authors. Licensee MDPI, Basel, Switzerland. This article is an open access article distributed under the terms and conditions of the Creative Commons Attribution (CC BY) license ( http://creativecommons.org/licenses/by/4.0/).
Share and Cite
Tao, S.; Yin, X.; Jiao, L.; Zhao, S.; Chen, L. Temporal Variability of Source-Specific Solvent-Extractable Organic Compounds in Coastal Aerosols over Xiamen, China. Atmosphere 2017, 8, 33. https://doi.org/10.3390/atmos8020033
Tao S, Yin X, Jiao L, Zhao S, Chen L. Temporal Variability of Source-Specific Solvent-Extractable Organic Compounds in Coastal Aerosols over Xiamen, China. Atmosphere. 2017; 8(2):33. https://doi.org/10.3390/atmos8020033
Chicago/Turabian StyleTao, Shuqin, Xijie Yin, Liping Jiao, Shuhui Zhao, and Liqi Chen. 2017. "Temporal Variability of Source-Specific Solvent-Extractable Organic Compounds in Coastal Aerosols over Xiamen, China" Atmosphere 8, no. 2: 33. https://doi.org/10.3390/atmos8020033
APA StyleTao, S., Yin, X., Jiao, L., Zhao, S., & Chen, L. (2017). Temporal Variability of Source-Specific Solvent-Extractable Organic Compounds in Coastal Aerosols over Xiamen, China. Atmosphere, 8(2), 33. https://doi.org/10.3390/atmos8020033