Article

Seasonal Changing Effect on Airflow and Pollutant Dispersion Characteristics in Urban Street Canyons

1
College of Urban Construction and Environmental Engineering, Chongqing University, Chongqing 400030, China
2
School of Engineering, RMIT University, Bundoora, VIC 3083, Australia
3
School of Civil Engineering, Chang’an University, Chang’an 710064, China
*
Author to whom correspondence should be addressed.
Atmosphere 2017, 8(3), 43; https://doi.org/10.3390/atmos8030043
Submission received: 8 January 2017 / Revised: 17 February 2017 / Accepted: 17 February 2017 / Published: 23 February 2017
(This article belongs to the Special Issue Recent Advances in Urban Ventilation Assessment and Flow Modelling)

Abstract

:
In this study, the effect of seasonal variation on air flow and pollutant dispersion characteristics was numerically investigated. A three-dimensional urban canopy model with unit aspect ratio (H/D = 1) was used to calculate surface temperature distribution in the street canyon. Four representative time events (1000 LST, 1300 LST, 1600 LST and 2000 LST) during typical clear summer and winter days were selected to examine the air flow diurnal variation. The results revealed the seasonal variation significantly altered the street canyon microclimate. Compared with the street canyon surface temperature distribution in summer, the winter case showed a more evenly distributed surface temperature. In addition, the summer case showed greater daily temperature fluctuation than that of the winter case. Consequently, distinct pollutant dispersion patterns were observed between summer and winter scenarios, especially for the afternoon (1600 LST) and night (2000 LST) events. Among all studied time events, the pollutant removal performance of the morning (1000 LST) and the night (2000 LST) events were more sensitive to the seasonal variation. Lastly, limited natural ventilation performance was found during the summer morning and the winter night, which induced relatively high pollutant concentration along the pedestrian height level.

1. Introduction

According to the latest statistics from the World Health Organization (WHO), the world’s urban population now stands at 3.7 billion, implying more than half of the global population resides in cities. This rapid urbanization poses challenges for sustainable development and public health. In urban environments, especially in those areas where population and traffic density are relatively high, human exposure to hazardous substances is significantly increased due to continuous traffic emissions and poor natural ventilation in street canyons.
The ventilation and pollutant dispersion process in street canyons have been extensively investigated [1,2,3]. Canyon geometry, ambient wind condition and thermal stratification are found to be the main determinants of air flow regimes in urban street canyons [4,5]. Influential factors such as building morphology, canyon aspect ratio, ambient wind speed and direction were intensively studied. Hang et al. [6,7,8] investigated the effect of geometry morphology on street canyon ventilation by varying aspect ratio, length and building packing density. They found that lowering aspect ratios or increasing street lengths may enhance the pollutant removal. As driven by ambient wind, street canyon flow is significantly influenced by external wind direction [9]. Soulhac et al. [10] built a theoretical two-region street canyon model and revealed that the mean longitudinal velocity is proportional to the cosine of the angle of incident for any wind direction. Ryu et al. [11] presented four regression equations of canyon-averaged wind speed as the function of canyon aspect ratio for different ambient wind directions. Wind tunnel experimental results reported by Gromke and Ruck [12] indicated that the trends of pollutant concentration at side walls with increasing crown porosity or tree-stand density may be altered by ambient wind direction.
Numerous research studies were also conducted on air flow and pollutant dispersion changes due to the street canyon surface heating effect [13,14,15]. Measurement results demonstrated that the surface temperature varies with the solar radiation and the surface albedo [16,17,18], and the temperature difference between sunlit and shadow walls in summer may exceed 10 °C [19,20]. Heating effect may cause unstable stratification, and significantly influent flow and pollutant transport in urban street canyons [21,22]. Studies conducted by Cheng et al. [23], Cheng and Liu [24] revealed the pollutant removal performance was improved when the stability decreases with ground heating. Cai [25] found the differential wall heating significantly affected street canyon ventilation, and the venting velocity and exchange velocity linearly increased with wall heating. Bottillo et al. [26,27] investigated the impact of solar radiation on the wind flow field and heat transfer within a street canyon. They found apparent vortex structure and heat transfer coefficient changes occurred along the length of the canyon for all studied wind conditions.
Recently, studies focused on the differential surface heating due to atmospheric instability and solar tilt becomes an emerging research topic [28]. Kwak and Baik et al. [29] demonstrated non-uniform wall heating played crucial roles in the pollutant removal process, and its exchange amount can be comparable with that by turbulent flow during afternoon. Nazarian and Kleissl [30] performed unsteady simulations of a street-scale urban environment based on idealized geometries, in which, non-uniform surface heating caused by solar insolation and building shadowing were dynamically coupled with the airflow field. In their following study [31], they found the highest convective heat transfer coefficient occurred at the windward wall throughout the day. Our previous studies [32,33] have identified obvious variation of air flow and pollutant dispersion due to surface heating diurnal variation under clear and haze-fog weather conditions.
Despite the numerous studies previously conducted, researches focusing on the seasonal difference considering the solar radiation and the anthropogenic heating from the building interiors remain limited, and their effects on air flow and pollutant transport are not clear [34]. To reveal the seasonal differences of flow patterns and pollutant dispersion in street canyons between summer and winter, numerical simulations considering exterior solar radiation and interior anthropogenic heating were performed in this paper.

2. Methodology

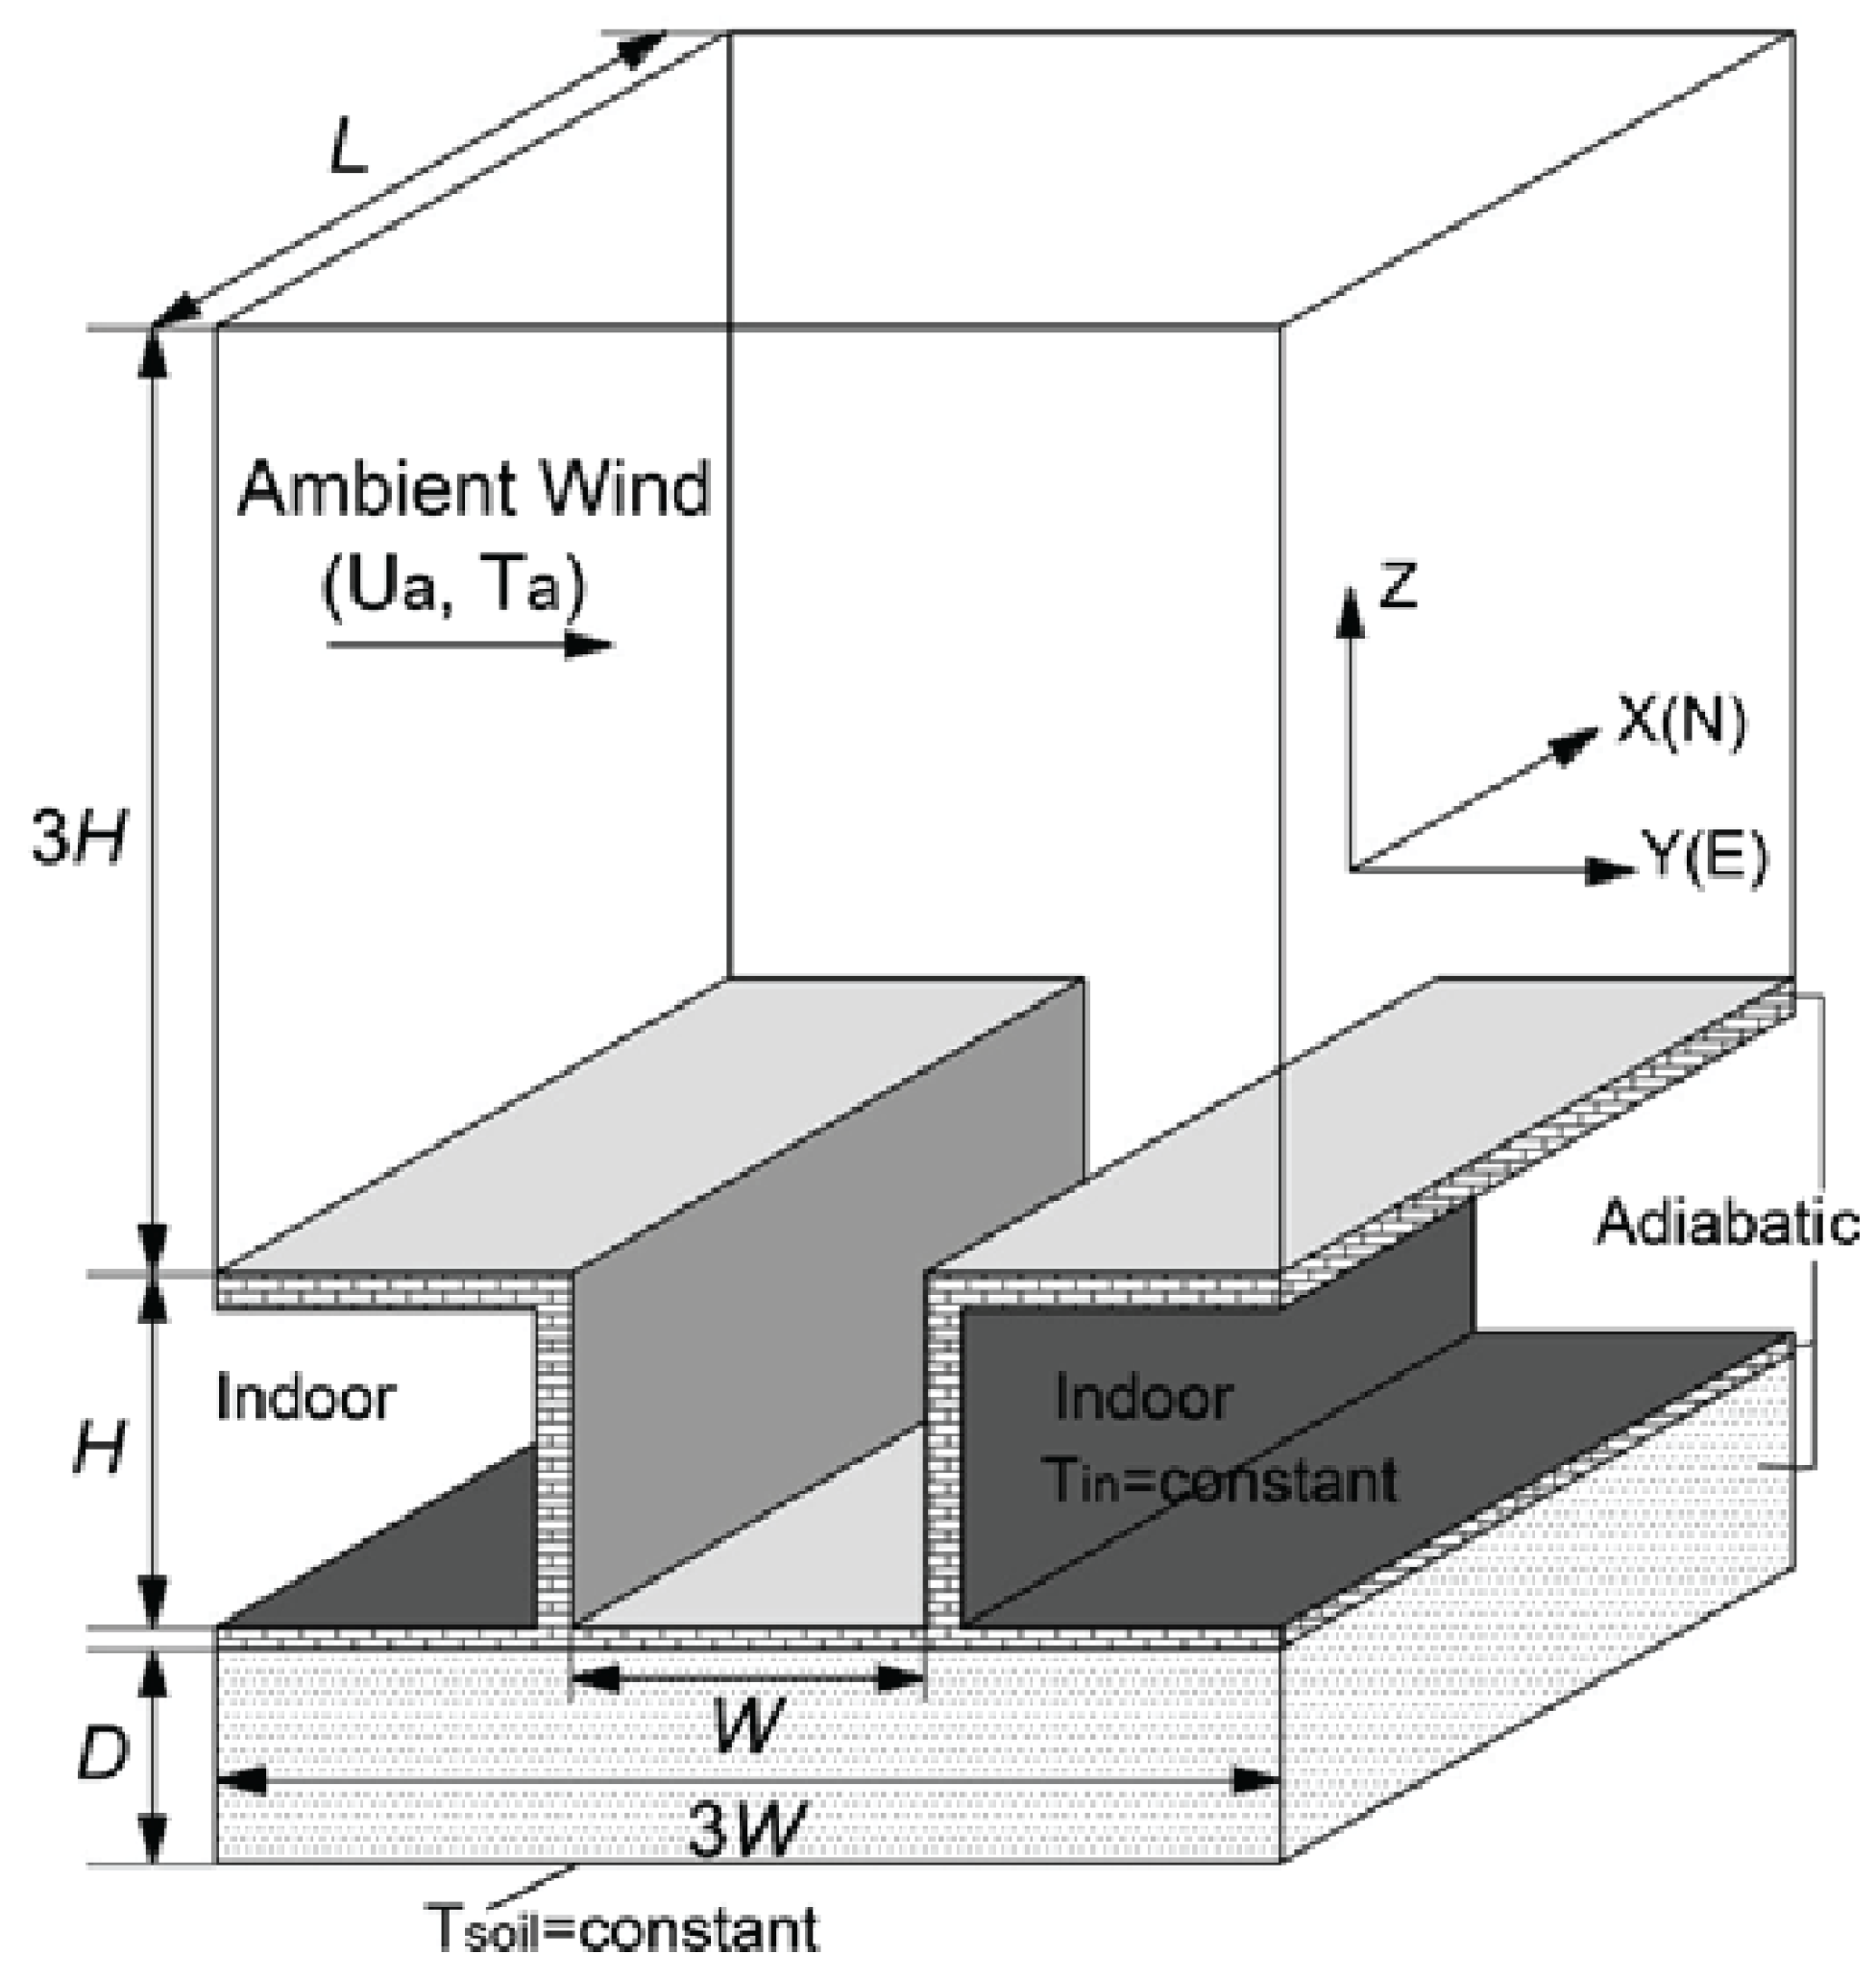
2.1. Numerical Model

In this study, a three-dimensional hypothetical street canyon model with an aspect ratio of unity was used (Figure 1). The street axis was aligned with the x-direction (north-south). Both the building height (H) and street canyon width (W) were set as 20 m. The fluid domain is 5H (x-direction) × 3H (y-direction) × 4H (z-direction).
Symmetry boundary condition was imposed at two side planes, while all other solid facets were set as no slip boundaries. A prescribed logarithmic profile [35] was adopted as the prevalent wind condition at the upstream inlet.
U ( z ) = u A B L * κ ln ( z + z 0 z 0 )
k = u A B L * 2 C μ
ε = u A B L * 3 κ ( z + z 0 )
u A B L * = κ U 10 ln 1 ( 10 + z 0 z 0 )
where u A B L * is the atmospheric boundary layer (ABL) friction velocity, z is the height above the street, z 0 is the aerodynamic roughness length, set as 0.03 m, κ is von Karman’s constant, set as 0.41, U 10 is the reference horizontal velocity at 10 m high, set as 1 m/s [36].
Figure 2 illustrates the sunlight angle variation through four representative time events, where the leeward wall receives direct solar radiation during the morning event (Figure 2a), the ground receives direct solar radiation during the noon event (Figure 2b), the windward wall receives direct solar radiation during the afternoon event (Figure 2c), and no solar radiation exists during the night (Figure 2d).
The Typical Meteorology Year weather data file of Designer’s Simulation Toolkit (DeST) software was used as the meteorological database [37,38]. Two sets of meteorological data selected from clear days in summer (18 July) and winter (17 January) of Beijing (39.92° N, 116.46° E), China were chosen and plotted in Figure 3.
The ambient air temperature was imposed at the inlet and the outlet of the computational domain, while the thermal stratification was set as neutral. Both indoor and underground surfaces were specified as constant temperature conditions. The internal building temperature was set as 299 K [26] for summer and 293 K [39] for winter, respectively. The daily-averaged air temperature (296 K for summer, and 275 K for winter) was assumed to be the soil temperature at the depth of 2 m. In reality, the soil temperature fluctuates annually and daily due to variations in air temperature and solar radiation, and it varies at different depths due to the soil texture, soil water content changes. In this study, these influential factors were not considered.
The solar ray tracing algorithm and the discrete ordinates (DO) model were chosen to include the diurnal solar radiation effect and radiation transfer between street canyon facets [30]. The transmissivity of the inlet, outlet and the top boundary was set as 1.0, and the effective sky temperature was used as external radiation condition [40]. The physical properties of all facets were referred from Idczak’s study [41], and model details are listed in Table 1.
Tracing particles representing vehicular emissions were released from a line source located along the center-line of the street for the street canyon ventilation assessment purpose [42,43]. Inert ash particles with the diameter of 2 × 10⁻⁶ m and density of 1 kg/m3 were used to represent airborne PM2.5 pollutant. The total mass of the tracing particles was set as 1 × 10⁻² kg [32]. Discrete Phase Model (DPM) was used to predict the particle dispersion characteristic, and all street canyon facets were set as reflect boundary for the particles. The governing equation is given below [44]:
d u p d t = F D ( u u p ) + g x ( ρ p ρ ) ρ p + F x
where F x is an additional acceleration (force/unit particle mass) term, F D ( u u p ) is the drag force per unit particle mass and
F D = 18 μ ρ p d p 2 C D Re 24
Here, u is the fluid phase velocity, u p is the particle velocity, μ is the molecular viscosity of the fluid, ρ is the fluid density, ρ p is the density of the particle, and ρ p is the particle diameter. Re is the relative Reynolds number, which is defined as
Re ρ d p | u p u | μ
The Discrete Random Walk (DRW) model used in ANSYS Fluent was used to simulate dispersed particles due to turbulent dispersion.
A mesh independency study was conducted over six grid scales. To address the buoyancy force in near wall regions, six different first layer grid thicknesses varied from 0.05 m to 0.4 m were chosen, while the inflation layer expansion ratio was kept as 1.1 in the whole domain. The mesh elements number is 2,070,145 and 560,583 for the finest and coarsest grids, respectively. As listed in Table 2, the air flow velocity became stable once the mesh elements number exceeded 780,318. Taking the computational efficiency into consideration, the case having 1,026,221 mesh elements (the first layer thickness is 0.15 m, 0.75% of the street’s width) was chosen for numerical analysis in this study. The scalable wall function was adopted to solve the near-wall convection in this model. y+ values of street canyon surfaces were around 100, which is within the desirable range of the scalable wall function.
The CFD model of this study is based on fluid flow and transport principles for incompressible turbulence flow in terms of mass, momentum and energy conservation equations. Reynolds number in all cases of this study is around 1 × 10⁶. Since many previous [45,46] and recent studies [47,48,49] indicate that the RNG k-epsilon model has good performance on both street canyon flow pattern and pollutant dispersion predictions, equations for turbulent kinetic energy and turbulent dissipation rate were solved with RNG k-eplison closure scheme. Boussinesq approximation was employed to address temperature induced density variation [45,47]. All governing equations were solved by the commercial CFD code ANSYS Fluent (ANSYS, Canonsburg, PA, USA) with finite volume method. The SIMPLE scheme was used for the pressure and velocity coupling. For all transport equations, the second-order scheme was used to provide better numerical accuracy, and the residual criterion for convergence was set as 1 × 10⁻⁴. The energy conservation solved in Fluent is based on the equation given below [50]:
Δ Δ t ( ρ E ) + · ( v ( ρ E + p ) ) = · ( k e f f T J h j J j + ( τ ¯ e f · v ) ) + S h
where k e f f is the effective conductivity, and J j is the diffusion flux of species j.

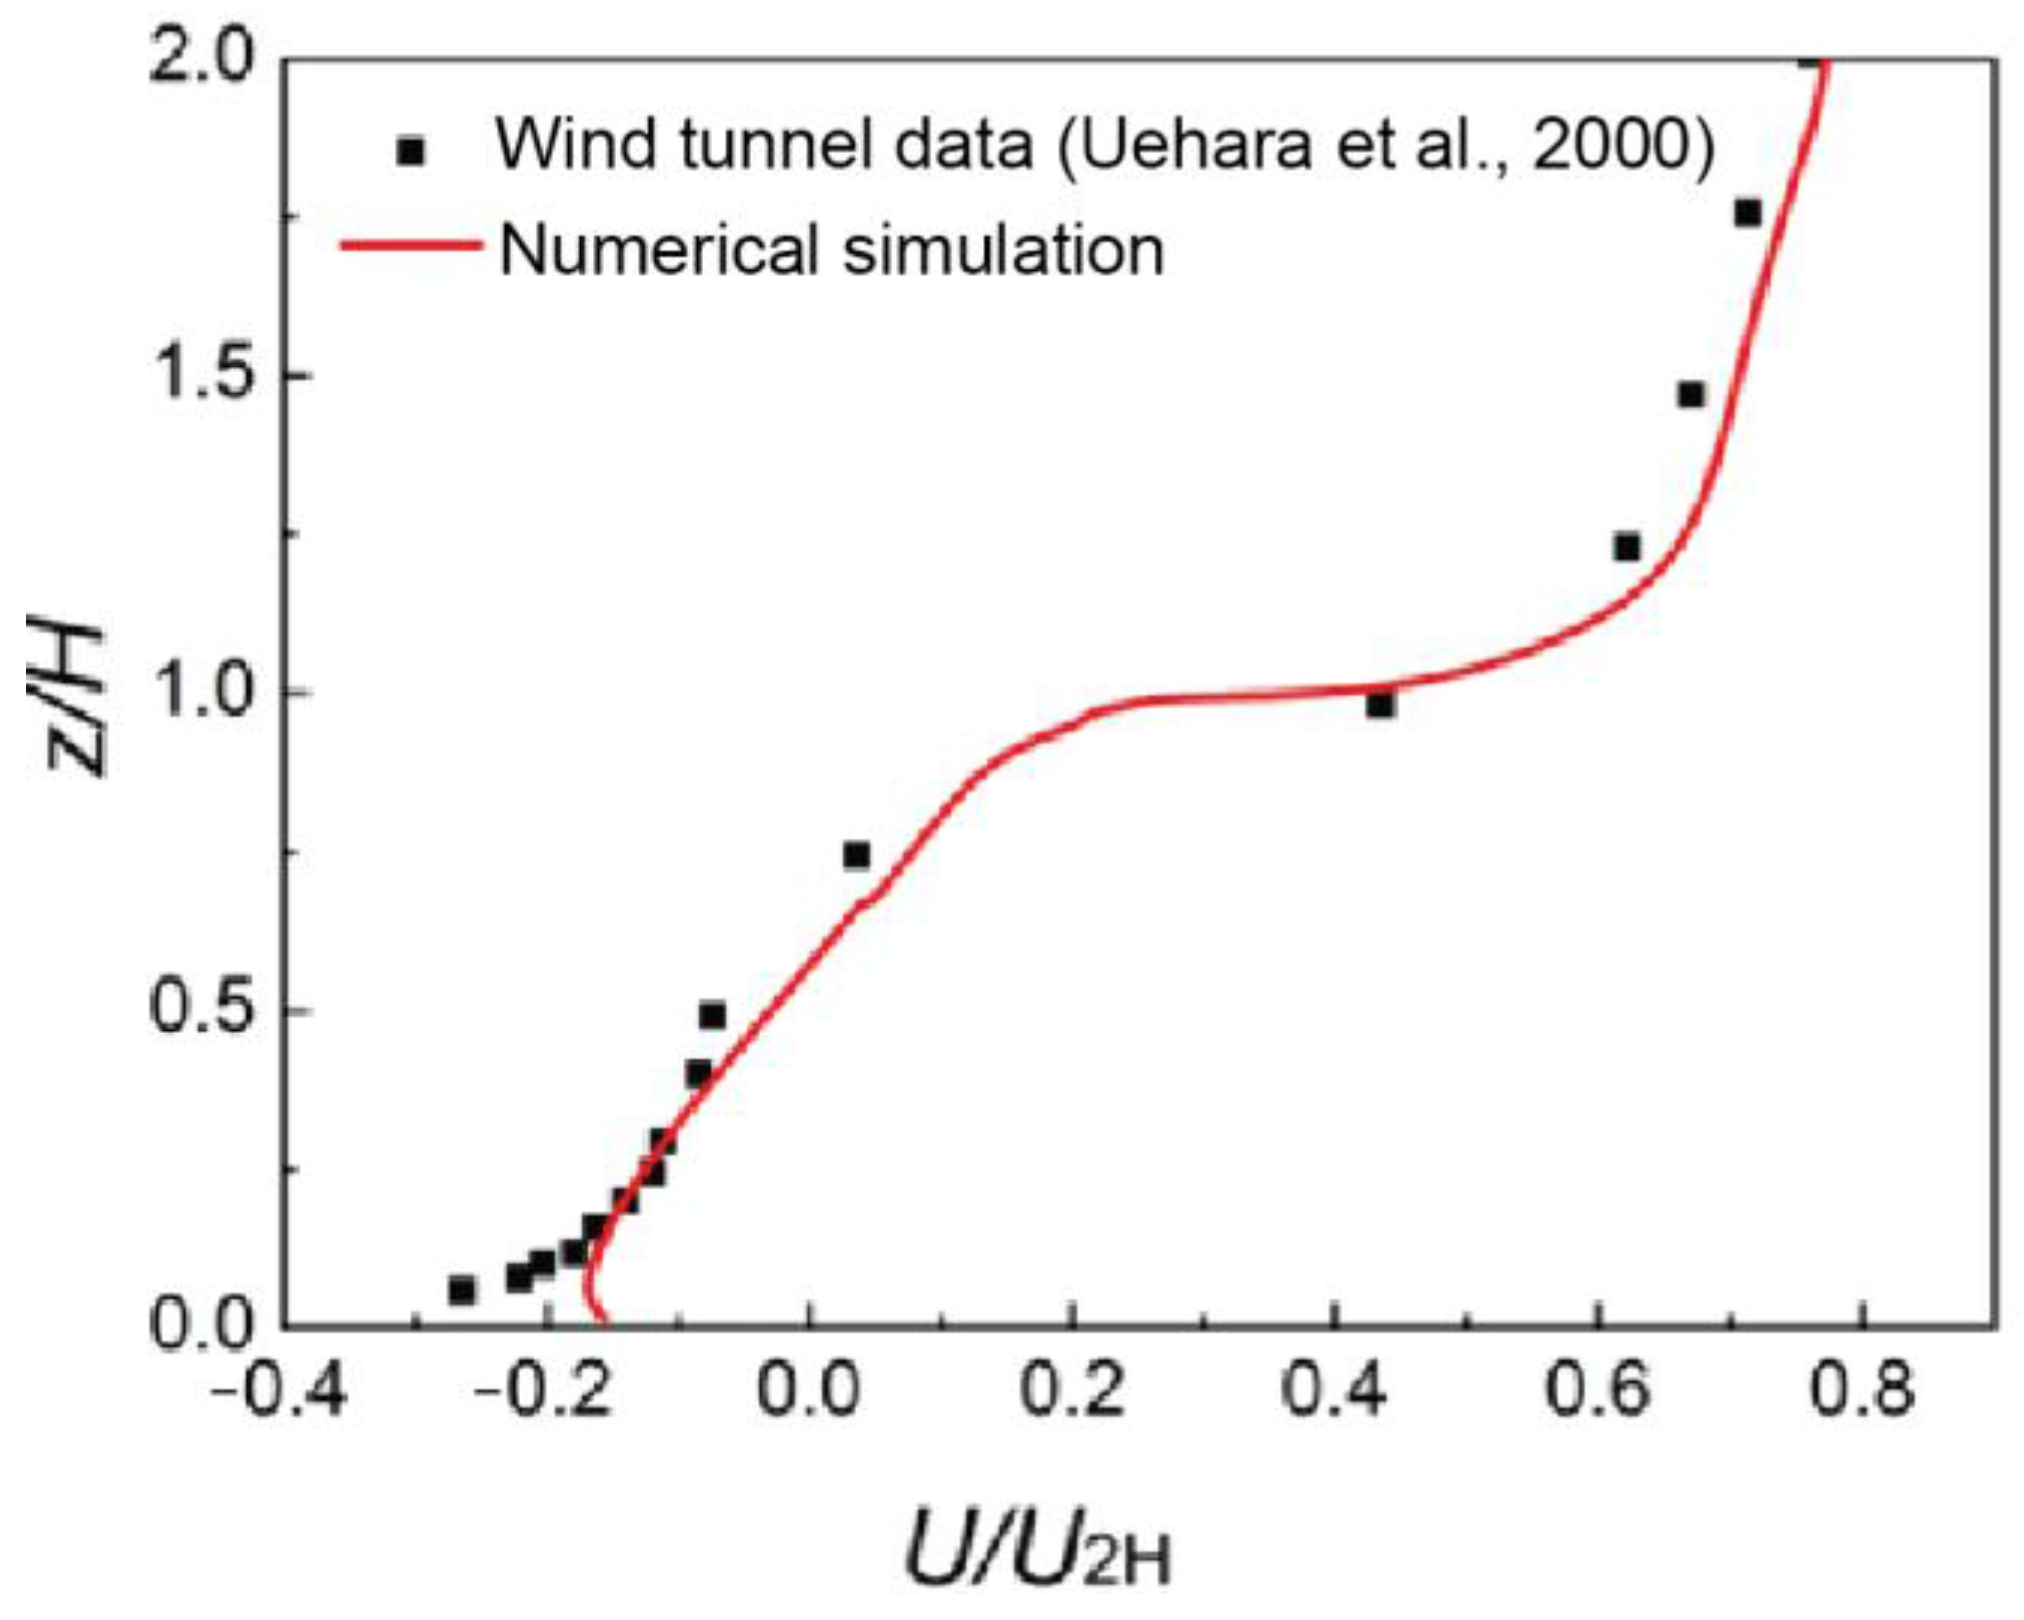
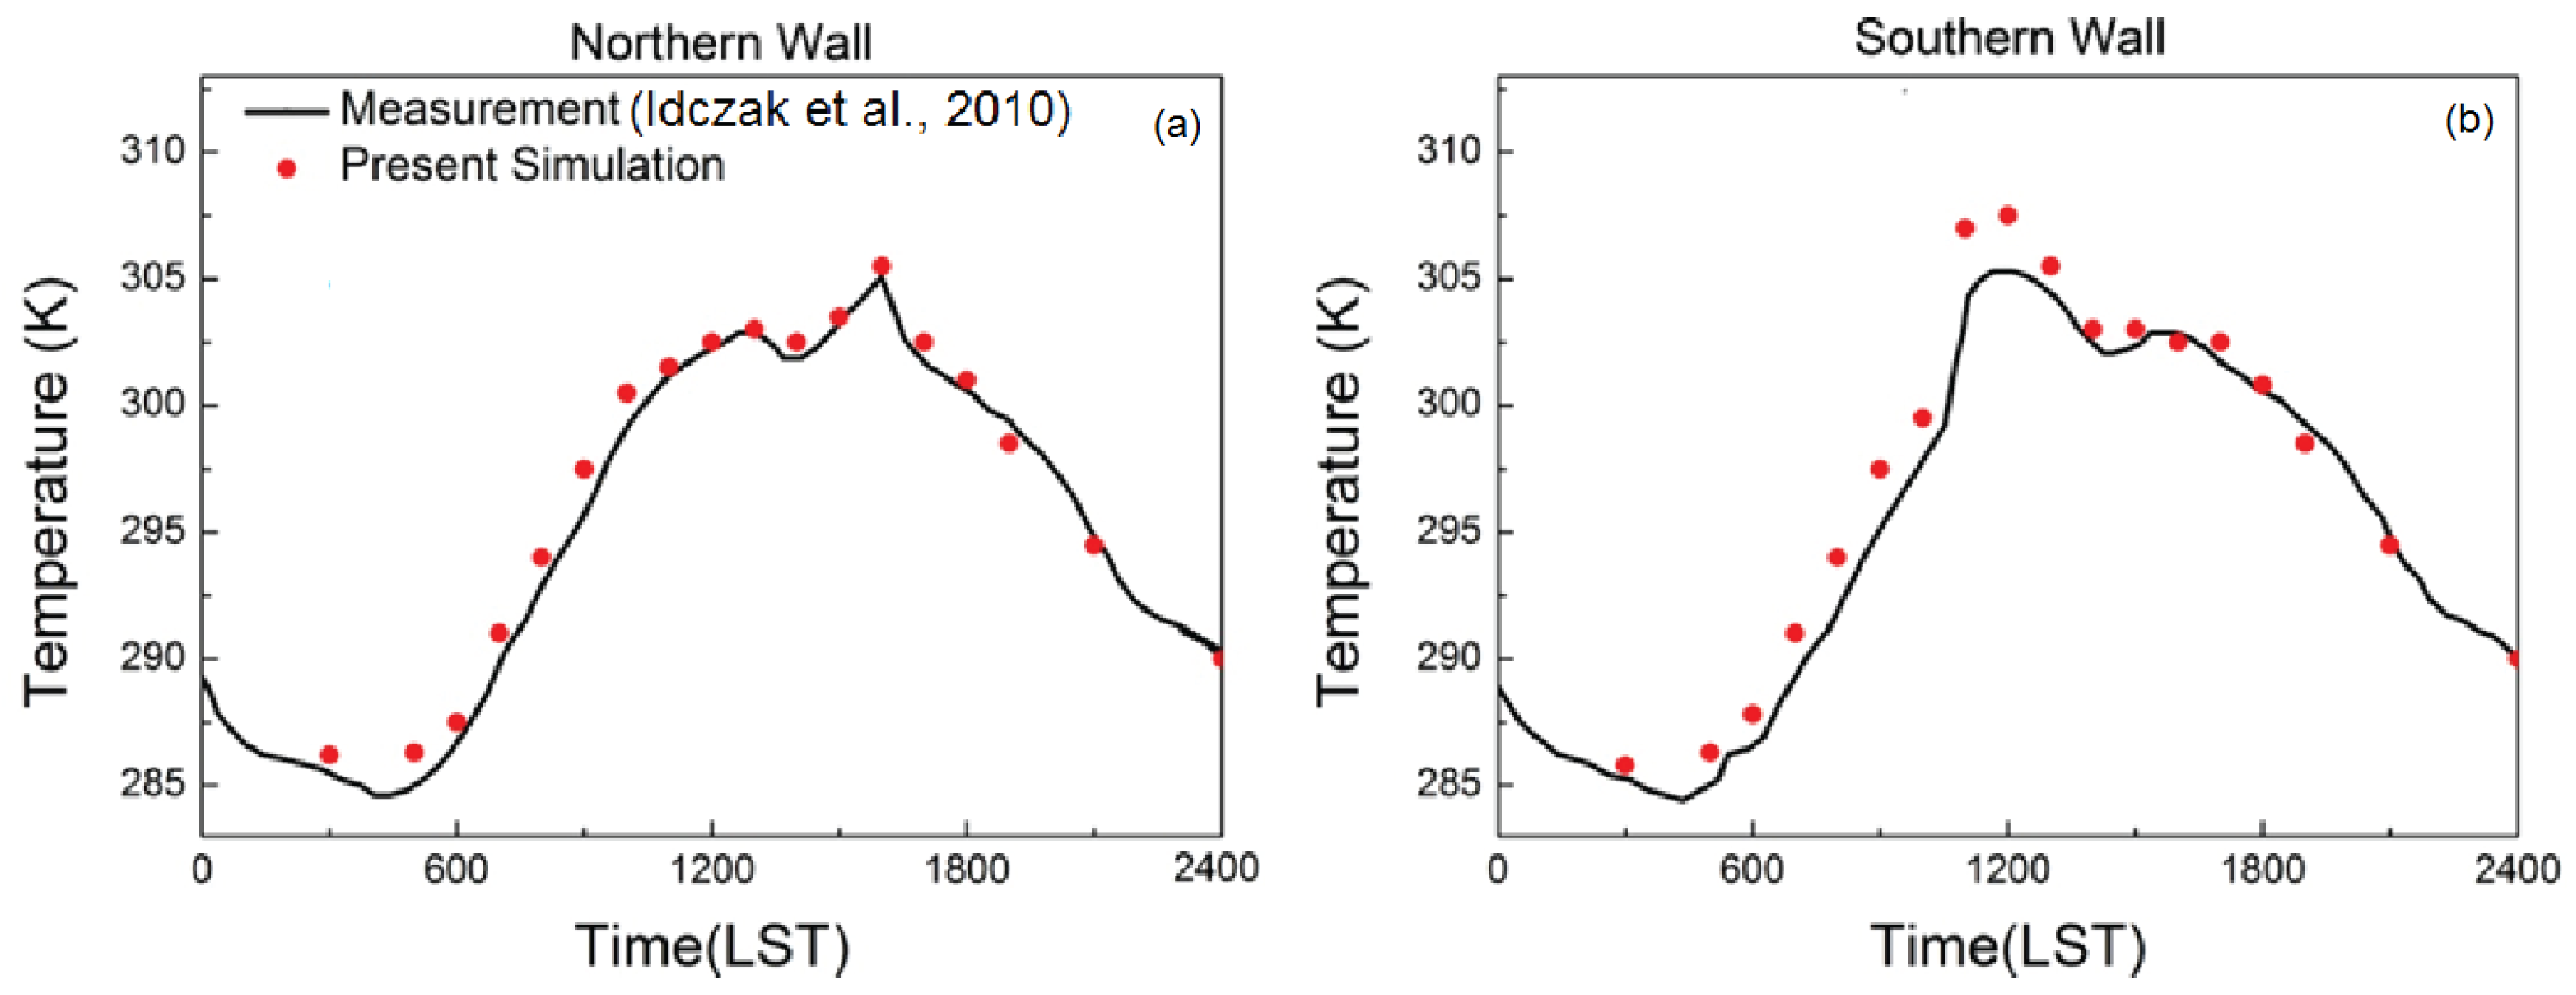
2.2. Model Validation

Despite many field measurements and wind tunnel experiments have been conducted, almost none of them combined surface heating and air flow measurement together. In the current study, the numerical model was validated against a field measurement [41] for surface heating comparison and a wind tunnel experiment [51] for air flow velocity comparison, separately.
Figure 4 compares the numerical prediction of surface temperature with a field measurement conducted by Idczak et al. [41]. It should be noted that this field measurement records thermal environment data including solar radiation, surface and air temperature based on a street canyon with the aspect ratio of 2.48, and the street direction was kept E–W, which is different from the benchmark model used in this study. Thus, an extra street canyon model was built for numerical validation purpose, which applied identical meteorology and geometry conditions with Idczak et al.’s [41] measurement. RNG k- epsilon turbulence model with scalable wall function was adopted to solve the governing equations. 235,985 structured cells were built in the domain with the minimum size of 0.018 m (0.75% of the street’s width) near the surfaces, and an expansion factor equals to 1.1 was used. The results showed y+ values of street canyon surfaces were around 100. The surface temperature distributions of northern and southern walls were compared. Despite minor over predictions can be found around noon for the southern wall, the simulated surface temperature well agreed with the recorded data. This minor discrepancy can be attributed to the underestimated wall thermal storage, and similar discrepancy can be founded in other relevant numerical studies [30,41].
Figure 5 compares the normalized horizontal velocity along the centerline of the street canyon with wind tunnel data referred from Uehara et al.’s work [51]. In the wind tunnel experiment, isolated cubic building blocks with the aspect ratio of 1 were used, and constant vertical temperature difference was kept by heating the bottom surface. Numerical simulations using the current street canyon model (shown in Figure 1) were compared with the wind tunnel data under the same bulk Richardson number (Rb = −0.21); the Rb calculation method is shown as below:
R b = g H ( T i n T g ) ( T a + 273 ) U 2 H 2
where, H is the building height, T a is the average air temperature inside the street canyon, and U 2 H is the horizontal velocity at Z = 2H, T i n is the inlet air temperature (equals to the ambient air temperature), and T g is the ground temperature.
The data comparison showed a good agreement. However, the current numerical model was slightly under predicted the near ground wind. This under prediction could be attributed to the geometric difference: the street canyon model used in the wind tunnel experiment has a shorter street length than that of the current numerical model, which allows additional airflow enters the street canyon from building sidewalls.
Based on the good agreements demonstrated through above two case studies, the prediction accuracy of the current numerical model is validated, which confirms the proposed numerical modelling approach is capable to provide wind and thermal environment prediction analysis for street canyons.

3. Results and Discussion

In this section, four typical time events, morning (1000 LST), noon (1300 LST), afternoon (1600 LST) and night (2000 LST) were used for results analysis. The diurnal variation of surface temperature, air flow patterns and pollutant dispersion were analyzed and compared between summer and winter seasons.

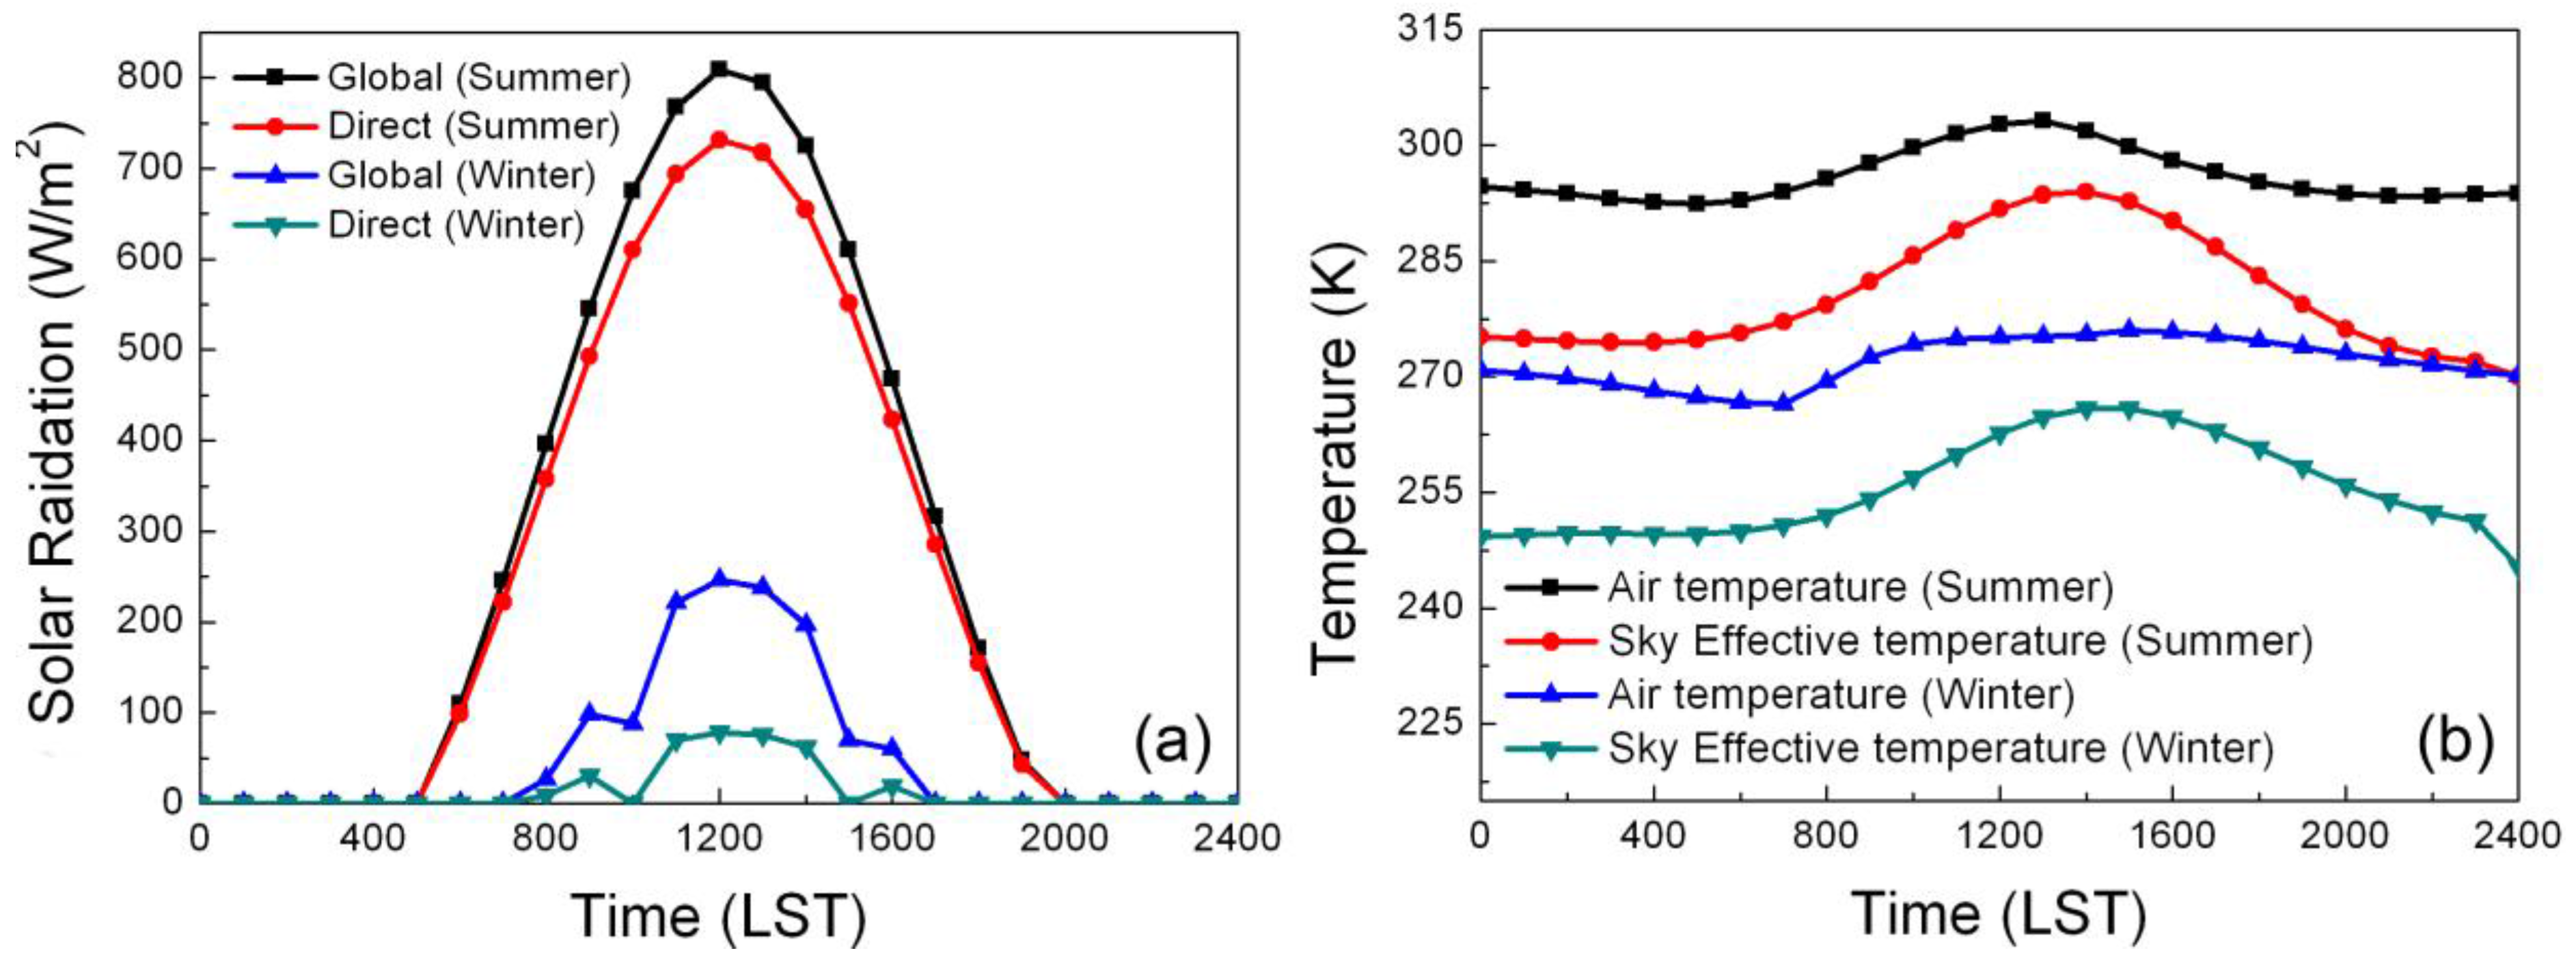
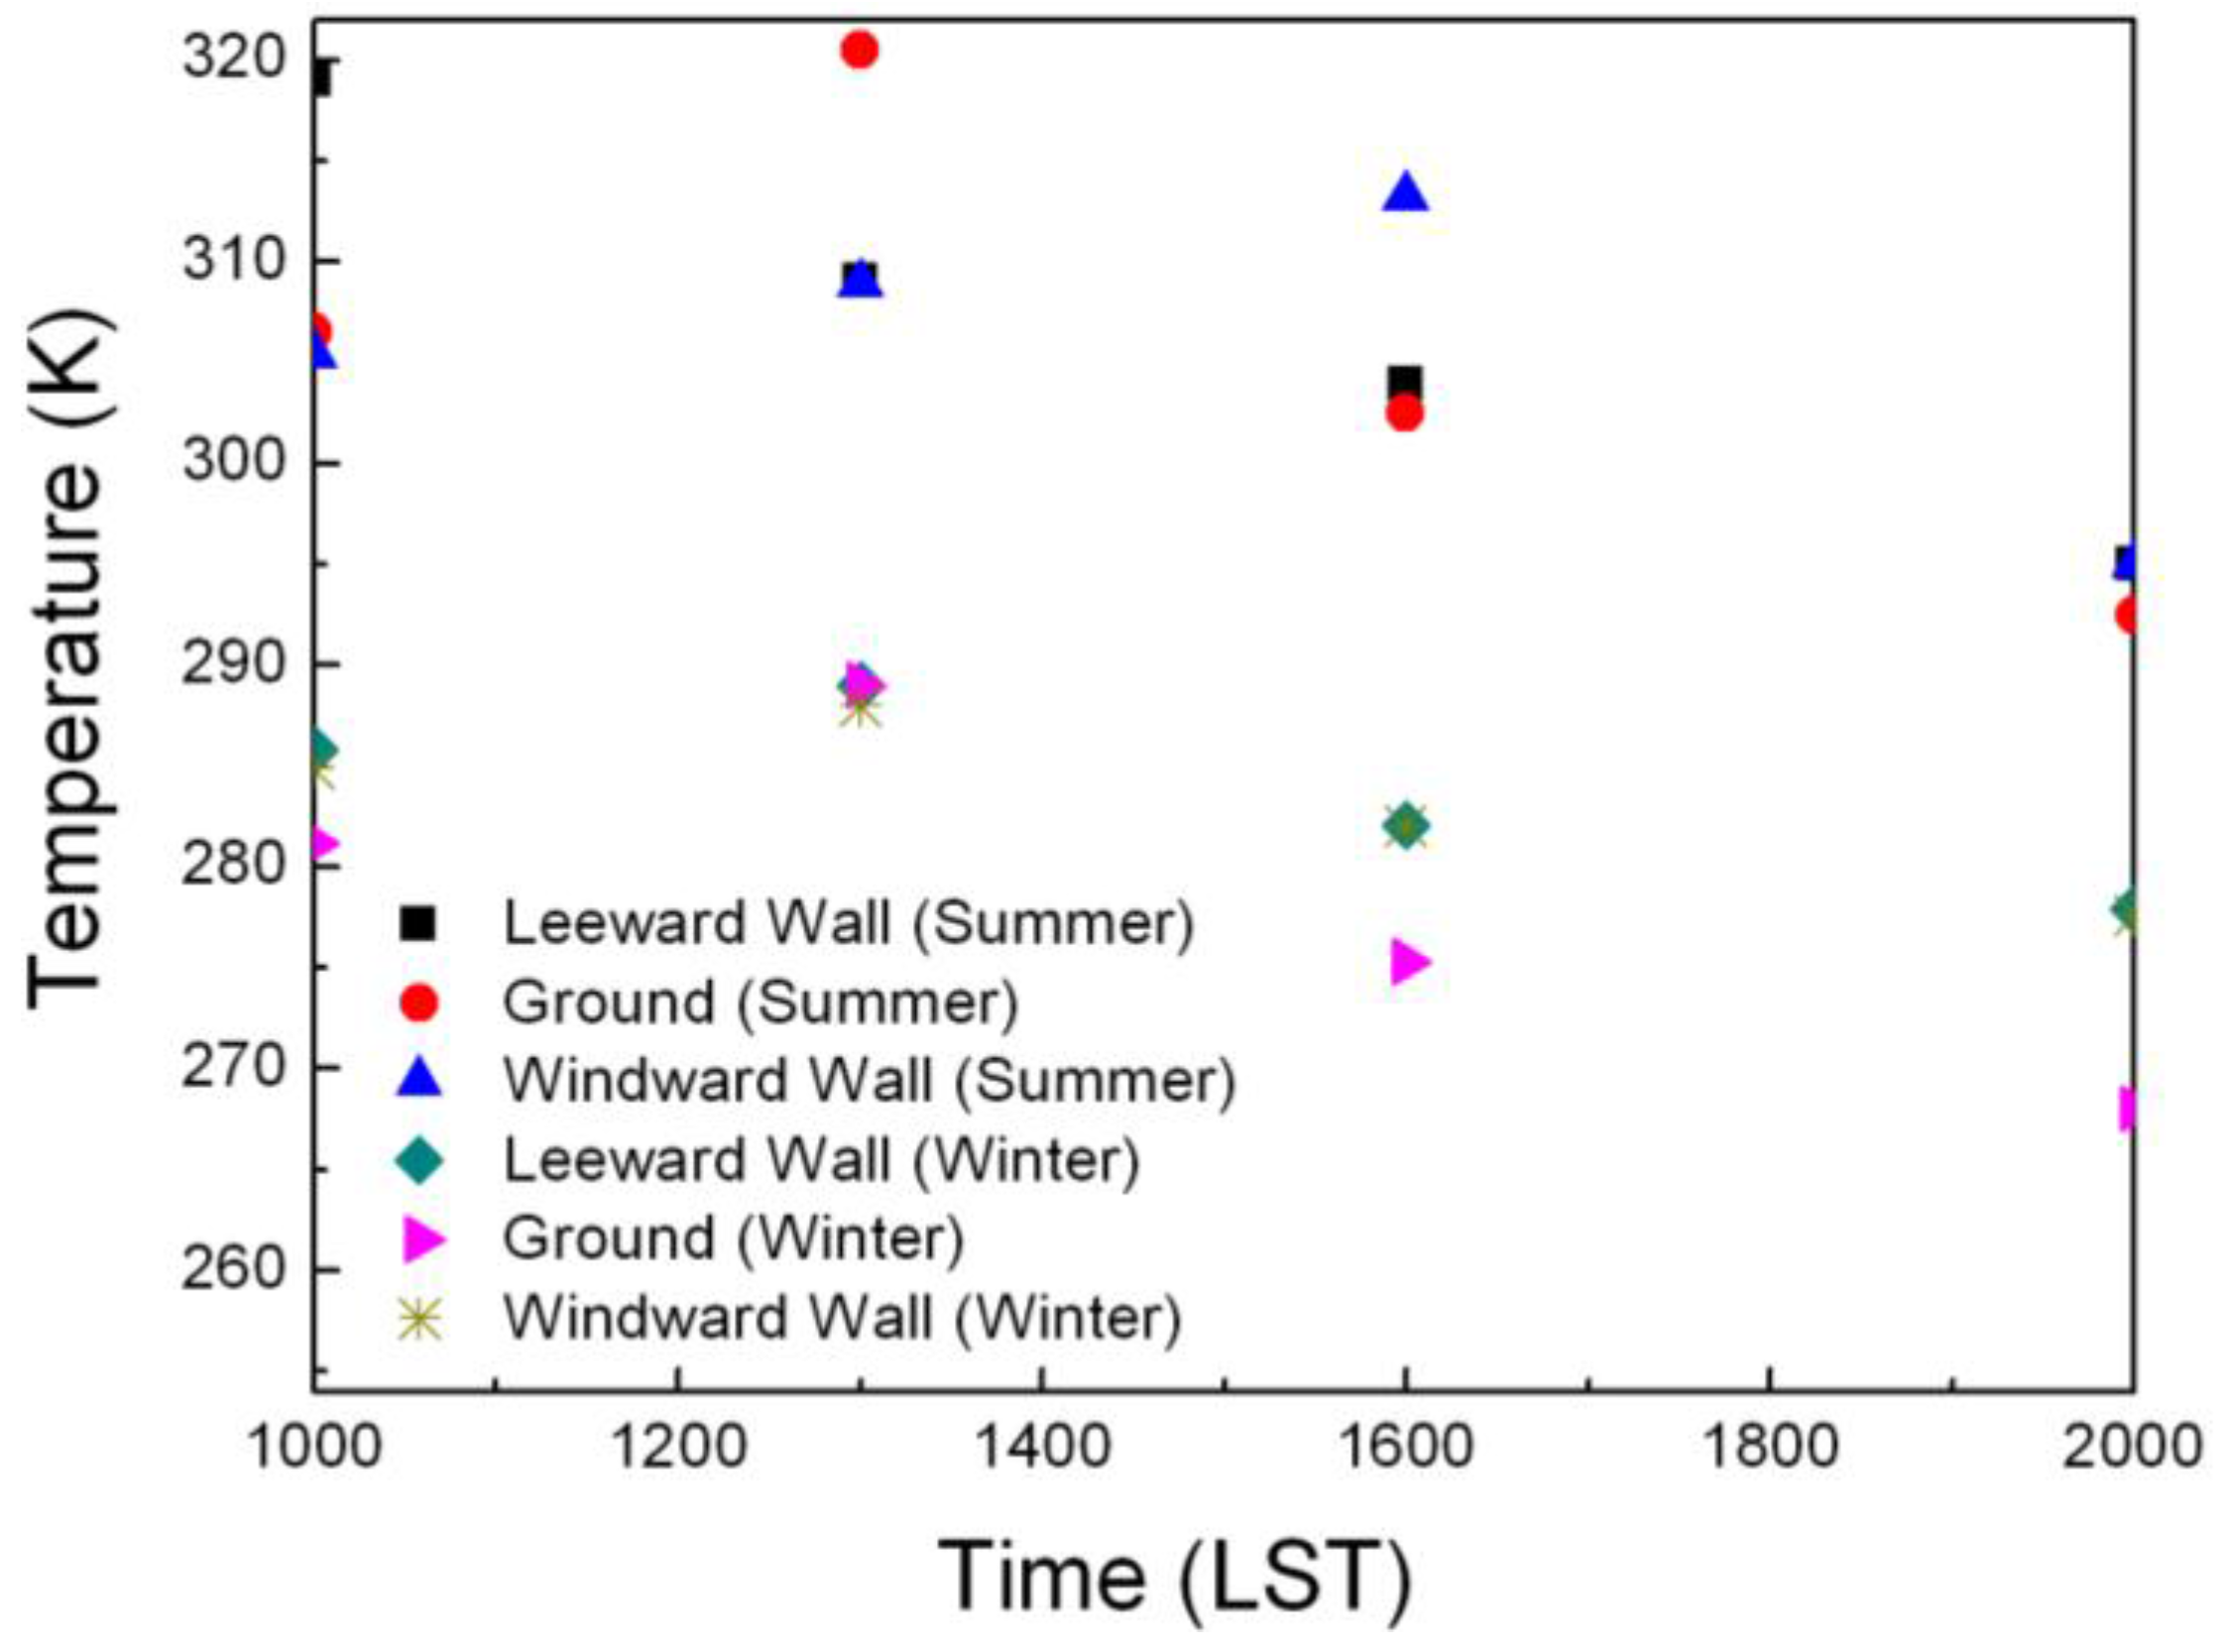
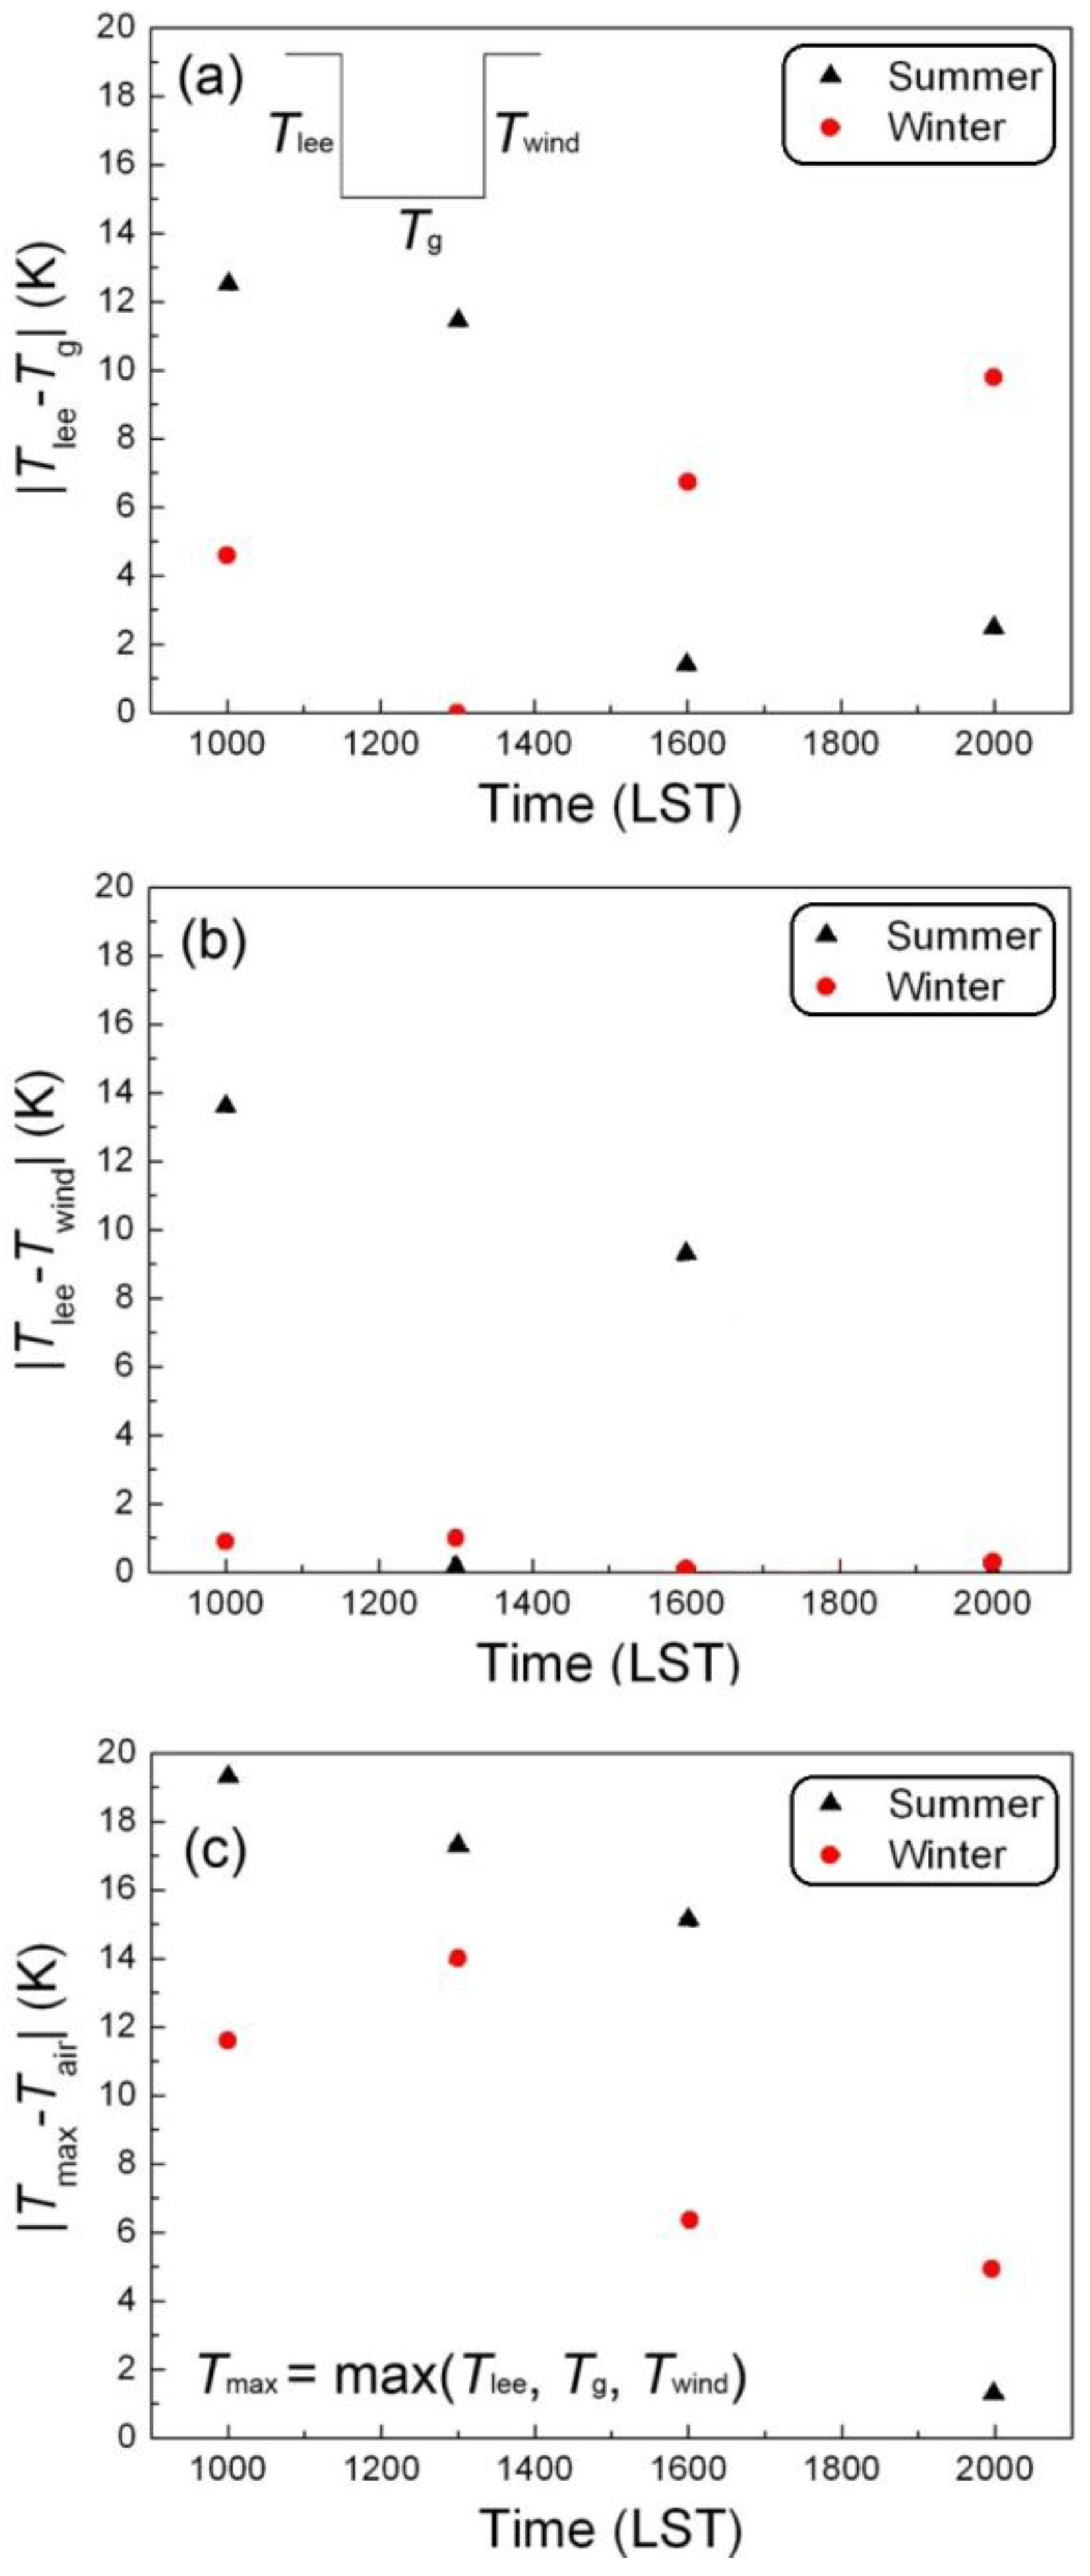
3.1. Surface Temperature

Figure 6 illustrates diurnal surface temperatures of leeward wall, ground and windward wall under summer and winter conditions. For the ground temperature, the same diurnal variation trend was observed both in winter and summer cases, which peaks at 1300 LST for both cases. In contrast, considerable seasonal differences were found for the windward and leeward walls. For the summer condition, the maximum temperature of leeward and windward wall occurred at 1000 LST (319 K) and 1600 LST (313.2 K). For the winter condition, almost identical diurnal varying trend was found between the windward and leeward walls, which peaks at 1300 LST with the value of 288.5 K. This is mainly because the different anthropogenic heating condition inside buildings. During the summer season, indoor temperature keeps lower than ambient air temperature during daytime due to the cooling effect of air conditioning systems. The solar radiation effect dominates building surface temperature variation. However, for the winter season, combining heating effects from the solar radiation and indoor heating systems contributes to the building facets temperature changing. Compared with the anthropologic heating, the heat energy sourced from the solar radiation is minor. Therefore, almost identical temperature distributions were observed between windward and leeward walls. Consequently, the leeward wall and windward wall temperature fluctuates more wildly in summer with a maximum daily temperature difference of 24 K and 18.2 K, respectively. For the winter condition, the maximum daily temperature difference remains 11 K for both leeward and windward walls, which accounts half of that in summer. Additionally, the ground temperature exceeds other building walls at 1300 LST in summer, but remains the lowest for the whole day in winter.
Figure 7 compares absolute temperature differences among all facets, namely leeward wall and ground (Figure 7a), leeward wall and windward wall (Figure 7b), the most heated facet and ambient air (Figure 7c) under summer and winter. In general, greater temperature difference occurred in summer during most of the day than that of winter. For the morning case (1000 LST), all three temperature differences under summer condition were found greater than those in winter. As the only one sunlight surface during the morning, the leeward wall was found to be the most heated surface for both seasons. The largest temperature difference between the leeward wall and ambient was 19.3 K in summer and 11.6 K in winter (Figure 7c). Despite notable surface temperature was established on the leeward wall for both seasons in the morning, the surface heating patterns were very different among all canyon facets. For the noon case (1300 LST), the temperature differences among all facets (namely leeward wall and ground, leeward wall and windward wall) were fairly small (<1 K) in winter, which indicates all three street canyon facets were evenly heated. For the noon case in summer, similar surface temperatures were established between the leeward wall and the windward wall. Only the ground received direct solar radiation, and its surface temperature exceeded the rest two side walls about 11.5 K.
For the afternoon event (1600 LST), the most heated facet was the windward wall as the solar radiation directly acted on the windward wall. The temperature difference between the leeward wall and ground was only 1.4 K in summer, but nearly 8 K in winter. The temperature difference between the two side walls was 9.3 K in summer and 0.1 K in winter. This can be attributed to the significant indoor heating effect during the winter season. Due to the combined effect of solar radiation and anthropologic heating, the temperature difference between the windward wall and ambient approached to 15.1 K in summer and 6.3 K in winter, respectively.
For the night event (2000 LST) in summer, temperature differences among all facets was significantly dropped (less than 2.5 K). However, for the winter condition, a 9.9 K temperature difference between the leeward wall and ground was established. Both leeward and windward walls showed similar temperature, which exceeds the ambient temperature about 4.9 K.
Therefore, significant seasonal and diurnal variations were found for the canyon facets heating. Especially for the winter condition, more evenly distributed facets temperature with weak diurnal fluctuation is expected due to the combined effect of solar radiation and anthropologic heating.

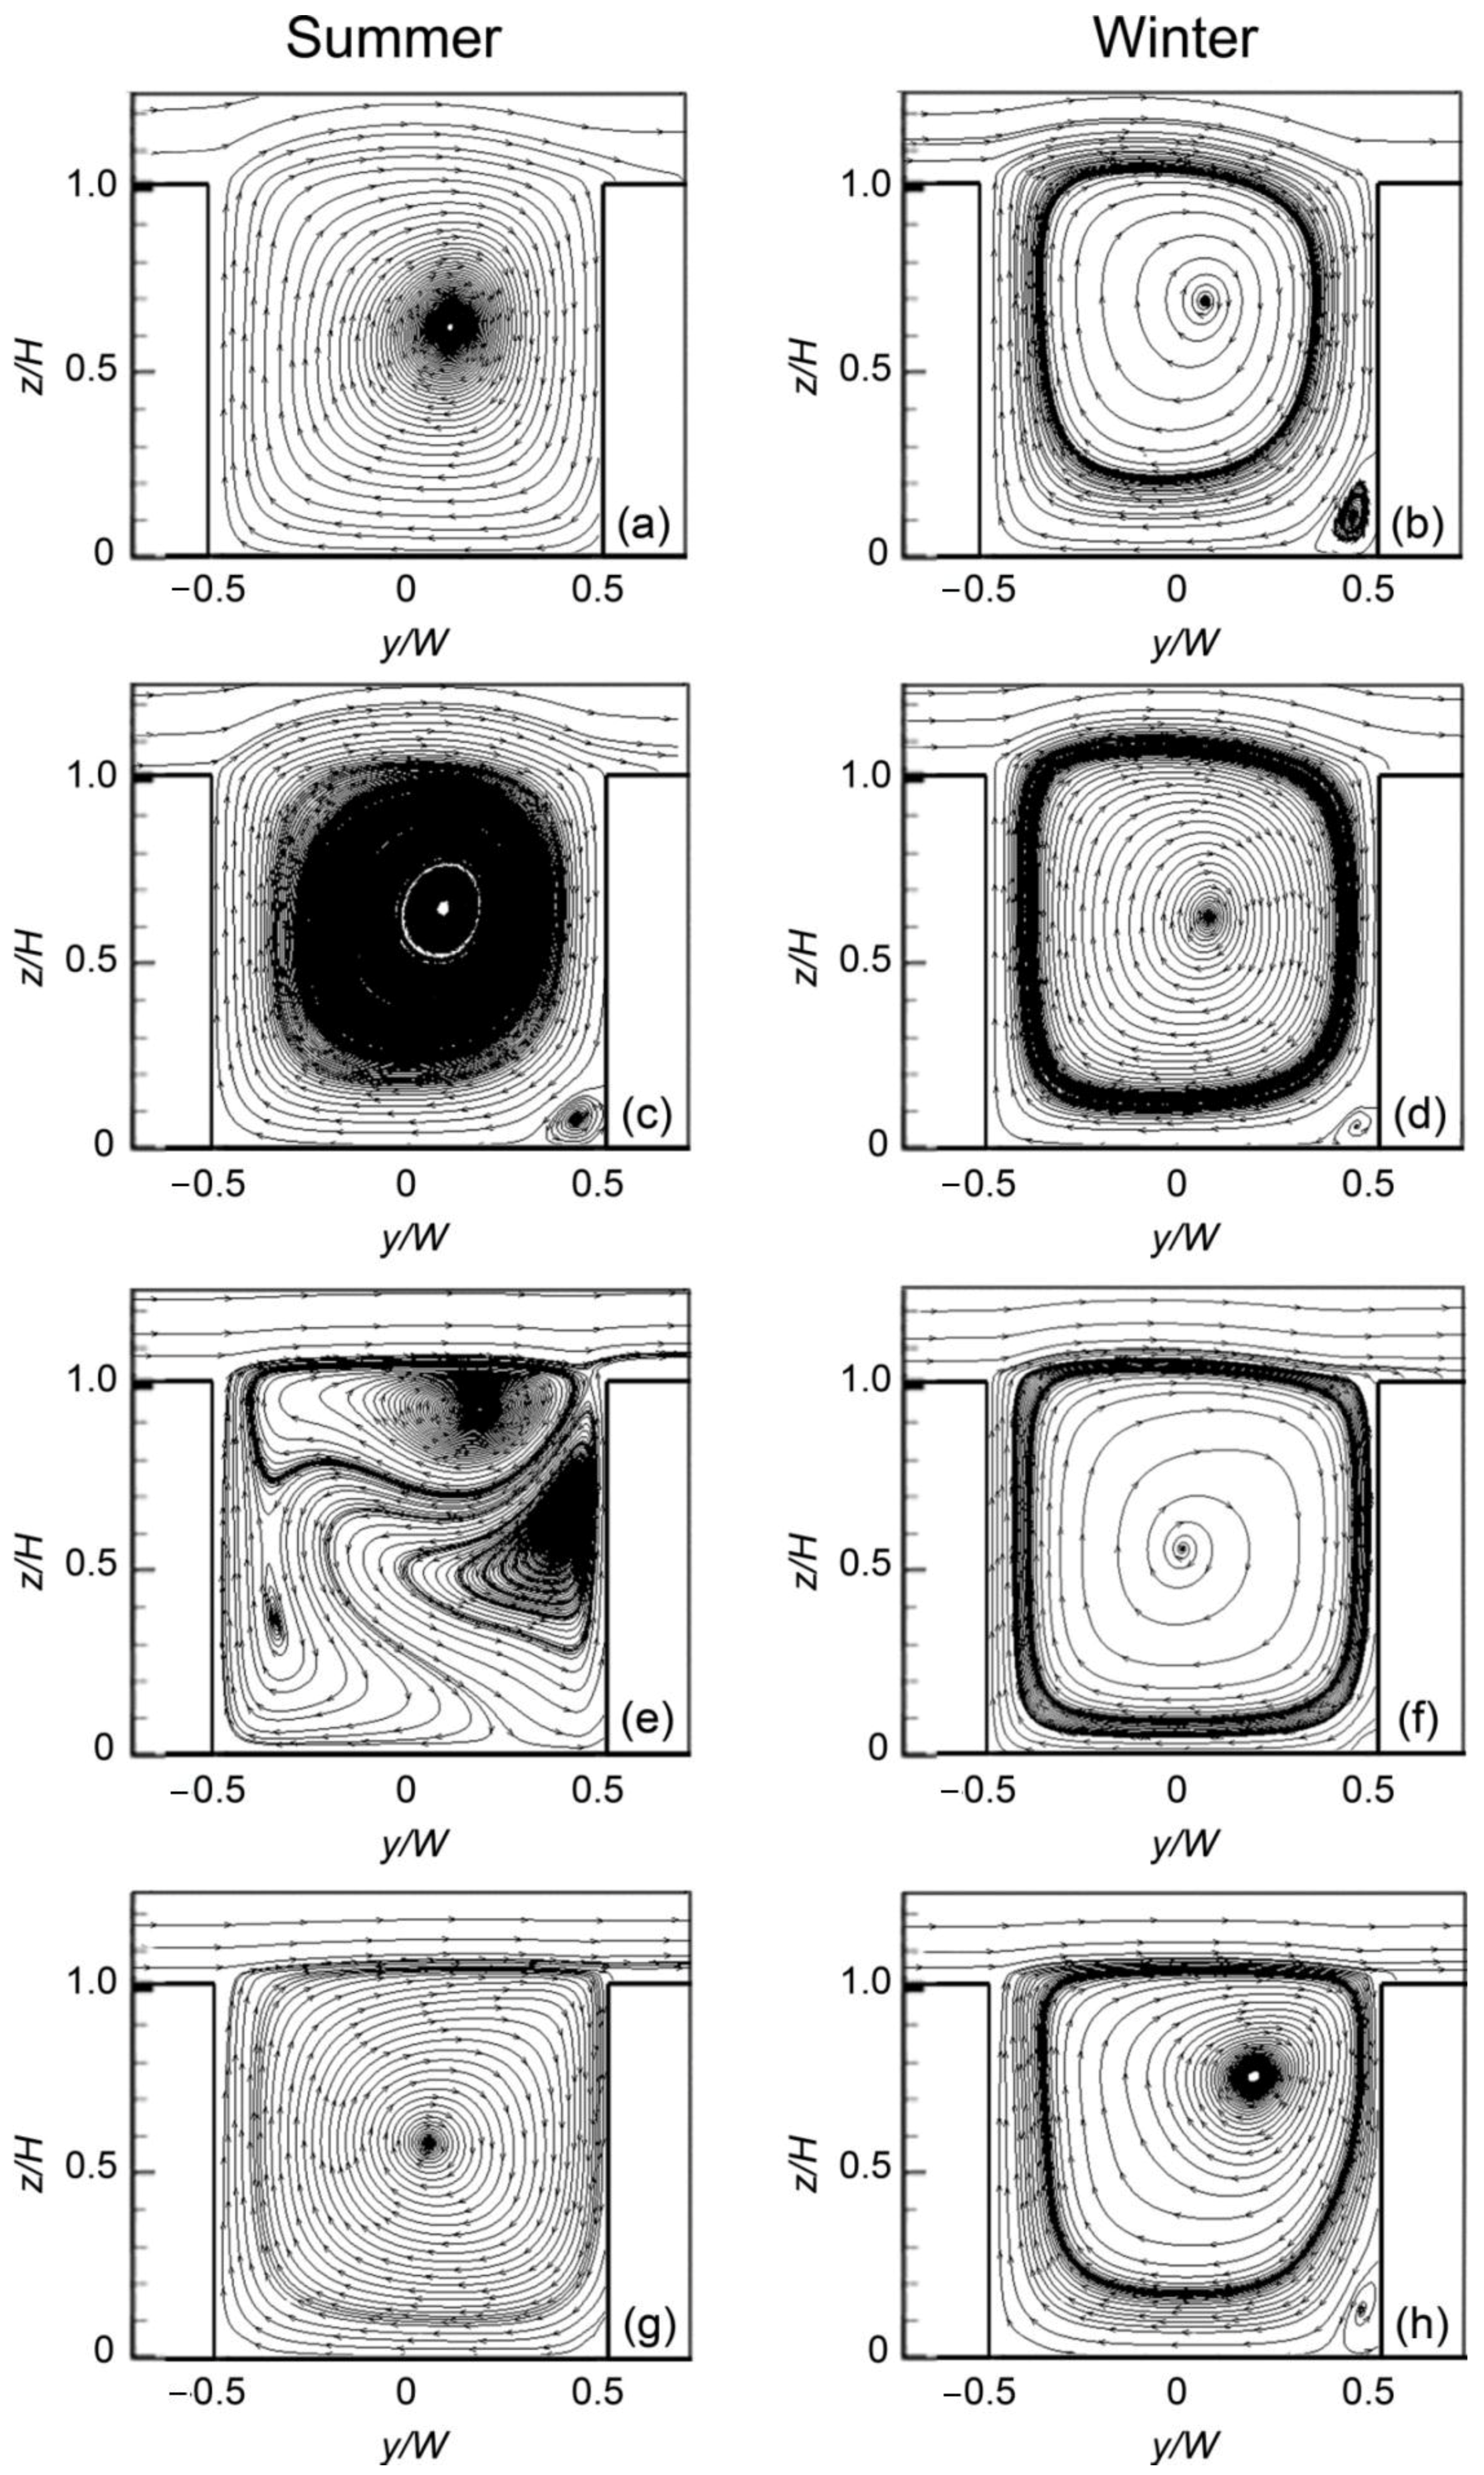
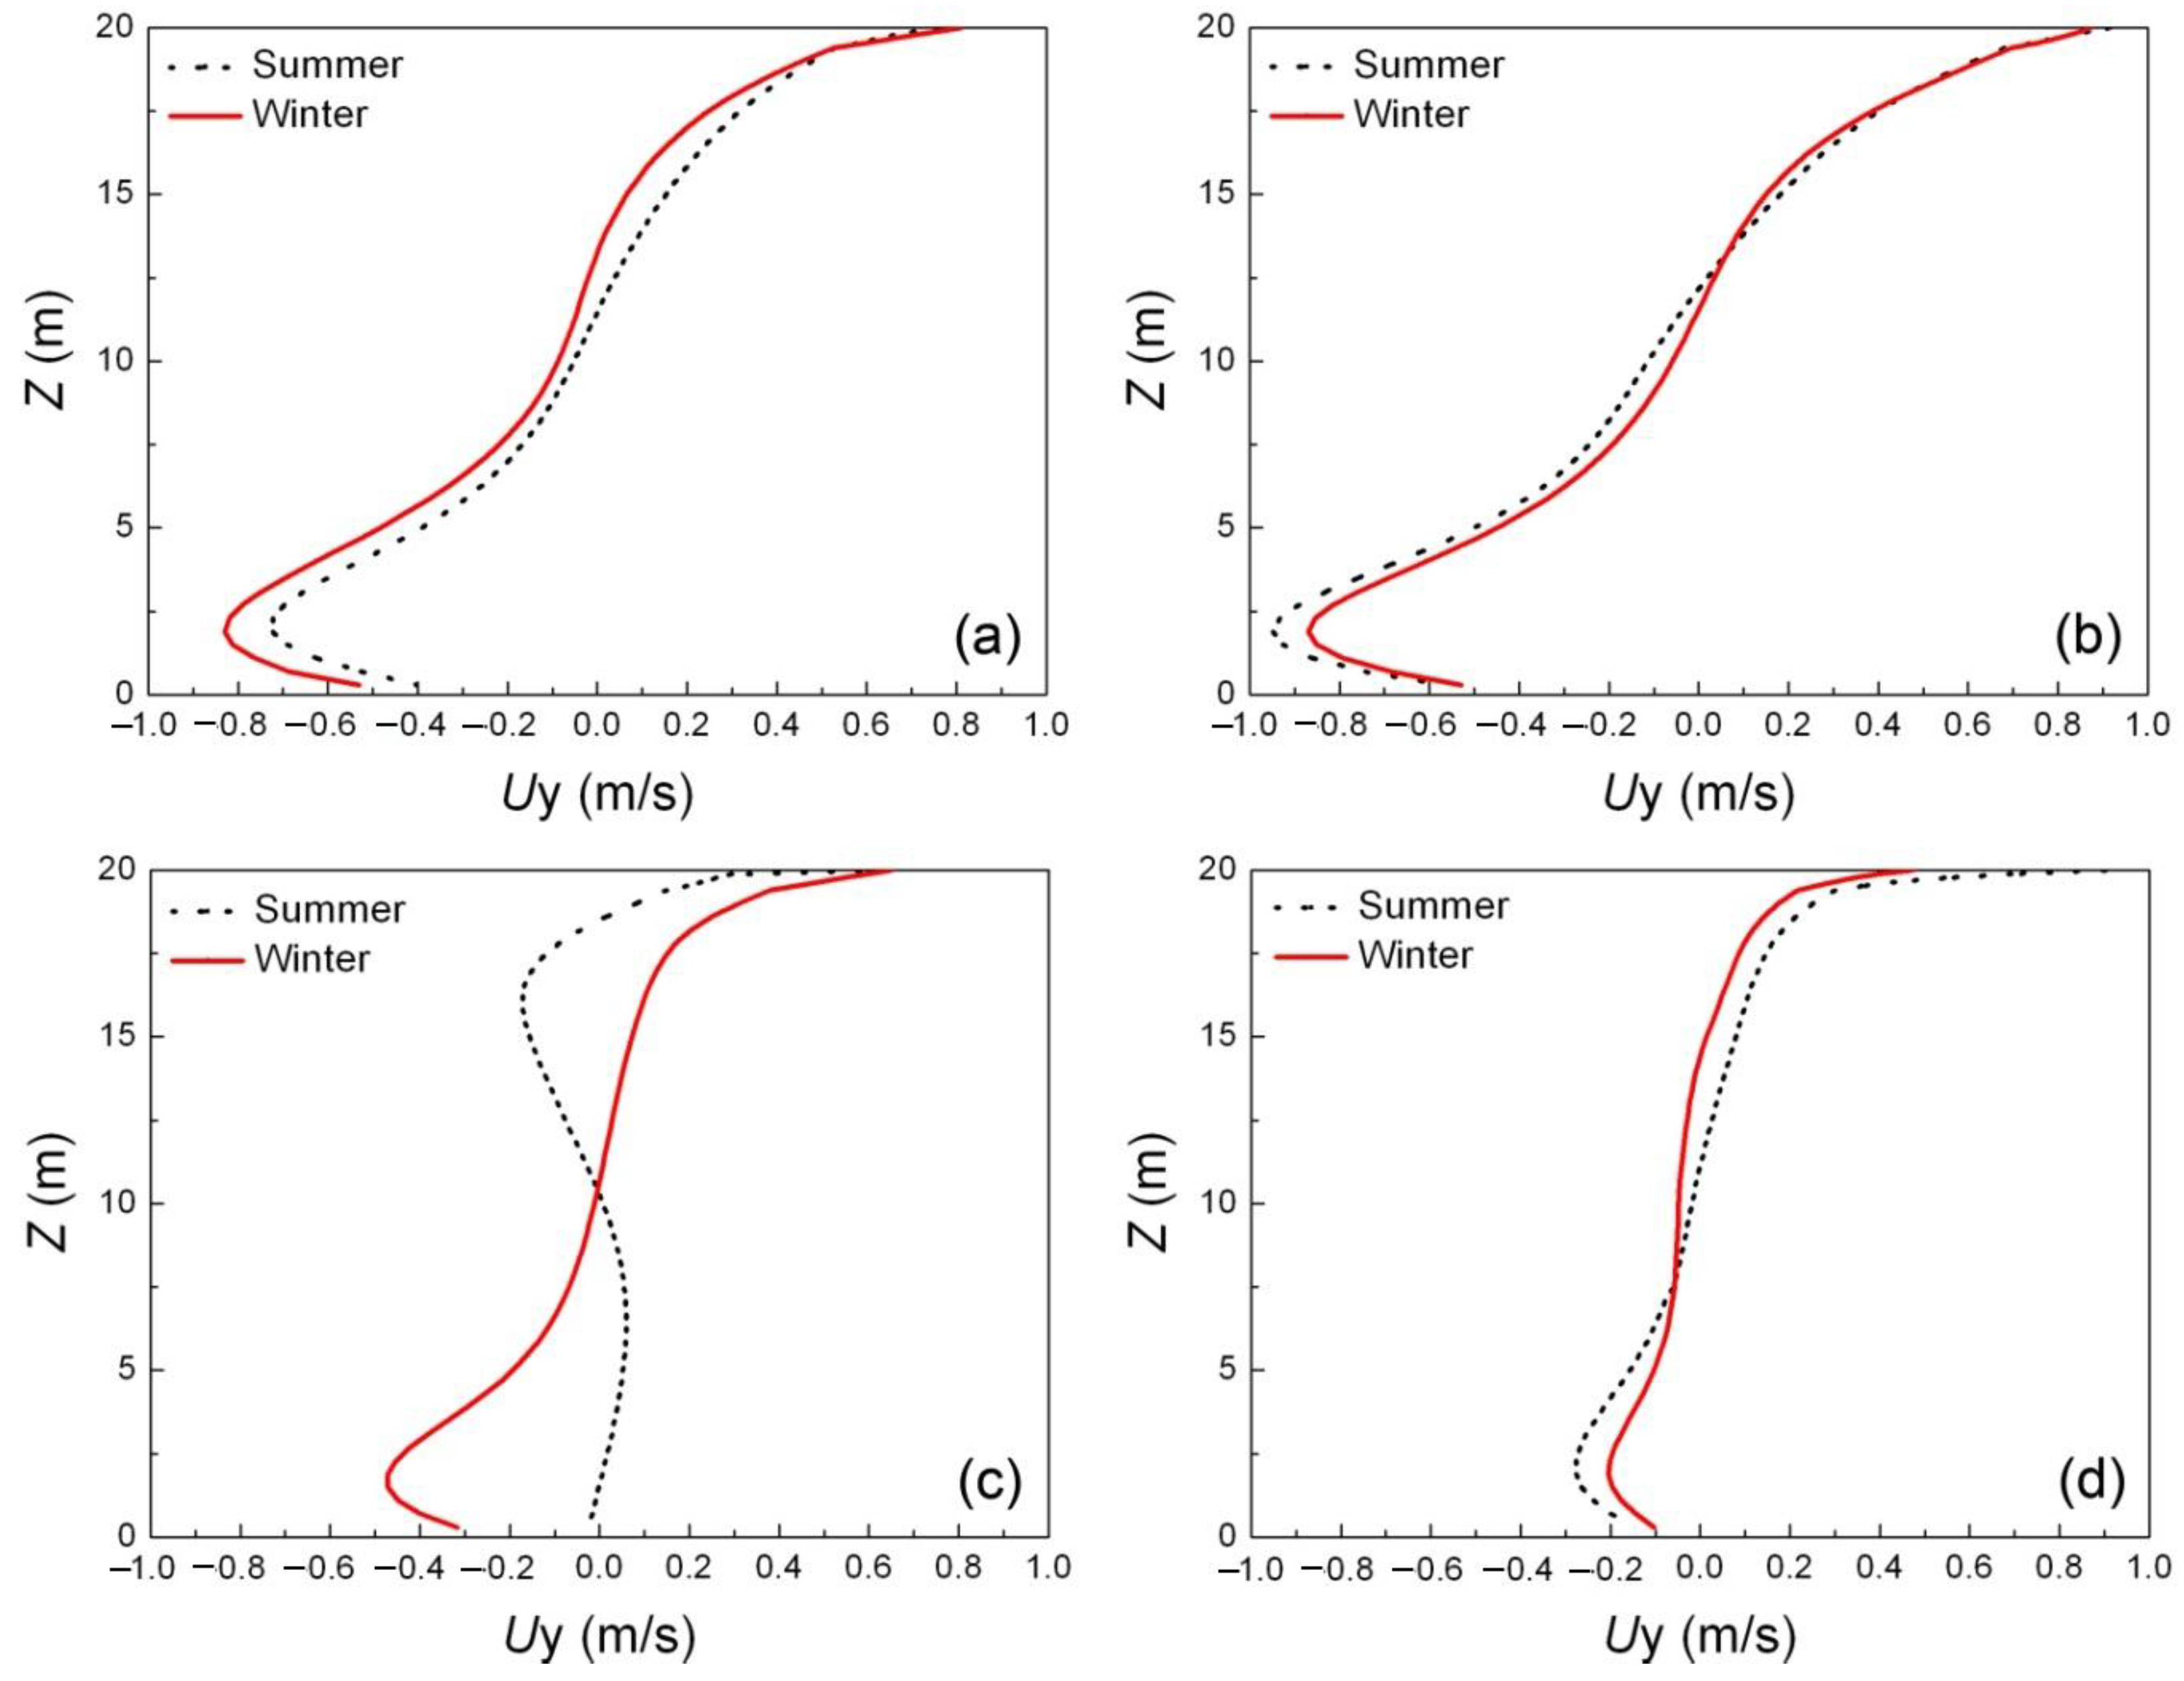
3.2. Air Flow Pattern

In this section, the along-canyon averaged streamline fields [52] were calculated. Figure 8 details the wind-buoyancy-driven flow behavior within the street canyon under different seasonal conditions. Streamlines emanating from the core of the vortex is observed in Figure 8b,f, which can be attributed to the presence of axial flow. Since the streamlines were averaged along street canyon from x/L = 0.25 to x/L = 0.75, slight axial flow caused by the canyon end effect might be captured in the calculated results. For the morning event (1000 LST) as shown in Figure 8a,b, a clockwise rotating vortex centering close to the windward wall was observed under both seasons. However, a small secondary vortex was established at the bottom corner of the windward wall under winter condition (Figure 8b). Since the winter case does not show significant temperature variation between the windward wall and the leeward wall (Figure 7), and both of them hold higher temperature value than that of either ground or ambient air, a secondary vortex imposing an opposite force on the main wind-driven flow was observed due to the buoyancy effect close to the windward wall.
Similar flow patterns with two counter-rotating vortices were found for the noon event (1300 LST) for both seasons (Figure 8c,d). For the summer case, the main airflow vortex was compressed towards its vortex core, and the secondary vortex size is slightly larger than that under the winter condition. In contrast, the air flow was intensified along near wall regions in the winter case, and the size and intensity of the secondary vortex were greatly reduced. This is mainly attributed to different surface heating between summer and winter. In general, the ground was the most heated surface (Figure 7), and no significant temperature difference can be found between the leeward and windward walls. In summer, the ground temperature exceeded approximately 12 K compared with the other two side walls, and 17 K compared with the ambient temperature. This temperature difference induced strong buoyancy, which pushes the main vortex 0.05H upwards and compresses the wind-driven flow (Figure 8c). In contrast, all canyon facets were evenly heated in winter, but higher than the ambient about 14 K. Thus, the airflow in the near wall region was intensified due to the buoyancy effect.
For the afternoon case (1600 LST), completely different airflow patterns were found. For the summer condition, the direct solar radiation on the windward wall during afternoon induced a 15 K temperature increase when compared with the ambient. This heated windward wall generated significant upward buoyancy against the main wind-driven airflow, which breaks the previous single main vortex structure into multiple disturbed patterns. Thus, a complex air flow structure with multi-vortex was observed in summer (Figure 8e). While for winter, a single vortex with intensified airflow along canyon facets was established (Figure 8f). Based on the surface heating showed in Figure 7, the two side walls hold almost identical surface temperatures in winter, but only exceeded around 6 K when compared with the ambient. Thus, the circumferential velocity of the main vortex was reduced. Comparable flow patterns are also reported by Xie et al. [53] under similar stratification condition.
For the night event (2000 LST), a clockwise rotating vortex with slight disturbance of the ambient wind was observed under both seasons. Similar with the morning event, the primary vortex occupies the whole street canyon in summer, and a small secondary vortex was observed at the windward corner in winter. As disclosed by Figure 7, for the summer condition, the temperature differences between canyon facets and ambient air were small during the night. Thus, the ambient wind dominated the vortex formation in summer. For the winter condition, the primary vortex center was moved upwards towards the windward wall, and a secondary vortex was established at the windward wall bottom corner. This is mainly due to the considerable temperature differences between the side walls and the ground (10 K), the side walls and the ambient air (5 K).
Figure 9 illustrates along-canyon averaged horizontal velocity profiles at the canyon center (y = 0). For the morning event (Figure 9a), the airflow velocity gradually changed from downwind direction at the top of the canyon to upwind direction at the bottom of the canyon for both seasons, which indicates the existence of the main vortex rotating in clockwise direction. Despite the velocity profile during the noon (Figure 9b) showed a similar overall trend with the morning case, the velocity magnitude under summer weather condition, especially for the lower part of the canyon (Z < 10 m), slightly exceeds that of winter condition, and the near ground peak wind velocity (Z = 2.2 m) increases from 0.72 m/s (1000 LST) to 0.95 m/s (1300 LST). Furthermore, the near ground peak velocities during the noon for both seasons were found to be the quickest compared with all other time events. The afternoon event showed complete difference horizontal velocity profiles (Figure 9c). Despite similar velocity pattern with previous events persisted in winter, but both the near ground and top wind speeds were significantly reduced. However, for the summer situation, due to the multiple vortex structure (Figure 8e), no significant air flow movement were observed at the lower half of the vertical center canyon region (Z < 10 m). For the night event (2000 LST), small air flow velocity (<±0.1 m/s) was found in the central part of the street canyon (5 m < Z < 15 m) for both seasons. While, for the top and near ground level regions, the air flow velocity was increased in summer due to the bulk motion of ambient wind.

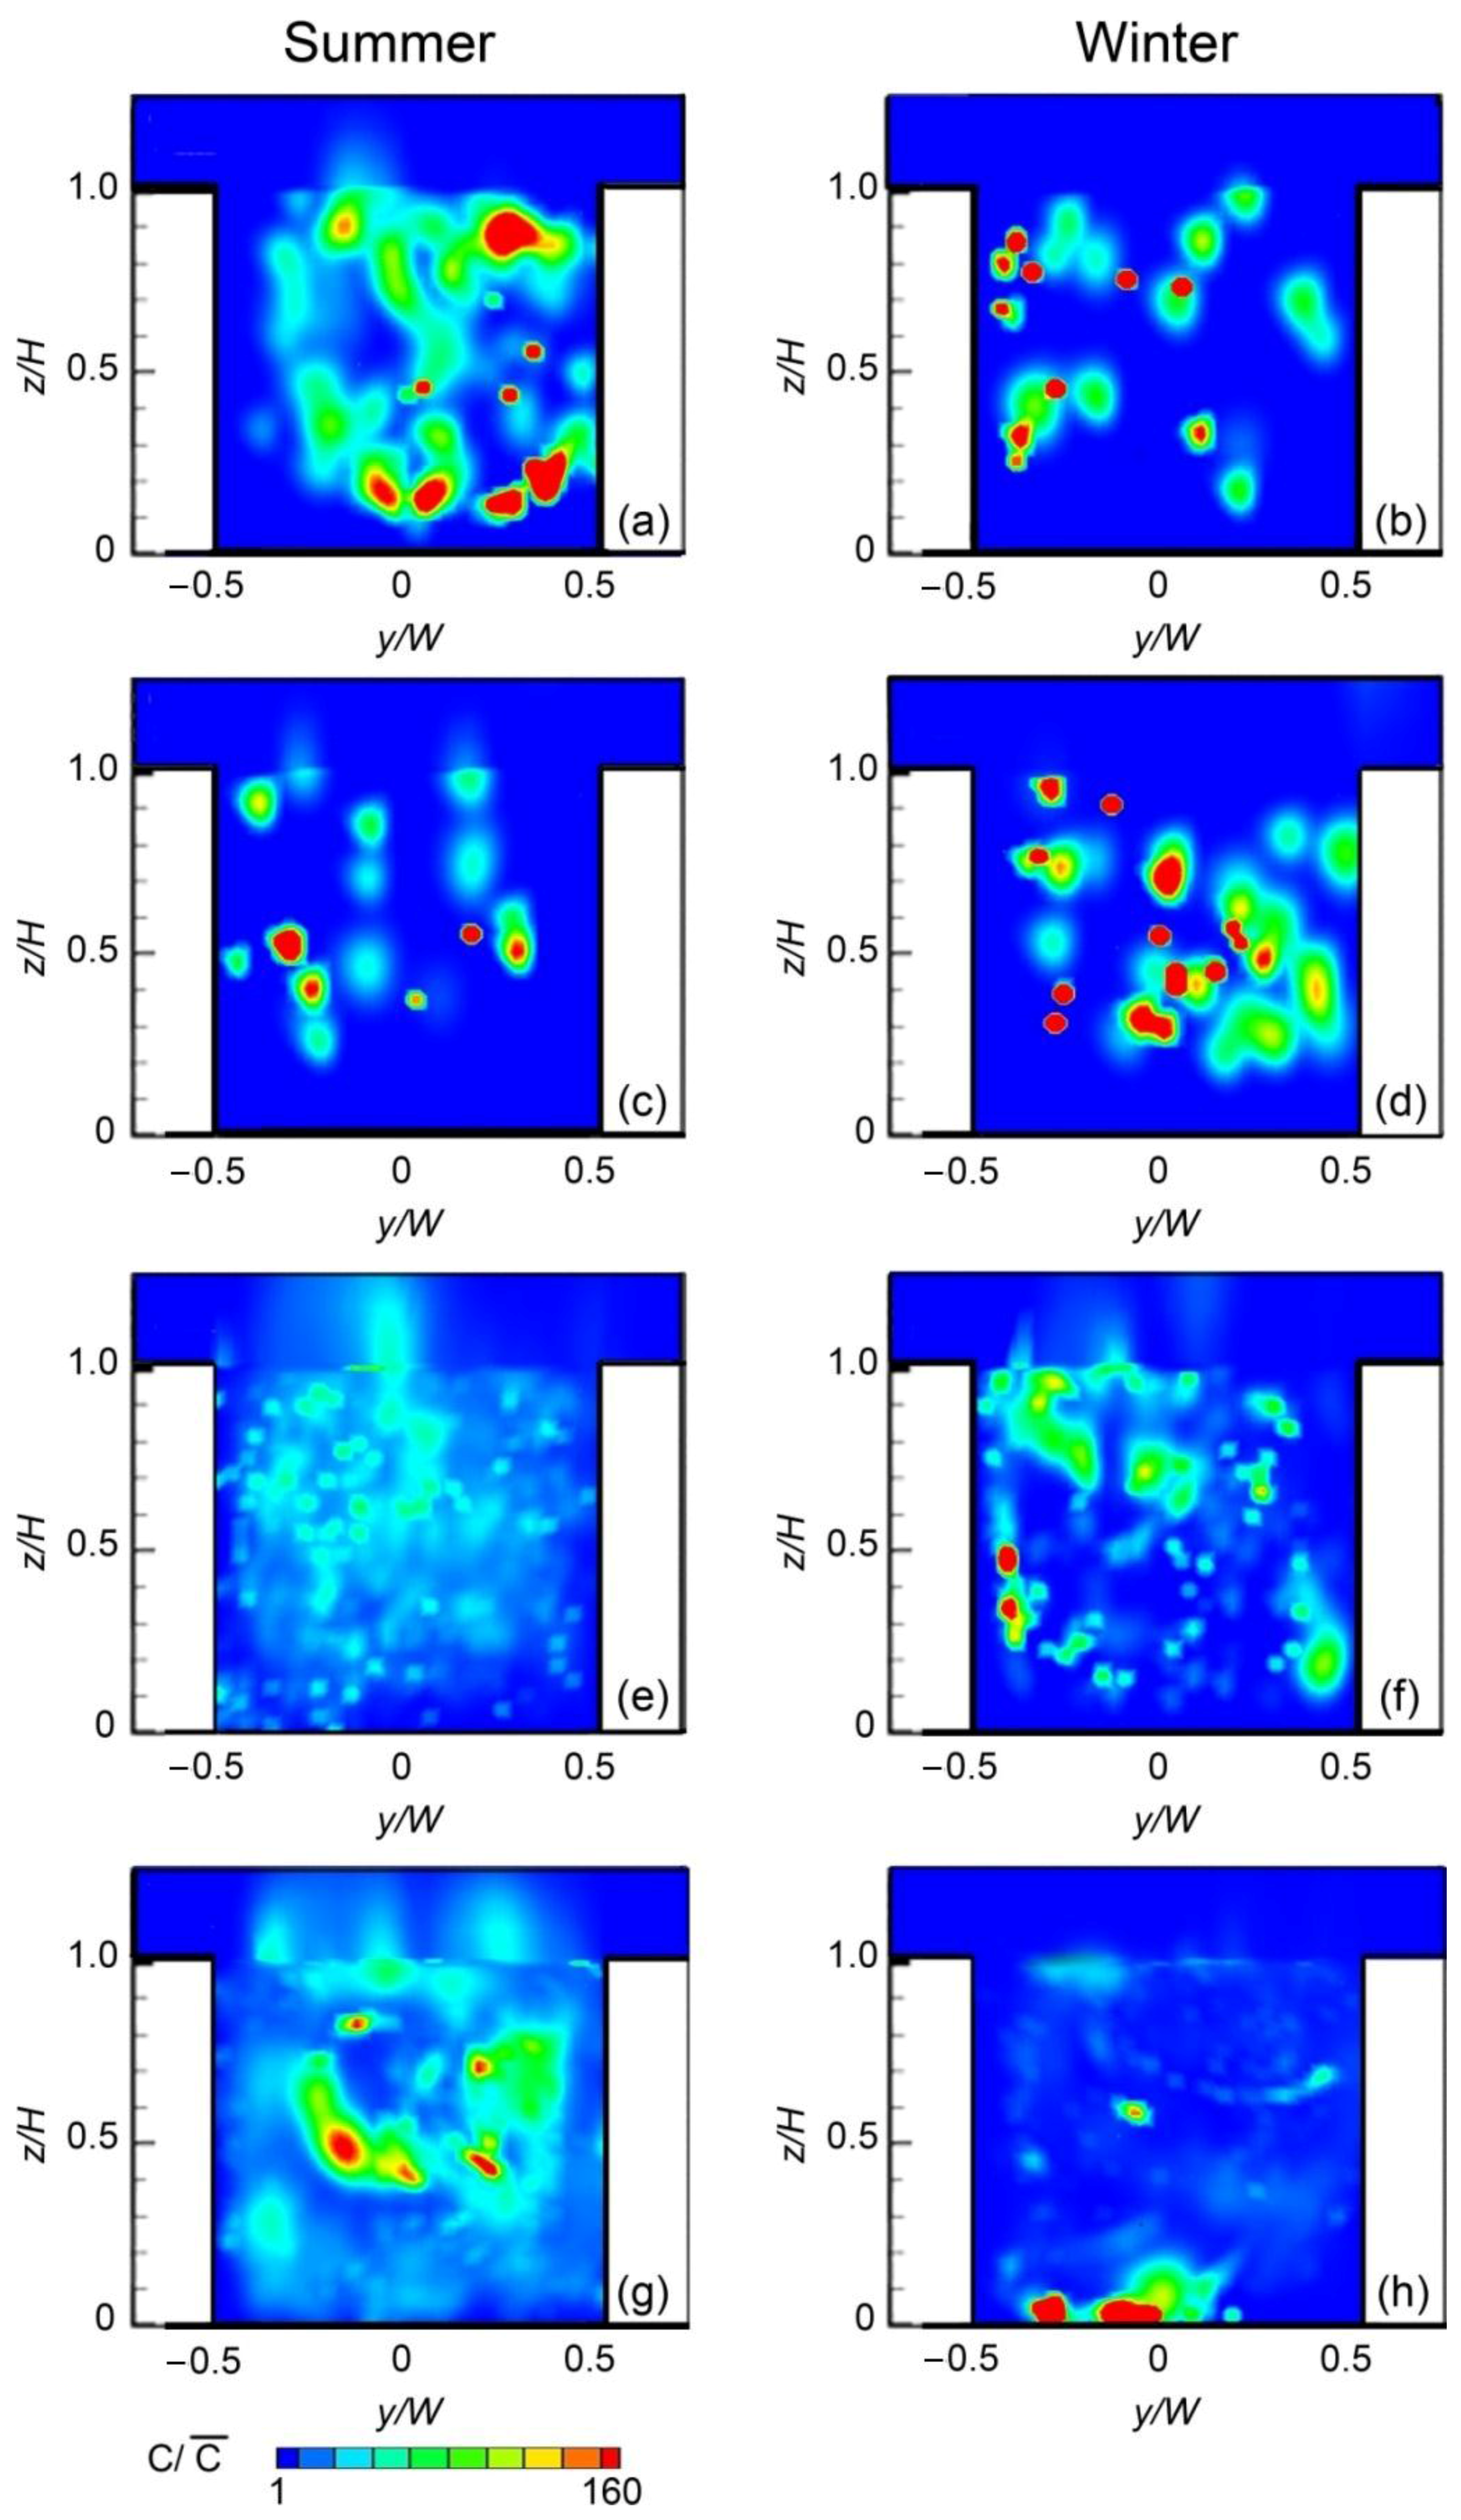
3.3. Pollutant Dispersion Characteristics

Figure 10 depicts the normalized along-canyon averaged tracing pollutants concentrations ( C / C ¯ ). These results are obtained by linear interpolation and averaging methods. Firstly, these results were extracted from x/L = 0.25 to x/L = 0.75, with an interval of x/L = 0.05; Then, all field data was averaged based on eleven Y-Z slices. In general, distinct differences were observed for all case studies. In summer, the morning event showed significant pollutant accumulations in the windward half of the canyon. In winter, the night event showed a notable near-ground contaminants build-up in the leeward half of the canyon.
For the morning event (Figure 10a), a lower pollutant concentration was observed in the leeward half of the canyon in summer. In contrast, the winter case showed a reversed pattern with relatively more pollutant accumulating within the leeward half of the canyon (Figure 10b). For the noon event (Figure 10c,d), both cases showed a good air quality in the near-ground-zone (z ≤ 0.3H) due to the strong lifting force imposed by the buoyancy. For the afternoon event, the summer case showed an evenly distributed pollutants concentration pattern in most of the canyon space (Figure 10e), while the winter case showed two elevated accumulation spots along the middle region of the leeward wall (Figure 10f). For the night event, despite the fact that notable pollutant accumulation can be found in summer (Figure 10g), the majority of the pollutants were centered in the upper half of the canyon space. Although majority of the pollutants have been removed out of the canyon, the night event for the winter case was the worst time slot with serious pollutant build-up along the pedestrian’s height level (Figure 10h).
To further quantify the pollutant removal performance, air exchange rate (AER), defined as the volumetric air exchange rate per unit time, is calculated by the following equations [13]:
A E R = w + ¯ | r o o f   d s + 1 2 w w ¯ 1 / 2 | r o o f   d s
w w ¯ 1 / 2 | r o o f = 2 3 k | r o o f
where w + ¯ is the mean positive vertical velocity, w is the mean positive velocity fluctuation, is the roof area of the street canyon, and k is the kinetic energy.
Figure 11 compares the normalized AER between summer and winter. In general, for both seasons, the normalized AER peaks at the noon event, and the lowest air exchange rate occurs at the night event. For the morning and night cases, greater normalized AER was found in winter. While, for the noon and afternoon cases, greater normalized AER value occurred in summer.
Lastly, the relative residual pollutant percentages in the near-wall-zone, near-ground-zone, and inhabitant-zone were calculated to quantify the air quality in human occupied zones (Figure 12). The near-wall-zone, near-ground-zone and inhabitant-zone was defined as the adjacent layer close to building side walls within 0.2W, the bottom layer in the street canyon (z < 0.3H), and the combination of near-ground-zone and near-wall-zone, respectively. Figure 12a summarizes the percentage of pollutants concentrated within all inhabitant zones, including near-ground zone, and near-wall zone. The results showed a great increase for the morning event in summer with almost 90% of residual pollutant concentrating in these regions. In contrast, the winter condition showed a worst air quality with 75% of residual pollutant persisting in all inhabitant zones during the night event. These peaks indicate the natural ventilation during summer morning and the winter night are poor, and they are worst time slots for residents.
Through comparing the localized pollutant concentration (Figure 12b,c) with the combined results (Figure 12a), it is found majority of the residual pollutant in winter night (65%) were accumulated in the near-ground-zone due to weak ground ventilation. However, no apparent pollutant concentration differences were observed in near-wall-zones for the summer condition.

4. Conclusions

In this study, the impact of seasonal changes, including solar radiation and anthropogenic heating effects, on urban canyon ventilation as well as pollutant dispersion characteristics was investigated. The numerical model was first validated against experimental data [41,51], then the seasonal changing effects were investigated in detail. Our results showed a more evenly distributed surface temperature with relatively weak diurnal fluctuation was found in winter. The summer afternoon case showed a very different flow pattern with multi-vortex flow structure due to strong buoyance disturbance generated by heated adjacent building walls. The near-ground velocity during the summer afternoon was significantly reduced (almost zero), which may even slower than the night event. Consequently, poor pollutant removal performance was observed for the summer afternoon with a scattered pollutant concentration. Lastly, the regional residual pollutant percentage analysis showed the summer morning and the winter night are two worst time slots with 87% and 77% of the residual pollutant being trapped in the inhabitant-zone, respectively.
Due to the steady state assumption, heat storage effects of building walls and ground soil were not considered in the present study, which may contribute over-predictions of surface temperature. Besides, real street canyon geometries are much more complicated. Despite some limitations of this study, such as the unit aspect ratio and constant ambient wind assumptions, research findings presented by the current paper can contribute to fully understandings of street canyon environment under different seasonal conditions. The proposed research method offers an effective solution for urban ventilation and wind path designs.

Acknowledgments

The financial supports of the Fundamental Research Funds for the Central Universities (Project ID: 106112016CDJCR211221), National Natural Science Foundation of China (Grant No.21277080 and No.51678088), Open-end Research Funds of Chongqing Meteorological Administration (Project ID: Kfjj-201202) are gratefully acknowledged.

Author Contributions

J.D., Z.T., Y.X. and J.T. conceived and designed the experiments; J.D. and Z.T. performed the experiments; J.D. and Z.T. analyzed the data; J.D. and Z.T. wrote the paper.

Conflicts of Interest

The authors declare no conflict of interest.

References

  1. Krayenhoff, E.S.; Voogt, J.A. A microscale three-dimensional urban energy balance model for studying surface temperatures. Bound.-Layer Meteorol. 2007, 123, 433–461. [Google Scholar] [CrossRef]
  2. Solazzo, E.; Britter, R. Transfer processes in a simulated urban street canyon. Bound.-Layer Meteorol. 2007, 124, 43–60. [Google Scholar] [CrossRef]
  3. Lee, S.-H.; Park, S.-U. A vegetated urban canopy model for meteorological and environmental modelling. Bound.-Layer Meteorol. 2008, 126, 73–102. [Google Scholar] [CrossRef]
  4. Vardoulakis, S.; Fisherb, B.E.A.; Pericleousa, K.; Gonzalez-Flescac, N. Modelling air quality in street canyons: A review. Atmos. Environ. 2003, 37, 155–182. [Google Scholar] [CrossRef]
  5. Georgakis, C.; Santamouris, M. On the air flow in urban canyons for ventilation purposes. Int. J. Vent. 2004, 3, 53–65. [Google Scholar] [CrossRef]
  6. Hang, J.; Li, Y. Wind conditions in idealized building clusters: Macroscopic simulations using a porous turbulence model. Bound.-Layer Meteorol. 2010, 136, 129–159. [Google Scholar] [CrossRef] [Green Version]
  7. Hang, J.; Li, Y.; Sandberg, M. Experimental and numerical studies of flows through and within high-rise building arrays and their link to ventilation strategy. J. Wind Eng. Ind. Aerodyn. 2011, 99, 1036–1055. [Google Scholar] [CrossRef]
  8. Hang, J.; Li, Y.; Sandberg, M.; Buccolieri, R.; di Sabatino, S. The influence of building height variability on pollutant dispersion and pedestrian ventilation in idealized high-rise urban areas. Build. Environ. 2012, 56, 346–360. [Google Scholar] [CrossRef]
  9. Santamouris, M.; Georgakis, C.; Niachou, A. On the estimation of wind speed in urban canyons for ventilation purposes—Part 2: Using of data driven techniques to calculate the more probable wind speed in urban canyons for low ambient wind speeds. Build. Environ. 2008, 43, 1411–1418. [Google Scholar] [CrossRef]
  10. Soulhac, L.; Perkins, R.J.; Salizzoni, P. Flow in a street canyon for any external wind direction. Bound.-Layer Meteorol. 2008, 126, 365–388. [Google Scholar] [CrossRef]
  11. Ryu, Y.-H.; Baik, J.-J.; Lee, S.-H. A new single-layer urban canopy model for use in mesoscale atmospheric models. J. Appl. Meteorol. Climatol. 2011, 50, 1773–1794. [Google Scholar] [CrossRef]
  12. Gromke, C.; Ruck, B. Pollutant concentrations in street canyons of different aspect ratio with avenues of trees for various wind directions. Bound.-Layer Meteorol. 2012, 144, 41–64. [Google Scholar] [CrossRef]
  13. Xie, X.; Liu, C.H.; Leung, D.Y.C.; Leung, M.K.H. Characteristics of air exchange in a street canyon with ground heating. Atmos. Environ. 2006, 40, 6396–6409. [Google Scholar] [CrossRef]
  14. Xie, X.; Liu, C.H.; Leung, D.Y.C. Impact of building facades and ground heating on wind flow and pollutant transport in street canyons. Atmos. Environ. 2007, 41, 9030–9049. [Google Scholar] [CrossRef]
  15. Allegrini, J.; Dorer, V.; Carmeliet, J. Buoyant flows in street canyons: Validation of CFD simulations with wind tunnel measurements. Build. Environ. 2014, 72, 63–74. [Google Scholar] [CrossRef]
  16. Yang, L.; Li, Y. City ventilation of Hong Kong at no-wind conditions. Atmos. Environ. 2009, 43, 3111–3121. [Google Scholar] [CrossRef] [Green Version]
  17. Kantzioura, A.; Kosmopoulos, P.; Zoras, S. Urban surface temperature and microclimate measurements in Thessaloniki. Energy Build. 2012, 44, 63–72. [Google Scholar] [CrossRef]
  18. Ahmed, A.Q.; Ossen, D.R.; Jamei, E.; Ahmad, M.H. Urban surface temperature behaviour and heat island effect in a tropical planned city. Theoret. Appl. Climatol. 2014, 119, 493–514. [Google Scholar] [CrossRef]
  19. Huang, H.; Ooka, R.; Kato, S. Urban thermal environment measurements and numerical simulation for an actual complex urban area covering a large district heating and cooling system in summer. Atmos. Environ. 2005, 39, 6362–6375. [Google Scholar] [CrossRef]
  20. Offerle, B.; Eliasson, I.; Grimmond, C.S.B.; Holmer, B. Surface heating in relation to air temperature, wind and turbulence in an urban street canyon. Bound.-Layer Meteorol. 2007, 122, 273–292. [Google Scholar] [CrossRef]
  21. Li, X.-X.; Britter, R.E.; Koh, T.-Y.; Norford, L.K.; Liu, C.H.; Entekhabi, D.; Leung, D.Y.C. Large-eddy simulation of flow and pollutant transport in urban street canyons with ground heating. Bound.-Layer Meteorol. 2010, 137, 187–204. [Google Scholar] [CrossRef] [Green Version]
  22. Li, X.-X.; Britter, R.E.; Norford, L.K.; Koh, T.-Y.; Entekhabi, D. Flow and pollutant transport in urban street canyons of different aspect ratios with ground heating: Large-eddy simulation. Bound.-Layer Meteorol. 2012, 142, 289–304. [Google Scholar] [CrossRef]
  23. Cheng, W.; Liu, C.-H.; Leung, D.Y. On the correlation of air and pollutant exchange for street canyons in combined wind-buoyancy-driven flow. Atmos. Environ. 2009, 43, 3682–3690. [Google Scholar] [CrossRef]
  24. Cheng, W.; Liu, C.-H. Large-eddy simulation of turbulent transports in urban street canyons in different thermal stabilities. J. Wind Eng. Ind. Aerodyn. 2011, 99, 434–442. [Google Scholar] [CrossRef]
  25. Cai, X. Effects of differential wall heating in street canyons on dispersion and ventilation characteristics of a passive scalar. Atmos. Environ. 2012, 51, 268–277. [Google Scholar] [CrossRef]
  26. Bottillo, S.; De Lieto Vollaro, A.; Galli, G.; Vallati, A. CFD modeling of the impact of solar radiation in a tridimensional urban canyon at different wind conditions. Sol. Energy 2014, 102, 212–222. [Google Scholar] [CrossRef]
  27. Bottillo, S.; De Lieto Vollaro, A.; Galli, G.; Vallati, A. Fluid dynamic and heat transfer parameters in an urban canyon. Sol. Energy 2014, 99, 1–10. [Google Scholar] [CrossRef]
  28. Yazid, A.W.M.; Sidik, N.A.C.; Salim, S.M.; Saqr, K.M. A review on the flow structure and pollutant dispersion in urban street canyons for urban planning strategies. Simulation 2014, 90, 892–916. [Google Scholar] [CrossRef]
  29. Kwak, K.-H.; Baik, J.-J. Diurnal variation of NO x and ozone exchange between a street canyon and the overlying air. Atmos. Environ. 2014, 86, 120–128. [Google Scholar] [CrossRef]
  30. Nazarian, N.; Kleissl, J. CFD simulation of an idealized urban environment: Thermal effects of geometrical characteristics and surface materials. Urban Clim. 2015, 12, 141–159. [Google Scholar] [CrossRef]
  31. Nazarian, N.; Kleissl, J. Realistic Solar Heating in Urban Areas: Air Exchange and Street-Canyon Ventilation. Build. Environ. 2015, 95, 79–93. [Google Scholar] [CrossRef]
  32. Tan, Z.; Dong, J.; Xiao, Y.; Tu, J. Numerical simulation of diurnally varying thermal environment in a street canyon under haze-fog conditions. Atmos. Environ. 2015, 119, 95–106. [Google Scholar] [CrossRef]
  33. Tan, Z.; Dong, J.; Xiao, Y.; Tu, J. A numerical study of diurnally varying surface temperature on flow patterns and pollutant dispersion in street canyons. Atmos. Environ. 2015, 104, 217–227. [Google Scholar] [CrossRef]
  34. Yaghoobian, N.; Kleissl, J. An Improved Three-Dimensional Simulation of the Diurnally Varying Street-Canyon Flow. Bound.-Layer Meteorol. 2014, 153, 251–276. [Google Scholar] [CrossRef]
  35. Richards, P.; Hoxey, R. Appropriate boundary conditions for computational wind engineering models using the k-ϵ turbulence model. J. Wind Eng. Ind. Aerodyn. 1993, 46, 145–153. [Google Scholar] [CrossRef]
  36. Qu, Y.; Milliez, M.; Musson-Genon, L.; Carissimo, B. Numerical study of the thermal effects of buildings on low-speed airflow taking into account 3D atmospheric radiation in urban canopy. J. Wind Eng. Ind. Aerodyn. 2012, 104, 474–483. [Google Scholar] [CrossRef]
  37. Yan, D.; Xia, J.; Tang, W.; Song, F.; Zhang, X.; Jiang, Y. DeST-An Integrated Building Simulation Toolkit Part I: Fundamentals. Build. Simul. 2008, 1, 95–110. [Google Scholar] [CrossRef]
  38. Zhang, X.L.; Xia, J.; Jiang, Z.; Huang, J.; Qin, R.; Zhang, Y.; Liu, Y.; Jiang, Y. DeST-An Integrated Building Simulation Toolkit Part: Applications. Build. Simul. 2008, 1, 193–209. [Google Scholar] [CrossRef]
  39. Stazi, F.; Mastrucci, A.; di Perna, C. The behaviour of solar walls in residential buildings with different insulation levels: An experimental and numerical study. Energy Build. 2012, 47, 217–229. [Google Scholar] [CrossRef]
  40. Jones, A.; Underwood, C. A thermal model for photovoltaic systems. Sol. Energy 2001, 70, 349–359. [Google Scholar] [CrossRef]
  41. Idczak, M.; Groleau, D.; Mestayer, P.; Rosant, J.-M.; Sini, J.-F. An application of the thermo-radiative model SOLENE for the evaluation of street canyon energy balance. Build. Environ. 2010, 45, 1262–1275. [Google Scholar] [CrossRef]
  42. Michioka, T.; Takimoto, H.; Sato, A. Large-Eddy Simulation of Pollutant Removal from a Three-Dimensional Street Canyon. Bound.-Layer Meteorol. 2014, 150, 259–275. [Google Scholar] [CrossRef]
  43. Salizzoni, P.; Soulhac, L.; Mejean, P. Street canyon ventilation and atmospheric turbulence. Atmos. Environ. 2009, 43, 5056–5067. [Google Scholar] [CrossRef]
  44. Fluent, A. ANSYS Fluent 14.0 User’s Guide; ANSYS Inc.: Canonsburg, PA, USA, 2011. [Google Scholar]
  45. Kang, Y.S.; Baik, J.J.; Kim, J.J. Further studies of flow and reactive pollutant dispersion in a street canyon with bottom heating. Atmos. Environ. 2008, 42, 4964–4975. [Google Scholar] [CrossRef]
  46. Kim, J.J.; Baik, J.J. Urban street-canyon flows with bottom heating. Atmos. Environ. 2001, 35, 3395–3404. [Google Scholar] [CrossRef]
  47. Memon, R.A.; Leung, D.Y.C.; Liu, C.H. Effects of building aspect ratio and wind speed on air temperatures in urban-like street canyons. Build. Environ. 2010, 45, 176–188. [Google Scholar] [CrossRef]
  48. Hang, J.; Luo, Z.; Wang, X.; He, L.; Wang, B.; Zhu, W. The influence of street layouts and viaduct settings on daily carbon monoxide exposure and intake fraction in idealized urban canyons. Environ. Pollut. 2016, 220, 72–86. [Google Scholar] [CrossRef] [PubMed]
  49. Blocken, B. Computational Fluid Dynamics for urban physics: Importance, scales, possibilities, limitations and ten tips and tricks towards accurate and reliable simulations. Build. Environ. 2015, 91, 219–245. [Google Scholar] [CrossRef]
  50. Fluent, I. ANSYS FLUENT 14: Theory Guide; Fluent Inc.: Canonsburg, PA, USA, 2012. [Google Scholar]
  51. Uehara, K.; Murakami, S.; Oikawa, S.; Wakamatsu, S. Wind tunnel experiments on how thermal stratification affects flow in and above urban street canyons. Atmos. Environ. 2000, 34, 1553–1562. [Google Scholar] [CrossRef]
  52. Kwak, K.H.; Baik, J.J.; Lee, S.H.; Ryu, Y.H. Computational Fluid Dynamics Modelling of the Diurnal Variation of Flow in a Street Canyon. Bound.-Layer Meteorol. 2011, 141, 77–92. [Google Scholar] [CrossRef]
  53. Xie, X.; Huang, Z.; Wang, J.; Xie, Z. The impact of solar radiation and street layout on pollutant dispersion in street canyon. Build. Environ. 2005, 40, 201–212. [Google Scholar] [CrossRef]
Figure 1. Schematic diagram of the computational domain (H = 20 m; W = 20 m; D = 2 m; L = 100 m; Ua: ambient wind velocity; Ta: ambient air temperature).
Atmosphere 08 00043 g001
Figure 2. Diurnal variation of sunlight angles for four typical time events: (a) Morning (1000 LST); (b) Noon (1300 LST); (c) Afternoon (1600 LST); (d) Night (2000 LST).
Atmosphere 08 00043 g002
Figure 3. Meteorological conditions: (a) solar radiation; and (b) air temperature, dew point and sky effective temperature.
Atmosphere 08 00043 g003
Figure 4. Surface temperature comparison between numerical simulations with field measurements: (a) Northern wall; (b) Southern wall [41].
Atmosphere 08 00043 g004
Figure 5. Comparison of normalized horizontal velocity along the centerline of the street canyon between numerical simulation and wind tunnel data (Uehara et al., 2000).
Atmosphere 08 00043 g005
Figure 6. Diurnal variation of canyon facets temperatures between summer and winter conditions.
Atmosphere 08 00043 g006
Figure 7. Temperature comparison for all time events: (a) leeward wall and ground; (b) leeward wall and windward wall; (c) the most heated wall and the ambient air. Tlee represents leeward wall temperature; Tg represents ground temperature; Twind represents windward wall temperature; Tmax represents maximum temperature among all canyon facets; Tair: ambient air temperature.
Atmosphere 08 00043 g007
Figure 8. Along-canyon averaged streamlines for all time events: (a,b) represents 1000 LST; (c,d) represents 1300 LST; (e,f) represents 1600 LST; (g,h) represents 2000 LST. The averaging calculation was taken from x/L = 0.25 to x/L = 0.75.
Atmosphere 08 00043 g008
Figure 9. Averaged horizontal velocity profile on the symmetry plane (y = 0): (a) represents 1000 LST; (b) represents 1300 LST; (c) represents 1600 LST; (d) represents 2000 LST.
Atmosphere 08 00043 g009
Figure 10. Along-canyon averaged pollutant concentration: (a,b) represents 1000 LST; (c,d) represents 1300 LST; (e,f) represents 1600 LST; (g,h) represents 2000 LST. Please note, pollutant concentration C was normalized by averaged pollutant concentration C ¯ .
Atmosphere 08 00043 g010
Figure 11. Normalized air exchange rate (AER) of the street canyon. Please note, V stands for the volume of street canyon of unity aspect ratio; T stands for the reference time scale H/Ua.
Atmosphere 08 00043 g011
Figure 12. Residual pollutant percentage within inhabitant zones: (a) represents the combined results, (b) and (c) represent the localized concentration. (Qwall: residual pollutant mass in the near-wall-zone; Qground: residual pollutant mass in the near-ground-zone; Qi: residual pollutant mass in the inhabitant-zone, Qr: total residual pollutant mass).
Atmosphere 08 00043 g012
Table 1. Physical properties of street canyon materials.
LocationαεCp (J·kg−1·K−1)ρ (kg·m−3)
street0.20.958802600
walls0.60.958002000
soil--15001440
α, ε, Cp and ρ represent absorption coefficient, emission coefficient, specific heat capacity and density of the solid materials, respectively.
Table 2. Mesh independence study.
Elements NumberFirst Layer Thickness (m)Grid Expansion RatioMaximum Element Size (m)U (m/s) *
560,5830.41.10.60.104
645,4800.31.10.50.09
780,3180.31.10.40.083
1,026,2210.151.10.30.083
1,237,6980.11.10.20.083
2,070,1450.051.10.20.083
* Velocity at the reference location (x = 50 m, y = 0 m, z = 5 m) at 1600 LST.

