
The Precipitation Variations in the Qinghai-Xizang (Tibetan) Plateau during 1961–2015


Abstract
:1. Introduction
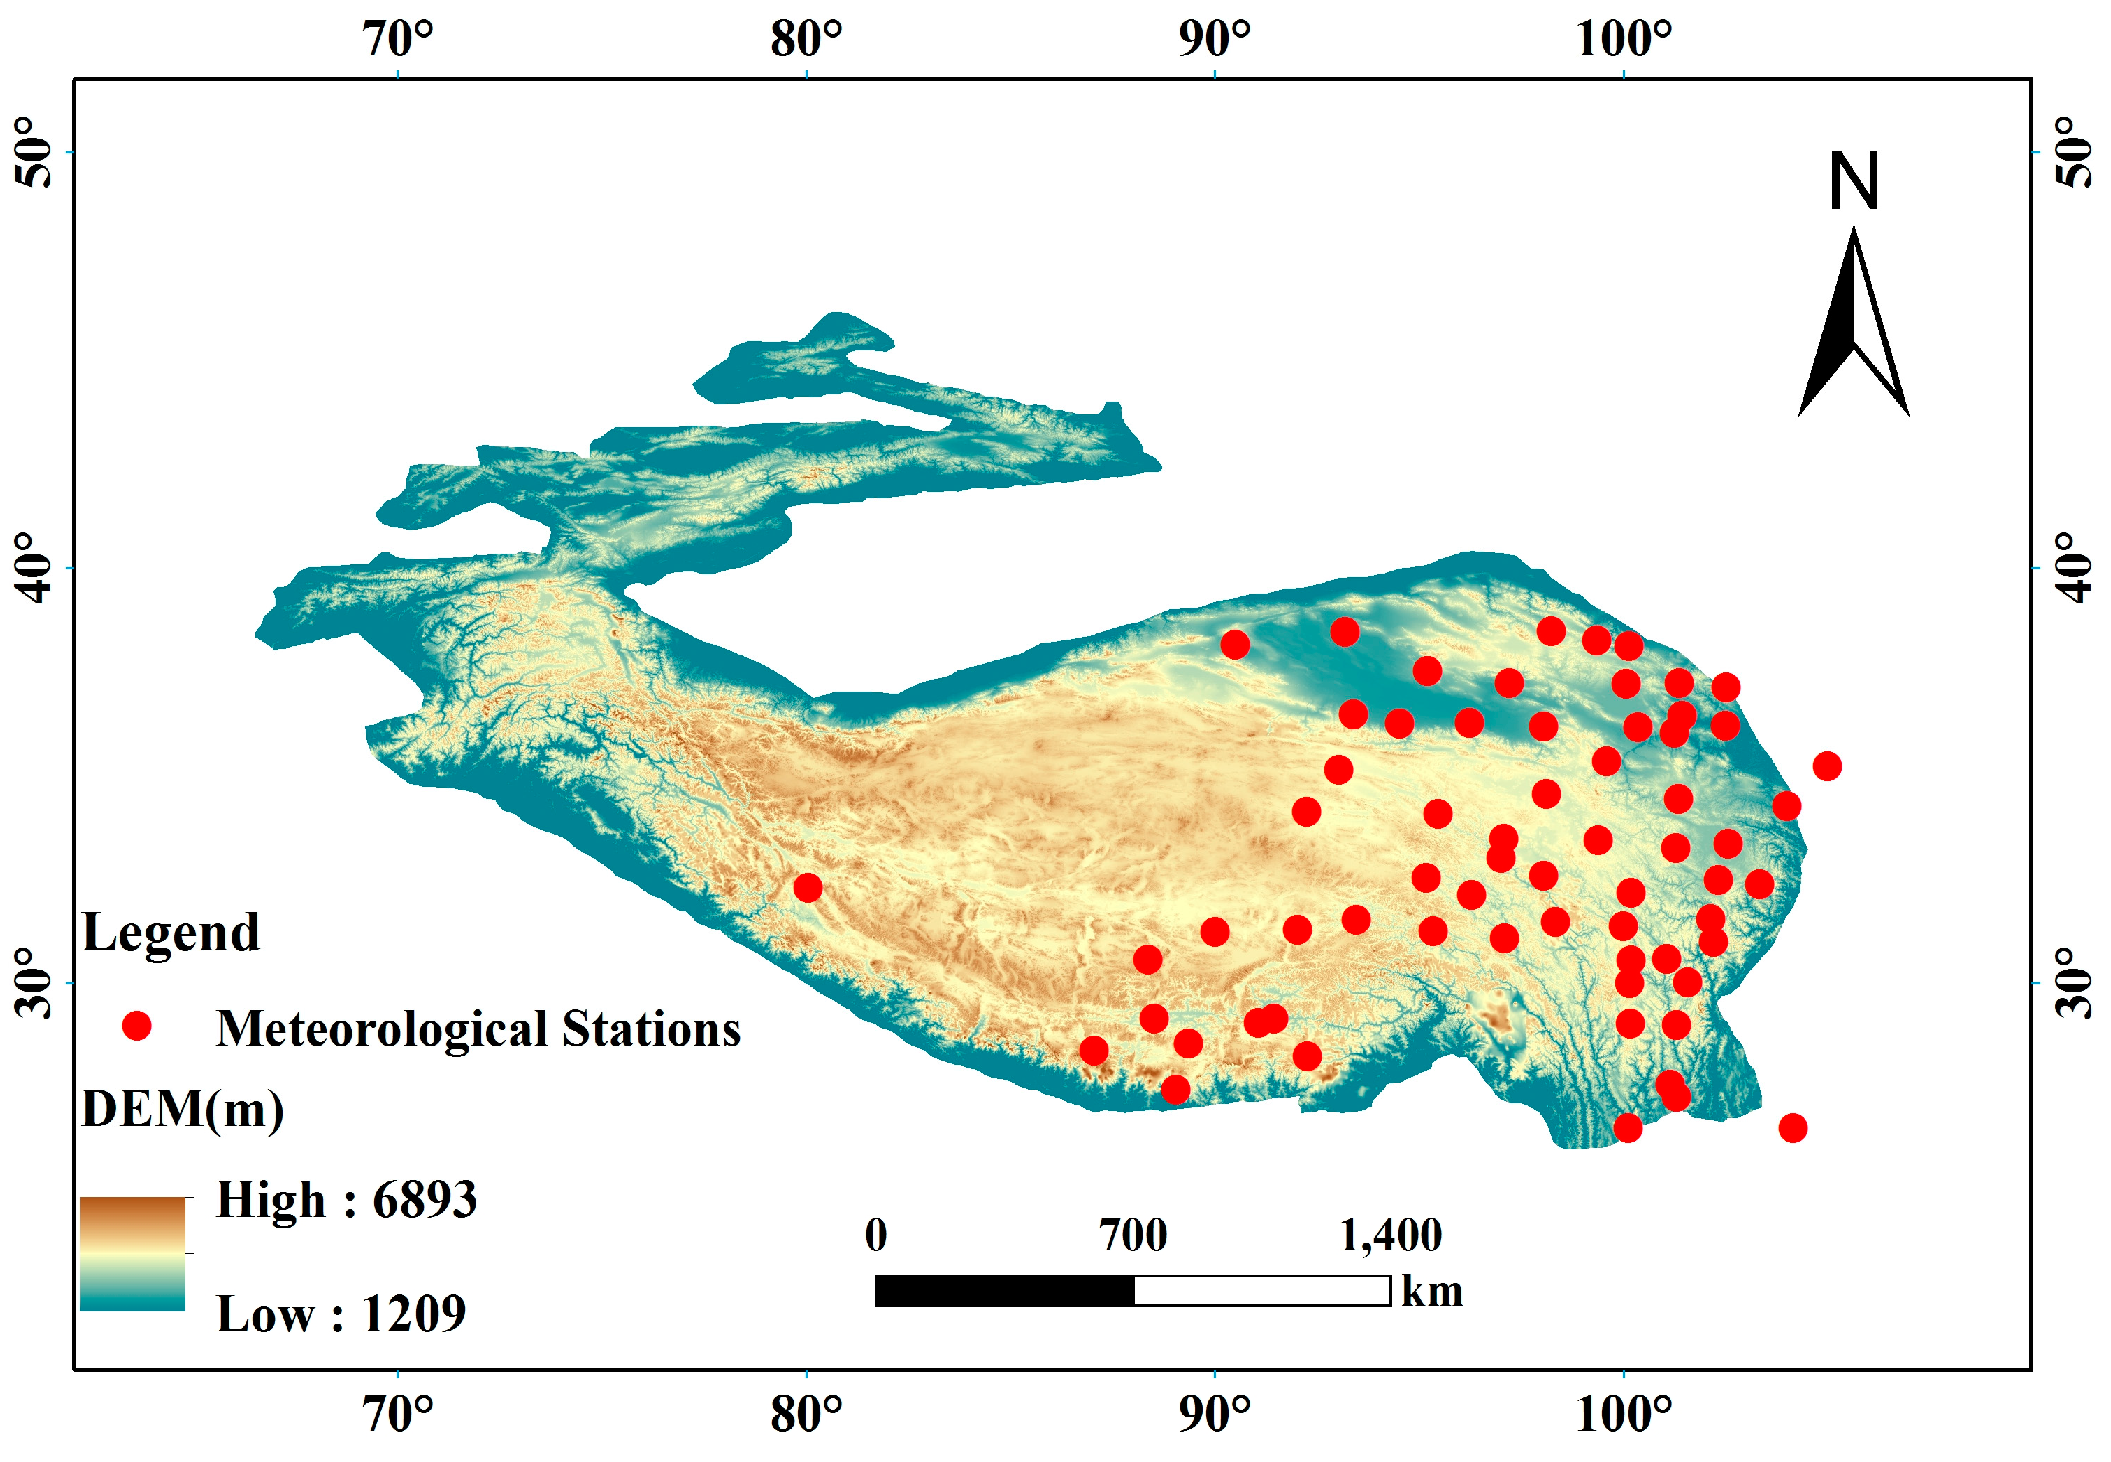
2. Data and Methods
3. Results
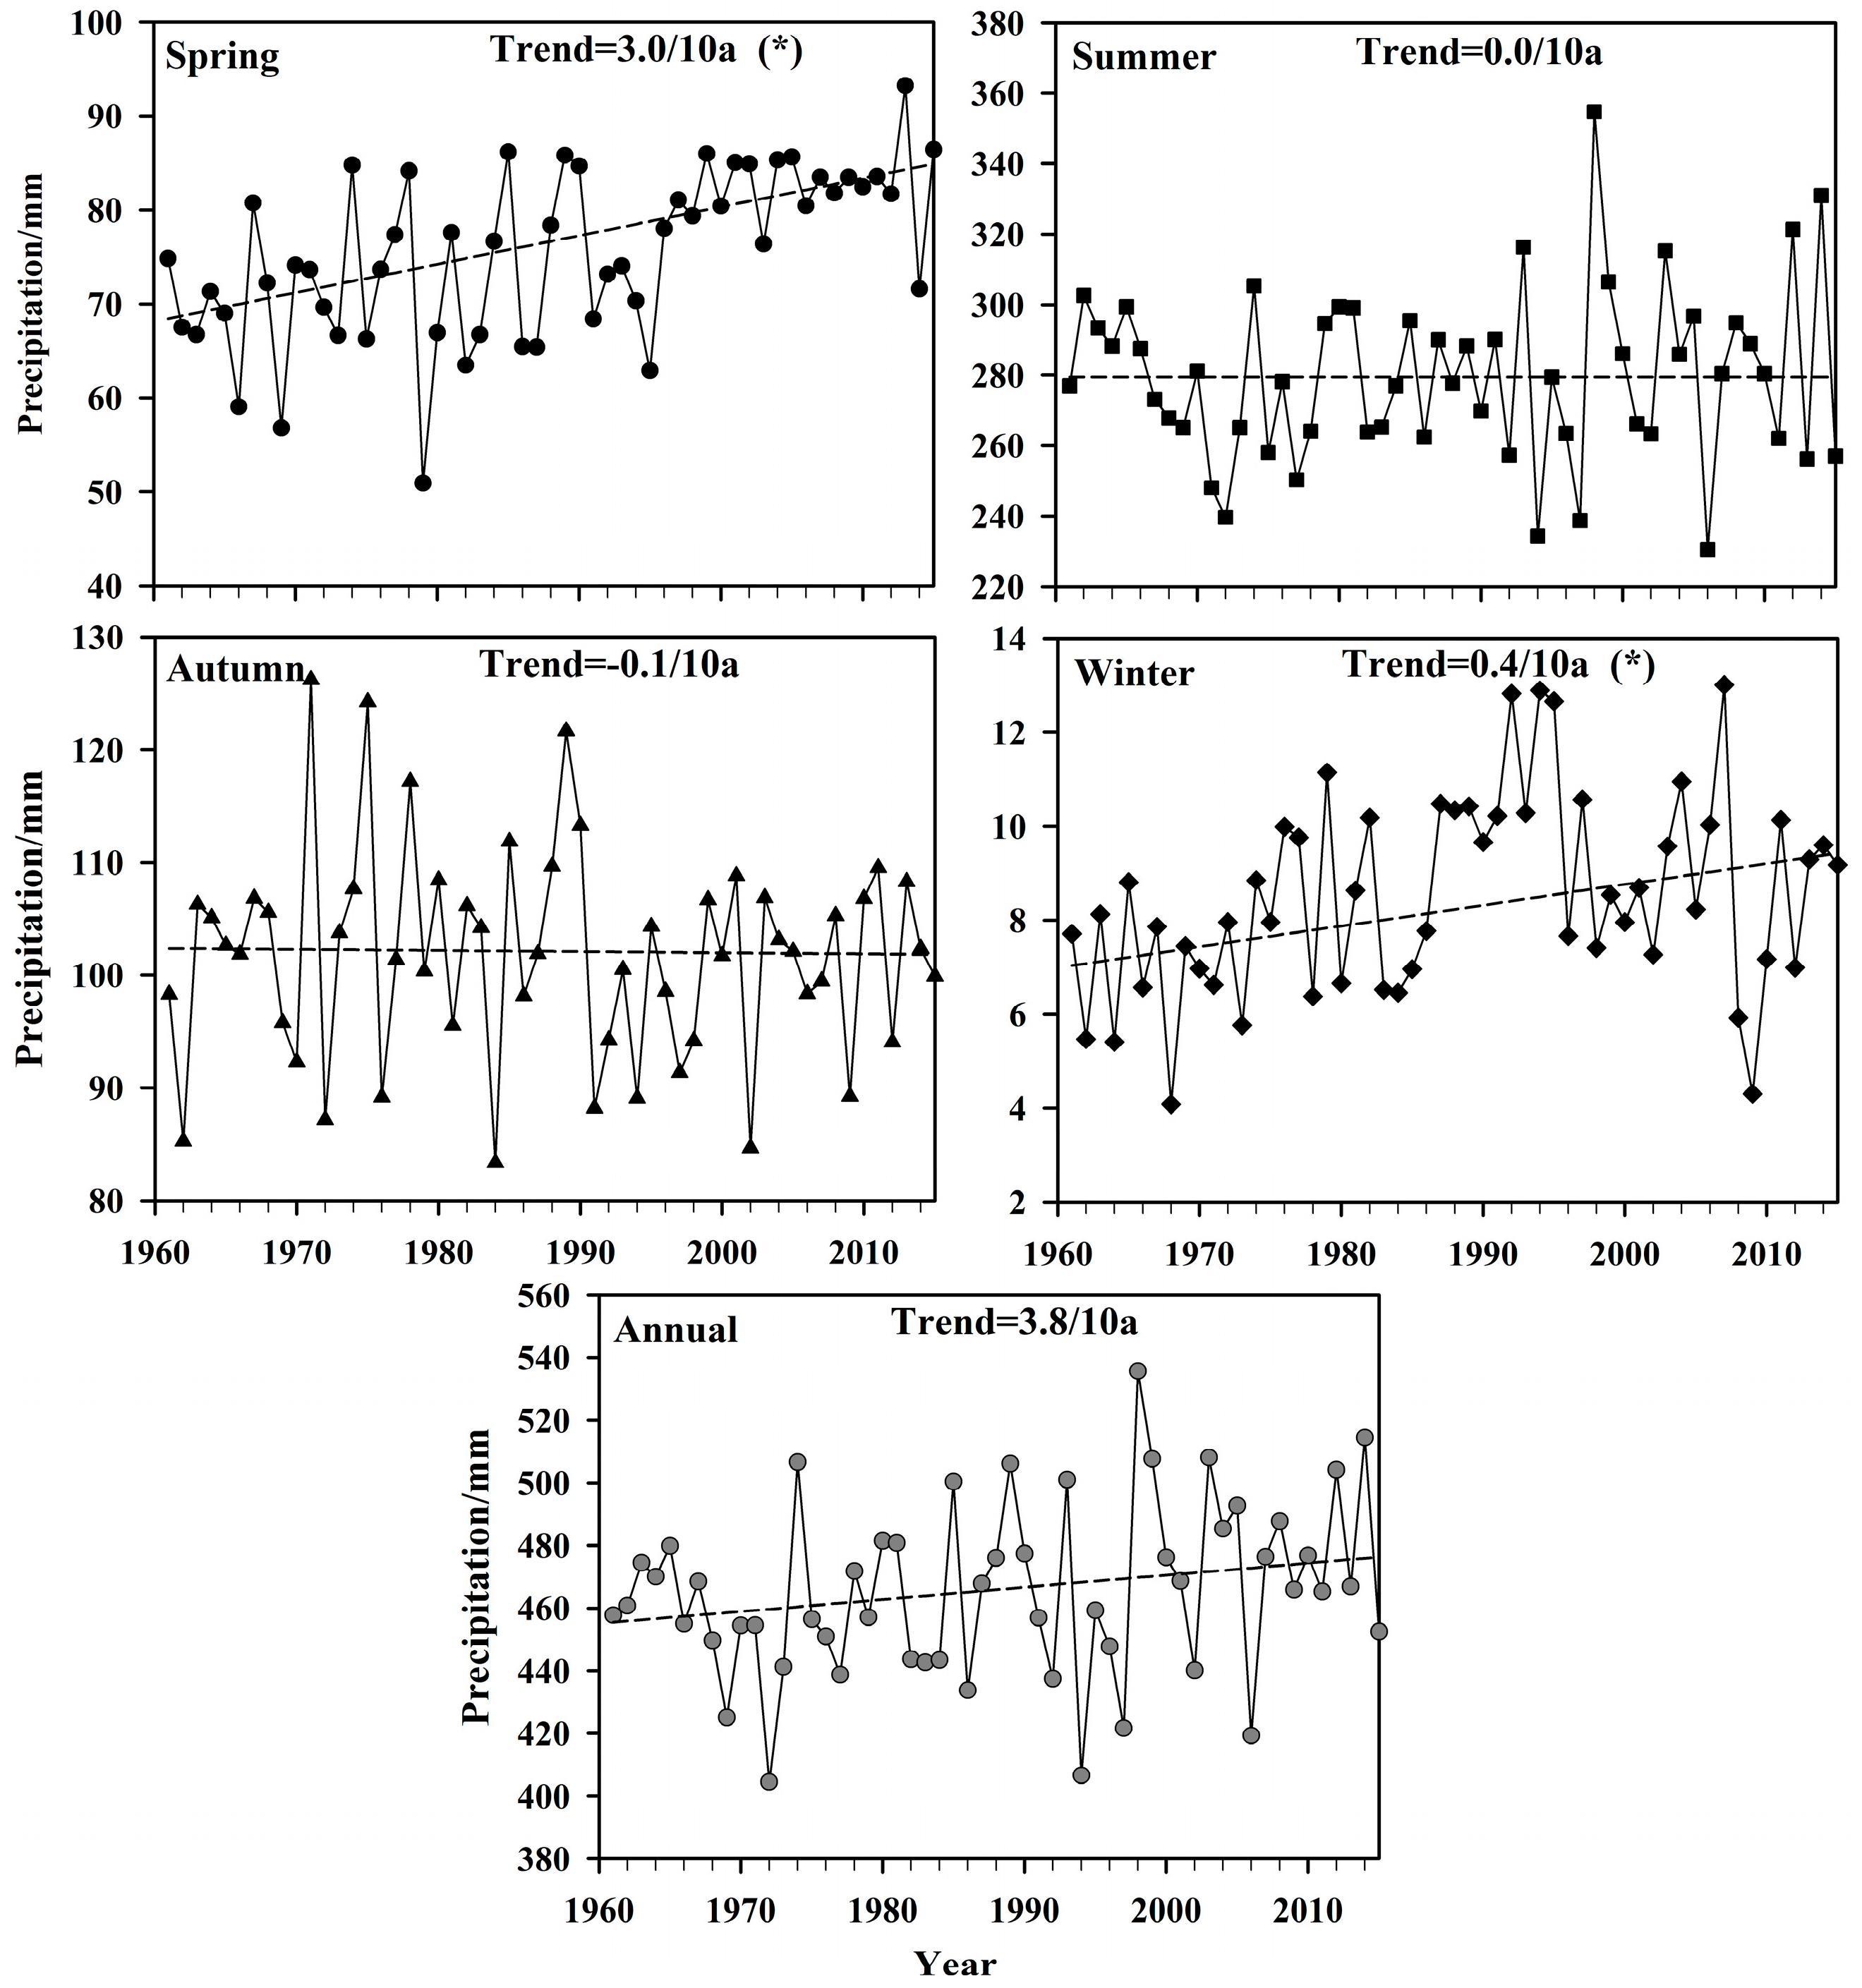
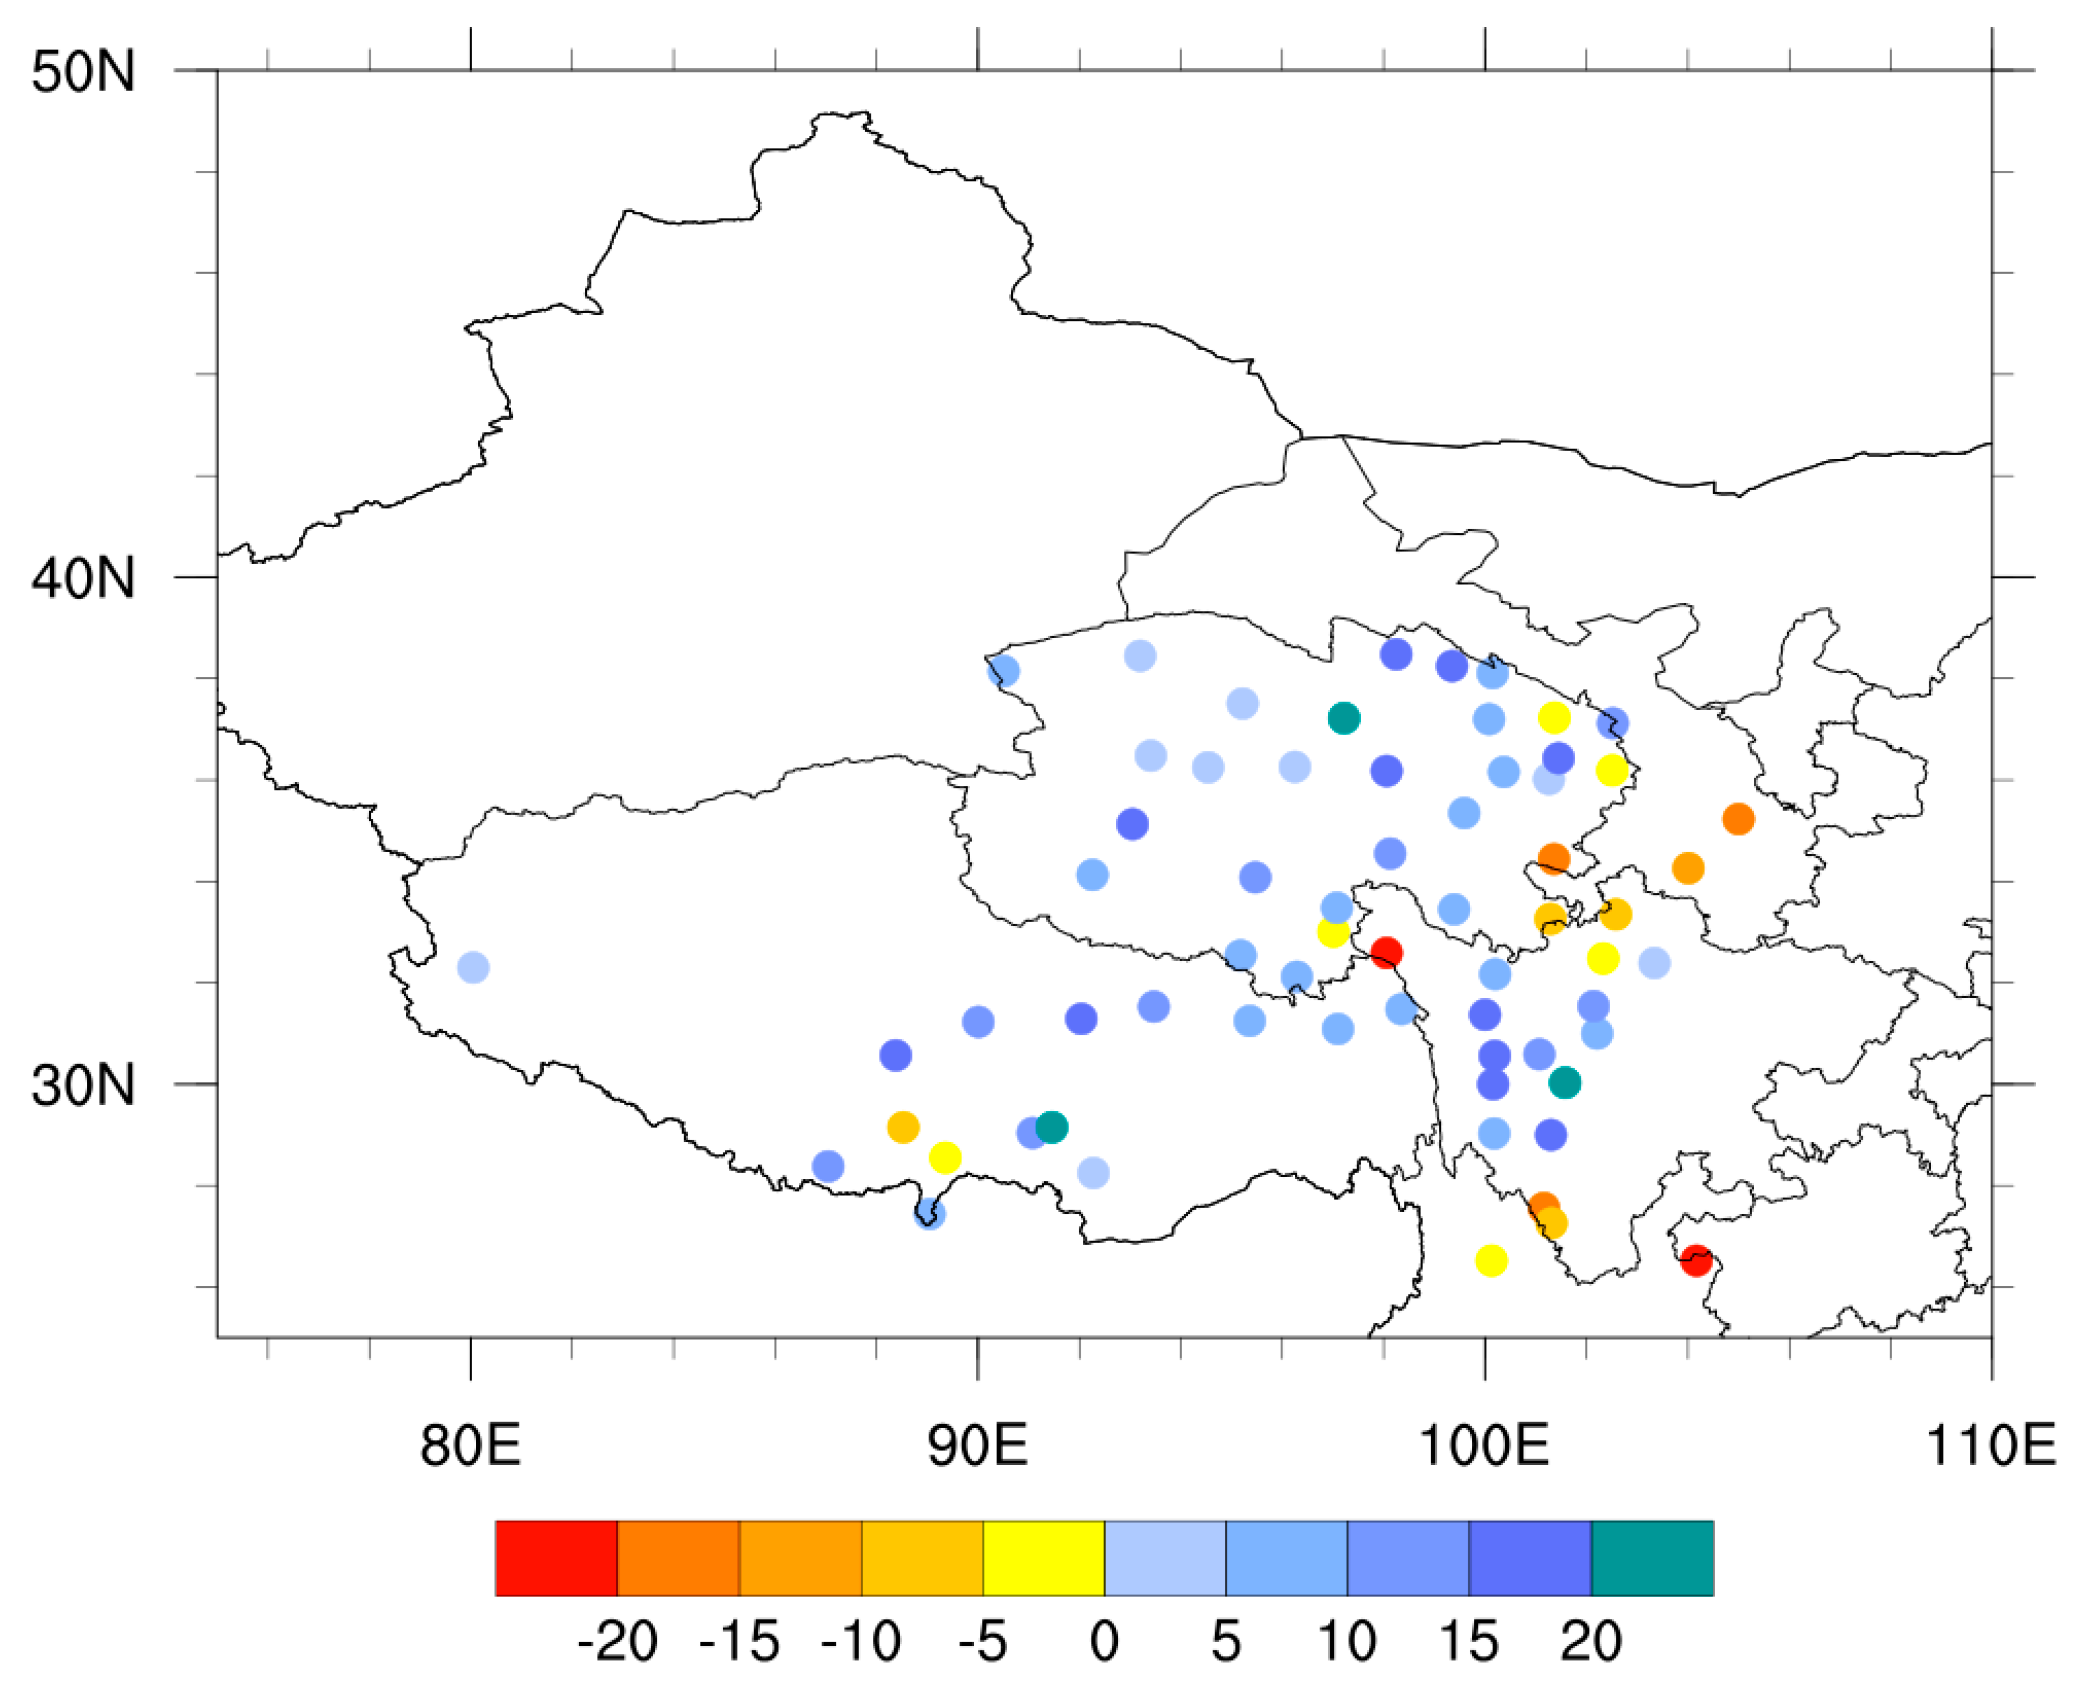
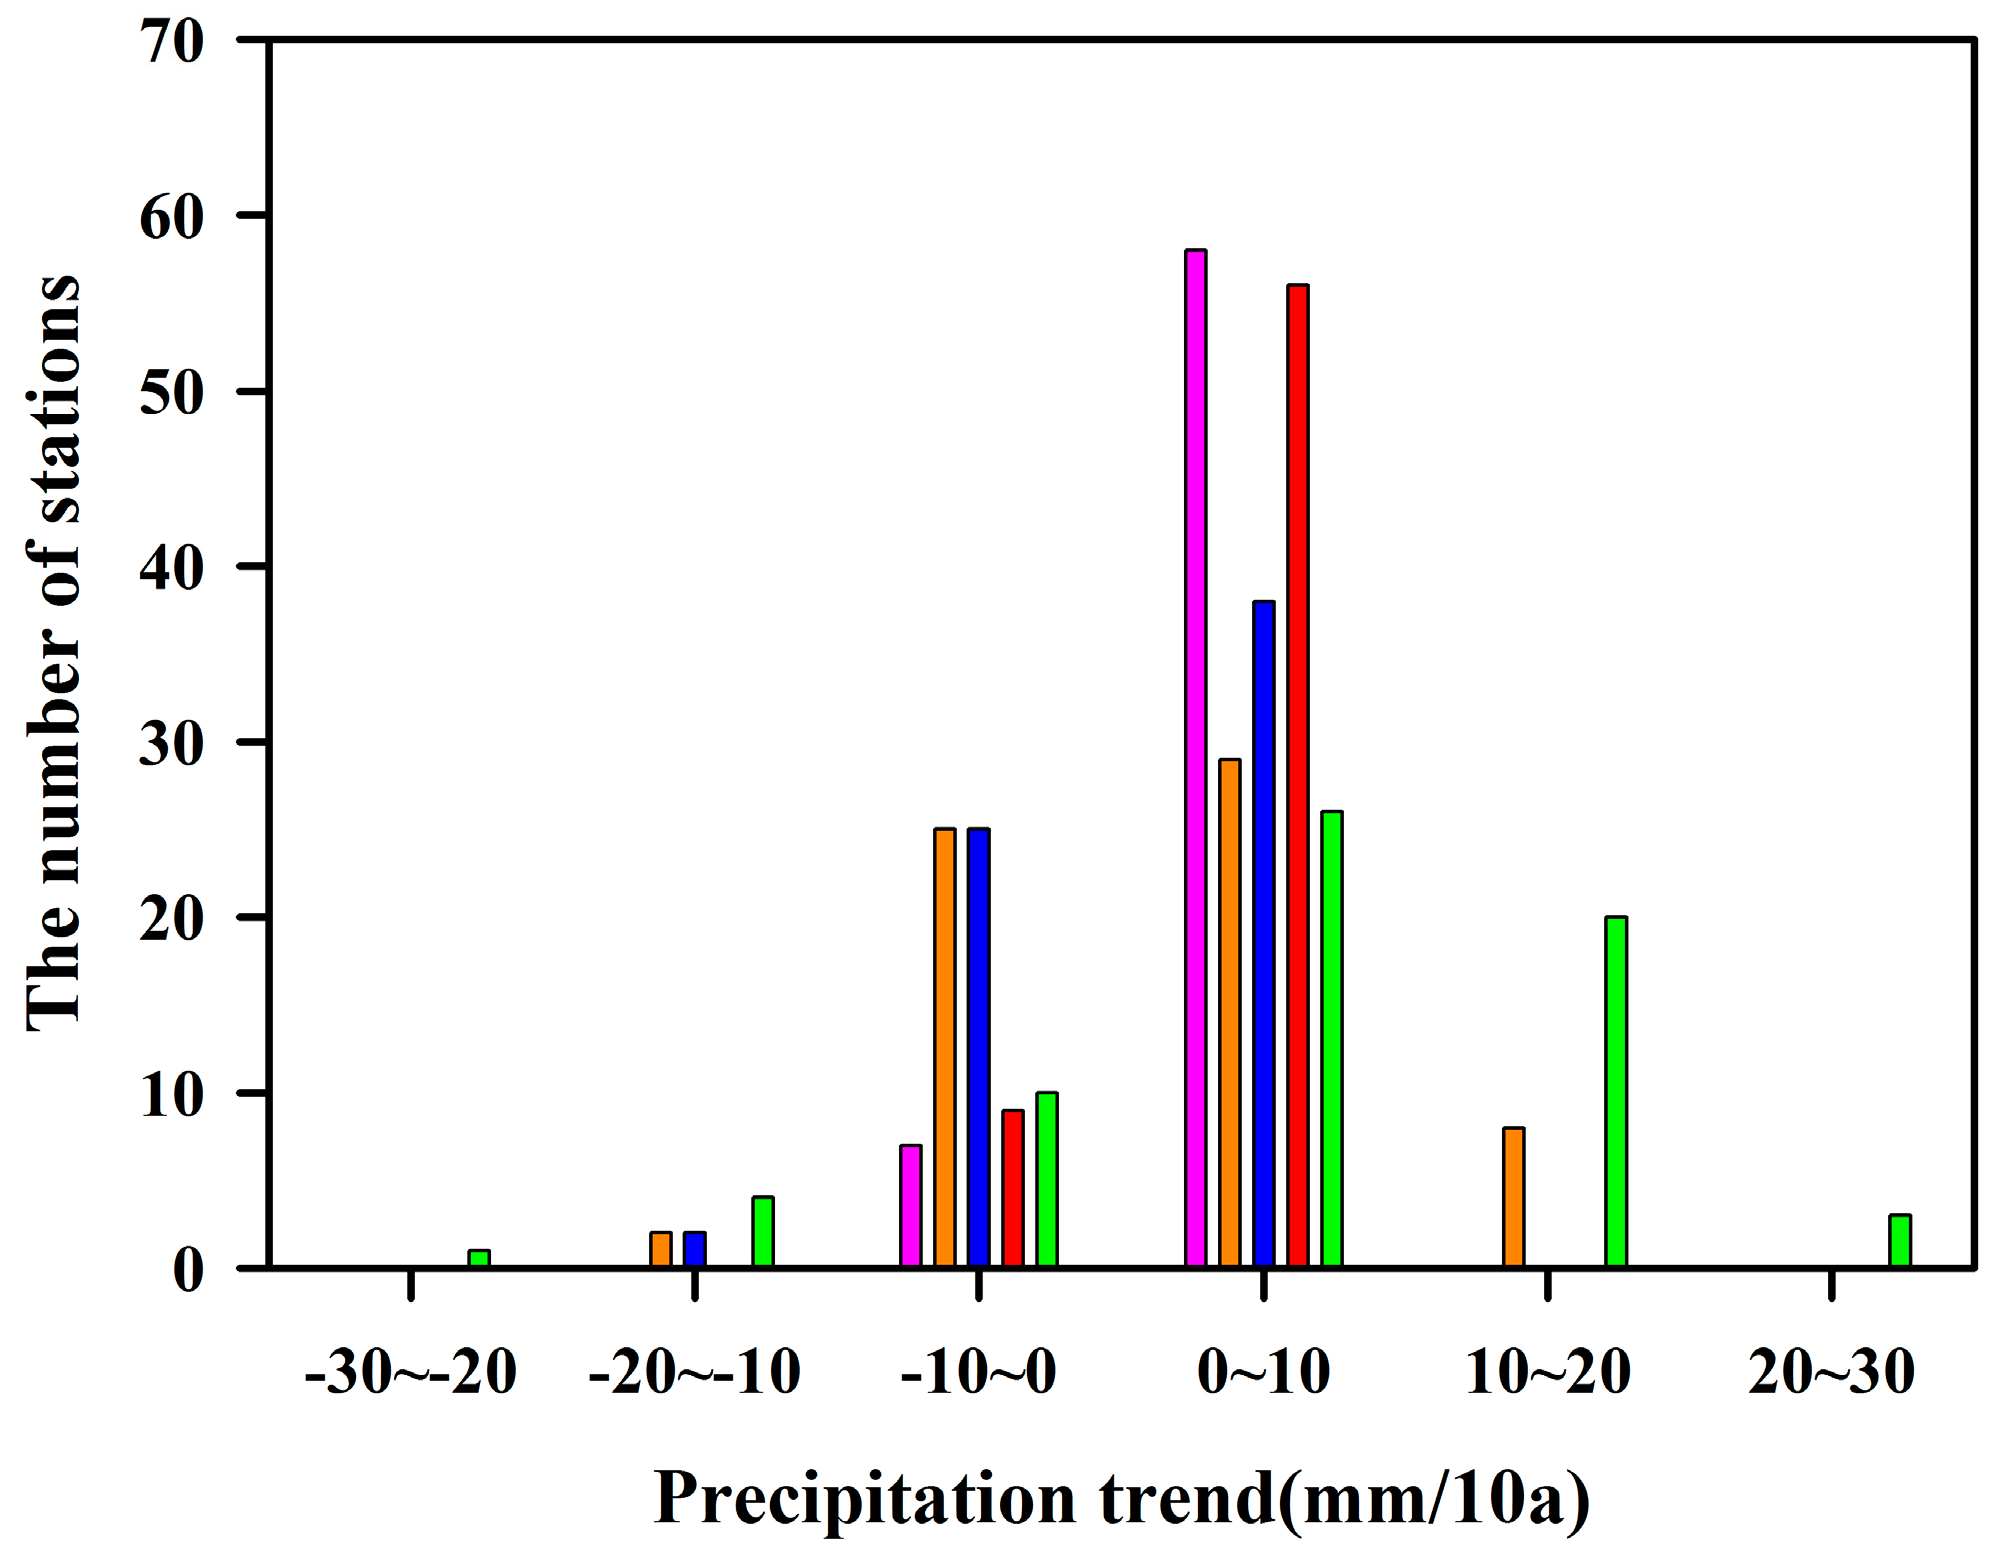
3.1. Trend in Annual and Seasonal Precipitation
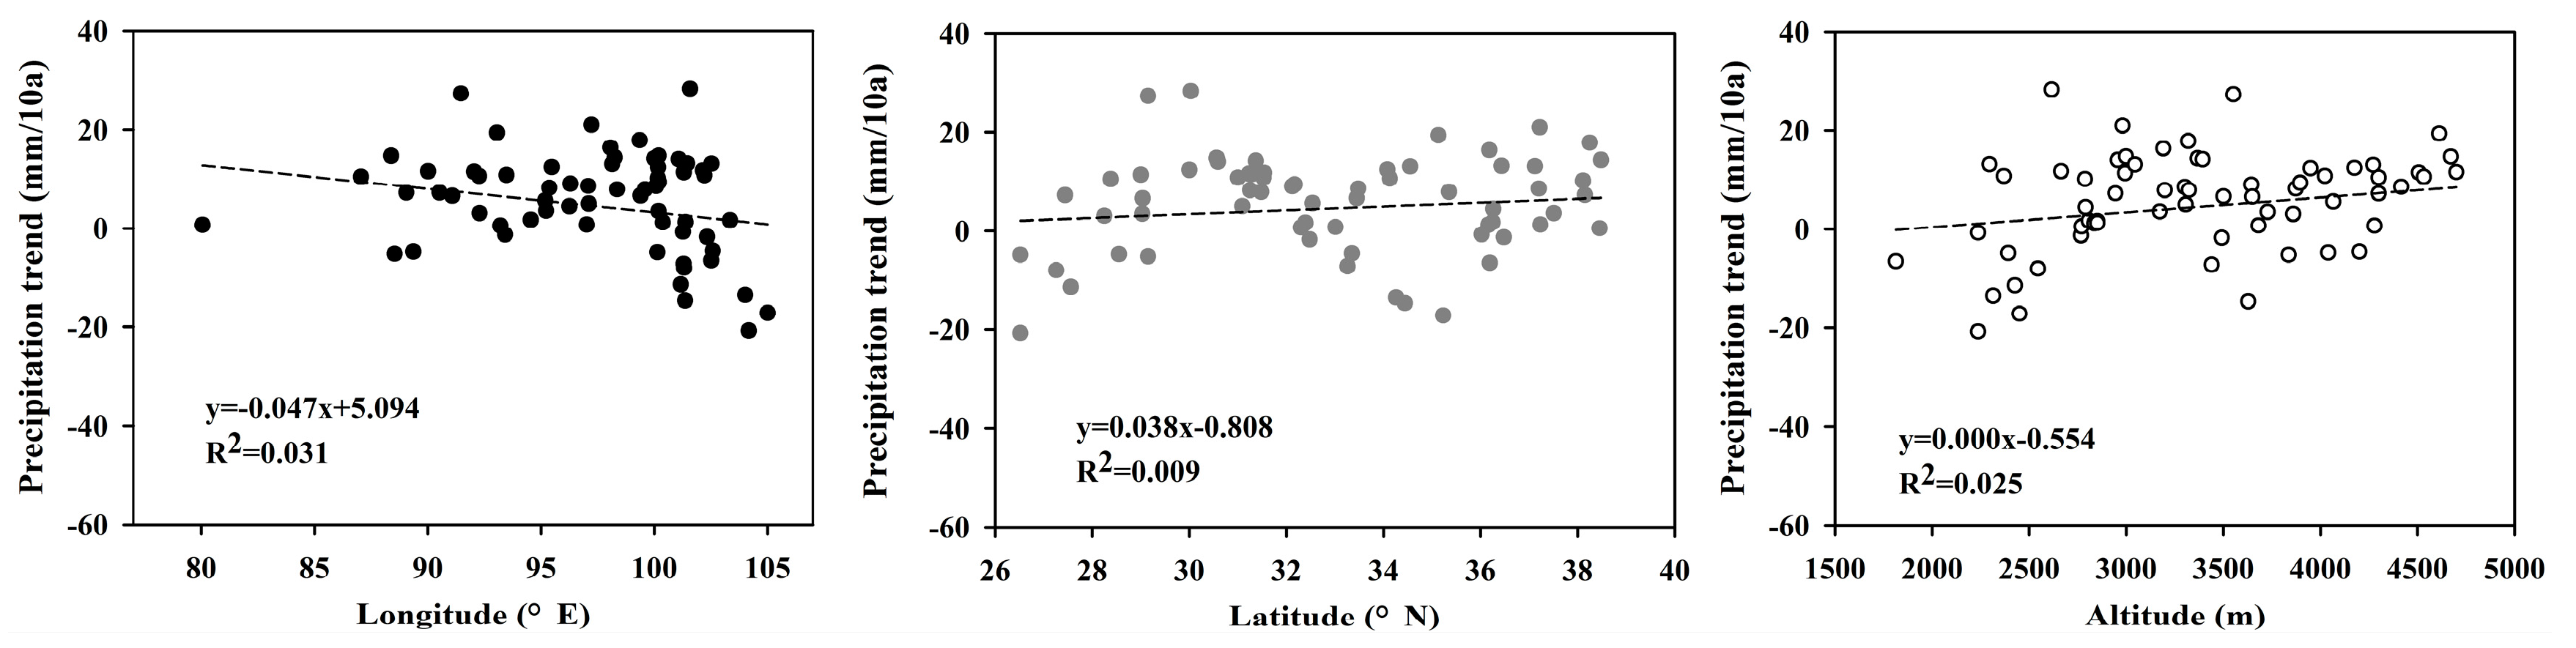
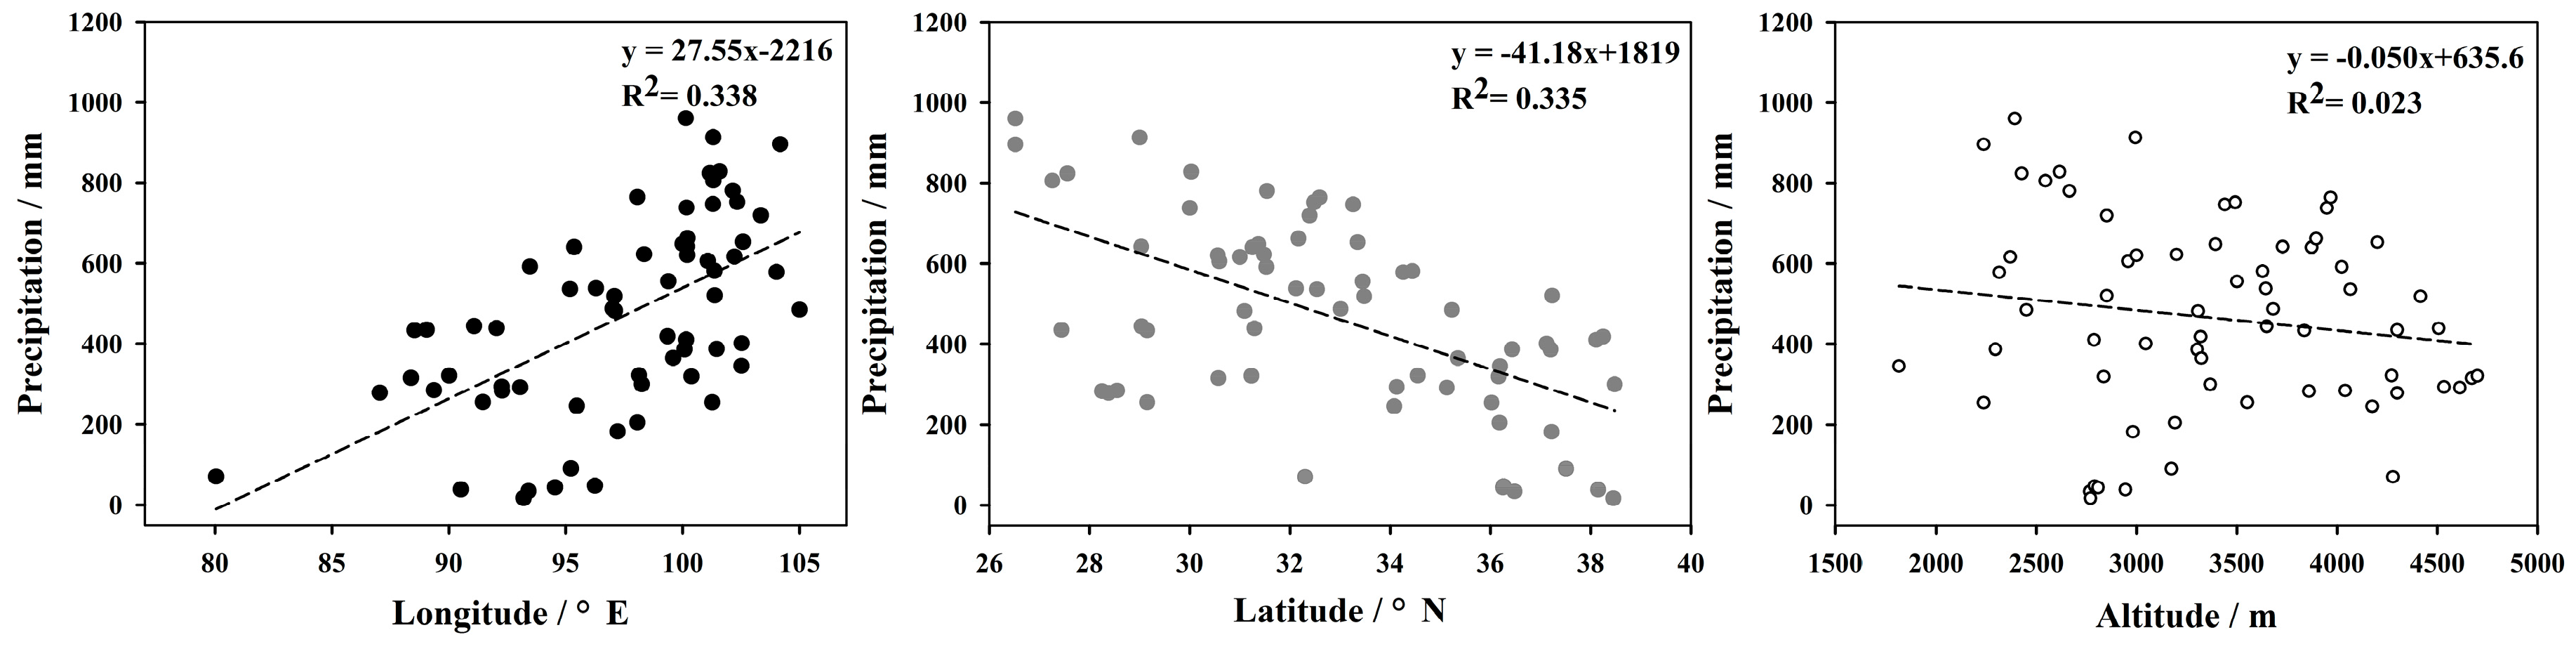
3.2. The Relationship Between Precipitation and Its Trend and Altitude, Latitude and Longitude
3.3. The Possible Reasons for Precipitation Variations
4. Discussion and Conclusions
Acknowledgments
Author Contributions
Conflicts of Interest
References
- Intergovernmental Panel on Climate Change (IPCC). Climate Change 2013: The Physical Science Basis; Cambridge University Press: Cambridge, UK; New York, NY, USA, 2013; pp. 1–30. [Google Scholar]
- Shi, Y.; Shen, Y.; Kang, E.; Li, D.; Ding, Y.; Zhang, G.; Hu, R. Recent and future climate change in northwest China. Clim. Chang. 2007, 80, 379–393. [Google Scholar] [CrossRef]
- Radić, V.; Bliss, A.; Beedlow, A.C.; Hock, R.; Miles, E.; Cogley, J.G. Regional and global projections of twenty-first century glacier mass changes in response to climate scenarios from global climate models. Clim. Dyn. 2014, 42, 37–58. [Google Scholar] [CrossRef]
- Sala, O.E.; Chapin, F.S.; Armesto, J.J.; Berlow, E.; Bloomfield, J.; Dirzo, R.; Huber-Sanwald, E.; Huenneke, L.E.; Jackson, R.B.; Kinzig, A.; et al. Global biodiversity scenarios for the year 2100. Science 2000, 287, 1770–1774. [Google Scholar] [CrossRef] [PubMed]
- Chapin, F.S.; Osvaldo, E.S.; Huber-Sannwald, E. Global Biodiversity in a Changing Environment: Scenarios for the 21st Century; Springer: New York, NY, USA, 2013; pp. 5–22. [Google Scholar]
- Wang, J.; Dai, A.; Mears, C. Global water vapor trend from 1988 to 2011 and its diurnal asymmetry based on GPS, radiosonde, and microwave satellite measurements. J. Clim. 2016, 29, 5205–5222. [Google Scholar] [CrossRef]
- Yao, C.; Yang, S.; Qian, W.; Lin, Z.; Wen, M. Regional summer precipitation events in Asia and their changes in the past decades. J. Geophys. Res. Atmos. 2008, 113, 487–497. [Google Scholar] [CrossRef]
- Roderick, M.L.; Sun, F.; Lim, W.H.; Farquhar, G.D. A general framework for understanding the response of the water cycle to global warming over land and ocean. Hydrol. Earth Syst. Sci. 2014, 18, 1575–1589. [Google Scholar] [CrossRef]
- Hirabayashi, Y.; Mahendran, R.; Koirala, S.; Konoshima, L.; Yamazaki, A.; Watanabe, S.; Kim, H.; Kanae, S. Global flood risk under climate change. Nat. Clim. Chang. 2013, 3, 816–821. [Google Scholar] [CrossRef]
- Trenberth, K.E.; Dai, A.; van der Schrier, G.; Jones, P.D.; Barichivich, J.; Briffa, K.R.; Sheffield, J. Global warming and changes in drought. Nat. Clim. Chang. 2014, 4, 17–22. [Google Scholar] [CrossRef]
- Weltzin, J.F.; Loik, M.E.; Schwinning, S.; Williams, D.G.; Fay, P.A.; Haddad, B.M.; Harte, J.; Huxman, T.E.; Knapp, A.K.; Lin, G.; et al. Assessing the response of terrestrial ecosystems to potential changes in precipitation. Bioscience 2009, 53, 941–952. [Google Scholar] [CrossRef]
- Piao, S.; Ciais, P.; Huang, Y.; Shen, Z.; Peng, S.; Li, J.; Zhou, L.; Liu, H.; Ma, Y.; Ding, Y.; et al. The impacts of climate change on water resources and agriculture in China. Nature 2010, 467, 43–51. [Google Scholar] [CrossRef] [PubMed]
- Jones, P.D.; Hulme, M. Calculating regional climatic time series for temperature and precipitation: Methods and illustrations. Int. J. Climatol. 1996, 16, 361–377. [Google Scholar] [CrossRef]
- Hulme, M.; Osborn, T.J.; Johns, T.C. Precipitation sensitivity to global warming: Comparison of observations with HadCM2 simulations. Geophys. Res. Lett. 1998, 25, 3379–3382. [Google Scholar] [CrossRef]
- Karl, T.R.; Knight, R.W. Secular trends of precipitation amount, frequency, and intensity in the United States. Bull. Am. Meteor. Soc. 1998, 79, 231–241. [Google Scholar] [CrossRef]
- Li, Y.; Li, D.; Yang, S.; Liu, C.; Zhong, A.; Li, Y. Characteristics of the precipitation over the eastern edge of the Tibetan Plateau. Meteorol. Atmos. Phys. 2010, 106, 49–56. [Google Scholar] [CrossRef]
- Klein Tank, A.M.G.; Wijngaard, J.B.; Können, G.P.; Böhm, R.; Demarée, G.; Gocheva, A.; Pashiardis, S.; Hejkrlik, L.; Kern-Hansen, C.; Heino, R.; et al. Daily dataset of 20th-century surface air temperature and precipitation series for the European Climate Assessment. Int. J. Climatol. 2002, 22, 1441–1453. [Google Scholar] [CrossRef]
- Pal, J.S.; Giorgi, F.; Bi, X. Consistency of recent European summer precipitation trends and extremes with future regional climate projections. Geophys. Res. Lett. 2004, 31, 1–4. [Google Scholar] [CrossRef]
- Xu, Z.; Takeuchi, K.; Ishidaira, H. Monotonic trend and step changes in Japanese precipitation. J. Hydrol. 2003, 279, 144–150. [Google Scholar] [CrossRef]
- Sen Roy, S.; Balling, J.R.; Robert, C. Trends in extreme daily precipitation indices in India. Int. J. Climatol. 2004, 24, 457–466. [Google Scholar] [CrossRef]
- New, M.; Todd, M.; Hulme, M.; Jones, P. Precipitation measurements and trends in the twentieth century. Int. J. Climatol. 2001, 21, 1889–1922. [Google Scholar] [CrossRef]
- Mohammed, H.I. Climate change and changes in global precipitation patterns: What do we know? Environ. Int. 2005, 31, 1167–1181. [Google Scholar]
- Zhai, P.; Zhang, X.; Wan, H.; Pan, X. Trends in total precipitation and frequency of daily precipitation extremes over China. J. Clim. 2005, 18, 1096–1108. [Google Scholar] [CrossRef]
- Choi, G.; Collins, D.; Ren, G.; Trewin, B.; Baldi, M.; Fukuda, Y.; Afzaal, M.; Pianmana, T.; Gomboluudev, P.; Huong, P.T.T.; et al. Changes in means and extreme events of temperature and precipitation in the Asia-Pacific Network region, 1955–2007. Int. J. Climatol. 2011, 29, 1906–1925. [Google Scholar] [CrossRef]
- Liu, B.; Xu, M.; Henderson, M.; Qi, Y. Observed trends of precipitation amount, frequency, and intensity in China, 1960–2000. J. Geophys. Res. Atmos. 2005, 110, 1–10. [Google Scholar] [CrossRef]
- Xin, H. A green fervor sweeps the Qinghai-Tibetan Plateau. Science 2008, 321, 633–635. [Google Scholar] [CrossRef] [PubMed]
- Feng, L.; Wei, F. Regional characteristics of summer precipitation on Tibetan Plateau and it’s water vapor feature in neighboring areas. Plateau Meteor. 2008, 27, 491–499. [Google Scholar]
- Cannarozzo, M.; Noto, L.V.; Viola, F. Spatial distribution of rainfall trends in Sicily (1921–2000). Phys. Chem. Earth 2006, 31, 1201–1211. [Google Scholar] [CrossRef]
- Niu, T.; Chen, L.; Zhou, Z. The characteristics of climate change over the Tibetan Plateau in the last 40 years and the detection of climatic jumps. Adv. Atmos. Sci. 2004, 21, 193–203. [Google Scholar] [CrossRef]
- Ma, X.; Hu, Z. Precipitation variation characteristics and abrupt change over Qinhai-Xizang Plateau in recent 40 years. J. Desert Res. 2005, 25, 137–139. [Google Scholar]
- Wu, S.; Yin, Y.; Zheng, D.; Yang, Q. Climatic trends over the Tibetan Plateau during 1971–2000. J. Geogr. Sci. 2007, 17, 141–151. [Google Scholar] [CrossRef]
- Xu, Z.; Gong, T.; Li, J. Decadal trend of climate in the Tibetan Plateau-regional temperature and precipitation. Hydrol. Process. 2008, 22, 3056–3065. [Google Scholar] [CrossRef]
- Xie, H.; Ye, J.; Liu, X.; Chongyi, E. Warming and drying trends on the Tibetan Plateau (1971–2005). Theor. Appl. Climatol. 2010, 101, 241–253. [Google Scholar] [CrossRef]
- Zhou, S.; Wang, C.; Wu, P.; Wang, M. Temporal and spatial distribution of strong precipitation days over the Tibetan Plateau. Arid Land Geogr. 2012, 35, 23–31. [Google Scholar]
- Lu, H.; Shao, Q.; Liu, J.; Chen, Z. Temporo-spatial distribution of summer precipitation over Qinghai-Tibet Plateau during the last 44 years. Acta Geogr. Sin. 2007, 62, 946–958. [Google Scholar]
- Lin, Z.; Zhao, X. Spatial characteristics of changes in temperature and precipitation of the Qinghai-Xizang (Tibet) Plateau. Sci. China Earth Sci. 1996, 39, 442–448. [Google Scholar]
- You, Q.; Kang, S.; Aguilar, E.; Yan, Y. Changes in daily climate extremes in the eastern and central Tibetan Plateau during 1961–2005. J. Geophys. Res. Atmos. 2008, 113, 1639–1647. [Google Scholar] [CrossRef]
- Easterling, D.R.; Meehl, G.A.; Parmesan, C.; Changnon, A.A.; Kar, T.R.; Mearns, L.O. Climate extremes: Observations, modeling, and impacts. Science 2000, 289, 2068–2074. [Google Scholar] [CrossRef] [PubMed]
- Groisman, P.Y.; Knight, R.W.; Easterling, D.R.; Karl, T.R.; Hegerl, G.C. Trends in intense precipitation in the climate record. J. Clim. 2005, 18, 1326–1350. [Google Scholar] [CrossRef]
- Cui, X.; Graf, H.F.; Langmann, B.; Chen, W.; Hhuang, R. Climate impacts of anthropogenic land use changes on the Tibetan Plateau. Glob. Planet. Chang. 2006, 54, 33–56. [Google Scholar] [CrossRef]
- Guo, Y.; Yu, Y.; Liu, X.; Zhang, X. Simulation of climate change induced by CO2 increasing for East Asia with IAP/LASG GOALS model. Adv. Atmos. Sci. 2001, 18, 53–66. [Google Scholar]
- Lau, K.M.; Kim, K.M. Observational relationships between aerosol and Asian monsoon rainfall, and circulation. Geophys. Res. Lett. 2006, 33, 320–337. [Google Scholar] [CrossRef]
- Liu, H.; Duan, K. Effects of north atlantic oscillation on summer precipitation over the Tibetan Plateau. J. Glaciol. Geocryol. 2012, 34, 311–318. [Google Scholar]
- Dai, A. Increasing drought under global warming in observations and models. Nat. Clim. Chang. 2013, 3, 52–58. [Google Scholar] [CrossRef]
- Li, Q.; Liu, X.; Zhang, H.; Peterson, T.C.; Easterling, D.R. Detecting and adjusting temporal inhomogeneity in Chinese mean surface air temperature data. Adv. Atmos. Sci. 2004, 21, 260–268. [Google Scholar] [CrossRef]
- Begert, M.; Schlegel, T.; Kirchhofer, W. Homogeneous temperature and precipitation series of Switzerland from 1864 to 2000. Int. J. Climatol. 2005, 25, 65–80. [Google Scholar] [CrossRef]
- Yan, Z.; Li, Z.; Xia, J. Homogenization of climate series: The basis for assessing climate changes. Sci. China Earth Sci. 2014, 57, 2891–2900. [Google Scholar] [CrossRef]
- Qin, J.; Yang, K.; Liang, S.; Guo, X. The altitudinal dependence of recent rapid warming over the Tibetan Plateau. Clim. Chang. 2009, 97, 321–327. [Google Scholar] [CrossRef]
- Cao, L.; Ju, X.; Liu, X. Penalized maximal F test for the homogeneity study of the annual mean wind speed over China. Meteor. Mon. 2010, 36, 52–56. [Google Scholar]
- Zhang, X.; Aguilar, E.; Sensoy, S.; Melkonyan, H.; Tagiyeva, U.; Ahmed, N.; Kutaladze, N.; Rahimzadeh, F.; Taghipour, A.; Hantosh, T.H.; et al. Trends in Middle East climate extreme indices from 1950 to 2003. J. Geophys. Res. Atmos. 2005, 110, 3159–3172. [Google Scholar] [CrossRef]
- Wang, X. Comments on “Detection of undocumented changepoints: A revision of the two-phase regression model”. J. Clim. 2003, 16, 3383–3385. [Google Scholar] [CrossRef]
- Wang, X. Accounting for autocorrelation in detecting mean-shifts in climate data series using the penalized maximal t or F test. J. Appl. Meteor. Climatol. 2008, 47, 2423–2444. [Google Scholar] [CrossRef]
- Wang, X. Penalized maximal f-test for detecting undocumented mean-shifts without trend-change. J. Atmos. Ocean. Technol. 2008, 25, 368–384. [Google Scholar] [CrossRef]
- Lu, A.; Kang, S.; Quan, Q. Spatial precipitation variation across China during 1951–2002. Ecol. Environ. Sci. 2010, 19, 205–207. [Google Scholar]
- Cai, Y.; Li, D.; Tang, M.; Bai, C. Decadal temperature changes over Qinghai-Xizang Plateau in recent 50 years. Plateau Meteor. 2003, 22, 464–470. [Google Scholar]
- Jiang, Y.; Li, S.; Shen, D.; Chen, W.; Jin, C. Climate change and its impact on the lake environment in the Tibetan Plateau in 1971–2008. Sci. Geogr. Sin. 2012, 32, 1503–1512. [Google Scholar]
- Du, J.; Ma, Y. Climate trend of rainfall over Tibetan Plateau from 1971 to 2000. Acta Geogr. Sin. 2004, 59, 375–382. [Google Scholar]
- Liu, X.; Yin, Z.; Shao, X.; Qin, N. Temporal trends and variability of daily maximum and minimum, extreme temperature events, and growing season length over the eastern and central Tibetan Plateau during 1961–2003. J. Geophys. Res. Atmos. 2006, 111, 4617–4632. [Google Scholar] [CrossRef]
- Wentz, F.J.; Ricciardulli, L.; Hilburn, K.; Mears, C. How much more rain will global warming bring? Science 2007, 317, 233–235. [Google Scholar] [CrossRef] [PubMed]
- Werth, D.; Avissar, R. The local and global effects of Amazon deforestation. J. Geophys. Res. 2002, 107, 5823–5826. [Google Scholar] [CrossRef]
- Meehl, G.A.; Arblaster, J.M.; Collins, W.D. Effects of black carbon aerosols on the Indian monsoon. J. Clim. 2008, 21, 2869–2882. [Google Scholar] [CrossRef]
- Yao, T.; Thompson, L.; Yang, W.; Yu, W.; Gao, Y.; Guo, X.; Yang, X.; Duan, K.; Zhao, H.; Xu, B.; et al. Different glacier status with atmospheric circulations in Tibetan Plateau and surroundings. Nat. Clim. Chang. 2012, 2, 663–667. [Google Scholar] [CrossRef]


| Station Number | Name | Latitude (° N) | Longitude (° E) | Altitude (m) | Missing Period (Month) |
|---|---|---|---|---|---|
| 51886 | Mangya | 38°15′ | 90°51′ | 2944.8 | |
| 52602 | Lenghu | 38°45′ | 93°20′ | 2770 | |
| 52633 | Tuole | 38°48′ | 98°25′ | 3367 | |
| 52645 | Yeniugou | 38°25′ | 99°35′ | 3320 | |
| 52657 | Qilian | 38°11′ | 100°15′ | 2787.4 | |
| 52707 | Xiaozaohuo | 36°48′ | 93°41′ | 2767 | Apr.–Dec. 1974 |
| 52713 | Dachaidan | 37°51′ | 95°22′ | 3173.2 | |
| 52737 | Delingha | 37°22′ | 97°22′ | 2981.5 | |
| 52754 | Gangcha | 37°20′ | 100°08′ | 3302 | |
| 52765 | Menyuan | 37°23′ | 101°37′ | 2851 | |
| 52787 | Wushaoling | 37°12′ | 102°52′ | 3045.1 | |
| 52818 | Geermu | 36°25′ | 94°54′ | 2807.6 | |
| 52825 | Nuomuhong | 36°26′ | 96°25′ | 2790.4 | |
| 52836 | Dulan | 36°18′ | 98°06′ | 3191.1 | |
| 52856 | Gonghe | 36°16′ | 100°37′ | 2835 | |
| 52866 | Xining | 36°43′ | 101°45′ | 2295.2 | |
| 52868 | Guide | 36°02′ | 101°26′ | 2237.1 | |
| 52876 | Minhe | 36°19′ | 102°51′ | 1813.9 | |
| 52908 | Wudaoliang | 35°13′ | 93°05′ | 4612.2 | |
| 52943 | Xinghai | 35°35′ | 99°59′ | 3323.2 | |
| 52996 | Huajialing | 35°23′ | 105°00′ | 2450.6 | |
| 55228 | Shiquanhe | 32°30′ | 80°05′ | 4278.6 | |
| 55279 | Bange | 31°23′ | 90°01′ | 4700 | Apr. 1965 |
| 55299 | Naqu | 31°29′ | 92°04′ | 4507 | |
| 55472 | Shenzha | 30°57′ | 88°38′ | 4672 | |
| 55578 | Rikaze | 29°15′ | 88°53′ | 3836 | |
| 55591 | Lasa | 29°04′ | 91°08′ | 3648.9 | Jun.–Oct. 1968 |
| 55598 | Zedang | 29°15′ | 91°46′ | 3551.7 | |
| 55664 | Dingri | 28°38′ | 87°05′ | 4300 | Nov. 1968–Jan. 1969 |
| Aug. 1969–Sep. 1970 | |||||
| 55680 | Jiangzi | 28°55′ | 89°36′ | 4040 | Jun. 1968 |
| 55696 | Longzi | 28°25′ | 92°28′ | 3860 | Jul.–Aug. 1969 |
| 55773 | Pali | 27°44′ | 89°05′ | 4300 | |
| 56004 | Tuotuohe | 34°13′ | 92°26′ | 4533.1 | |
| 56018 | Zaduo | 32°54′ | 95°18′ | 4066.4 | |
| 56021 | Qumalai | 34°08′ | 95°47′ | 4175 | Aug.–Dec. 1962 |
| 56029 | Yushu | 33°01′ | 97°01′ | 3681.2 | |
| 56033 | Maduo | 34°55′ | 98°13′ | 4272.3 | |
| 56034 | Qingshuihe | 33°48′ | 97°08′ | 4415.4 | |
| 56046 | Dari | 33°45′ | 99°39′ | 3967.5 | |
| 56065 | Henan | 34°44′ | 101°36′ | 3501 | |
| 56067 | Jiuzhi | 33°26′ | 101°29′ | 3628.5 | |
| 56079 | Ruoergai | 33°35′ | 102°58′ | 3439.6 | |
| 56083 | Shiqu | 32°59′ | 98°06′ | 4201 | |
| 56093 | Minxian | 34°26′ | 104°01′ | 2315 | |
| 56106 | Suoxian | 31°53′ | 93°47′ | 4022.8 | |
| 56116 | Dingqing | 31°25′ | 95°36′ | 3873.1 | Jun.–Aug. 1969 |
| 56125 | Nangqian | 32°12′ | 96°29′ | 3643.7 | |
| 56137 | Changdu | 31°09′ | 97°10′ | 3306 | Jun. 1969 |
| 56144 | Dege | 31°48′ | 98°35′ | 3199 | |
| 56146 | Ganzi | 31°37′ | 100°00′ | 3394 | |
| 56152 | Seda | 32°17′ | 100°20′ | 3896 | |
| 56167 | Daofu | 30°59′ | 101°07′ | 2957.2 | |
| 56172 | Maerkang | 31°54′ | 102°14′ | 2664.4 | |
| 56173 | Hongyuan | 32°48′ | 102°33′ | 3491.6 | |
| 56178 | Xiaojin | 31°00′ | 102°21′ | 2369.2 | |
| 56182 | Songpan | 32°39′ | 103°34′ | 2850.7 | |
| 56251 | Xinlong | 30°56′ | 100°19′ | 2999 | |
| 56257 | Litang | 30°00′ | 100°16′ | 3948.9 | Sep. 1967 |
| Jan.–Jul. 1968 | |||||
| May–Aug. 1969 | |||||
| Jan. 1970 | |||||
| 56357 | Daocheng | 29°03′ | 100°18′ | 3729 | May 1968 |
| 56374 | Kangding | 30°03′ | 101°58′ | 2615.7 | Apr. 1969 |
| 56459 | Muli | 27°56′ | 101°16′ | 2426.5 | |
| 56462 | Jiulong | 29°00′ | 101°30′ | 2994 | |
| 56565 | Yanyuan | 27°26′ | 101°31′ | 2545 | |
| 56651 | Lijiang | 26°52′ | 100°13′ | 2392.4 | |
| 56691 | Weining | 26°52′ | 104°17′ | 2237.5 |
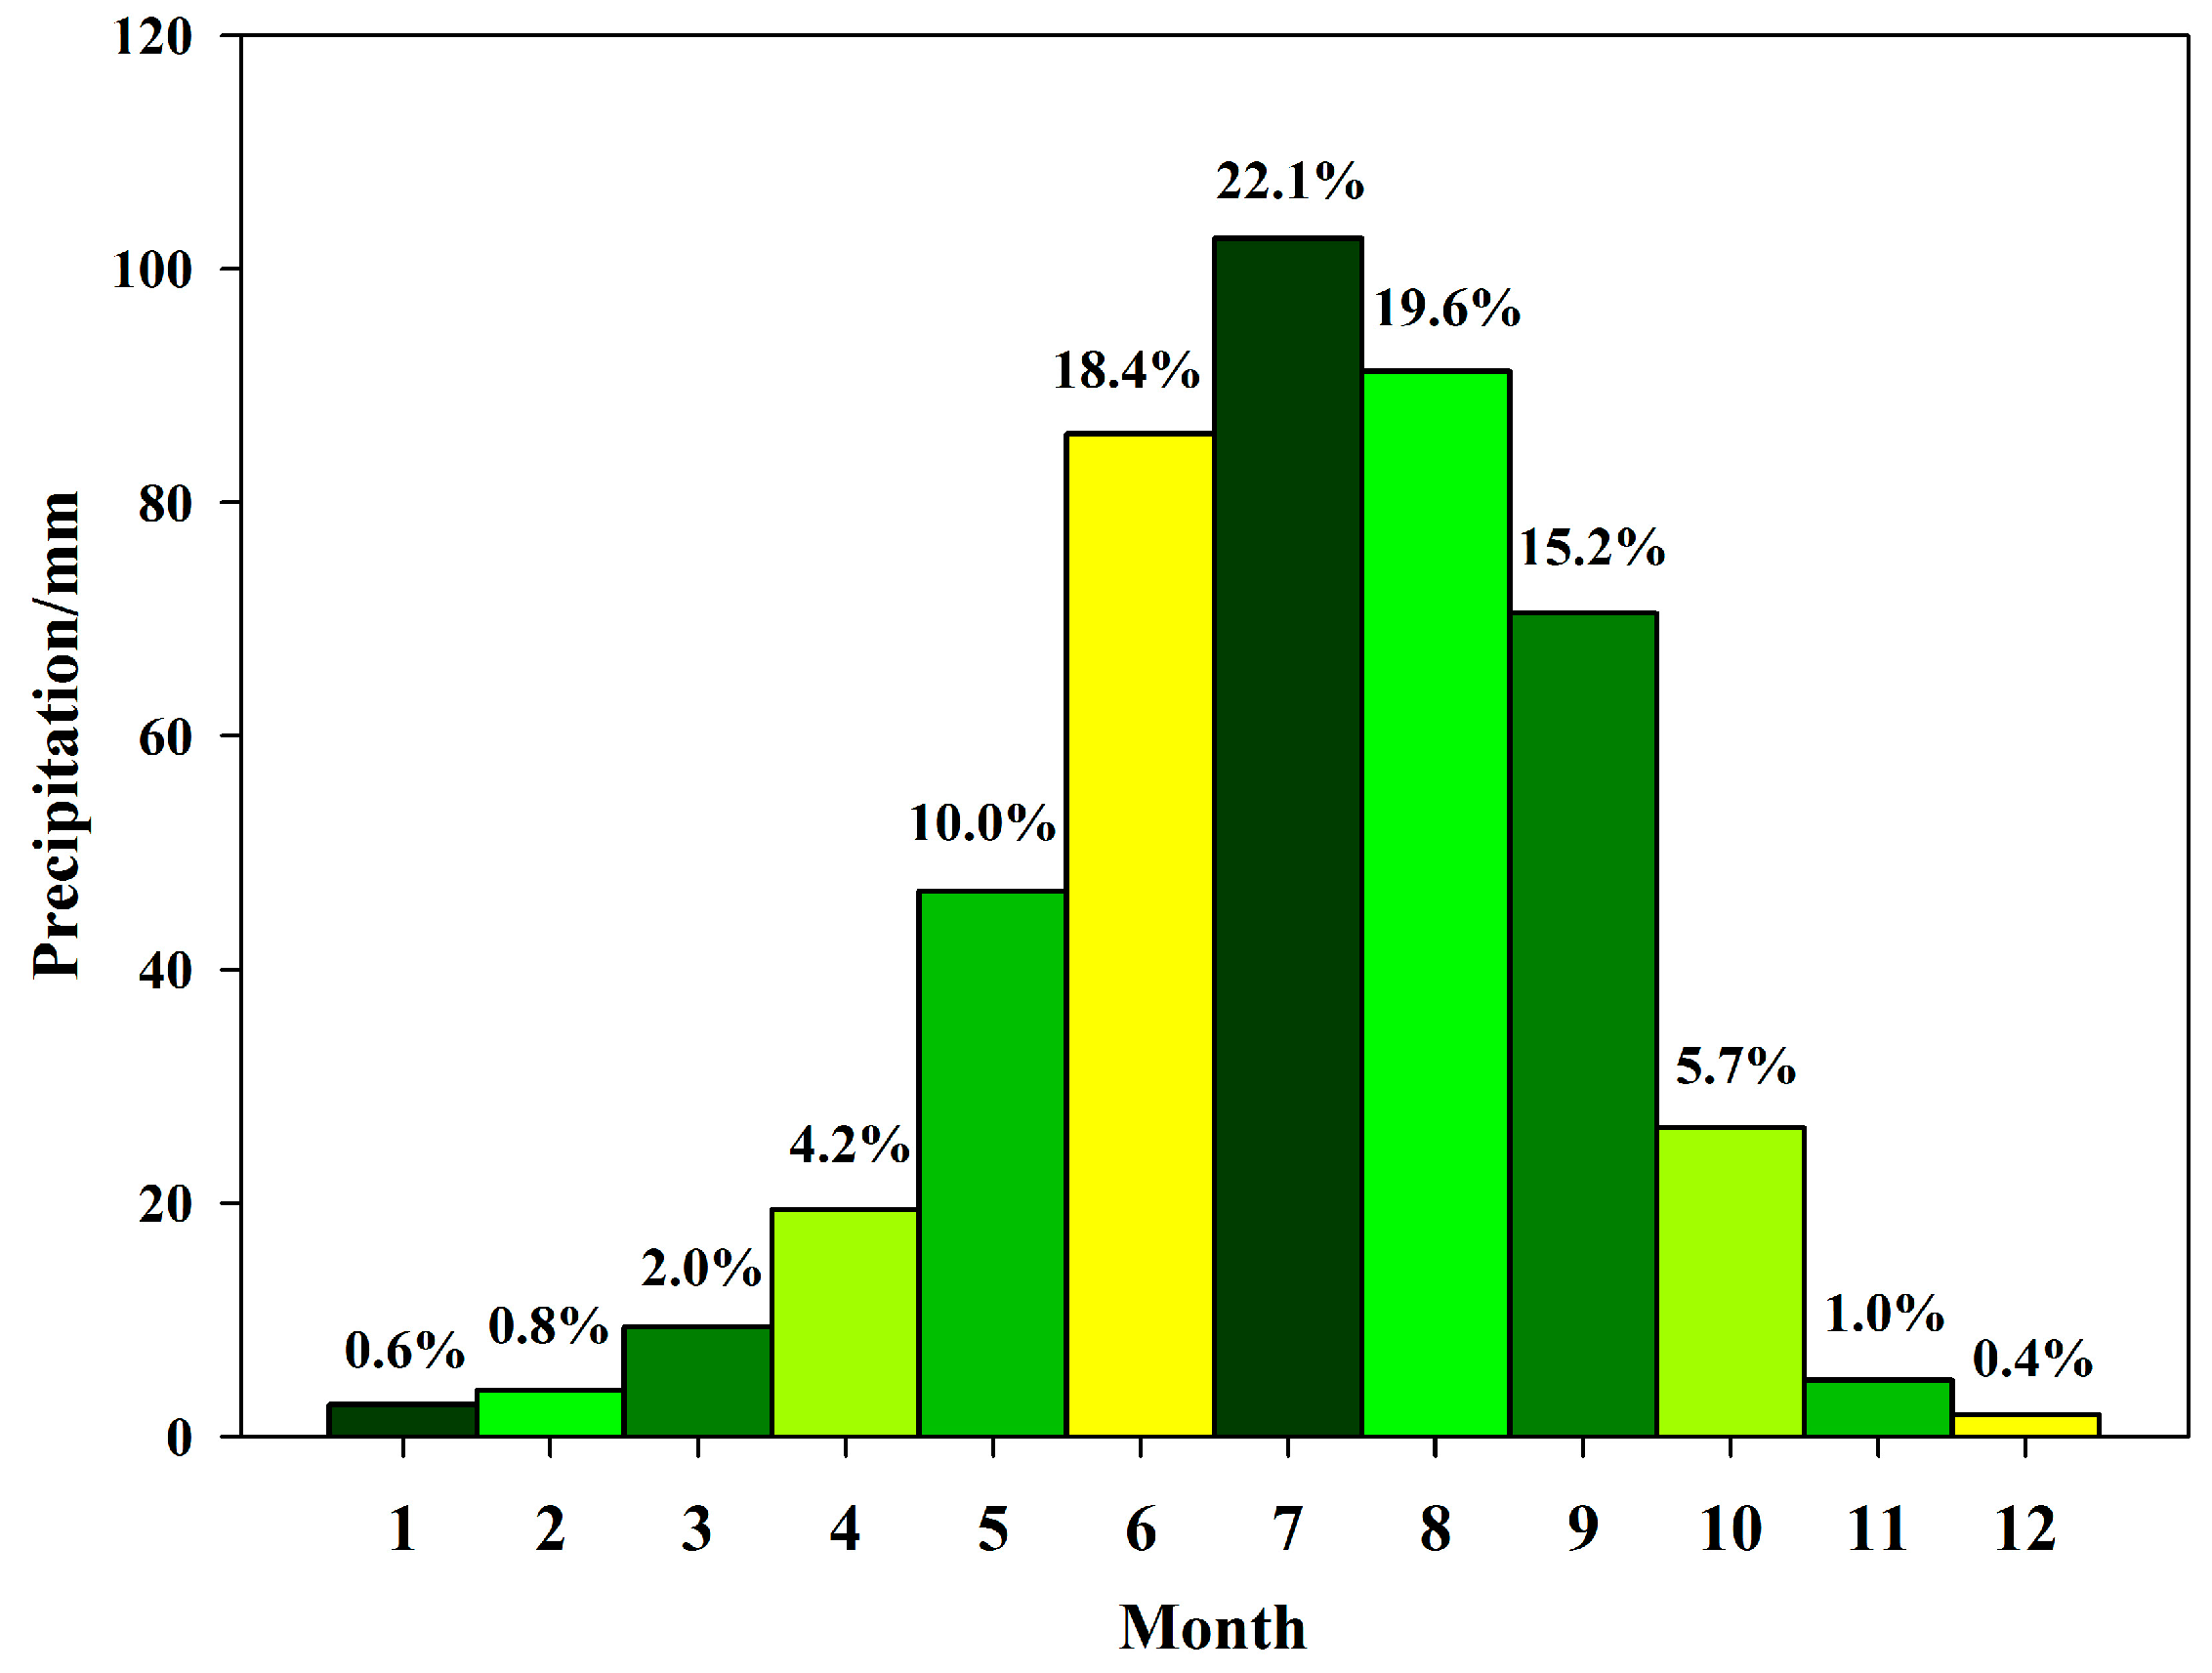
| Month | Precipitation (mm) | Ratio of Annual Precipitation (%) | Precipitation Trend (mm/10a) |
|---|---|---|---|
| Junuary | 2.7 | 0.6 | 0.18 |
| Feburary | 3.9 | 0.8 | 0.17 |
| Marrch | 9.4 | 2.0 | 0.59 * |
| April | 19.5 | 4.2 | 0.92 * |
| May | 46.7 | 10.0 | 1.64 * |
| June | 85.9 | 18.4 | 0.86 |
| July | 102.6 | 22.1 | 0.46 |
| August | 91.2 | 19.6 | −0.45 |
| September | 70.6 | 15.2 | −0.77 |
| October | 26.5 | 5.7 | 0.29 |
| November | 4.8 | 1.0 | 0.01 |
| December | 1.9 | 0.4 | 0.01 |
| Annual | 465.5 | 100 | 3.87 |
| Period | Annual (mm) | Spring (mm) | Summer (mm) | Autumn (mm) | Winter (mm) |
|---|---|---|---|---|---|
| 1961–1970 | 459.6 | 69.2 | 283.5 | 100.0 | 6.8 |
| 1971–1980 | 456.3 | 71.4 | 270.3 | 106.5 | 8.1 |
| 1981–1990 | 467.2 | 75.0 | 278.9 | 104.6 | 7.0 |
| 1991–2000 | 465.0 | 75.4 | 282.7 | 96.9 | 10.1 |
| 2001–2015 | 475.0 | 83.0 | 282.0 | 101.2 | 8.7 |
| 10 Stations with Largest Upward Trends | 10 Stations with Largest Downward Trends | ||
|---|---|---|---|
| Name | Precipitation Trend (mm/10a) | Name | Precipitation Trend (mm/10a) |
| Kangding | 28.48 * | Shiqu | −72.75 * |
| Zedang | 27.45 | Weining | −24.44 |
| Delingha | 22.20 * | Huajialing | −16.27 * |
| Dulan | 18.47 * | Muli | −15.76 * |
| Jiulong | 17.72 | Henan | −12.66 |
| Wudaoliang | 17.67 | Minxian | −8.50 |
| Litang | 16.56 * | Yanyuan | −6.50 |
| Yeniugou | 16.46 * | Ruoergai | −5.32 * |
| Xinlong | 16.15 | Jiuzhi | −5.08 * |
| Tuole | 16.14 | Rikaze | −4.82 |
© 2017 by the authors. Licensee MDPI, Basel, Switzerland. This article is an open access article distributed under the terms and conditions of the Creative Commons Attribution (CC BY) license (http://creativecommons.org/licenses/by/4.0/).
Share and Cite
Wan, G.; Yang, M.; Liu, Z.; Wang, X.; Liang, X. The Precipitation Variations in the Qinghai-Xizang (Tibetan) Plateau during 1961–2015. Atmosphere 2017, 8, 80. https://doi.org/10.3390/atmos8050080
Wan G, Yang M, Liu Z, Wang X, Liang X. The Precipitation Variations in the Qinghai-Xizang (Tibetan) Plateau during 1961–2015. Atmosphere. 2017; 8(5):80. https://doi.org/10.3390/atmos8050080
Chicago/Turabian StyleWan, Guoning, Meixue Yang, Zhaochen Liu, Xuejia Wang, and Xiaowen Liang. 2017. "The Precipitation Variations in the Qinghai-Xizang (Tibetan) Plateau during 1961–2015" Atmosphere 8, no. 5: 80. https://doi.org/10.3390/atmos8050080
APA StyleWan, G., Yang, M., Liu, Z., Wang, X., & Liang, X. (2017). The Precipitation Variations in the Qinghai-Xizang (Tibetan) Plateau during 1961–2015. Atmosphere, 8(5), 80. https://doi.org/10.3390/atmos8050080