
Intercomparison of MODIS and VIIRS Fire Products in Khanty-Mansiysk Russia: Implications for Characterizing Gas Flaring from Space


1
Department of Earth and Atmospheric Sciences, University of Nebraska-Lincoln, 1400 R St, Lincoln, NE 68588, USA
2
Chemical and Biochemical Engineering, and Center for Global and Regional Environmental Research, University of Iowa, Iowa City, IA 52242, USA
*
Author to whom correspondence should be addressed.
Atmosphere 2017, 8(6), 95; https://doi.org/10.3390/atmos8060095
Submission received: 24 February 2017
/
Revised: 15 May 2017
/
Accepted: 18 May 2017
/
Published: 23 May 2017
(This article belongs to the Special Issue Biomass Burning)
Abstract
:Gas flaring is commonly used by industrial plants for processing oil and natural gases in the atmosphere, and hence is an important anthropogenic source for various pollutants including CO2, CO, and aerosols. This study evaluates the feasibility of using satellite data to characterize gas flaring from space by focusing on the Khanty-Mansiysk Autonomous Okrug in Russia, a region that is well known for its dominant gas flaring activities. Multiple satellite-based thermal anomaly data products at night are intercompared and analyzed, including MODIS (Moderate Resolution Imaging Spectroradiometer) Terra level 2 Thermal Anomalies product (MOD14), MODIS Aqua level 2 Thermal Anomalies product (MYD14), VIIRS (Visible Infrared Imaging Radiometer Suite) Active Fires Applications Related Product (VAFP), and VIIRS level 2 Nightfire product (VNF). The analysis compares and contrasts the efficacy of these sensor products in detecting small, hot sources like flares on the ground in extremely cold environments such as Russia. We found that the VNF algorithm recently launched by the National Oceanic and Atmospheric Administration (NOAA) has the unprecedented accuracy and efficiency in characterizing gas flares in the region owing primarily to the use of Shortwave Infrared (SWIR) bands. Reconciliation of VNF’s differences and similarities with other nighttime fire products is also conducted, indicating that MOD14/MYD14 and VAFP data are only effective in detecting those gas flaring pixels that are among the hottest in the region; incorporation of shortwave infrared (1.6 µm) band used in VNF may improve the detection of relatively cooler gas flares. The gas flaring locations from the VNF product are validated using Google Earth images. It is shown that VNF’s estimates of the area of gas flaring agree well with the Google image counterparts with a linear correlation of 0.91, highlighting its potential use for routinely monitoring emissions of gas flaring from space.
1. Introduction
Gas flaring is a global environmental hazard severely impacting air quality, economy, climate, vegetation, and public health [1]. According to World Bank estimates, over 150 bcm (billion cubic meters) of natural gas is being flared or vented globally each year, which adds about 400 million tons of carbon dioxide to the atmosphere in addition to other harmful impacts [2]. Flaring is a high temperature oxidation process that burns combustible components. These combustible components mostly constitute hydrocarbons originating from the waste gases of industrial operations [3]. It is widely used to dispose of economically unprofitable waste gases emerging with oil, but flaring also acts as a safety device providing protection from the over-pressuring of vessels. A profuse amount of the world’s energy supply is continuously lost through gas flaring which contributes to the global carbon emission budget [4]. Apart from greenhouse gases like methane and carbon dioxide and pollutants like NO2, SO2 and CO, the flares contain widely recognized toxins such as benzene, benzopyrene, carbon disulphide (CS2), carbonyl sulphide (COS) along with harmful metals such as mercury, arsenic, and chromium. These emissions pose a great threat to human health, built-up environments, and the social well-being of the local communities’ inhabitants [5]. Therefore, it is essential to characterize gas flaring activity and its associated emissions, both spatially and temporally.
The objective of this paper is to evaluate the feasibility of using data from multiple satellite sensors to monitor gas flaring from space. In contrast to ground-based observations, satellite remote sensing provides significant spatial, and sometimes temporal, advantages because of the routine and global coverage by the satellite sensors. The earliest detections of gas flaring using satellite remote sensing data date back to the early 1970s when Croft [6] observed nighttime imagery (mainly over Africa) from a lowlight sensor (operating in spectral range of 0.4–1.1 µm) belonging to the United States Airforce DAPP (Data Acquisition and Processing Program) system and found gas flares to be the brightest feature observed in the visible band. The DAPP system is now called the Defense Meteorological Satellite Program (DMSP). He used the imagery from the sensor again in 1978, along with the Landsat Multi-spectral Scanner System, to observe gas flares in many parts of the world including Algeria, Libya, Nigeria, the Persian Gulf, Siberia, and Mexico [7]. He used visual identification and manual analysis procedures for the identification of flares from the images and reasserted that the gas flares associated with the world’s major oil fields were the brightest man-made feature observed from space. Further, Muirhead and Cracknell [8] used the daytime imagery from NOAA’s AVHRR (Advanced Very High Resolution Radiometer) to detect off-shore gas flaring sites in the North Sea. Their detections were based on the brightness values observed during the daytime in the infrared channel (3.55–3.93 µm) of AVHRR from the pixels containing gas flares. Much later, the DMSP’s Operational Linescan System (DMSP-OLS) products were used to produce maps of gas flares, fishing boats, fires and human settlements for 200 nations as part of the first study to globally detect gas flaring [9]. Further analyses of DMSP-OLS products by Elvidge et al. [10] provided the first record of long-term (1994–2005) gas flaring volumes, and through the intercomparison method, these flaring and emission estimate products were extended to 2008 [2]. Although these studies were able to characterize some gas flaring sites, their procedure relied on visual inspection of images, namely the circularity and bright centers of the flares, which was not time efficient. Also, the spatial resolution of the instruments (e.g., smoothed nominal spatial resolution of 2.7 km for DMSP-OLS) was usually not high enough to resolve the flare location accurately, particularly if the flares were situated in proximity of bright urban areas.
The first study to identify hot sources such as flares was done by Matson and Dozier [11] who were able to identify some gas flares from oil fields by using the hot source signal in the MidWave InfraRed, MWIR (~3.7 μm), and LongWave InfraRed, LWIR (~11 μm), spectrums from the nighttime AVHRR (onboard NOAA-6) imagery. They highlighted the capability of these bands for fire monitoring which formed the basis of many fire detection algorithms developed afterward such as MODIS, VIIRS, and AVHRR [12,13,14]. A limitation of the fire algorithms based on MWIR and LWIR bands is that the measured brightness temperature is dependent on the background temperature which means the total radiance observed by the satellite instrument is the result of both burning (subpixel fire) and non-burning fractions (background) of the ground pixel. This becomes a shortcoming for hotspot detection in cold areas such as Canada and Russia because the seasonal variation in the background surface temperatures is relatively large. Thus, the fixed threshold algorithm that is optimal for summer may only be able to detect large fires in winter [4]. Later, an active flare detection algorithm for global flare monitoring was developed by Casadio et al. [4] using ATSR (Along Track Scanning Radiometers) SWIR band imagery. The use of shortwave infrared (SWIR) bands overcomes the problem faced by the standard fire product algorithm for extremely hot sources like gas flares. Since the background contribution to SWIR during nighttime is negligible, the signal to noise ratio is high. They further revised their algorithm by integrating the use of ATSR and SAR (Synthetic Aperture Radar) nighttime products for North Sea flare detections [15]. This method offered significant improvement over previous manual detection methods, but the low spatial resolution of the ATSR instrument (1000 m) still posed a challenge toward the accuracy of flare detection.
More recently, Elvidge et al. [16] developed an algorithm for nighttime global fire activity monitoring using SWIR band (1.6 µm channel as the primary detection band) data from high resolution VIIRS nighttime imagery. The product also uses five more spectral bands in the near infrared, short-wave infrared, medium-wave infrared, and a panchromatic Day-Night band (DNB) for an additional quality check on detections, but the product does not discriminate active flares from other fire sources such as biomass burning and forest fires. While the principle for detecting fires (either biomass burning and gas flares) is the same, gas flaring often has a higher temperature, a smaller area, and a relatively large signal in the SWIR [16]. Anejionu et al. [17] also developed a flare detection method based on multispectral infrared band data from high spatial resolution Landsat imagery, but the detections were confined to Niger data only, and their method was handicapped by limitations such as low frequency of available cloud-free images and unavailability of nighttime Landsat data. Nevertheless, all these efforts have paved the way for more precise and automated detections of gas flares globally, so moving forward, a comprehensive study of these new active gas flaring products is essentially required.
Despite the availability of high resolution data from new generation satellite sensors, there have only been a limited number of studies specifically targeted to monitor gas flaring from space, and satellite-based fire or hotspot products are not well-validated for gas flare cases. Since a gas flare can be persistent for weeks, the location and characteristics of gas flares can be best retrieved at nighttime when SWIR from gas flares does not interfere with solar radiation. Therefore, a detailed analysis of the performance of nighttime fire products over gas flaring regions is necessary to reconcile for any significant differences in the detections by MODIS and VIIRS products with the newly developed VNF product over the test region. The study aims to explain the underlying differences between nocturnal fire detections from MOD14, MYD14, VAFP and VNF products. It is well known that factors (listed in Table 1) such as differences in sensor characteristics, spatial resolution, and along-scan aggregation schemes play an important role in resultant fire detection differences even when sensors have similar orbital characteristics, as in the case of VIIRS and Aqua. In extension to these factors, the study investigates how the choice of primary detection spectral bands affects the fire detections and looks into the validation of parameters reported by the VNF version 1.0 product.
The test region used for the study is Khanty-Mansiysk Autonomous Okrug in Russia. The choice of the region is based on the fact that Russia has lately emerged as the biggest flaring region in the world [10]. Russia is believed to be responsible for a quarter to a third of globally associated gas flaring. Data from NOAA shows Russia flares about 35 bcm of gas per year, and the related economic losses account for $5 billion per year [18]. The satellite-based estimate of gas flaring volumes reported from Khanty-Mansiysk alone account for more than 50% of total Russian flaring [10]. Moreover, the official and unofficial data on associated gas resources and utilization volumes is not accurate and does not reflect the actual extent of flaring. The discrepancies are because of a lack of adequate instrumentation and equipment to generate precise statistics on flaring volumes. According to the Govt. of Khanty-Mansiysk Autonomous District, only half of the flare units operating in the region were equipped with metering devices as of 2007, which worsens the problem for accurately estimating flaring volumes [19].
The large amount of gas flaring in Russia has a significant impact on climate. Russian gas flares annually produce almost 100 million tons of CO2 emissions, given the entire gas is flared efficiently. However, due to a large inefficiency in burning, much more harmful greenhouse gasses are emitted as well. The volume of soot emissions caused by the associated gas flaring is approximately 0.5 million tons/year. Moreover, the presence of abundant gas flares is hugely detrimental to public health, too. Elevated concentrations of nitrogen oxides, sulphur oxides, carbon monoxide, etc. are recorded near the flare vicinity and contribute to the increasing cases of lung and bronchi cancer and damage to the nervous system, liver, and eyesight in the communities affected by gas flaring [19]. Therefore, it is highly important to study the large gas flaring regions in Russia such as Khanty-Mansisyk, and satellite remote sensing offers significant benefits in that aspect.
2. Experimental Section
2.1. MODIS Thermal Anomalies and Fire Products (MOD14 and MYD14)
The MOD14 and MYD14 level 2 Thermal Anomalies and Fire Products are derived from the radiances observed in the MWIR and LWIR channels of MODIS instruments residing on NASA EOS-Terra and EOS-Aqua satellites, respectively. Both MODIS Aqua and MODIS Terra acquire data twice per day (once each in nighttime and daytime) about three hours apart from each other, and this data is used to produce level 2 swath data at 1 km resolution on a daily basis. The detection algorithm is based on the brightness temperature derived from MODIS 4 µm and 11 µm channels and has two steps to test if a pixel is a fire pixel [20]. The first test is the absolute test in which if the derived brightness temperature of the potential fire pixel is more than the predetermined threshold, that pixel is considered a fire pixel. The second test is the contextual test in which if a temperature of a potential fire pixel is larger than the background temperature by a certain threshold, that pixel is considered a fire pixel. Apart from providing the geolocation of the fire detected, the science datasets in the product provide information on fire mask, fire radiative power, and quality flags in the algorithm. Both of the products have attained Validation Stage 3 (uncertainties in the product are well quantified from comparison with reference to in situ or other suitable reference data) for which active fire reference data from ASTER and LANDSAT-TM have been used [21,22,23].
2.2. VIIRS Active Fire Product (VAFP)
The VIIRS AFARP (Active Fire Applications Related Product, [12]), called VAFP in the study, is the fire detection product derived from radiances obtained in MWIR and LWIR channels of the VIIRS instrument aboard SUOMI-NPP. The EOS MODIS Collection 4 Fire and Thermal Anomalies Algorithm form the basis of the algorithm for this product [12]. The tests used to identify fire containing pixels in VAFP are similar to the ones used in the MODIS fire detection algorithm. The primary channels used for the algorithms are the M13 (3.9–4.1 µm) and M15 (10.2–11.2 µm) bands. Although the spectral placement of these channels is a little different from MODIS, the basic algorithm is applicable to these channels. VIIRS has a similar overpass time as MODIS Aqua, but they differ in spatial resolution (VIIRS having higher spatial resolution than MODIS) and along scanline aggregation schemes [24]; these differences can result in the difference in fire detection between MODIS and VAFP products. The VAFP was released to the public with a provisional level of maturity on 16 October 2012. The provisional quality is described as the product may not have optimal quality, version control is still in effect, the general research community is encouraged to participate, incremental product improvements are still occurring, and it is ready for operational evaluation.
2.3. NOAA’s VIIRS NightFire Product (VNF)
The Nightfire product, VNF, developed by Elvidge [16] provides global, daily nocturnal fire monitoring data. The product operates on level 2 SDR (Sensor Data Record) data from the VIIRS sensor aboard Suomi-NPP. It uses radiances observed in the visible, near infrared (NIR), SWIR, MWIR, and DNB (Day Night Band) spectras, but it is primarily based on detections in the SWIR band (1.6 µm) that corresponds to the M10 band in VIIRS. As mentioned earlier, the SWIR bands prove advantageous for hot source detection during nighttime since highly radiant emissions from the hot sources recorded by them stand out in contrast to the sensor noise recorded otherwise. The product provides crucial parameters such as subpixel fire area, radiant heat, radiant heat intensity and fire temperature based on Planck curve fitting, along with the geolocation and other metadata such as radiance thresholds, quality flags, and cloud mask, etc.
2.4. Study Region and Time Period
The Khanty-Mansisyk region has a sub-arctic climate which means the winters are very long and cold and the summers are short with cool to mild temperatures. The warm season lasts from late May to early September, and the cold season lasts from late November to early March. The precipitation is fairly low (~0.21 inches/year) and is heavier in winter than in summer. Over the entire year, the most common forms of precipitation are light rain, light snow, and moderate snow. The cloud cover is more than 80% throughout the year [25]. The clearer part of the year begins around mid-April and the cloudier part of the year begins around late August and sustains through mid-April. Therefore, the summer months of April-August (having less cloud cover) are used for analysis in this study.
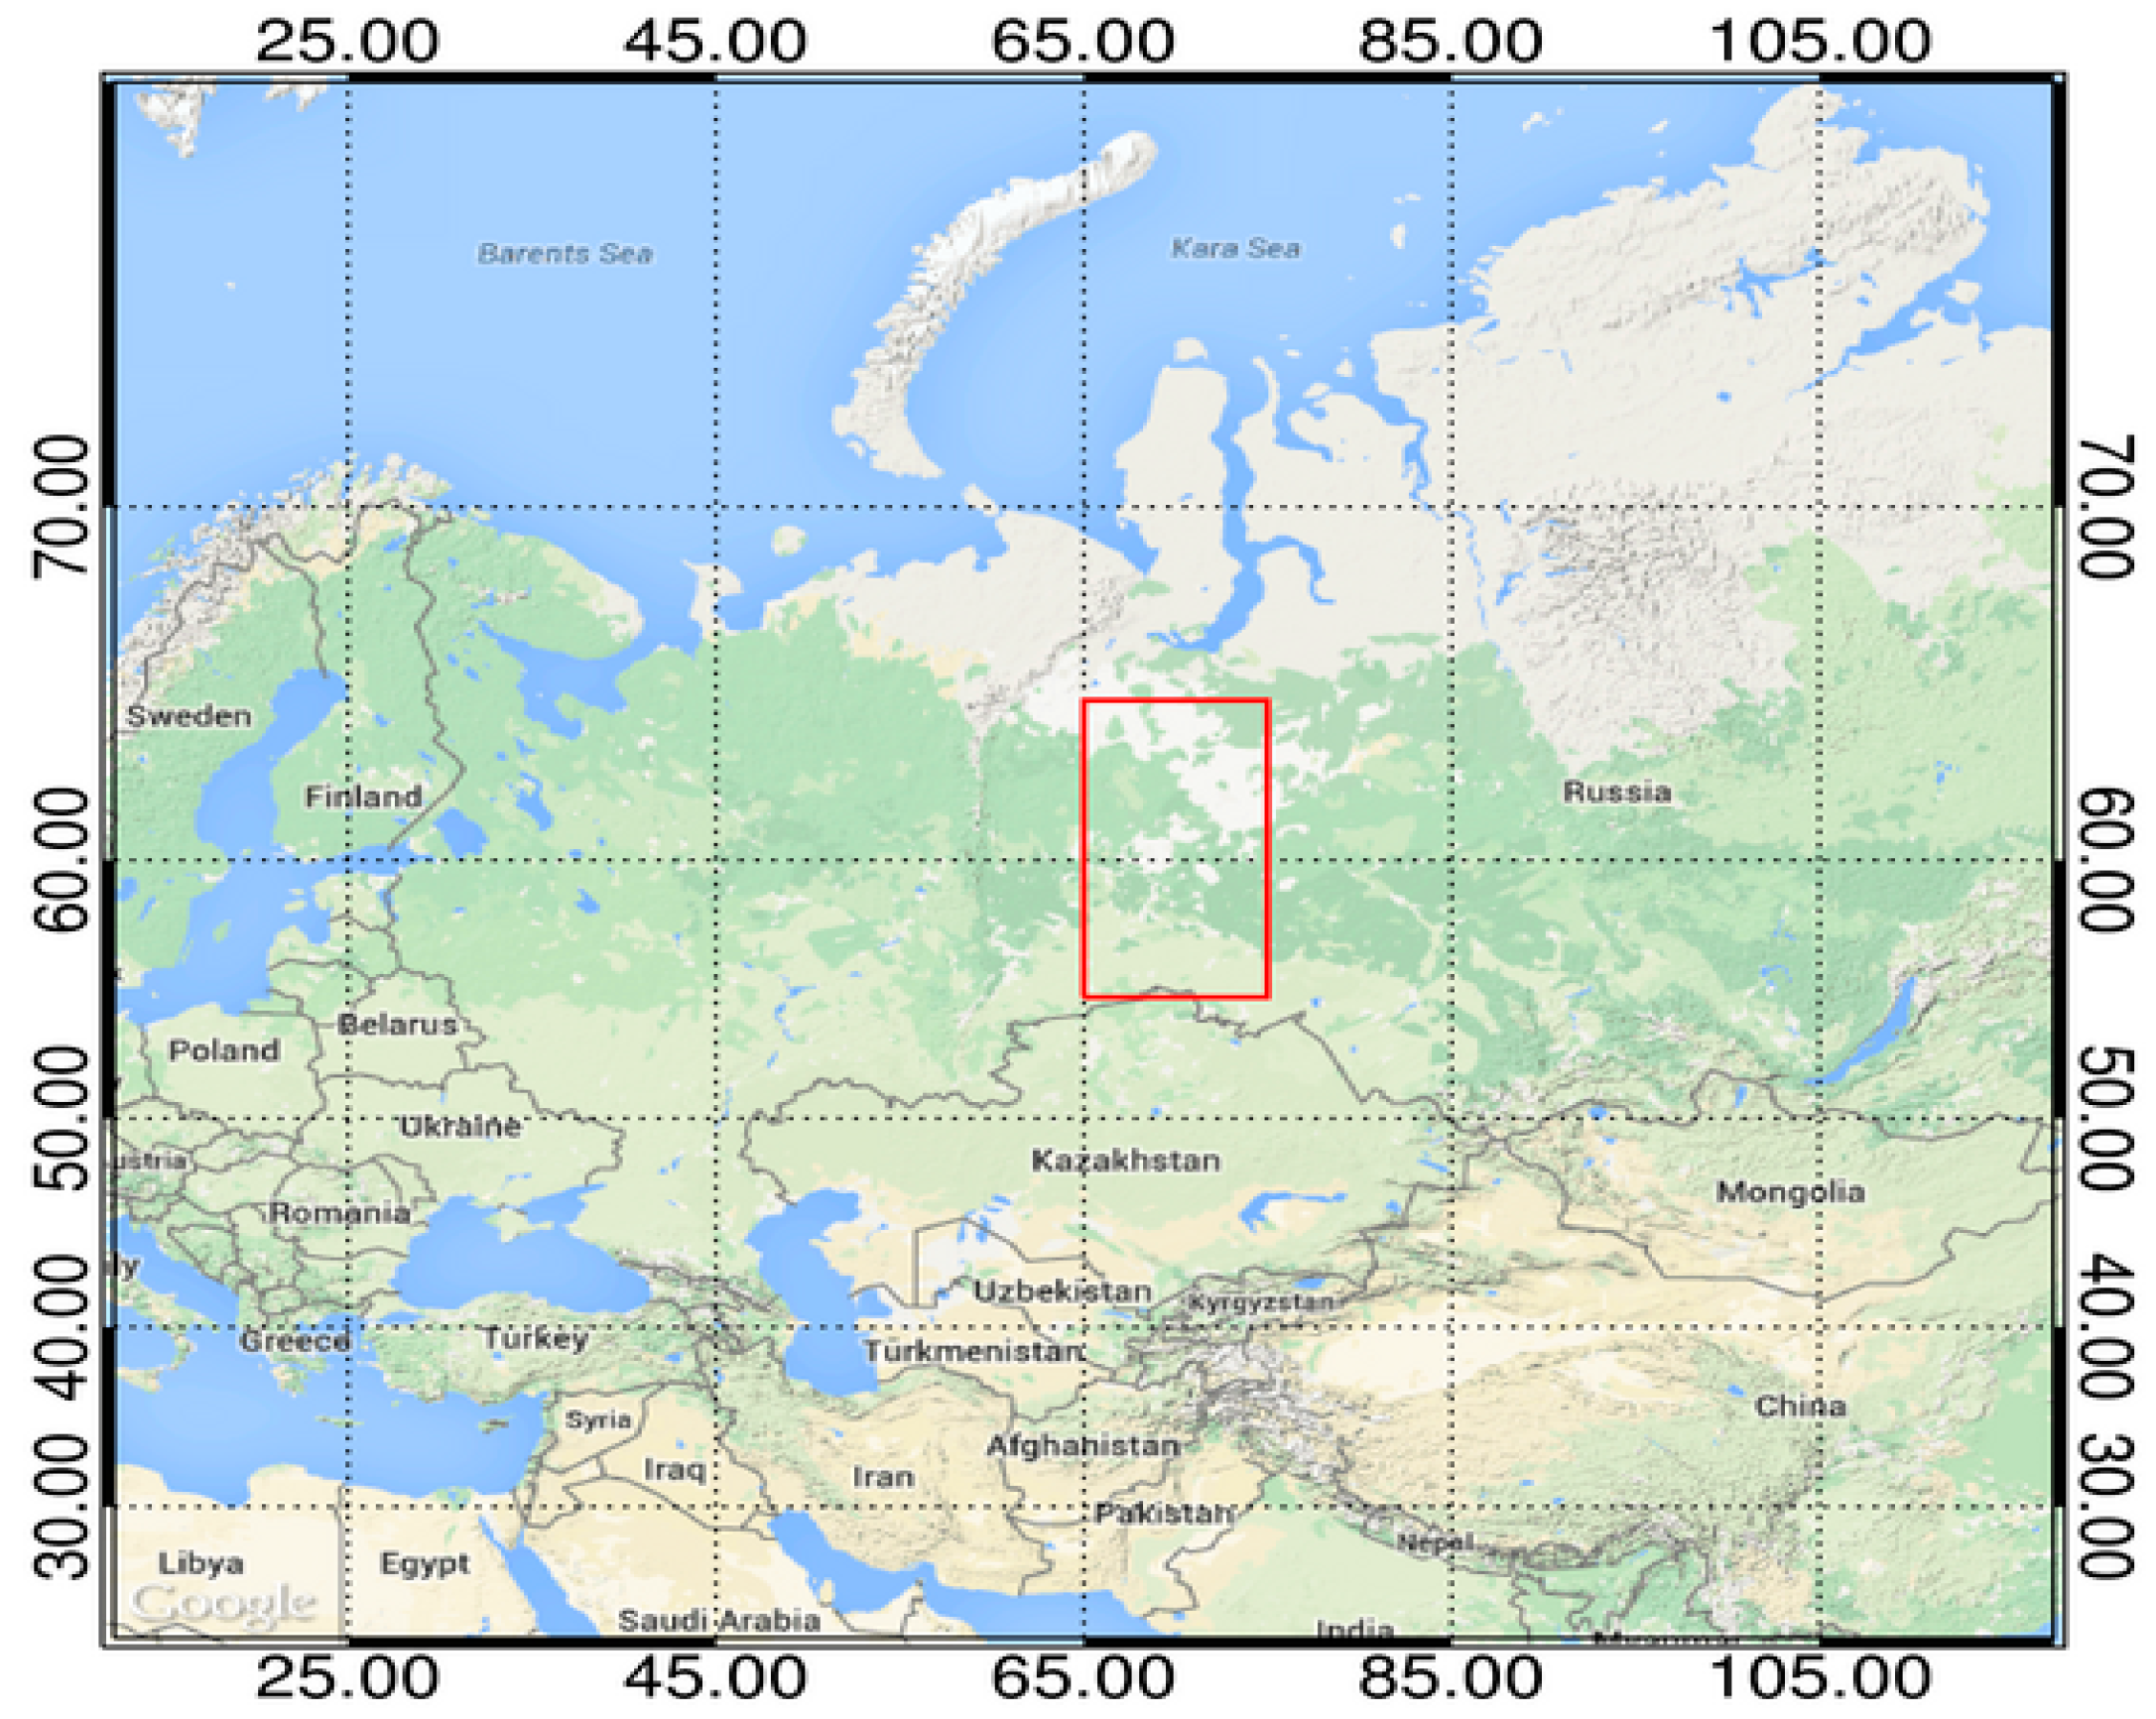
We used MOD14, MYD14, VAFP and VNF products over a 10° × 10° region (55° N–65° N, 65° W–75° W) that encloses our study area Khanty-Mansiysk Autonomous Okrug in Russia and also some neighboring states like Komi, Yamalia, and Tyumen Oblast. Nighttime data from all the products was acquired for five summer months of 2013. Figure 1 shows the map of the study region, and Figure 2 shows detections by the four different fire products during the period May–July 2013. It is notable that the number of hotspots detected during nighttime by the VNF product is much higher than the counterparts by MODIS and VIIRS official fire products. It is interesting to see that while VIIRS has a slightly wider swath and more frequent overpasses for the same high-latitude region, the official VIIRS and MODIS fire products do not show significant differences. Hence, most of the VNF detections are likely the abundant gas flares found in the region of Khanty-Mansiysk, Russia. These gas flares are not picked up by the MODIS and VIIRS fire products because they are primarily designed to detect wildfires that usually have a bigger surface area and burn at lower temperatures rather than small, bright hot sources like gas flares. VNF on the other hand consciously utilizes the shortwave bands to detect hot sources like flares even with small surface areas on the order of only a few m2. Since the gas flares are quite abundant in the region and the VNF product is able to detect them while other products fail to do so, the cumulative impact on the number of detections is much larger when we observe detections on a larger space for a couple of months. Nevertheless, we will analyze the reasons for the differences of these products in detail in Section 3.
3. Analysis of Algorithm Differences
As illustrated by Figure 2, there are conspicuously large differences between the detections done by the VNF product and the MODIS and VIIRS active fire products. Since the VNF product detects the most flaring activity because of its use of shortwave bands, it was used to demarcate the gas flaring regions that are also verified by visualization of oil refinery locations through GoogleEarth© maps (next section). The flaring regions were demarcated in order to quantify the number of detections by the different fire products within and outside of these regions to evaluate their performance. The entire study area was broken down into a collection of 0.25° × 0.25° grids. Persistence of detection within the grids and associated high temperature were used as the criteria for delineating the gas flaring regions. The hotspots detected by the VNF were collocated over the reference grid for each day, and a total of 153 days were used. Only the detections having a cloud mask as clear and temperatures higher than 1600 K (temperature criterion from Elvidge et al. [16] were used and marked as valid, and the rest of the detections were filtered. The total number of valid detections within each grid was recorded for each day. For each grid, a frequency counter was also set to count the number of days when clear-sky hotspot activity was observed in it. If one or more valid detections were found in a grid on a given day, a count was added to the counter of the grid. At the end, the grids having at least 15 days, roughly 10% of total days studied, of hotspot activity within them were highlighted as the most probable areas having flaring activity in them.
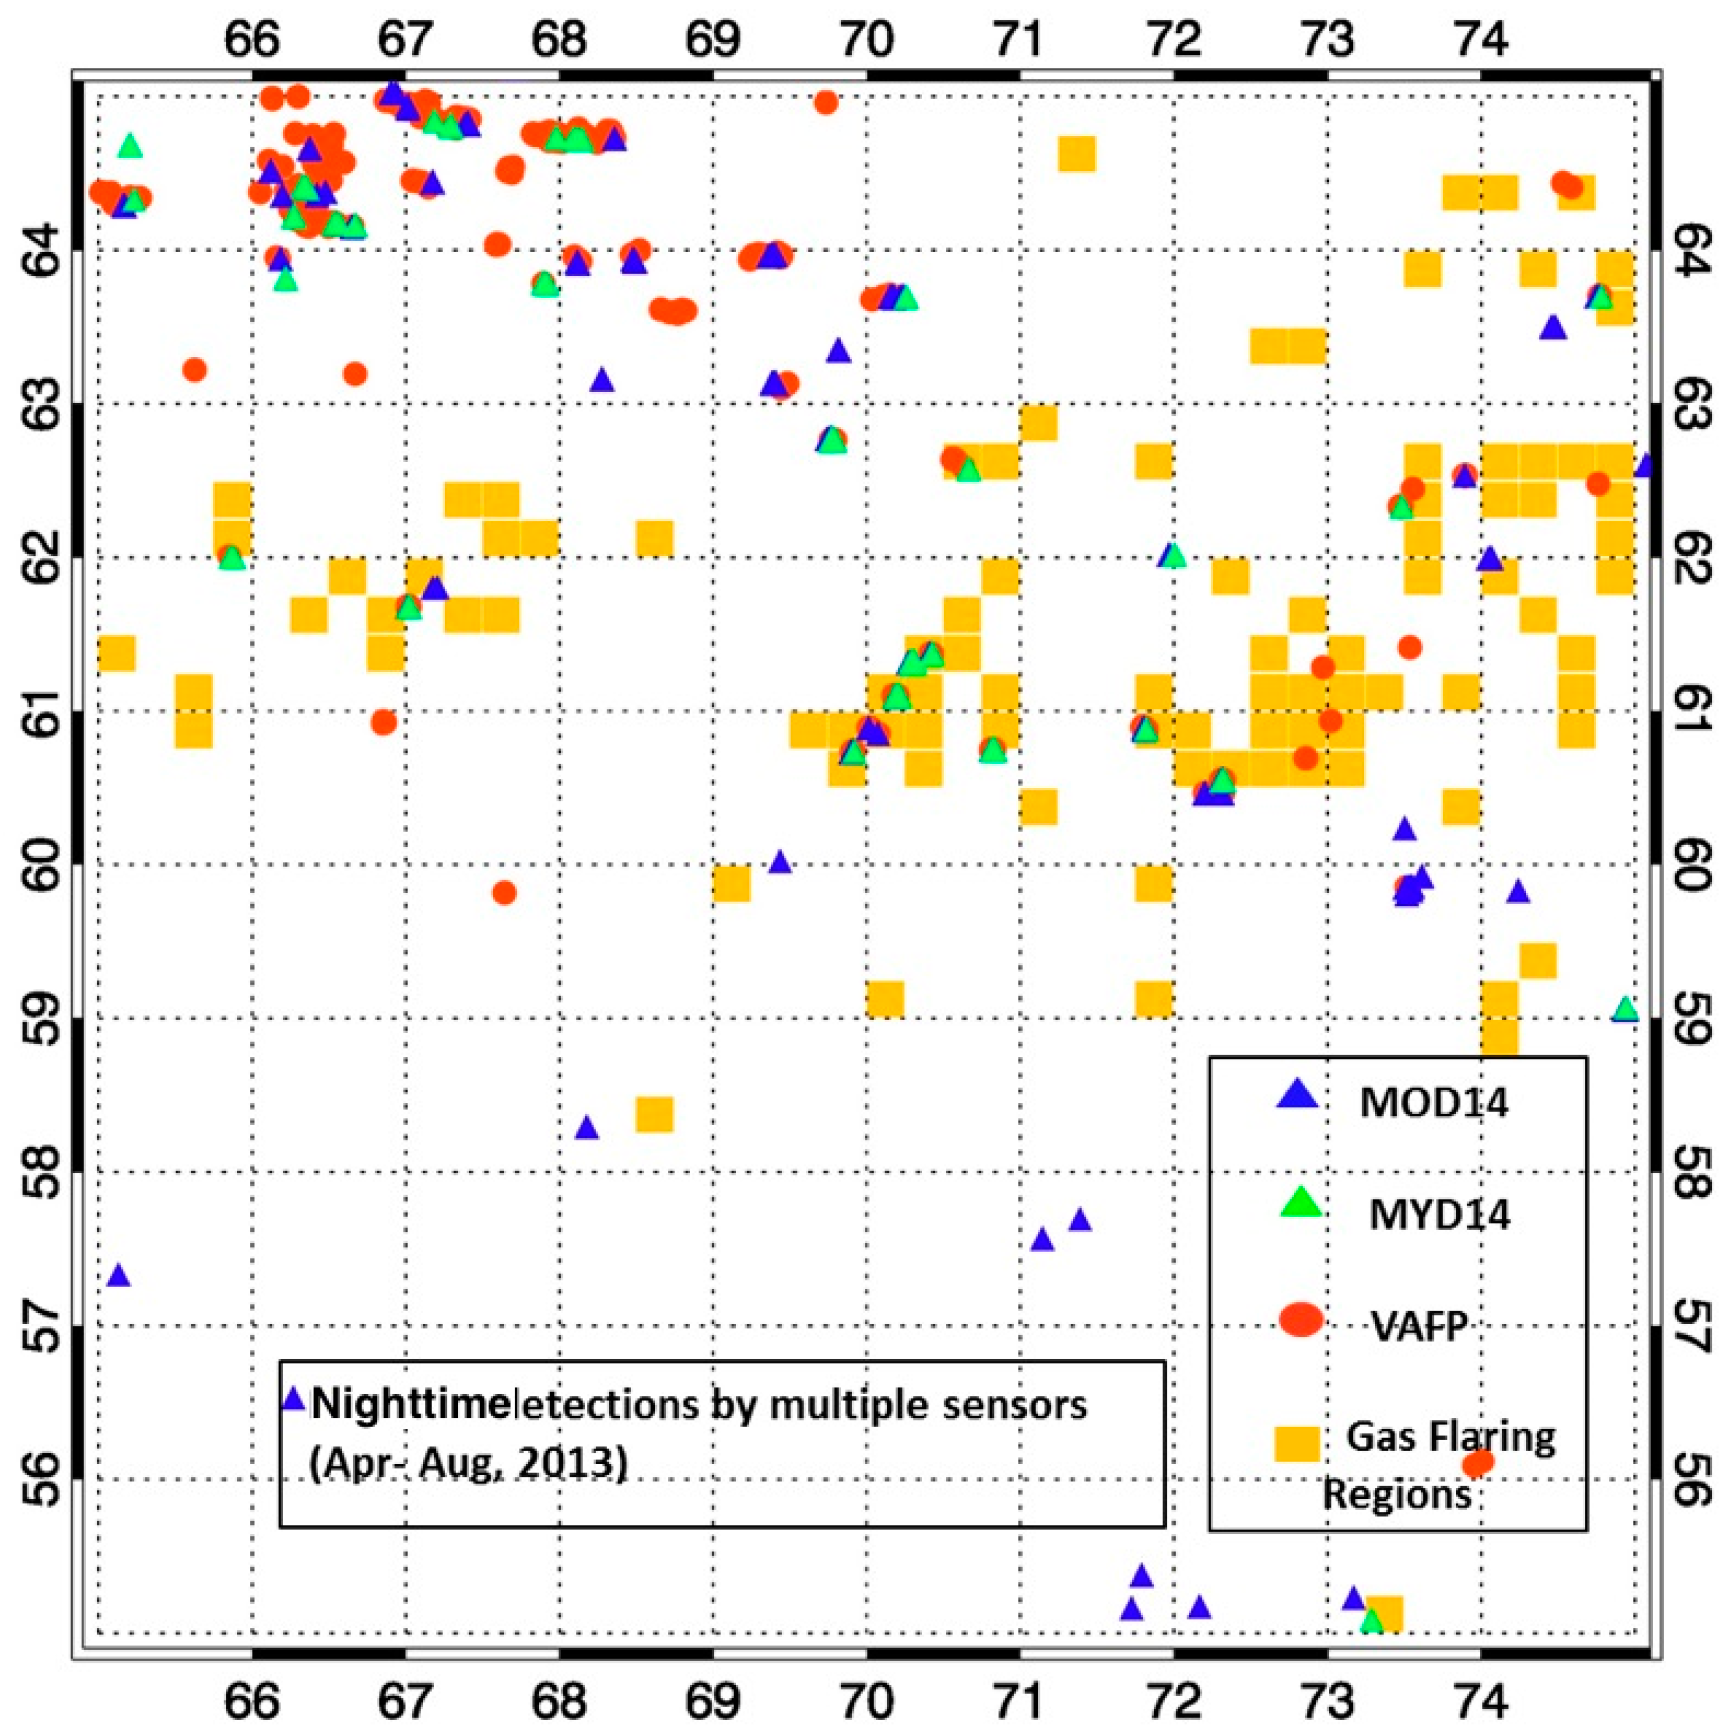
Following the procedure above, a total of 99 such grids were found, and 75 of those grids showed hotspot activity in them for at least 30 days. Figure 3 shows these areas as yellow boxes along with detections from MODIS Terra, MODIS Aqua, and VIIRS active fire products during the nighttime for five summer months of 2013.
Figure 3 describes how the detections from various fire products are aligned with the probable flaring areas. A quantitative analysis for these detections is tabulated in Table 2, displaying the total number of detections by these sensors on a monthly basis within and outside gas flaring regions. As expected and observed earlier in Figure 2, VNF showed the maximum number of hotspot counts over the entire region, much more than other nighttime products studied. VAFP (following VNF by a huge margin) was found to have a greater number of detections (about five times) than MODIS Terra and Aqua. In terms of alignment with the gas flaring areas, ~47% of nighttime detections from MODIS Terra were found within the gas flaring zones (grids showing persistent, high temperature fire activity), whereas ~67% and ~55% of nighttime detections by MODIS Aqua and VAFP, respectively, were found in the gas flaring zones. It is noted that all MODIS and VAFP do have quite a few consistent detections for numerous hotspots, especially over the upper left corner of the image. Presumably, those spots are fires or pixels that have multiple gas flares, but further study is needed to look into this.
Detection counts recorded in each grid from the VNF product were divided into two categories based on associated brightness temperatures, a) TB (0 < TB < 1600 K) and b) TB (TB ≥ 1600 K), to see how detections from both these temperature ranges aligned with the gas flaring regions, with the latter range representing hotter sources that are characteristic of flares. It also helps in characterizing the hot source type (gas flares, forest fires, biomass burning, etc.) found in the study area along with the spatial pattern of their occurrence. ~77% of the total number of valid detections by the VNF product over the entire study region belonged to category (b) (TB ≥ 1600 K) which indicates the dominance of the flaring activity in the area. About 52% of the detections belonging to category (a) and ~95% of the detections from category (b) were found in the gas flaring zones.
Since the fire activity estimated by the VNF product was astoundingly much more than other official fire products like VAFP, MOD14, and MYD14, we decided to look deeper into the VNF product to comprehend its functioning better and also to see how the differences could be better appreciated and reconciled. The next section therefore details the NOAA VNF algorithm, its comprehension and replication, and an approach to understand the underlying basis of the vast differences in the monitored fire activity.
4. Reconciliation between VIIRS and VNF
4.1. Reconciliation with Replication and Sensitivity Analysis of VNF Algorithm
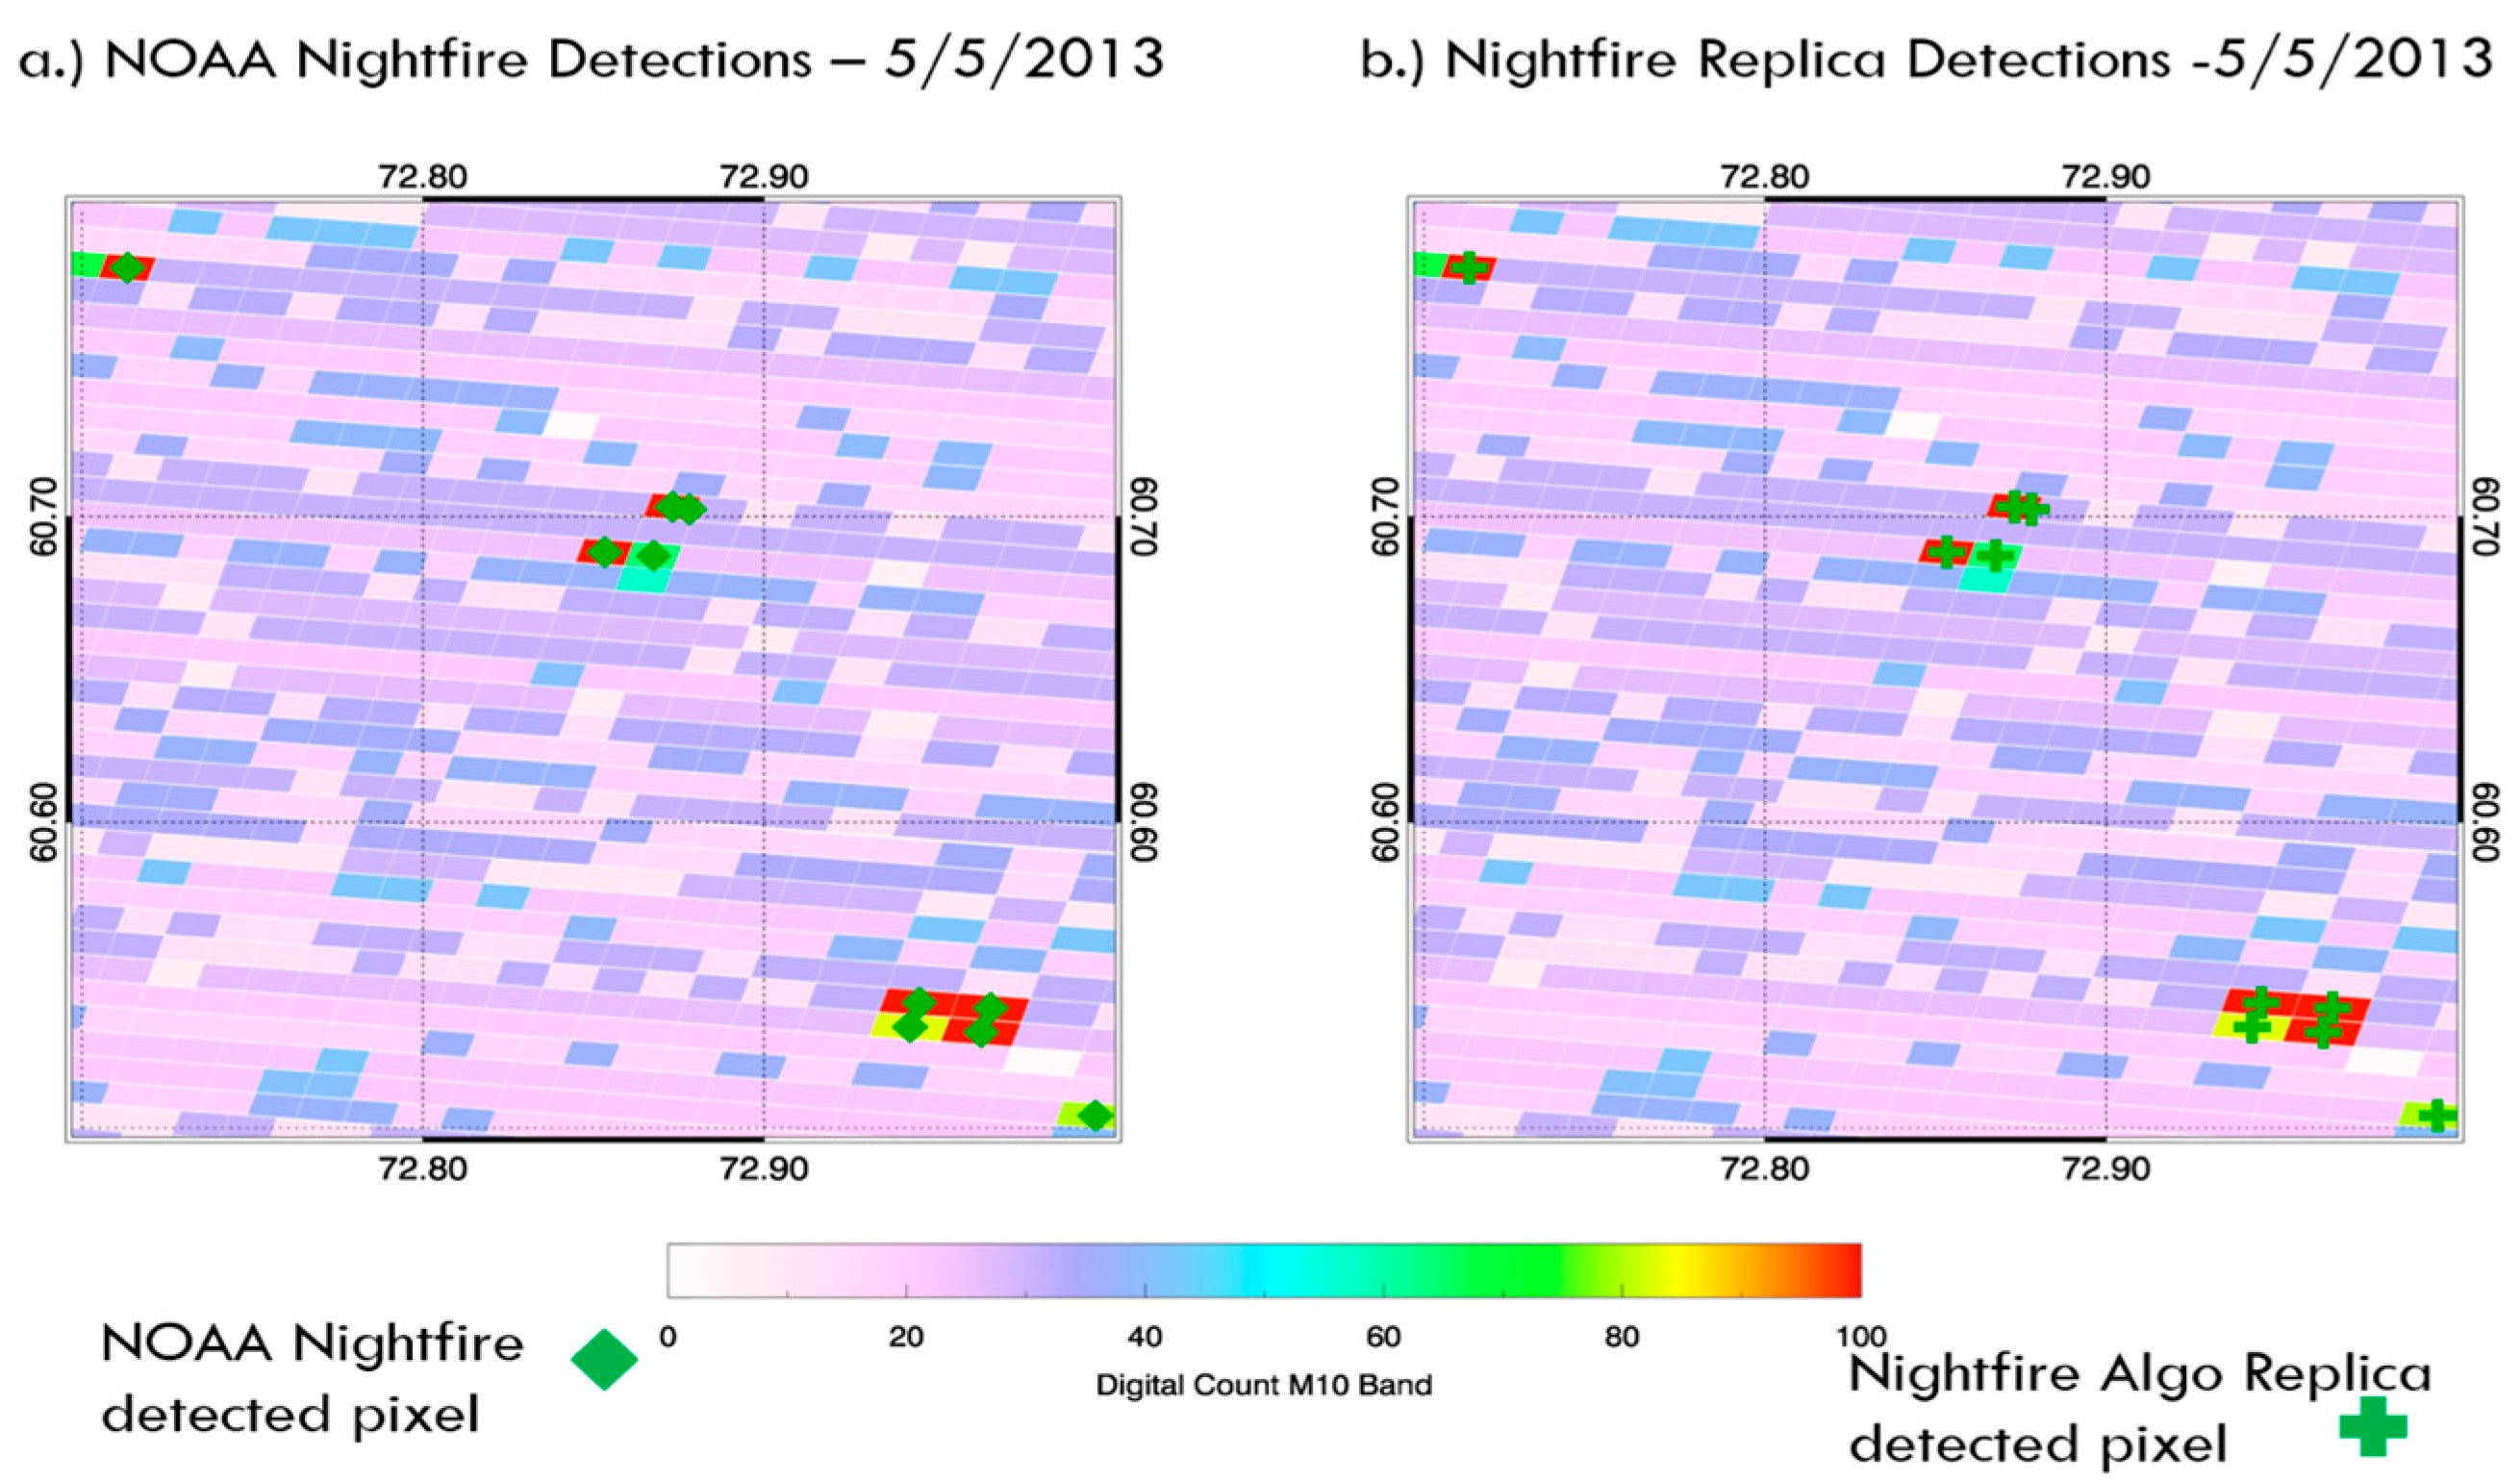
To understand the functioning of the VNF algorithm, we replicated the algorithm as described in the work by Elvidge et al. [16] and applied that to the same study region and time period of this study. The replication was confined only to the hotspot detection and threshold calculation part; we did not delve into the hot source area and temperature estimation part as performed by the authors using Planck curve fitting. The primary reason to perform the replication was to familiarize oneself more with the intricate details and working of a product which was much more efficient in detecting flares than others, but the process eventually revealed some discrepancies found in the product version 1.0. Detections in the five VIIRS bands of M10, M7, M8, M12, and M13 were performed using VIIRS level 2 data and compared to VNF. A small sub-region of the study area persistently showing hotspots was chosen, and level 2 data was collected for a random day (5 May 2013). Figure 4 shows that we are able to replicate the results of VNF. After replicating the VNF product with multispectral data and gaining insight into the way it worked, we probed further into how such vast differences in nighttime fire detection (mainly flares in this particular case) between this product and other official fire products could be reconciled.
VIIRS nocturnal fire detection is primarily based on MWIR bands, following suit from MODIS fire products [12,13]. The choice of primary spectral band by these products is one of the most important factors responsible for the remarkable difference in detections between VNF and other fire products. The peak radiation emitted from the typical fire surface (temperature ~1000 ± 200 K) lies mostly near the mid-wave infrared region of the electromagnetic spectrum, but the gas flares burn at very high temperatures (~1500 ± 200 K), and thus, their peak radiant emissions are at much shorter wavelengths (i.e., in short-wave IR). Therefore, using spectral bands operating in SWIR, such as VIIRS M10 (~1.6 μm), as the primary detection band in the VNF product provides an efficiency in globally detecting both inland and offshore gas flaring sites. Another advantage that SWIR bands provide is that the background contribution to nighttime radiance in them is quite low compared to the detector noise that is recorded by them [26]. Hence, pixels containing hot sources stand out in these bands due to their high radiance values and low contribution from background noise. Apart from the primary spectral band choice, another significant factor for different detections is how the products treat clouds. While MODIS and VIIRS discard the pixels contaminated by even partial cloud cover, the VNF product does not discard the pixels with cloud cover. While studying gas flares, the developers of the VNF product found that gas flares were consistently being misidentified as having cloud cover because of a spectral confusion, and pixels were being marked as partially or completely cloudy [16]. They used a cloud clearing algorithm to reset the cloud mask values for gas flares associated with hot pixels and identified them as potential flare.
Other than these known factors, we performed some case studies using days where both Nightfire and VAFP detected some fire activity in the study region to see if the VNF detections could be made to match VAFP detections as an aid to determine crucial factors that lead to sizeable differences. We used the VNF replica that we developed to meet our purpose.
Case 1: 4 July 2013; Area (latitude: 60°–61.5°, longitude: 70.5°–72°). Only two counts of fires were reported by the VAFP in the small target region, but the M10 VNF replica gave 13 counts of hotspots in the same region (Figure 5c,d). We increased the threshold to five times the calculated value (in digital counts (DC)) for the M10 band in the VNF replica, and the number of hotspots detected with this new higher threshold was reduced to seven. These seven hotspots still contained the two hotspots seen by VAFP. Upon stepping up the threshold further to now ten times the original M10 threshold in DC, only four detections from the VNF replica were observed, again identifying the two hotspots seen by VAFP (Figure 5e,f). When the threshold was raised 30 times, the exact spots were matched by the two products. It was concluded from this particular case study that the detections from the two products could be matched by increasing the threshold manifolds and that VAFP detected hotspots that had really high DC values in the M10 band. One of the hotspots detected by VAFP and the VNF replica vaguely shows an industrial settlement when looked at with zoomed in Google imagery (Figure 5b), and there is a good probability of it being a flow station for gas flares. Further zoom was unavailable to confirm this theory, and the other spot could not be verified because of the same zoom limitations. It also showed that really hot gas flares can be picked up by VAFP as well, even though it is primarily designed for detecting bigger fire activities like forest fires and biomass burning.
Case 2: 2 August 2013; Area (latitude: 60.5°–61.5°, longitude: 70°–71°). Five counts of fire were detected by the VAFP on the given date during nighttime in the small target region, whereas the M10 VNF replica detected 20 hotspot (includes all the ones seen by VAFP) counts in the same region (Figure 6c,d). When the computed VNF replica M10 threshold (in DC) was increased to five times its value, the new replica hotspot count dropped to 15. These new counts still included the four spots highlighted by VAFP. When the threshold was further increased to 20 times, the replica gave ten detections, again having the four spots detected by VAFP. 60 times the threshold gave six detections, still including the four locations by VAFP, seen in Figure 6e,f. The two extra locations that the replica saw had high DC values but were not picked up by VIIRS possibly due to cloud cover which is not discarded by VNF. At an even higher threshold of 70 times, three of the fires originally picked by VAFP were still picked up by the replica, corroborating the fact that VAFP is detecting fires that have very high DC values or are incredibly bright. One of the pixels picked at all thresholds by the replica and seen by VIIRS was clearly showing gas flare flow stations when observed through zoomed in Google imagery (see Figure 6b).
4.2. Reconciliation through Theoretical Interpretation
After observing that the VAFP product could also detect some big high temperature flares along with VNF, we looked into the simulated radiances of the primary detection channels of these two products for varying cases of high temperatures and subpixel fire areas. Since the detections by VAFP are mainly based on the 4 µm channel and the VNF is based on SWIR bands, principally 1.6 µm, we did a simulation of radiance values in 4 µm and 1.6 µm channels and analyzed how the TOA (Top-Of-Atmosphere) radiance seen by the sensor in these channels varies as the size or hotness of the fire changes. The TOA radiance, I, is represented as:
where Af is the sub-pixel fire fraction, Ib is the spectral radiance contributed by the background pixels (computed by Planck function), and If represents the spectral radiance contributed by the flaming part of the pixel at the given wavelength. Tb and Tf represent surface kinetic temperatures of background and fire, respectively [27,28].
I = (1 − Af) Ib(λ,Tb) + (Af) If(λ,Tf)
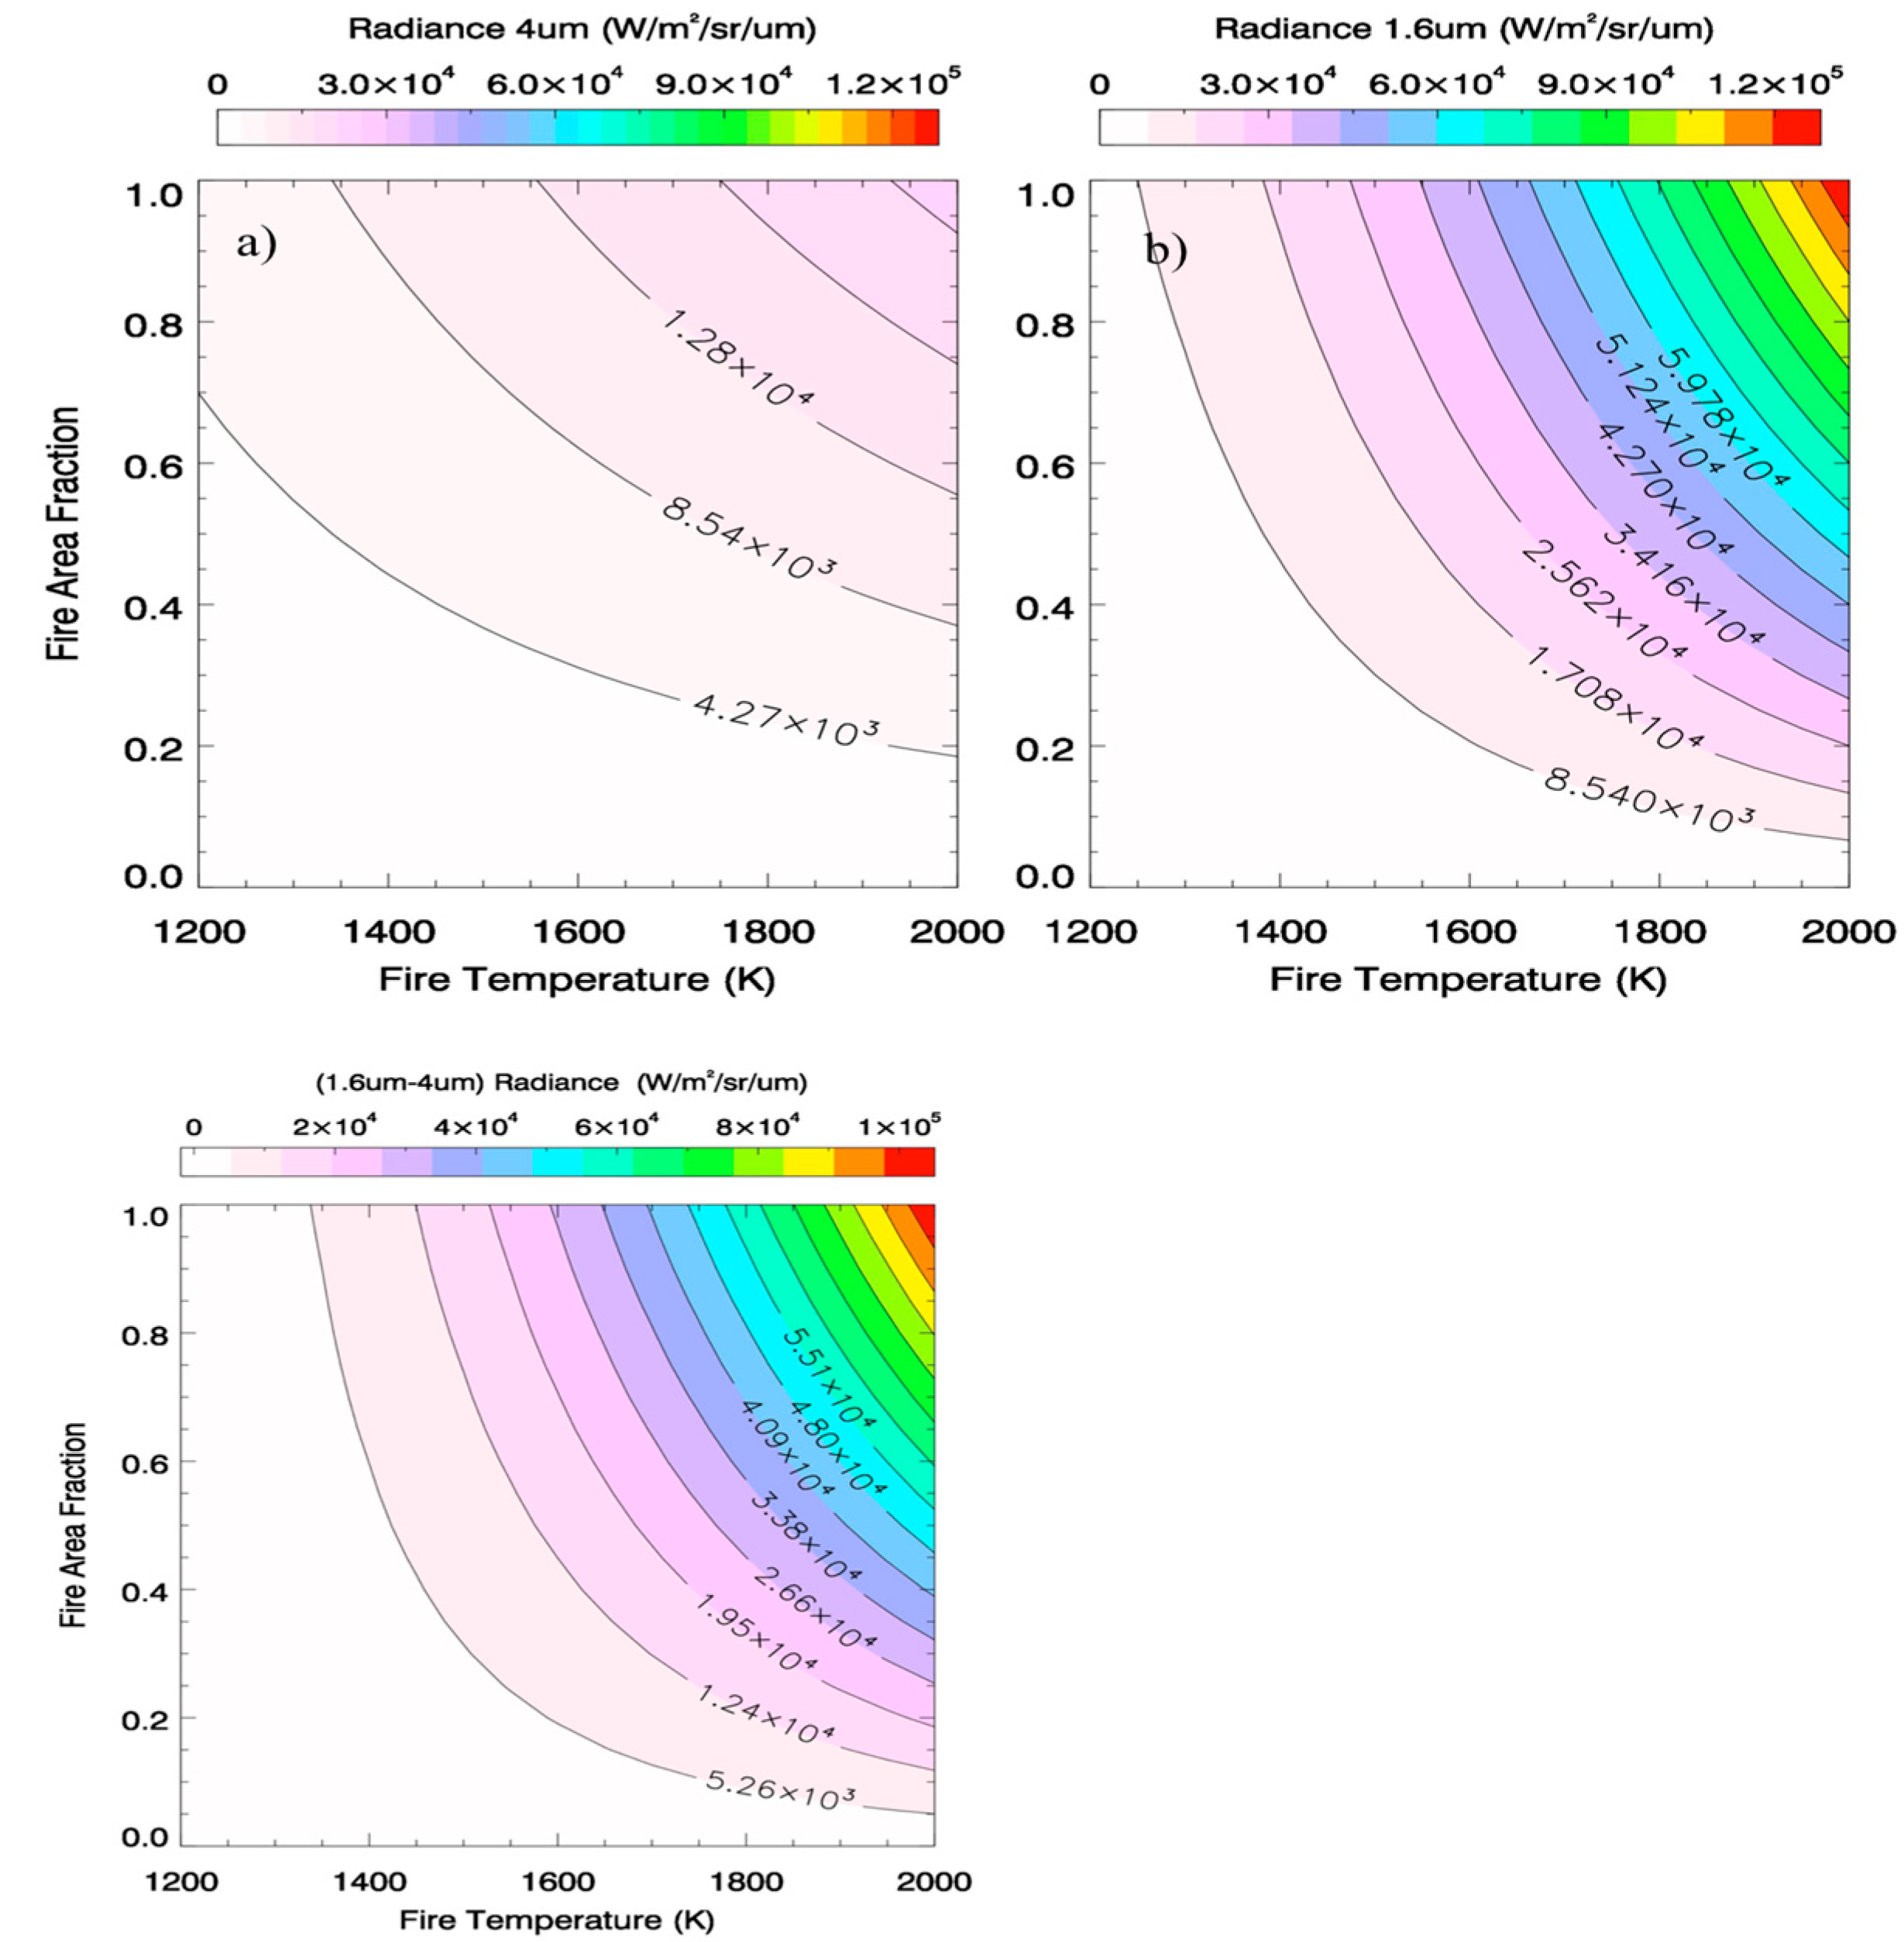
The background temperature was considered uniformly as 300 K for all simulations to represent the average surface temperature during summer in West-Siberian, Russia (where the target region is located). Both the flaming part of the pixel and background were considered as blackbodies, and the atmospheric effects were neglected so that computed radiances could represent TOA radiance values [28,29]. Figure 7a,b, respectively, show the contour plot for these simulations for the 1.6 µm channel and 4 µm channel. The subpixel fire fractions are varied from 0–100%, and the temperatures are simulated for the range 1400–2000 K to represent hot sources such as flares. Figure 7 shows that the simulated 1.6 µm radiances increase as flare temperature and subpixel area increases and are much higher than the 4 µm radiances, especially for bigger flares at higher temperatures. The result helps in substantiating the sensitivity of SWIR bands to extremely hot sources. It is also notable that the 4 µm radiances also increase for high temperature flares with bigger areas, which could possibly explain why some big flares were detected by the MWIR based VAFP as well. The contour plot of the differences between the 1.6 and 4 µm radiances is also shown in Figure 7c. For the most part, the difference between the radiances is positive and quite high (on the order of 10 MW/m2/sr/µm) but for some lower temperature flares with low subpixel area (e.g., white areas in Figure 7c), the 4 µm radiances were higher than their 1.6 µm counterparts, which is expected since the peak radiation tends to shift to higher frequency ranges for sources with cooler temperatures. Hence, for gas flares with small areas, only those with very high temperature can be detected by MWIR; however, use of SWIR appears to be efficient in detecting gas flaring for a wide range of temperatures because the background of SWIR is extremely low when compared to the background of MWIR.
5. Evaluation of the Night-Fire Product for Characterizing Gas Flaring
Since the VNF product is proved to be more effective than other active fire products in detecting gas flares by a considerable margin, we analyzed the collected data (April–August 2013) for further evaluation and validation. We chose ten foreknown gas flaring locations from Google imagery within the test region boundaries and studied the efficacy of detecting these flares by the product. All the sites were detected many times by the product within the footprint of VIIRS level 2 imagery pixels. The detections where the distance between the pixel center and the flare location exceeded 3 kilometers were discarded and deemed as invalid. Many attributes such as fire area, fire temperature, viewing geometry, radiant heat, radiances in multiple bands, and distance from actual flare location associated with valid detections (distance < 3 km) were stored in a database for further evaluation. The database was created for all ten different gas flaring sites. Figure 8a shows one such site (Google Image) in Khanty-Mansiysk, Russia, and Figure 8b shows the days of valid detections by the VNF product within the study period along with fire area, fire temperature and distance from the flare.
Table 3 shows the locations of the predetermined flare sites, the number of times VNF successfully detected them over a period of five months, along with the mean area, temperature and distance of detection (the Euclidean distance between the flare site and the center of the nearby pixel showing a hotspot). It can be noted here that for almost all the sites, the associated mean temperatures reported by VNF are very high (1600–2000 K). These high mean temperatures corroborate this product’s potential of detecting flares burning at extremely hot temperatures with consistency over a long period. The histogram analysis (Figure 9) of temperatures reported for valid detections for all flaring locations under study also exhibits that high temperatures are most frequently associated with these detections.
Another particular feature is the observation of the view zenith angle, VZA (the angle between local zenith and the line of sight of the satellite) associated with valid flare detections (Figure 10). A histogram of VZA shows that most of the detections are made between 0° and 5°, which means that these flares are detected when the satellite overpasses are either directly overhead of the flares or near local nadir. A plausible reason for this observation is that the small size of the flares (the flare area as reported by the VNF product is usually <50 m2 compared to the VIIRS level 2 data pixel size of 750 × 750 m at nadir) makes them hard to detect when seen over a large angle by the satellite instrument. Since flares are mostly found over flare stacks (columns constructed for safety purposes) and are not spread out on the ground like biomass burning or forest fires, the fire area reported is generally confined to the area around the periphery of the flare stacks.
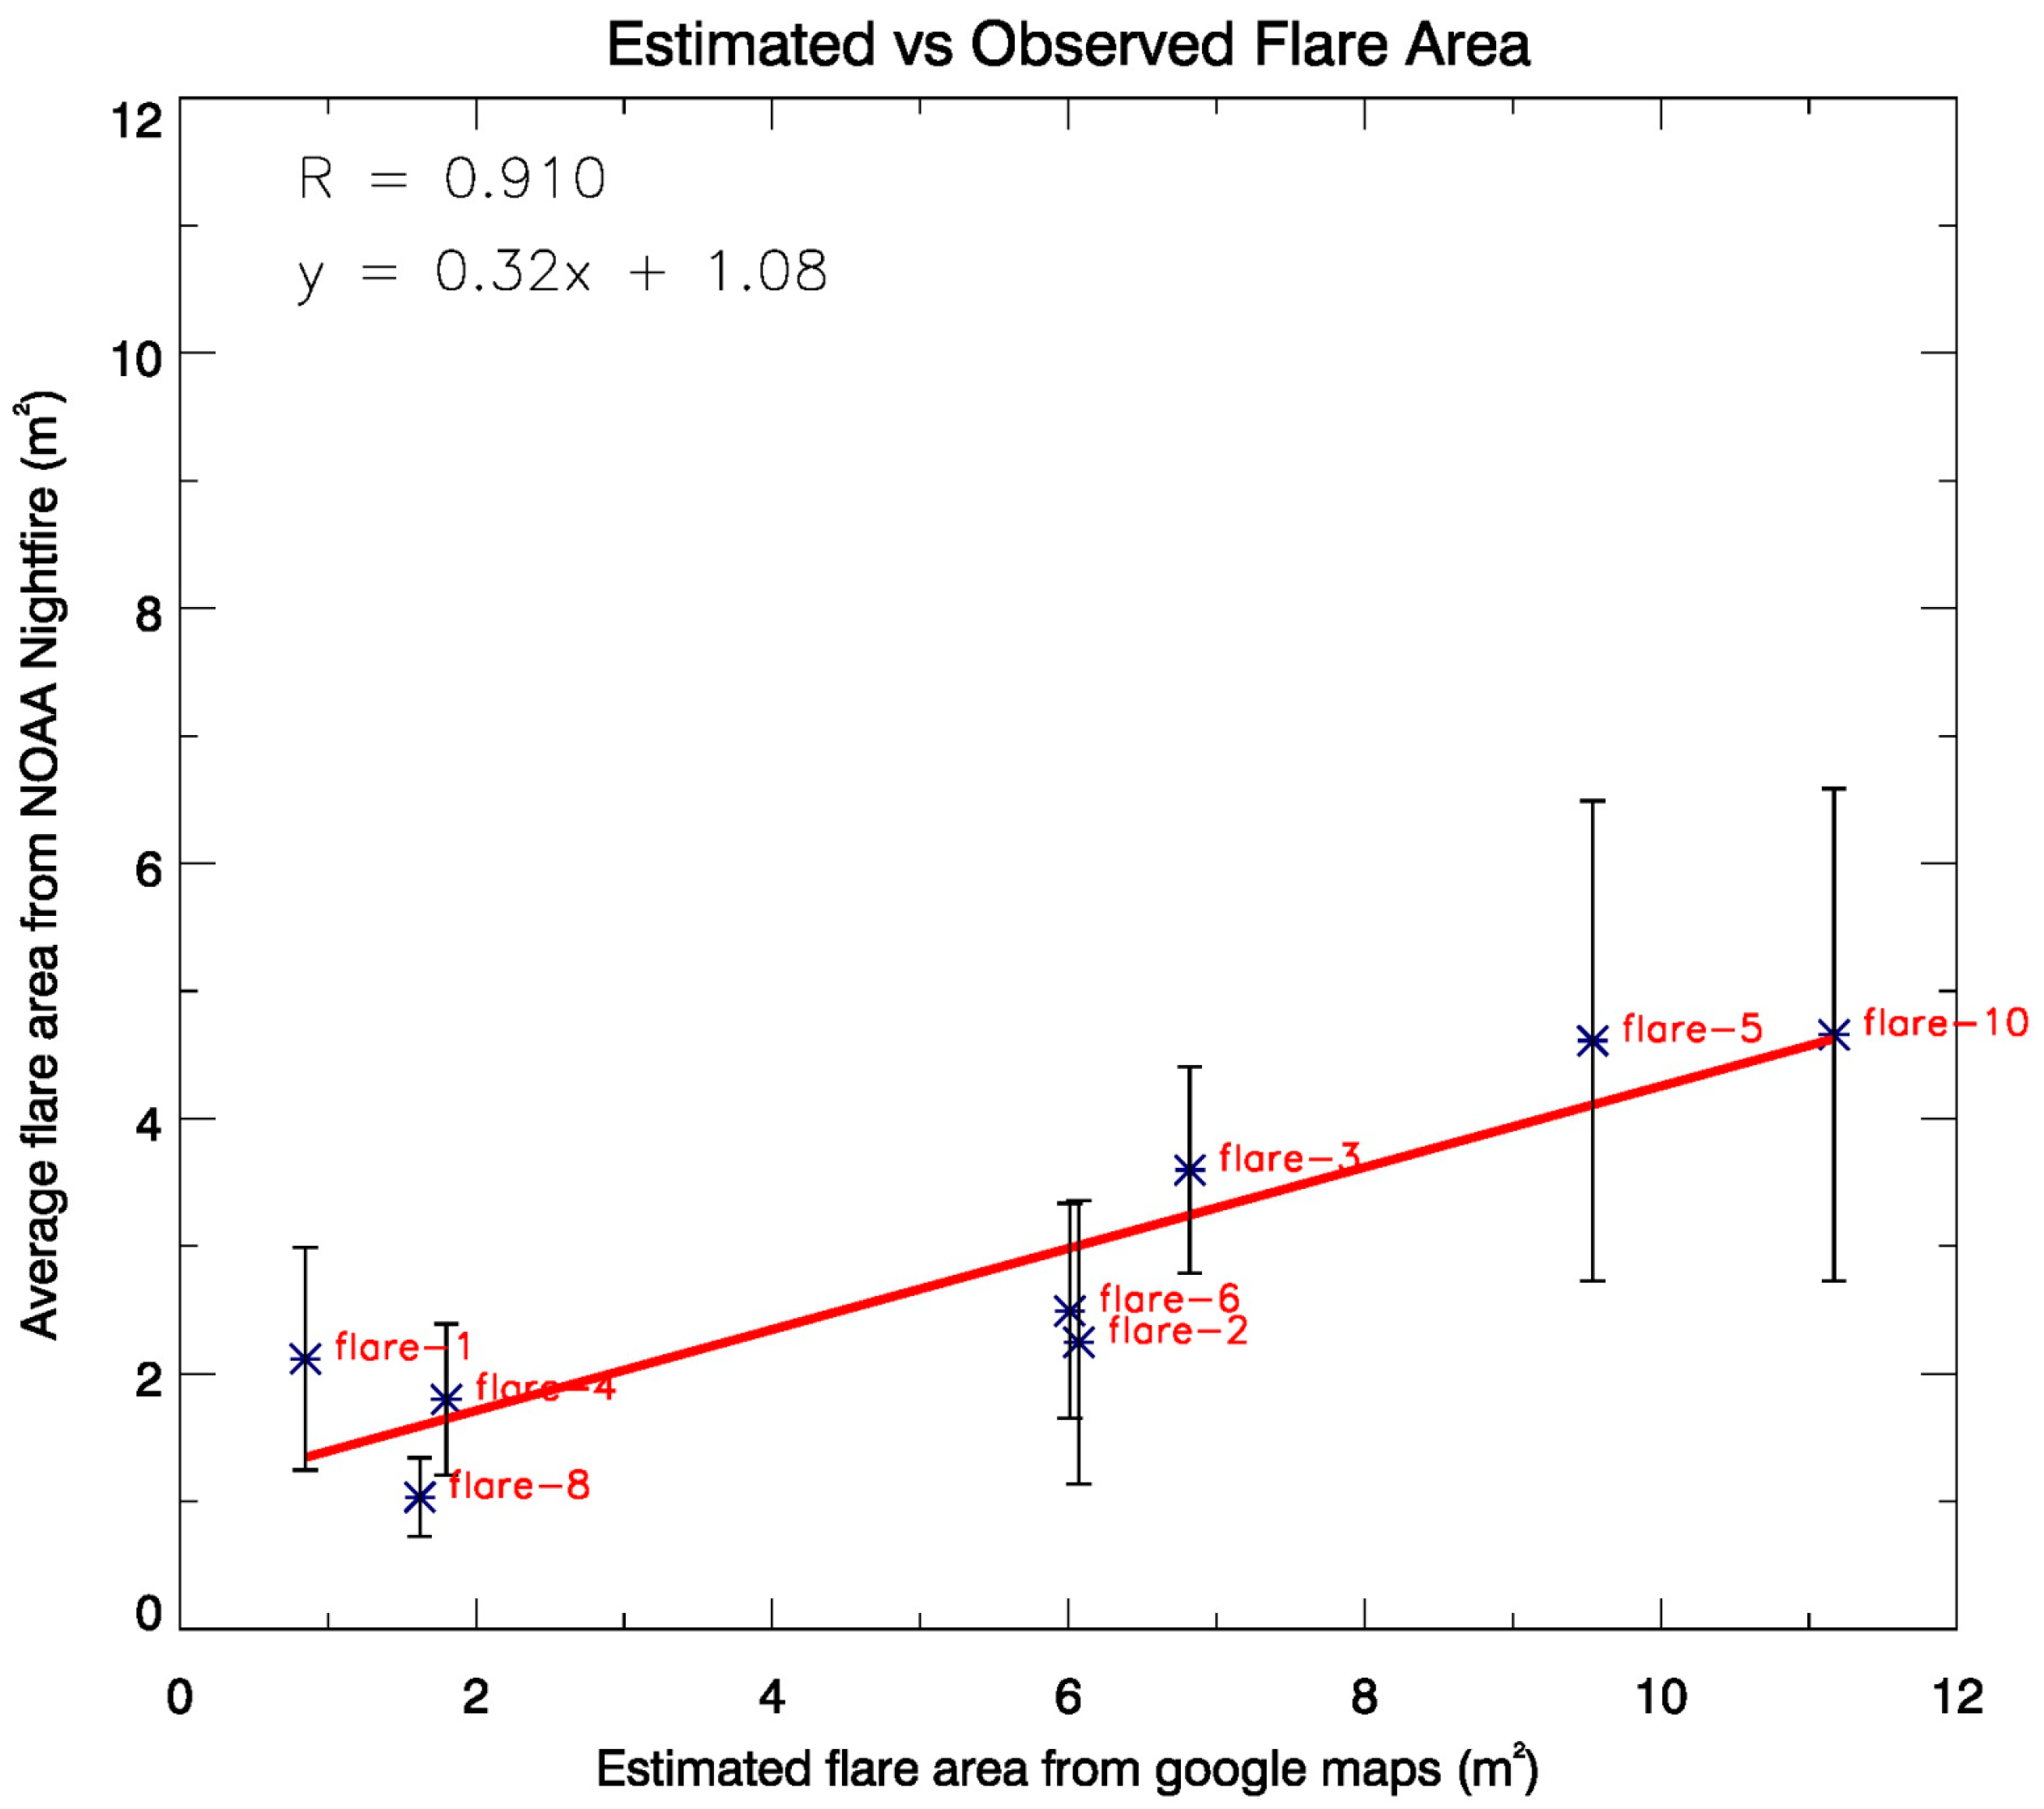
We also verified the fire areas reported by the VNF product for flares under study with the Google imagery. Triangular areas were drawn around the flare stacks over zoomed in Google Images to show foreknown flare locations and to approximately calculate the areas around the flares. It should be noted these are conservative estimates of fire areas for flares and are not representative of exact flame areas, as the flame size depends on various factors like wind speed and fuel burned. Therefore, deducing flare areas from flames is not very reliable. Verification of these areas could not be done for two locations of the flares because of the limitation of the available zoomed in Google imagery there. Figure 11 shows a scatter plot of the comparison between the mean of the areas reported by VNF and the area estimated by Google imagery. In order to remove the bias from the outliers for mean area calculations from the VNF product, the interquartile range (q0.25–q0.75) of all reported areas was used. The mean and the standard deviation were calculated using the data in this range only. The scatter plot shows a correlation of 0.91 between the imagery estimated and VNF areas, however, VNF is found to underestimate the areas of the flares.
6. Summary and Discussion
The VNF product was studied for the summer months of 2013 (April–August) in the Khanty-Mansiysk Autonomous Okrug, Russia along with other standard fire products. The fire activity was contrasted and compared for the same period with other fire products such as MOD14 (MODIS Terra land level 2 data), MYD14 (MODIS Aqua land level 2 data), and VIIRS Active Fire Product (VIIRS level 2 data). A broad gas flaring map was made highlighting grids in the target region showing the most persistent flaring activity using VNF data. The results revealed that fire counts observed by the VNF product were way higher than the other products both in and outside of gas flaring zones, with the counts observed by VAFP coming a distant second. The large differences were attributed to the choice of primary detection bands and thresholds involved. The VNF algorithm was replicated using multispectral level 2 VIIRS data to better understand its functioning. Case studies attempting to reconcile the differences between VNF and VAFP showed that the VAFP was able to detect flares but only those with very high M10 DC counts (or high radiance).
Upon increasing the M10 based thresholds manifold for hotspot detection, the VNF replica was able to match VAFP detections. The factor by which thresholds for VNF need to be multiplied to match with VAFP is variable. Smaller flares tend to be picked up by VNF but are not detected by VAFP. In order test the efficacy of the VNF product to detect flares over a longer period of time, the product was tested on pre-specified flaring locations for a period of five months. The product did sufficiently well with detecting all the pre-determined flares with frequency touching as high as 40% of the days tested. A database was also created using data associated with the detections by the product. The database included information on viewing geometries, brightness temperatures, fire areas, multispectral radiances, etc. Some of the peculiar features of flares shown by the data from the database demonstrated that the associated temperatures detected were consistently higher than 1600 K almost all the time. Also, a large number of valid detections seemed to have a viewing zenith angle preference of <5°, which tells that the satellites are almost overhead of the flares most of the time they are detected, their small size being the most plausible reason. The small size of the flares was consistently observed from the VNF as well, and on comparison with areas estimated manually from Google imagery, a good correlation of 0.91 was found between the two. It was also observed that VNF generally underestimates the area of the flares. It should be noted that the area estimated manually is not fully accurate and is a conservative estimate derived by drawing polygon boundaries around the flare structure. However, VNF is among the first that shows the capability to characterize the gas flaring areas from space with good accuracy.
Acknowledgments
This project was supported by the NASA’s Applied Science Program.
Author Contributions
Jun Wang conceived and designed the project; Ambrish Sharma analyzed the data; Ambrish Sharma, Jun Wang and Elizabeth M Lennartsonwrote the paper.
Conflicts of Interest
The authors declare no conflict of interest.
References
- Ismail, O.; Umukoro, G. Global Impact of Gas Flaring. Energy Power Eng. 2012, 4, 290–302. [Google Scholar] [CrossRef]
- Elvidge, C.D.; Ziskin, D.; Baugh, K.E.; Tuttle, B.T.; Ghosh, T.; Pack, D.W.; Erwin, E.H.; Zhizhin, M. A Fifteen Year Record of Global Natural Gas Flaring Derived from Satellite Data. Energies 2009, 2, 595–622. [Google Scholar] [CrossRef]
- Gervet, B. Gas Flaring Emission Contributes to Global Warming. Master’s Thesis, Lule University of Technology, Lule, Sweden, 2017. [Google Scholar]
- Casadio, S.; Arino, O.; Serpe, D. Gas flaring monitoring from space using the ATSR instrument series. Remote Sens. Environ. 2012, 116, 239–249. [Google Scholar] [CrossRef]
- Nwanya, S.C. Climate change and energy implications of gas flaring for Nigeria. Int. J. Low Carbon Technol. 2011, 6, 193–199. [Google Scholar] [CrossRef]
- Croft, T.A. Burning Waste Gas in Oil Fields. Nature 1973, 245, 375–376. [Google Scholar] [CrossRef]
- Croft, T. Nighttime Images of Earth from Space. Sci. Am. 1978, 239, 86–98. [Google Scholar] [CrossRef]
- Muirhead, K.; Cracknell, A. Identification of Gas Flares in the North-Sea using Satellite Data. Int. J. Remote Sens. 1984, 5, 199–212. [Google Scholar] [CrossRef]
- Elvidge, C.; Imhoff, M.; Baugh, K.; Hobson, V.; Nelson, I.; Safran, J.; Dietz, J.; Tuttle, B. Night-time lights of the world: 1994–1995. Isprs J. Photogramm. Remote Sens. 2001, 56, 81–99. [Google Scholar] [CrossRef]
- Elvidge, C.; Tuttle, B.T.; Sutton, P.S.; Baugh, K.E.; Howard, A.T.; Milesi, C.; Bhaduri, B.L.; Nemani, R. Global distribution and density of constructed impervious surfaces. Sensors 2007, 7, 1962–1979. [Google Scholar] [CrossRef]
- Dozier, J. A Method for Satellite Identification of Surface Temperature Fields of Subpixel Resolution. Remote Sens. Environ. 1981, 11, 221–229. [Google Scholar] [CrossRef]
- Csiszar, I.; Schroeder, W.; Giglio, L.; Ellicott, E.; Vadrevu, K.P.; Justice, C.O.; Wind, B. Active fires from the Suomi NPP Visible Infrared Imaging Radiometer Suite: Product status and first evaluation results. J. Geophys. Res. Atmos. 2014, 119, 803–816. [Google Scholar] [CrossRef]
- Giglio, L.; Descloitres, J.; Justice, C.; Kaufman, Y. An enhanced contextual fire detection algorithm for MODIS. Remote Sens. Environ. 2003, 87, 273–282. [Google Scholar] [CrossRef]
- Weaver, J.; Lindsey, D.; Bikos, D.; Schmidt, C.; Prins, E. Fire detection using GOES rapid scan imagery. Weather Forecast. 2004, 19, 496–510. [Google Scholar] [CrossRef]
- Casadio, S.; Arino, O.; Minchella, A. Use of ATSR and SAR measurements for the monitoring and characterisation of night-time gas flaring from off-shore platforms: The North Sea test case. Remote Sens. Environ. 2012, 123, 175–186. [Google Scholar] [CrossRef]
- Elvidge, C.D.; Zhizhin, M.; Hsu, F.; Baugh, K.E. VIIRS VNF: Satellite Pyrometry at Night. Remote Sens. 2013, 5, 4423–4449. [Google Scholar] [CrossRef]
- Anejionu, O.C.D.; Blackburn, G.A.; Whyatt, J.D. Satellite survey of gas flares: Development and application of a Landsat-based technique in the Niger Delta. Int. J. Remote Sens. 2014, 35, 1900–1925. [Google Scholar] [CrossRef]
- World Bank. Igniting solutions to gas flaring in Russia. Available online: http://www.worldbank.org/en/news/feature/2013/11/12/igniting-solutions-to-gas-flaring-in-russia (accessed on 19 May 2017).
- Knizhnikov, A.; Poussenkova, N. Russian Associated Gas Utilization: Problems and Prospects; Annual Report within the Framework of the Project, Environment and Energy; Institute of World Economy and International Relations of the Russian Academy of Sciences: Moscow, Russian, 2009. [Google Scholar]
- Justice, C.O.; Giglio, L.; Korontzi, S.; Owens, J.; Morisette, J.; Roy, D.; Descloitres, J.; Alleaume, S.; Petitcolin, F.; Kaufman, Y.J. The MODIS fire products. Remote Sens. Environ. 2002, 83, 244–262. [Google Scholar] [CrossRef]
- Csiszar, I.; Morisette, J.; Giglio, L. Validation of active fire detection from moderate resolution satellite sensors: The MODIS example in Northern Eurasia. IEEE Trans. Geosci. Remote Sens. 2006, 44, 1757–1764. [Google Scholar] [CrossRef]
- Morisette, J.T.; Giglio, L.; Csiszar, I.; Setzer, A.; Schroeder, W.; Morton, D.; Justic, C.O. Validation of MODIS active fire detection products derived from two algorithms. Earth Interact. 2005, 9, 1–25. [Google Scholar] [CrossRef]
- Schroeder, W.; Prins, E.; Giglio, L.; Csiszar, I.; Schmidt, C.; Morisette, J.; Morton, D. Validation of GOES and MODIS active fire detection products using ASTER and ETM+ data. Remote Sens. Environ. 2008, 112, 2711–2726. [Google Scholar] [CrossRef]
- Polivka, T.; Hyer, E.; Wang, J.; Peterson, D. First global analysis of saturation artifacts in the VIIRS infrared channels and the effects of sample aggregation. IEEE Geosci. Remote Sens. Lett. 2015, 12, 1262–1266. [Google Scholar] [CrossRef]
- Weather Spark. Average weather in Khanty-Mansiysk Russia. Available online: https://weatherspark.com/y/106931/Average-Weather-in-Khanty-Mansiysk-Russia (accessed on 19 May 2017).
- Arino, O.; Casadio, S.; Serpe, D. Global night-time fire season timing and fire count trends using the ATSR instrument series. Remote Sens. Environ. 2012, 116, 226–238. [Google Scholar] [CrossRef]
- Peterson, D.; Wang, J. A Sub-pixel-based calculate of fire radiative power from MODIS observations: 2. Sensitivity analysis and potential fire weather application. Remote Sens. Environ. 2013, 129, 231–249. [Google Scholar]
- Peterson, D.A.; Wang, J.; Ichoku, C.; Hyer, E.; Ambrosia, V. A sub-pixel-based calculation of fire radiative power from MODIS observations: 1: Algorithm development and initial assessment. Remote Sens. Environ. 2013, 129, 262–279. [Google Scholar] [CrossRef]
- Giglio, L.; Kendall, J.D. Application of the Dozier retrieval to wildfire characterization: A sensitivity analysis. Remote Sens. Environ. 2011, 77, 34–49. [Google Scholar]
Figure 1.
Projected map of test region (in red boundaries) enclosing Khanty-Mansiysk Autonomous Okrug, Russia. The background map is from GoogleEarth© with modification.
Figure 1.
Projected map of test region (in red boundaries) enclosing Khanty-Mansiysk Autonomous Okrug, Russia. The background map is from GoogleEarth© with modification.

Figure 2.
Nighttime fire detections by different products over the study area during Summer 2013. The considerable difference in detections between VNF and other products is due to VNF’s ability to detect more gas flares in the region.
Figure 2.
Nighttime fire detections by different products over the study area during Summer 2013. The considerable difference in detections between VNF and other products is due to VNF’s ability to detect more gas flares in the region.
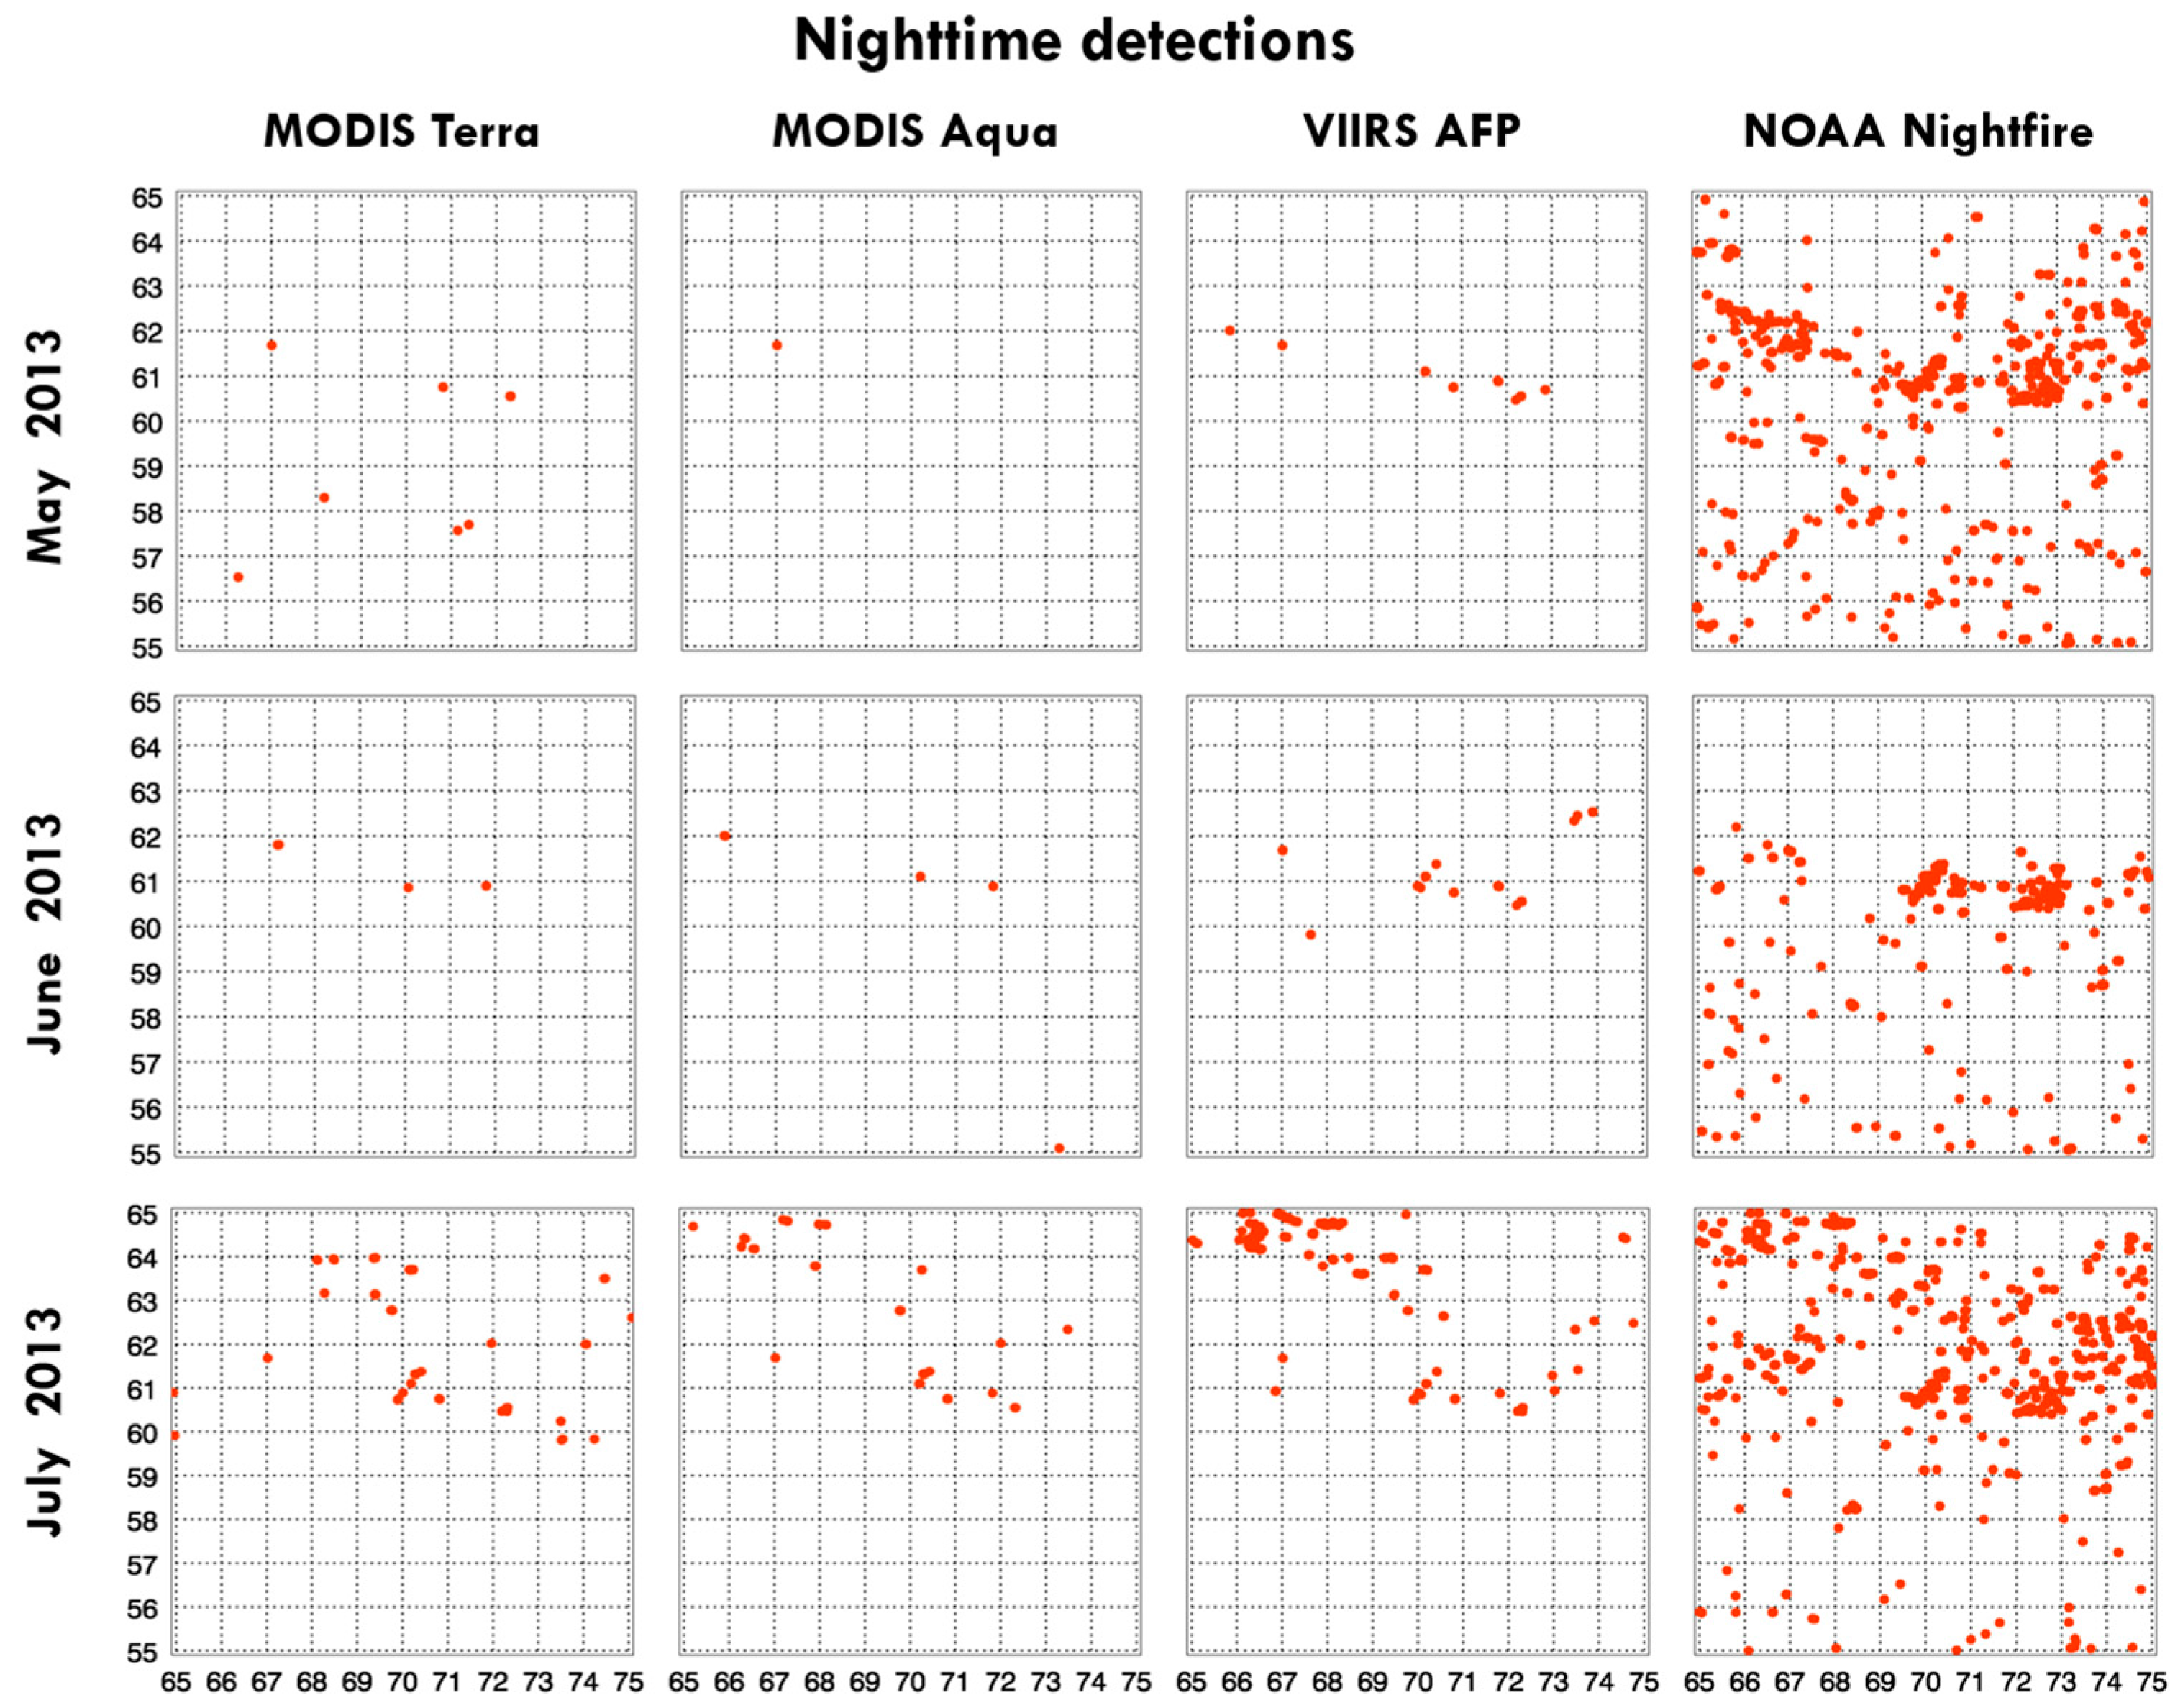
Figure 3.
Nocturnal detections by different sensors over the gas flaring regions in the study area (April–August 2013). X- and Y-axis show the longitude and latitude, respectively.
Figure 3.
Nocturnal detections by different sensors over the gas flaring regions in the study area (April–August 2013). X- and Y-axis show the longitude and latitude, respectively.

Figure 4.
NOAA VNF (a) and VNF Replica (b): Nighttime M10 band detections. See the text for details.
Figure 4.
NOAA VNF (a) and VNF Replica (b): Nighttime M10 band detections. See the text for details.

Figure 5.
(a–f) Reconciliation between VAFP and NOAA VNF, 4 July 2013. See the text for details.
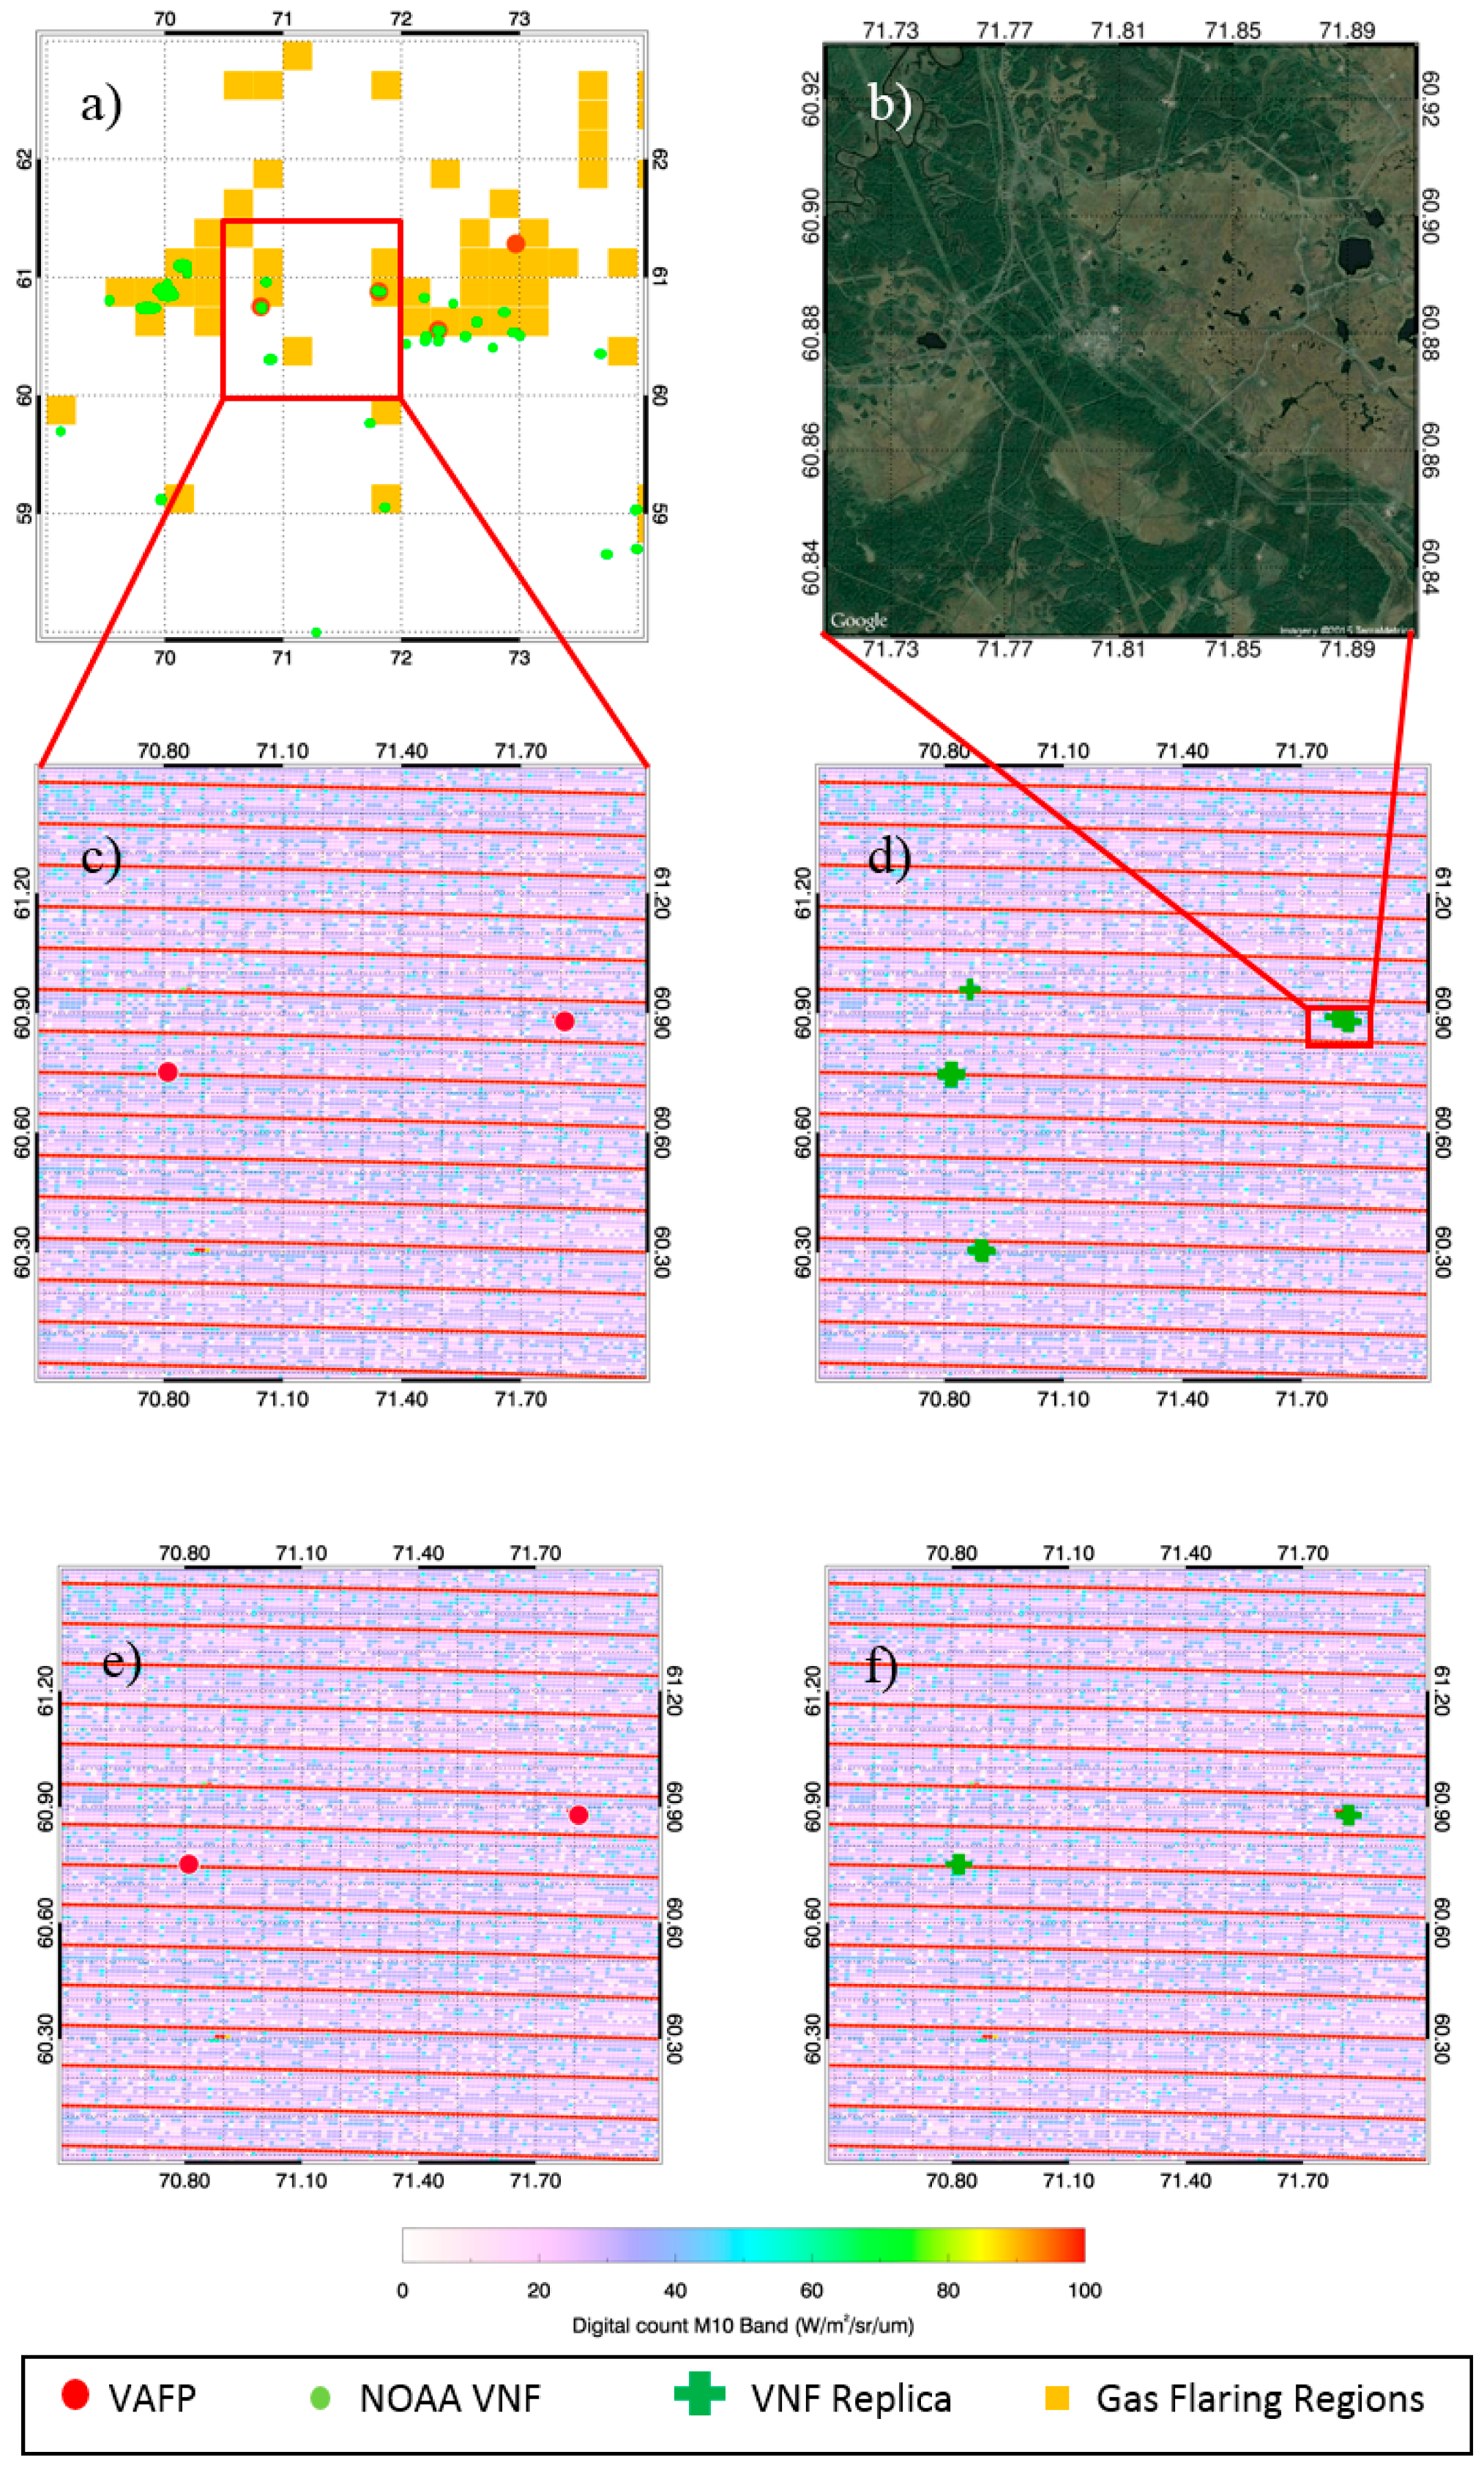
Figure 6.
(a–f) Reconciliation between VAFP and NOAA VNF, 2 August 2013. See the text for details.
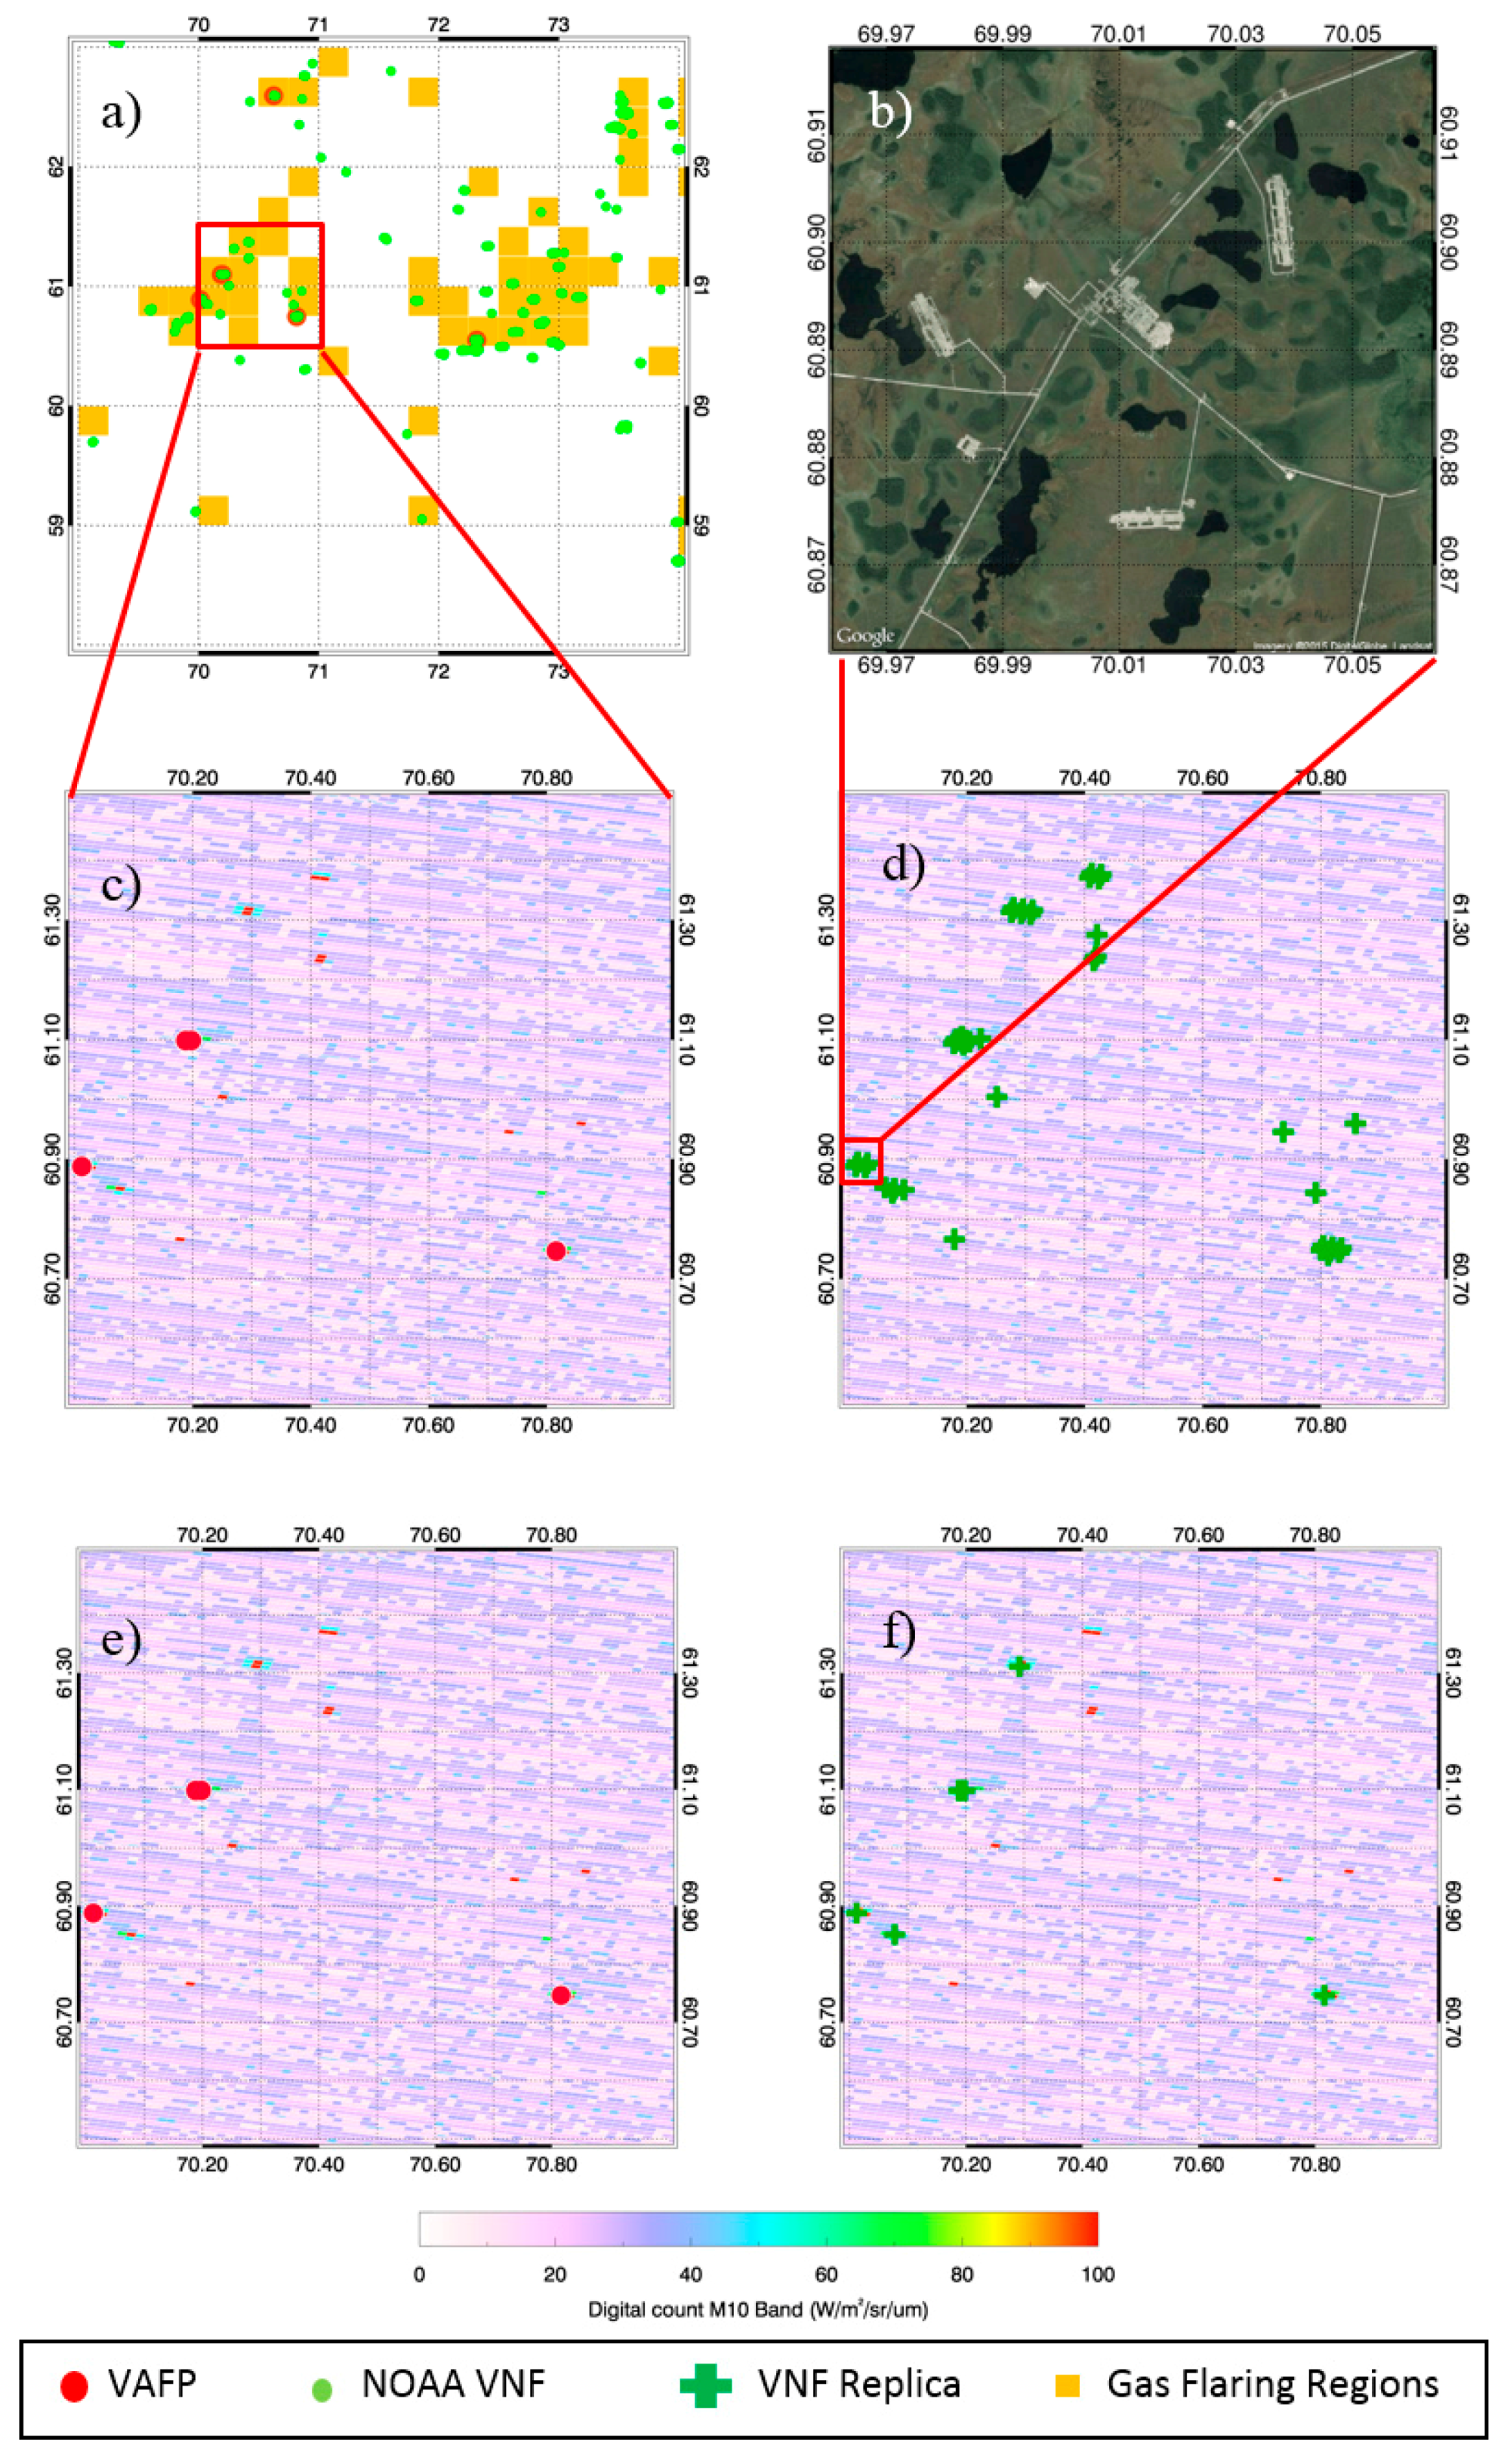
Figure 7.
(a) Simulation of 4 µm (top left) and (b) 1.6 µm (top right) radiances for varying fire temperature and fire area fraction, as well as (bottom left) (c) their corresponding difference (1.6–4 µm) for varying fire temperature and fire area fraction. The background brightness temperature is considered uniformly at 300 K.

Figure 8.
(a) A test site in Khanty-Mansiysk, Russia (Image courtesy: Google maps); (b) Fire area, temperature, and distance of detected pixel from the flare location for this site over five months in 2013, as retrieved by NOAA VNF version 1.0. The red lines represent the fire temperature reported by VNF for hot pixels found in proximity to the flare, whereas the blue and navy blue lines represent the fire area and distance from the flare to the center of the detected pixel, respectively.
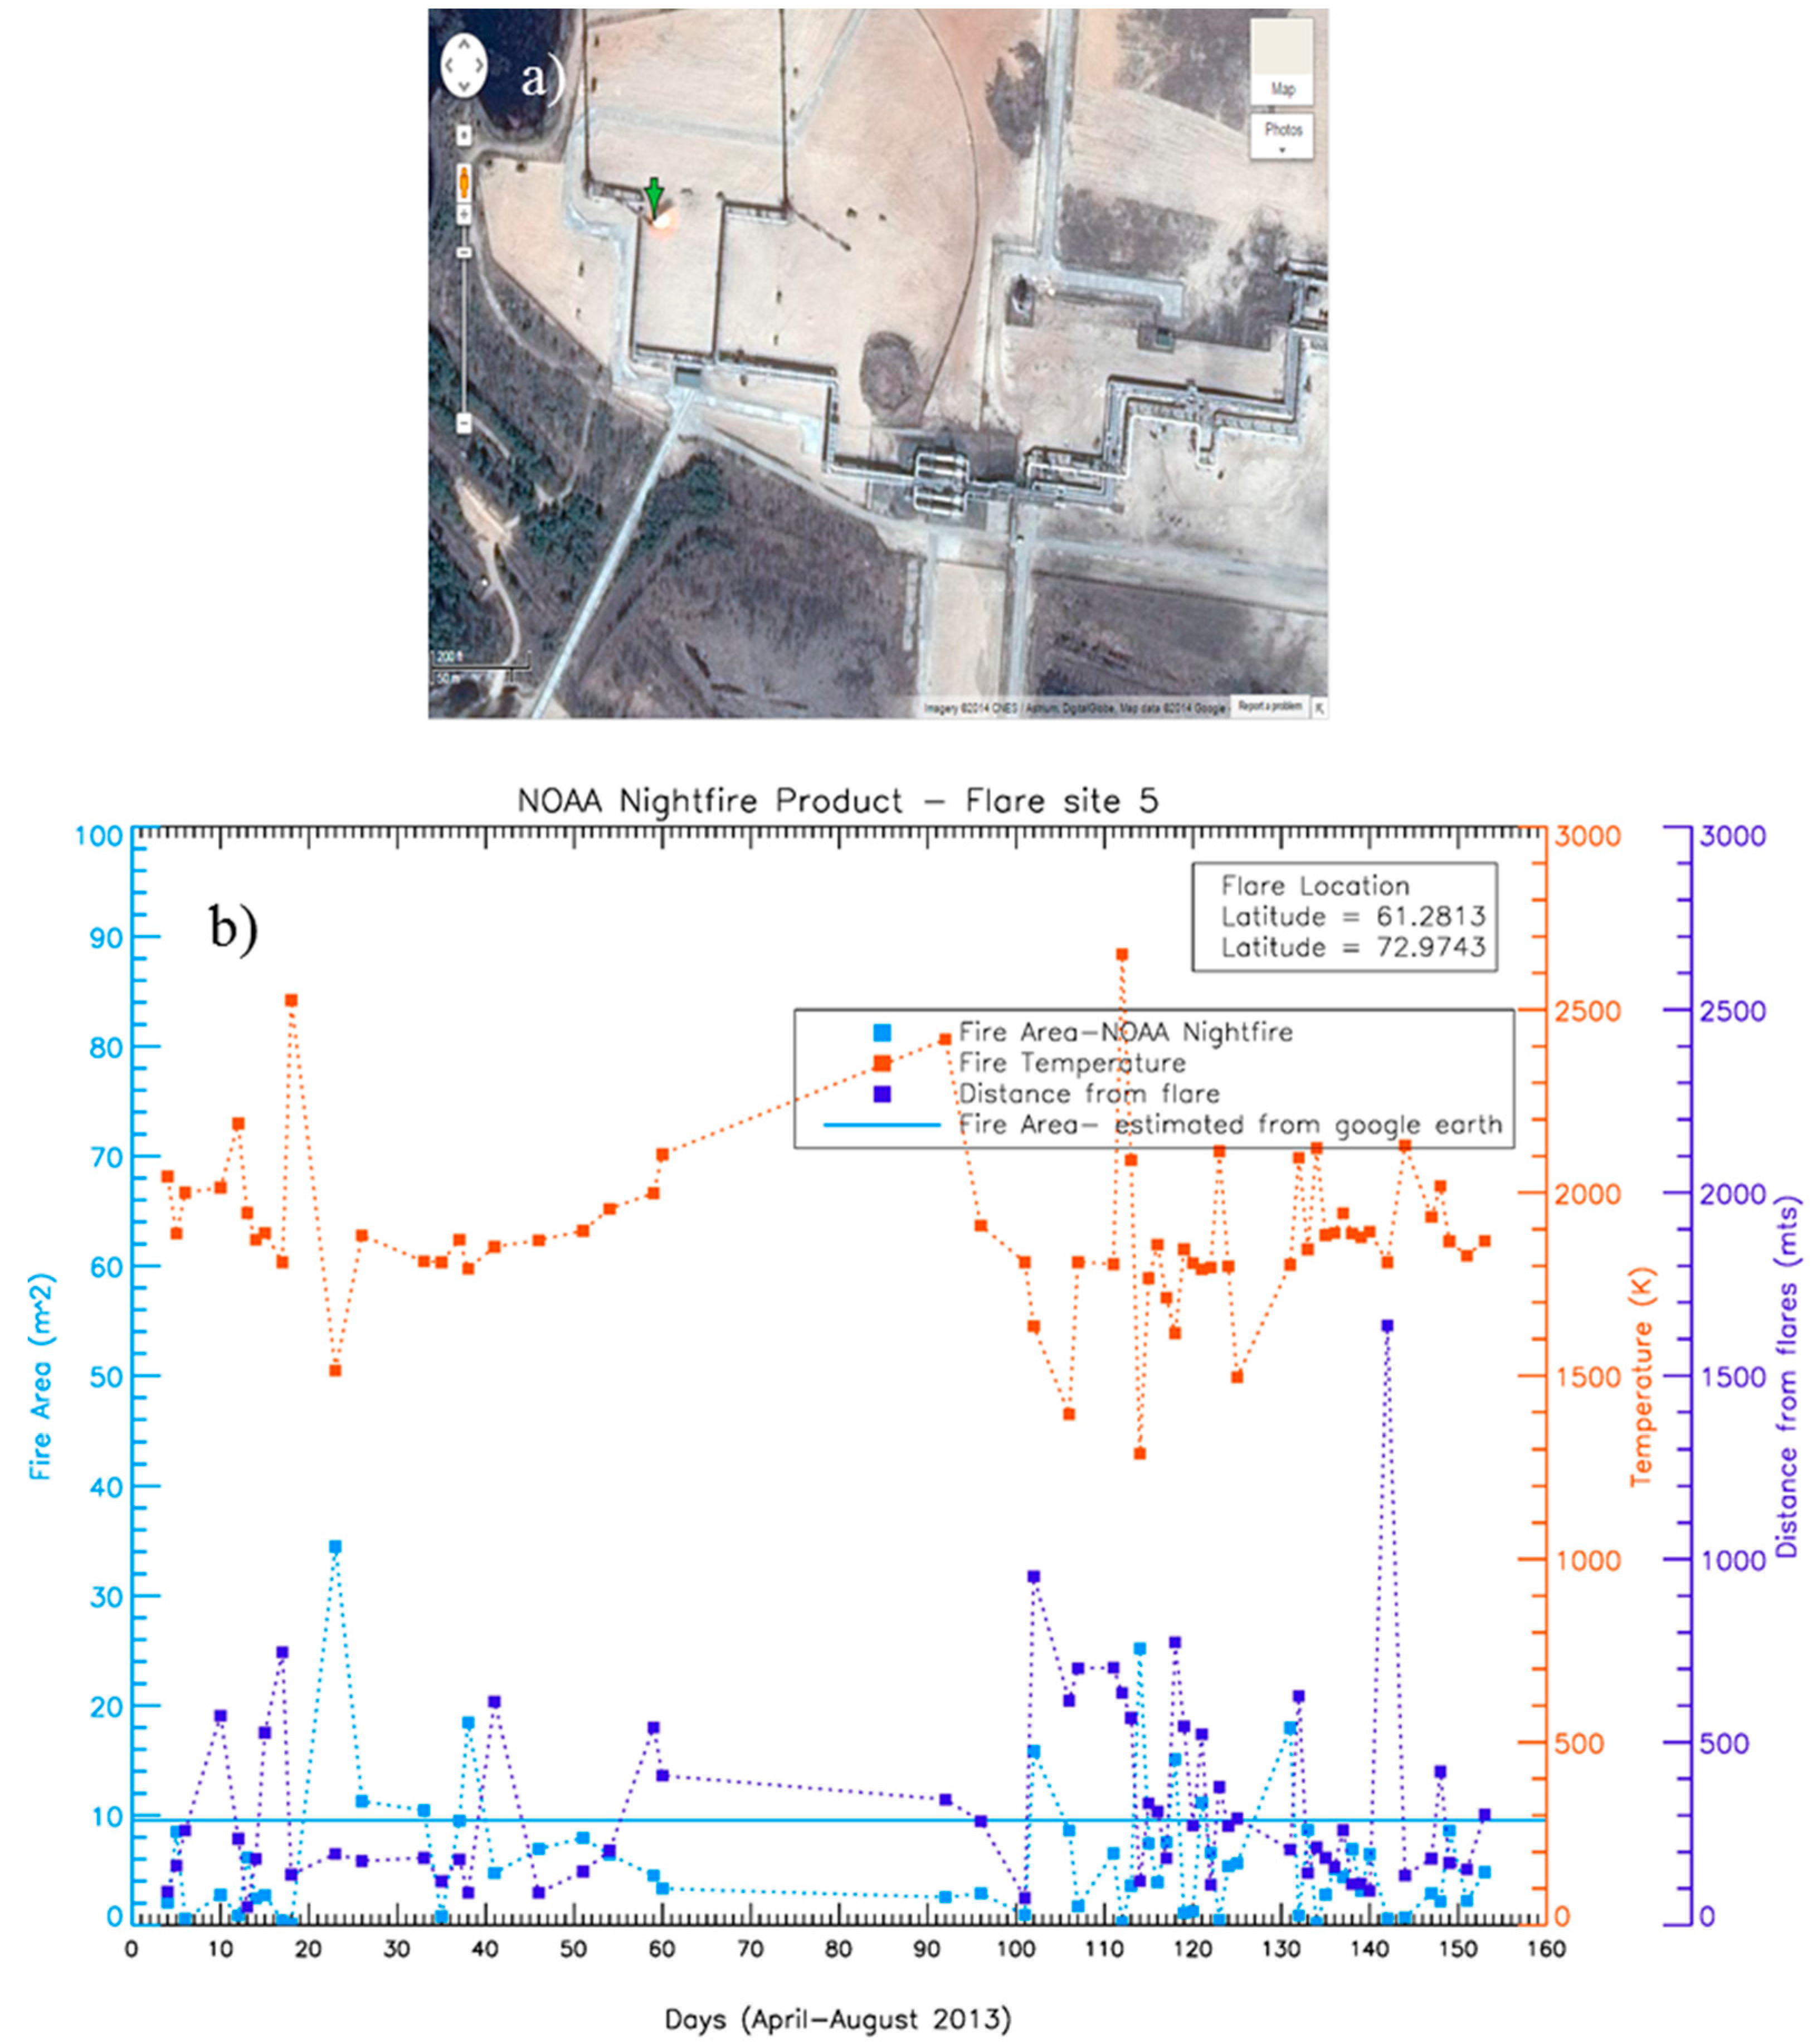
Figure 9.
Histogram for fire temperature reported by VNF for ten chosen flaring sites in the study region over the five month period (April–August 2013).
Figure 9.
Histogram for fire temperature reported by VNF for ten chosen flaring sites in the study region over the five month period (April–August 2013).
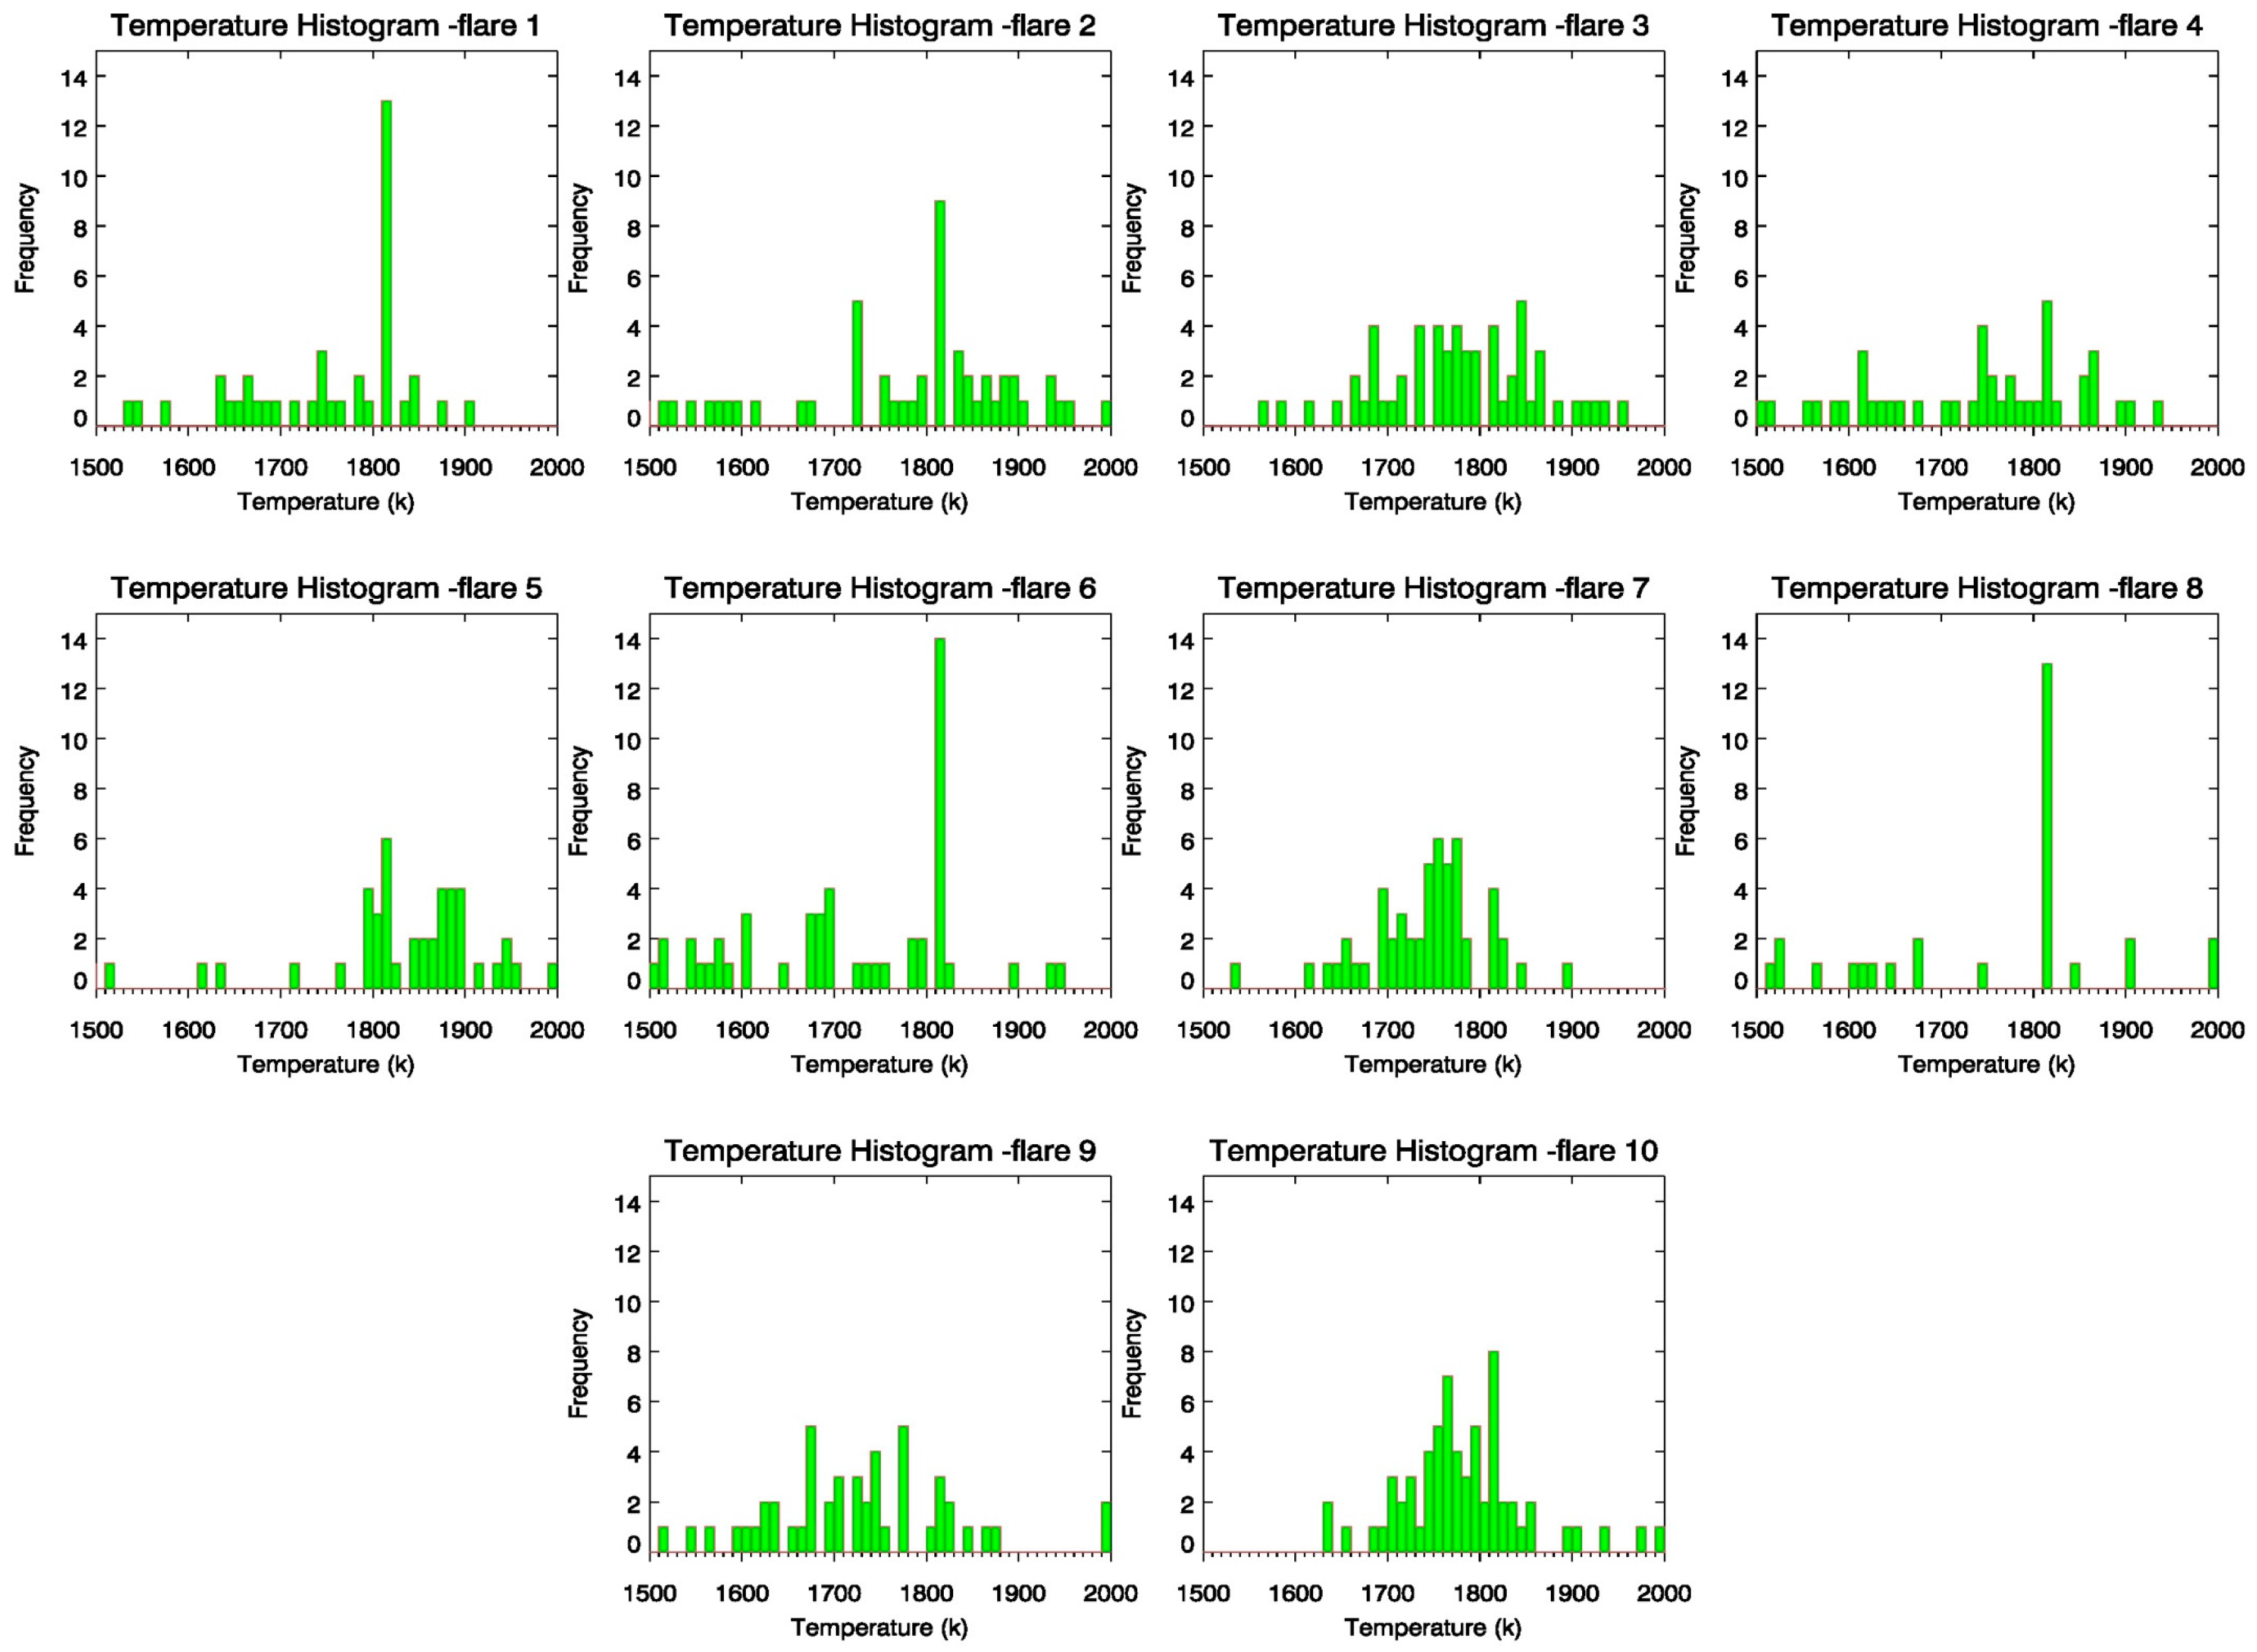
Figure 10.
Histogram for view zenith angles for the same period and sites reported by VNF. It is noticeable that most flare detections are happening for viewing angles very close to nadir.
Figure 10.
Histogram for view zenith angles for the same period and sites reported by VNF. It is noticeable that most flare detections are happening for viewing angles very close to nadir.
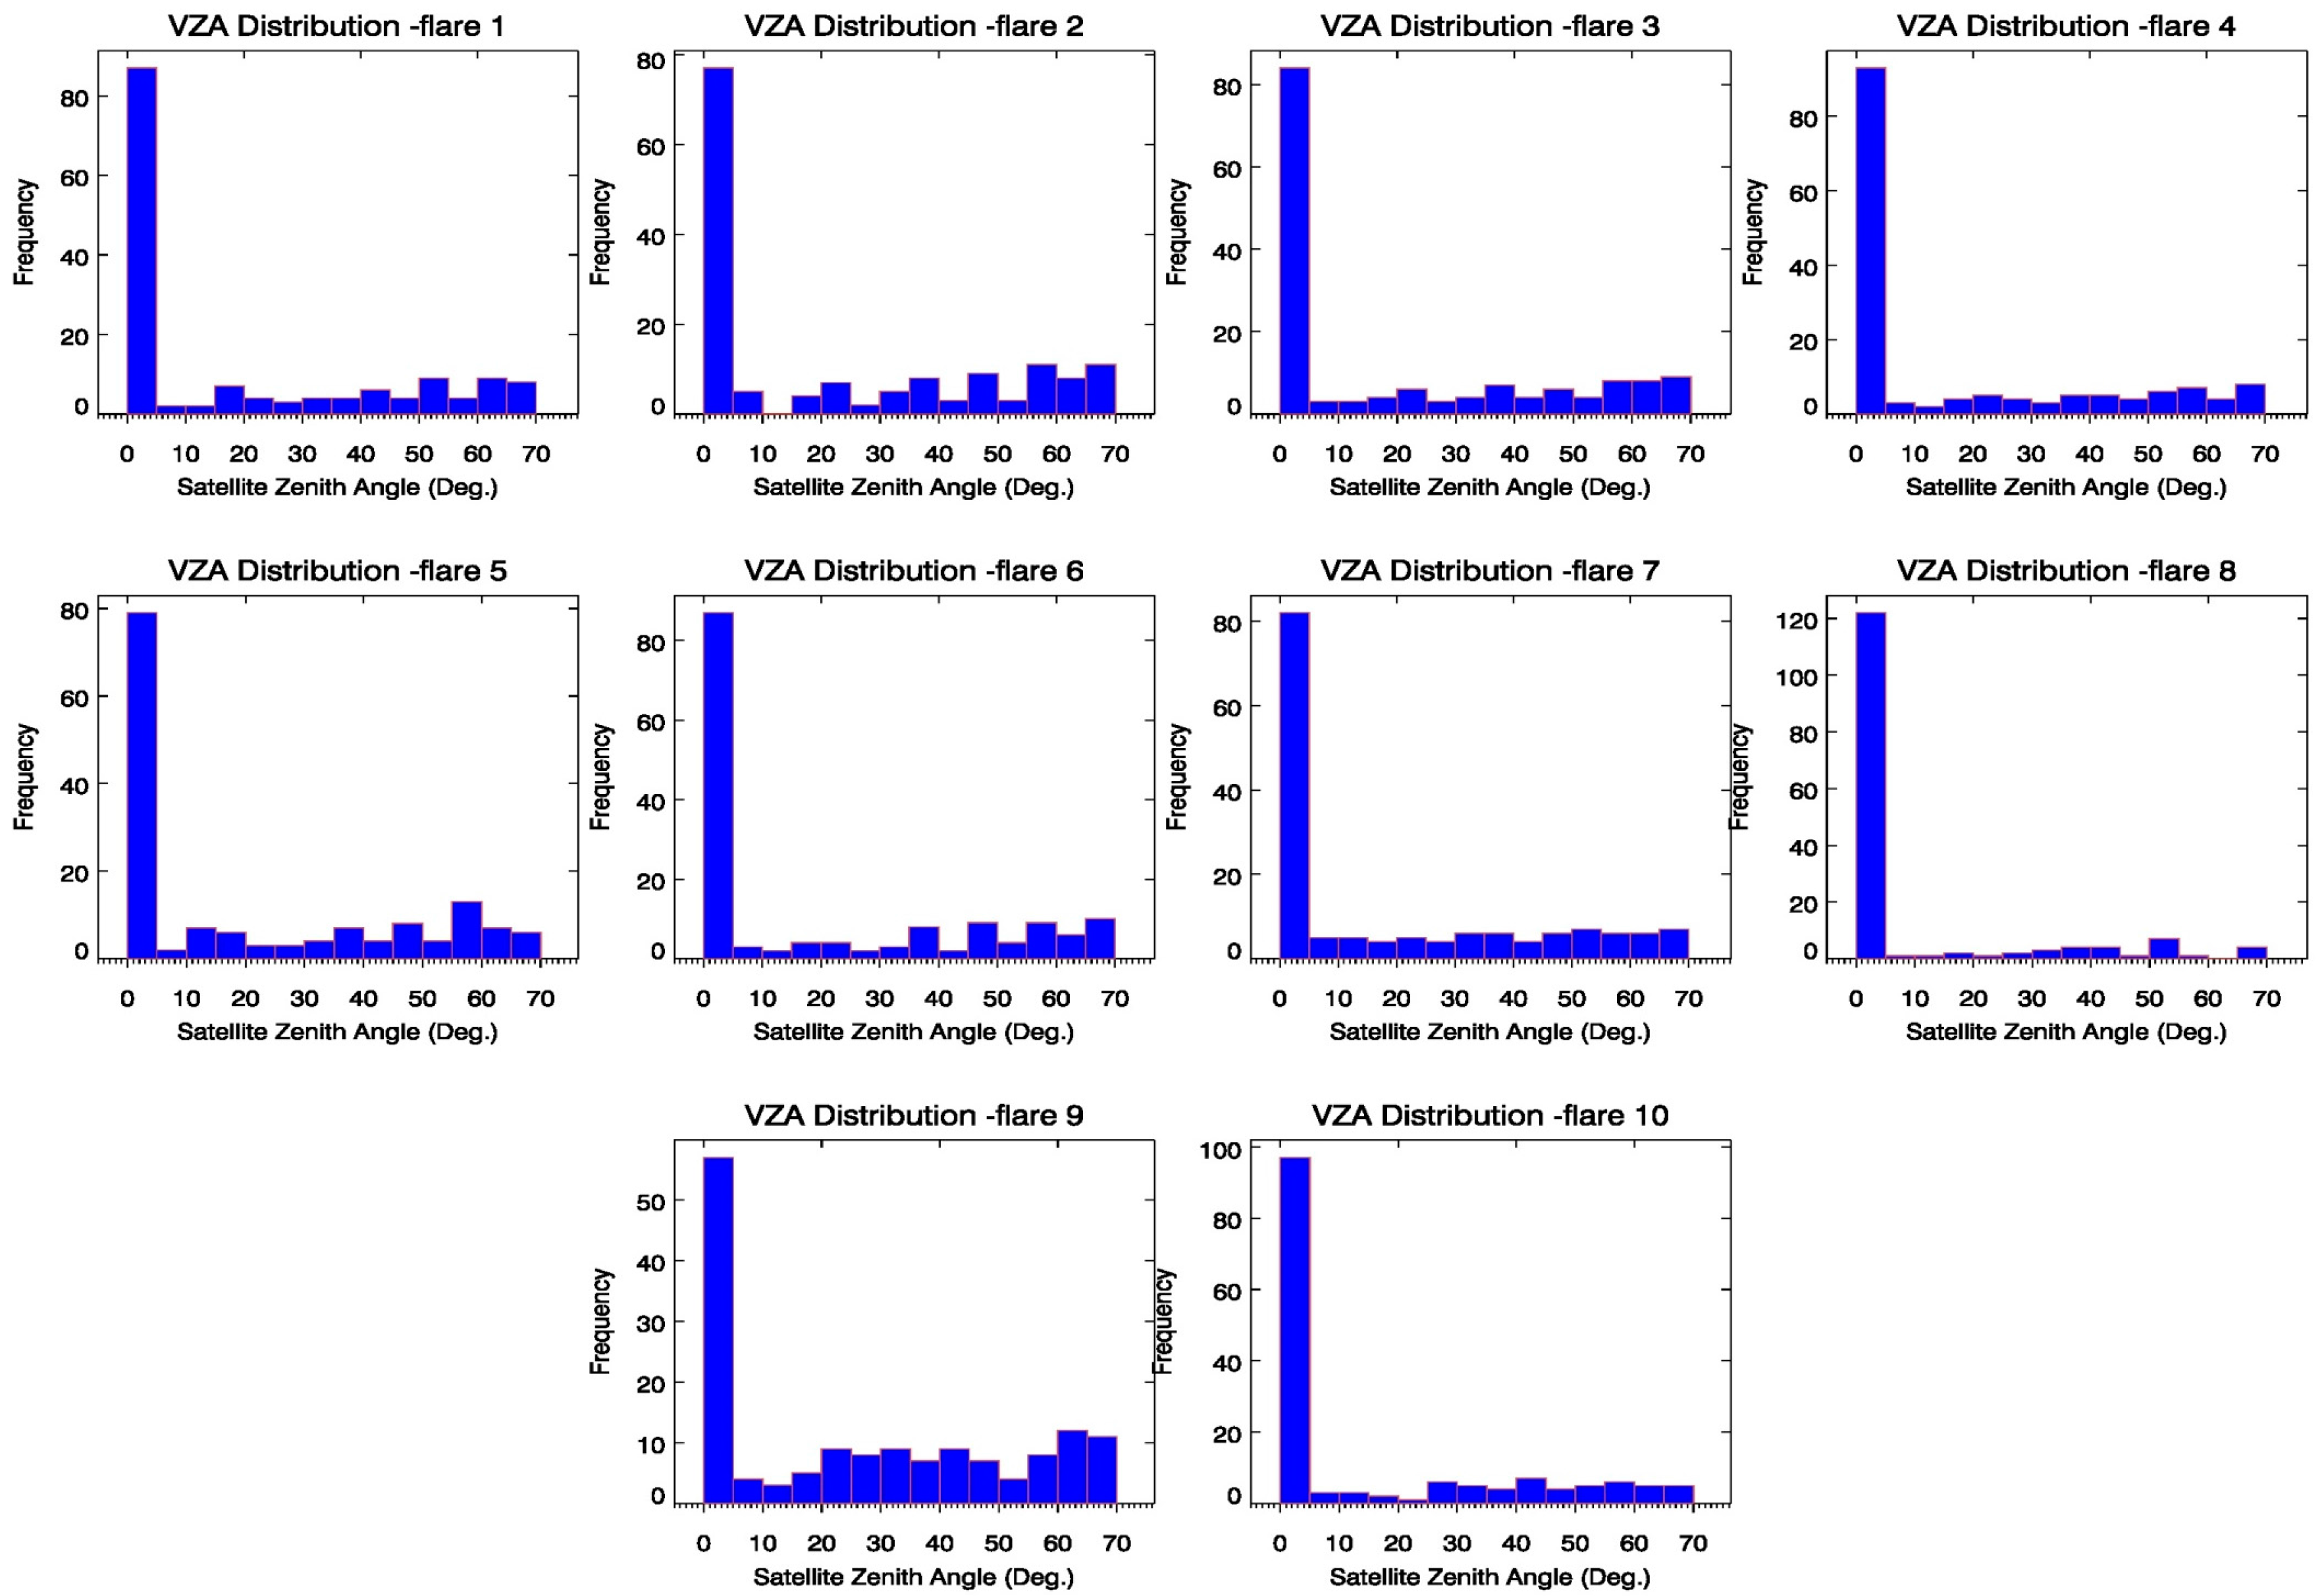
Figure 11.
Scatter plot for fire areas reported by NOAA VNF for different flare sites versus the area estimated using Google imagery for the respective sites.
Figure 11.
Scatter plot for fire areas reported by NOAA VNF for different flare sites versus the area estimated using Google imagery for the respective sites.

Table 1.
Differences in algorithms of fire products.
| MODIS Fire Product | VIIRS Active Fire | NOAA VNF | |
|---|---|---|---|
| Primary Detection Band | 4 µm, 11 µm channels | 4 µm, 11 µm channels | 1.6 µm channel |
| Treatment of Clouds | Cloudy Pixels Pre-screened | Cloudy Pixels Pre-screened | Completely or Partially Cloudy Pixel considered |
| Solar Contamination | Observations ≥ 85° SZA | Observations ≥ 85° SZA | Observations > 95° SZA |
| Auxiliary Info | Fire Radiative Power, Geolocation, Geometry | Geolocation, Geometry | Sub-pixel fire area, temperature and radiant heat, Geolocation, Geometry |
| Spatial Resolution | 1 km at Nadir | 750 m at Nadir | Variable |
| Aggregation | None | Sub-pixel aggregation across scan | N/A |
| Potential Pixel Selection | T4 > 305 and ΔT > 10 | T4 > 305 and ΔT > 10 | Radiance values above calculated threshold |
Table 2.
Multi-sensor fire detection during Summer 2013 over the study area.
| Date Nighttime | MOD14 (MODIS Terra) | MYD14 (MODIS Aqua) | VAFP (VIIRS) | VNF (VIIRS) 0 < TB < 1600 K TB ≥ 1600 | |||||||||||
|---|---|---|---|---|---|---|---|---|---|---|---|---|---|---|---|
| Total | In * | Out * | Total | In | Out | Total | In | Out | Total | In | Out | Total | In | Out | |
| April 13 | 07 | 02 | 05 | 02 | 02 | 00 | 17 | 15 | 02 | 551 | 301 | 250 | 2603 | 2461 | 142 |
| May 13 | 11 | 07 | 04 | 01 | 01 | 00 | 45 | 45 | 00 | 339 | 161 | 178 | 1476 | 1400 | 76 |
| June 13 | 04 | 02 | 02 | 05 | 04 | 01 | 52 | 36 | 16 | 86 | 85 | 01 | 370 | 357 | 13 |
| July 13 | 56 | 23 | 33 | 49 | 26 | 23 | 314 | 137 | 177 | 983 | 569 | 414 | 3004 | 2897 | 107 |
| August 13 | 59 | 30 | 29 | 27 | 23 | 04 | 138 | 81 | 57 | 1359 | 852 | 507 | 4952 | 4706 | 246 |
* In or out gas flaring regions shown in Figure 3.
Table 3.
Using VNF for long-term study of predetermined flaring locations.
| VIIRS VNF Test Sites | Geolocation (Degrees) | # of Detections | Mean Fire Area (m2) | Mean Brightness Temperature (K) | Mean Distance of Detection (m) |
|---|---|---|---|---|---|
| Site 1: | Lat: 60.9704 Lon: 73.8491 | 45 | 4.59 ± 7.23 | 1773.71 ± 140.868 | 402.640 ± 327.470 |
| Site 2: | Lat: 60.6912 Lon: 72.8564 | 62 | 5.37± 11.85 | 1789.61 ± 236.843 | 768.956 ± 697.082 |
| Site 3: | Lat: 61.0195 Lon:72.6190 | 60 | 3.65 ± 2.08 | 1789.20 ± 109.462 | 420.553 ± 330.132 |
| Site 4: | Lat: 61.6430 Lon: 72.1709 | 53 | 2.42 ± 2.18 | 1773.72 ± 226.354 | 370.547 ± 287.388 |
| Site 5: | Lat: 61.2813 Lon: 72.9743 | 60 | 5.95 ± 6.32 | 1894.10 ± 222.996 | 333.063 ± 275.531 |
| Site 6: | Lat: 60.7791 Lon:72.7071 | 53 | 3.23 ± 3.29 | 1710.96 ± 130.777 | 358.884 ± 226.843 |
| Site 7: | Lat:62.4468 Lon:73.5506 | 56 | 11.04 ± 7.63 | 1728.12 ± 123.712 | 418.890 ± 476.166 |
| Site 8: | Lat: 61.7231 Lon:73.8940 | 31 | 1.19 ± 0.77 | 1757.84 ± 154.92 | 505.728 ± 356.719 |
| Site 9: | Lat: 62.4922 Lon: 74.4010 | 65 | 24.88 ± 16.48 | 1788.29 ± 90.1068 | 344.189 ± 243.270 |
| Site 10: | Lat: 60.7386 Lon: 69.9132 | 50 | 5.19 ± 4.04 | 1733.50 ± 131.160 | 480.738 ± 315.054 |
© 2017 by the authors. Licensee MDPI, Basel, Switzerland. This article is an open access article distributed under the terms and conditions of the Creative Commons Attribution (CC BY) license (http://creativecommons.org/licenses/by/4.0/).
Share and Cite
MDPI and ACS Style
Sharma, A.; Wang, J.; Lennartson, E.M. Intercomparison of MODIS and VIIRS Fire Products in Khanty-Mansiysk Russia: Implications for Characterizing Gas Flaring from Space. Atmosphere 2017, 8, 95. https://doi.org/10.3390/atmos8060095
AMA Style
Sharma A, Wang J, Lennartson EM. Intercomparison of MODIS and VIIRS Fire Products in Khanty-Mansiysk Russia: Implications for Characterizing Gas Flaring from Space. Atmosphere. 2017; 8(6):95. https://doi.org/10.3390/atmos8060095
Chicago/Turabian StyleSharma, Ambrish, Jun Wang, and Elizabeth M. Lennartson. 2017. "Intercomparison of MODIS and VIIRS Fire Products in Khanty-Mansiysk Russia: Implications for Characterizing Gas Flaring from Space" Atmosphere 8, no. 6: 95. https://doi.org/10.3390/atmos8060095
Note that from the first issue of 2016, this journal uses article numbers instead of page numbers. See further details here.