1. Introduction
Heatwaves (HWs) are one of the “natural” hazards with the greatest impact worldwide in terms of mortality and economic losses. On the basis of the recent report produced by the US Global Change Research Program [
1], HWs revealed the highest 10-year estimates of fatalities and represented the second estimated economic damage (after hurricanes) among the main weather and climate disaster events in the United States from 2004 to 2013 [
1]. The impact of HWs on mortality is particularly high in Europe, accounting for over 80% of the total heatwave-related deaths worldwide [
2].
During the last 15 years, Europe has suffered a high number of severe summer HWs with devastating health and economic effects. In particular, several years characterized by major European HWs need to be mentioned in virtue of their great magnitude, spatial area extension and temporal persistence measured in HW consecutive days: 2003 in much of the northwestern and central-western part of Europe and in northern Italy [
3], 2006 in central-western and northwestern Europe [
4], 2007 in southeastern Europe [
5,
6], 2010 in eastern Europe and European Russia [
7], 2013 in the UK [
8] and, more recently, 2014 in the Scandinavian countries, and 2015 in central-western Europe. Most of these HWs were included in the top ten European HW
S that have occurred in Europe since 1950 [
9]. Over recent decades, the European summertime atmospheric circulation has shown distinctive regime variations associated not only with growing regional thermal trends but also with an increase in the occurrence of mid-latitude anti-cyclonic structures related to atmospheric blocking and linked to global climate-change processes [
10,
11,
12,
13]. Despite these recent dynamical evolutions of the climate patterns, the general population does not perceive the HW as a real public-health problem, presumably because this meteorological hazard lacks spectacular and sudden violence, with none of the evident physical destruction of other atmospheric extreme events, such as hurricanes and floods. Moreover, HWs generally spread their impact over large geographical areas where many vulnerable subjects may be exposed. The HW effect may also be exacerbated in large urban areas because of the urban heat island phenomenon, capable of amplifying the regional heat load during HW events [
14,
15]. In this regard, several studies have also revealed higher mortality rates in more densely built-up districts of urban areas than in rural ones [
16].
For these reasons, more detailed and updated analyses on HW trends in urban environments, where most of population lives, represent a priority that can no longer be overlooked. The analyses should be based on long time-series and extended geographically to include the main European cities characterized by the highest rate of exposed and vulnerable citizens.
The hardest task in this kind of study is to identify the most valid and reliable approach for defining and classifying HWs, as nowadays there is no universally accepted HW definition. However, it is currently agreed that HWs are relative to the climate of a location and therefore their classification should be geographically-related: the same meteorological conditions can represent a HW in one place but not in another [
14]. In a special report of the IPCC [
17], the HW was simply defined as “a period of abnormally hot weather”. A more thorough and detailed HW definition was reported in the latest guidelines on HWs and health, developed jointly by the WMO and the WHO [
14]: “a period of unusually hot and dry, or hot and humid weather that have a subtle onset and cessation, a duration of at least two–three days, usually with a discernible impact on human and natural systems”.
As reported in a specific study on the HW definition [
18], although a HW is a real meteorological event, it cannot be assessed without making any references to its human impacts. For this reason, an appropriate and consistent HW definition must address a real human health context where the combination of weather elements related to human sensations of heat should be included in order to evaluate the heat stress level. Many more or less complex heat stress indices (i.e., the apparent temperature index, humidex, Universal Thermal Climate Index, etc.) describe the complex status of the heat exchange between the human body and its thermal environment. The choice of the optimal method used to definitively evaluate a heat stress level will depend on meteorological data and other available informative resources. In addition, several recent studies used HW classifications by only accounting for the diurnal conditions, i.e., daily maximum temperature [
19,
20,
21]. However, it is well known that the daily minimum temperature also plays an important role in extreme heat events [
22,
23]: when nighttime temperatures remain at unusually high values, people obtain no relief from the heat of the day and high minimum temperatures will result in an accumulated heat load, leading to excess heat stress. For this reason, both daytime and nighttime conditions should be considered for having a reliable HW definition. Furthermore, the intensity, duration and timing of HWs should also be taken into account because these features can significantly influence the impact of HWs on the general population, especially vulnerable subjects.
At a European level, a useful contribution towards defining a HW in a human health context was provided by the EU-funded project EuroHEAT (Improving Public Health Responses to extreme weather/heatwaves), which also aimed to develop a standardized definition of a HW event to be applied across cities in the subsequent analyses [
24]. This objective approach also included a methodology for classifying a HW in terms of its characteristics, such as intensity, duration and timing within the season. However, as reported in a recent review [
25], many other HW definitions are available and the most appropriate choice should be based on the context of the study and the sector (i.e., health, infrastructure, agriculture, etc.) potentially affected by HWs. This latter aspect is of particular importance also because the environmental heat stress has reduced the labor capacity to 90% in peak months over the past few decades [
26].
In this study, the HW trends during the warmest period of the year (May–September) were investigated using a slightly improved version of the EuroHEAT HW definition applied on long historical time-series (36-year period, 1980–2015) of daily meteorological data collected by weather stations located in the capitals of the 28 European Union member countries. Furthermore, comparisons between two 18-year sub-periods (1980–1997 vs. 1998–2015) were carried out, and a city-specific HW hazard index (HWHI) was assessed by simultaneously capturing the main HW characteristics, such as the number of HW days, the duration, intensity (magnitude) and timing of the HWs (intra-seasonal precocity).
The results from this study are especially relevant for providing useful information for local authorities, urban planners and policy-makers in general, who should work to allocate resources to support environmental actions aimed at mitigating the urban microclimate and improving household thermal comfort conditions, particularly during the warmest period of the year. These interventions are fundamental particularly in light of potentially strong heat impacts due to global warming already predicted in most European cities [
27] and the predicted increase, from a factor of 5 to 10, in the frequency of a European mega-HW in the next 40 years, such as the one experienced in Europe in 2003 [
7].
2. Experiments
Daily meteorological data were collected in the capitals of the 28 member countries of the European Union over a 36-year period (1980–2015) by using weather stations available in the Global Surface Summary of the Day (GSOD) dataset produced by the National Climatic Data Center (NCDC) [
28]. The 28 European cities included in this study are characterized by different climatic conditions and fall into three of the five main groups of the Köppen climate classification scheme [
29]. Most cities (68%) are characterized by temperate/mesothermal climates: ocean climate (Cfb) (Amsterdam, Berlin, Bratislava, Brussels, Budapest, Copenhagen, Dublin, London, Ljubljana, Luxembourg, Paris, Prague, Vienna and Zagreb) and Mediterranean climate (Csa) (Athens, Valletta, Lisbon, Madrid and Roma). Almost 30% of the cities have continental/microthermal climates: hemiboreal climate (Dfb) (Helsinki, Riga, Sofia, Stockholm, Tallinn, Warsaw and Vilnius) and continental climate (Dfa) (Bucharest). Only one city is included in the group dry semiarid climate (Bsh) (Nicosia).
For each European city included in this study, HWs were defined over the 1980–2015 period and during the warmest time of the year (from 1 May to 30 September), by using a slightly improved version of the EuroHEAT HW definition [
23]. In particular, HWs were defined as periods of at least two days with a maximum apparent temperature (ATmax) exceeding the 90th percentile centered on a 31-day window, or periods of at least two days in which the minimum temperature (Tmin) exceeds the 90th percentile and the ATmax exceeds the median value centered on a 31-day window. In this study, the EuroHEAT HW definition was further enhanced by taking into account a 31-day smoothed climate reference window rather than a fixed monthly value as reported in the original HW classification version. The ATmax was assessed by using the “Apparent Temperature (AT)” index formula (AT = 0.89T + 0.382e − 2.56) based on air temperature (T, °C) and water vapor pressure (e, hPa) formulated in Steadman’s studies [
30,
31]. The variable “e” in this study was calculated from the air temperature (T, °C) and the relative humidity (rh, %) according to the following equation:
HW characteristics within the warmest period of the year were assessed following the method described in D’Ippoliti et al. [
24]. In this way, long (short) HWs were calculated if the duration was equal to or longer (shorter) than the median value of HW duration. High (low) intensity HWs were assessed if the average ATmax during HW days was equal to or above (below) the ATmax 95th percentile centered on a 31-day window. The timing in the season of the first simultaneously long and high-intensity HW was also identified.
In particular, four HW hazard characteristics were assessed during the warmest period of the year during the 1980–2015 period:
the number of HW days (HWD);
the number of long HWs (HWL);
the number of high-intensity HWs (HWI);
the timing of the first simultaneously long and high-intensity HW (HWT).
City-specific linear trend analyses of the HW hazard characteristics were carried out by using specific packages written in R-language [
32], such as “trend” (Non-Parametric Trend Tests and Change-Point Detection) [
33] and “EnvCpt” (Detection of Structural Changes in Climate and Environment Time Series) [
34]. Both R-packages are useful tools for climate and environmental data analyses and in particular, for trend detection in a non-parametric manner (Mann-Kendall Trend Test) and change-point analysis taking into account time-series autocorrelation. For each HW characteristic, city-specific trend slopes and the associated statistically significance (
p value) were reported.
Following, comparisons between the median values of the four HW hazard characteristics identified on two 18-year sub-periods (1980–1997 vs. 1998–2015) were carried out through the non-parametric Kruskal Wallis Test [
35]. Furthermore, a city-specific HW hazard index (HWHI) was assessed during the warmest period (May–September) of both the 18-year sub-periods, capturing the simultaneous effect of HW
D, HW
L, HW
I and HW
T. In addition, HW
T was also combined with the frequency of years with at least one simultaneously long and high-intensity HW (HW
T(%)). A standardization procedure was used to obtain each HW hazard variable on the same scale (0 to 1) by dividing each hazard value of an individual variable by the variability range among all the cities. The following step was the combination of the standardized HW hazard variables through a weighting procedure. To avoid subjective manipulation, all weightings were kept equal (each HW hazard variable weighted at 25%):
Therefore, the HWHI represents a metric which, by incorporating all the HW hazard characteristics, provides an appropriate risk score for a simple and synthetic graphical representation of the whole set of risk components related to the HW.
The final HWHI mapping visualizations referred to the 1980–1997 and 1998–2015 sub-periods were created by splitting the HWHI into five equal risk-levels: very low (0.0 < HWHI ≤ 0.2), low (0.2 < HWHI ≤ 0.4), moderate (0.4 < HWHI ≤ 0.6), high (0.6 < HWHI ≤ 0.8), and very high (0.8 < HWHI ≤ 1.0). Moreover, a map of the city-specific percentage change of the HWHI in the sub-period 1998–2015 compared with the sub-period 1980–1997 was provided. All maps were developed by using specific cartographic R-packages such as “leaflet” (Create Interactive Web Maps with the JavaScript “Leaflet” Library) [
36], “cartography” (Thematic Cartography) [
37], “rworldmap” (Mapping Global Data) [
38] and “maptools” (Tools for Reading and Handling Spatial Objects) [
39]. These R-packages are useful tools for manipulating and reading geographic data and creating interactive maps.
The results shown follow the geographical scheme provided by the United Nation Statistics Division [
40] which groups together all the European countries in four geographic areas: northern, western, eastern and southern Europe. Data and code are available in work public github repository [
41].
3. Results
The median number of HW
D during the 36-year period (1980–2015) and in the warmest period of the year was the highest in western and eastern EU capitals (
Table S1), with the highest values (18 HW
D) in Amsterdam and Berlin, followed by northern (15 HW
D) and southern cities (14 HW
D) cities, with the minimum value in Athens (12 HW
D). However, the highest absolute values of AT
max and T
min during HW
D were observed in southern cities with median values of 37 °C and 20 °C respectively, followed by eastern (AT
max = 34 °C and T
min = 16 °C), western (AT
max = 32 °C and T
min = 16 °C) and northern (AT
max = 28 °C and T
min = 14 °C) cities. The median number of HW
L ranged between 2 in northern and southern capitals and 3 in western and eastern capitals. The median number of HW
I was always 1 in all cities.
The frequency of years characterized by at least one simultaneously long and high-intensity HW was the highest in western and eastern EU capitals (64%), typically occurring at the end of June. The lowest frequency was observed in southern capitals (55%) which also showed the late HW
T, corresponding to the first decade of July (
Table S1). On the other hand, northern capitals revealed an earliness of the HW
T, generally occurring at the beginning of the third decade of June.
3.1. City-Specific Trend Analyses of HW Hazard Characteristics
Most EU capitals showed positive linear trends of HWD, HWL and HWI and negative trends of HWT, which means an increasing earliness in the occurrence of the first simultaneously long and high-intensity HW during the warmest period of the year. These trends were often statistically significant when HWD and HWL were considered, especially in cities located in the eastern and southern European countries. On the other hand, only 39% and 32% of all the cities studied revealed significant trends in the case of HWI and HWT respectively.
3.1.1. Northern EU Capitals
Most of the northern cities (6 out of 8 capitals) revealed non-statistically-significant linear variations of all (Riga and the two northwestern cities: Dublin and London) or the majority (Stockholm, Helsinki and Vilnius) of the HW hazard characteristics (
Table 1). Only two capitals revealed statistically significant changes of most (Tallinn) or half (Copenhagen) of the HW indicators. In particular, considering the few statistically significant city-specific slopes, average increases of 2.2 (±0.2), 0.3 (±0.0) and 0.4 (±0.1) days/5-year were observed for HW
D, HW
L and HW
I respectively. No significant changes were observed for HW
T that generally showed positive trends, meaning a delay in the occurrence of the first simultaneously long and high-intensity HW (
Table 1).
3.1.2. Western EU Capitals
Half of the western capitals (Paris, Brussels and Amsterdam) revealed no significant changes in the HW indicators. Conversely, the other half of the western cities, and in particular the most easterly among the western EU capitals (Luxembourg, Berlin and Vienna), revealed statistically significant changes of most of the HW indicators (
Table 2). Considering the statistically significant city-specific slopes, average increases of 2.3 (±0.8), 0.4 (±0.1) and 0.4 (±0.1) days/5-year were observed for the HW
D, HW
L and HW
I respectively. Vienna was the only city that showed significant variations in all the four HW hazard indicators, also revealing a significant decrease in the HW
T: an increased earliness (early date) was observed in the occurrence of the first simultaneously long and high-intensity HW during the warmest period of the year of about 26 days/5-year (
Table 2).
3.1.3. Eastern EU Capitals
Almost all the eastern EU capitals showed statistically significant changes of most (Warsaw and Sofia) or half (Prague, Budapest and Bucharest) of the HW indicators (
Table 3). Bratislava was the only exception: no significant changes in the HW indicators were observed. Considering the statistically significant city-specific slopes, average increases of 2.8 (±0.8), 0.5 (±0.1) and 0.3 (±0.2) days/5-year were observed for the HW
D, HW
L and HW
I respectively. Budapest also revealed a significant decrease of the HW
T by about 22 days/5-year.
3.1.4. Southern EU Capitals
Most of the southern EU capitals (5 of 8 capitals) revealed statistically significant changes in all (Ljubljana and Zagreb) or half (Rome, Athens and Nicosia) of the HW indicators (
Table 4). Exceptions were represented by the most westerly cities (Lisbon and Madrid) and the capital of Malta (Valletta). In particular, while no HW indicators showed significant variations for Lisbon and Valletta, an opposite behavior of the HW
I slope with respect to all the other cities was shown in Madrid: a significant decrease in the HW
I by 0.3 days/5-year was observed. In the other southern EU capitals and only considering the statistically significant city-specific slope rises, average increases of 3.6 (±1.1 SD), 0.5 (±0.3) and 0.4 (±0.1) days/5-year were observed for the HW
D, HW
L and HW
I respectively. In addition, an average significant decrease in the HW
T by about 29 (±9) days/5-year in Ljubljana and Zagreb was observed.
3.2. City-Specific HW Hazard Characteristics and HWHI Comparisons Between Two 18-Year Sub-Periods (1980–1997 vs. 1998–2015)
HW
D generally increased from the sub-period 1980–1997 to the sub-period 1998–2015 in most of the EU capitals (
Table 5,
Table 6,
Table 7 and
Table 8). These HW
D increases were statistically significant in 64% of cities, and in particular in all eastern (
Table 7), most of southern (
Table 8) and half of northern (
Table 5) and western (
Table 6) EU capitals. However, three cities showed an opposite pattern: no HW
D changes between the two 18-year sub-periods were observed in Paris (
Table 6) and non-significant HW
D decreases were found in Lisbon, which even more pronounced in Madrid (
Table 8).
The majority of the EU capitals also showed HW
L increases (in 61% of cities it was statistically significant) in the sub-period 1998–2015 when compared with the previous 18-year sub-period (
Table 5,
Table 6,
Table 7 and
Table 8). However, two northern (Dublin and Riga), two western (Paris and Amsterdam) and one southern (Lisbon) EU capitals did not reveal any HW
L changes (
Table 5,
Table 6 and
Table 8) and a non-significant decrease was also observed in Madrid (
Table 8).
Even though the HW
I also increased in most of the EU capitals, it was statistically significant in only 39% of the cities (
Table 5,
Table 6,
Table 7 and
Table 8). Madrid, instead, showed an opposite situation (
Table 8): a significant decrease in HW
I was observed from the sub-period 1980–1997 to the sub-period 1998–2015. Although non-statistically significant, HW
I reductions were also observed in Helsinki and Amsterdam. Other cities revealed no HW
I changes between the two 18-year sub-periods: most of them located in northern Europe and the capitals of the Mediterranean islands (Malta and Cyprus).
Significant changes in the timing of the HW
T were only observed in three southern EU capitals (
Table 8) (Madrid, Ljubljana and Zagreb) and in Vienna (
Table 6): a greater precocity in the timing of the first simultaneously long and high-intensity HW was observed in the sub-period 1998–2015 compared to the previous 18-year sub-period. The other cities revealed non-statistically significant HW
T changes (
Table 5,
Table 6,
Table 7 and
Table 8). An early occurrence of HW
T was observed in most of the western (with the exception of Brussels and Amsterdam) (
Table 6), eastern (with the exception of Sofia and Bucharest) (
Table 7) and southern (with the exception of the Mediterranean islands) (
Table 8) EU capitals, generally from the first decade of July during the sub-period 1980–1997 until the third decade of June in the sub-period 1998–2015. Conversely, most of northern cities revealed a delay of HW
T in the sub-period 1998–2015 compared with the previous 18-year sub-period (excepting Vilnius) with a prevalence in the first decade of June in the sub-period 1980–1987 and the first and second decades of July during the sub-period 1998–2015 (
Table 5). Most of the cities also showed a general increase in the frequency of years in the sub-period 1998–2015 compared to the sub-period 1980–1997, with at least one simultaneously long and high-intensity HW. Exceptions were only represented by two northern (London and Helsinki), one western (Amsterdam) and two southern (Lisbon and especially Madrid) EU capitals, which revealed the opposite pattern.
The HWHI generally increased in the sub-period 1998–2015 compared to the previous 18-year sub-period in most of the EU capitals. Exceptions were represented by one northern (Dublin), one western (Amsterdam) and two southwestern (Lisbon and Madrid) cities, which revealed the opposite situation (
Table 5,
Table 6,
Table 7 and
Table 8).
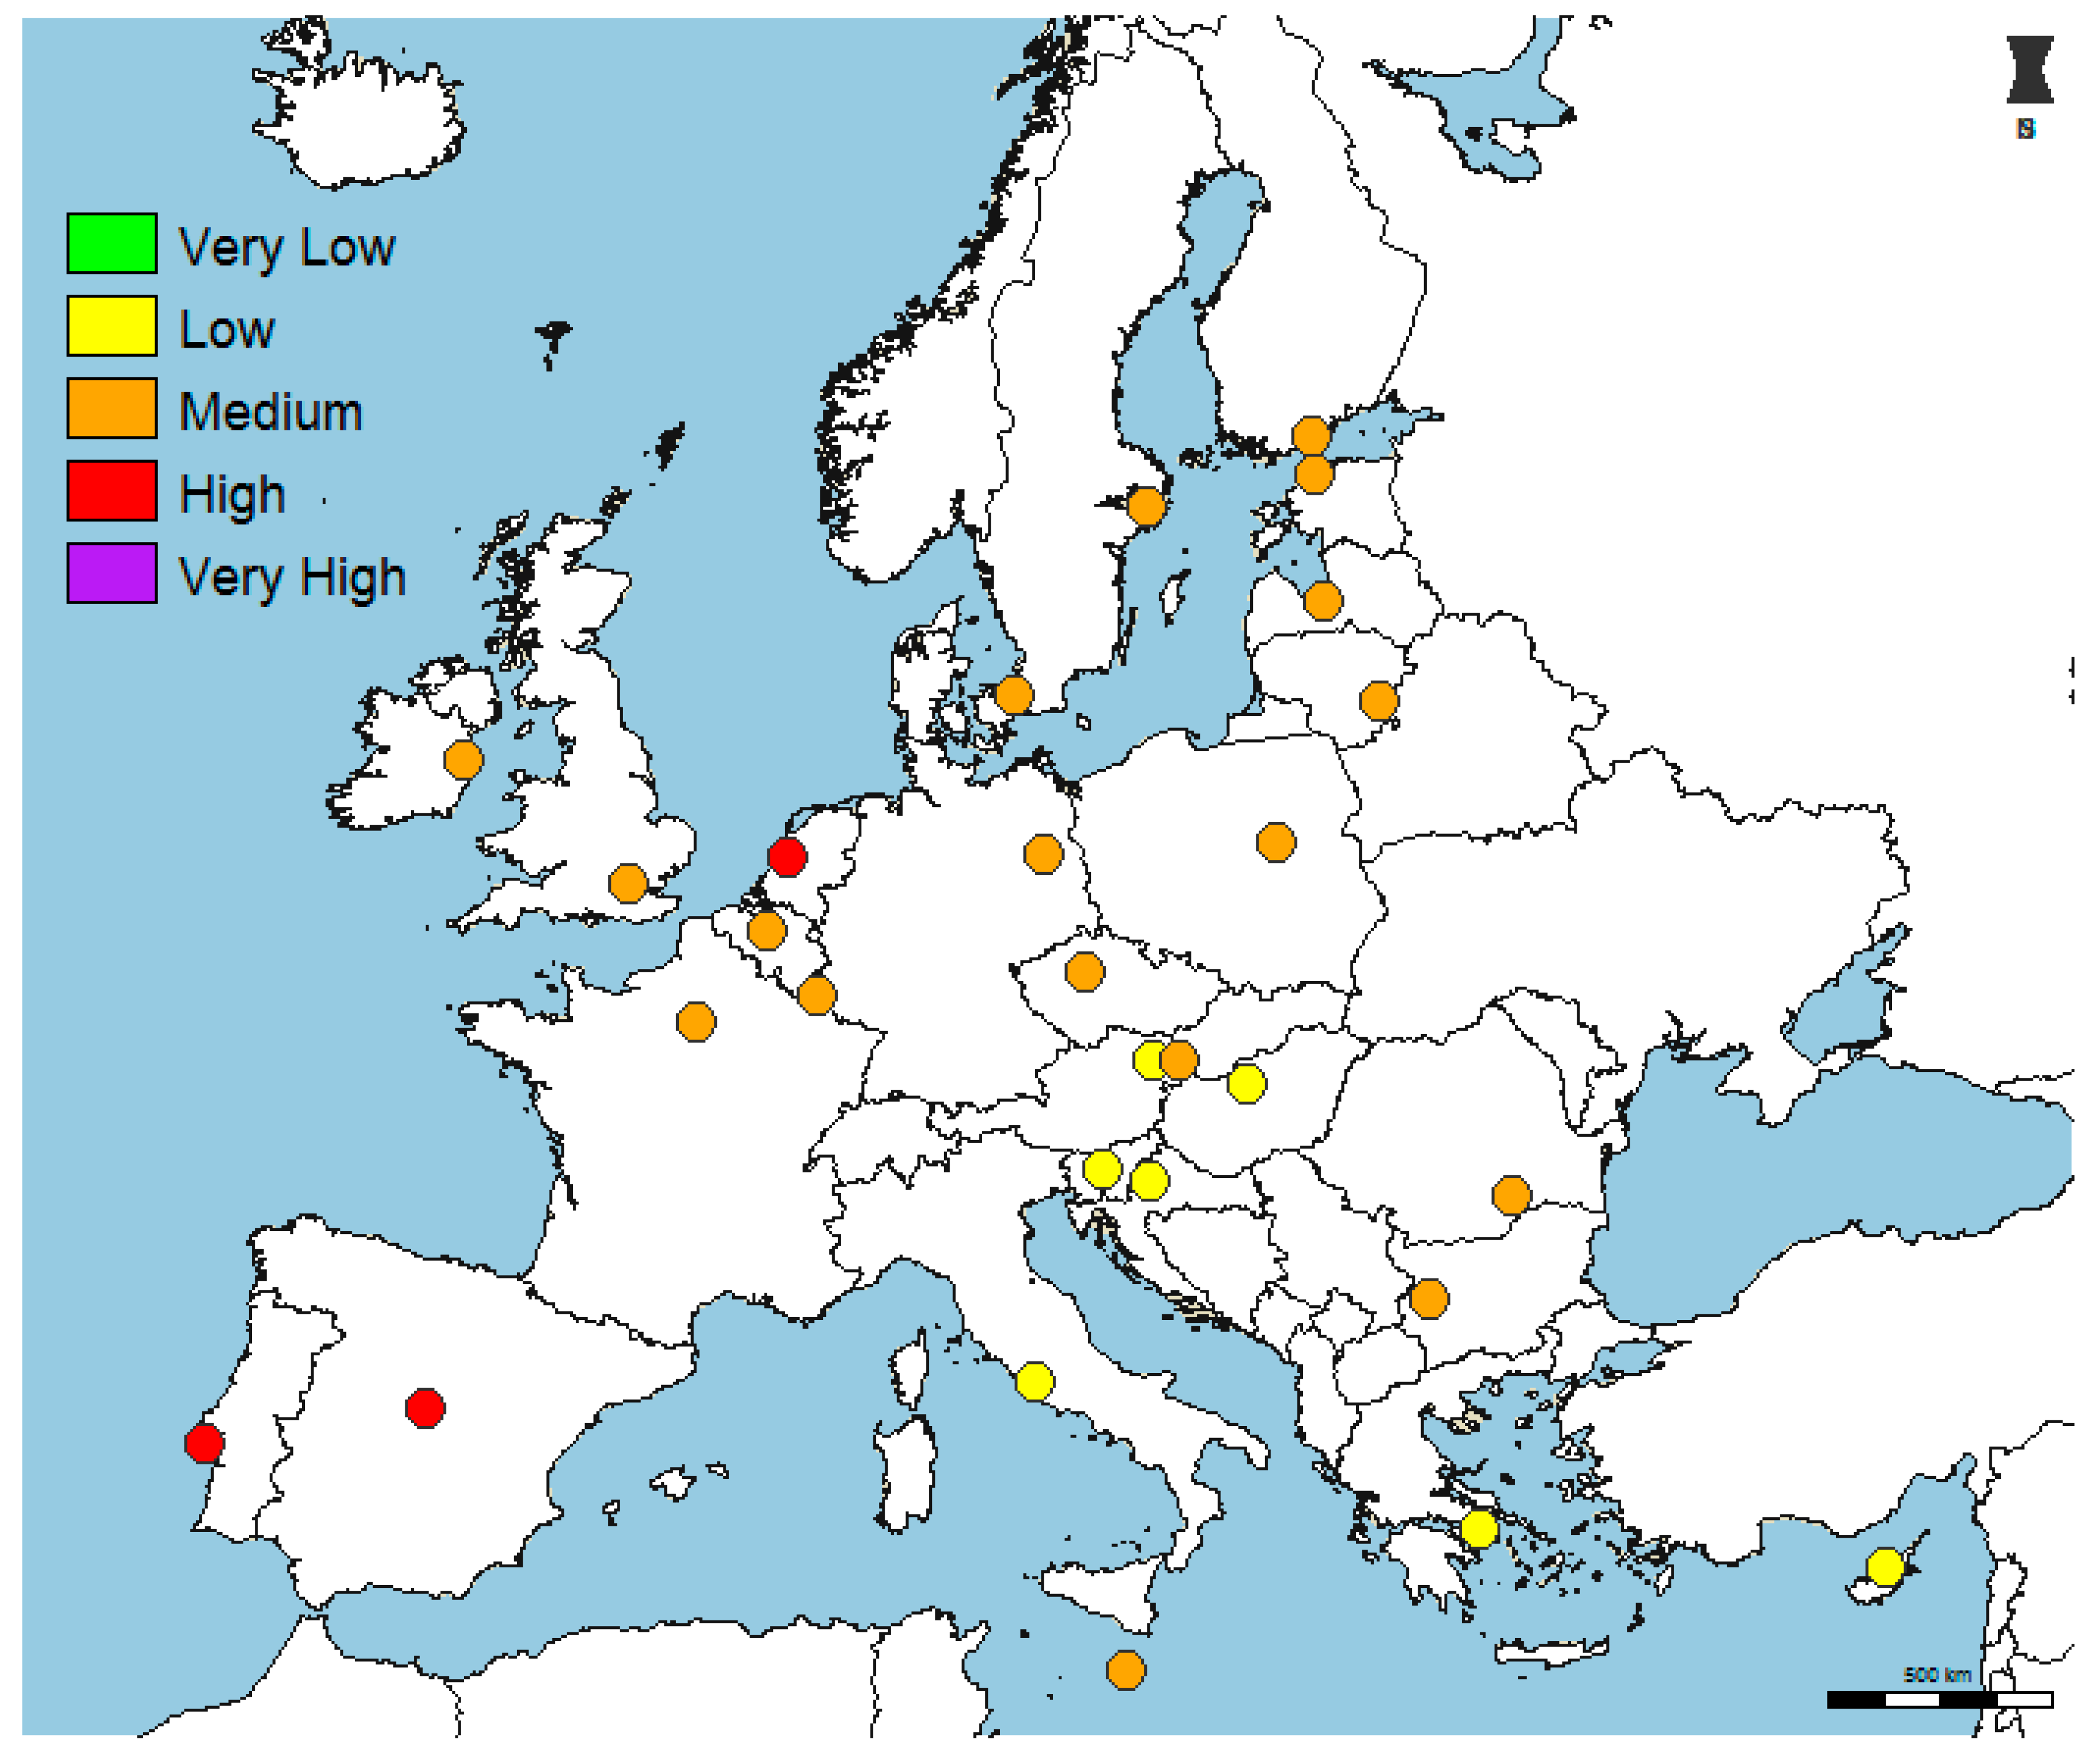
The HWHI risk-levels all over the EU capitals during the sub-periods 1980–1997 and 1998–2015 are shown in
Figure 1 and
Figure 2 respectively.
During the sub-period 1980–1997, the highest average HWHI values (among all the EU capitals of a specific European geographic area) were observed in northern (HWHI: 0.49, 95% CI: 0.47–0.52) and western (HWHI: 0.49; 95% CI: 0.38–0.59) European cities, followed by eastern (HWHI: 0.45; 95% CI: 0.41–0.49) and southern (HWHI: 0.40; 95% CI: 0.26–0.54) EU capitals. The average HWHI in southern EU capitals was found in the borderline area between low and medium HWHI risk-levels, while the other cities were found in the medium HWHI risk-level.
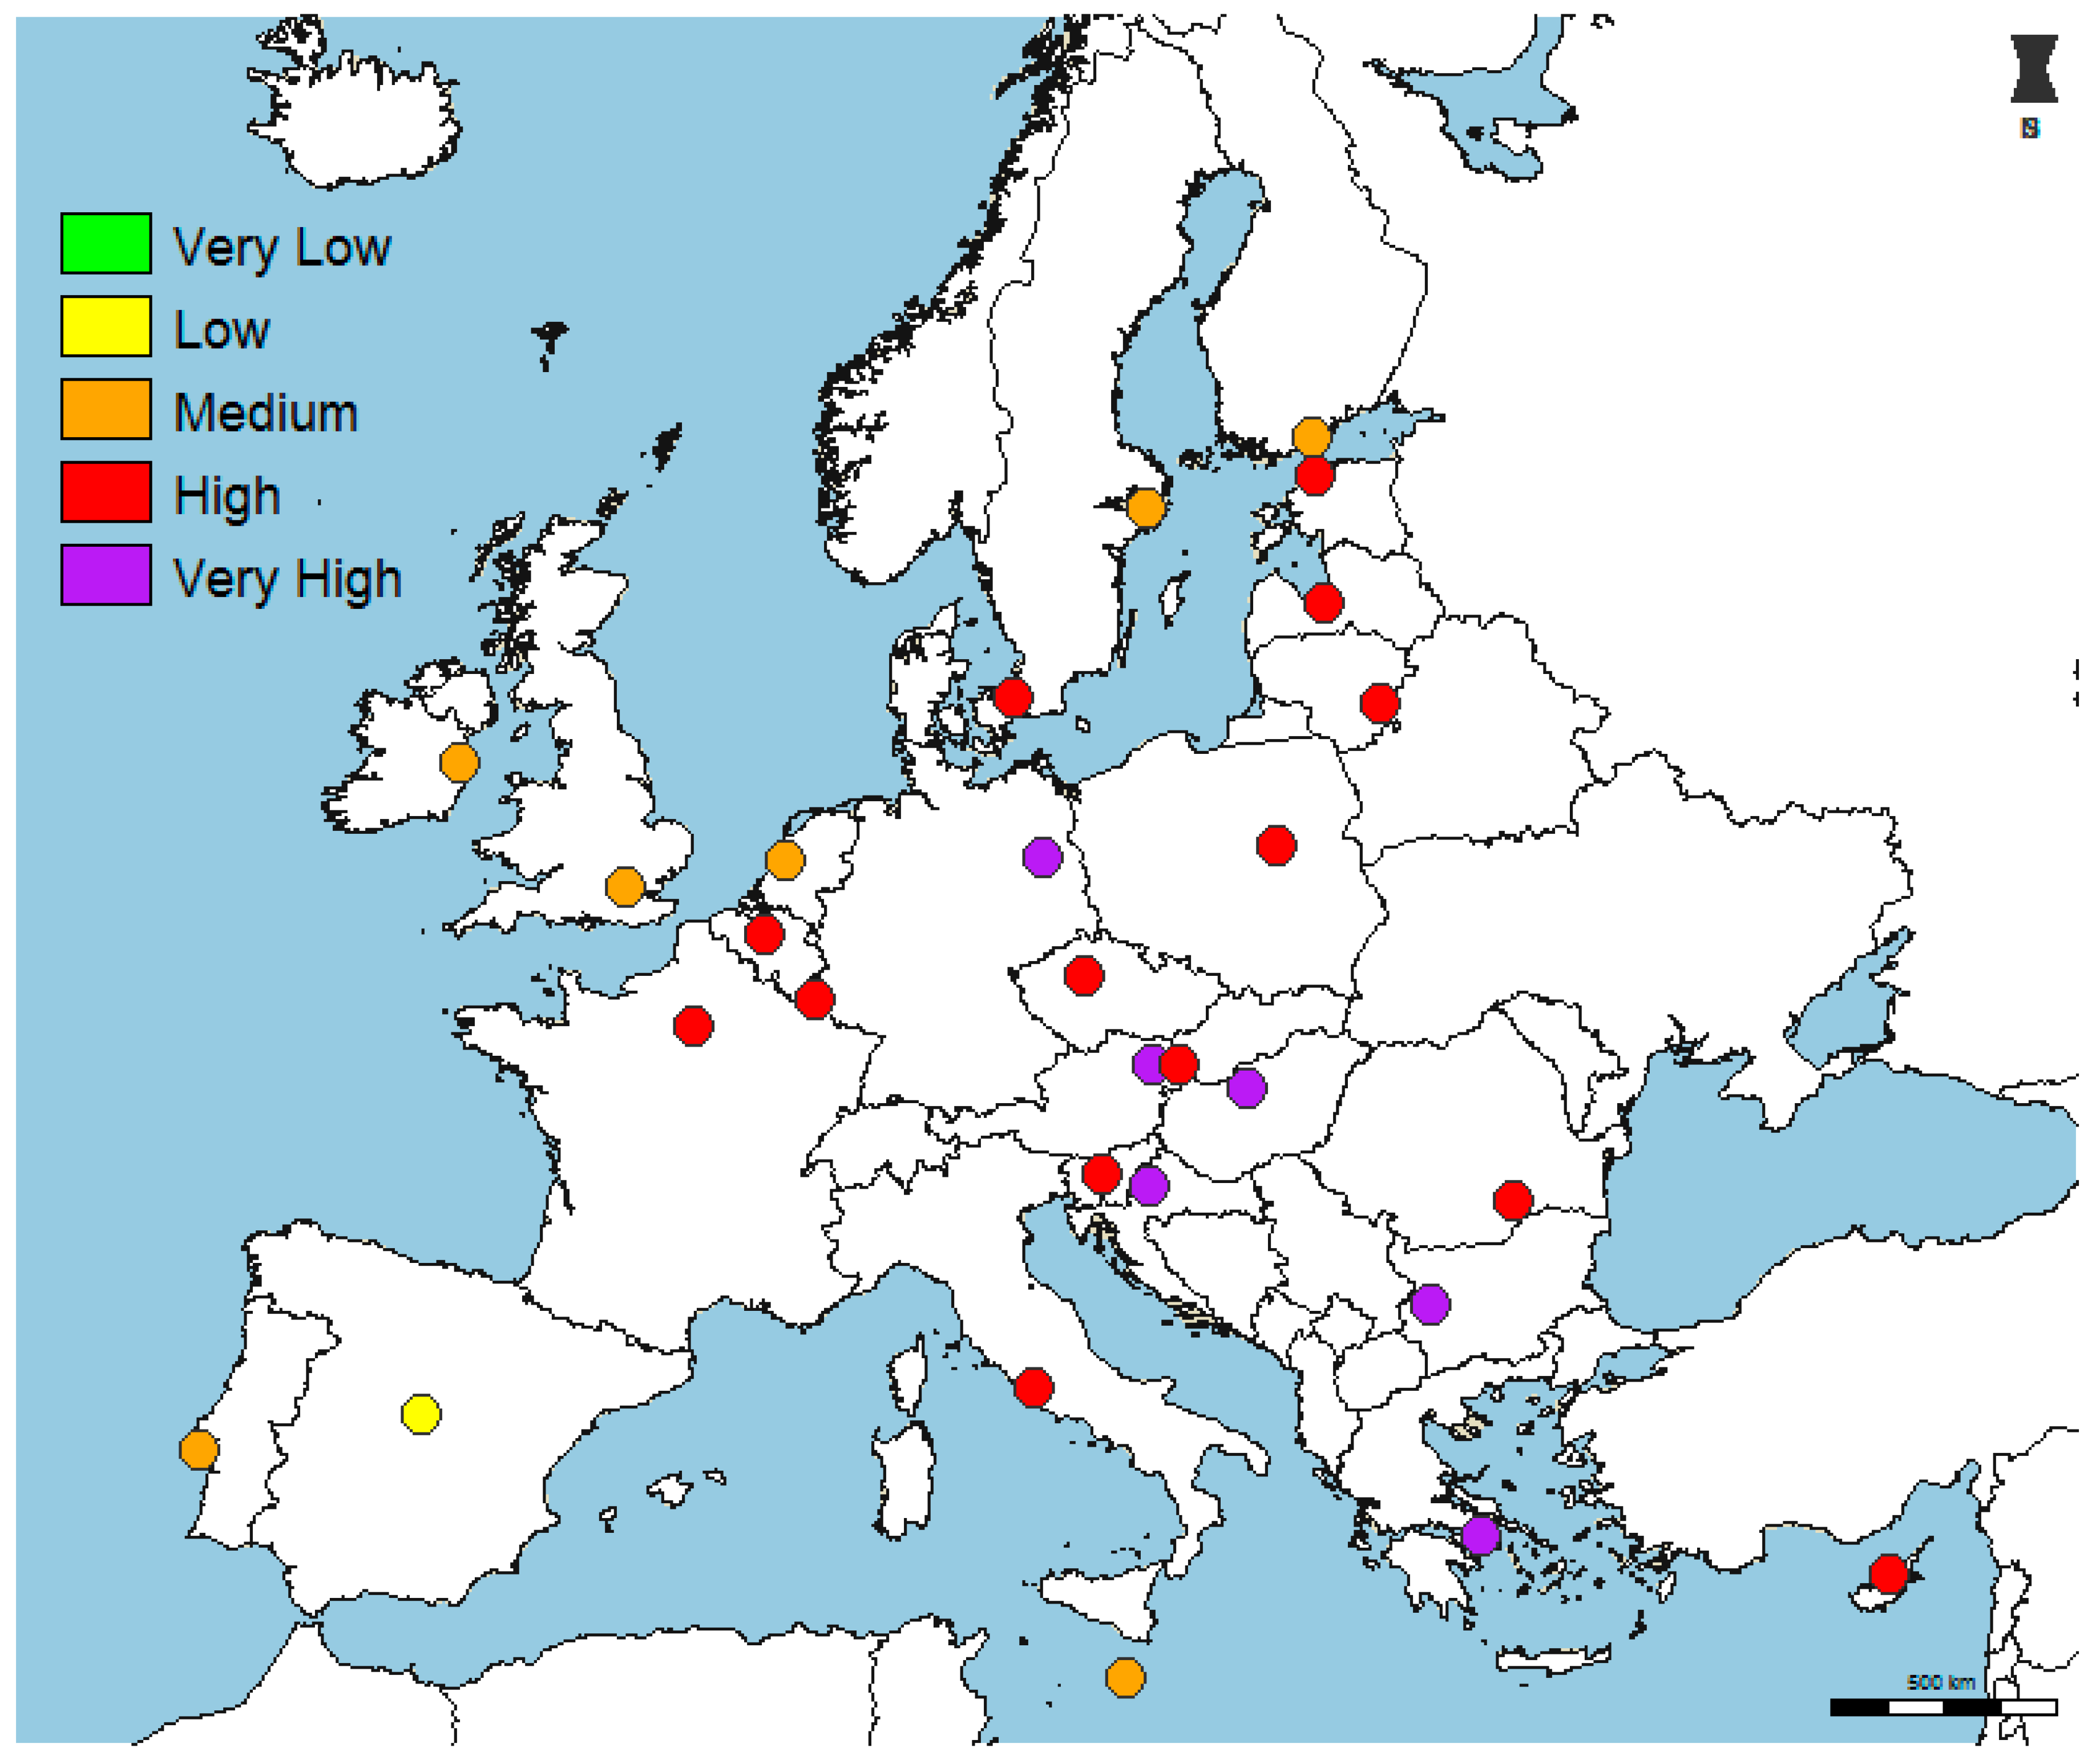
During the sub-period 1998–2015, the highest average HWHI value (among all the EU capitals of a specific European geographic area) was observed in eastern European cities (HWHI: 0.79; 95% CI: 0.69–0.89), that is, in the border area between high and very high HWHI risk-levels. The average HWHI values in western and southern European cities were 0.72 (95% CI: 0.58–0.86) and 0.65 (95% CI: 0.51–0.80) respectively, that are both high HWHI risk-levels. The lowest HWHI value was observed in the northern cities (HWHI: 0.60; 95% CI: 0.53–0.66) with a HWHI value found in the borderline area between medium and high HWHI risk-levels.
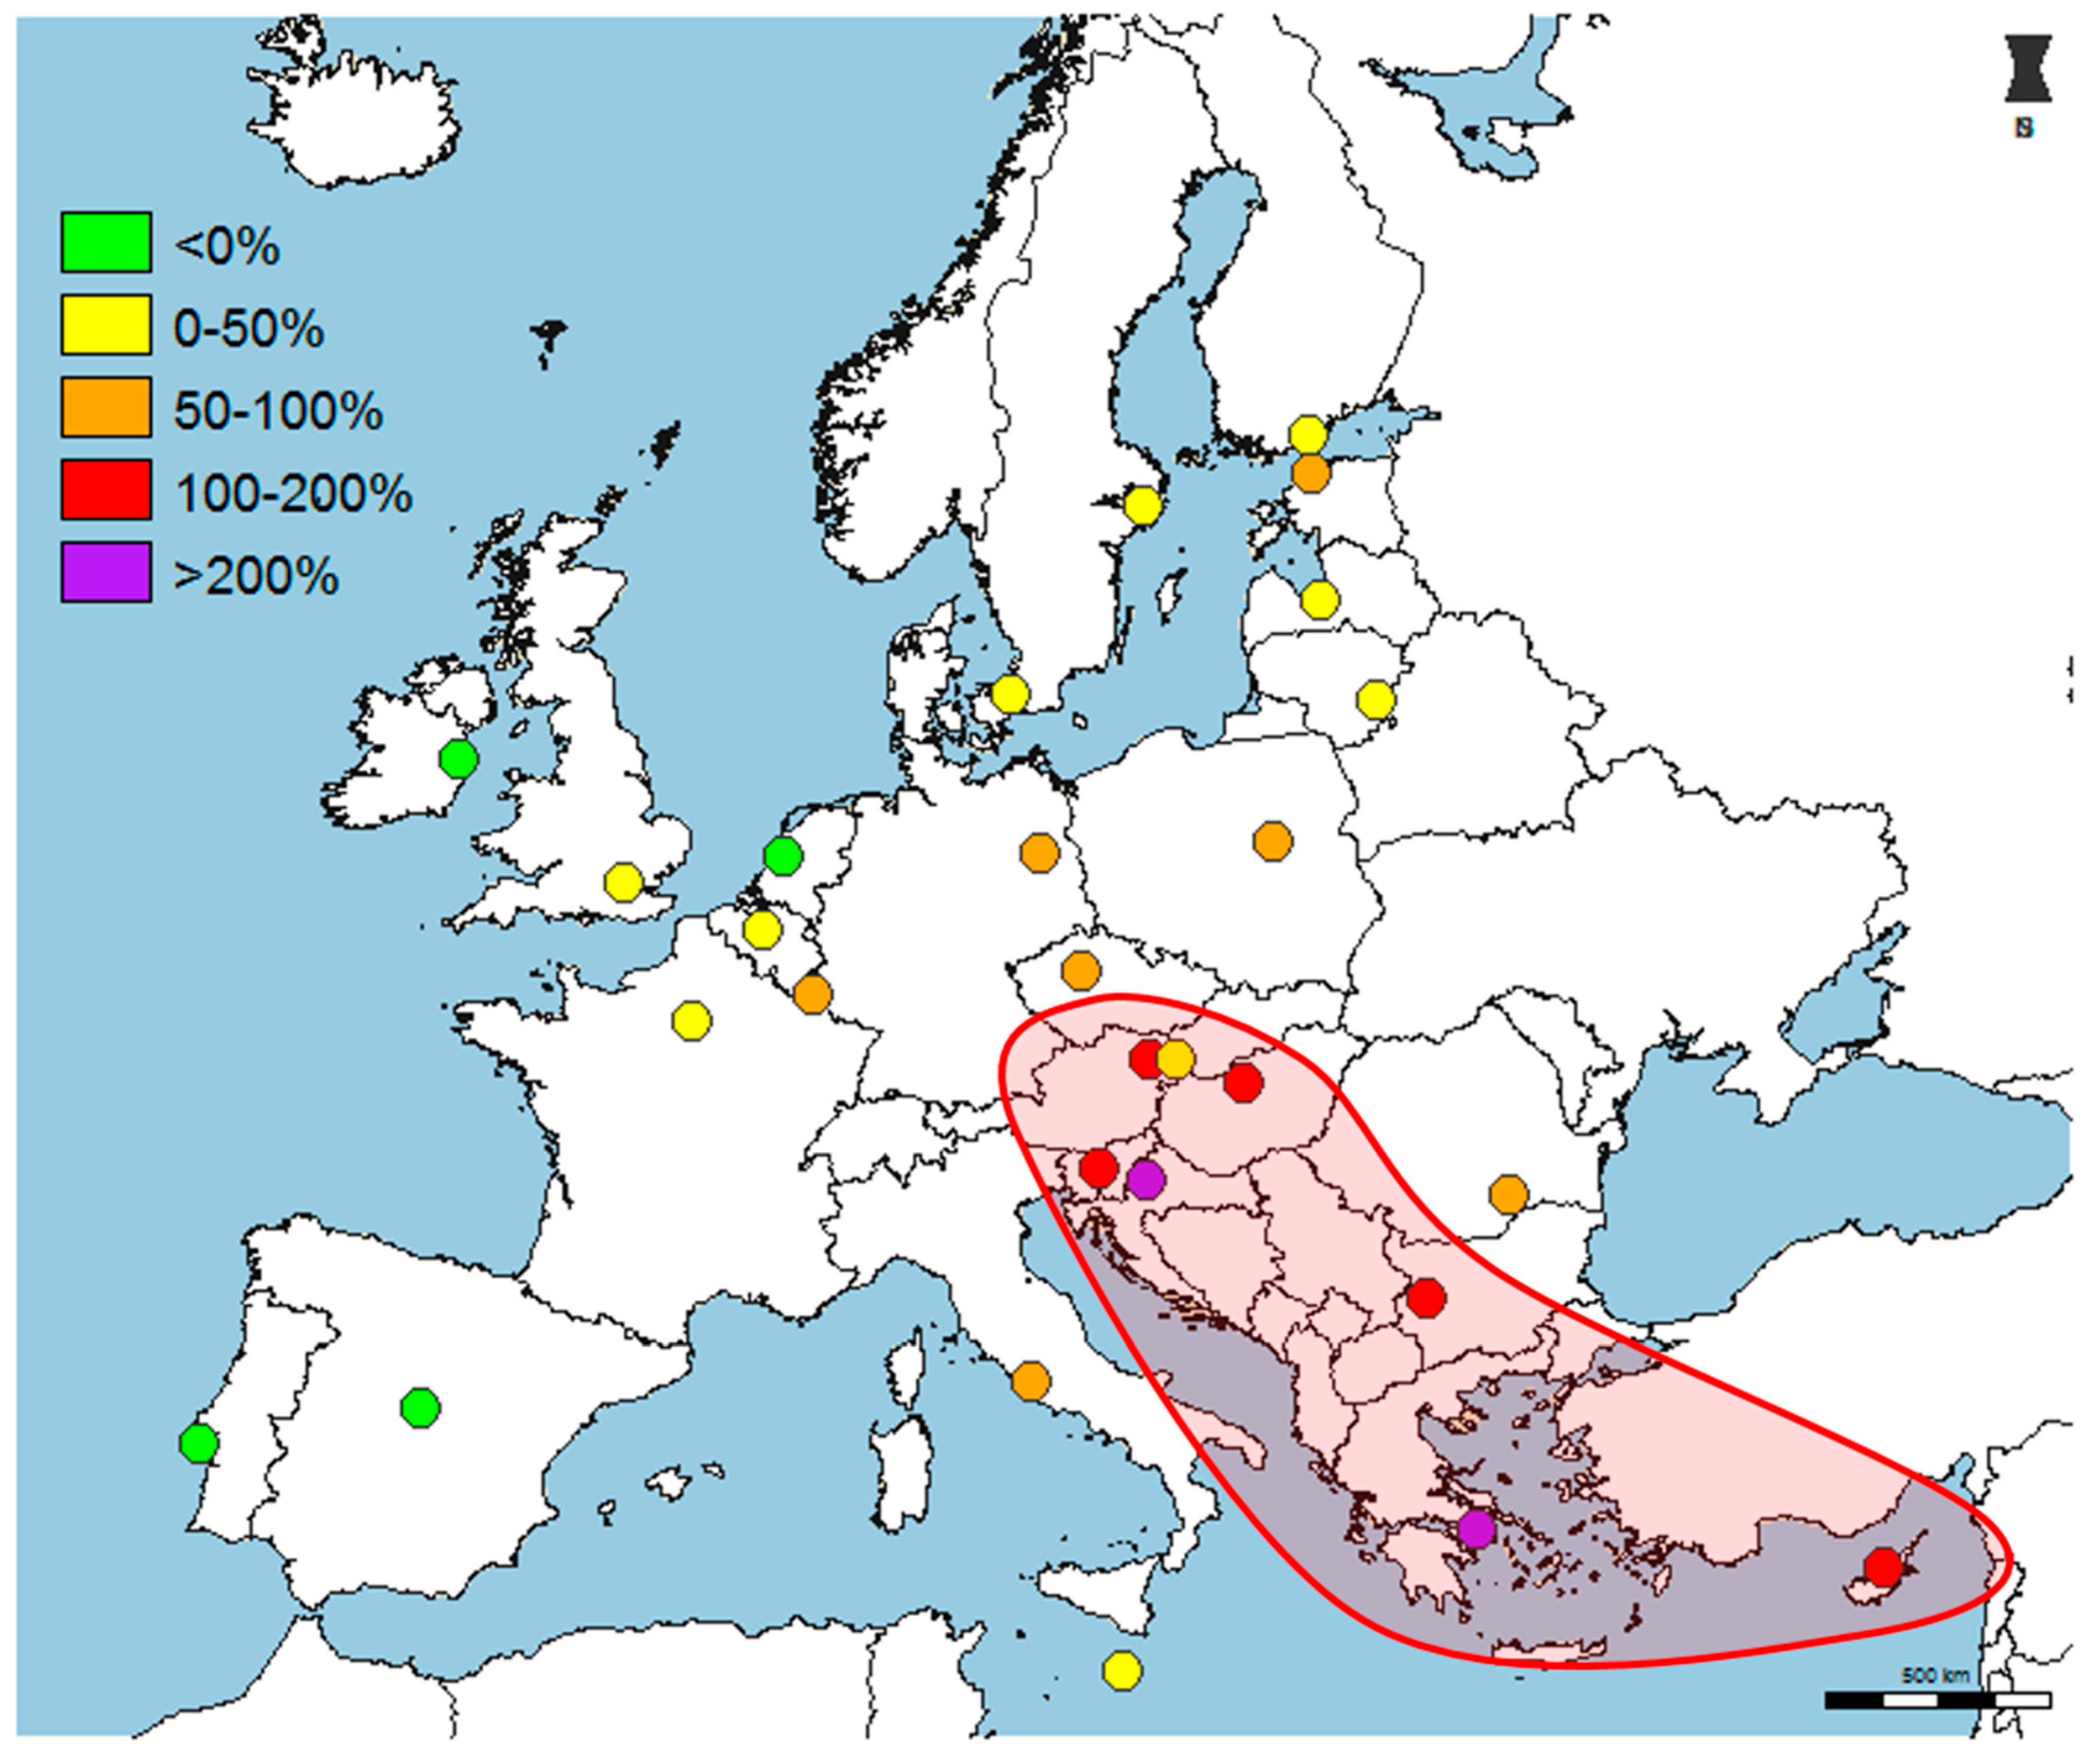
The city-specific percentage change in the HWHI during the sub-period 1998–2015 compared with the sub-period 1980–1997 is shown in
Figure 3. Decreases in HWHI were observed, especially in the two Southwestern capitals, with 10% and 43% HWHI decreases in Lisbon and Madrid respectively during the sub-period 1998–2015 compared to the previous 18-year sub-period. Small HWHI decreases (4%) were also observed in Dublin and Amsterdam (
Figure 3). Most of the northern EU capitals (6 out of 8 northern cities) revealed a small increase of the HWHI (0% ≤ HWHI% change < 50%). Small HWHI increases were also observed in two western (Paris and Brussels) cities, and one eastern (Bratislava) and one southern (Valletta) city. Moderate HWHI increases (50% ≤ HWHI% change < 100%) were observed in eastern and western cities generally, as well as in one southern (Rome) and one northern (Vilnius) city. High and very high HWHI increases only occurred in central-eastern and southeastern capitals (red area in
Figure 3): the HWHI more than doubled during the sub-period 1998–2015 in Vienna, Budapest, Ljubljana, Budapest, and Nicosia, and even more than tripled in Zagreb and Athens compared to the sub-period 1980–1997.
By using the average HWHI percentage change (among all the EU capitals of a specific European geographic area) the highest average HWHI increase in the sub-period 1998–2015 compared to the sub-period 1980–1997 was observed in the eastern European capitals (76%), followed by southern (63%) and western (47%) European cities. The lowest HWHI% increase was observed in northern EU capitals (22%).
4. Discussion
This study provides a useful framework offering better comprehension of the HWs trend patterns, based on ground meteorological data over the past 36 years (1980–2015) in the capitals of the 28 EU Member States. A baseline climate description of HWs for all the EU capitals has been provided. Although most of the cities studied revealed positive trends of the main HW characteristics and a general increased earliness (early date) in the occurrence of the most critical HWs, different temporal HW patterns were detected depending on the sub-period analyzed and the geographical features of the area investigated. Furthermore, an useful metric (the Heatwave Hazard Index) that incorporates the simultaneous effects of the main HW hazard characteristics into a single risk score, was proposed, thus allowing for a good synthesis suitable for a comprehensive graphical representation of the HW impact over the 28 EU Member State capitals.
The main findings of this study are:
Most of the 28 EU Member State capitals showed significant positive trends during the 36-year period (1980–2015) and changes between the two 18-year sub-periods (1980–1997 vs. 1998–2015) in both HWD and HWL. Conversely, less than half the capitals revealed significant trends and changes in HWI and even a lower percentage of cities disclosed significant variations in HWT.
Statistically significant trends of the HW hazard characteristics and substantial HWHI changes were found, especially in eastern and southern EU capitals (with the exception of the southwestern cities and the capital of Malta) and the most easterly among the western European cities (Luxembourg, Berlin and Vienna).
Vienna, Ljubljana and Zagreb showed significant trends and differences in all the HW hazard characteristics between the two 18-year sub-periods. In particular, positive trends and increases were found during the sub-period 1998–2015 compared with the sub-period 1980–1997 when HWD, HWL and HWI were considered. Conversely, significant negative trends of HWT were observed, meaning an increased earliness in the occurrence of the first simultaneously long and high intensity HW (from the second decade of September in the sub-period 1980–1997 to the second or third decades of June).
Two completely different city-specific HWHI risk-level European patterns were detected during the two 18-year sub-periods (1980–1997 and 1998–2015). In particular, the highest HWHI values were observed in the two southwestern capitals (Lisbon and Madrid) and in general, in most of the northern and western cities during the sub-period 1980–1997; the highest HWHI values were observed in most of the central-eastern and southeastern EU capitals in the sub-period 1998–2015.
Central-eastern and southeastern EU capitals revealed the highest HWHI increase during the sub-period 1998–2015 compared to the previous 18-year sub-period. Conversely, only minor HWHI increases were observed in most of the northern EU capitals and opposite situations were even observed in two northern cities (Dublin and Amsterdam) and especially in the two southwestern capitals (Lisbon and Madrid).
The significant trends of HW
D and HW
L revealed in most of the 28 EU Member States capitals are in agreement with previous studies carried out in other parts of the globe where adequate and consistent data exist. The number of HW
D increased each decade between 1950–2010 in most of North America, Europe, Central and East Asia, and Australia [
42,
43], with variations at a regional level.
Our results also confirmed the positive trends in the occurrence of HWs reported in previous studies carried out in several European regions [
44,
45]. Furthermore, the IPCC Special Report on Extreme Events [
17] reported that major increases in the frequency of HWs in Europe occurred with high confidence in the Mediterranean region and medium confidence over North and Central Europe.
Based on our results, and only accounting for the cities in which statistically significant trends over the 36-year period were observed, it is plausible to assume that by 2020 the HWD and HWL in EU Member States capitals will change as follows:
the number of HW days will increase by 3.8 (southern EU capitals), 3.0 (eastern), 2.5 (western) and 2.4 (northern) during the warmest months;
the number of long HWs will increase by 0.8 (eastern EU capitals), 0.7 (western and southern) and 0.6 (northern) during the warmest months.
The lower frequency of EU cities showing statistically significant positive trends of HW
I (less than 50% of all EU capitals) should not be seen as a positive factor, because in Europe there are specific geographical areas (such as the EU capitals in western and eastern Europe) where half of the cities studied revealed significant increases in HW
I. This is in agreement with model results published by Meehl and Tebaldi [
46], which reported that besides the Mediterranean region, several western European regions (i.e., Germany) and the Balkans could see increases in HW intensity in the 21st century.
On the other hand, few studies [
47,
48] have investigated the effects of the onset of the first HW during the warmest period of the year, generally evidencing a greater impact on humans associated with HWs occurring earlier in the summer season. Very rarely has the timing of the first simultaneously long and high-intensity HW been analyzed. This latter situation certainly represents the worst condition, with potentially greater effects on the health of the population and the most vulnerable citizens. In this study, most of the capitals revealed an increased earliness of HW
T in Vienna and two Balkan capitals (Ljubljana and Zagreb). In particular, these three EU capitals revealed significant changes in all the HW hazard characteristics over the 1980–2015 period.
The HWHI changes observed between the two 18-year sub-periods revealed a substantial increase in HWs in EU capitals located in the eastern Mediterranean areas, central-eastern and southeastern cities. These results support previous studies were the authors found statistically significant positive trends in the intensity, number and length of HWs in summer in the eastern Mediterranean region, specifically the western Balkans [
49], and the entire Carpathian Region, in particular the Hungarian Plain [
50]. These studies identified these geographical areas as “Hot spots” of HW changes.
The opposite situation observed in two southwestern EU capitals, characterized by a decrease of the HWHI in the sub-period 1998–2015 compared to the sub-period 1980–1987, is partially in agreement with a previous study [
44], which revealed positive trends in the occurrence of HWs with the greatest trends observed especially over central and part of western Europe during the period 1880–2003, even if they were not significant and the lowest magnitude was in Portugal. In our study, both the southwestern EU capitals (in Portugal and Spain) showed the highest HWHI values during the sub-period 1980–1997. However, these capitals also revealed HWHI decreases during the sub-period 1998–2015 compared to a substantial HWHI increase observed in the central-eastern and southeastern EU capitals.
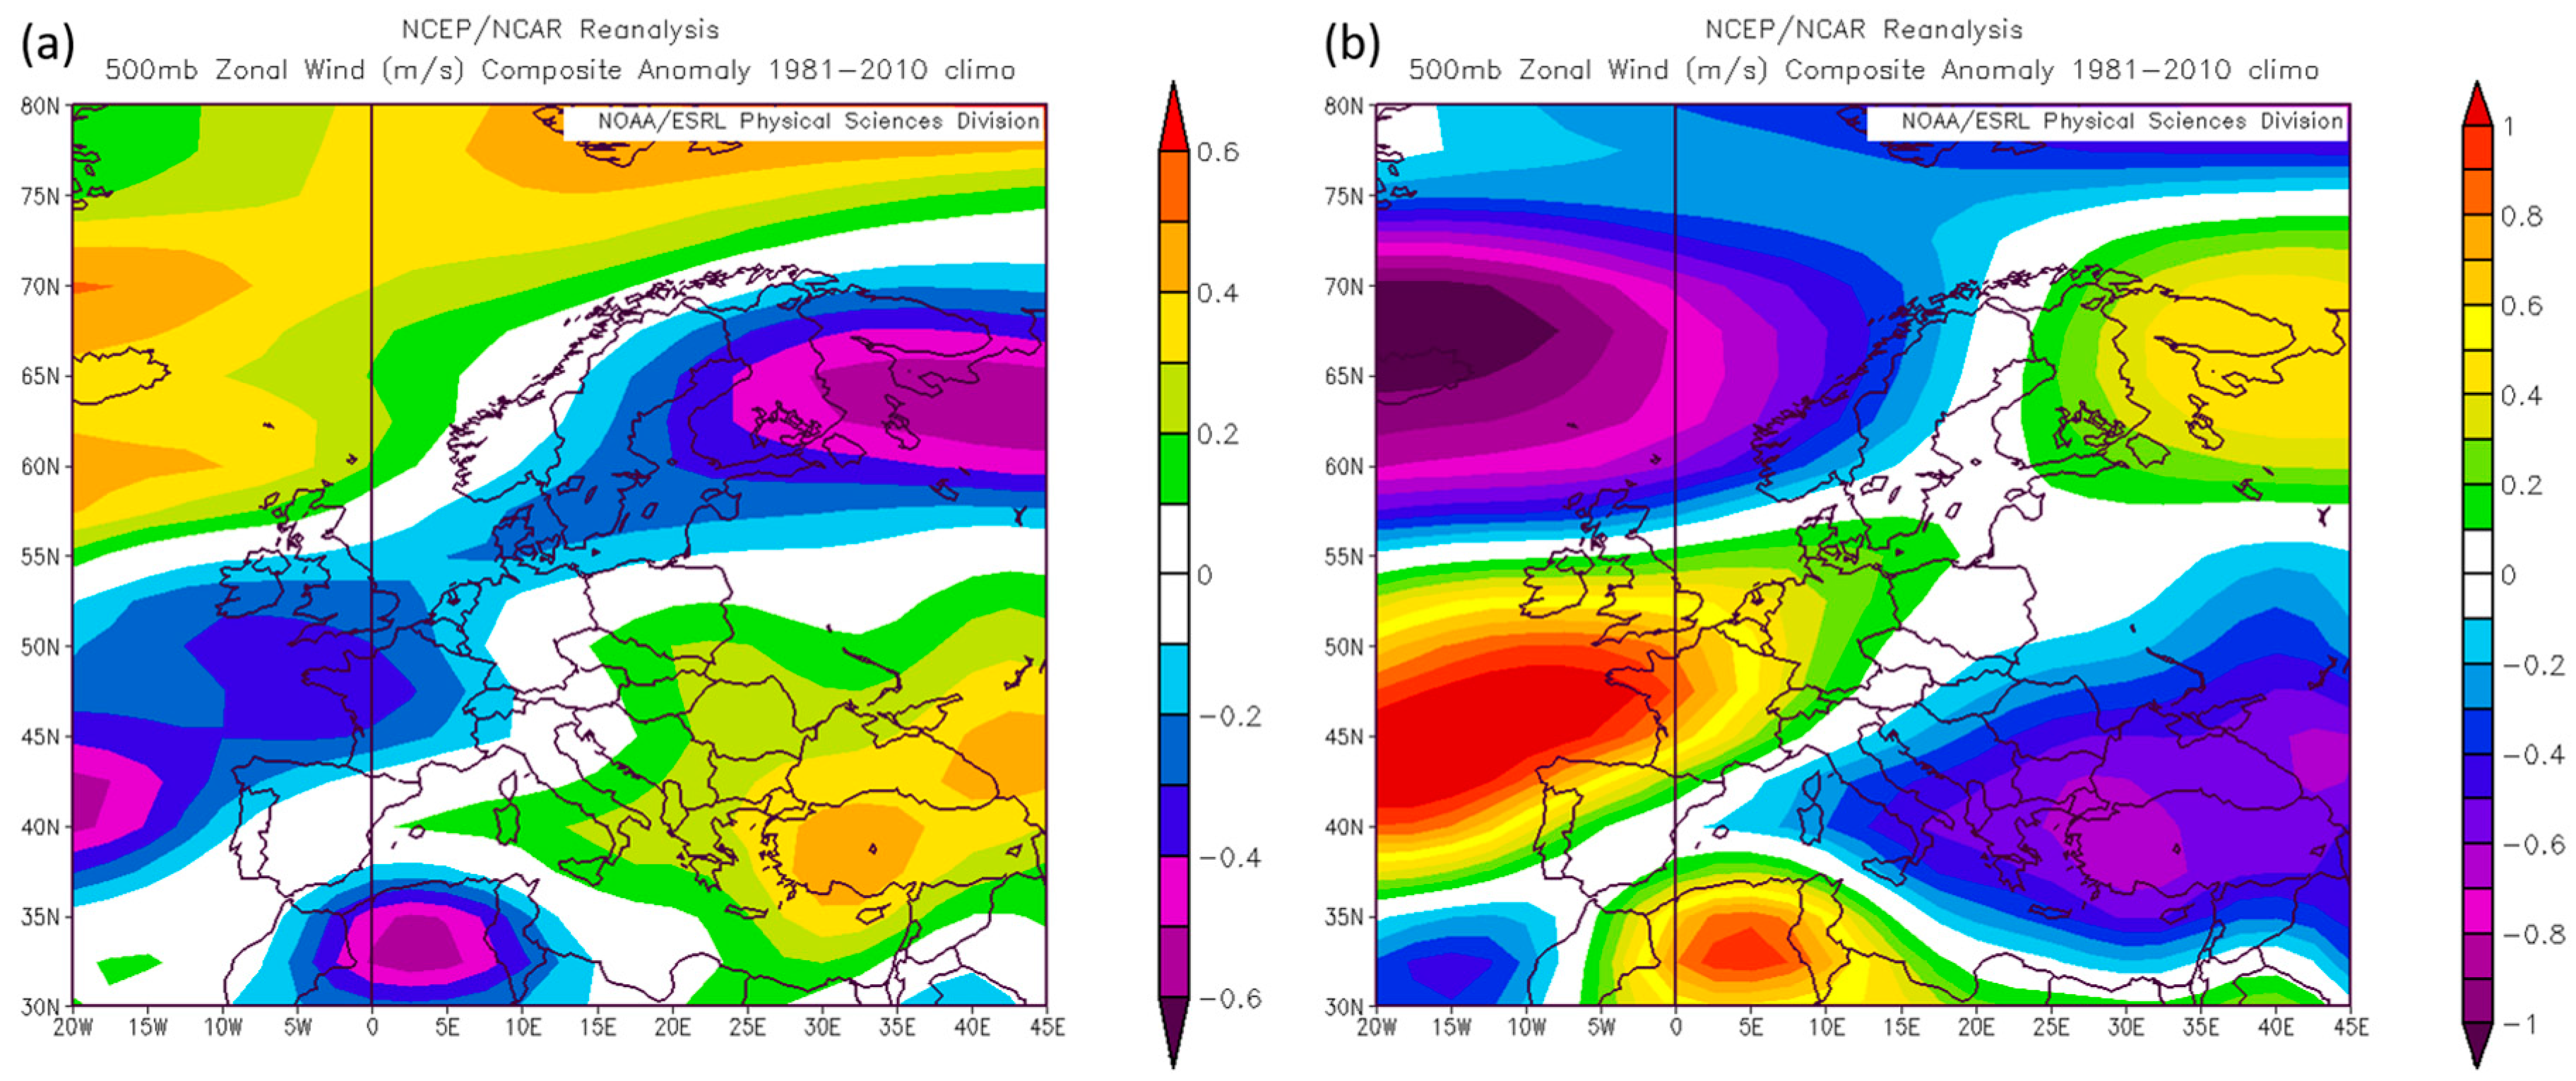
The substantially different HWHI patterns observed in our study during the two 18-year sub-periods in the capitals of the 28 EU Member States is probably the consequence of synoptic variability, also influenced by large scale forcing [
11,
51]. This is also confirmed in our study by the completely different synoptic patterns observed in the two 18-year sub-periods studied (
Figure 4).
In particular, a noticeable decrease (increase) in the 500 hPa zonal flux was observed over northern Europe (southeastern Europe) during the sub-period 1980–1997 (
Figure 4a). Conversely, a decrease (increase) in the 500 hPa zonal flux was observed over southeastern Europe and extreme northwestern Europe during the sub-period 1998–2015 (
Figure 4b). A decrease in the zonal winds seems to be associated with a longer persistence of high-pressure blocking situations [
53], which helps explain the different HWs characteristics observed over the southeastern Europe cities during the sub-period 1998–2015. The recently observed increases in the frequency and severity of HWs over Europe are partially related to the enhanced persistence of the atmospheric circulation patterns [
12,
46,
54,
55,
56]. In addition, other factors, besides atmospheric circulation changes, may also contribute to the intensification of the HWHI over southeastern (and central) Europe, such as the soil moisture deficit and air temperature feedback that can potentially create, or at least amplify, extreme temperature conditions and contribute to HWs [
57,
58].
A point of strength of this study is the approach used to calculate the HW, represented by the use of the HWHI, a metric that takes into account the simultaneous effect of all the HW hazard characteristics (the number of HW days, intensity, duration and timing of the first HW during the warmest period of the year) as defined by the EU project EuroHEAT. The HWHI allows for a close link with human wellbeing thanks to the use of a biometeorological approach and the Apparent Temperature index, which clearly describes the eventual specific regional climate features. In particular, the HWHI calculation includes the assessment of the daily maximum heat stress level and also considers the daily minimum air temperature that plays an important role in extreme heat events. Human wellbeing perception requires lower nighttime temperatures for physical and psychological recovery and when nighttime temperatures remain high, most people do not get relief from the heat and are unable to handle any extreme heat the following day [
22,
59,
60]. Furthermore, it must also be borne in mind that globally minimum temperatures (nighttime) have increased more than daytime temperatures [
42,
61] and a reasonably symmetric warming of minimum and maximum extremes has been detected at a European level [
62]. For these reasons, a comprehensive approach to the HW calculation should also take the cooling effect at night into consideration, and not just the maximum temperature or apparent temperature as reported in recent studies [
63,
64]. The HWHI approach developed in this study is in line with the latest guidelines on HWs and health developed thanks to the joint action of the WMO and the WHO [
14].
Another strength of this study is the use of long (36-year) time-series of ground meteorological data referred to densely populated European cities, where most people and the vulnerable population potentially exposed to heat conditions live. Furthermore, cities are nowadays considered as the environments with the highest levels of heat-related-risks due to the increase in impervious artificial surfaces that enhance urban microclimate modifications. In particular, the rise in heat storage during the day and a slower release at night caused by the urban sealed soils generates alterations to the energy budget of the surfaces, producing a rise in the city temperature and contributing to the urban heat island phenomenon [
65]. This condition can amplify the heat load during HW events and may also exacerbate the HW effects [
14,
15].
Several authors [
27] have revealed that strong heat-impact events are predicted in cities in the near future due to global warming, and for this reason, more and more attention should be paid to the impact of global warming on this vulnerable anthropogenic ecosystem.
5. Conclusions
The knowledge of local trends, frequency, duration and intensity of HWs referring to the main European cities represents another step towards increasing knowledge about this “natural” hazard which has devastating impacts on ecosystems and human health. Recent Regional Climate Model projections over Europe have shown spatial heterogeneity in the expected increases of the HW intensity, frequency and duration, with greatest impacts projected for southern Europe [
66]. In addition, recent climatological scenarios have also revealed substantial increases predicted in the summer temperatures by the end of the century over central and eastern Europe [
67], together with projected increases in pollution levels (ozone and aerosol particles) [
68] thus representing additional aggravating factors for the situation outlined in this paper.
Further investigations are needed in order to compare the HW characteristics used in this study with other existing HW indicators. The comprehension of the relationships between HW risk components based on novel scientific evidence represents a priority which would also be useful for attributing different weights to the various HW hazard characteristics, in this way calibrating the proposed HWHI.
The results of this study represent a backup for increasing awareness about the need for heat-related mitigation and adaptation strategies, particularly through improved urban planning in order to counteract the effects of HWs in most of the EU capitals, with priority given to the southeastern cities.

 ,
, 


