An Advanced Radiative Transfer and Neural Network Scheme and Evaluation for Estimating Water Vapor Content from MODIS Data


1
National Hulunber Grassland Ecosystem Observation and Research Station, Institute of Agricultural Resources and Regional Planning, Chinese Academy of Agricultural Sciences, Beijing 100081, China
2
State Key Laboratory of Remote Sensing Science, Institute of Remote Sensing and Digital Earth Research, Chinese Academy of Science and Beijing Normal University, Beijing 100086, China
3
College of Resources and Environments, Hunan Agricultural University, Changsha 410128, China
4
Hydrometeorology and Remote Sensing Laboratory, University of Oklahoma, Norman, OK 73072, USA
5
International Agricultural Big Data and Nutrition Academy in China, Hong Kong, China
*
Author to whom correspondence should be addressed.
Atmosphere 2017, 8(8), 139; https://doi.org/10.3390/atmos8080139
Submission received: 13 June 2017
/
Revised: 24 July 2017
/
Accepted: 26 July 2017
/
Published: 29 July 2017
(This article belongs to the Special Issue Water Vapor in the Atmosphere)
Abstract
:This work made an improvement upon and a further evaluation of previous work for estimating water vapor content from near-infrared around 1 μm from MODIS data. The accuracy of RM-NN is determined by the complicated relationship of the geophysical parameters. An advanced scheme is proposed for building different training databases for different seasons in different regions to reduce the complexity. The training database includes three parts. The first part is a simulation database by MODTRAN for different weather conditions, which is made as a basic database; the second part is reliable field measurement data in observation stations; and the third part is the MYD05_L2 product on clear days, which is produced by the standard product algorithm for water vapor content. The comparative analyses based on simulation data indicate that maximum accuracy of single condition could be improved by about 34% relative to the “all conditions” results. Two study regions in China and America are selected as test areas, and the evaluation shows that the mean and the standard deviation of estimation error are about 0.08 g cm−2 and 0.09 g cm−2, respectively. All the analysis indicates that the advanced scheme can improve the retrieval accuracy of water vapor content, which can make full use of the advantages of previous methods.
1. Introduction
The Moderate Resolution Imaging Spectrometer (MODIS) on the Earth Observing System (EOS) is an instrument that has near-IR channels within and around the 0.94 μm water vapor band for remote sensing of water vapor content over the globe from a satellite platform [1]. Until now, many algorithms have been proposed to estimate water vapor content from near-infrared at around 1 μm from MODIS data [2,3,4,5,6]. The general method uses ratios of water vapor absorbing channels at 0.905, 0.936 and 0.94 μm, with atmospheric window channels at 0.865 and 1.24 μm, to estimate water vapor content [2,3,4,5,6]. Mao et al. proposed to use the combination of radiative transfer model MODTRAN4 (RM) [7] and neural network (NN) to estimate water vapor content from MODIS data, and the initial analysis indicates that the accuracy has been improved well [1].
An advanced scheme will be proposed based on a previous algorithm [1], and the idea that different training and testing databases should be built for different weather conditions in different regions. Reliable compensation training data are added to the training database according to different conditions in different regions, and more application analysis and evaluation will be made of the retrieved results in China and America by using neural network. The details of the method are in next section.
2. An Advanced Scheme
The details of geophysical parameter retrieval using a dynamic-learning neural network can be found in [8,9,10]. MODTRAN4 was used to simulate the radiative transfer process. The implementation of the RM-NN algorithm can be broken into four basic steps [1].
- (1)
- The land surface reflectance of water, snow, soil, and vegetation (about 49 land types) [11] in MODIS bands 2, 5, 17, 18 and 19 are used as input parameters for MODTRAN4. The range of atmospheric water vapor content is from 0.3 g cm−2 to 3.5 g cm−2 for the purposes of simulation.
- (2)
- Computing the radiance () in bands 2, 5, 17, 18, 19, and computing the ratios , , , , , , which are made up of six input nodes of neural network, with the output node being water vapor content. The training and testing databases were built.
- (3)
- Training and testing the neural network.
- (4)
- Estimation of water vapor content from the MODIS image data is performed using the neural network.
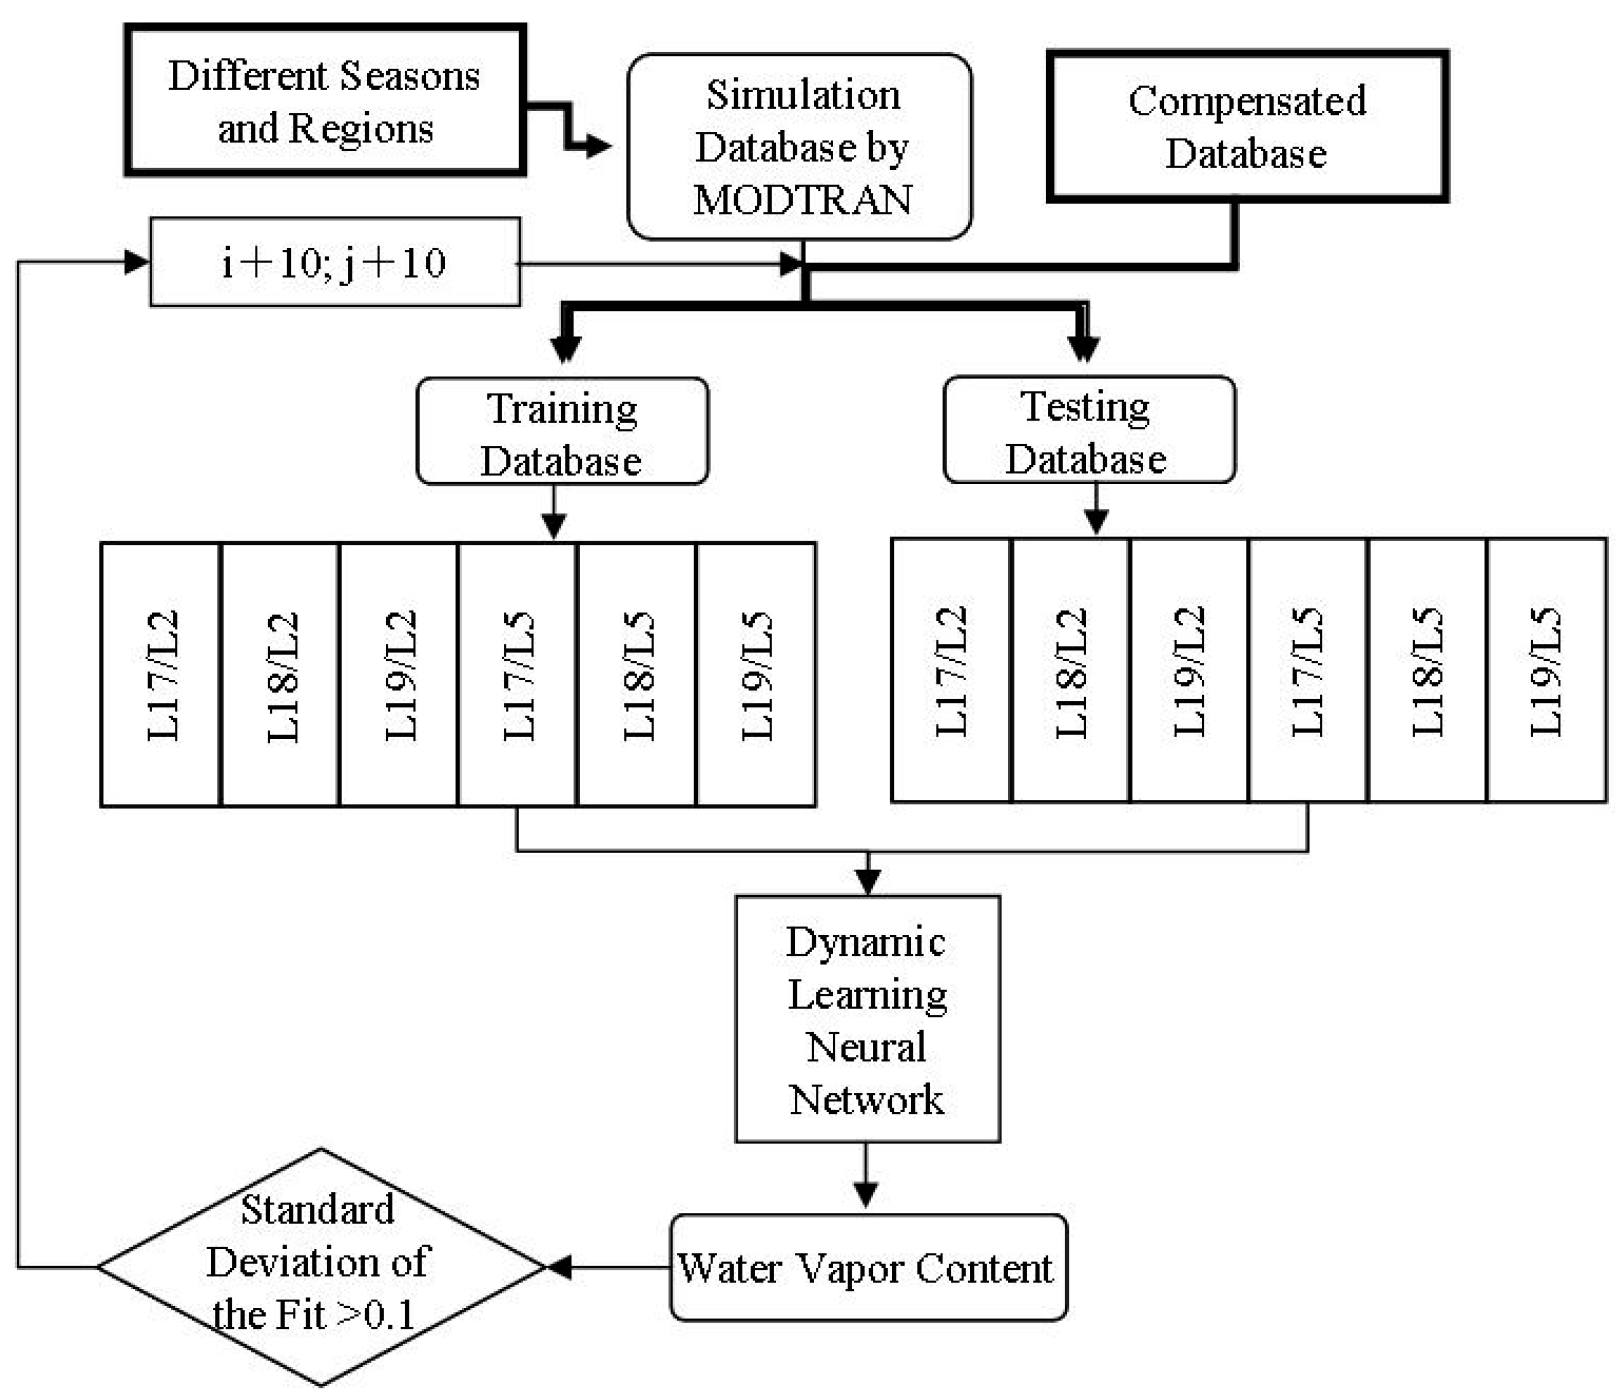
Mao et al. has discussed why RM-NN should be used to estimate water vapor content [1]. Training and testing databases were built for the standard atmospheres, including Tropical, Mid-latitude Summer, Mid-latitude Winter, Sub-arctic Summer, and Sub-arctic Winter. Although the application analysis indicates that that RM–NN can be used to accurately estimate the water vapor content from MODIS 1B data, it still needs to be improved, especially for different weather conditions in different regions, because the profile of the atmosphere changes with the time and space. There are different radiance responses for different surface types, which can be seen in reference [1]. So the estimation accuracy of RM-NN is mainly determined by two factors. The first is the complexity of the relationship between the geophysical parameters, and the other is the training and testing database. So we make two improvements for this, which are marked in bold in Figure 1. The first is that different simulation databases should be built respectively for different seasons (even for different weather conditions) in different regions (different surface types), which can reduce the complexity of the problem. The other is that the compensated database should be added to the training database and testing database. The compensated database includes two parts. One part is the reliable measured water vapor content data, obtained from observation sites and matched with the MODIS L1B data in different regions, and the other part is reliable MODIS water vapor content product data (MYD05_L2), matched with validated MODIS 1B data.
3. Results and Evaluation
The MODTRAN4 is used to simulate the radiative transfer of MODIS bands 2, 5, 17, 18 and 19. The reflectances of MODIS bands 2, 5, 17, 18 and 19 for different surface types obtained from [11] are used as input parameters of MODTRAN4. The changes in the atmosphere’s water vapor content range from 0.3 g cm−2 to 4.5 g cm−2. The standard atmospheres of Tropical, Mid-latitude Summer, Mid-latitude Winter, Sub-arctic Summer, and Sub-arctic Winter are input to MODTRAN4. We get 2539 simulation datasets for each atmosphere mode, and divide the simulation data randomly into two parts. There are 1952 sets of training data, and 587 sets of testing data, and we then use a dynamic learning (DL) NN [12] to estimate the water vapor content. First, we use the training database to train the NN, and then we use the test data to verify the NN. The details of the training process can be found in Figure 1 and reference [1]. After trial and error, part of the testing data set information can be seen in Table 1. As shown in Table 1, the average error of water vapor content is less than 0.05 g cm−2 when we estimate water vapor content using a different database for each standard atmosphere mode. The last row (all conditions above included) in Table 1 presents the retrieval error when the training neglects latitudinal and seasonal variations of water vapor, and the average error is about 0.06 g cm−2. The estimation accuracy of Sub-arctic Winter is the highest, with the average accuracy being improved by about 34% () relative to “above included”. So the estimation accuracy can be improved greatly when we estimate water vapor content for different seasons in different regions.
The standard atmosphere modes cannot present all weather conditions, and the input parameters (like reflectance) of MODTRAN4 do not include all surface types. In order to improve retrieval accuracy, the reliable training and testing database needs to be compensated. The AERONET (Aerosol Robotic Network) program is a federation of ground-based remote-sensing aerosol networks established by NASA and PHOTONS (Univ. of Lille 1, CNES, and CNRS-INSU). The AERONET collaboration provides globally distributed observations of spectral aerosol optical depth, inversion products, and precipitable water in diverse aerosol regimes (http://aeronet.gsfc.nasa.gov/). Fifteen sites (as shown in Table 2) in Mid-latitude regions of China were selected as observation stations, with a date range from 30 May 2005 to 30 May 2011.
We extracted 561 data sets of water vapor content in clear skies from these observation stations. A program was made to simultaneously read the data from MODIS 1B and MYD05_L2 by using longitude/latitude as a control condition, matching this data with observation data. If the water vapor content obtained from MYD05_L2 data is approximately equal to the water vapor content obtained from the observation station, we set this pixel as the center one, and get the values of MODIS 1B matching with MYD05_L2 data for positioning pixel by 3 × 3 matrix. Finally, 3611 data sets were obtained, and these data were randomly divided into two groups. 2210 of them were added into the training database and 1401 of them were added to the testing database of the Mid-latitude Summer mode. After trial and error, part of the test data set information can be seen in Table 3.
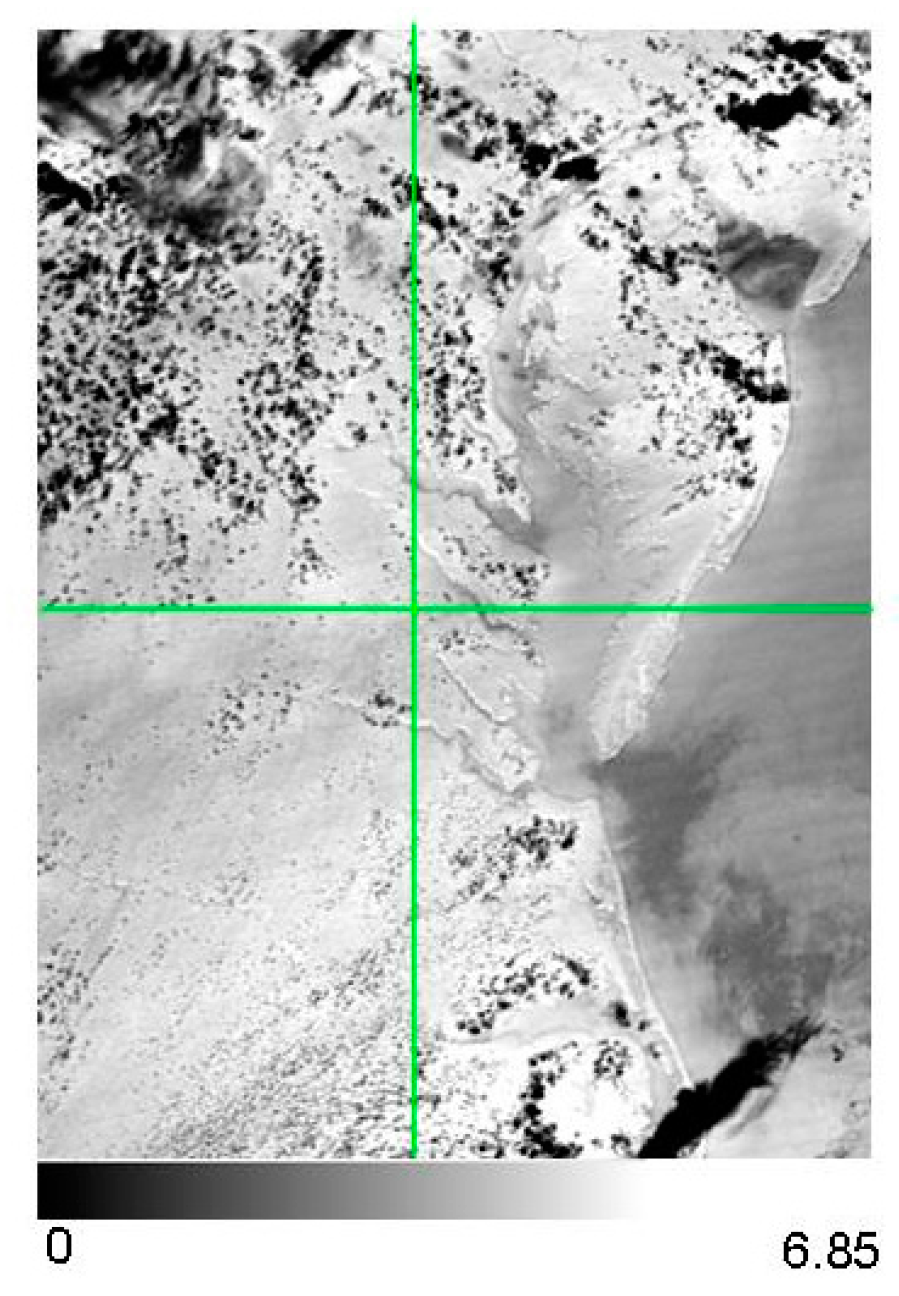
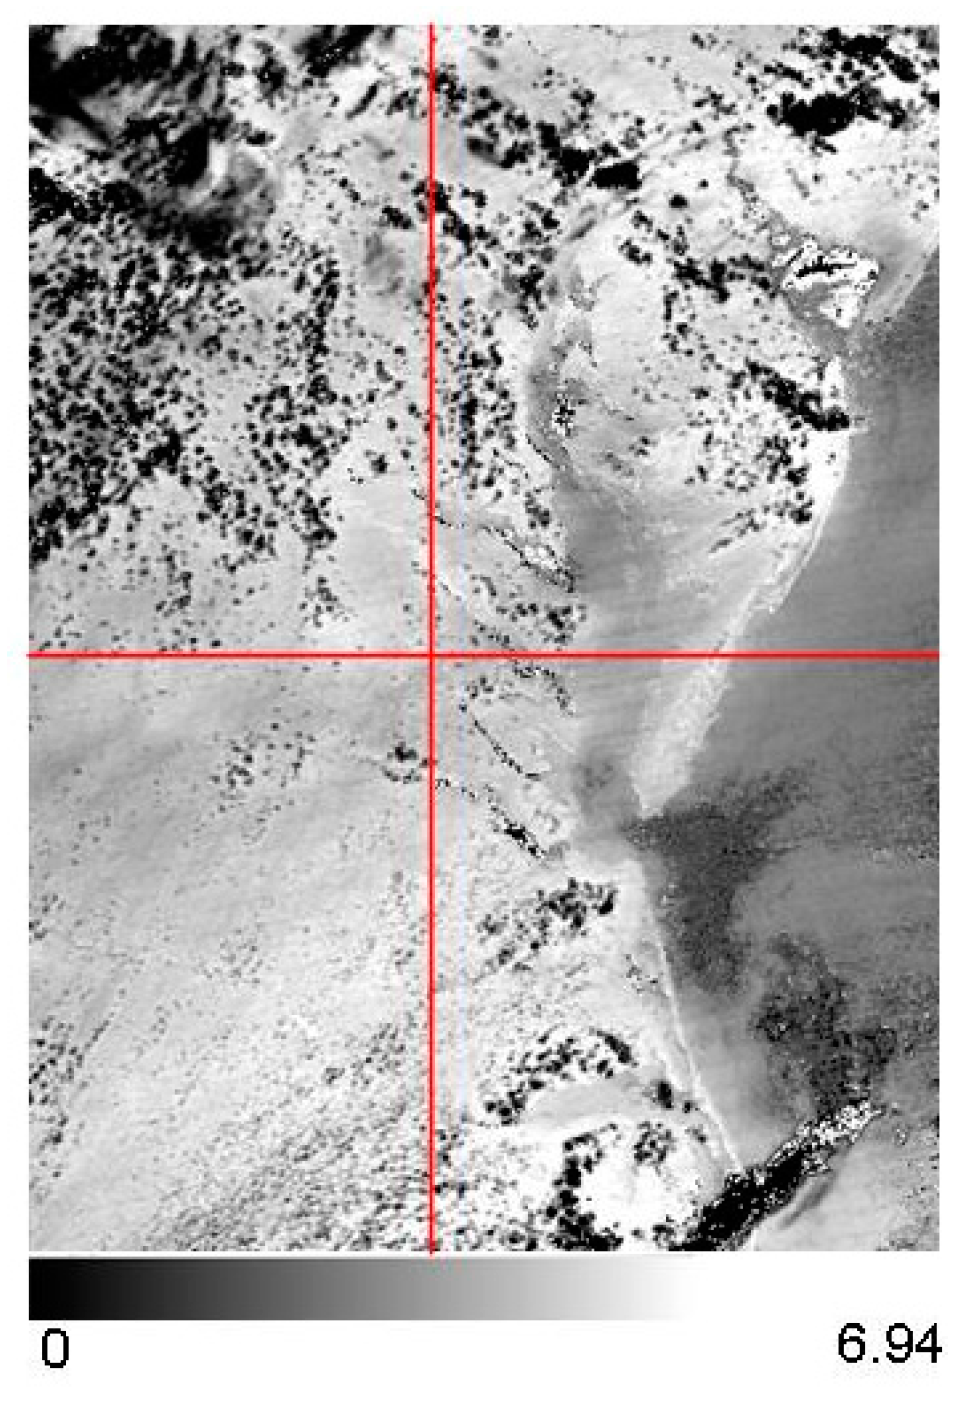
We selected the MODIS/AQUA image of East-China to perform the analysis. Figure 2 is the image combined by MODIS bands 3, 2 and 1, which include land and ocean. There is some cloud over the land and ocean. The date is 22 September 2007. Figure 3 is the MYD05_L2 product, which provides per-pixel water vapor content values. Figure 4 is the retrieval result by the NN trained above. Figure 5 is the difference between Figure 3 and Figure 4. Figure 6 and Figure 7, respectively, are the X and Y profiles in Figure 3, Figure 4 and Figure 5, marked with green, red and blue, respectively. Most retrieval results by RM-NN were slightly higher than the MODIS product, as can be seen from Figure 6 and Figure 7. Overall, MODIS products had smaller water vapor values in cloud-covered areas. The largest difference between the result retrieved by RM-NN and the MOD11_1KM product was at the edge of the sea, marked by A and B in Figure 3, Figure 4 and Figure 5. The results retrieved by RM-NN were better than those from MYD05 in the A and B regions because the value of water vapor content is a gradual change in the air, which is also analyzed in reference [1]. The values of the A and B regions are higher than the values of their surroundings, as can be seen from Figure 3 and Figure 4. The reflectance at the sea is complex (mixed pixel), and the general algorithm cannot depict the conditions very well [2]. The RM-NN can overcome this shortcoming by compensating the training database.
30 sites (as shown in Table 4) in Mid-latitude regions of America were selected as observation stations, with a date range from 30 May 2005 to 30 November 2011. We extracted 611 data sets of water vapor content in clear skies from these observation stations. If the water vapor content obtained from MYD05_L2 data was approximately equal to the water vapor content obtained from the observation station, we made this pixel the center, and get the values of MODIS 1B matching with MYD05_L2 data by 3 × 3 matrix. Finally, 3973 data sets were obtained, which were randomly divided into two groups. 2481 of them were added into the training database, and 1492 of them are added to the testing database for the Mid-latitude Summer mode.
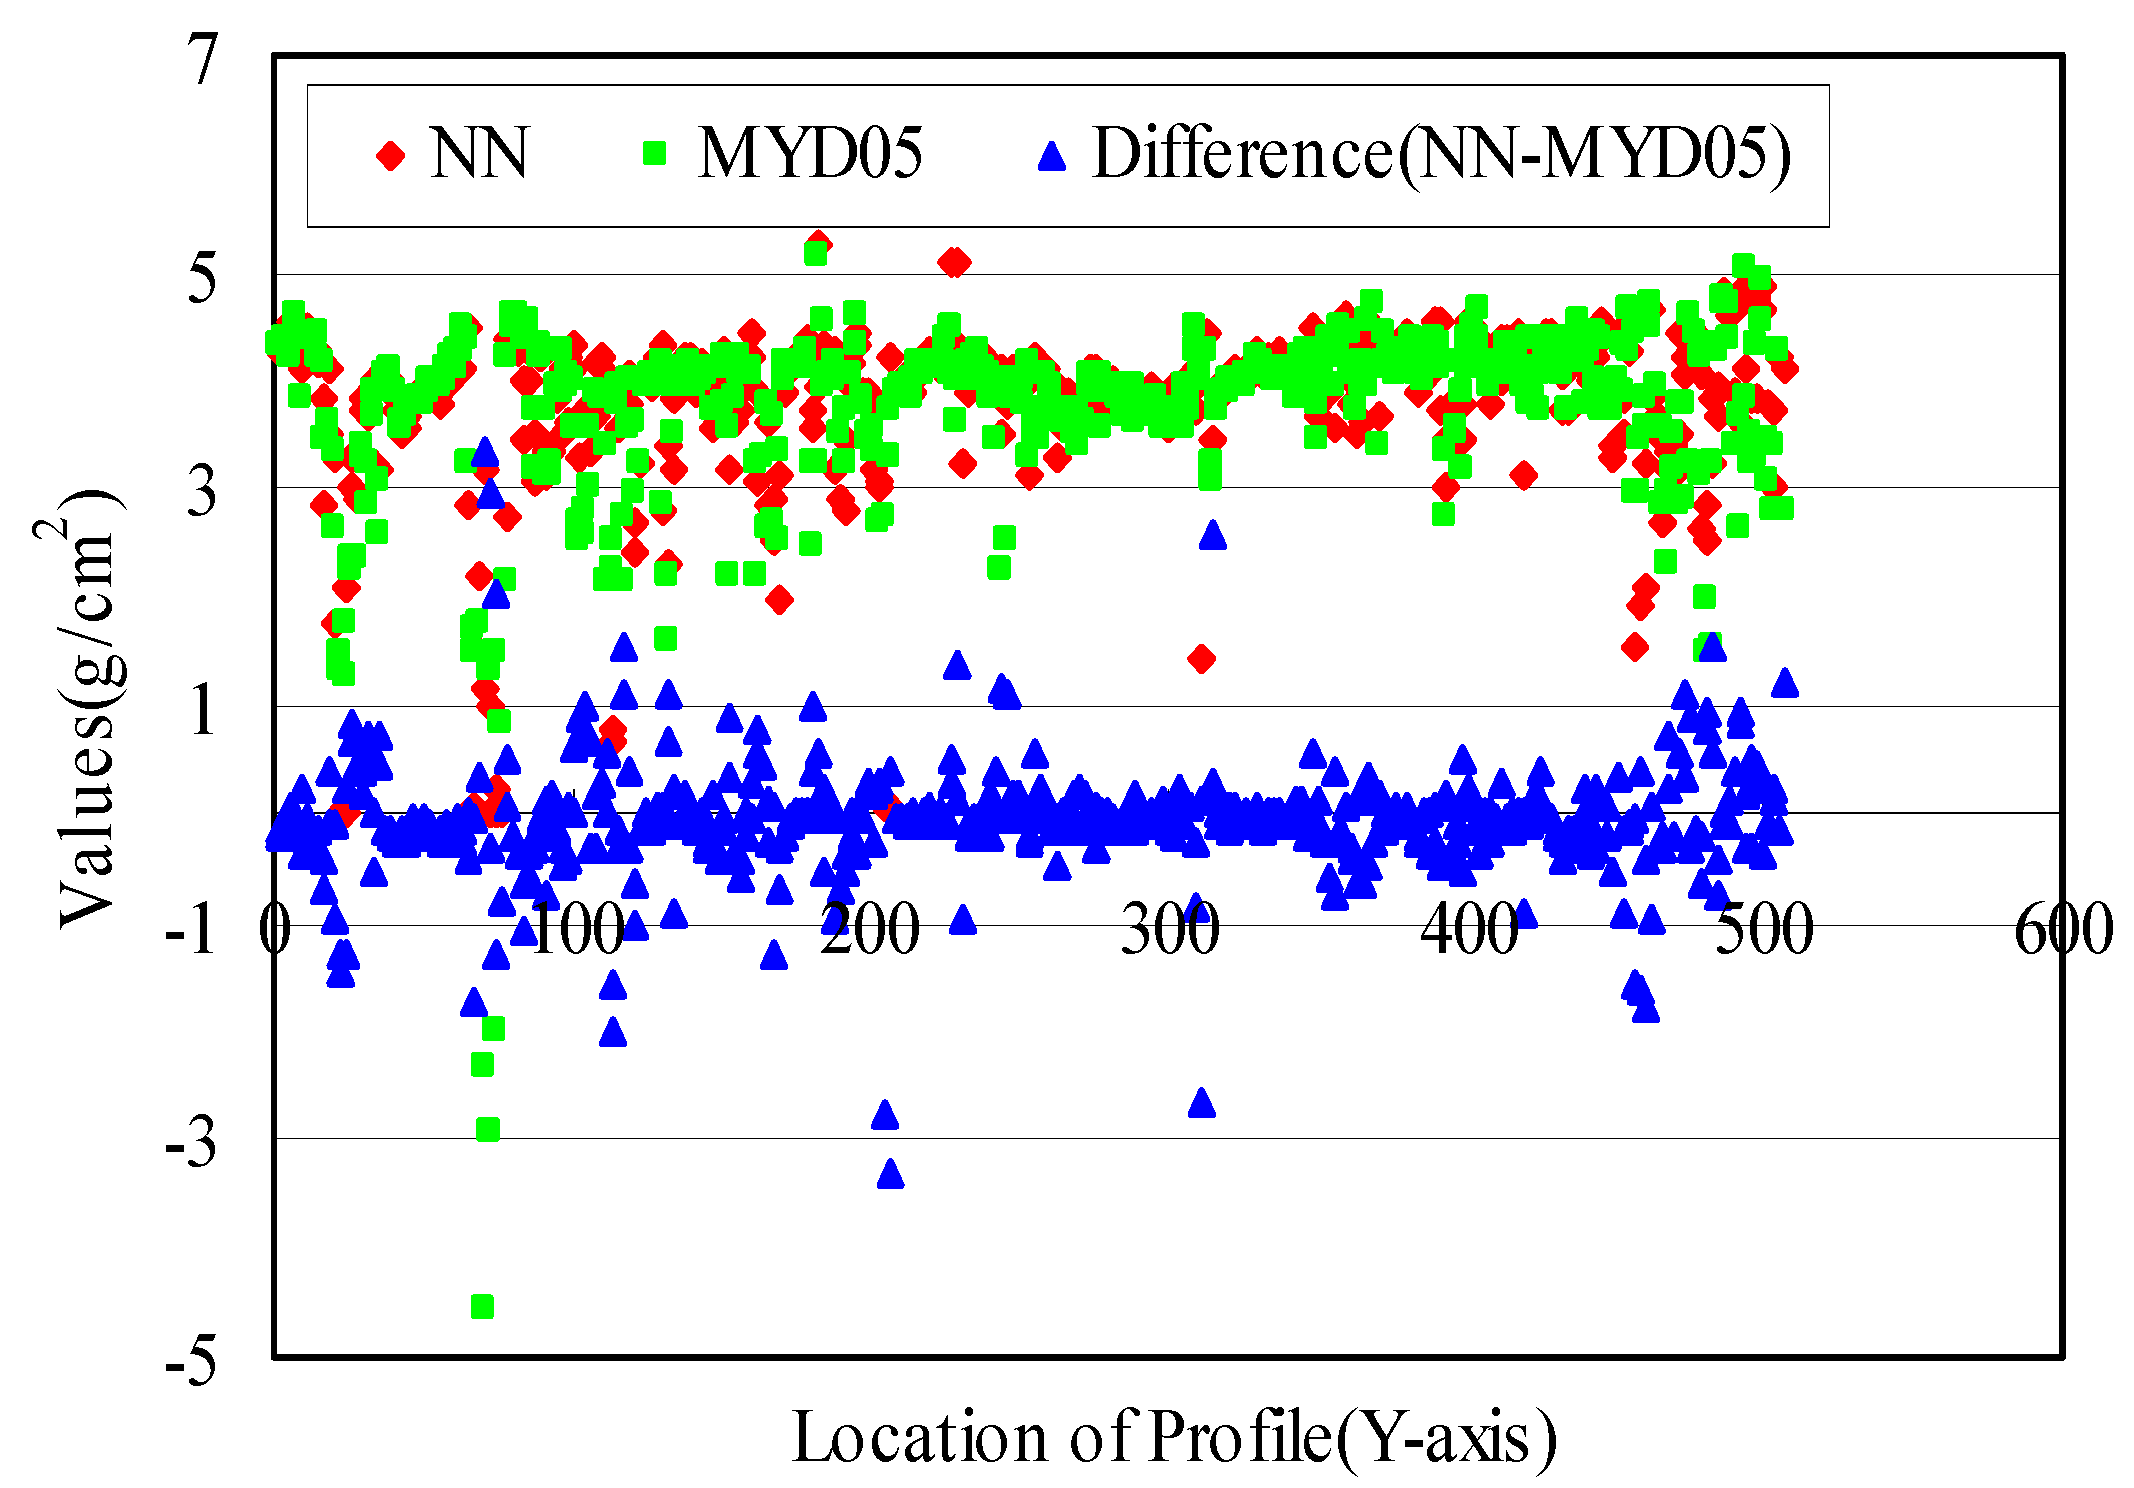
A MODIS/AQUA image of eastern USA was used to make a further analysis. Figure 8 is the image combined by MODIS bands 3, 2 and 1. The date was 1 August 2011. Figure 9 is the product of MYD05_L2, which provides per-pixel water vapor content values. The dynamic learning (DL) NN was trained and tested using a new database for the American region. After trial and error, the average error and standard deviation of the fit were 0.045 and 0.064 g cm−2, respectively, when the two hidden layers were given 450 nodes each. Figure 10 is the result retrieved by the NN. Figure 11 is the difference between Figure 9 and Figure 10. Figure 12 and Figure 13 are, respectively, the X and Y profile in Figure 9, Figure 10 and Figure 11, marked with green, red and blue, respectively. Most values were approximately equal between the results retrieved by RM-NN and the MYD05_L2 product, with the largest difference being over land covered by cloud, which is shown in Figure 12 and Figure 13.
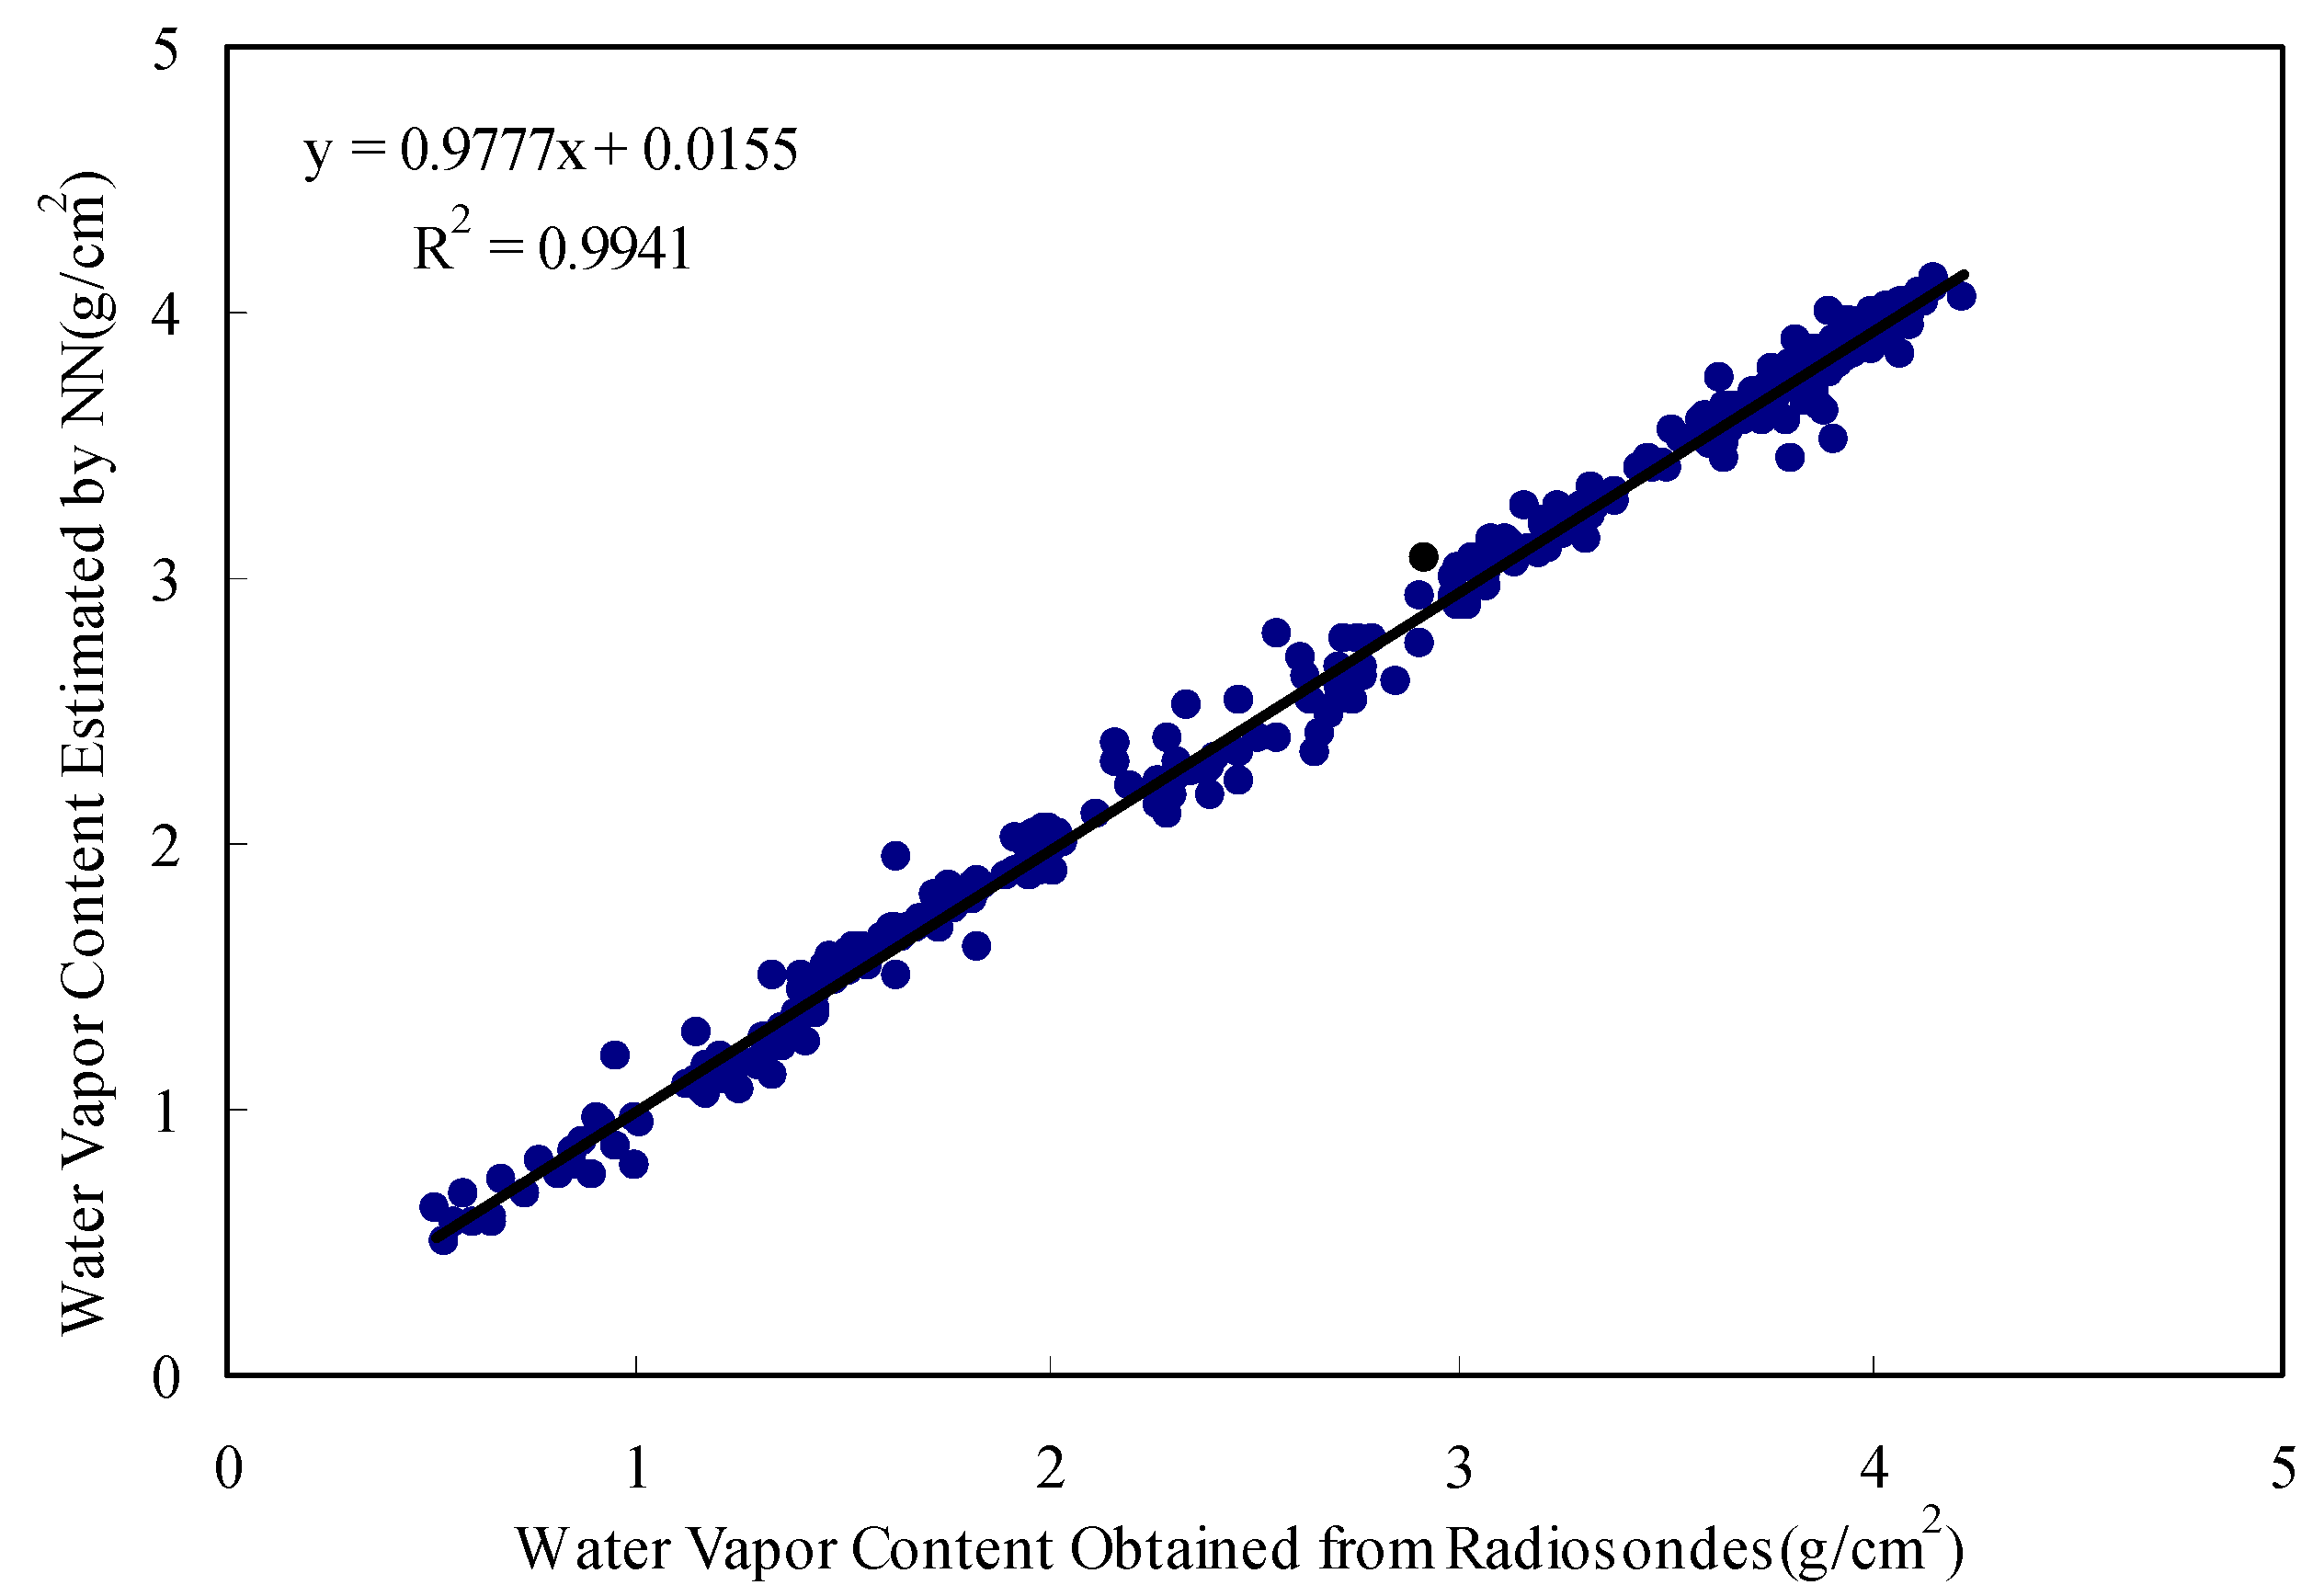
247 observation data sets were obtained from the observation sites in Table 2 and Table 4. The comparison between the results estimated by the NN and the observation data is shown in Figure 14, and the mean and the standard deviation of estimation error are about 0.08 g cm−2 and 0.09 g cm−2, respectively. The accuracy using measurement data was also improved by about 33% (), relative to [1].
4. Conclusions
In order to improve the retrieval accuracy of water vapor content from MODIS data by using RM-NN, we proposed an advanced scheme to overcome the shortcomings of the previous algorithm. Different training and testing databases should be built for different weather conditions in different regions. The analysis of simulation data indicates that the estimation accuracy can be improved greatly by differentiating between different global regions and different seasons. The highest average accuracy was improved by about 34% for Sub-arctic Winter mode relative to the “all conditions above included” results.
Two examples of its application were analyzed in China and America. The compensated database is added to the training database and the testing database. The compensated database includes two parts. One part is the reliable measured data of water vapor content obtained from observation sites, matched with the MODIS 1B data from different regions, and the other part is reliable MODIS water vapor content product data (MYD05_L2), matched with validated MODIS 1B data. The analysis indicates that the accuracy of using measurement data was also improved by about 33% relative to [1], and the mean and the standard deviation of estimation error are about 0.08 g cm−2 and 0.09 g cm−2, respectively. The analysis shows that RM–NN is more competent for estimating water vapor content after being improved, and that databases built for different weather conditions in different regions can optimize the computing during the retrieval process, which is an important advancement, and makes it possible to perform inversion with higher accuracy and more practicality. In order to further improve the accuracy of global water vapor product inversion, it is necessary to establish a reliable training database for different land types in different regions.
Acknowledgments
The authors thank K. Chen, Y. Tzeng and H.W. Lee, and The Center for Space and Remote Sensing Research, National Central University, Taiwan, for their various help with this study, and the JPL for providing the ASTER Spectral Library data. They also thank the AERONET (Aerosol Robotic Network) program for providing precipitable water data and NASA for providing MODIS 1B and the MODIS water vapor content product. This work was supported by National Key R&D Program of China (No.2016YFC0500203), National Natural Science Foundation of China (No.41571427), Innovative group guide project (Grant No. Y2017JC33) and Open Fund of State Key Laboratory of Remote Sensing Science (Grant No. OFSLRSS201708).
Author Contributions
Kebiao Mao and Xinyi Shen conceived and designed the experiments; Zhiyuan Zuo performed the experiments; Ying Ma and Guang Liu analyzed the data; Huajun Tang contributed to the discussion; Kebiao Mao wrote the paper.
Conflicts of Interest
The authors declare no conflict of interest.
References
- Mao, K.; Li, H.T.; Hu, D.Y.; Wang, J.; Huang, J.X.; Li, Z.L.; Zhou, Q.B.; Tang, H.J. Estimation of water vapor content in near-infrared bands around 1 μm from MODIS data by using RM–NN. Opt. Express 2010, 18, 9542–9554. [Google Scholar] [CrossRef] [PubMed]
- Kaufman, Y.J.; Gao, B.C. Remote sensing of water vapor in the near-IR from EOS/MODIS. IEEE Trans. Geosci. Remote Sens. 1992, 5, 871–884. [Google Scholar] [CrossRef]
- Gao, B.C.; Kaufman, Y.J. The MODIS Near-IR Water Vapor Algorithm, Product ID: MOD05-Total Precipitable Water; Algorithm technical background document (ATBD); Remote Sensing Division, Naval Research laboratory: Washington, DC, USA; Climate and Radiation Branch, NASA Goddard Space Flight Center: Greenbelt, MD, USA, 1998; pp. 1–25.
- Gao, B.C.; Kaufman, Y.J. Water vapor retrievals using Moderate Resolution Imaging Spectrometer (MODIS) near-IR channels. J. Geophys. Res. Atmos. 2003, 108. [Google Scholar] [CrossRef]
- Sobrino, J.A.; Kharraz, J.E.; Li, Z.L. Surface temperature and water vapour retrieval from MODIS data. Int. J. Remote Sens. 2003, 24, 5161–5182. [Google Scholar] [CrossRef]
- King, M.D.; Kaufman, Y.J.; Menzel, W.P.; Tanre, D. Remote sensing of cloud, aerosol, and water vapor properties from the Moderate Resolution Imaging Spectrometer (MODIS). IEEE Trans. Geosci. Remote Sens. 1992, 30, 1–27. [Google Scholar] [CrossRef]
- Berk, A.; Bemstein, L.S.; Roberttson, D.C. MODTRAN: A Modetate Resolution Model for LOWTRAN; Rep. AFGL-TR-87-0220; Spectral Science, Inc.: Burlington, MA, USA, 1987. [Google Scholar]
- Mao, K.B.; Shi, J.; Li, Z.; Tang, H. An RM-NN algorithm for retrieving land surface temperature and emissivity from EOS/MODIS data. J. Geophys. Res. Atmos. 2007, 112. [Google Scholar] [CrossRef]
- Mao, K.B.; Shi, J.C.; Tang, H.J.; Li, Z.L.; Wang, X.F.; Chen, K.S. A neural network technique for separating land surface emissivity and temperature from ASTER imagery. IEEE Trans. Geosci. Remote Sens. 2008, 46, 200–208. [Google Scholar] [CrossRef]
- Mao, K.; Tang, H.J.; Wang, X.F.; Zhou, Q.B.; Wang, D.L. Near-surface air temperature estimation from ASTER data using neural network. Int. J. Remote Sens. 2008, 29, 6021–6028. [Google Scholar] [CrossRef]
- Bowker, D.E.; Davis, R.E.; Myrick, D.L.; Stacy, K.; Jones, W.T. Spectral Reflectances of Natural Targets for Use in Remote Sensing Studies; NASA Reference Publication 1139; Scientific and Technical Information Branch, National Aeronautics and Space Administration (NASA): Washington, DC, USA, 1985.
- Tzeng, Y.C.; Chen, K.S.; Kao, W.L.; Fung, A.K. A dynamic learning neural network for remote sensing applications. IEEE Trans. Geosci. Remote Sens. 1994, 5, 1096–1102. [Google Scholar] [CrossRef]
Figure 1.
An advanced scheme for RM-NN.

Figure 2.
MODIS1B image (bands 3, 2 and 1) in 22 September 2007.
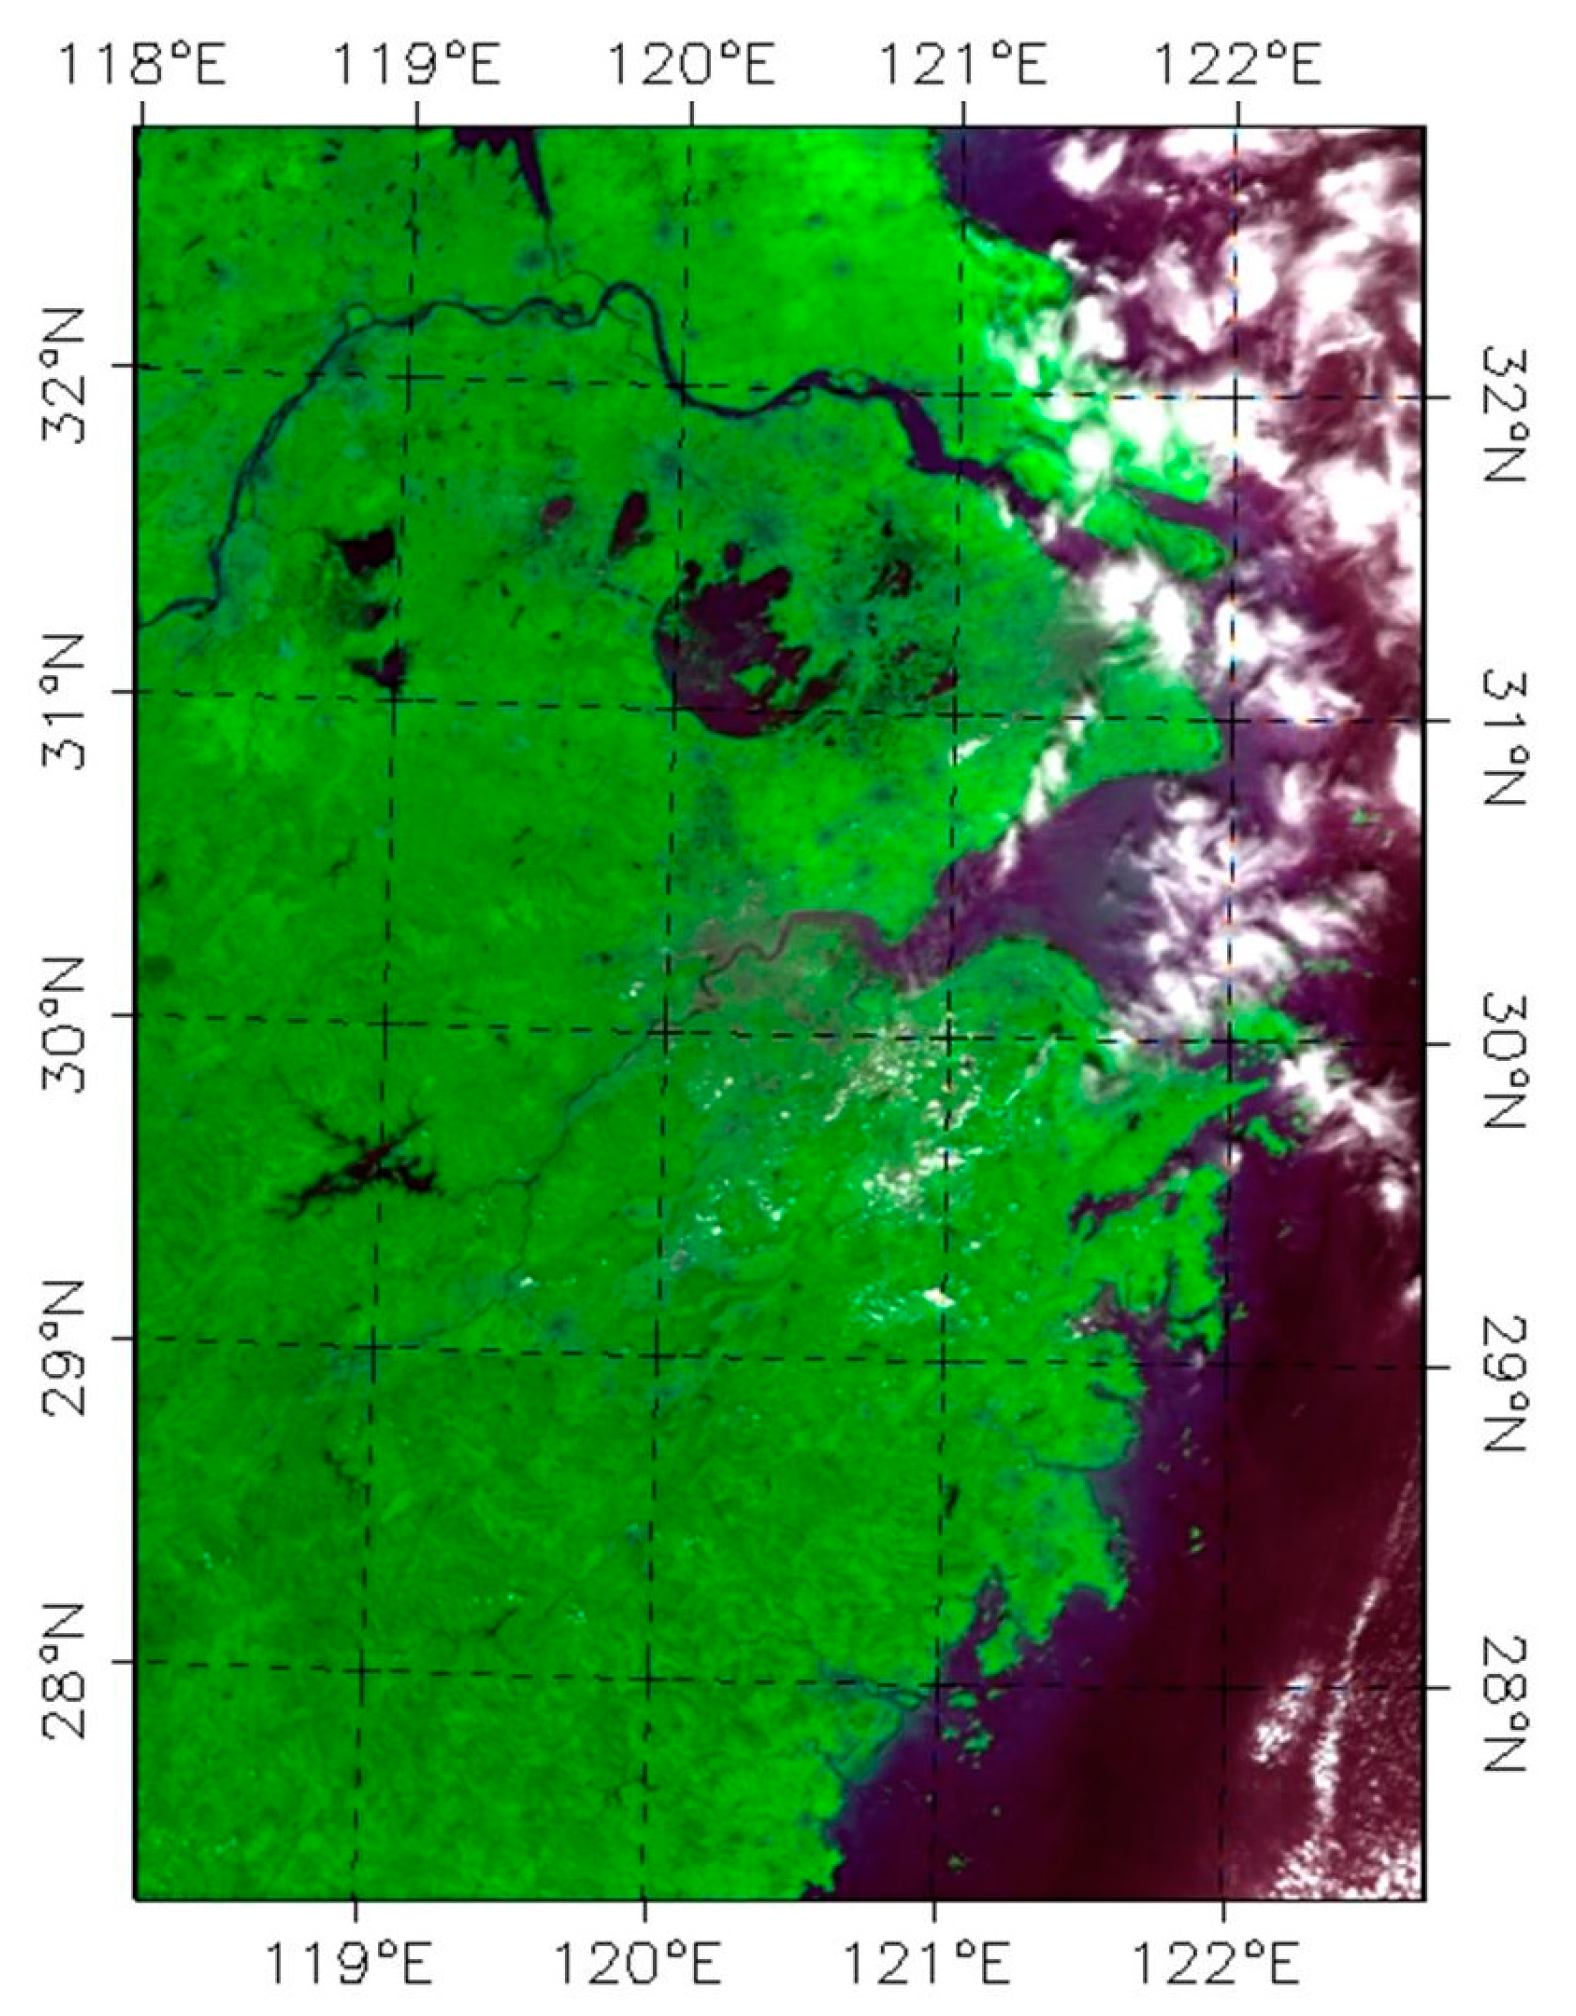
Figure 3.
MYD05_L2 product over China.
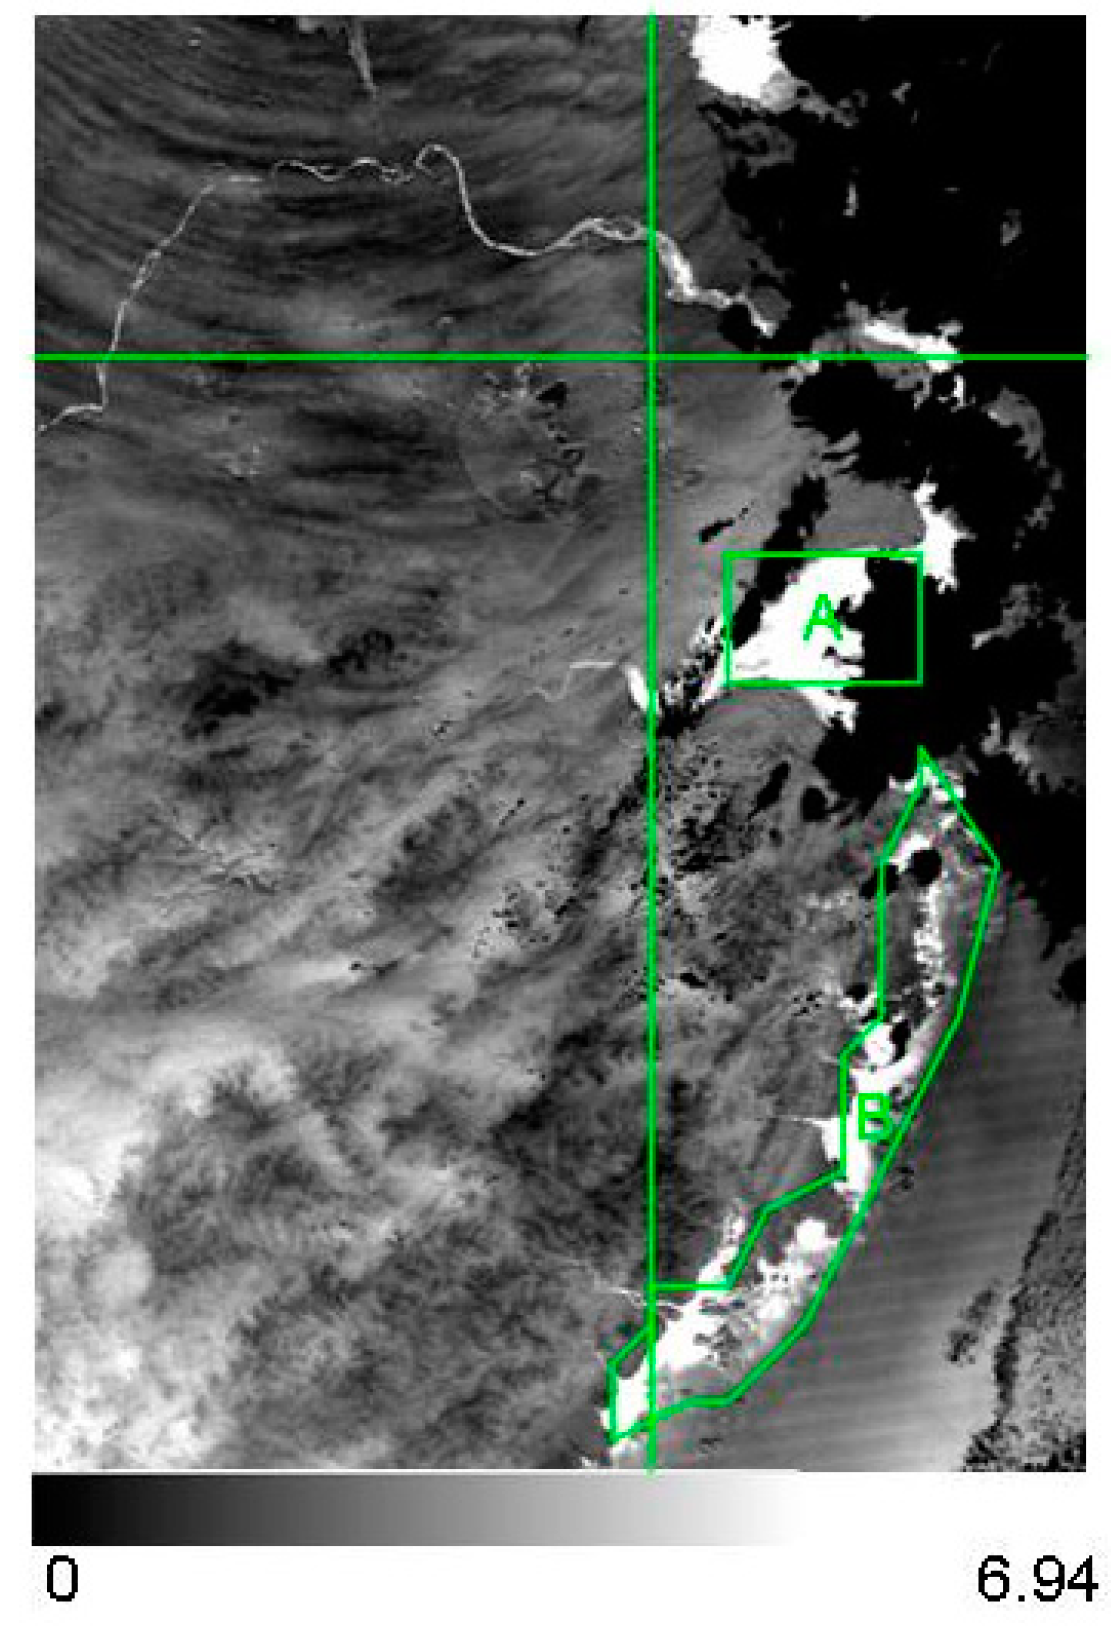
Figure 4.
Water vapor content retrieved by NN.
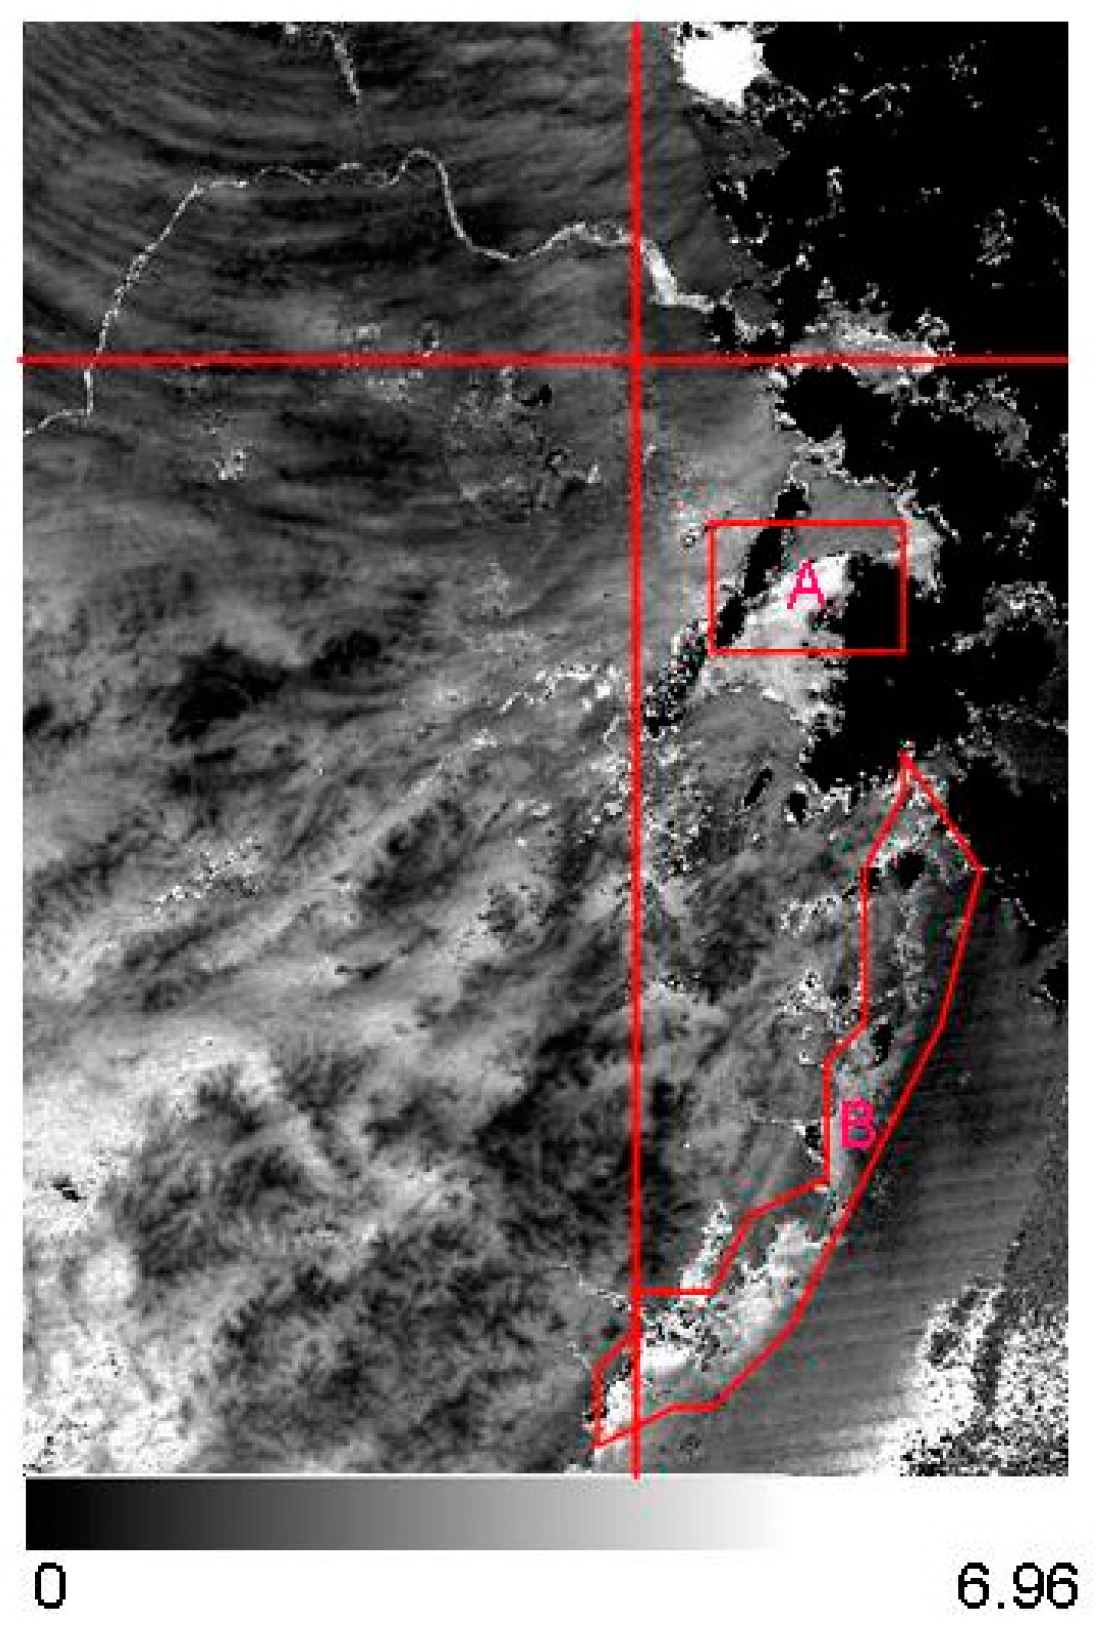
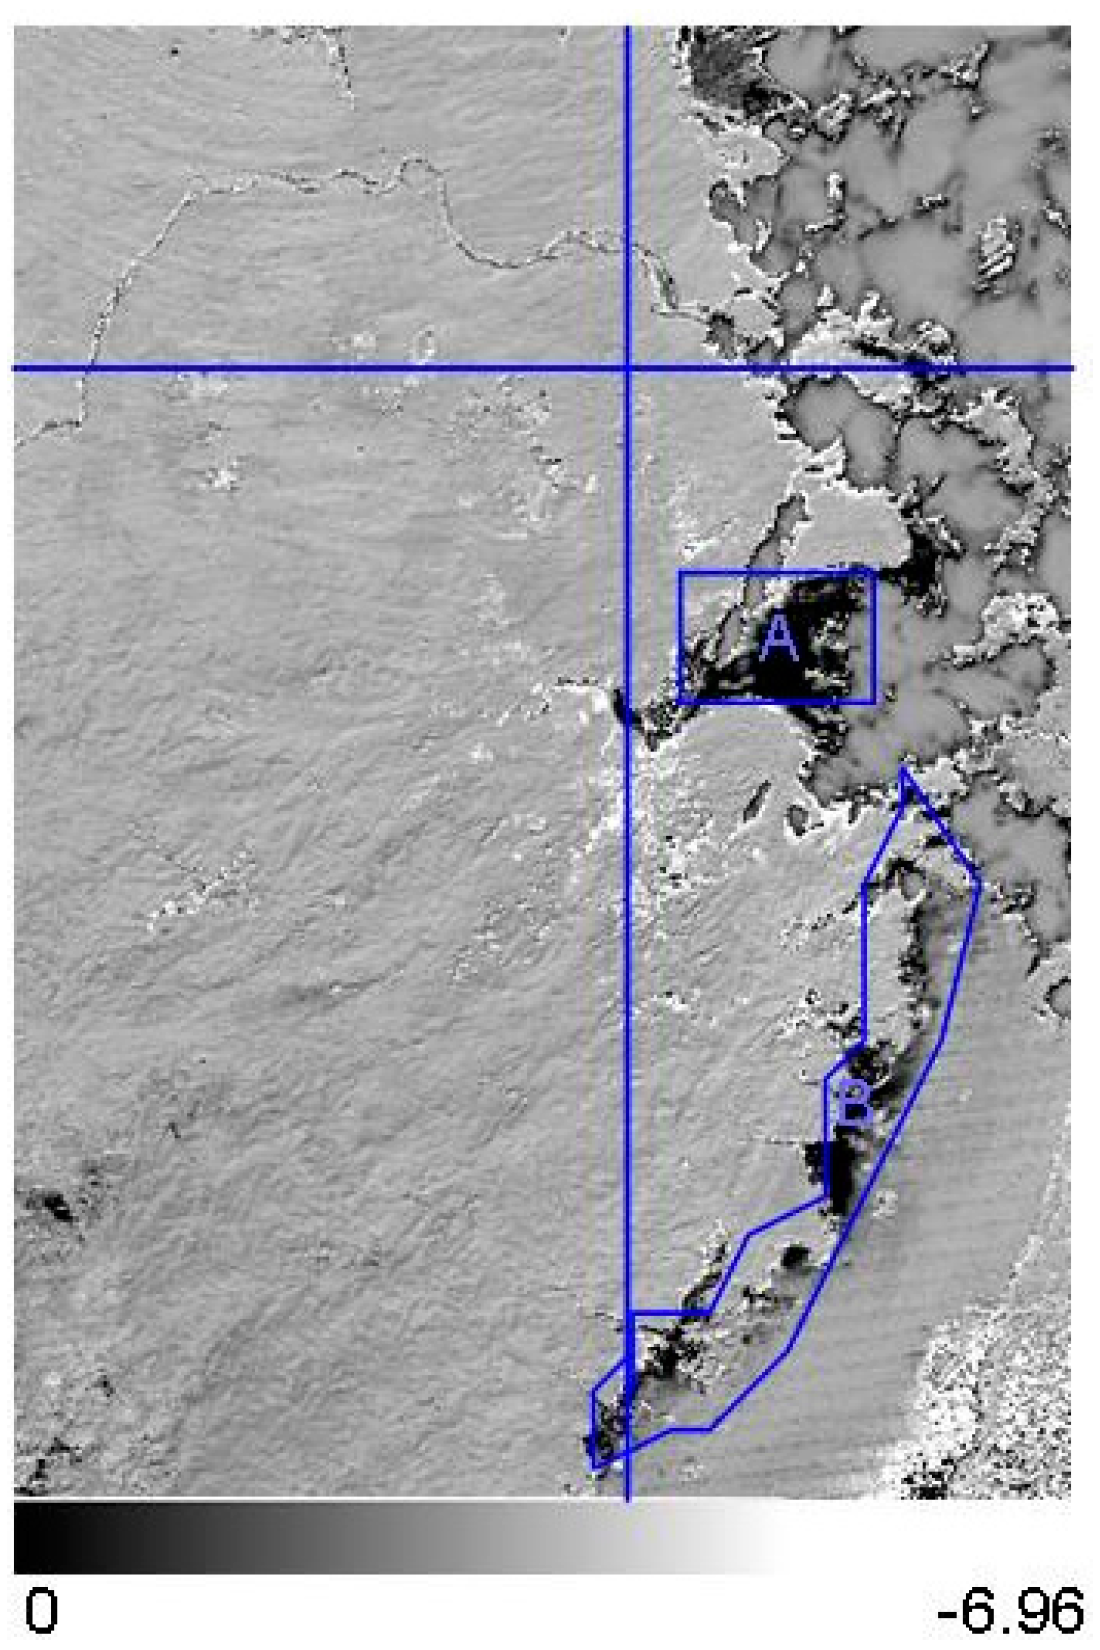

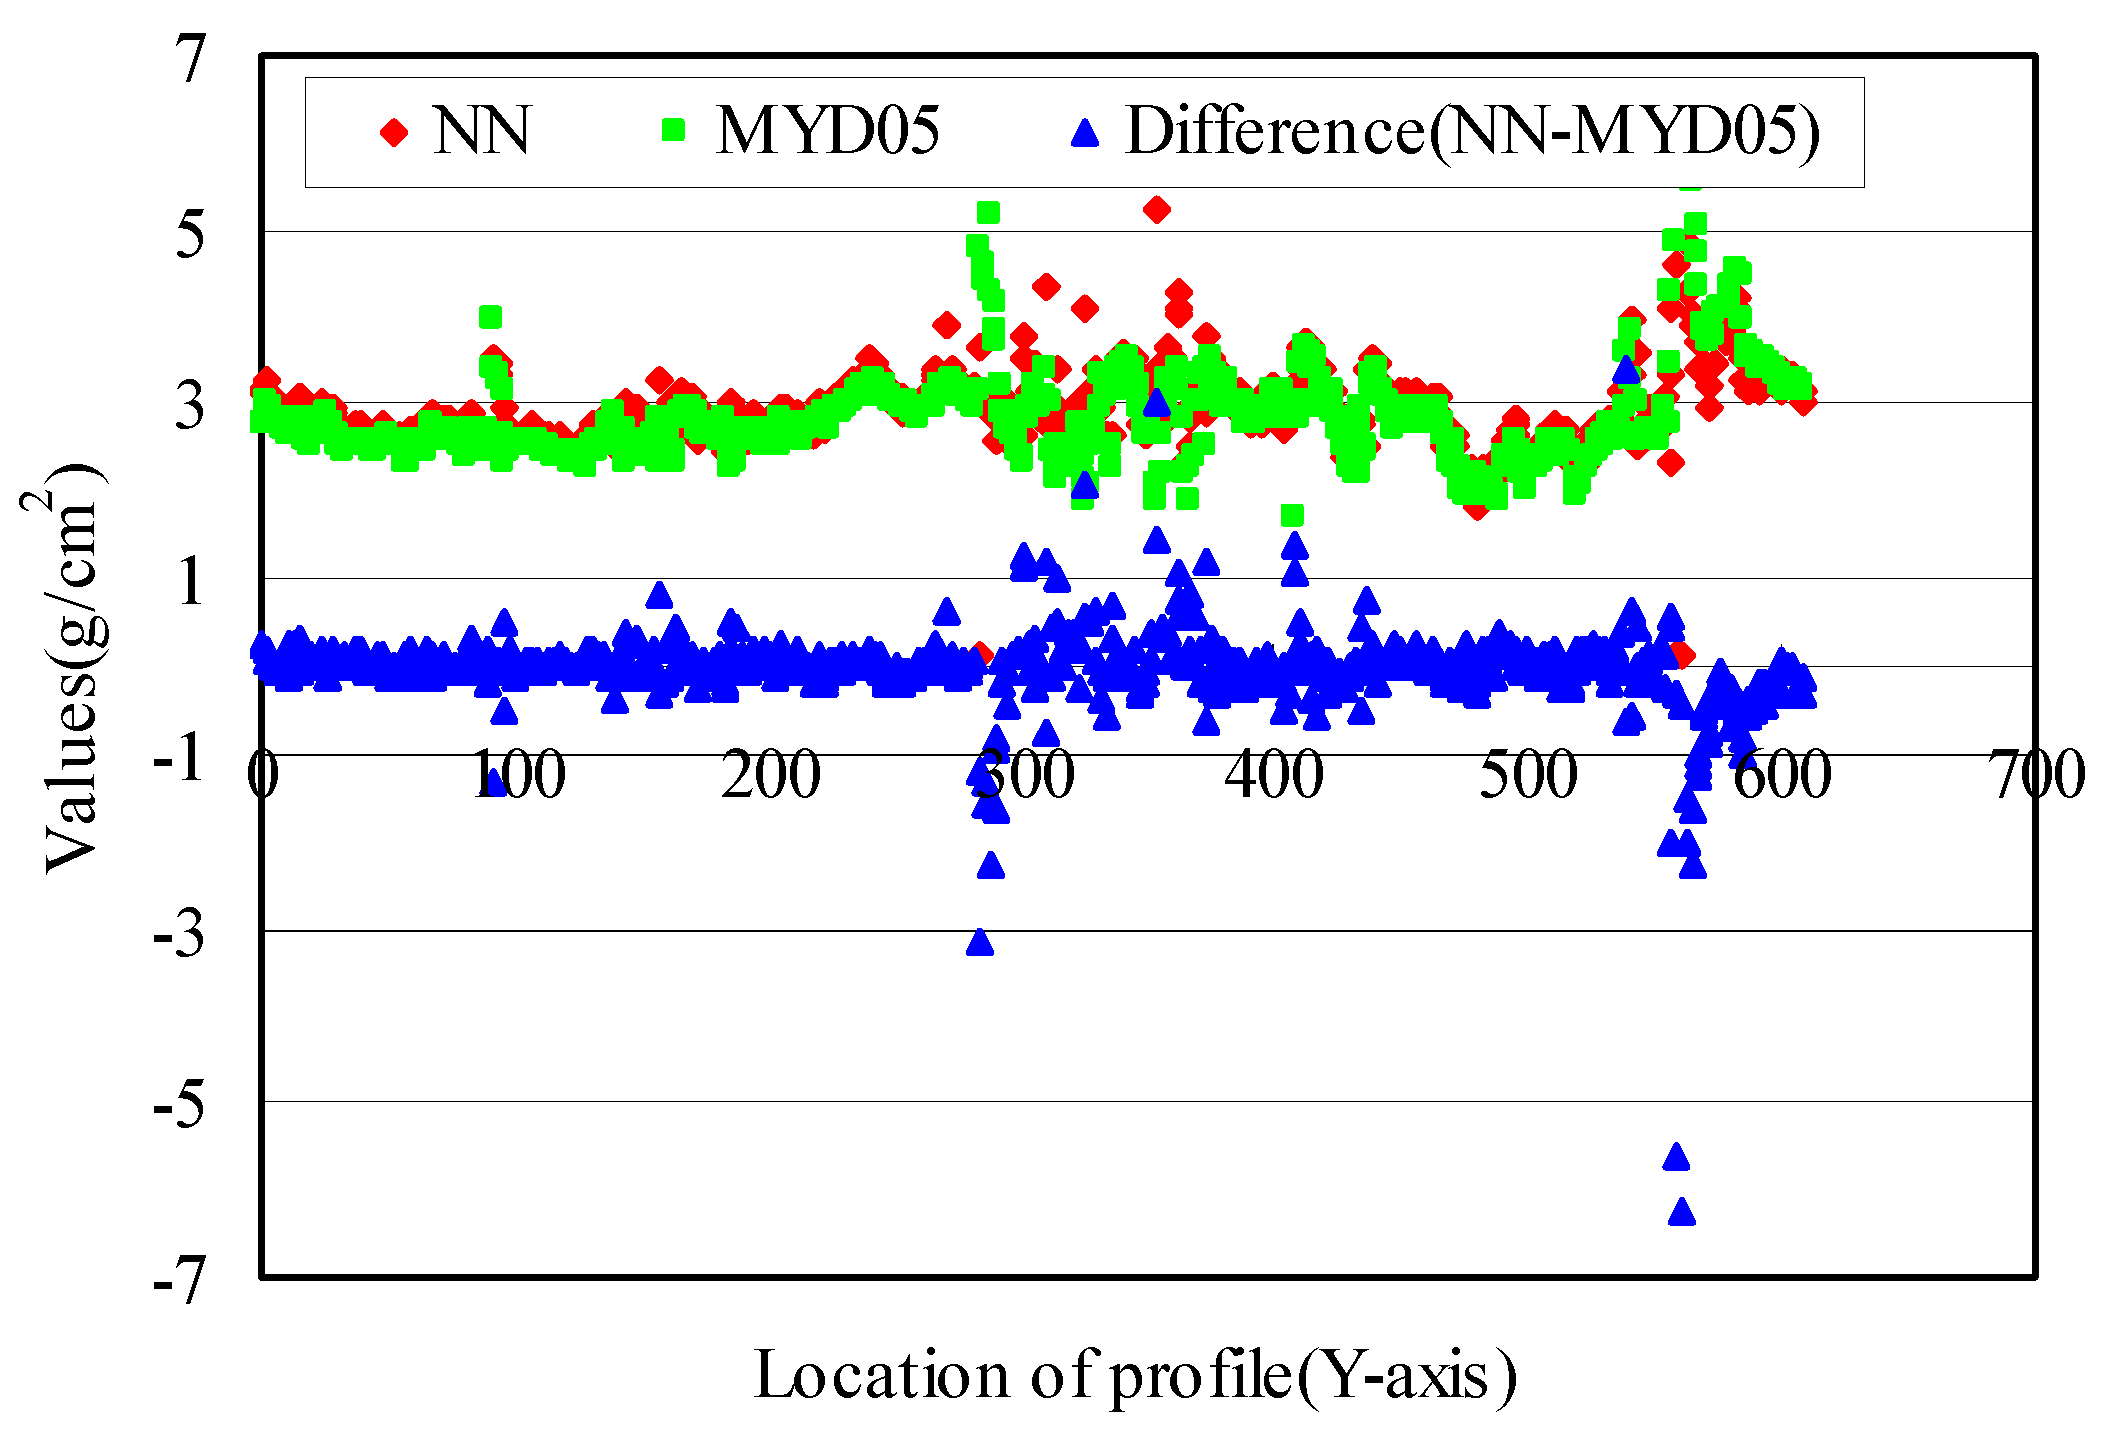
Figure 8.
MODIS1B image (bands 3, 2 and 1) in 1 August 2011.
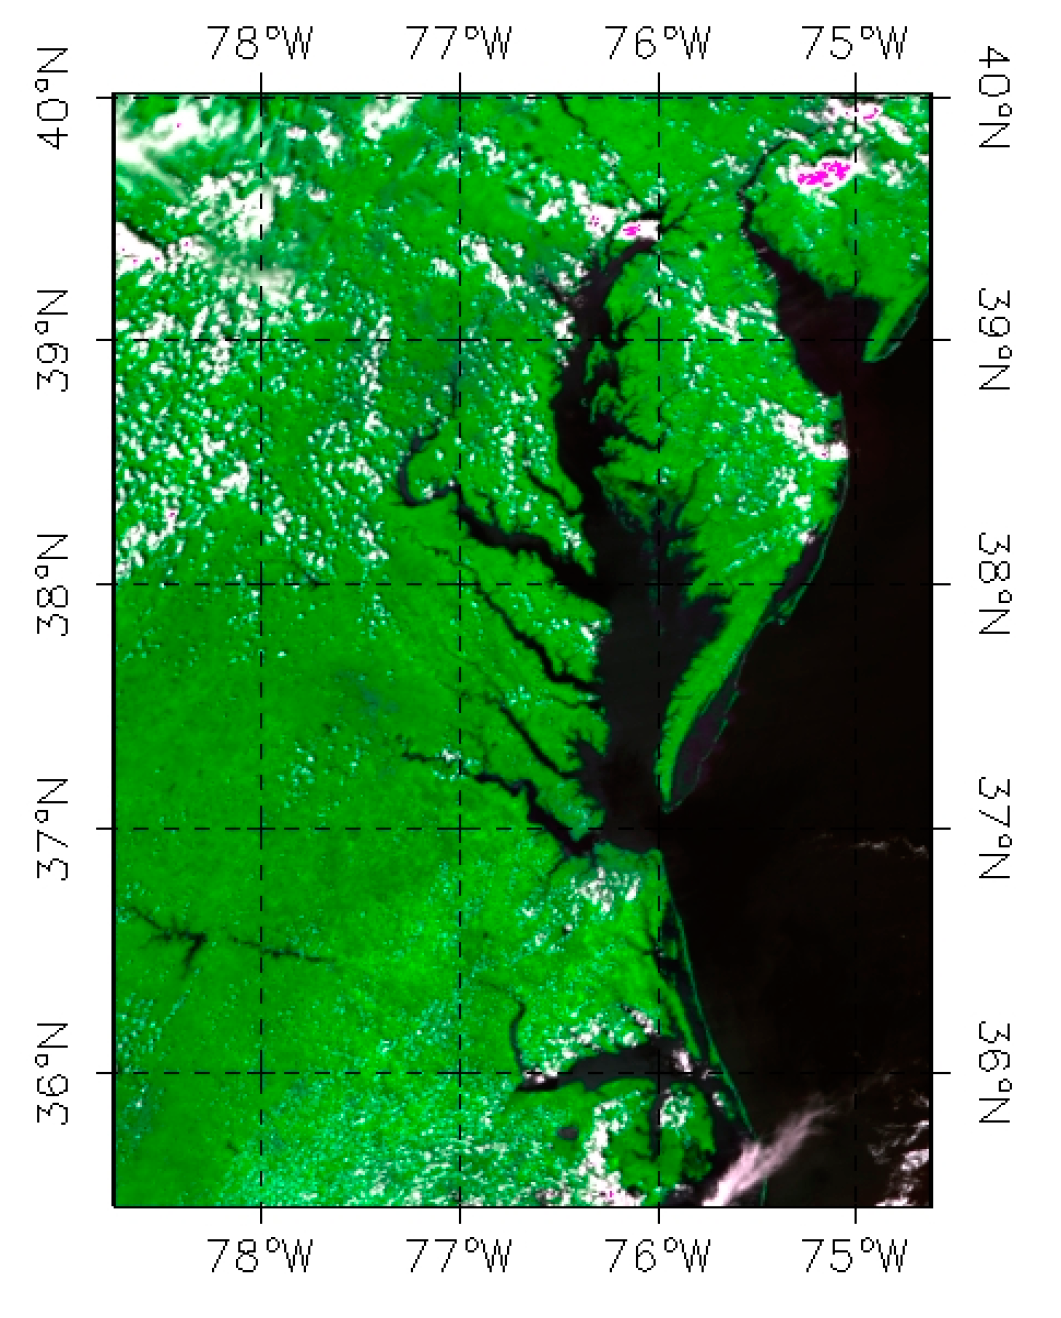
Figure 9.
MYD05_L2 product in America.

Figure 10.
Water vapor content retrieved by NN.

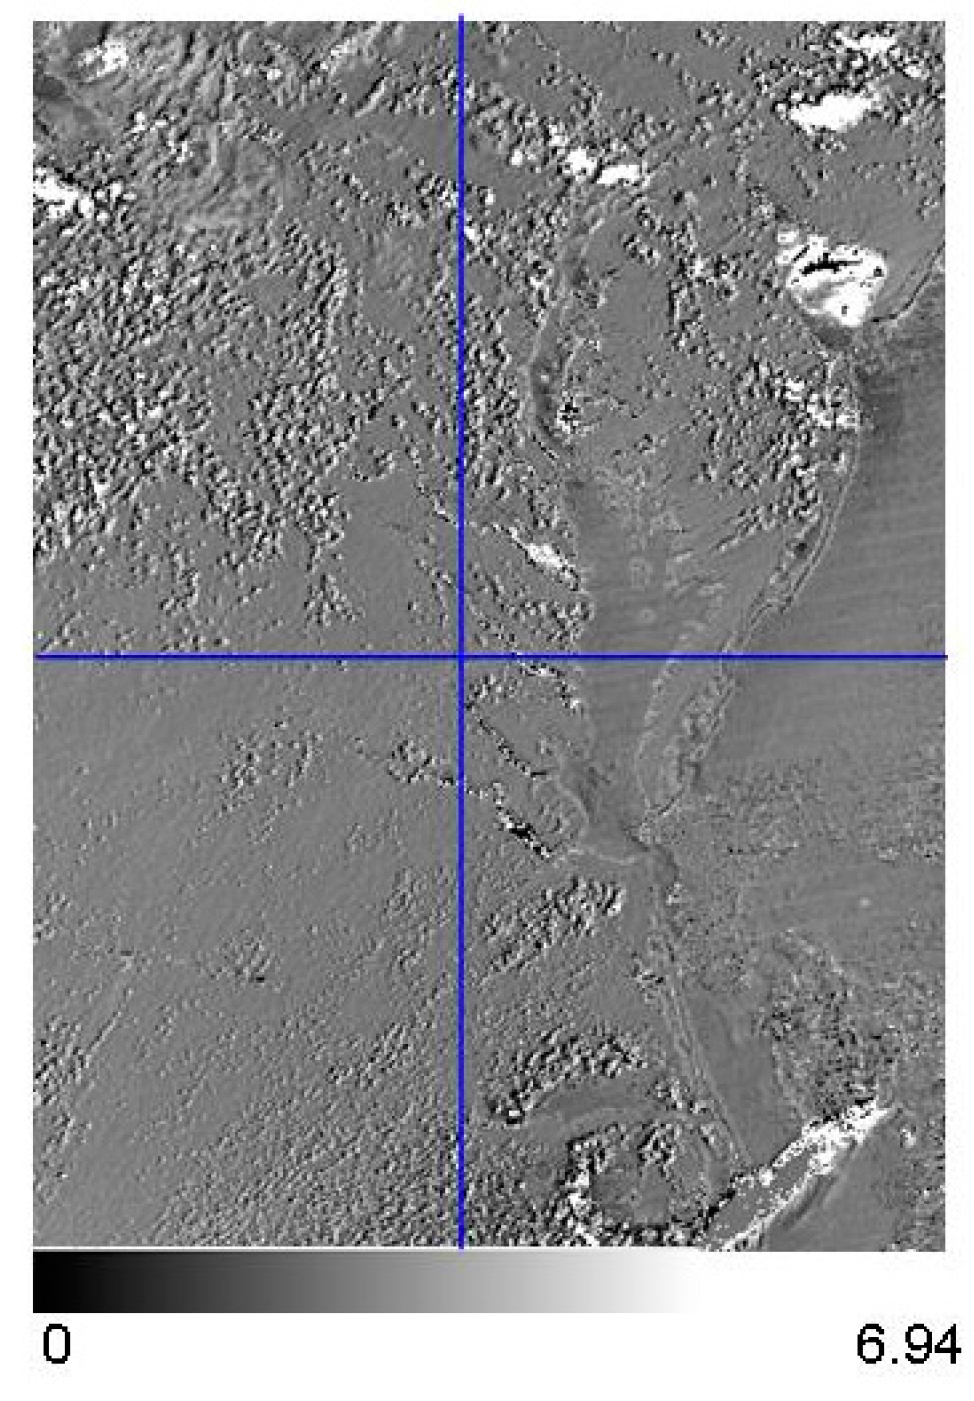
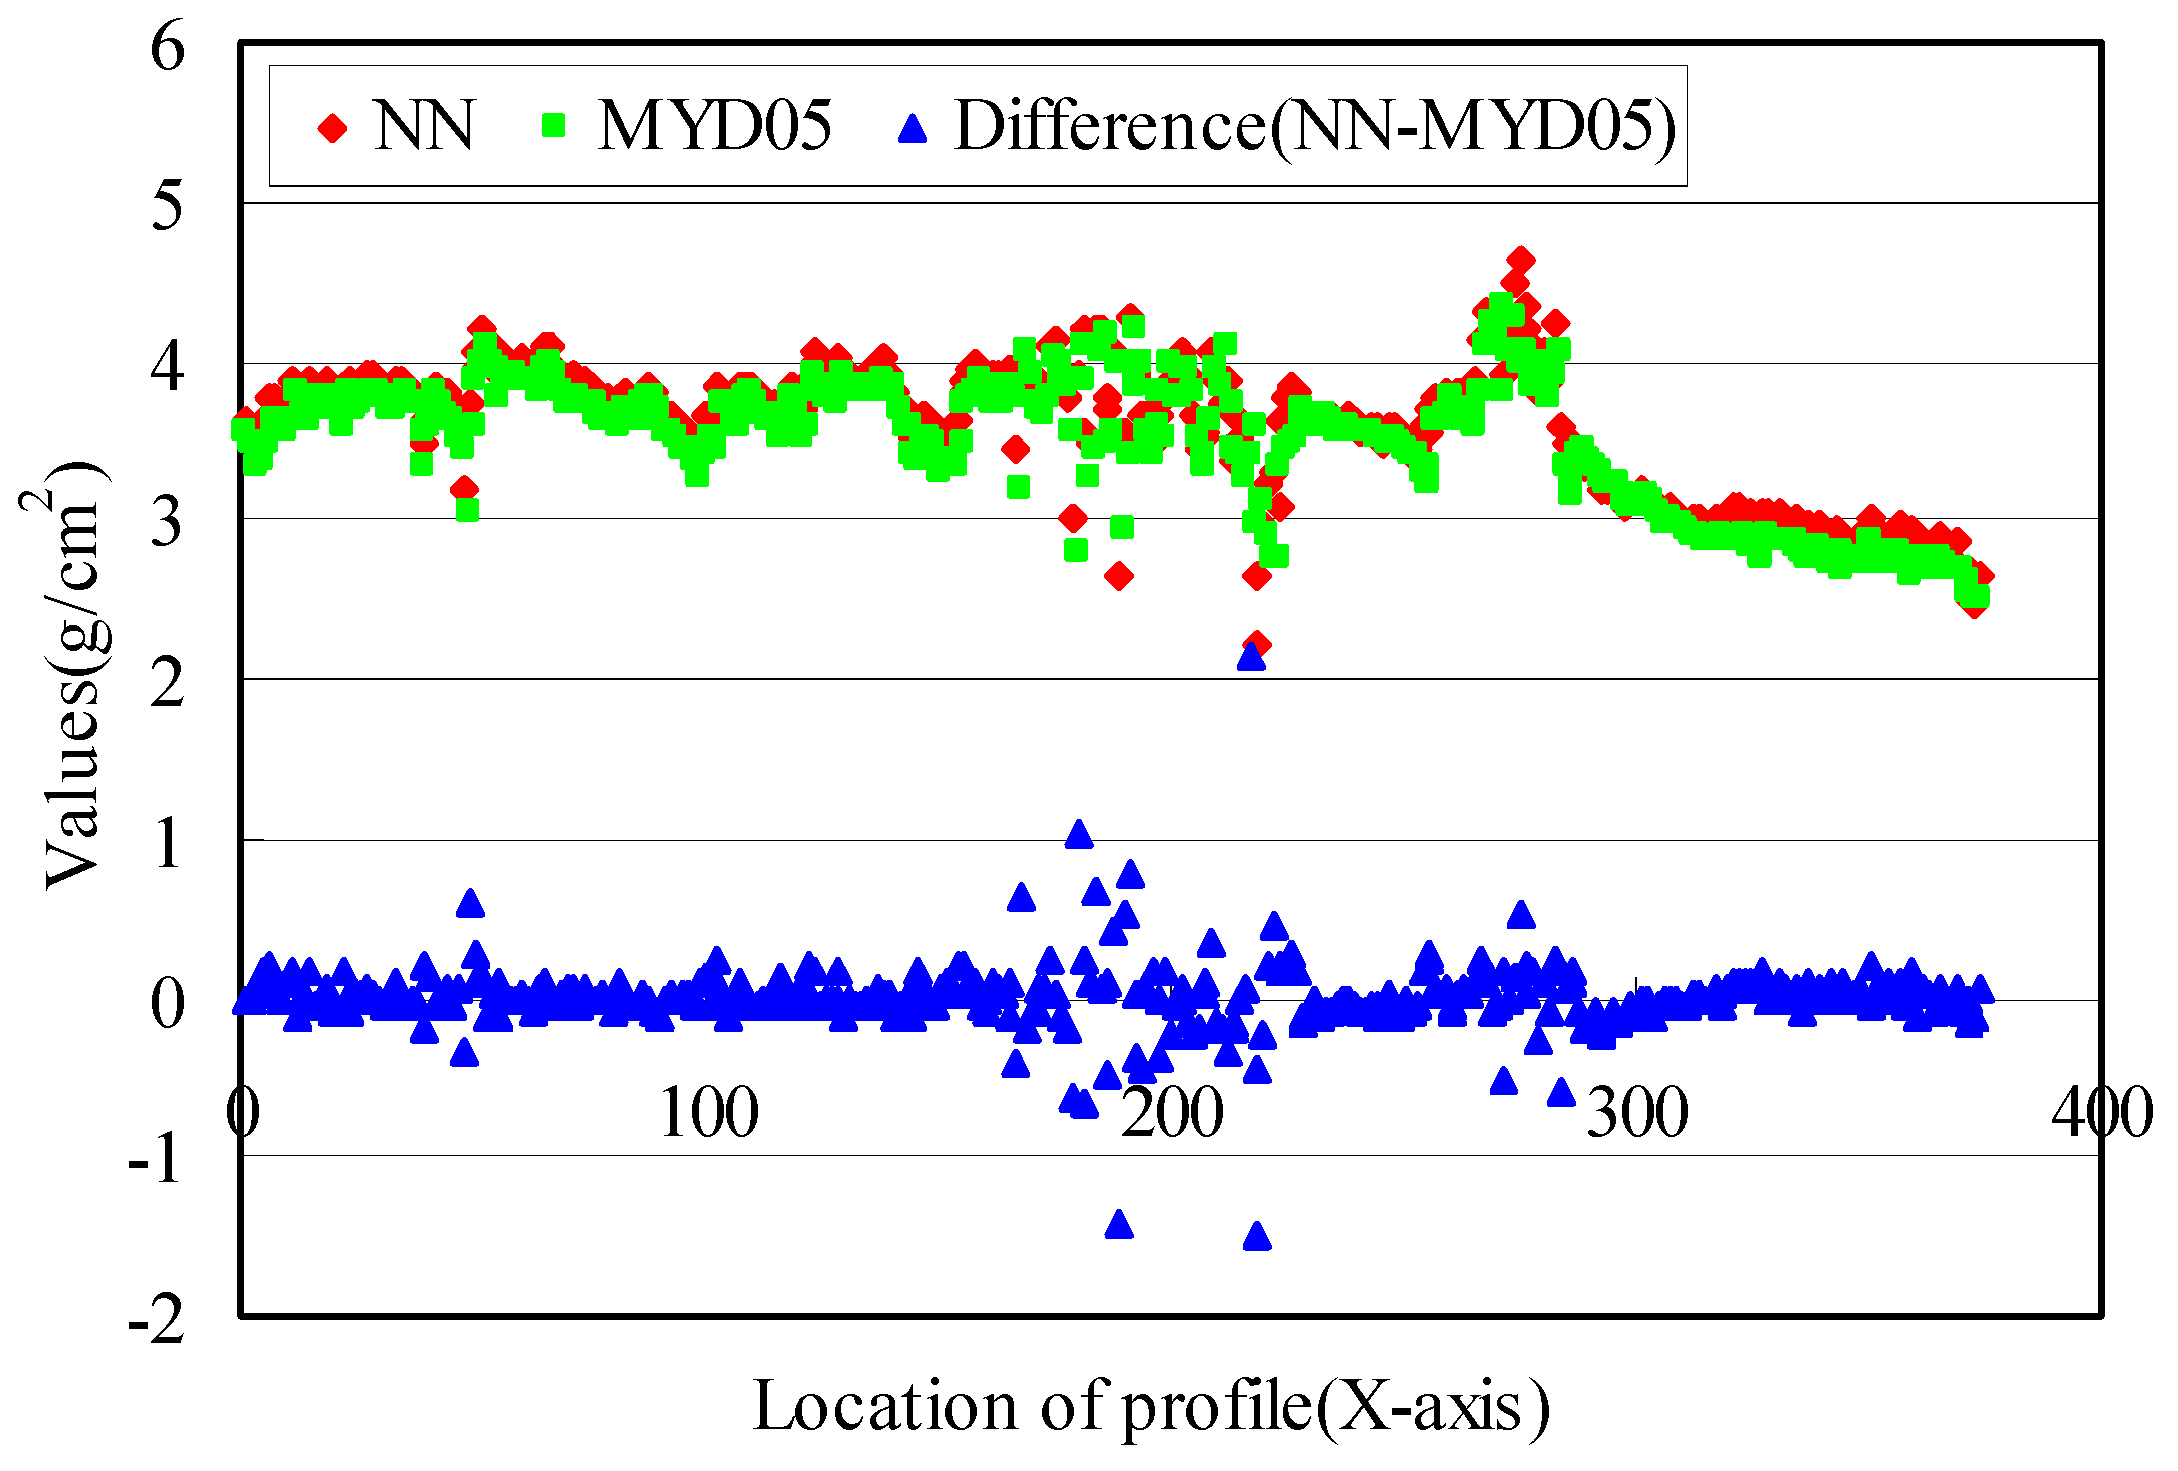

Figure 14.
Validation results.


Table 1.
Summary of retrieval error.
| Different Seasons and Regions | Hidden Nodes | Water Vapor Content | |||
|---|---|---|---|---|---|
| Average Error (g cm−2) | Average Error (%) | R | SD | ||
| Tropical | 400–400 | 0.049 | 4.3 | 0.996 | 0.06 |
| Mid-latitude Summer | 380–380 | 0.041 | 3.4 | 0.996 | 0.059 |
| Mid-latitude Winter | 370–370 | 0.041 | 3.4 | 0.997 | 0.059 |
| Sub-arctic Summer | 350–350 | 0.039 | 3.2 | 0.997 | 0.057 |
| Sub-arctic Winter | 350–350 | 0.038 | 3.1 | 0.998 | 0.056 |
| Above Included | 800–800 | 0.058 | 5.1 | 0.994 | 0.078 |
Table 2.
Precipitable water observation stations in China.
| Hangzhou-ZFU (30N, 119E) | Taihu (31N, 120E) | Hefei (31N, 117E) |
| Shouxian (32N, 116E) | NUIST (32N, 118E) | SACOL (35N, 104E) |
| Yulin (38N, 109E) | XiangHe (39N, 116E) | Yufa_PEK (39N, 116E) |
| PKU_PEK (39N, 116E) | Beijing (39N, 116E) | Xinglong (40N, 117E) |
| Liangning (41N, 122E) | Inner_Mongolia (42N, 115E) | Dalanzadgad (43N, 104E) |
Table 3.
Summary of retrieval error.
| Hidden Nodes | Water Vapor Content | |||
|---|---|---|---|---|
| Average Error (g cm−2) | Average Error (%) | R | SD | |
| 350–350 | 0.056 | 5.2 | 0.995 | 0.075 |
| 370–370 | 0.054 | 5 | 0.995 | 0.071 |
| 420–420 | 0.048 | 4.5 | 0.996 | 0.065 |
| 430–430 | 0.044 | 4.1 | 0.997 | 0.061 |
Table 4.
Precipitable water observation stations in America.
| COVE (36N, 75W) | EOPACE1 (36N, 75W) | COVE_SEAPRISM (36N, 75W) |
| EOPACE2 (36N, 75W) | Norfolk_State_Univ (36N, 76W) | EOPACE1 (36N, 75W) |
| Hampton_Roads (36N, 76W) | Wallops (37N, 75W) | Hog_Island (37N, 75W) |
| Cheritan (37N, 75W) | NASA_LaRC (37N, 76W) | Sterling (38N, 77W) |
| GSFC (38N, 76W) | Jug_Bay (38N, 76W) | Big_Meadows (38N, 78W) |
| SERC (38N, 76W) | Easton_Airport (38N, 76W) | Hagerstown (39N, 77W) |
| UMBC (39N, 76W) | USDA-Howard (39N, 76W) | Kolfield (39N, 74W) |
| USDA (39N, 76W) | Burtonsville (39N, 76W) | Burtonsville (39N, 76W) |
| MD_Science_Center (39N, 76W) | USDA-BARC (39N, 76W) | Gaithersburg (39N, 77W) |
| Philadelphia (40N, 75W) | Penn_State_Univ (40N, 78W) | Sandy_Hook (40N, 73W) |
© 2017 by the authors. Licensee MDPI, Basel, Switzerland. This article is an open access article distributed under the terms and conditions of the Creative Commons Attribution (CC BY) license (http://creativecommons.org/licenses/by/4.0/).
Share and Cite
MDPI and ACS Style
Mao, K.; Shen, X.; Zuo, Z.; Ma, Y.; Liu, G.; Tang, H. An Advanced Radiative Transfer and Neural Network Scheme and Evaluation for Estimating Water Vapor Content from MODIS Data. Atmosphere 2017, 8, 139. https://doi.org/10.3390/atmos8080139
AMA Style
Mao K, Shen X, Zuo Z, Ma Y, Liu G, Tang H. An Advanced Radiative Transfer and Neural Network Scheme and Evaluation for Estimating Water Vapor Content from MODIS Data. Atmosphere. 2017; 8(8):139. https://doi.org/10.3390/atmos8080139
Chicago/Turabian StyleMao, Kebiao, Xinyi Shen, Zhiyuan Zuo, Ying Ma, Guang Liu, and Huajun Tang. 2017. "An Advanced Radiative Transfer and Neural Network Scheme and Evaluation for Estimating Water Vapor Content from MODIS Data" Atmosphere 8, no. 8: 139. https://doi.org/10.3390/atmos8080139
Note that from the first issue of 2016, this journal uses article numbers instead of page numbers. See further details here.