Spatial Patterns and Temporal Changes in Atmospheric-Mercury Deposition for the Midwestern USA, 2001–2016


1
U.S. Geological Survey, Indianapolis, IN 46278, USA
2
Lake Michigan Air Directors Consortium, Rosemont, IL 60018, USA
*
Author to whom correspondence should be addressed.
Atmosphere 2018, 9(1), 29; https://doi.org/10.3390/atmos9010029
Submission received: 30 October 2017
/
Revised: 11 January 2018
/
Accepted: 12 January 2018
/
Published: 18 January 2018
(This article belongs to the Special Issue Atmospheric Metal Pollution)
Abstract
:Spatial patterns and temporal changes in atmospheric-mercury (Hg) deposition were examined in a five-state study area in the Midwestern USA where 32% of the stationary sources of anthropogenic Hg emissions in the continental USA were located. An extensive monitoring record for wet and dry Hg deposition was compiled for 2001–2016, including 4666 weekly precipitation samples at 13 sites and 27 annual litterfall-Hg samples at 7 sites. This study is the first to examine these Hg data for the Midwestern USA. The median annual precipitation-Hg deposition at the study sites was 10.4 micrograms per square meter per year (µg/m2/year) and ranged from 5.8 µg/m2/year to 15.0 µg/m2/year. The median annual Hg concentration was 9.4 ng/L. Annual litterfall-Hg deposition had a median of 16.1 µg/m2/year and ranged from 9.7 to 23.4 µg/m2/year. Isopleth maps of annual precipitation-Hg deposition indicated a recurring spatial pattern similar to one revealed by statistical analysis of weekly precipitation-Hg deposition. In that pattern, high Hg deposition in southeastern Indiana was present each year, frequently extending to southern Illinois. Most of central Indiana and central Illinois had similar Hg deposition. Areas with comparatively lower annual Hg deposition were observed in Michigan and Ohio for many years and frequently included part of northern Indiana. The area in southern Indiana where high Hg deposition predominated had the highest number of extreme episodes of weekly Hg deposition delivering up to 15% of the annual Hg load from precipitation in a single week. Modeled 48-h back trajectories indicated air masses for these episodes often arrived from the south and southwest, crossing numerous stationary sources of Hg emissions releasing from 23 to more than 300 kg Hg per year. This analysis suggests that local and regional, rather than exclusively continental or global Hg emissions were likely contributing to the extreme episodes and at least in part, to the spatial patterns of precipitation-Hg deposition in the study area. Statistically significant temporal decreases in weekly precipitation-Hg concentrations in the study area between the periods 2001–2013 and 2014–2016 were observed, coinciding with reported reductions in Hg emissions in the USA required by implementation of national Hg emissions-control rules. These decreases in atmospheric-Hg concentrations are believed to have resulted in the reduced atmospheric-Hg deposition recorded because precipitation depths between the two periods were not significantly different. The Hg-monitoring data for the study area identified an atmospheric deposition response to decreased local and regional Hg emissions.
1. Introduction
1.1. Mercury in the Environment
Mercury (Hg) is a persistent environmental contaminant and can accumulate and concentrate in food webs as methylmercury (MeHg), presenting a health risk to humans and wildlife [1]. MeHg exposure can result in adverse neurological, cardiovascular and reproductive effects in humans [2]. Developing infants and children are most susceptible to the harmful effects of MeHg but adults have been affected by MeHg poisoning too [3]. Neurological development and reproduction in wildlife can be damaged by MeHg exposure [4]. Because MeHg concentrations are highest at top levels in the aquatic food web, humans, wild mammals and birds who consume fish risk exposure to harmful concentrations of MeHg. Public health agencies have issued advisories that warn about consumption of freshwater and marine fish because of risks from Hg [5].
Most of the Hg in aquatic and terrestrial ecosystems comes from atmospheric deposition and atmospheric Hg predominantly originates from human activities [3,6,7]. The three operationally-defined species of atmospheric Hg are gaseous elemental Hg (GEM), gaseous oxidized Hg (GOM) and particulate-bound Hg (PBM), as summarized in previous research [6,7,8]. Transfers of GOM and PBM from the atmosphere to the biosphere occur episodically in precipitation (rain, snow, sleet, hail and fog), which is sometimes called wet deposition and is called precipitation-Hg deposition hereafter. Other transfers of GEM, GOM and PBM from the atmosphere to vegetation, soil, impervious surfaces and water, called dry-Hg deposition hereafter, can be more continuous. The vertical dry-deposition velocity to a forest landscape can be 2 to 5 times larger than the velocity to other landscapes for all three Hg species because the greater leaf surface area and canopy roughness in a forest intercepts air flow and amplifies dry-Hg deposition to vegetation [8].
Previous studies of atmospheric-Hg deposition in the USA have not focused on the Midwestern region. Rather, studies have had a national scope [9,10,11,12], or targeted a large region including part of the Midwest [13,14,15,16,17,18]. Some earlier studies focused on a single Midwestern state [19,20,21,22,23,24,25]. Therefore, the study described here fills a geographic gap in atmospheric-Hg research by investigating a multi-state area in the Midwestern USA with an extensive Hg-monitoring record and considerably high amounts of long-term anthropogenic Hg emissions.
1.2. Purpose and Scope
The purpose of this study was to describe spatial patterns and temporal changes in atmospheric-Hg concentrations and Hg deposition and to relate the observations to potential contributing factors such as weather and Hg sources in a study area centered on Indiana and four surrounding Midwestern states in the USA (Illinois, Michigan Lower Peninsula, Ohio and Kentucky). Precipitation-Hg and dry-Hg deposition data for this study were compiled and summarized for 2001–2016. Interpretations from this study explain the long-term status of atmospheric-Hg deposition in an intensively monitored study area with substantial anthropogenic Hg emissions.
1.3. Hg Emissions Sources
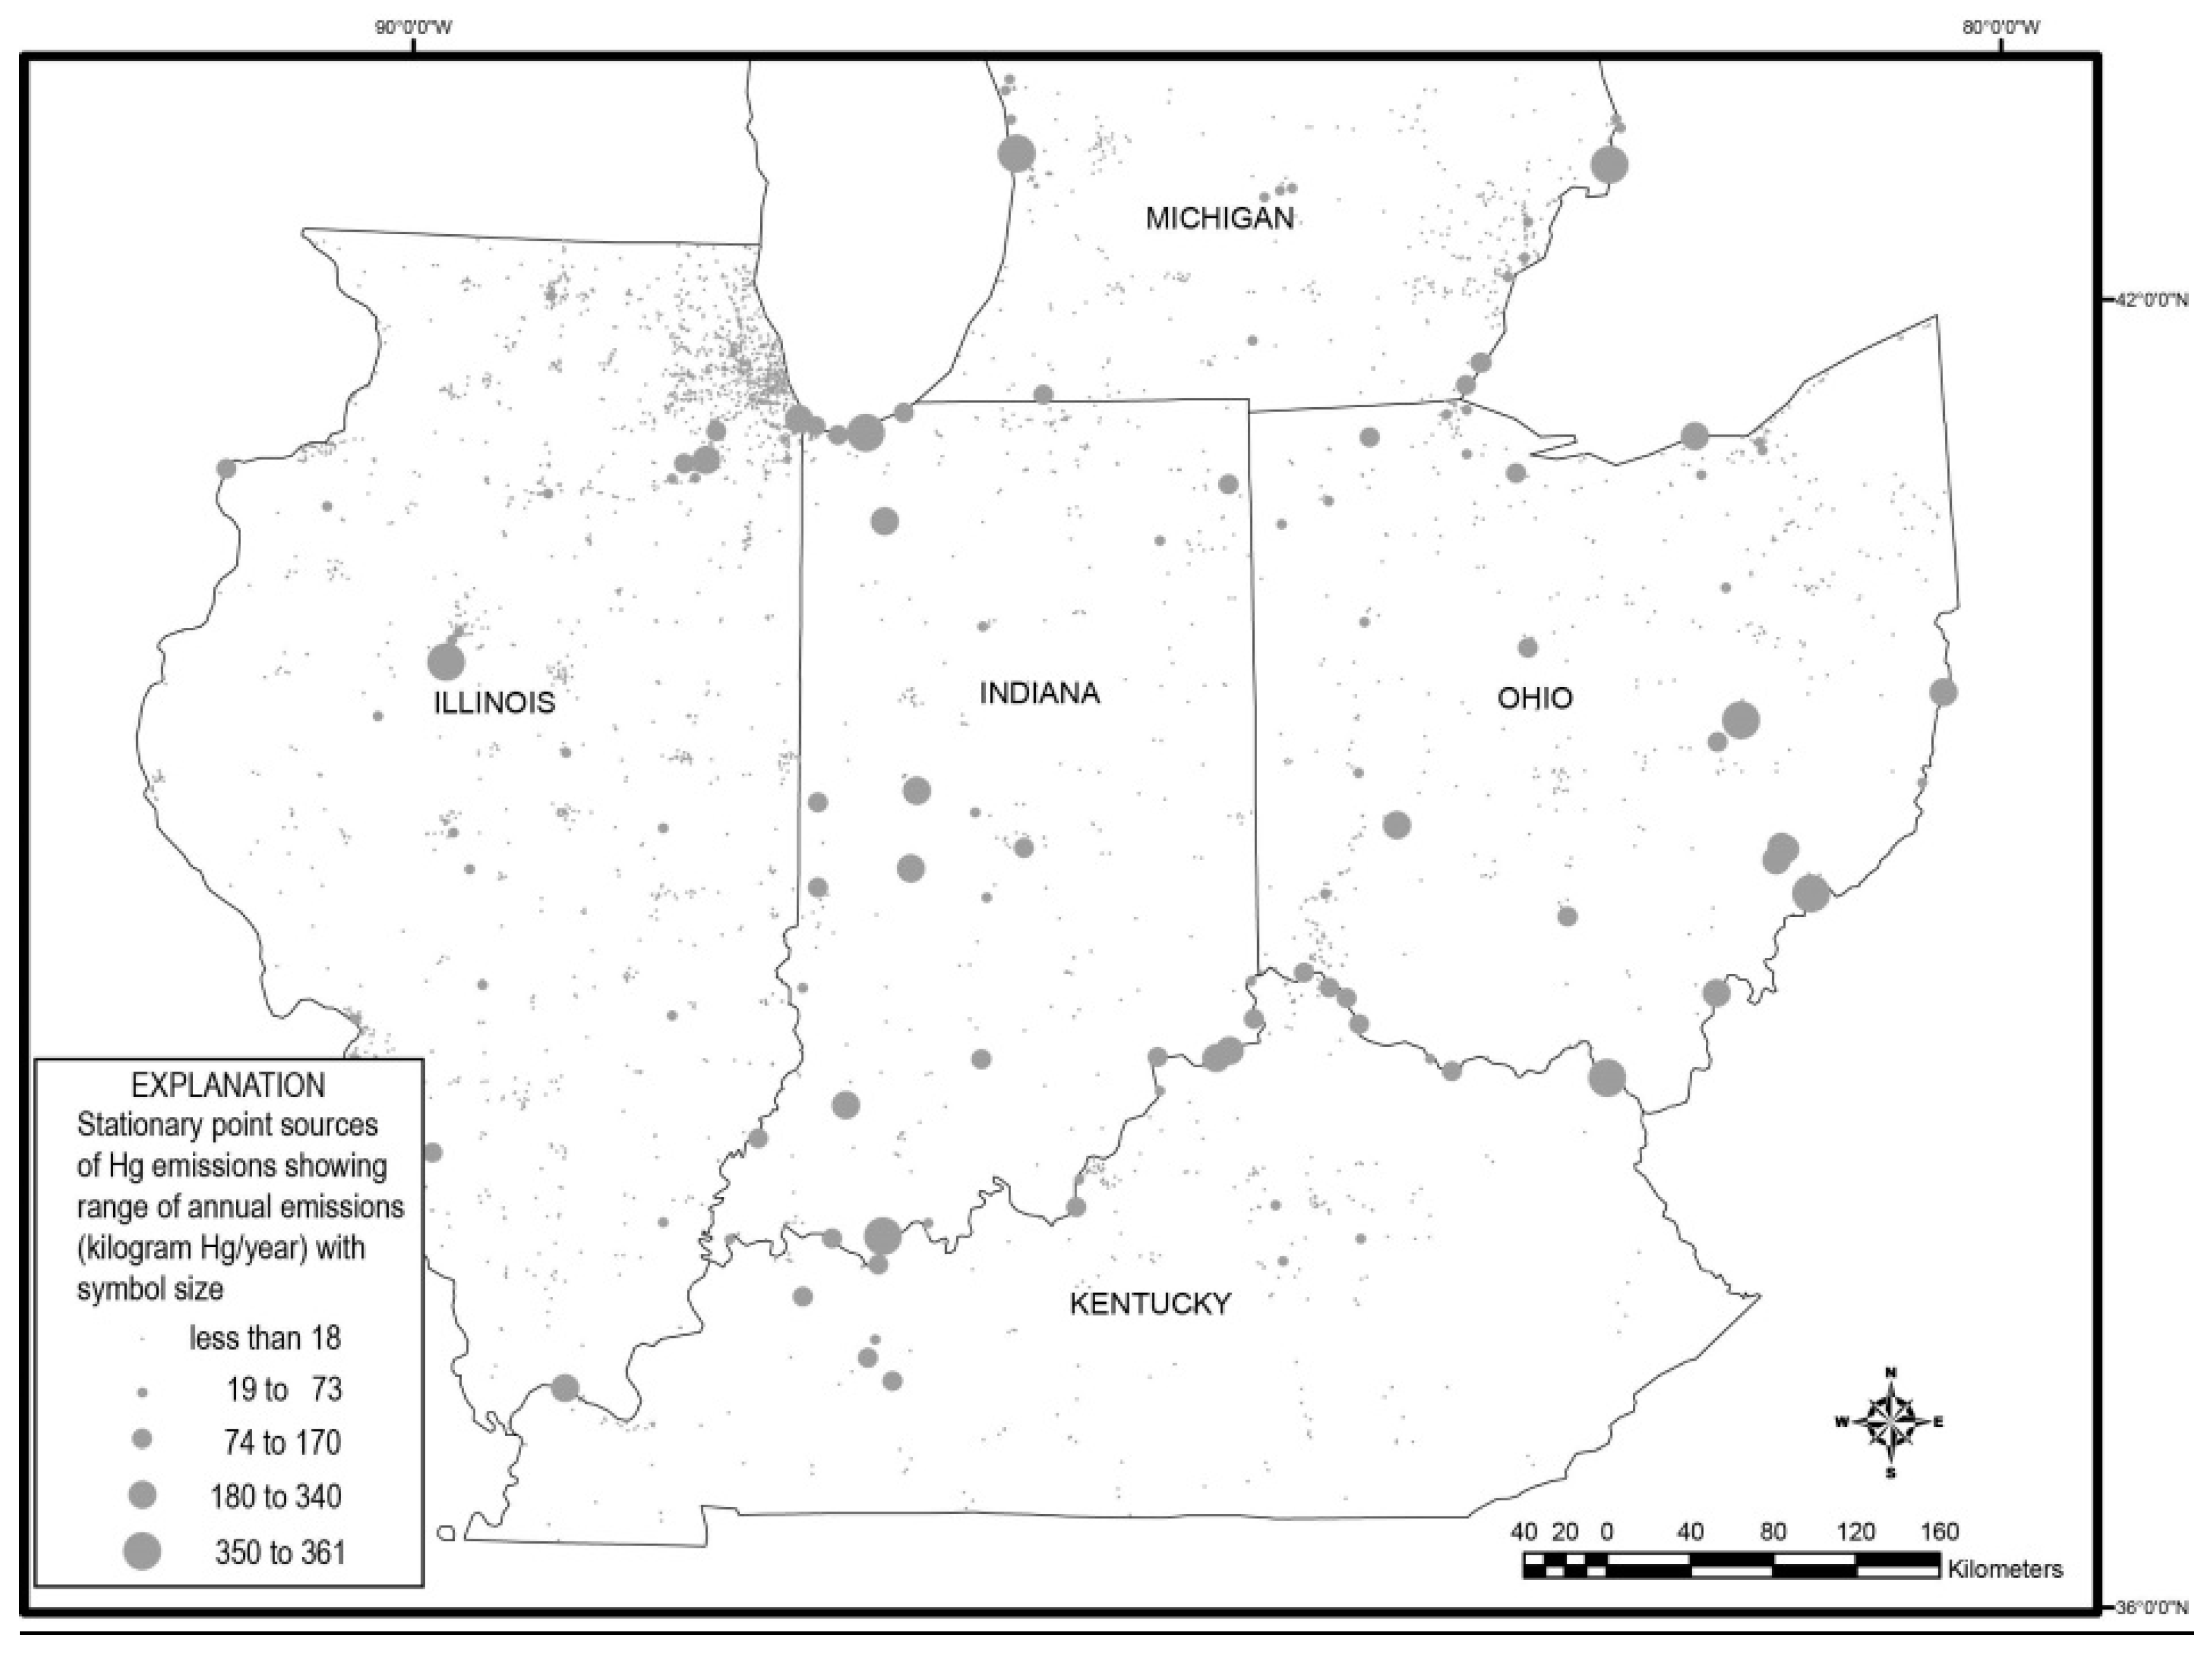
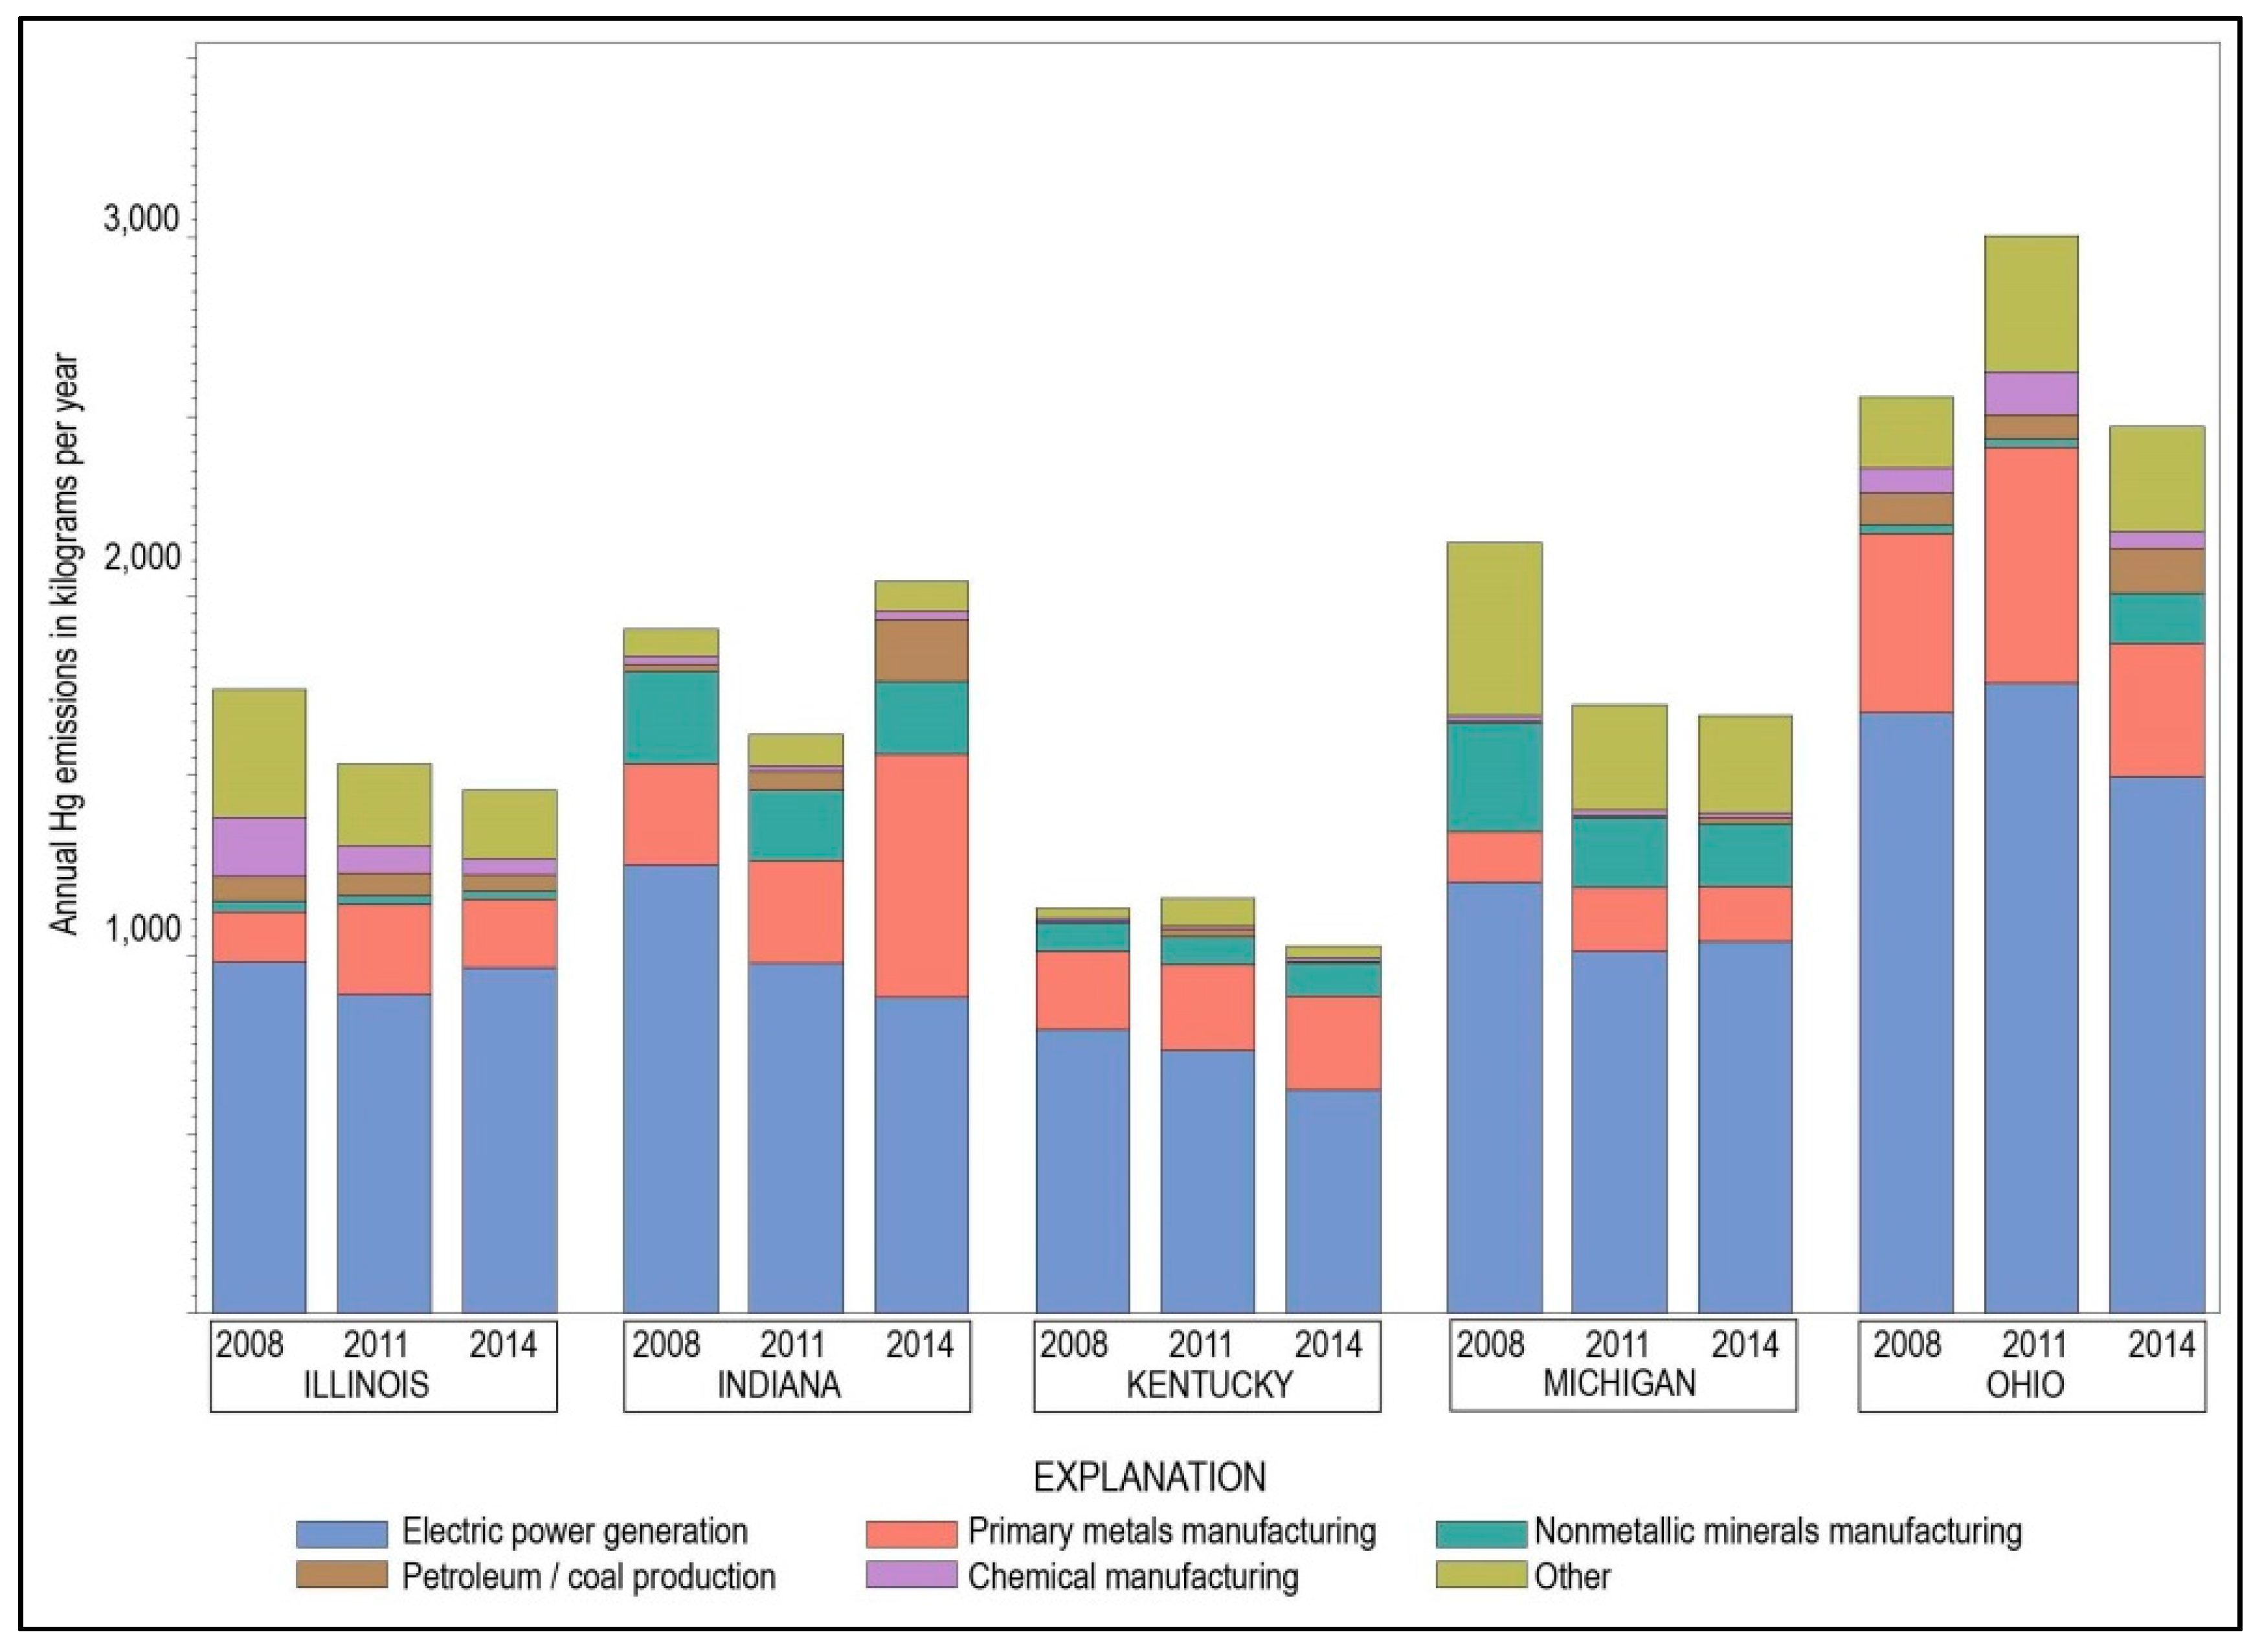
The Midwestern USA region has a history of numerous anthropogenic Hg emission sources, including those with high annual emission rates. As of 2014, 7861 kg/year of Hg were emitted from 3940 stationary sources in the five states of the study area [26]. These 5 states include 32% of the 12,377 sources and 20% of the 39,395 kg of Hg emissions in the 48 states in the continental USA. The Hg sources in the study area were broadly distributed geographically (Figure 1) and varied by 5 orders of magnitude in annual Hg emission rates (Table 1). A large percentage of the sum of annual Hg emissions in the study area came from a small number of sources. Most sources contributed a relatively small percentage of the total for the study area. Considering Indiana as an example, the sum of the top 10% of ranked annual Hg emissions (from 36 of 358 sources) amounted to 1807 kg, which was 97.5% of the state’s total. The two dominant categories for these 36 Hg emissions sources were electric power generation and primary metal manufacturing, accounting for 77.5% of the 1807 kg. Comparable results were tabulated for the other four states, indicating the stationary sources with the highest Hg emissions were consistently important throughout the study area (Figure 1). Annual Hg emissions varied for each state from emissions inventories as of 2008, 2011 and 2014 [26,27,28], but comparative ranks among states were the same, from highest to lowest totals—Ohio, Indiana, Michigan, Illinois and Kentucky (Figure 2). In addition, the relative contributions of Hg emissions from the six categories were comparable from year to year and state to state, where electric power generation and primary metals manufacturing contributed approximately three-fourths of the totals. For the top 1% of ranked Hg emissions in the continental USA, 21 of the 124 sources (17%) are in the study area, accounting for 3274 of the 22,286 kg (15%) of the total Hg emissions. Those top 124 sources contribute 57% of total Hg emissions in the continental USA. A comparison of the distribution of stationary Hg emissions sources in the USA with those in this study area can be made by consulting maps from the National Oceanic and Atmospheric Administration [29], Castro and Sherwell [30] and Risch et al. [31].
1.4. Atmospheric-Hg Monitoring
Monitoring atmospheric-Hg deposition is a necessary complement to regulations of Hg emissions to the air. The National Atmospheric Deposition Program (NADP) has the primary atmospheric-Hg monitoring networks in the USA. The NADP is an affiliation of federal, state, local, tribal, academic and private entities that sponsor the operation of individual monitoring sites or groups of sites. The Mercury Deposition Network (MDN) measures precipitation-Hg deposition [32]. In the MDN, uniform protocols are used to collect composite weekly precipitation samples and to measure precipitation depths. Standardized equipment includes an automated precipitation collector plus a continuous-recording rain gage. The Hg concentration in the sample and the precipitation depth are used to compute weekly precipitation-Hg deposition. Data are quality assured by internal and external programs [33]. Annual precipitation-Hg deposition for Midwestern states has been included in previous large-scale assessments using data from the NADP-MDN. In these assessments, Prestbo and Gay [10] reported a range of precipitation-Hg deposition from 8 to 13 micrograms per square meter per year (µg/m2/year) for 1996–2005, while Risch et al. [16] found 7 to 17 µg/m2/year for 2002–2008 and the National Atmospheric Deposition Program maps [34] reported 7 to 14 µg/m2/year for 2009–2015. Data from NADP-MDN were included in this study.
The NADP has two monitoring networks for dry-Hg deposition. First, the Litterfall Mercury Monitoring Initiative (LMMI) measures ambient litterfall-Hg deposition [35]. In this network, passive collectors near MDN sites are used to obtain autumn litterfall samples that are analyzed for Hg concentration and litterfall mass to compute annual litterfall-Hg deposition. Risch et al. [18] reported mean annual litterfall-Hg deposition in Midwestern states were the highest in the eastern USA and ranged from 12.6 to 18.8 µg/m2/year for 2007–2014. Litterfall Hg is thought to represent 75% of dry-Hg deposition to deciduous forests in North America and Europe [36] and was reported previously to be 60 to 80% of dry-Hg deposition at sites in the eastern USA [16,37,38,39,40]. Data from NADP-LMMI were included in this study.
Second, the Atmospheric Mercury Network (AMNet) [41,42] measures semi-continuous, surface-air concentrations of GEM, GOM and PBM. Research by Zhang et al. [43] stated the range of modeled annual dry-Hg deposition in the eastern USA was 5.1 to 23.8 µg/m2/year during 2009–2014. These annual rates were based on AMNet GEM, GOM and PBM concentrations and modeled vertical deposition velocities matched to land cover near each site, with daily data aggregated into annual values. The range of modeled annual dry-Hg deposition aligned closely with annual litterfall-Hg deposition measured at MDN sites [43]. Data from NADP-AMNet sites were not included in this study because sites were absent in Midwestern states before 2016.
2. Methods
Annual precipitation-Hg data for the study sites during 2001–2016 were derived from weekly monitoring data in the NADP-MDN data base [44]. Annual data from years with monitoring observations completed for all 52 weeks were compiled and data from incomplete years were not included. Weekly observations with precipitation depth <0.25 mm and no reported Hg concentration were not included (<12% of all observations). Data from weekly precipitation samples in complete years were examined in this study and included weeks with (a) a valid precipitation depth >0.25 mm and reported Hg concentration and Hg deposition (>97% of all samples); and (b) a valid precipitation depth >0.25 mm and estimated Hg concentrations and Hg deposition (<3% of all samples). Missing weekly Hg values were estimated with data from valid samples using the methods from previous research [10,16,23]. Weekly precipitation-Hg deposition is the product of Hg concentration (in nanogram per liter, ng/L) and precipitation depth (in mm), yielding nanogram per square meter (ng/m2/week). Annual precipitation-Hg deposition is the sum of the weekly deposition values, in microgram per square meter per year (µg/m2/year) and annual Hg concentration is the sum of weekly precipitation-weighted Hg concentrations (products of weekly Hg concentration and the ratio of weekly precipitation depth to annual precipitation depth).
Annual litterfall-Hg data for the study sites during 2007–2016 were derived from Risch [45,46]. Litterfall-Hg samples were collected and analyzed with standardized methods [18]. Annual litterfall dry mass in gram per square meter (g/m2) and annual litterfall-Hg concentration in nanogram per gram (ng/g) were used to compute the annual litterfall-Hg deposition in µg/m2/year, the same units as those for annual precipitation-Hg deposition.
Nonparametric statistics were used to compare data from sites, samples and time periods in this study. The Wilcoxon rank-sum test was applied to determine differences between two groups. The Kruskal-Wallis rank-sum test was applied to determine differences among multiple groups and the Tukey multiple comparisons of medians was applied to pairs among those groups. Relations among factors contributing to Hg deposition were examined with the Spearman rank correlation coefficient rho and linear regression. A p-value less than 0.05 was selected to indicate a statistical significance.
An inverse-distance weighting algorithm in geographic information system software was used to prepare isopleth grids of annual precipitation-Hg concentrations for MDN sites in and near the study area for selected years. These precipitation-Hg concentration grids were multiplied by an overlay of annual precipitation depths for the corresponding years, obtained from PRISM [47]), to create isopleth maps of annual precipitation-Hg deposition. These maps were used to interpret spatial patterns of annual precipitation-Hg deposition in the study area.
The air pollution transport and dispersion modeling system HYSPLIT [48] was used to calculate the paths of air masses contributing to selected precipitation-Hg deposition episodes in the study area during 2009–2015 when continuous, digital precipitation depth data were recorded at the monitoring sites. The 40-km gridded input data to HYSPLIT were from the National Oceanic and Atmospheric Administration [49]. Precipitation-Hg deposition episodes that were examined contained hourly precipitation depth totals >2.54 mm. For the selected episodes, HYSPLIT was used to calculate the hourly position coordinates of the contributing air mass during 48 h preceding the episode. Back trajectories were plotted from starting heights of 100 m, 300 m and 500 m above ground level [50]. These trajectories were not constrained and the actual height of the air mass as it traveled could vary from ground level to the boundary layer at 1000 m to 2000 m. The most recent Hg-emission data [26] were overlain on a map that combined the back trajectories paths for the three starting heights for the selected episodes.
3. Results
3.1. Precipitation-Hg Deposition
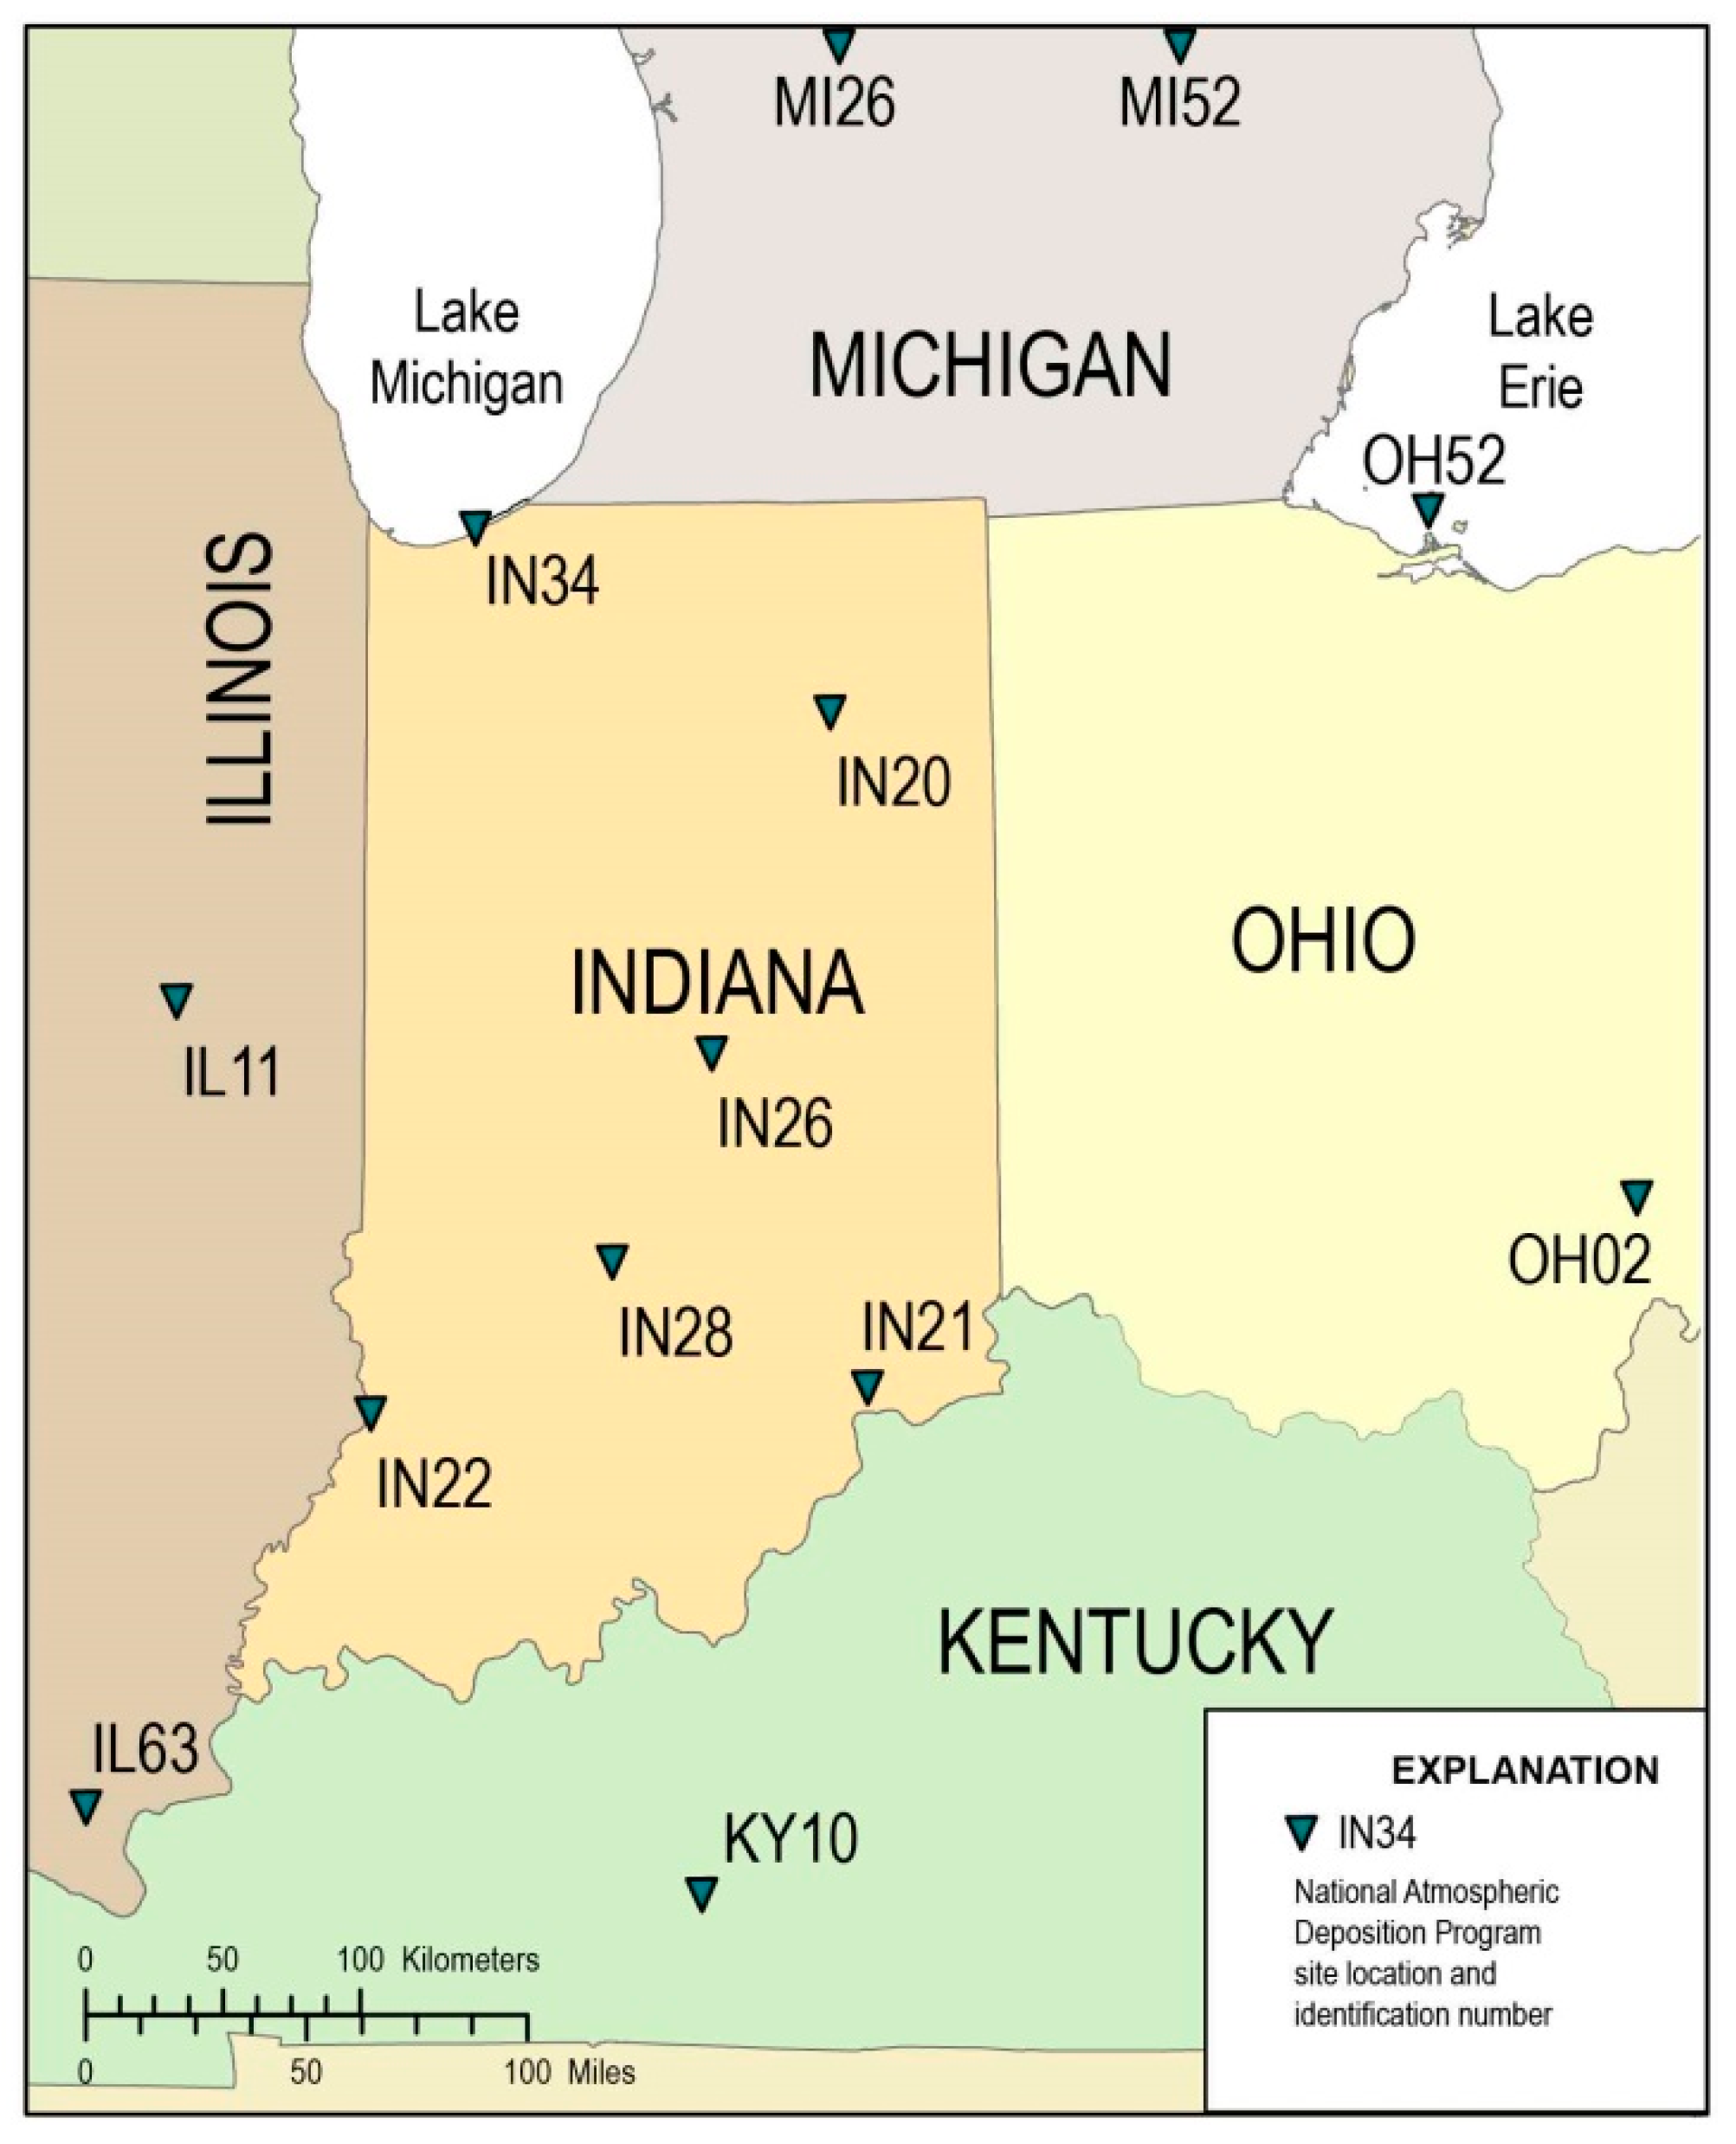
Annual and weekly precipitation-Hg data were compiled for 13 sites in the study area (Figure 3, Table 2). Complete annual records were not available for every year at all sites in the study period (Table 3). Because the most annual records during 2001–2016 were from sites in Indiana, separate interpretive analyses for Indiana were made for comparison with the study area.
Data from the 5-state study area included 4666 samples out of 5304 observations from 2 to 16 complete annual records per site (Table S1 in Supplementary Materials). Data for sites in Indiana were from 2492 samples out of 2860 observations from 3 to 15 annual records per site, which comprise 61% of samples in the study area. Overall, the median annual Hg deposition was 10.4 µg/m2/year, with a median annual Hg concentration of 9.4 ng/L and median annual precipitation depth of 1098 mm/year. Sites in Indiana had higher values in that the median annual Hg deposition was 11.4 µg/m2/year with a median annual Hg concentration of 9.6 ng/L and median annual precipitation depth of 1154 mm/year. For individual sites in the study (Table 4), median annual Hg deposition ranged from 5.8 µg/m2/year at OH52 with 2 years of data (2015–2016) to 15.0 µg/m2/year at IN21 with 13 years of data (2001–2016).
The median weekly Hg deposition in all samples from the study area, 2001–2016 was 144 ng/m2/week, with a median weekly Hg concentration of 9.5 ng/L and a median weekly precipitation depth of 17.0 mm. Samples from sites in Indiana had higher values in that median weekly Hg deposition was 157 ng/m2/week, with a median weekly Hg concentration of 9.9 ng/L and a median weekly precipitation depth of 17.8 mm.
3.2. Litterfall-Hg and Atmospheric-Hg Deposition
Annual litterfall-Hg deposition was measured at 5 sites in Indiana, one site in Ohio and one site in Kentucky, for 3 to 8 years 2007–2016 (Table 5 and Table 6). Annual litterfall-Hg deposition in the study area ranged from 9.7 to 23.4 µg/m2/year, with a median of 16.1 µg/m2/year, based on annual litterfall Hg-concentrations that ranged from 33.4 to 58.8 ng/g, with a median of 45.1 ng/g and annual litterfall mass that ranged from 236 to 588 g/m2, with a median of 377 g/m2 (Table 7). Summary data for Indiana were similar. The sum of precipitation-Hg and litterfall-Hg deposition is a reasonable estimate of the annual atmospheric-Hg deposition, assuming that most of the annual dry-Hg deposition to a forest landscape comes from litterfall [18]. Based on this assumption, estimated annual atmospheric-Hg deposition in the study area ranged from 17.5 to 39.2 µg/m2/year, with a median of 26.4 µg/m2/year. Summary data for Indiana were similar.
4. Discussion
4.1. Spatial Patterns in Hg Deposition
Spatial patterns of precipitation-Hg deposition in the study area were examined with statistical analysis of the weekly data and with isopleth maps of annual data. Statistical analysis revealed a spatial pattern of differences in weekly precipitation-Hg deposition. During 2001–2016, Hg deposition at IN21 (median 196.2 ng/m2/week, 13-year record) was significantly higher (p < 0.001) than that at IL11, IN20, IN34, MI26, MI52, OH02 and OH52 (Figure 3, Table 8). The sites in Indiana differed according to the same spatial pattern of the study area in that the southeastern site IN21 was significantly higher (p = 0.001) than the northeastern site IN20 and the northwestern site IN34. In contrast, Hg deposition at 7 sites located in the central and southern part of the study area was not significantly different—IN21, IN22, IN26, IN28, IL63 and KY10. The site with the highest median weekly precipitation-Hg deposition was IL63 with 198.3 ng/m2/week, which was significantly different from 4 sites during 2014–2016—MI26, MI52, OH52 and OH02. Some of the statistical differences among sites in the study can be attributed to the temporal changes discussed in the next section and comparisons limited to the years with complete annual records for each site (Table 3). Annual litterfall-Hg deposition (Table 7) and estimated atmospheric-Hg deposition (sum of litterfall-Hg and precipitation-Hg deposition) for 2007–2016 were not significantly different among 7 sites in the study area or among 5 Indiana sites (p = 0.25 and p = 0.54, respectively).
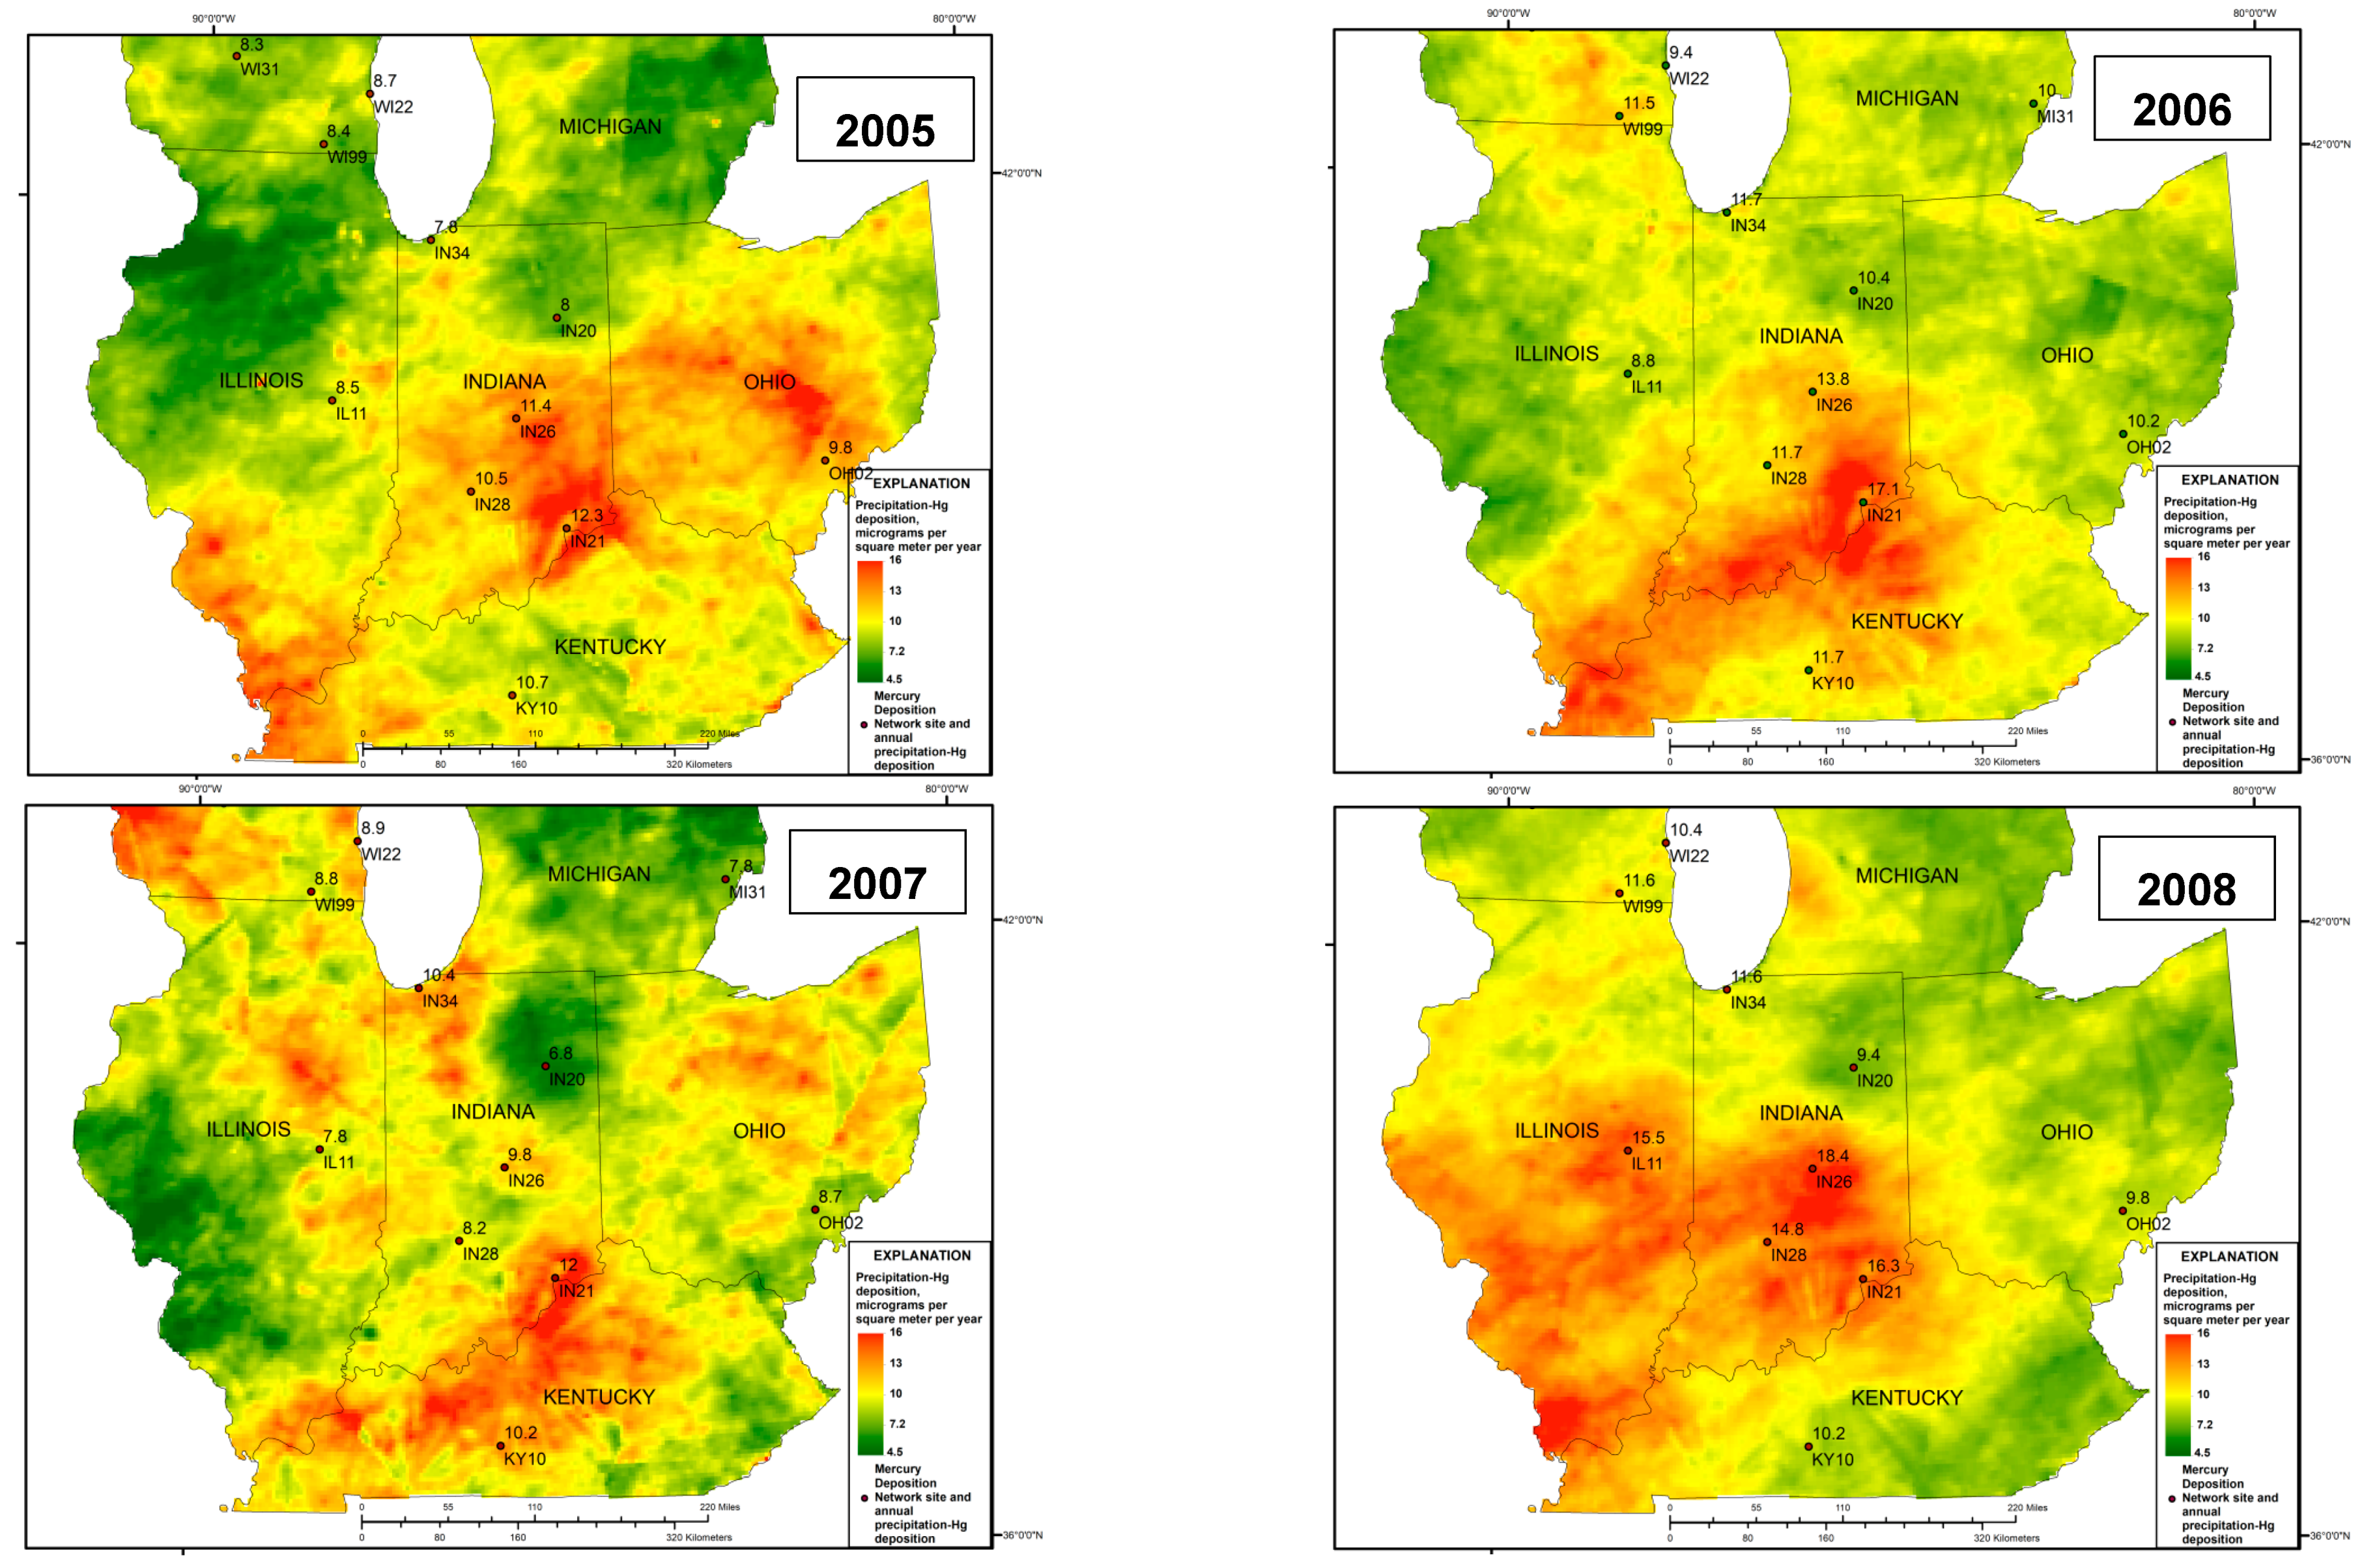
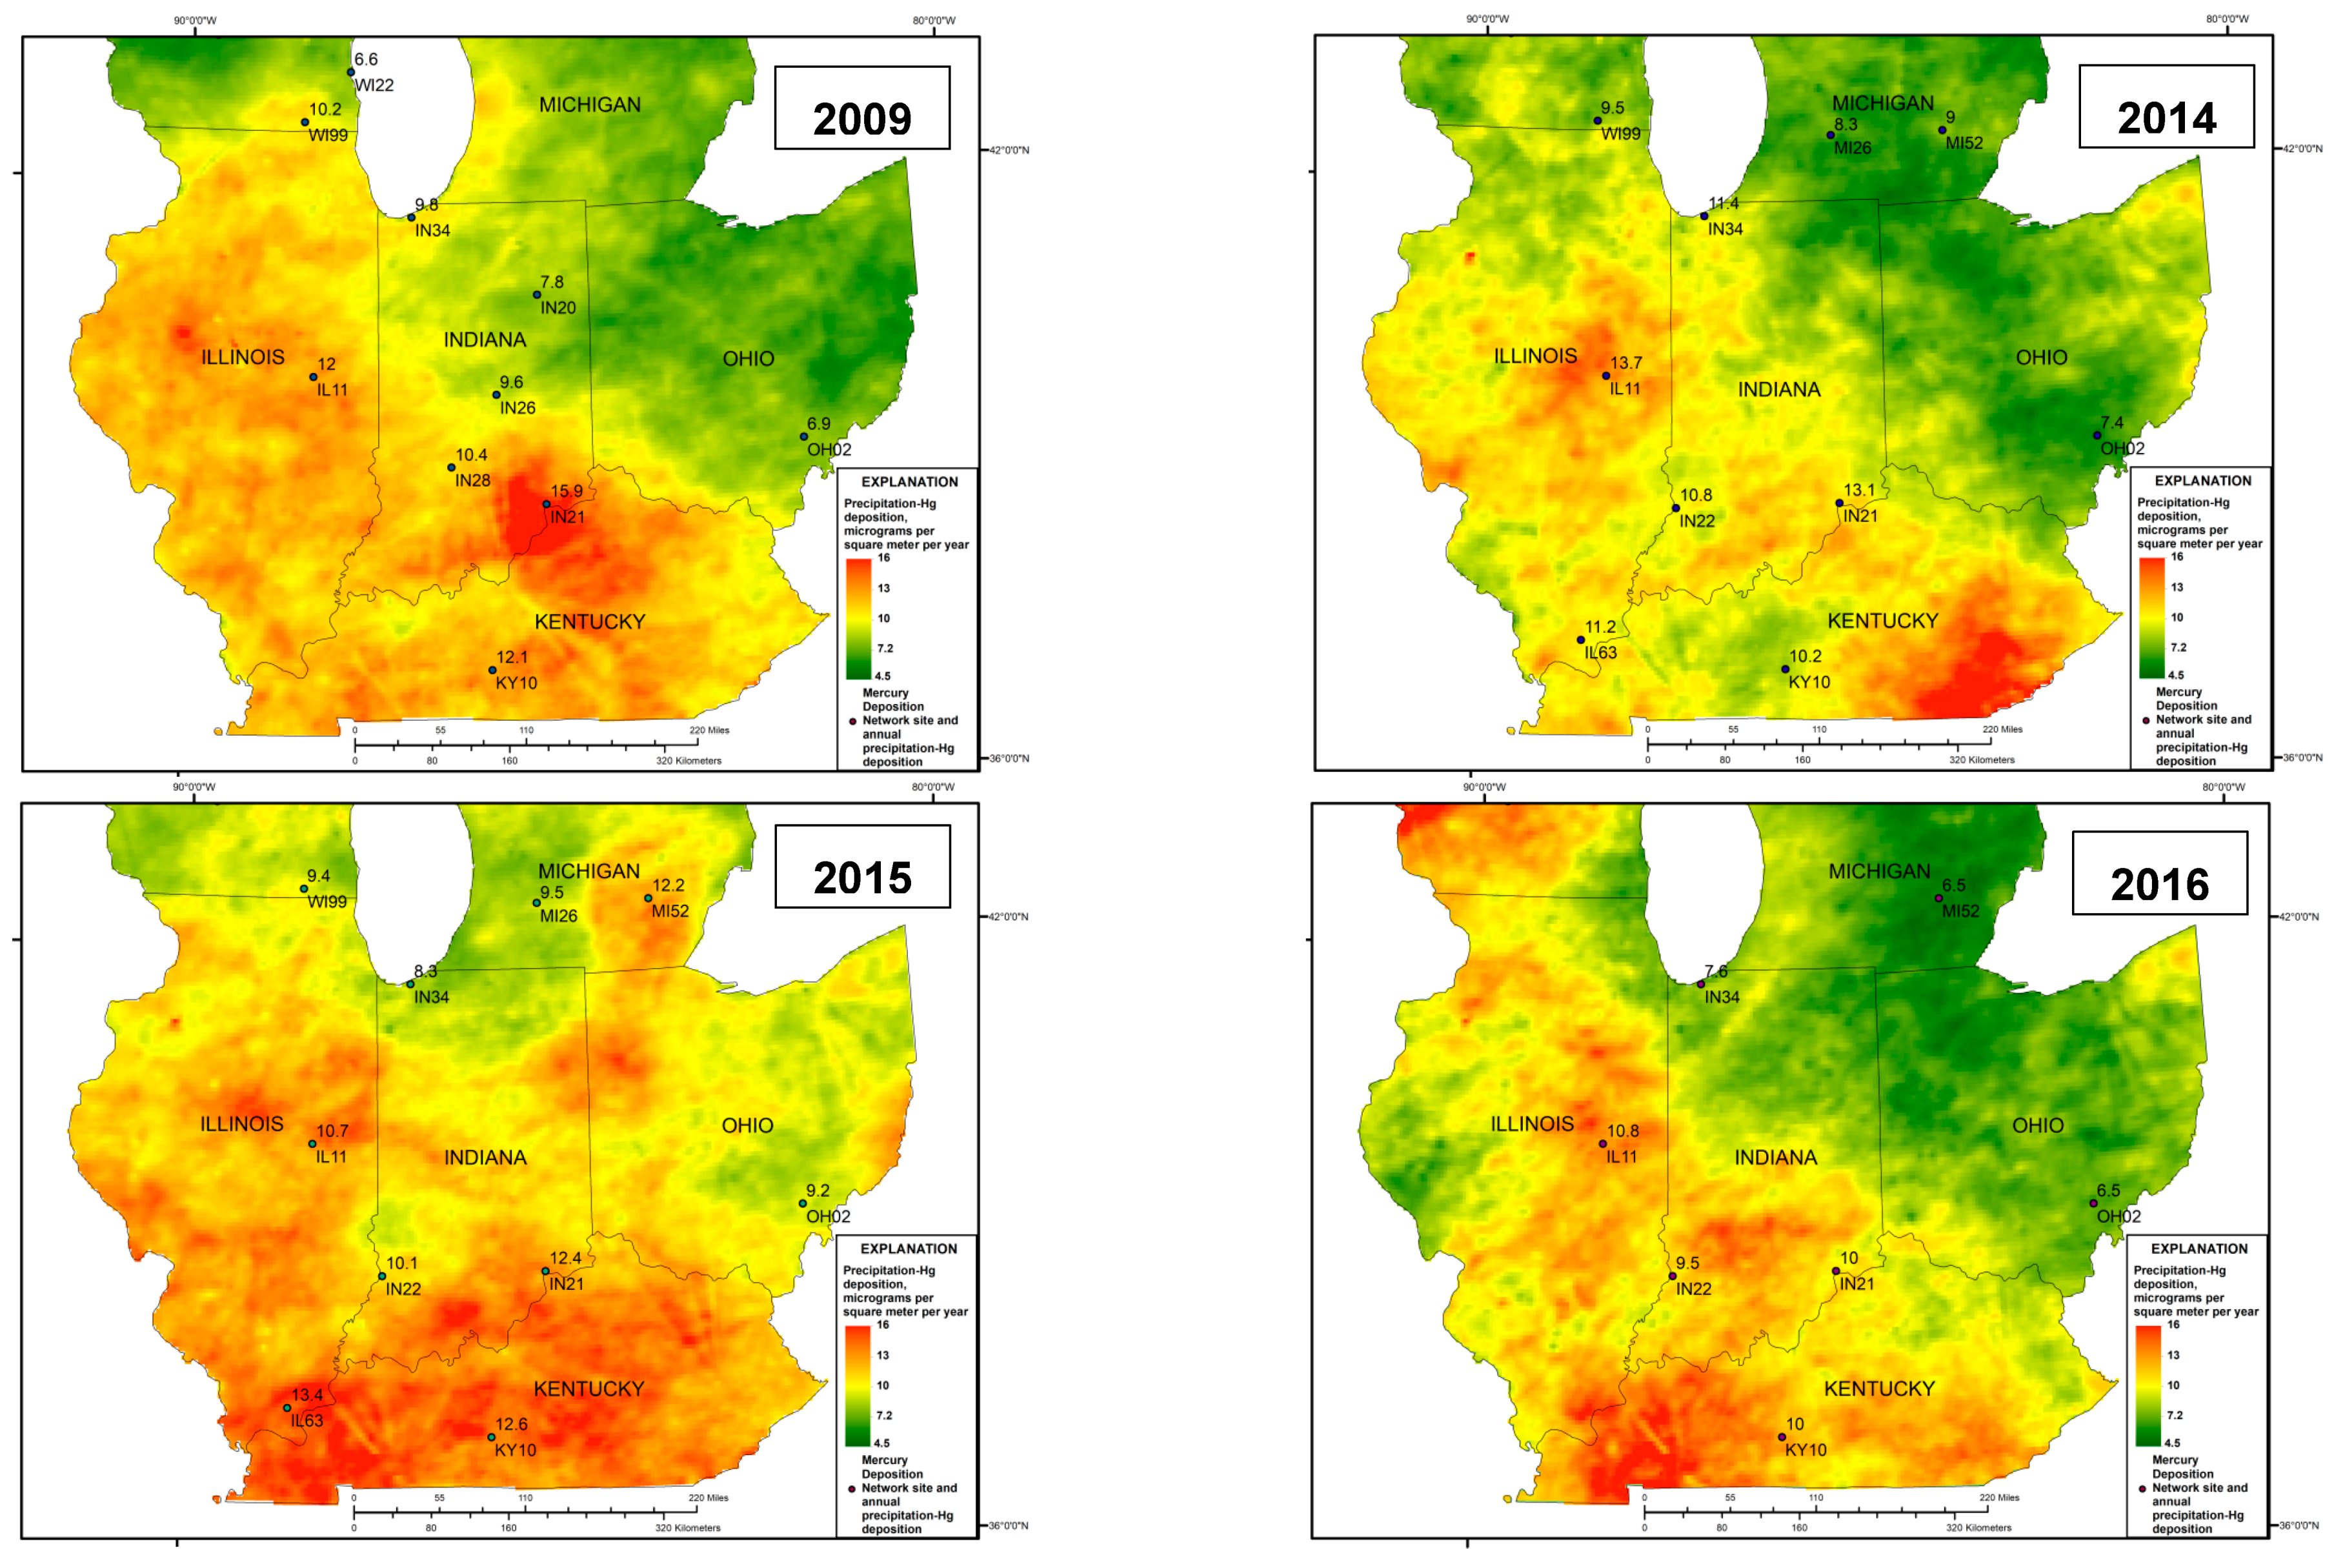
Isopleth maps of annual precipitation-Hg deposition were prepared for 2005–2009 and 2014–2016 (Figure 4). These 12 years had a sufficient number of sites with complete annual records to support spatial grids of Hg-concentrations to map the study area. Color coding of annual Hg deposition on the maps indicates a recurring spatial pattern similar to the one revealed by the statistical analysis. High deposition in southeastern Indiana near IN21 was present each year, frequently extending to southern Illinois. Areas with low annual Hg deposition were mapped in Michigan and Ohio for many years and frequently included part of northern Indiana.
The isopleth maps show apparent spatial detail in precipitation-Hg deposition corresponding to the detail from the PRISM precipitation depth data, rather than the Hg concentration data but this is not an anomaly from the method. Although Hg deposition is a product of Hg concentration and precipitation depth, the data from this study area indicates that weekly Hg deposition is more highly correlated with precipitation depth (rho 0.833, p < 0.001) than Hg concentration (rho 0.249, p < 0.001). Similarly, linear regressions indicate more of the variability in weekly Hg deposition is explained by precipitation depth (coefficient of determination r2 0.58, p < 0.001) than by Hg concentration (r2 0.04, p < 0.001). A supporting observation is that sites in the southern part of the study area (IN21, IN22, IN28, IL63 and KY10) had significantly higher weekly precipitation depths (p < 0.001) than sites in the northern part of the study area (IN34, MI52 and OH52). The substantial influence of precipitation depth on precipitation-Hg deposition has been reported by other research [10,16,51,52,53].
The distribution of Hg emissions sites (Figure 1), particularly those releasing 180 to 361 kg/year of Hg, is not uniformly related to the spatial pattern of annual precipitation-Hg deposition, although the density of these emissions sites appears to coincide with the area of high Hg deposition mapped for southern Indiana. A simple comparison of the magnitude of annual precipitation-Hg deposition with annual Hg emissions from stationary sources in Indiana was made using data from Table 1 and Table S1. If the mean statewide precipitation-Hg deposition of 11.8 µg/m2/year based on data from IN21, IN22 and IN34 in 2014 was uniform to the land area of Indiana (9.43 × 10¹⁰ m2), the annual precipitation-Hg load statewide would have been 1094 kg, which is 60% of the 1852 kg annual Hg emissions in the state.
4.2. Extreme Episodes of Hg Deposition
A potential reason that southern Indiana consistently showed statistically and spatially high precipitation-Hg deposition is the frequency of extreme episodes of weekly Hg deposition in the study area, 2001–2016. Extreme episodes were defined as the top 0.5% of values (Table 9). Extreme Hg-deposition episodes occurred at 8 of the 13 sites in 12 of the 16 years with annual Hg deposition records and 13 of the 27 episodes were recorded for IN21. Extreme Hg-deposition episodes occurred in all seasons but most were between April and September. Only two pairs of extreme episodes occurred in the same weeks, 26 April to 3 May 2011 at IN21 and KY10 and 1 to 8 April 2014 at IN21 and IN22. Notably, the Hg deposition, Hg concentration and precipitation depths were similar among each pair, indicating the potential spatial extent of some extreme episodes.
Weekly Hg-deposition in the extreme episodes was 5 to 10 times higher than in most weekly samples. The episodes ranged from 1640 to 2602 ng/m2/week, compared with a median of 145 ng/m2/week and a 75th percentile of 308 ng/m2/week for all sites for all years. The extreme episodes supplied 10 to 17% of the annual precipitation-Hg deposition in a single week but the episodes did not occur more than twice in one year at any site. Hg concentrations ranged from 7.1 to 45.4 ng/L with a median 14.9 ng/L. The median weekly Hg concentration for all samples from the study area was 9.5 ng/L, which is 36% lower. For these extreme Hg deposition episodes, precipitation depths ranged from 37.3 to 265 mm with a median 120 mm. The median weekly precipitation depth for all samples from the study area was 17.0 mm, which is 61% lower. Weekly precipitation-Hg deposition amounts for the extreme episodes in the study area and at IN21 alone were not correlated significantly with precipitation depth or Hg concentration and variability in Hg deposition was not statistically explained by either factor. The data indicate that high precipitation depth and relatively high Hg concentration contributed to each extreme episode (Table 9).
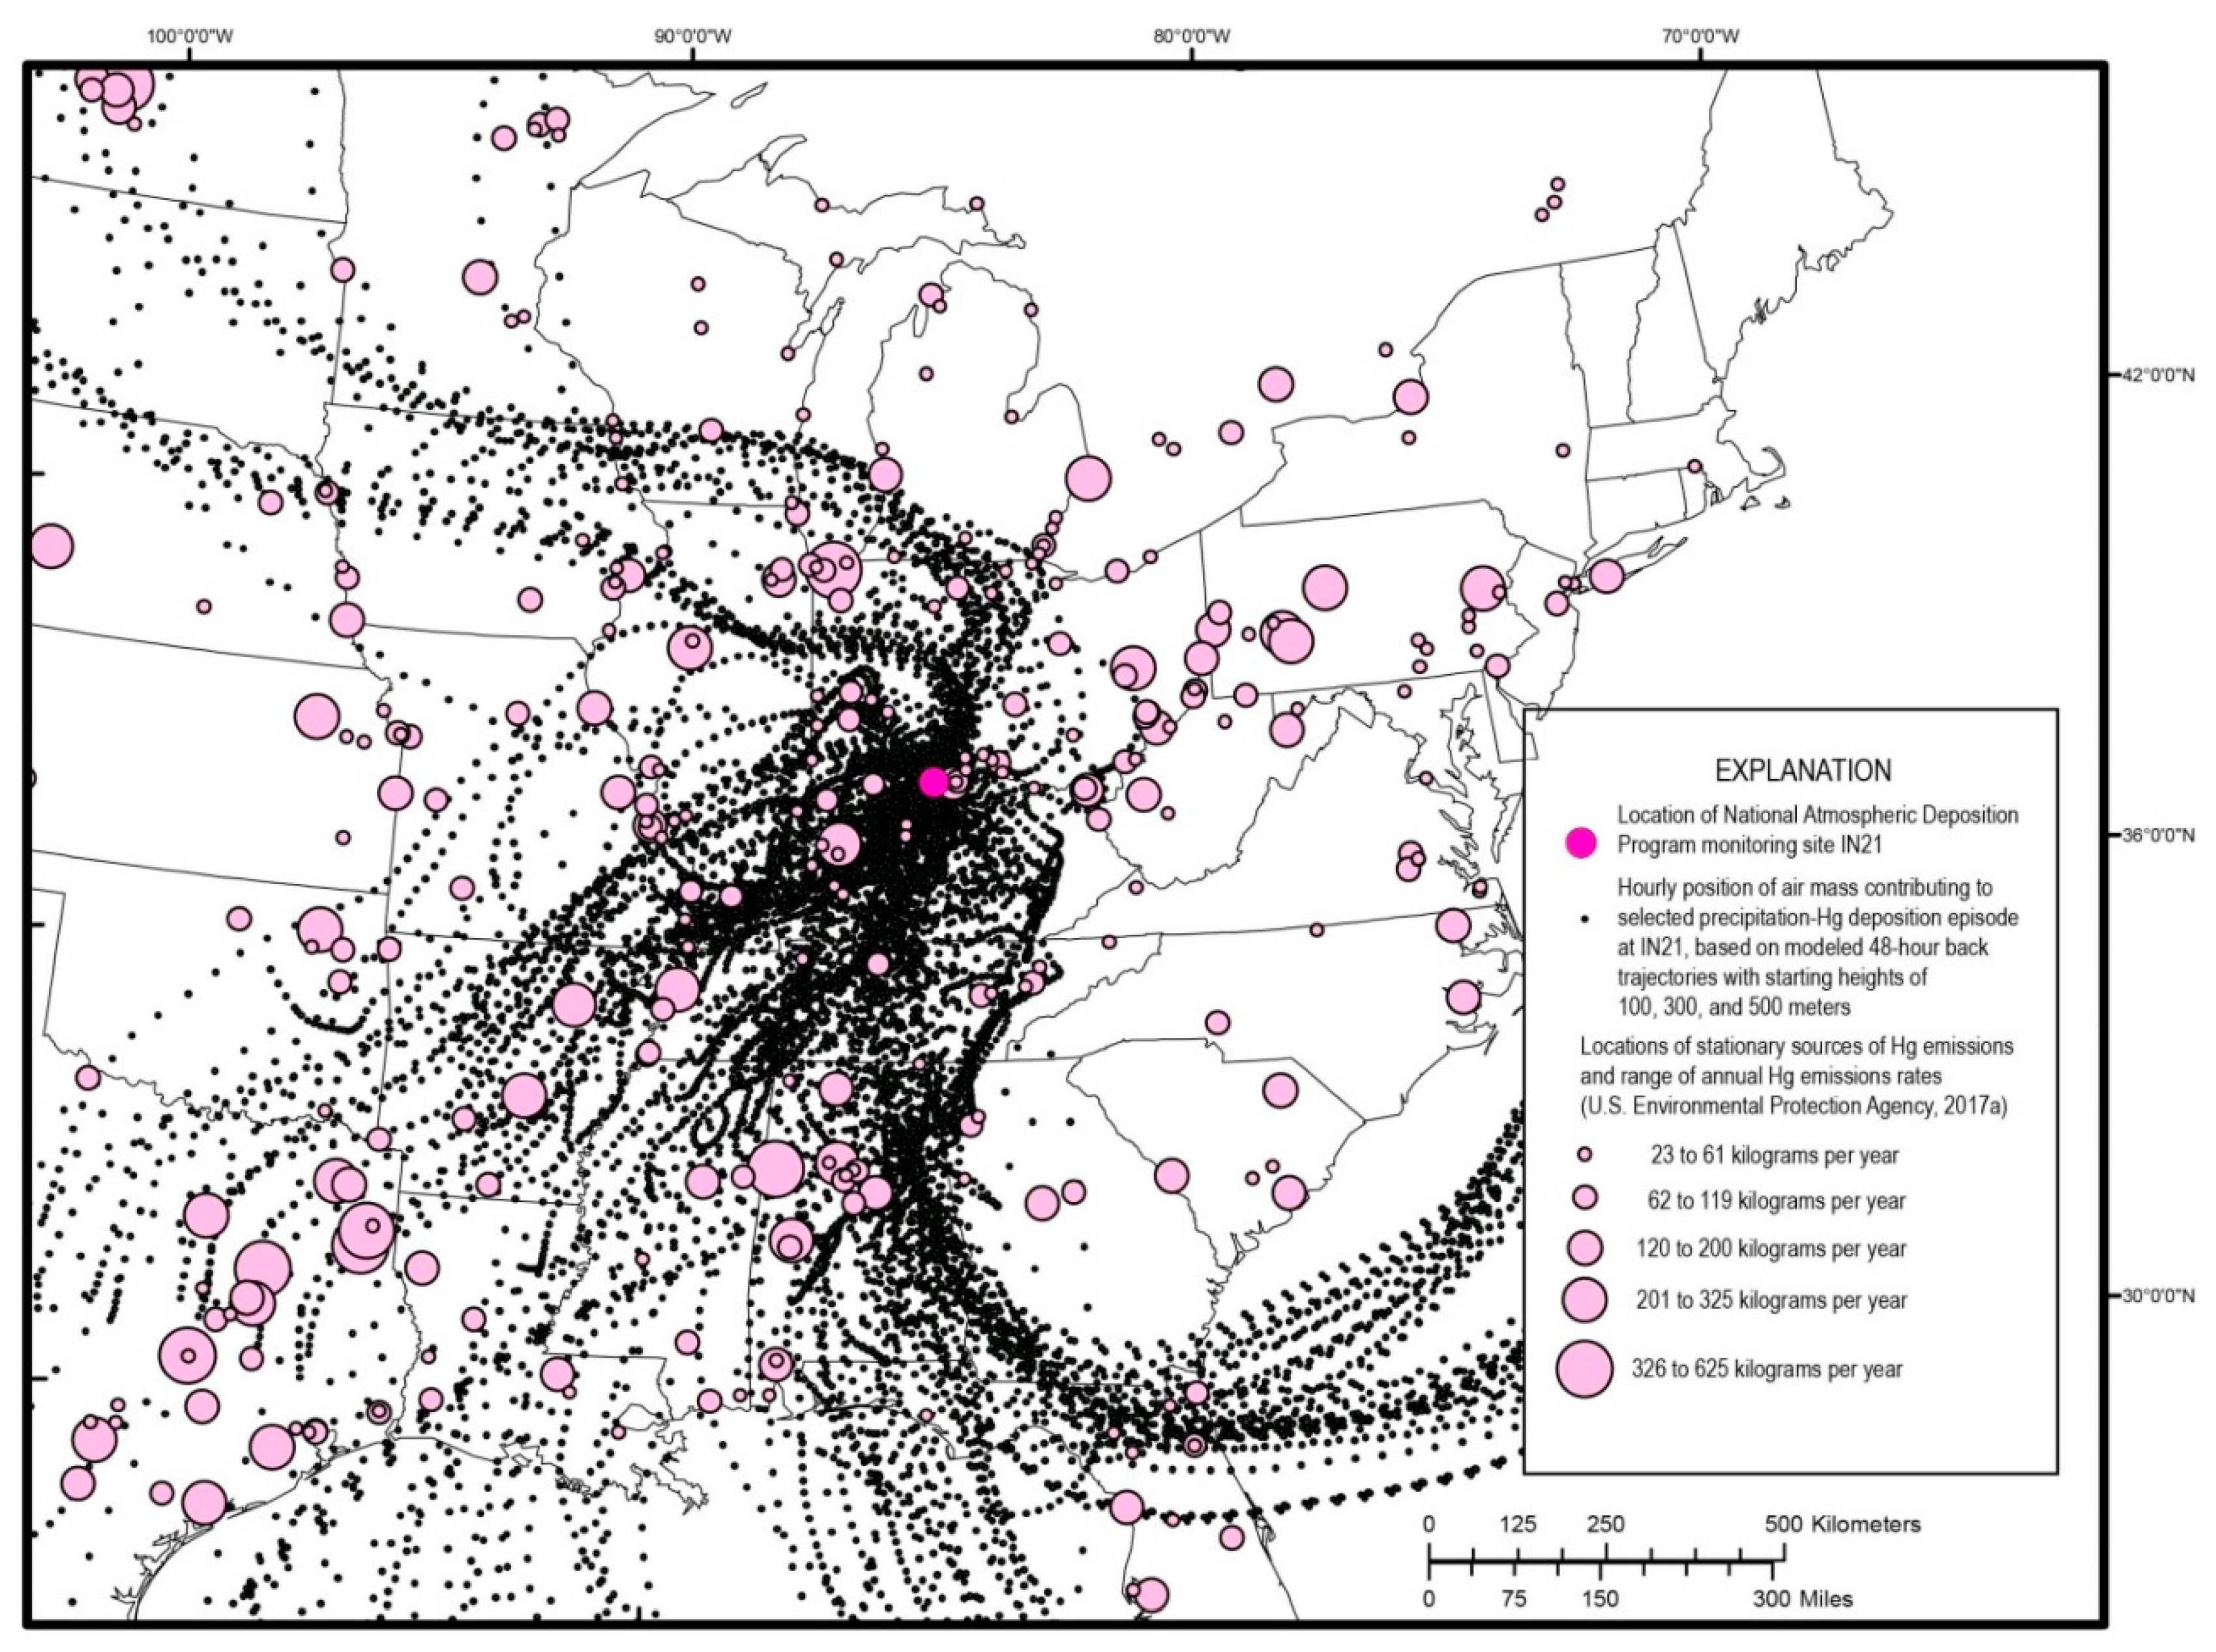
Modeled 48-h back trajectories of the hourly positions of the air masses for five extreme episodes of precipitation-Hg deposition at IN21 during 2009–2015 illustrate a further explanation for the high precipitation-Hg deposition (Table 9, Figure 5). The back trajectories indicate that air masses predominantly came from the south and southwest. Locations and annual Hg emissions for stationary sources overlain on the back-trajectory map show that numerous sources emitting from 23 kg to more than 300 kg Hg per year were in the path of these air masses. This analysis suggests that local and regional sources, rather than exclusively continental or global Hg emissions likely contributed to the extreme episodes and at least in part, to the spatial patterns of precipitation-Hg deposition in the study area. Other research attributed substantial contributions from local and regional Hg emissions sources to precipitation-Hg deposition in the Midwestern USA [19,20,54,55]. According to Holmes et al. [56] and Kaulfus et al. [57], warm weather, convective thunderstorms are believed to increase Hg deposition and this may be the case for many of the extreme episodes examined in this study. Such storms can incorporate additional GOM formed in the troposphere from GEM originating at local and regional sources [55], in addition to effective below-cloud and in-cloud scavenging of GOM, as described by Lynam et al. [58].
4.3. Temporal Changes in Hg Deposition
Temporal changes in Hg deposition can be observed in the study area during the 16-year study period. The Mercury and Air Toxics Standards (MATS) rules were finalized by U.S. Environmental Protection Agency for Hg emissions from power plants in 2011, effective in 2015 [59]. Rules for other Hg emissions sources such as cement kilns, utility boilers and medical waste incinerators were finalized in 2010, 2011 and 2013, respectively [60,61,62]. The expected outcome was a succession of reduced Hg emissions from these sources up to and after the effective dates.
To examine whether a temporal trend was evident in precipitation-Hg in response to these rules, the weekly data were grouped by year 2001–2012 and 2014–2016. As grouped, Hg deposition and Hg concentration were shown to be significantly lower in 2014–2016 than 2001–2013 (p < 0.001). The median weekly Hg deposition in 2001–2013 was 152 µg/m2/week, compared with 123 µg/m2/week in 2014–2016, a 19% difference and the median weekly Hg concentration was 9.9 ng/L compared with 8.3 ng/L, a 16% difference. Data for Indiana showed a similar response. Hg deposition and Hg concentration were significantly lower in 2014–2016 than 2001–2012 (p = 0.038 and p < 0.001, respectively). The median weekly Hg deposition in 2001–2012 was 161 µg/m2/week, compared with 135 µg/m2/week in 2014–2016, a 16% difference and the median weekly Hg concentration was 10.2 ng/L compared with 8.3 ng/L, a 19% difference. Consistent with other analysis for the study area, weekly Hg concentrations grouped 2001–2009 (median 10 ng/L) and 2010–2012 (median 9.6 ng/L) were significantly higher (p < 0.001) than 2014–2016 (median 8.3 ng/L). Weekly precipitation depth between these two time periods was not significantly different in the study area (p = 0.331) or in Indiana (p = 0.469), meaning the decreases in Hg deposition were related primarily to decreases in Hg concentration rather than decreases in precipitation depth. These data document a gradual decline in Hg concentrations in advance of the period when Hg emissions reductions were required. This observation is consistent with model results by Zhang and Jaegle [63] for 2005–2010 in the Midwestern USA.
Wetherbee et al. [64] analyzed trends in annual precipitation depths at a separate group of NADP monitoring sites for 2001–2015. They reported increases in precipitation at 17 of 21 sites in the study area that were statistically significant and higher than 1 cm/year at 3 of the 17 sites. This information suggests the potential for some decreases in Hg concentrations to involve dilution by increased precipitation. Typically, increased precipitation depth would cause a corresponding increase in Hg deposition but that response was not identified in the statistical analysis. Precipitation-Hg concentrations and Hg deposition exhibited a decline during the study period.
The findings from this study in the Midwestern USA indicate that reductions in Hg emissions associated with implementation of the MATS and related rules coincided with temporal decreases in precipitation-Hg concentrations, resulting in decreased atmospheric Hg deposition. Meanwhile, precipitation depths did not significantly change. At the minimum, it can be postulated that reductions of atmospheric GOM and PBM in the study area, the species most readily scavenged from the air during precipitation, were associated with the reduced precipitation-Hg concentrations and deposition. Reductions of atmospheric GEM, the most abundant species and the one considered to dominate litterfall-Hg deposition, were inconclusive based on these Midwestern data. Annual litterfall-Hg deposition, litterfall-Hg concentrations and litterfall mass at 7 sites were not significantly different in 2007–2009 compared with 2012–2016. A study by Risch et al. [18] reported litterfall-Hg concentrations in the eastern USA were significantly lower in 2014–2016 than 2007–2009, consistent with reported declines in atmospheric GEM reported by others. The inconsistency of Midwestern litterfall-Hg data with the broader region underscores the value of the spatial focus on five states afforded by this study.
5. Conclusions
The Midwestern USA region has a history of numerous anthropogenic Hg emission sources, including those with high annual emission rates. The 5 states in this study include 32% of the sources and 20% of the Hg emissions in the 48 states of continental USA. An extensive monitoring record of weekly precipitation-Hg data and annual litterfall-Hg data from the NADP was investigated for 13 sites for a 16-year period. Although dry deposition of atmospheric Hg from litterfall was not statistically different among sites in the study, spatial patterns and temporal changes were identified with the precipitation-Hg data. Isopleth maps showed the southern part of the study area had a recurring pattern of high annual Hg deposition while the northern and eastern parts had comparatively lower annual Hg deposition. This spatial pattern was consistent with statistically significant differences determined in weekly Hg deposition among the sites. One site in the area of high Hg deposition recorded half of all extreme episodes (top 0.5%) of weekly Hg deposition in in the study area. Modeled back trajectories for extreme episodes at this site showed the storm paths crossed numerous large Hg emissions sources. A conclusion is that some of the spatial patterns are attributable to deposition of atmospheric Hg transported from local and regional emissions sources, rather than exclusively continental and global sources. Another conclusion is that statistically significant differences in weekly precipitation-Hg concentrations between periods before and after implementation of rules requiring reductions in Hg emissions were a response to these rules. The reduced Hg concentrations led to the 19% decrease in precipitation-Hg deposition in the study area in recent years.
Supplementary Materials
The following are available online at www.mdpi.com/2073-4433/9/1/29/s1, Table S1: Summary of annual precipitation depths, Hg concentrations, and Hg deposition by year for Midwestern USA study area, 2001–2016.
Acknowledgments
Part of the research presented in this article was supported by the Indiana Department of Environmental Management through the Lake Michigan Air Directors Consortium. Any use of trade, firm, or product names is for descriptive purposes only and does not imply endorsement by the U.S. Government.
Author Contributions
Martin R. Risch and Donna M. Kenski designed the study and analyzed the data. Donna M. Kenski provided the back trajectory models and isopleth maps. Martin R. Risch wrote the paper.
Conflicts of Interest
The authors declare no conflicts of interest.
References
- U.S. Geological Survey. Mercury in the Environment, Fact Sheet 146-00. 2000. Available online: https://www.epa.gov/mercury/basic-information-about-mercury (accessed on 30 October 2017).
- Mergler, D.; Anderson, H.A.; Chan, L.H.M.; Mahaffey, K.R.; Murray, M.; Sakamoto, M.; Stern, A.H. Methylmercury exposure and health effects in humans—A worlwide concern. AMBIO 2007, 36, 3–11. [Google Scholar] [CrossRef]
- National Research Council. Toxicological Effects of Methylmercury; National Academy Press: Washington, DC, USA, 2000. [Google Scholar]
- Scheuhammer, A.M.; Meyer, M.W.; Sandheinrich, M.B.; Murray, M.W. Effects of environmental methylmercury on the health of wild birds, mammals, and fish. AMBIO 2007, 36, 12–18. [Google Scholar] [CrossRef]
- U.S. Environmental Protection Agency. 2010 National Listing of Fish Advisories; EPA-823-F-09-007; Office of Science and Technology, 2011. Available online: http://water.epa.gov/scitech/swguidance/fishshellfish/fishadvisories/upload/nlfa_slides_2011.pdf (accessed on 30 October 2017).
- Driscoll, C.T.; Mason, R.P.; Chan, H.M.; Jacob, D.J.; Pirrone, N. Mercury as a global pollutant: Sources, pathways, and effects. Environ. Sci. Technol. 2013, 47, 4967–4983. [Google Scholar] [CrossRef] [PubMed]
- Lindberg, S.; Bullock, R.; Ebinghaus, R.; Engstrom, D.; Feng, X.; Fitzgerald, W.; Pirrone, N.; Prestbo, E.; Seigneur, C. A synthesis of progress and uncertainties in attributing the sources of mercury in deposition. AMBIO 2007, 36, 19–32. [Google Scholar] [CrossRef]
- Zhang, L.; Wright, L.P.; Blanchard, P. A review of current knowledge concerning dry deposition of atmospheric mercury. Atmos. Environ. 2009, 43, 5853–5864. [Google Scholar] [CrossRef]
- Butler, T.J.; Likens, G.E.; Cohen, M.D.; Vermeylen, F. Mercury in the Environment and Patterns of Mercury Deposition from the NADP/MDN Mercury Deposition Network; Institute of Ecosystem Studies Final Report to NOAA; Millbrook: New York, NY, USA, 2007. [Google Scholar]
- Prestbo, E.M.; Gay, D.A. Wet deposition of mercury in the U.S. and Canada, 1996–2005: Results and analysis of the NADP mercury deposition network (MDN). Atmos. Environ. 2009, 43, 4223–4233. [Google Scholar] [CrossRef]
- Weiss-Penzias, P.S.; Gay, D.A.; Brigham, M.E.; Parsons, M.T.; Gustin, M.E.; ter Schure, A. Trends in mercury wet deposition and mercury air concentrations across the U.S. and Canada. Sci. Total Environ. 2016, 568, 546–556. [Google Scholar] [CrossRef] [PubMed]
- Zhang, L.; Blanchard, P.; Gay, D.A.; Prestbo, E.M.; Risch, M.R.; Johnson, D.; Narayan, J.; Zsolway, R.; Holsen, T.M.; Miller, E.K.; et al. Estimation of speciated and total mercury dry deposition at monitoring locations in Eastern and Central North America. Atmos. Chem. Phys. 2012, 12, 4327–4340. [Google Scholar] [CrossRef] [Green Version]
- Cohen, M.; Artz, R.; Draxler, R.; Miller, P.; Poissant, L.; Niemi, D.; Ratté, D.; Deslauriers, M.; Duval, R.; Laurin, R.; et al. Modeling the atmospheric transport and deposition of mercury to the Great Lakes. Environ. Res. 2004, 95, 247–265. [Google Scholar] [CrossRef] [PubMed]
- Engle, M.A.; Tate, M.T.; Krabbenhoft, D.P.; Schauer, J.J.; Kolker, A.; Shanley, J.B.; Bothner, M.H. Comparison of atmospheric mercury speciation and deposition at nine sites across central and eastern north america. J. Geophys. Res. 2010, 115. [Google Scholar] [CrossRef]
- Hall, B.; Manolopoulos, H.; Hurley, J.; Schauer, J.; St. Louis, V.; Kenski, D.; Graydon, J.; Babiarz, C.; Cleckner, L.; Keeler, G. Methyl and total mercury in precipitation in the great lakes region. Atmos. Environ. 2005, 39, 7557–7569. [Google Scholar] [CrossRef]
- Risch, M.R.; Gay, D.A.; Fowler, K.K.; Keeler, G.J.; Backus, S.M.; Blanchard, P.; Barres, J.A.; Dvonch, J.T. Spatial patterns and temporal trends in mercury concentrations, precipitation depths, and mercury wet deposition in the North American Great Lakes region, 2002–2008. Environ. Pollut. 2012, 161, 261–271. [Google Scholar] [CrossRef] [PubMed]
- Risch, M.R.; DeWild, J.F.; Krabbenhoft, D.P.; Kolka, R.K.; Zhang, L. Litterfall mercury dry deposition in the eastern USA. Environ. Pollut. 2012, 161, 284–290. [Google Scholar] [CrossRef] [PubMed]
- Risch, M.R.; DeWild, J.F.; Gay, D.A.; Zhang, L.; Boyer, E.W.; Krabbenhoft, D.P. Atmospheric mercury deposition to forests in the eastern USA. Environ. Pollut. 2017, 228, 8–18. [Google Scholar] [CrossRef] [PubMed]
- Gratz, L.E.; Keeler, G.J.; Morishita, M.; Barres, J.A.; Dvonch, J.T. Assessing the emission sources of atmospheric mercury in wet deposition across Illinois. Sci. Total Environ. 2013, 448, 120–131. [Google Scholar] [CrossRef] [PubMed]
- Keeler, G.J.; Landis, M.S.; Norris, G.A.; Christianson, E.M.; Dvonch, J.T. Sources of mercury wet deposition in eastern Ohio, USA. Environ. Sci. Technol. 2006, 40, 5874–5881. [Google Scholar] [CrossRef] [PubMed]
- Risch, M.R. Mercury in Precipitation in Indiana, January 2001–December 2003; U.S. Geological Survey Scientific Investigations Report 2007–5063; USGS: Reston, VA, USA, 2007.
- Risch, M.R.; Prestbo, E.M.; Hawkins, L. Measurement of atmospheric mercury species with manual sampling and analysis methods in a case study in Indiana. Water Air Soil Pollut. 2007, 184, 285–297. [Google Scholar] [CrossRef]
- Risch, M.R.; Fowler, K.K. Mercury in Precipitation in Indiana, January 2004‒December 2005; U.S. Geological Survey Scientific Investigations Report 2008–5148; USGS: Reston, VA, USA, 2008.
- Risch, M.R.; Baker, N.T.; Fowler, K.K.; Egler, A.L.; Lampe, D.C. Mercury in Indiana Watersheds: Retrospective for 2001–2006; U.S. Geological Survey Professional Paper 1780; USGS: Reston, VA, USA, 2010.
- University of Michigan Air Quality Laboratory. Spatial Patterns in Wet and Dry Deposition of Atmospheric Mercury to Illinois Watersheds; Final Report for State of Illinois Department of Environmental Protection; University of Michigan Air Quality Laboratory: Ann Arbor, MI, USA, 2013. [Google Scholar]
- U.S. Environmental Protection Agency. 2014 National Emissions Inventory (NEI) Data. Available online: https://www.epa.gov/air-emissions-inventories/2014-national-emissions-inventory-nei-data (accessed on 30 October 2017).
- U.S. Environmental Protection Agency. 2008 National Emissions Inventory (NEI) Data. Available online: https://www.epa.gov/air-emissions-inventories/2008-national-emissions-inventory-nei-data (accessed on 30 October 2017).
- U.S. Environmental Protection Agency. 2011 National Emissions Inventory (NEI) Data. Available online: https://www.epa.gov/air-emissions-inventories/2011-national-emissions-inventory-nei-data (accessed on 30 October 2017).
- National Oceanic and Atmospheric Administration. Air Resources Laboratory Atmospheric Mercury Measurements. 2016. Available online: https://www.arl.noaa.gov/research/atmospheric-chemistry/atmospheric-mercury/measurements/ (accessed on 30 October 2017).
- Castro, M.S.; Sherwell, J. Effectiveness of emission controls to reduce the atmospheric concentrations of mercury. Environ. Sci. Technol. 2015, 49, 14000–14007. [Google Scholar] [CrossRef] [PubMed]
- Risch, M.R.; Kenski, D.M.; Gay, D.A. A Great Lakes atmospheric mercury monitoring network: Evaluation and design. Atmos. Environ. 2014, 85, 109–122. [Google Scholar] [CrossRef]
- National Atmospheric Deposition Program. Mercury Deposition Network. 2017. Available online: http://nadp.sws.uiuc.edu/mdn/ (accessed on 30 October 2017).
- National Atmospheric Deposition Program. Quality Assurance Support for the NADP. 2017. Available online: http://nadp.sws.uiuc.edu/qa/ (accessed on 30 October 2017).
- National Atmospheric Deposition Program. Annual Mercury Deposition Network Maps. 2017. Available online: http://nadp.sws.uiuc.edu/MDN/annualmdnmaps.aspx (accessed on 30 October 2017).
- National Atmospheric Deposition Program. Litterfall Mercury Monitoring Initiative. 2017. Available online: http://nadp.sws.uiuc.edu/newissues/litterfall/ (accessed on 30 October 2017).
- Wang, X.; Bao, Z.; Lin, C.; Yuan, W.; Feng, X. Assessment of global mercury deposition through litterfall. Environ. Sci. Technol. 2016, 50, 8548–8557. [Google Scholar] [CrossRef] [PubMed]
- Demers, J.D.; Driscoll, C.T.; Fahey, T.J.; Yavitt, J.B. Mercury cycling in litter and soil in different forest types in the Adirondack region, New York, USA. Ecol. Appl. 2007, 17, 1341–1351. [Google Scholar] [CrossRef] [PubMed]
- Grigal, D.F. Inputs and outputs of mercury from terrestrial watesheds—A review. Natl. Res. Counc. Can. Environ. Rev. 2002, 10, 1–39. [Google Scholar] [CrossRef]
- Graydon, J.A.; St. louis, V.L.; Hintelmann, H.; Lindberg, S.E.; Sandilands, K.A.; Rudd, J.W.M.; Kelly, C.A.; Hall, B.D.; Mowat, L.D. Long-Term Wet and Dry Deposition of Total and Methyl Mercury in the Remote Boreal Ecoregion of Canada. Environ. Sci. Technol. 2008, 42, 8345–8351. [Google Scholar] [CrossRef] [PubMed]
- St. Louis, V.L.; Rudd, J.W.; Kelly, C.A.; Hall, B.D.; Rolfhus, K.R.; Scott, K.J.; Lindberg, S.E.; Dong, W. Importance of the forest canopy to fluxes of methyl mercury and total mercury to boreal ecosystems. Environ. Sci. Technol. 2001, 35, 3089–3098. [Google Scholar] [CrossRef] [PubMed]
- Gay, D.A.; Schmeltz, D.; Prestbo, E.; Olson, M.; Sharac, T.; Tordon, R. The atmospheric mercury network: Measurement and initial examination of an ongoing atmospheric mercury record across North America. Atmos. Chem. Phys. Discuss. 2013, 13, 10521–10546. [Google Scholar] [CrossRef]
- National Atmospheric Deposition Program. Atmospheric Mercury Network. 2017. Available online: http://nadp.sws.uiuc.edu/amn/ (accessed on 30 October 2017).
- Zhang, L.; Wu, Z.; Cheng, I.; Wright, L.P.; Olson, M.L.; Gay, D.A.; Risch, M.R.; Brooks, S.; Castro, M.S.; Conley, G.D.; et al. The estimated six-year mercury dry deposition across North America. Environ. Sci. Technol. 2016, 50, 12864–12873. [Google Scholar] [CrossRef] [PubMed]
- National Atmospheric Deposition Program. Mercury Deposition Network Data Retrieval. 2017. Available online: http://nadp.sws.uiuc.edu/data/MDN/ (accessed on 30 October 2017).
- Risch, M.R. Mercury and Methylmercury Concentrations and Litterfall Mass in Autumn Litterfall Samples Collected at Selected National Atmospheric Deposition Program Sites in 2007–2009 and 2012–2015; U.S. Geological Survey Data Release; USGS: Reston, VA, USA, 2017.
- Risch, M.R. Mercury and Methylmercury Concentrations and Litterfall Mass in Autumn Litterfall Samples Collected at Selected National Atmospheric Deposition Program Sites in 2016; U.S. Geological Survey Data Release; USGS: Reston, VA, USA, 2017.
- Northwest Alliance for Computational Science & Engineering. PRISM Climate Data. 2017. Available online: http://prism.oregonstate.edu/ (accessed on 30 October 2017).
- Stein, A.F.; Draxler, R.R.; Rolph, G.D.; Stunder, B.J.B.; Cohen, M.D.; Ngan, F. NOAA’s HYSPLIT atmospheric transport and dispersion modeling system. Bull. Am. Meteorol. Soc. 2015, 96, 2059–2077. [Google Scholar] [CrossRef]
- National Oceanic and Atmospheric Administration. Eta Data Assimilation System (EDAS40) Archive Information. 2017; Available online: https://www.ready.noaa.gov/edas40.php and ftp://arlftp.arlhq.noaa.gov/pub/archives/edas40/; (accessed on 30 October 2017). [Google Scholar]
- Kenski, D.M.; Risch, M.R. Calculated Back Trajectory Coordinates for Air Masses Contributing to Five Selected Precipitation-Mercury Deposition Episodes at a National Atmospheric Deposition Program Monitoring Site in Southeastern Indiana during 2009 to 2015; U.S. Geological Survey Data Release; USGS: Reston, VA, USA, 2018.
- Mao, H.; Ye, Z.; Driscoll, C. Meteorological effects on Hg wet deposition in a forested site in the Adirondack region of New York during 2000–2015. Atmos. Environ. 2017, 168, 90–100. [Google Scholar] [CrossRef]
- Sakata, M.; Marumoto, K. Wet and dry deposition fluxes of mercury in Japan. Atmos. Environ. 2005, 39, 3139–3146. [Google Scholar] [CrossRef]
- Seo, Y.S.; Han, Y.J.; Choi, H.D.; Holsen, T.M.; Yi, S.M. Characteristics of total mercury(TM) wet deposition: Scavenging of atmospheric mercury species. Atmos. Environ. 2012, 49, 69–76. [Google Scholar] [CrossRef]
- Selin, N.E.; Jacob, D.J. Seasonal and spatial patterns of mercury wet deposition in the United States: Constraints on the contribution from North American anthropogenic sources. Atmos. Environ. 2008, 42, 5193–5204. [Google Scholar] [CrossRef] [Green Version]
- Shah, V.; Jaegle, L. Subtropical subsidence and surface deposition of oxidized mercury produced in the free troposphere. Atmos. Chem. Phys. 2017, 17, 8999–9017. [Google Scholar] [CrossRef]
- Holmes, C.D.; Krishnamurthy, N.P.; Caffrey, J.M.; Landing, W.M.; Edgerton, E.S.; Knapp, K.R.; Nair, U.S. Thunderstorms increase mercury wet deposition. Environ. Sci. Technol. 2016, 50, 9343–9350. [Google Scholar] [CrossRef] [PubMed]
- Kaulfus, A.S.; Nair, U.; Holmes, C.D.; Landing, W.M. Mercury wet scavenging and deposition differences by precipitation type. Environ. Sci. Technol. 2017, 51, 2628–2634. [Google Scholar] [CrossRef] [PubMed]
- Lynam, M.M.; Dvonch, J.T.; Barres, J.A.; Landis, M.S.; Kamal, A.S. Investigating the impact of local urban sources on total atmospheric mercury wet deposition in Cleveland, Ohio, USA. Atmos. Environ. 2016, 127, 262–271. [Google Scholar] [CrossRef]
- U.S. Environmental Protection Agency. Mercury and Air Toxics Standards. Available online: https://www.epa.gov/mats (accessed on 30 October 2017).
- U.S. Environmental Protection Agency. Portland Cement Manufacturing. Available online: https://www3.epa.gov/airquality/cement/ (accessed on 30 October 2017).
- U.S. Environmental Protection Agency. Controlling Air Pollution from Boilers and Process Heaters. Available online: https://www.epa.gov/boilers (accessed on 30 October 2017).
- U.S. Environmental Protection Agency. Hospital, Medical, and Infectious Waste Incinerators (HMIWI): New Source Performance Standards (NSPS), Emission Guidelines, and Federal Plan Requirements Regulations. Available online: https://www.epa.gov/stationary-sources-air-pollution/hospital-medical-and-infectious-waste-incinerators-hmiwi-new-source (accessed on 30 October 2017).
- Zhang, Y.; Jaeglé, L. Decreases in mercury wet deposition over the united states during 2004–2010: Roles of domestic and global background emission reductions. Atmosphere 2013, 4, 113–131. [Google Scholar] [CrossRef]
- Wetherbee, G.A.; Lehmann, C.B.; Kerschner, B.M.; Ludtke, A.S.; Green, L.A.; Rhodes, M.F. Trends in bromide wet deposition concentrations in the contiguous United States, 2001–2016. Environ. Pollut. 2017, 233, 168–179. [Google Scholar] [CrossRef] [PubMed]
Figure 1.
Stationary sources of Hg emissions in Midwestern USA study area (2014 National Emissions Inventory [26]).
Figure 1.
Stationary sources of Hg emissions in Midwestern USA study area (2014 National Emissions Inventory [26]).

Figure 2.
Annual Hg emissions from categories of stationary sources in states of Midwestern USA study area (2008, 2011 and 2014 National Emissions Inventories [26,27,28]).

Figure 3.
National Atmospheric Deposition Program Hg-data sites in Midwestern USA study area.

Figure 4.
Isopleth maps of annual precipitation-Hg deposition in Midwestern USA study area, 2005–2009 and 2014–2016.
Figure 4.
Isopleth maps of annual precipitation-Hg deposition in Midwestern USA study area, 2005–2009 and 2014–2016.


Figure 5.
Modeled 48-h back trajectories for five precipitation-Hg deposition episodes at National Atmospheric Deposition Program monitoring site IN21, 2009–2015, with locations of stationary sources of Hg emissions for 2014 [26].
Figure 5.
Modeled 48-h back trajectories for five precipitation-Hg deposition episodes at National Atmospheric Deposition Program monitoring site IN21, 2009–2015, with locations of stationary sources of Hg emissions for 2014 [26].


Table 1.
Annual mercury emissions from stationary sources in states from Midwestern USA study area.
| State | Annual Hg Emissions a (kg/year) | Number of Sources a | Median Annual Hg Emission per Source (kg/year) | Range of Top 10% of Ranked Hg Emissions per Source (kg/year) | Percentage of Total State Emissions from Top 10% of Sources |
|---|---|---|---|---|---|
| Indiana | 1852 | 358 | 0.018 | 5.67 to 361 | 97.5 |
| Illinois | 1323 | 2234 | 0.005 | 0.11 to 207 | 98.2 |
| Kentucky | 929 | 255 | 0.005 | 2.45 to 152 | 98.4 |
| Michigan | 1513 | 569 | 0.014 | 2.04 to 290 | 97.5 |
| Ohio | 2244 | 524 | 0.023 | 2.36 to 230 | 97.6 |
| Study area | 7861 | 3940 | 0.009 | 0.39 to 361 | 98.9 |
Note: Hg: mercury; kg/year: kilogram per year; a: 2014 National Emissions Inventory [26].
Table 2.
Characteristics of National Atmospheric Deposition Program sites in Midwestern USA study area.
Table 2.
Characteristics of National Atmospheric Deposition Program sites in Midwestern USA study area.
| State | Site ID Number | Abbreviated Site Name | Latitude (Decimal Degrees) | Longitude (Decimal Degrees) | Elevation (Meters) | MDN | LMMI |
|---|---|---|---|---|---|---|---|
| Indiana | IN20 | Roush Lake | 40.8401 | −85.4639 | 244 | yes | yes |
| IN21 | Clifty Falls | 38.7622 | −85.4202 | 256 | yes | yes | |
| IN22 | SW Agr. Center | 38.7408 | −87.4855 | 134 | yes | yes | |
| IN26 | Fort Harrison | 39.8583 | −86.0208 | 260 | yes | yes | |
| IN28 | Bloomington | 39.1464 | −86.6133 | 256 | yes | no | |
| IN34 | Indiana Dunes | 41.6318 | −87.0881 | 208 | yes | yes | |
| Illinois | IL11 | Bondville | 40.0528 | −88.3719 | 212 | yes | no |
| IL63 | Dixon Springs | 37.4356 | −88.6719 | 161 | yes | no | |
| Kentucky | KY10 | Mammoth Cave | 37.1317 | −86.1480 | 236 | yes | yes |
| Michigan | MI26 | Kellogg | 42.4103 | −85.3928 | 288 | yes | no |
| MI52 | Ann Arbor | 42.4164 | −83.9019 | 267 | yes | no | |
| Ohio | OH02 | Athens | 39.3078 | −82.1182 | 275 | yes | yes |
| OH52 | South Bass Island | 41.6582 | −82.8270 | 177 | yes | no |
ID. identification; MDN: Mercury Deposition Network; LMMI: Litterfall Mercury Monitoring Initiative.
Table 3.
Annual precipitation-Hg records for Midwestern USA study area, 2001–2016.
| Year | National Atmospheric Deposition Program Mercury Deposition Network Site Identification Number | ||||||||||||
|---|---|---|---|---|---|---|---|---|---|---|---|---|---|
| IN20 | IN21 | IN22 | IN26 | IN28 | IN34 | IL11 | IL63 | KY10 | MI26 | MI52 | OH02 | OH52 | |
| 2001 | yes | yes | yes | yes | yes | ||||||||
| 2002 | yes | yes | yes | yes | yes | ||||||||
| 2003 | yes | yes | yes | yes | yes | yes | |||||||
| 2004 | yes | yes | yes | yes | yes | yes | yes | ||||||
| 2005 | yes | yes | yes | yes | yes | yes | yes | yes | |||||
| 2006 | yes | yes | yes | yes | yes | yes | yes | yes | |||||
| 2007 | yes | yes | yes | yes | yes | yes | yes | yes | |||||
| 2008 | yes | yes | yes | yes | yes | yes | yes | yes | |||||
| 2009 | yes | yes | yes | yes | yes | yes | yes | yes | |||||
| 2010 | yes | yes | yes | ||||||||||
| 2011 | yes | yes | yes | yes | |||||||||
| 2012 | yes | yes | yes | ||||||||||
| 2013 | yes | yes | |||||||||||
| 2014 | yes | yes | yes | yes | yes | yes | yes | yes | yes | yes | |||
| 2015 | yes | yes | yes | yes | yes | yes | yes | yes | yes | yes | |||
| 2016 | yes | yes | yes | yes | yes | yes | yes | ||||||
Note: yes indicates complete annual record (52 weeks of monitoring observations); shaded indicates incomplete annual record.
Table 4.
Summary of annual precipitation-Hg data by site for Midwestern USA study area, 2001–2016.
| Site ID Number | Number of Years | Number of Weekly Observations a | Number of Weekly Precipitation Samples b | Median Annual Precipitation-Hg Deposition (mg/m2) | Median Annual Precipitation-Weighted Hg Concentration (ng/L) | Median Annual Precipitation Depth (mm) |
|---|---|---|---|---|---|---|
| IN20 | 9 | 468 | 400 | 9.4 | 9.2 | 1049 |
| IN21 | 13 | 676 | 602 | 15.0 | 11.6 | 1289 |
| IN22 | 3 | 156 | 134 | 10.1 | 8.1 | 1152 |
| IN26 | 6 | 312 | 279 | 10.6 | 9.4 | 1184 |
| IN28 | 9 | 468 | 395 | 10.5 | 8.6 | 1244 |
| IN34 | 15 | 780 | 682 | 10.4 | 10.7 | 1071 |
| IL11 | 16 | 832 | 718 | 9.9 | 10.9 | 882 |
| IL63 | 2 | 104 | 89 | 12.3 | 9.8 | 1285 |
| KY10 | 14 | 728 | 661 | 10.7 | 8.1 | 1315 |
| MI26 | 2 | 104 | 100 | 8.6 | 8.3 | 1048 |
| MI52 | 3 | 156 | 143 | 8.8 | 9.8 | 900 |
| OH02 | 8 | 416 | 376 | 8.8 | 8.4 | 930 |
| OH52 | 2 | 104 | 87 | 5.8 | 8.4 | 704 |
Note: ID: identification; Hg: mercury; mg/m2: microgram per square meter; ng/L: nanogram per liter; mm: millimeter; a “Observation” is rain gage and precipitation collector in operation, regardless of measured weekly precipitation depth. b “Sample” is measured weekly precipitation depth >0.25 mm.
Table 5.
Characteristics of Litterfall Mercury Monitoring Initiative sites in Midwestern USA study area.
Table 5.
Characteristics of Litterfall Mercury Monitoring Initiative sites in Midwestern USA study area.
| Site ID Number | Abbreviated Site Name | Deciduous Forest-Cover Type | Tree Species |
|---|---|---|---|
| IN20 | Roush Lake | maple-beech-birch | maple, poplar, ash, cherry, elm |
| IN21 | Clifty Falls | oak-hickory | poplar, maple, elm, sassafras, red cedar |
| IN22 | SW Agr. Center | oak-hickory | sycamore, hackberry, elm, honey locust, paw paw |
| IN26 | Fort Harrison | oak-hickory | poplar, maple, oak, cherry |
| IN34 | Indiana Dunes | oak-hickory | black oak, white oak, shagbark hickory, sugar maple, red maple, black walnut, black cherry |
| KY10 | Mammoth Cave | oak-hickory | oak, maple, hickory, ash |
| OH02 | Athens | oak-hickory | oak, maple, hickory, cherry |
ID: identification.
Table 6.
Annual litterfall-Hg records for Midwestern USA study area, 2007–2016.
| Year | National Atmospheric Deposition Program Litterfall Mercury Monitoring Initiative Site Identification Number | ||||||
|---|---|---|---|---|---|---|---|
| IN20 | IN21 | IN22 | IN26 | IN34 | KY10 | OH02 | |
| 2007 | yes | yes | yes | yes | yes | yes | |
| 2008 | yes | yes | yes | yes | yes | yes | |
| 2009 | yes | yes | yes | yes | yes | yes | |
| 2010 | |||||||
| 2011 | |||||||
| 2012 | yes | ||||||
| 2013 | yes | ||||||
| 2014 | yes | ||||||
| 2015 | yes | yes | yes | ||||
| 2016 | yes | yes | yes | ||||
Note: yes indicates Litterfall Mercury Monitoring Initiative site operation per year; shaded years indicate no data collection.
Table 7.
Atmospheric-Hg deposition data for Litterfall Mercury Monitoring Initiative sites in Midwestern USA study area, 2007–2016.
Table 7.
Atmospheric-Hg deposition data for Litterfall Mercury Monitoring Initiative sites in Midwestern USA study area, 2007–2016.
| Site ID Number | Year | Annual Litterfall-Hg Concentration (ng/g) a | Annual Litterfall Mass (g/m2) b | Annual Litterfall-Hg Deposition (mg/m2/year) c | Annual Precipitation-Hg Deposition (mg/m2/year) d | Estimated Annual Atmospheric-Hg Deposition (mg/m2/year) e |
|---|---|---|---|---|---|---|
| IN20 | 2007 | 33.4 ± 19.6 | 588 | 19.7 | 7.6 | 27.3 |
| 2008 | 45.1 ± 3.6 | 274 | 12.3 | 9.5 | 21.8 | |
| 2009 | 41.3 ± 1.5 | 236 | 9.7 | 7.8 | 17.5 | |
| IN21 | 2007 | 34.0 ± 22.3 | 475 | 16.1 | 12.0 | 28.1 |
| 2008 | 53.4 ± 2.8 | 322 | 17.2 | 16.3 | 33.5 | |
| 2009 | 58.8 ± 1.0 | 252 | 14.8 | 16.5 | 31.3 | |
| 2015 | 49.3 ± 2.5 | 283 | 14.0 | 12.4 | 26.4 | |
| 2016 | 50.6 ± 3.5 | 281 | 14.2 | 10.0 | 24.2 | |
| IN22 | 2015 | 47.1 ± 3.8 | 418 | 19.7 | 10.1 | 29.8 |
| 2016 | 45.4 ± 3.8 | 328 | 14.9 | 9.5 | 24.4 | |
| IN26 | 2007 | 48.2 ± 12.1 | 445 | 21.5 | 9.8 | 31.3 |
| 2008 | 47.8 ± 0.6 | 409 | 19.5 | 19.7 | 39.2 | |
| 2009 | 42.8 ± 1.9 | 260 | 11.1 | 9.6 | 20.7 | |
| IN34 | 2007 | 58.3 ± 11.0 | 402 | 23.4 | 10.6 | 34.0 |
| 2008 | 45.4 ± 2.2 | 446 | 20.3 | 12.1 | 32.4 | |
| 2009 | 33.7 ± 3.3 | 368 | 12.4 | 10.0 | 22.4 | |
| 2012 | 40.7 ± 2.2 | 423 | 17.2 | 8.8 | 26.1 | |
| 2013 | 40.6 ± 1.7 | 377 | 15.3 | 13.8 | 29.1 | |
| 2014 | 35.2 ± 0.9 | 507 | 17.8 | 12.0 | 29.8 | |
| 2015 | 38.7 ± 3.9 | 417 | 16.1 | 8.3 | 24.4 | |
| 2016 | 39.4 ± 1.8 | 383 | 15.1 | 7.6 | 22.7 | |
| KY10 | 2007 | 36.1 ± 8.9 | 349 | 12.6 | 10.2 | 22.8 |
| 2008 | 39.9 ± 1.9 | 318 | 12.7 | 10.2 | 22.9 | |
| 2009 | 45.2 ± 4.1 | 277 | 12.5 | 12.1 | 24.6 | |
| OH02 | 2007 | 50.1 ± 9.8 | 431 | 21.6 | 8.7 | 30.3 |
| 2008 | 37.6 ± 3.8 | 499 | 18.8 | 9.8 | 28.6 | |
| 2009 | 49.0 ± 1.2 | 329 | 16.1 | 6.8 | 22.9 |
Note: ID, identification; Hg: mercury; ng/g: nanogram per gram; g/m2: gram per square meter; mg/m2/year: microgram per square meter per year; a: Annual mean Hg concentration in litterfall samples ± standard deviation of mean; b: Annual sum of the litterfall mass in gram dry weight per square meter; c: Annual litterfall-Hg deposition computed as the product of annual mean Hg concentration and annual litterfall mass, using non-rounded values; d: Annual precipitation-Hg deposition from National Atmospheric Deposition Program [44]; e: Sum of annual litterfall-Hg deposition and annual precipitation-Hg deposition.
Table 8.
Summary of weekly precipitation-Hg data by site for Midwestern USA study area, 2001–2016.
| Site ID Number | Number of Years | Number of Weekly Precipitation Samples a | Median Weekly Precipitation-Hg Deposition (ng/m2) | Median Weekly Precipitation-Hg Concentration (ng/L) | Median Weekly Precipitation Depth (mm) |
|---|---|---|---|---|---|
| IN20 | 9 | 400 | 136.6 | 9.4 | 17.3 |
| IN21 | 13 | 602 | 196.2 | 10.8 | 21.0 |
| IN22 | 3 | 134 | 141.9 | 8.4 | 18.0 |
| IN26 | 6 | 279 | 158.3 | 8.8 | 17.8 |
| IN28 | 9 | 395 | 159.8 | 9.4 | 19.8 |
| IN34 | 15 | 682 | 137.3 | 10.2 | 15.2 |
| IL11 | 16 | 718 | 137.2 | 10.8 | 14.2 |
| IL63 | 2 | 89 | 198.2 | 10.4 | 21.3 |
| KY10 | 14 | 661 | 158.1 | 8.3 | 20.1 |
| MI26 | 2 | 100 | 95.0 | 7.6 | 14.3 |
| MI52 | 3 | 143 | 89.3 | 8.0 | 11.4 |
| OH02 | 8 | 376 | 116.7 | 8.3 | 16.5 |
| OH52 | 2 | 87 | 63.6 | 8.1 | 9.6 |
Note: ID: identification; Hg: mercury; ng/m2: nanogram per square meter; ng/L: nanogram per liter; mm: millimeter; a: Sample is measured weekly precipitation depth >0.25 mm.
Table 9.
Extreme episodes of weekly precipitation-Hg deposition in Midwestern USA study area, 2001–2016.
Table 9.
Extreme episodes of weekly precipitation-Hg deposition in Midwestern USA study area, 2001–2016.
| Site ID Number | Dates of Weekly Sample | Weekly Precipitation-Hg Deposition (ng/m2) | Weekly Precipitation-Hg Concentration (ng/L) | Weekly Precipitation Depth (mm) | Percentage of Annual Precipitation-Hg Deposition |
|---|---|---|---|---|---|
| IN34 | 28 June–5 July 2011 | 2602 | 30.7 | 84.8 | 17% |
| IN20 | 1–8 July 2003 | 2456 | 11.0 | 222.9 | 16% |
| KY10 | 26 April–3 May 2011 | 2453 | 14.7 | 166.9 | 16% |
| IN21 | 11–19 March 2008 | 2422 | 16.7 | 144.8 | 15% |
| IL11 | 1–8 July 2008 | 2326 | 39.8 | 58.4 | 16% |
| IN26 | 3–9 June 2008 | 2218 | 20.3 | 109.5 | 12% |
| IN21 | 26 April–3 May 2011 a | 2158 | 14.7 | 147.3 | 11% |
| IN21 | 8–15 July 2003 | 2043 | 22.4 | 91.2 | 12% |
| IN21 | 29 November–6 December 2011 a | 1891 | 20.3 | 93.2 | 10% |
| IN34 | 9–16 September 2008 | 1876 | 7.1 | 265.2 | 16% |
| IN21 | 7–14 March 2006 | 1797 | 12.4 | 144.8 | 11% |
| IN21 | 17–24 June 2015 a | 1790 | 14.9 | 120.1 | 14% |
| IN21 | 26 August–9 September 2003 | 1766 | 10.7 | 165.7 | 10% |
| IN20 | 6–13 May 2003 | 1754 | 12.5 | 140.4 | 12% |
| IN21 | 6–14 April 2004 | 1742 | 35.7 | 48.8 | 11% |
| IL11 | 13–20 July 2010 | 1729 | 16.6 | 104.4 | 15% |
| IN20 | 8–15 June 2004 | 1709 | 14.4 | 118.4 | 15% |
| IN21 | 11–18 December 2001 | 1703 | 22.3 | 76.2 | 14% |
| IN21 | 1–8 April 2014 a | 1701 | 12.7 | 133.9 | 13% |
| IN26 | 25 April–2 May 2006 | 1696 | 45.4 | 37.3 | 12% |
| IN21 | 4–11 January 2005 | 1686 | 20.1 | 83.8 | 14% |
| IN34 | 20–27 July 2010 | 1660 | 15.8 | 105.2 | 13% |
| IN21 | 25 May–1 June 2004 | 1658 | 13.7 | 121.4 | 11% |
| IN28 | 6–13 March 2006 | 1657 | 8.7 | 191.5 | 14% |
| IN20 | 11–18 April 2006 | 1654 | 17.4 | 95.0 | 16% |
| IN22 | 1–8 April 2014 | 1644 | 12.1 | 135.9 | 15% |
| IN21 | 28 July–4 August 2009 a | 1640 | 10.6 | 154.4 | 10% |
Note: ID: identification; Hg: mercury; ng/m2: nanogram per square meter; ng/L: nanogram per liter; mm: millimeter; bold indicates identical weeks; a: Paths of air masses contributing to precipitation-Hg episode analyzed with modeled 48 h back trajectory (Figure 5).
© 2018 by the authors. Licensee MDPI, Basel, Switzerland. This article is an open access article distributed under the terms and conditions of the Creative Commons Attribution (CC BY) license (http://creativecommons.org/licenses/by/4.0/).
Share and Cite
MDPI and ACS Style
Risch, M.R.; Kenski, D.M. Spatial Patterns and Temporal Changes in Atmospheric-Mercury Deposition for the Midwestern USA, 2001–2016. Atmosphere 2018, 9, 29. https://doi.org/10.3390/atmos9010029
AMA Style
Risch MR, Kenski DM. Spatial Patterns and Temporal Changes in Atmospheric-Mercury Deposition for the Midwestern USA, 2001–2016. Atmosphere. 2018; 9(1):29. https://doi.org/10.3390/atmos9010029
Chicago/Turabian StyleRisch, Martin R., and Donna M. Kenski. 2018. "Spatial Patterns and Temporal Changes in Atmospheric-Mercury Deposition for the Midwestern USA, 2001–2016" Atmosphere 9, no. 1: 29. https://doi.org/10.3390/atmos9010029
Note that from the first issue of 2016, this journal uses article numbers instead of page numbers. See further details here.