Typhoon Rainfall Forecasting by Means of Ensemble Numerical Weather Predictions with a GA-Based Integration Strategy


1
Taiwan Typhoon and Flood Research Institute, National Applied Research Laboratories, Taipei City 10093, Taiwan
2
National Applied Research Laboratories, Taipei City 10093, Taiwan
3
Department of Civil Engineering, National Chiao Tung University, Hsinchu City 30010, Taiwan
*
Author to whom correspondence should be addressed.
Atmosphere 2018, 9(11), 425; https://doi.org/10.3390/atmos9110425
Submission received: 9 October 2018
/
Revised: 29 October 2018
/
Accepted: 29 October 2018
/
Published: 30 October 2018
(This article belongs to the Special Issue Integration of Advanced Soft Computing Techniques in Hydrological Predictions)
Abstract
:Rainfall during typhoons is one of the most important water resources in Taiwan, but heavy typhoon rainfall often leads to serious disasters and consequently results in loss of lives and property. Hence, accurate forecasts of typhoon rainfall are always required as important information for water resources management and rainfall-induced disaster warning system. In this study, a methodology is proposed for providing quantitative forecasts of 24 h cumulative rainfall during typhoons. Firstly, ensemble forecasts of typhoon rainfall are obtained from an ensemble numerical weather prediction (NWP) system. Then, an evolutionary algorithm, i.e., genetic algorithm (GA), is adopted to real-time decide the weights for optimally combining these ensemble forecasts. That is, the novelty of this proposed methodology is the effective integration of the NWP-based ensemble forecasts through an evolutionary algorithm-based strategy. An actual application is conducted to verify the forecasts resulting from the proposed methodology, namely NWP-based ensemble forecasts with a GA-based integration strategy. The results confirm that the forecasts from the proposed methodology are in good agreement with observations. Besides, the results from the GA-based strategy are more accurate as compared to those by simply averaging all ensemble forecasts. On average, the root mean square error decreases about 7%. In conclusion, more accurate typhoon rainfall forecasts are obtained by the proposed methodology, and they are expected to be useful for disaster warning system and water resources management during typhoons.
1. Introduction
Based on the report of the World Meteorological Organization [1], the tropical cyclone is the second ranked natural disaster in terms of loss of life. The Northwestern Pacific Ocean is the most active tropical cyclone basin and nearly 30 tropical cyclones (approximately 1/3 of all tropical cyclones in the whole world) occur annually. Tropical cyclones occur in this basin are also called Northwestern Pacific typhoons. Taiwan is situated in one of the main paths of Northwestern Pacific typhoons. According to the data counted by Taiwan Central Weather Bureau, a total of 365 typhoons invaded Taiwan from 1911 to 2017. On average, three to four typhoons invade Taiwan per year. Rainfall brought by typhoons is one of the most important water resources in Taiwan (about 50% of the annual rainfall). However, heavy typhoon rainfall often leads to serious disasters, such as floods, inundations and debris flows, and results in loss of lives and property. For effective water resources management and rainfall-induced disaster mitigation, accurate typhoon rainfall forecasts are always required as an important reference for related authorities.
In hydrological applications, the forecasts of typhoon rainfall are commonly obtained by applying various statistically based techniques. Many researches are available in the literature, such as the use of time series regression (e.g., [2,3]), and the use of neural networks (e.g., [4,5,6,7,8,9]). Most of these researches reported that statistically based techniques usually yield acceptable forecasts with a shorter lead time generally. That is because that the relationship between available predictors and desired predictands (i.e., typhoon rainfall herein) decreases with increasing forecast lead time. Therefore, statistically-based techniques fail to provide efficient forecasts of typhoon rainfall with a longer lead time. Recently, with the development of atmospheric science and computer technology, the use of numerical weather prediction (NWP) techniques for typhoon rainfall forecasting has been receiving considerable attention (e.g., [10–14]). By using physically- and dynamically-based numerical weather models (NWMs), weather forecasts with lead times of several days (usually 1 to 3 days in Taiwan) are generated according to the current weather observations. Nowadays, NWP is seen as the most reliable source for atmospheric forecasts with a large spatial coverage and high temporal resolution [15,16].
Therefore, in order to provide accurate rainfall forecasts when typhoons affect Taiwan, a NWP-based ensemble prediction system (EPS) is established by Taiwan Typhoon and Flood Research Institute (TTFRI) of the National Applied Research Laboratories [12]. The EPS means two or more NWMs with different configurations are executed at the same time to take the uncertainties of NWPs into account. By giving differences in model configurations, EPS can yield multiple results to capture the uncertainties of weather/rainfall forecasting [17,18], and then to provide probabilistic forecasts [19]. Studies related to the use of rainfall forecasts from the EPS of TTFRI (named as TTFRI-EPS hereafter) have confirmed the potential of TTFRI-EPS for providing useful information of rainfall during typhoons [12,20–23].
However, owing to the differences in model configuration, ensemble rainfall forecasts provided by TTFRI-EPS sometimes vary in a wide range and differ from each other even at the same location and time. It is difficult to determine how to effectively use these ensemble forecasts. If these diverse rainfall forecasts are used directly, totally different hydrological scenarios might be obtained accordingly. That is confusing for authorities to make a proper decision for water management and disaster mitigation. Conventionally, the simple average of all ensemble forecasts (i.e., the ensemble mean) is usually used because the ensemble mean is generally more accurate than the forecasts from individual members in an EPS [12,24,25,26]. Nevertheless, the ensemble mean often under-predicts the extreme rainfall actually [27]. This drawback is unfavorable for disaster mitigation and prevention. Therefore, in recent years, considerable concern has arisen over the effective integration of the ensemble forecasts from an EPS (e.g., [27,28,29,30,31,32]). By using various statistically based techniques, the researches confirm the advantage of post-processing of ensemble forecasts in obtaining improved results. For example, Messner et al. [28] used logistic regression to achieve well-calibrated probabilistic forecasts. Kumar et al. [30] performed linear programming and weighted mean techniques to select the best combination of five streamflow models. Wu et al. [32] applied a neural network-based cluster analysis technique to categorize ensemble forecasts and then calculated the simple average of partial forecasts which are grouped in a specific cluster.
In this study, for providing more accurate quantitative forecasts of 24 h cumulative rainfall during typhoons, a methodology based on the use of ensemble NWPs with a meta-heuristic-based integration strategy is proposed. First, through the ensemble numerical weather prediction system in Taiwan (i.e., TTFRI-EPS), the NWP-based ensemble forecasts of typhoon rainfall are obtained. Moreover, an optimization-based strategy is developed to real-time integrate these ensemble forecasts for obtaining a better result. That is, the ensemble forecasts will be combined optimally by using the weights derived from the optimization-based strategy. The results from the proposed methodology is an improved ensemble mean and is expected to improve the quantitative forecasts of 24 h typhoon rainfall. The remainder of this paper is organized as follows. The second section introduces the ensemble numerical weather prediction system in Taiwan. The detail of the optimization-based integration strategy for optimally combining these ensemble forecasts of TTFRI-EPS is described in the third section. The fourth section contains the study typhoon events. Then, the results of actual application are provided in the fifth section. Comparison between the proposed and the conventional strategy (i.e., the simple average method) is also conducted and discussed in this section. Finally, the summary and conclusions are presented.
2. Ensemble Numerical Weather Prediction System
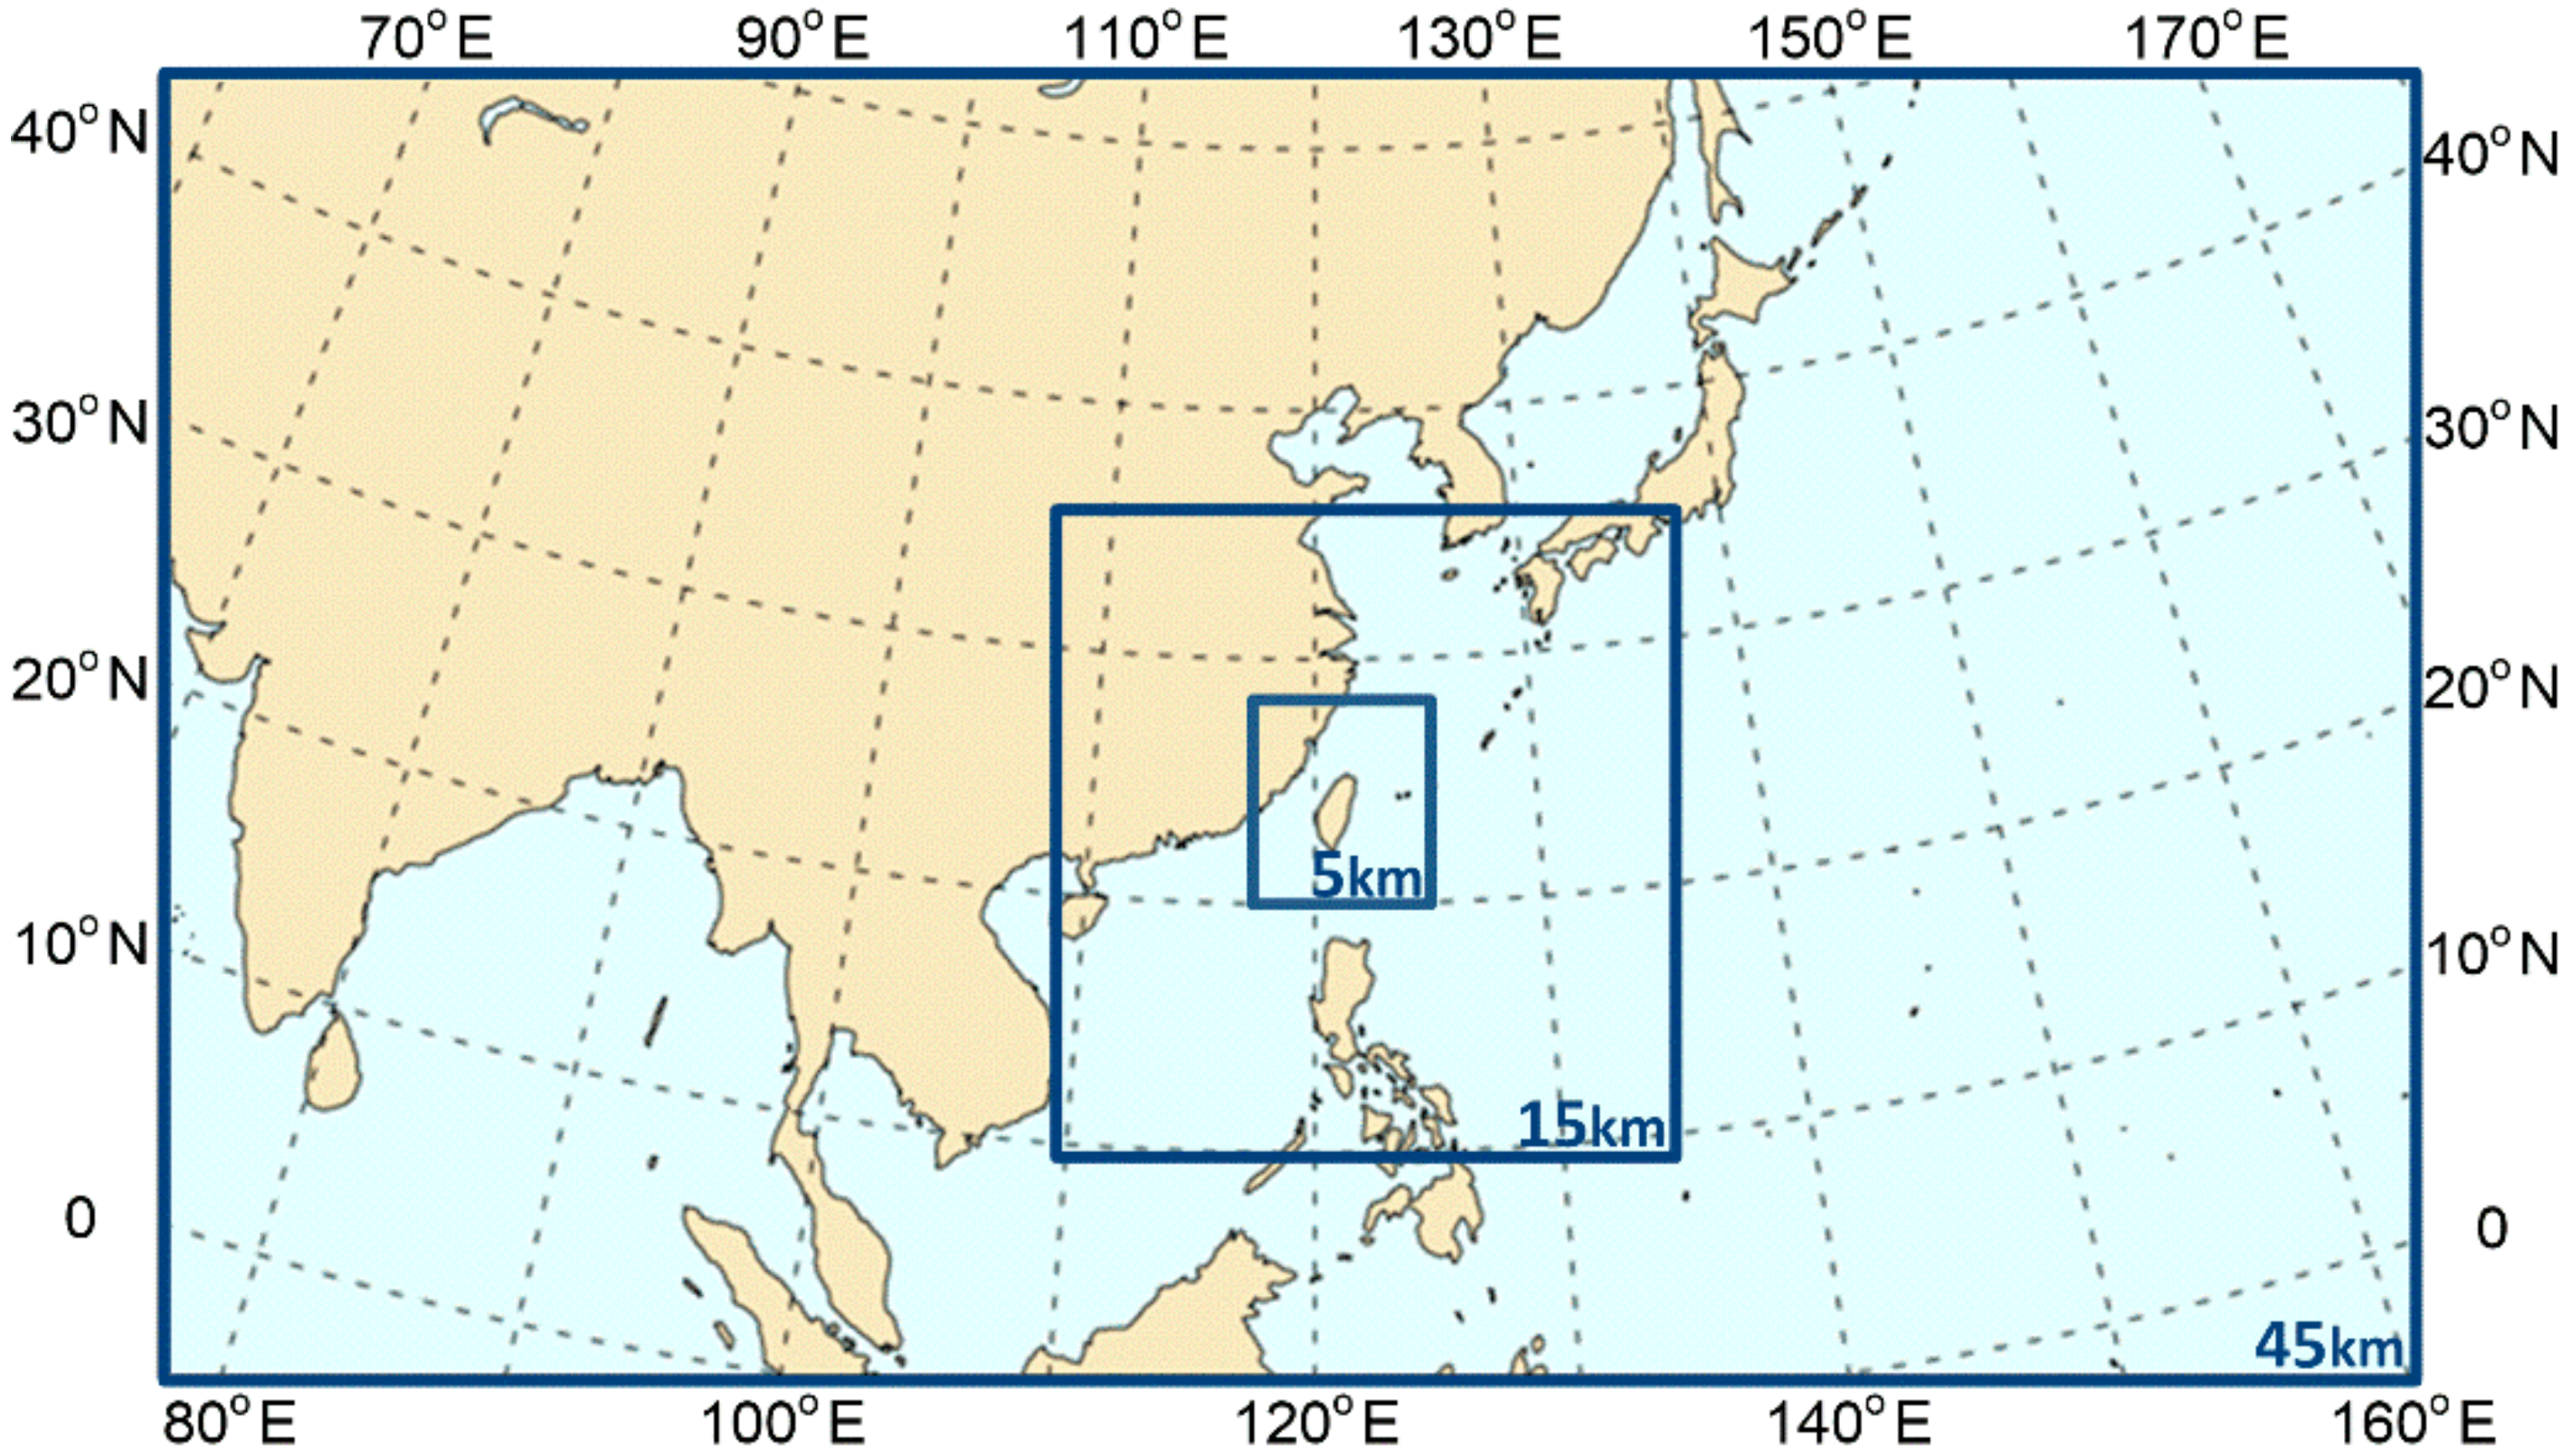
Based on physical and dynamical principles of atmosphere, numerical weather models (NWMs) are performed to generate future numerical weather predictions (NWPs). With a large spatial coverage and high temporal resolution, NWPs are recognized as the “state-of-the-art” most reliable source for atmospheric predictions. In recent years, the potential of NWPs for quantitative precipitation/rainfall forecasting has been receiving considerable attention (e.g., [10,11,12,13]). To provide typhoon rainfall forecasts for Taiwan, Taiwan Typhoon and Flood Research Institute (TTFRI) of the National Applied Research Laboratories establishes a NWP-based ensemble weather prediction system (EPS). TTFRI-EPS, which started at 2010, is a collective effort among several academic institutes and government agencies [12]. To date, more than 20 ensemble members have been established in TTFRI-EPS for future weather prediction. These ensemble members are designed by using several NWMs with different model configurations. Four NWMs adopted in TTFRI-EPS are the Weather Research and Forecasting (WRF) Model, the Hurricane Weather Research and Forecasting (HWRF) Model, the fifth-generation Pennsylvania State University-National Center for Atmospheric Research Mesoscale Model (MM5), and the Cloud Resolving Storm Simulator (CReSS) Model. The nested domains, which cover Taiwan, are used for these NWMs (Figure 1), except that CReSS uses only one domain. The outermost domain with 45 km horizontal resolution is designed to capture the synoptic-scale features. As to the middle and the innermost domain, which are designed to resolve mesoscale systems, the horizontal resolutions are 15 and 5 km, respectively. As regards CReSS, the horizontal resolution of the only one domain is 5 km and the domain size is similar to the innermost domain used in the other NWMs. Additionally, a total of 45, 43, 35, and 40 vertical levels are used for WRF, HWRF, MM5 and CReSS, respectively.
NWMs in TTFRI-EPS are equipped with different model configurations, such as the use of initial condition perturbations and model perturbations. The initial condition perturbation means the variations in the atmospheric first-guess states. Two data-assimilation strategies, i.e., cold-start and partial-cycle, are used in TTFRI-EPS. Cold-start means that the initial conditions at the analysis time are directly obtained from the National Centers for Environmental Prediction Global Forecast System (NCEP-GFS). Partial-cycle means that 12 h before NCEP-GFS analysis data are used and two 6 h data-assimilation cycles are executed to obtain the initial conditions at the analysis time. The three-dimensional variational data assimilation system is applied to process these initial conditions for initial perturbations. As for model perturbations, different cumulus parameterization schemes and microphysics schemes are used. In TTFRI-EPS, 6 cumulus parameterization schemes are employed to the outermost and the middle domains to describe the effects of subgrid-scale convective clouds. More precisely, the Grell-Devenyi, the Grell 3D, the Betts-Miller-Janjic, and the Kain-Fritsch schemes are used for WRF members. The Grell and the Simplified Arakawa and Schubert schemes are used for MM5 and HWRF members, respectively. As to CReSS members, there is no need for the cumulus parameterization scheme due to the use of only one high-resolution domain. Regarding the microphysics schemes, which are applied to high-resolution domains to describe grid-scale precipitation processes, 4 schemes are employed. The Goddard scheme is used for WRF and MM5 members, the Cold rain scheme is used for CReSS members, and the Ferrier scheme is used for HWRF members. The aforementioned model configurations are designed based on the preliminary experiments in 2010. For more detailed information about TTFRI-EPS, readers can refer to Hsiao et al. [12,33], Yang et al. [23], and Wu and Lin [34].
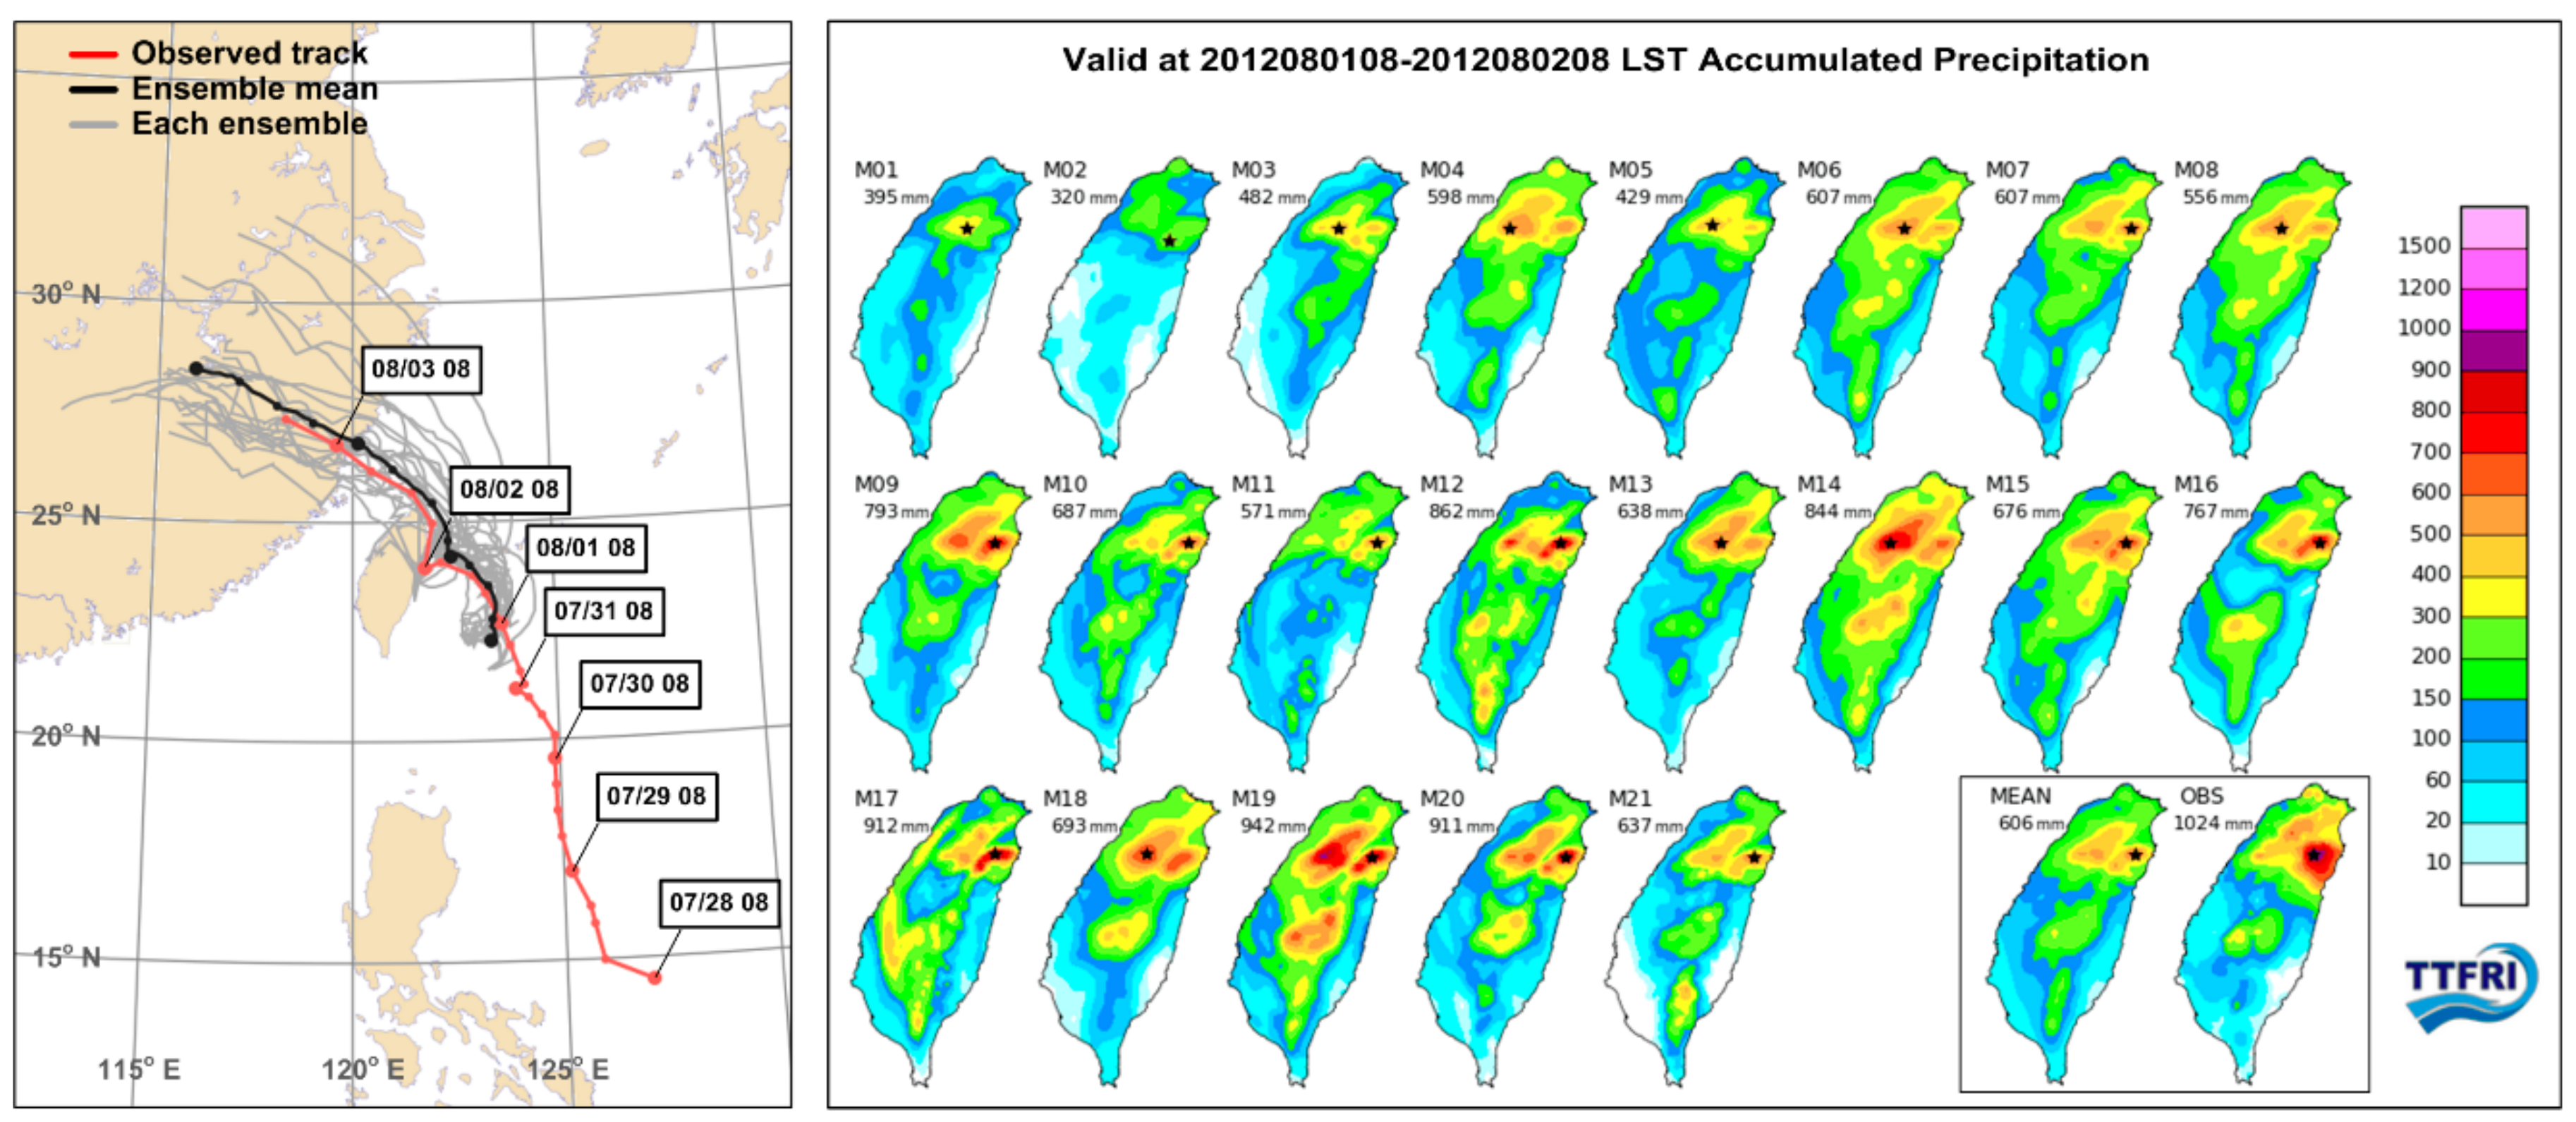
Nowadays, TTFRI-EPS operationally provides 24, 48, and 72 h typhoon track and rainfall forecasts 4 times per day (every 6 h). An example of ensemble forecasts of typhoon track and rainfall provided by TTFRI-EPS is presented in Figure 2. The date is Local Standard Time (LST) in Taiwan that is 8 h behind Coordinated Universal Time (UTC). In this figure, ensemble forecasts are issued at 08 LST on 1 August during typhoon Saola in 2012 and the model initial time is 02 LST on 1 August. The 6 h time difference is in order to ensure all forecasts are available as well as to avoid the numerical model spin-up issue. For typhoon track, the ensemble forecasts and the average of all ensemble forecasts are shown by gray and black lines, respectively. As to the ensemble forecasts of typhoon rainfall, contour plots are provided. For each forecast, the maximum value is presented and the location is starred. As shown in Figure 2, the variances among ensemble forecasts are obvious. That is because the ensemble members are designed by using various numerical weather prediction models with different model configurations. However, these ensemble forecasts still provide useful information, such as the main direction of typhoon track and the main rainfall area. It is expected that the ensemble forecasts from TTFRI-EPS have potential as a valuable reference for typhoon rainfall forecasting.
3. The Proposed GA-Based Methodology
As mentioned earlier, the ensemble typhoon rainfall forecasts from TTFRI-EPS are useful information. However, these results are not easy to use directly in hydrological modeling due to the high variability among different members. It is suggested that a proper analysis or post-process should be carried out first for effectively use these ensemble forecasts. Hence, a novel methodology based on the use of an optimal integration strategy to integrate ensemble NWPs (i.e., TTFRI-EPS) is proposed herein for obtaining more accurate quantitative forecasts of 24 h rainfall during typhoons. Many kinds of optimization algorithms have been presented in the literature (e.g., [35,36,37,38]). In this study, the genetic algorithm (GA), which is the most common, is adopted because of its simplicity, great capability to find the global optimum solution, and applicability to a wide variety of problems. Through the GA-based integration strategy, ensemble forecasts will be well combined by using the optimal weights derived from GA. On the basis of the effective combination of these ensemble forecasts, it is expected to provide improved forecasts of 24 h typhoon rainfall.
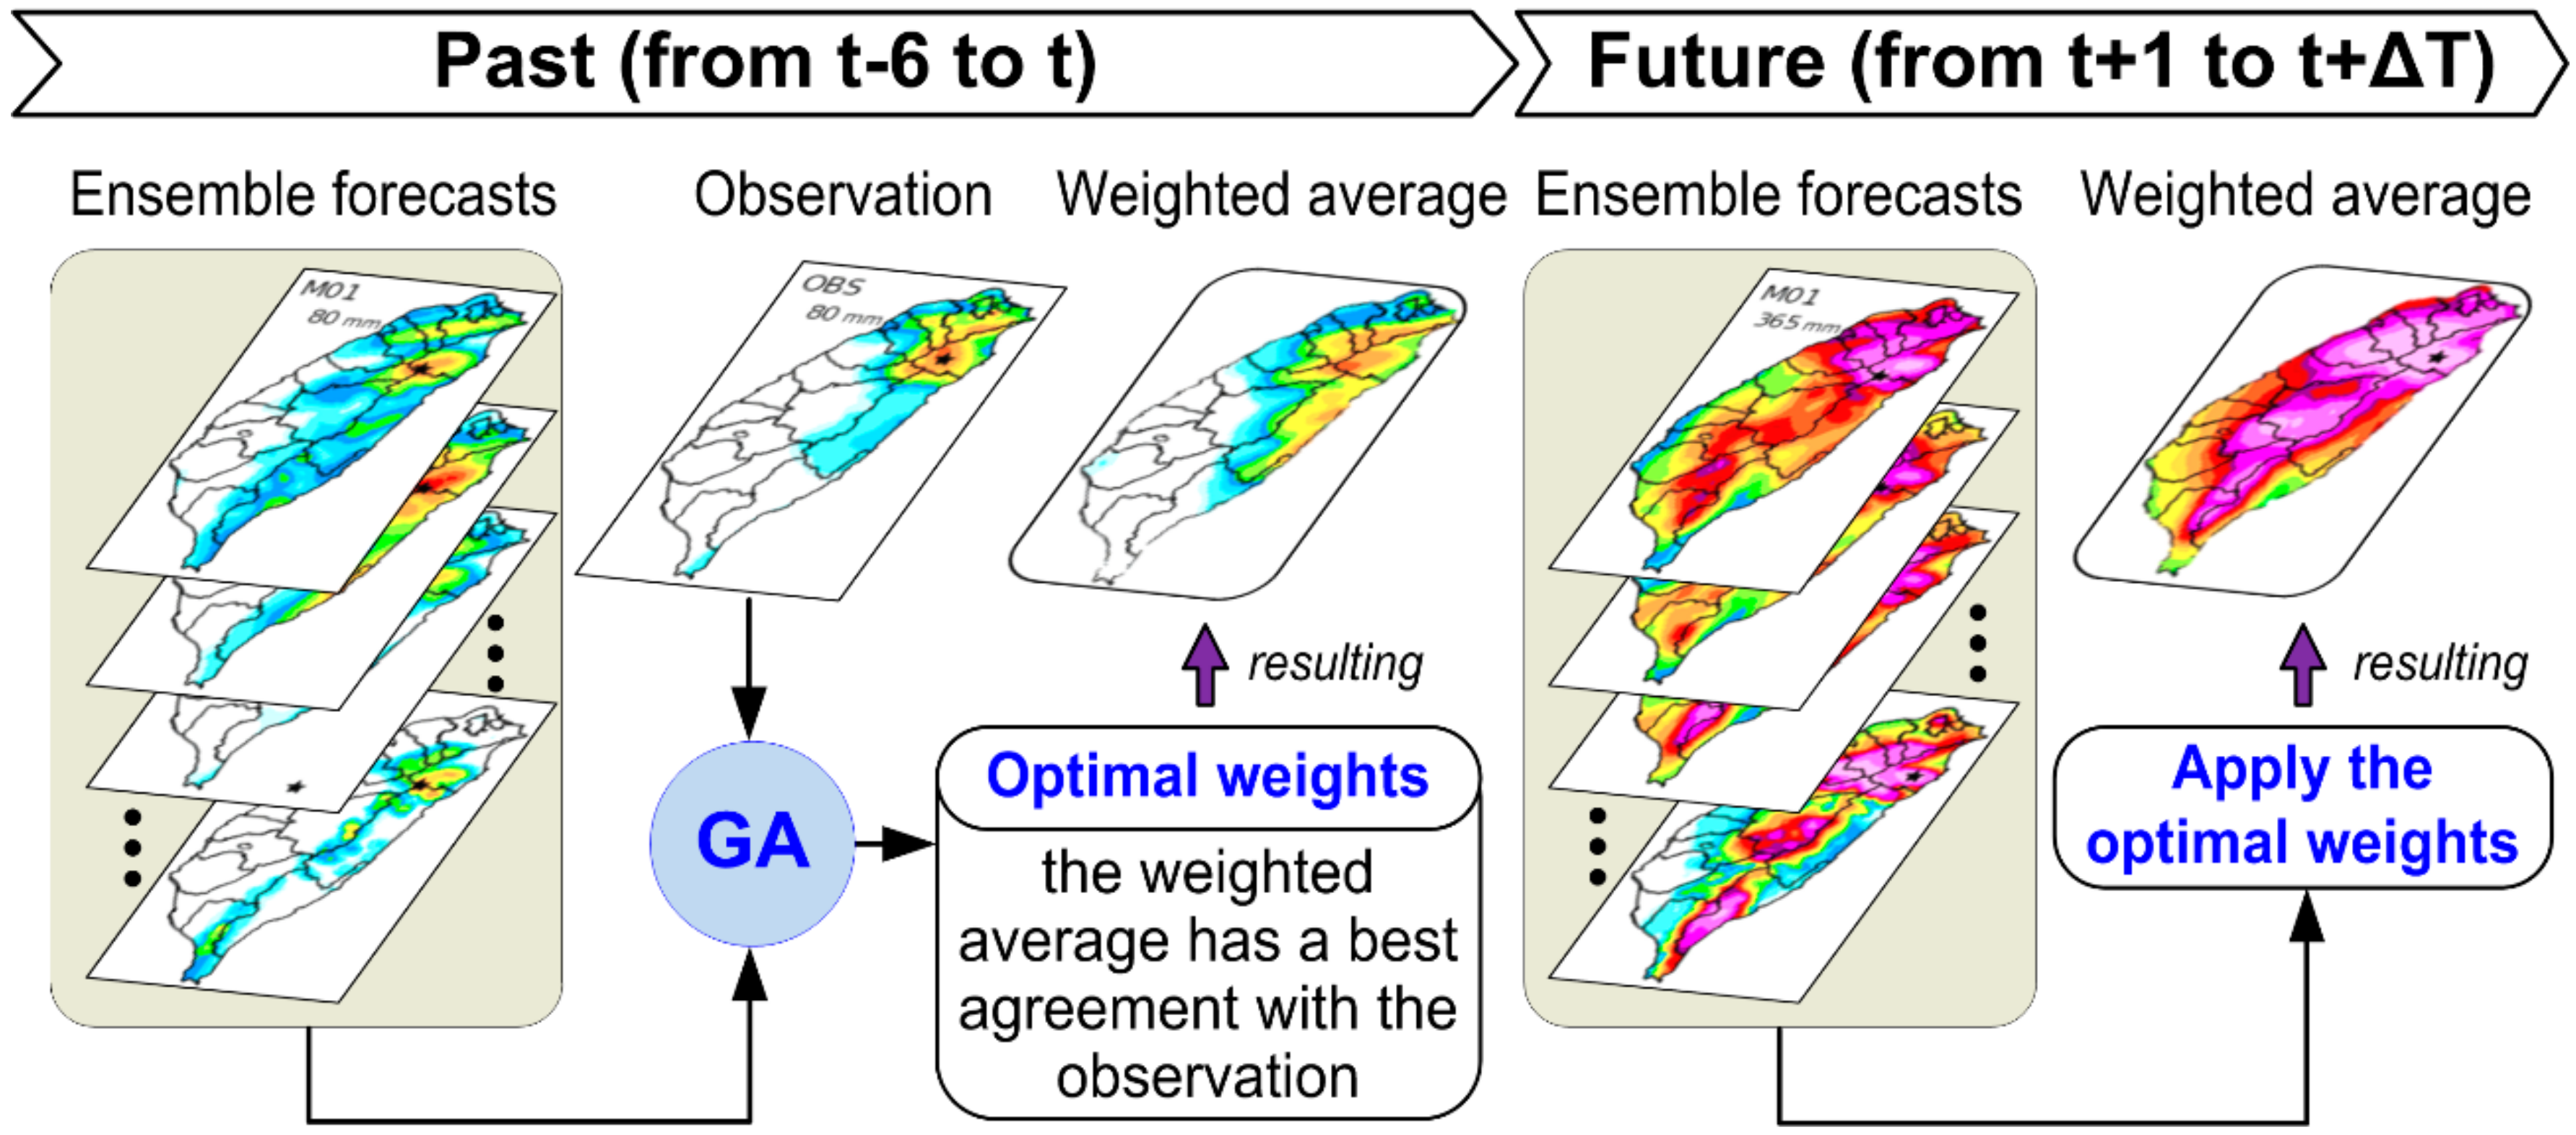
The illustration of the proposed GA-based methodology is presented in Figure 3. Two steps are involved in the proposed methodology for the optimal combination of ensemble forecasts. The first is the “Past” step and the second is the “Future” step. In the Past step, the ensemble forecasts from TTFRI-EPS and the observation during the near past time are collected firstly. As mentioned earlier, the ensemble forecasts are provided 6 h later than the model initial time. For example, the NWMs in TTFRI-EPS are initialized at 00 UTC, and the ensemble forecasts are yielded at 06 UTC. That is, when the ensemble forecasts are obtained, the observation during the earlier time period (i.e., from 00 to 06 UTC) is already available. Therefore, in this step, the observation and the ensemble forecasts during the past 6 h is used to decide the optimal weights. By using the optimal weights derived from GA, these ensemble forecasts are combined to a single result that has the best agreement with the corresponding observation. Then, the optimal weights are applied to the next step, i.e., the Future step. In this step, the ensemble forecasts for the following 24 h (i.e., in Figure 3) are collected and combined by the optimal weights to yield the quantitative forecasts of 24 h rainfall. In conclusion, the proposed methodology is developed based on that if a combination of ensemble forecasts well represent the real situation in the near past, the combination will still be sufficient for the near future. Due to the use of the proposed GA-based methodology to effectively integrate the ensemble forecasts, the resulting forecasts are expected to be more accurate.
The proposed GA-based methodology are expressed in the following equations. The ensemble rainfall forecasts during the near past time in TTFRI-EPS are described as:
where means the cumulative rainfall forecasts for the past 6 h from the 1st member in TTFRI-EPS and n is the number of all ensemble members in TTFRI-EPS, namely 21. is a vector that represents the 6 h rainfall forecasts for rain gauges (as shown in Equation (2), means the forecast for the m-th gauge from the n-th member). In the Past step, the main work is to decide the optimal weights by means of GA. If a set of weights make the combination of ensemble forecasts has the best agreement with the corresponding observation, these weights are the optimal ones. The optimal combination of ensemble forecasts is described as Equation (3):
where means the weights and is the corresponding observation for a certain gauge i. The weight for a certain member j ranges from 0.0 to 1.0 and the sum of weights is 1 (). On the basis of Equation (3), the best agreement means the minimum root mean square error (RMSE), which is a good measure of accuracy, between forecasts and observations.
The flowchart of the determination of the optimal weights using GA is presented in Figure 4. In which, the adoption of methods used in GA is based on the generality, simplicity and convenience. Besides, the values of parameters are decided based on the preliminary experiments. Firstly, we randomly generate the initial group of chromosomes (population size is 8000 herein). Each chromosome contains genes using binary coding and can be decoded into one set of n weights, i.e., 5 genes represent a weight. Thus, a total of 8000 sets of weights are randomly generated. Then, all sets of weights are used to combine the ensemble forecasts and the fitness (i.e., RMSE in Equation (3)) of these combined results is evaluated. Thirdly, the chromosomes with better fitness are used as potential parents (i.e., the mating pool) to reproduce the new population in the next generation. Fourthly, among these parents, the fitness-based selection, the reproduction process with a crossover rate of 1 (single-point crossover), and a mutation rate of 0.1 is executed until the population size in the new generation is achieved. Fifthly, the fitness of each population in the new generation is re-evaluated. The population with the best fitness of the present generation is then recorded. The aforementioned selection, reproduction and evaluation steps are repeated sequentially for each generation until the stop condition is reached (generation size is 20 herein). Finally, the population with the best fitness among all generations is obtained and is adopted as the optimal weights . The optimal weights are then used in the Future step to integrate the ensemble rainfall forecasts of the following 24 h. The integration of ensemble rainfall forecasts for the following 24 h is described as:
where means the cumulative rainfall forecasts for the following 24 h from the 1st member in TTFRI-EPS and n is the total number of ensemble members, means the forecast for the gauge i from the j-th member, m is the total number of gauges, and is the final result.
4. Study Cases
4.1. Study Area and Typhoons
In this study, the study area is whole of Taiwan due to the use of the TTFRI-EPS ensemble forecasts. A total of about 750 rain gauges are used in this study. For these gauges, observed rainfall data are obtained from Taiwan Central Weather Bureau. The corresponding ensemble forecasts of rainfall provided by TTFRI-EPS are also collected. It is worth noting that the NWP-based ensemble rainfall forecasts are gridded data with a spatial resolution of 5 km. Thus, the ensemble rainfall forecasts of a certain gauge are obtained from the grid that contains this gauge. These ensemble rainfall forecasts will be integrated by means of the proposed GA-based methodology.
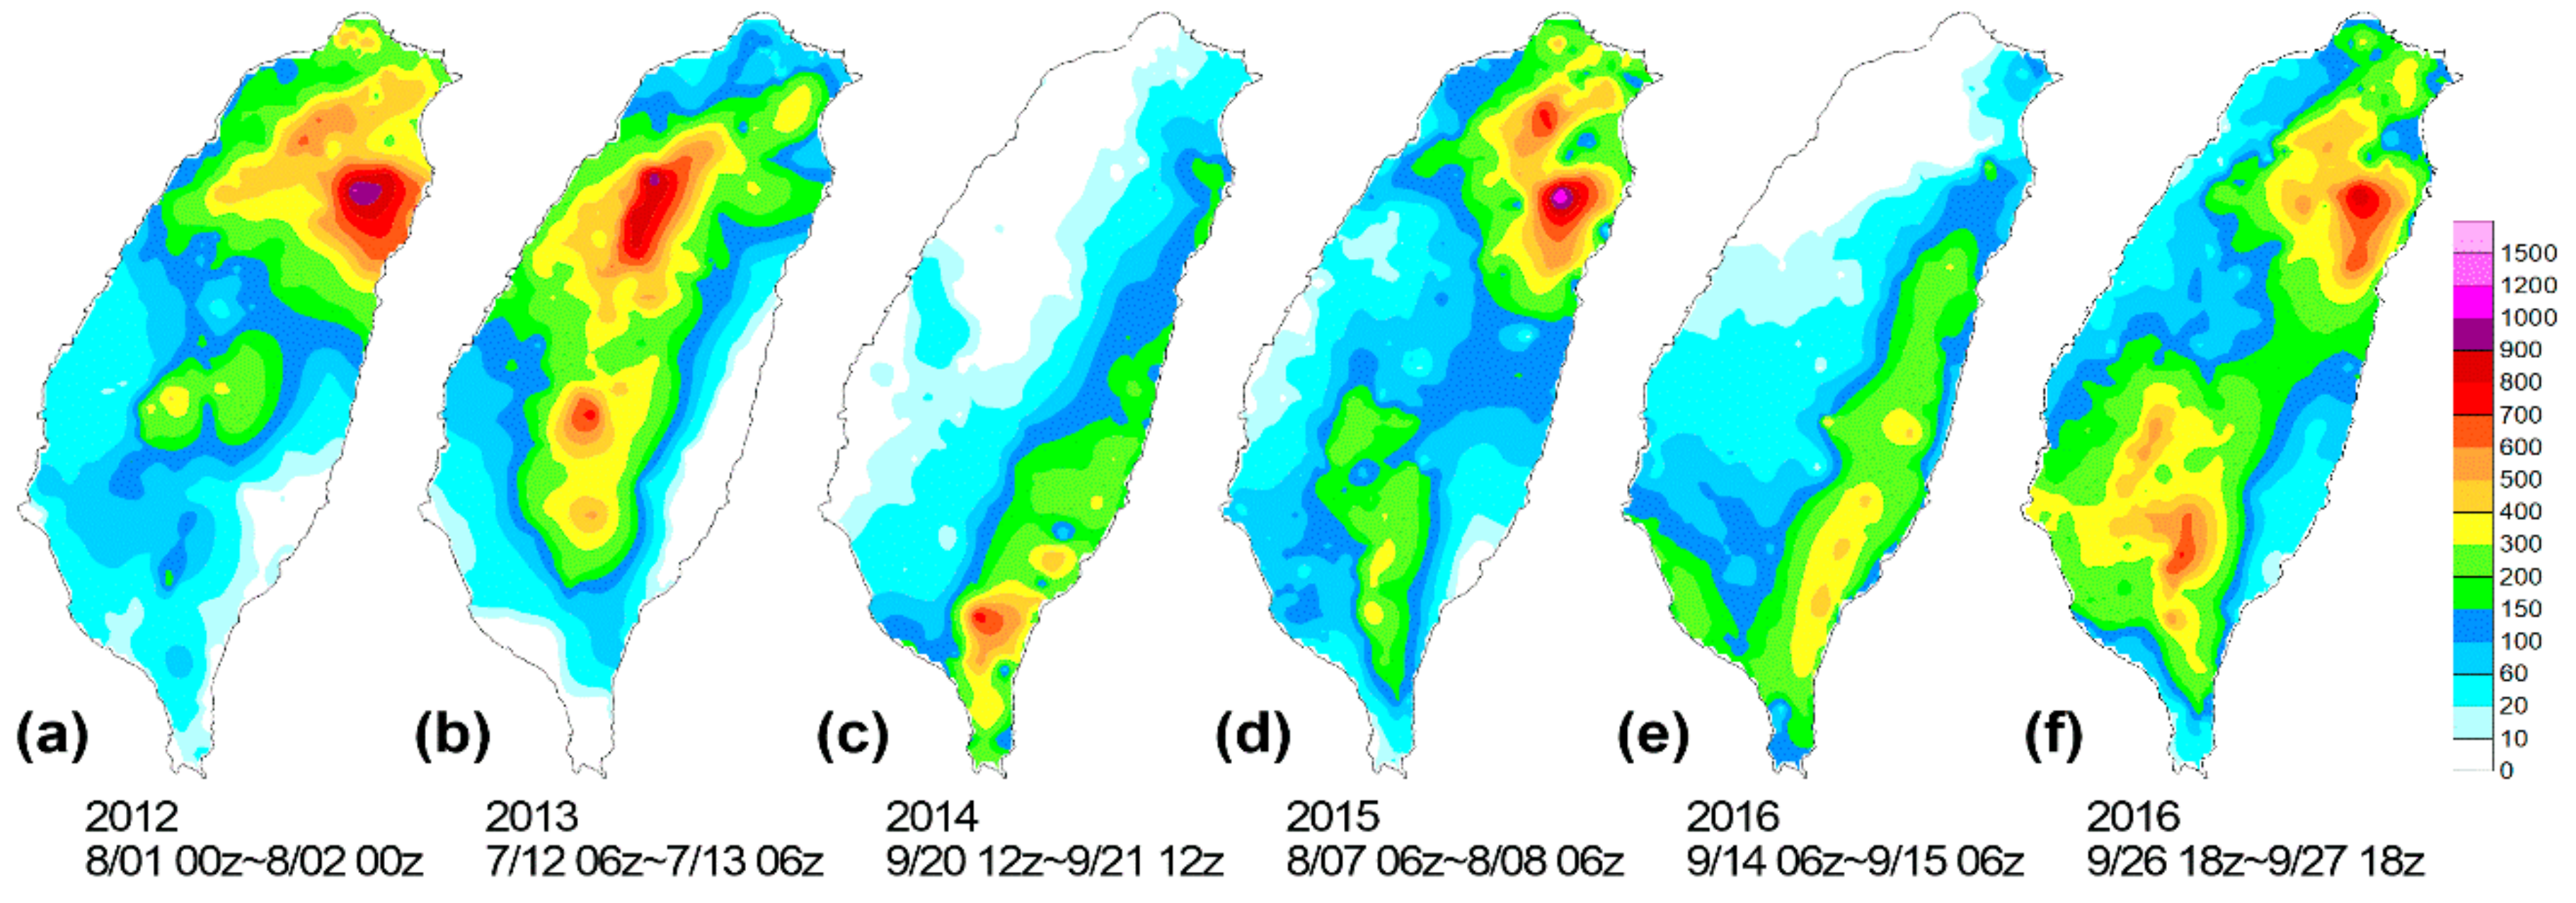
The study cases are selected based on two main criteria: (1) the typhoon brought heavy rainfall, and (2) the typhoon occurred since 2012 because TTFRI-EPS has reached maturity in 2012. Therefore, from 2012 to 2017, 6 typhoons with severe storms are selected herein. Detailed information of these typhoons is provided in Table 1. When these typhoons affected Taiwan (i.e., during the warning period), many areas suffered heavy rainfall. Among these typhoons, the maximum 24 h rainfall observed on-site (i.e., at a certain gauge) ranges from 797 mm to 1178 mm, and the average is about 964 mm. The observations regarding the time period of the maximum 24 h rainfall of each typhoon are presented in Figure 5. The largest maximum 24 h rainfall (1178 mm at Tai-ping-shan) is observed during typhoon Soudelor in 2015, which is classified as Category 5 in Saffir-Simpson Hurricane Scale. It is approximately half of the annual rainfall in Taiwan (2500 mm, which is 2.6 times the world average).
For these 6 typhoons, the TTFRI-EPS ensemble forecasts provided within the typhoon warning period are used. Thus, for a single typhoon, several runs, i.e., forecasting at different initial times, are used. IF a typhoon makes a longer warning period, a larger number of forecast runs will be taken into account. For example, the warning period of typhoon Soudelor is from 6 August to 9 August in 2015. Thus, the ensemble forecasts initialized at 12, 18 UTC on 6 August and at 00, 06, 12, 18 UTC on 7 August are used herein. That is, the ensemble forecasts from 6 runs at different initial times that cover the main warning period are adopted for typhoon Soudelor. Therefore, in a like manner, a total of 29 runs during 6 typhoons are used in this study. On average, almost 5 forecast runs are considered for a typhoon. The number of forecast runs used for every typhoon is also listed in Table 1.
4.2. Performance Indices
To evaluate the performance of the forecasts from the proposed methodology, two measures, which are the most commonly used, are employed herein. Firstly, the correlation coefficient (CC) is used to assess the correlation between the observed and forecasted rainfall. The CC is written as:
where and are the observed and forecasted 24 h rainfall at a certain gauge , respectively. and are the average of the observed and forecasted 24 h rainfall, respectively, and is the total number of gauges (in this study, ). Secondly, the root mean square error (RMSE) used to measure the difference between the observed and forecasted 24 h rainfall is written as:
Typically, higher CC means better correlation, and lower RMSE means better agreement between observations and forecasts. Therefore, based on the use of these two useful measures, a just conclusion is expected to be reached. Moreover, it is worth noting that these measures are calculated based on the rainfall data of all gauges. The observed rainfall data of 750 gauges in Taiwan are used herein. The forecasted rainfall data of a certain gauge is obtained from the nearest grid data (i.e., by using the forecasts of the grid which contains this gauge). That is, these measures present the forecasting performance for point forecasts at all gauges.
5. Results and Discussion
In this section, the potential of the proposed GA-based integration methodology is assessed. Hence, the performance of the rainfall forecasts resulting from the proposed methodology is measured. The resulting forecasts are, namely, the ensemble mean based on the use of the optimal weight set derived from the GA-based integration strategy. To reach a just conclusion, the conventional ensemble mean method (i.e., the use of equal weights for all members) is also involved for comparison with the proposed methodology (i.e., the use of non-equal weights).
5.1. Assessment of the Ensemble Rainfall Forecasts Provided by TTFRI-EPS
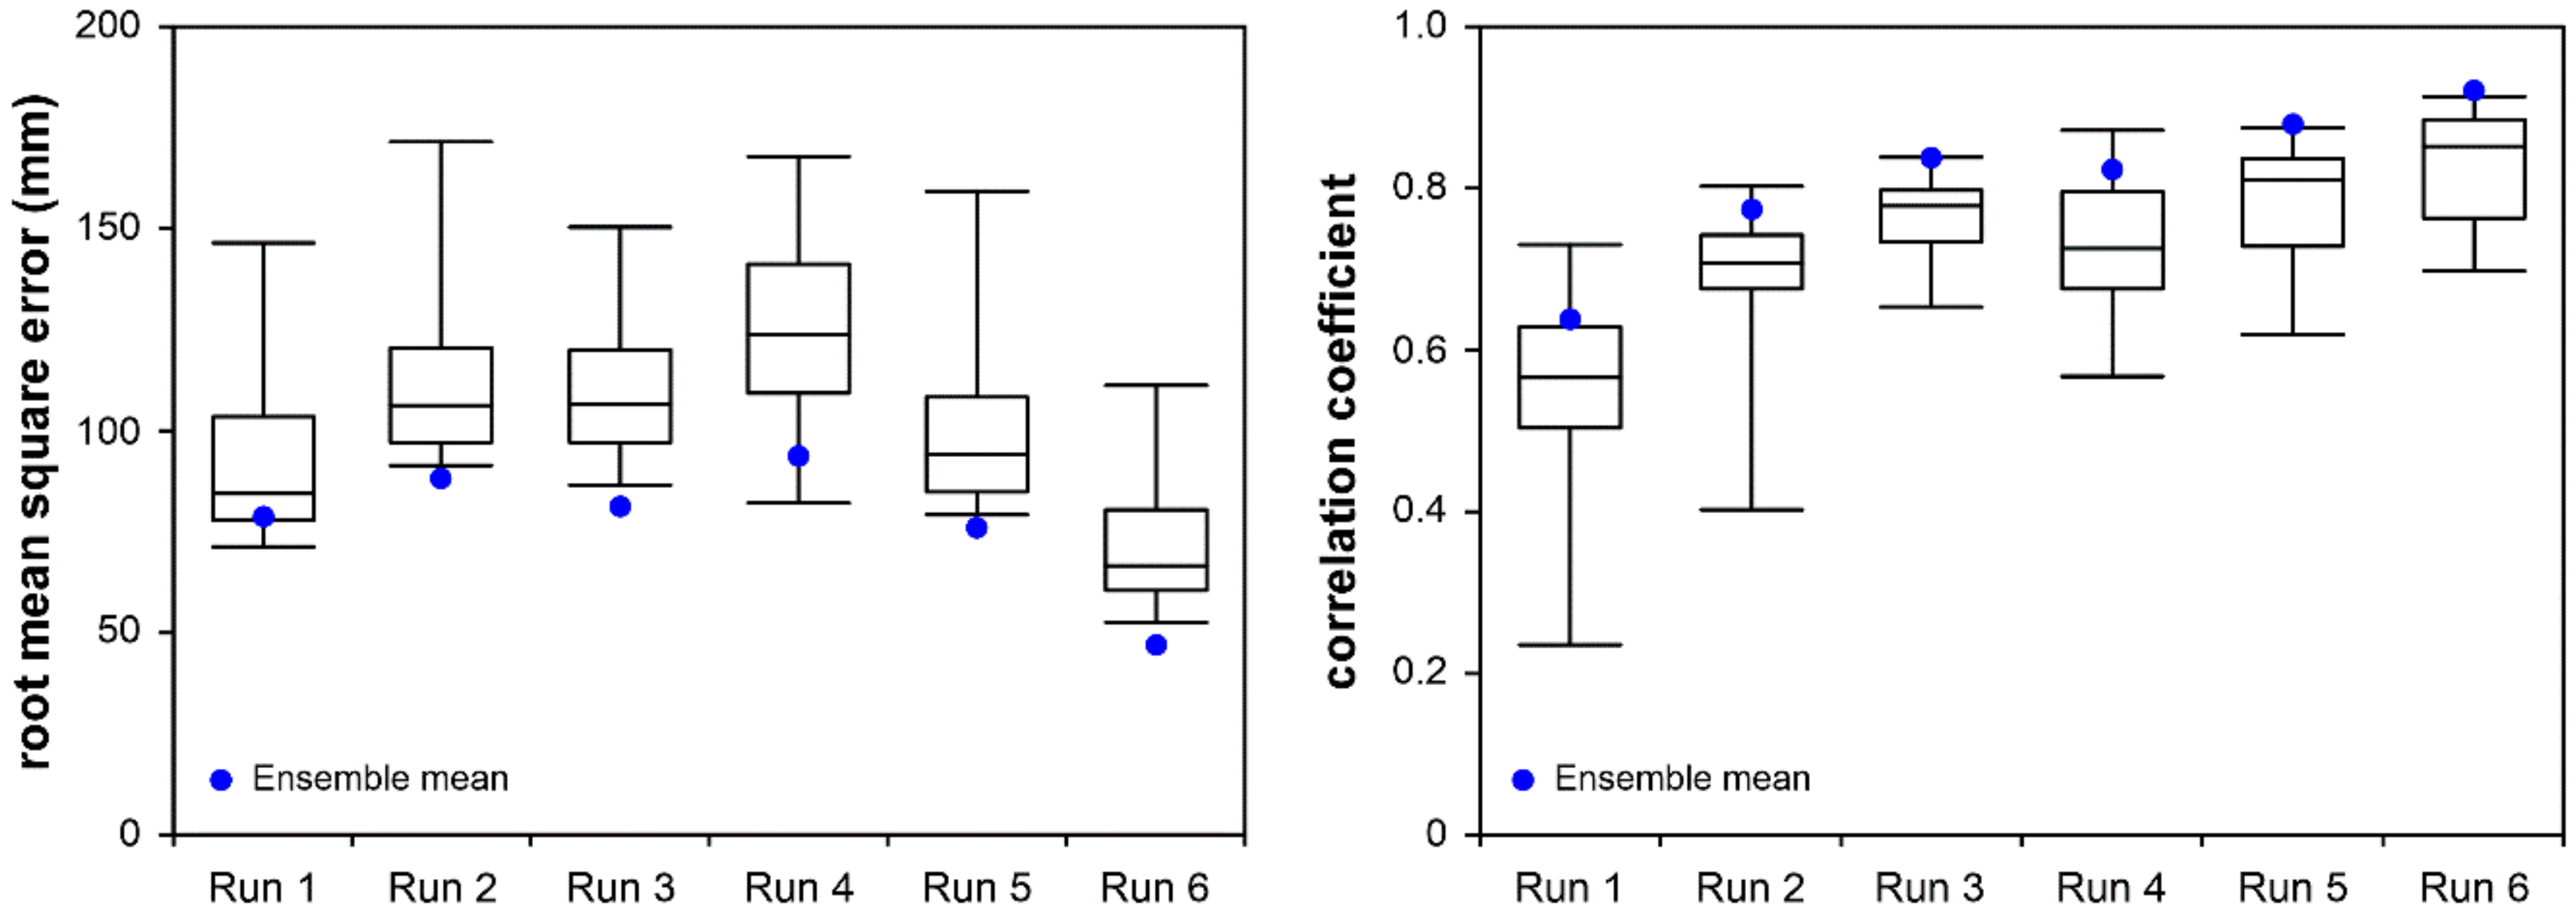
In this subsection, we focus on the assessment of TTFRI-EPS members. Therefore, the performance of the rainfall forecasts provided by all members in TTFRI-EPS is evaluated and typhoon Saola is taken as an example herein. The ensemble forecasts of 24 h rainfall from 21 individual members under 6 runs (i.e., 6 different model initial times at 12, 18 UTC on July 31, and at 00, 06, 12, 18 UTC on August 1) are evaluated by Equations (5) and (6). For the first run, which is initialized at 12 UTC on July 31, the model valid time period is from 18 UTC on July 31 to 18 UTC on August 1. That is in order to ensure that all forecasts are available at the time of integration. In the same manner, the valid time periods for the remaining 5 runs are also defined.
The evaluation results of these 6 runs are presented in Figure 6 by means of a box-and-whisker plot. Thus, the spread of CC and RMSE values is displayed by five-number summary (i.e., the minimum, lower quartile, median, upper quartile, and maximum). Figure 6 shows that the variations of CC and RMSE of members are obvious in a single run. Besides, among different runs, the members that performed the best are different. For instance, Members 14, 16, 9, 13, 7, and 6 provided the minimum RMSE values for Run 1 to Run 6, respectively. That is, in TTFRI ensemble prediction system, the forecasting performance is case-dependent. This phenomenon may be due to the difference among typhoons, such as different tracks, structures, or other properties. That is complex and involves multiple aspects or components [12,33]. Nevertheless, the result also confirms the uncertainties of NWPs to a certain degree and therefore, it is difficult to ensure which member is the best in advance. Accordingly, it is risky to use only one forecast from a single member.
Moreover, in Figure 6, the performance of the conventional ensemble mean is presented by blue dots. The conventional ensemble mean used herein is the arithmetic average of all members. The weight for each member is equal that is , and n is the total number of ensemble members. It is clearly observed that the conventional ensemble mean yields almost the lowest RMSE, and the highest CC for 6 runs during typhoon Saola. That is, instead of using the forecast from a single TTFRI-EPS member, the use of ensemble mean of all members is more robust to obtain better results generally. Similar conclusions have also been made in previous studies [12,27,34]. TTFRI-EPS members are designed by using several NWMs with different model configurations for taking the uncertainties of NWPs into account. Consequently, different members provide distinct results. The use of ensemble mean of all members represents a consensus of all members and is superior to that of each ensemble member. In the following subsection, the conventional ensemble mean method is adopted as the benchmark.
5.2. Performance of Rainfall Forecasts Resulting from the Proposed Methodology
In this subsection, we focus on the evaluation of the proposed methodology. The performance of the rainfall forecasts resulting from the proposed methodology is measured and 6 typhoons are all used. In contrast with the conventional ensemble mean method that uses equal weights for all members, the proposed methodology uses the optimal weight set which is derived from the GA-based integration strategy. In other words, the ensemble mean resulting from the proposed methodology is a non-equally weighted average of all members. The weights are optimized according to the forecasts during the near past time and adjusted at each run. That is, in this study, a total of 29 optimal weight sets will be obtained along with the 29 runs of 6 typhoons.
The ensemble 24 h rainfall forecasts of 29 runs are integrated (i.e., weight-averaged) sequentially by means of the proposed methodology as well as by the conventional ensemble mean method. CC and RMSE values corresponding to the proposed and the conventional methods are summarized in Table 2. On the whole, for the conventional method, CC ranges from 0.64 to 0.92, and RMSE ranges from 42.76 mm to 106.24 mm. The average values are 0.80 (CC) and 73.57 mm (RMSE). As for the proposed methodology, CC and RMSE range from 0.63 to 0.92, and from 43.30 mm to 92.92 mm, respectively. The average values are 0.80 (CC) and 68.26 mm (RMSE). That is, in comparison with the conventional, the proposed methodology provides lower RMSE and comparable CC mostly. Comparable CC value means that the forecasts from the proposed and conventional methods have similar linear relationship to observations. Lower RMSE value indicates the forecasts from the proposed method are closer to observations.
For convenience, a run with superior results, i.e., higher CC or lower RMSE, is indicated by bold type in Table 2. Accordingly, a total of 22 runs provide either improved or comparable performance due to the use of the proposed methodology. Namely, the proposed methodology generally provides better 24 h rainfall forecasts than the conventional. In Table 2, it is also observed that the improvements of RMSE are more obvious than those of CC. On average, due to the use of the proposed methodology, the improvements of RMSE and CC are 7% and 0.6%, respective. That is because during the determination of the optimal weight set (i.e., the Past step), the RMSE has been used to evaluate the fitness. Consequently, an obvious improved RMSE is obtained while this optimal weight set is applied (i.e., the Future step). Besides, CC and RMSE are used to respectively assess the correlation and difference between the observations and forecasts. So RMSE is more sensitive and useful than linear CC for assessing the accuracy. It is also found that among these typhoons, the proposed methodology provides always superior results for typhoons Saola and Fung-Wong.
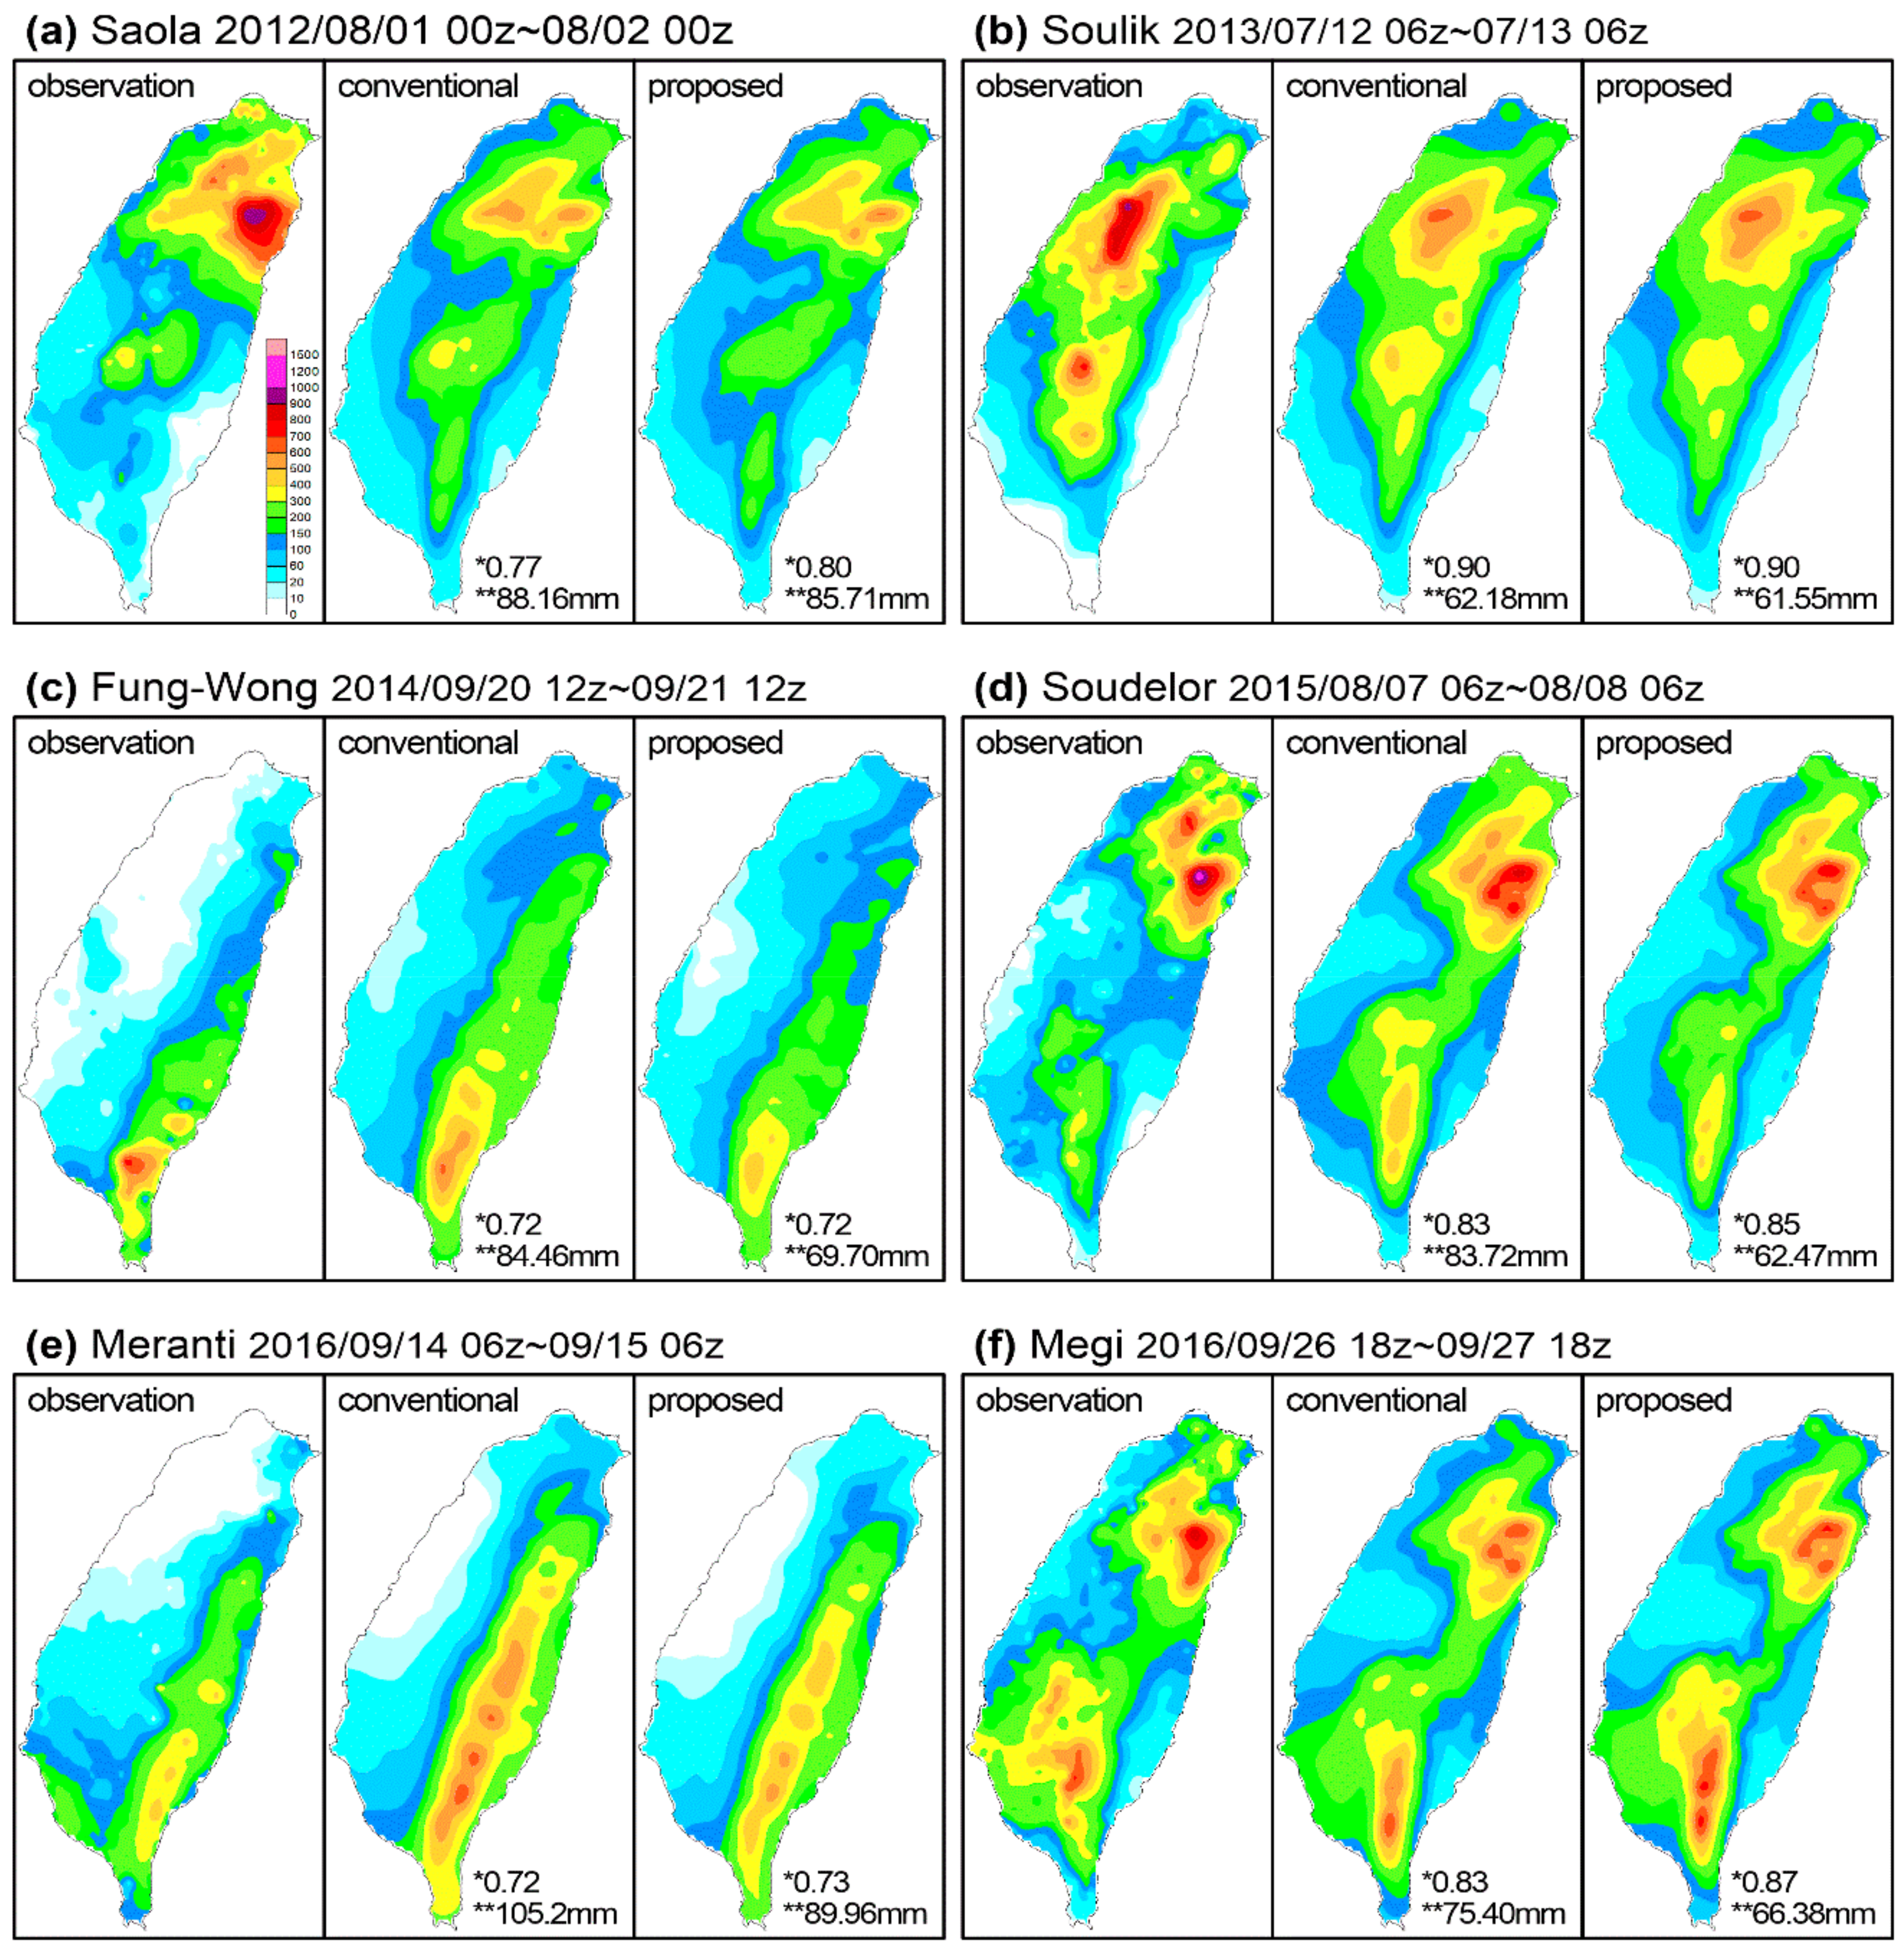
Moreover, the forecasts regarding the time period of the maximum 24 h rainfall of each typhoon are presented in Figure 7. The observation is also shown herein. As a result, 3 contours, namely the observation, and the two forecasts individually resulting from the conventional and the proposed methodologies, are provided for each typhoon. For typhoon Saola in Figure 7a, the observed maximum 24 h rainfall is recorded from 00z on 1 August to 00z on 2 August. As mentioned in Section 2, the TTFRI-EPS forecasts are provided 6 h later than the model initial time. Accordingly, the forecasts from the run with the initial time at 18z on 31 July are adopted. That is, the forecasts in Figure 7a are corresponding to the results of Run 2 in Table 2. The CC and RMSE values are also provided in this figure for displaying the performance of the conventional and the proposed methodologies. The results shown in Figure 7 confirm forecasts from the conventional and proposed methodologies have good agreement with the observations. Furthermore, the forecasts from the proposed methodology are closer to the observations due to the lower RMSE. Hence, it is finally concluded that the proposed GA-based methodology does indeed provide more accurate quantitative forecasts of 24 h typhoon rainfall. That is because a more suitable combination of TTFRI-EPS ensemble forecasts is performed by means of the proposed methodology.
It is notable that different values for the parameters used in GA had been tested in our preliminary experiments and the results still lead to the same conclusion. Future work on the use of more events to examine the proposed methodology will be required to obtain a solid conclusion. Then, it is also worthy to discuss the potential reasons about the different results among different typhoons in future research. Study on the use of the proposed methodology to different forecasting time periods, such as the 12 h or 6 h rainfall forecasts (i.e., different in Figure 3), will be also tested. Besides, the investigation of the relationship between the optimal weight set and the model configuration is one future direction of this study. The results will be expected to be a rough guide for the design of NWP members in an ensemble prediction system in the future.
6. Summary and Conclusions
Forecasts of typhoon rainfall are always desired for water resources management and disaster warning system in Taiwan. To provide accurate rainfall forecasts during typhoons, a methodology based on the use of ensemble numerical weather predictions with a GA-based integration strategy is proposed in this study. Firstly, the ensemble rainfall forecasts from an ensemble numerical weather prediction system (i.e., TTFRI-EPS) are used. Then, the GA-based integration strategy is developed to effectively integrate these ensemble forecasts. On the basis of the ensemble forecasts during the past 6-h, the weights that are used to weighted-average these ensemble forecasts can be optimized. That is, through the optimal weights, the combination of the ensemble forecasts has the best agreement with the observation at this time period. Finally, the optimal weights are applied to weighted-average the ensemble forecasts during the following 24 h. Hence, the novelty of this study is the use of the GA-based strategy to optimally combine the TTFRI-EPS ensemble rainfall forecasts. The NWP-based ensemble forecasts are non-equal-weight averaged by using the optimal weights, rather than the equal weights (i.e., the conventional method). Consequently, it is expected that the forecasts of 24 h typhoon rainfall will be improved.
To validate the advantage of the proposed methodology, the actual application is conducted during 6 typhoons containing a total of 29 runs. We first focus on the performance of TTFRI-EPS members. The result indicates that among 21 members, the variation of RMSE or CC values is notable, and is case-dependent. That is, it is risky to arbitrary use only one forecast from a single member. The result also confirms that the conventional ensemble mean method generally provides better 24 h rainfall forecasts than individual members. Then, we focus on the comparison between the proposed (i.e., optimal combination of ensemble forecasts by non-equal weights) and the conventional (by equal weights) methodologies. The result confirms that the proposed methodology provides lower RMSE and comparable CC mostly as compared to the conventional. On average, the reduction of RMSE is about 7% due to the use of the proposed methodology instead of the conventional. In conclusion, the proposed methodology indeed provides improved forecasts of 24 h typhoon rainfall through the optimal combination of TTFRI-EPS ensemble forecasts.
To sum up, in this study, the novel contribution of the proposed methodology is the optimal combination of NWP-based forecasts from the TTFRI ensemble prediction system through a GA-based integration strategy. Therefore, the performance of the proposed methodology would be affected by the ensemble prediction system. If all forecasts of the ensemble prediction system fail to capture the weather situation, the optimal combination of these forecasts would also be failed. Therefore, the inclusion of more NWP-based forecasts from different ensemble prediction systems will be helpful for providing more accurate rainfall forecasts through the proposed methodology. The improved rainfall forecasts are expected to be useful for disaster warning system and water resources management during typhoons.
Author Contributions
Conceptualization, M.-C.W. and T.-H.Y.; Methodology, M.-C.W.; Software, M.-C.W.; Validation, M.-C.W. and S.-C.Y.; Formal Analysis, M.-C.W. and H.-M.K.; Writing-Original Draft Preparation, M.-C.W.; Writing-Review & Editing, M.-C.W., S.-C.Y., T.-H.Y. and H.-M.K.
Funding
This research was funded by the Ministry of Science and Technology, Taiwan (under the grant MOST 106-2625-M-492-009 and 107-2119-M-492-011).
Acknowledgments
We appreciated the collective efforts among the academic institutes and government agencies that contribute to the execution of TTFRI ensemble prediction system. We would also like to thank the Editors and reviewers for their constructive suggestions that greatly improve the manuscript.
Conflicts of Interest
The authors declare no conflict of interest.
References
- Bengtsson, L. Tropical cyclones in a warmer climate. WMO. Bull. 2007, 56, 196–203. [Google Scholar]
- Hipel, K.W.; Mcleod, A.I. Time Series Modelling of Water Resources and Environmental Systems. Elsevier: Amsterdam, The Netherlands, 1994; pp. 463–465. [Google Scholar]
- Wang, W.C.; Chau, K.W.; Cheng, C.T.; Qiu, L. A comparison of performance of several artificial intelligence methods for forecasting monthly discharge time series. J. Hydrol. 2010, 374, 294–306. [Google Scholar] [CrossRef] [Green Version]
- Luk, K.C.; Ball, J.E.; Sharma, A. An application of artificial neural networks for rainfall forecasting. Math. Comput. Model. 2001, 33, 683–693. [Google Scholar] [CrossRef]
- Lin, G.F.; Chen, L.H. Application of artificial neural network to typhoon rainfall forecasting. Hydrol. Process 2005, 19, 1825–1837. [Google Scholar] [CrossRef]
- Lin, G.F.; Wu, M.C. A hybrid neural network model for typhoon-rainfall forecasting. J. Hydrol. 2009, 375, 450–458. [Google Scholar] [CrossRef]
- Wu, C.L.; Chau, K.W.; Fan, C. Prediction of rainfall time series using modular artificial neural networks coupled with data-preprocessing techniques. J. Hydrol. 2010, 389, 146–167. [Google Scholar] [CrossRef] [Green Version]
- Lin, G.F.; Jhong, B.C.; Chang, C.C. Development of an effective data-driven model for hourly typhoon rainfall forecasting. J. Hydrol. 2013, 495, 52–63. [Google Scholar] [CrossRef]
- Lin, G.F.; Jhong, B.C. A real-time forecasting model for the spatial distribution of typhoon rainfall. J. Hydrol. 2015, 521, 302–313. [Google Scholar] [CrossRef]
- Liguori, S.; Rico-Ramirez, M.A. Quantitative assessment of short-term rainfall forecasts from radar nowcasts and MM5 forecasts. Hydrol. Process 2012, 26, 3842–3857. [Google Scholar] [CrossRef]
- He, S.; Raghavan, S.V.; Nguyen, N.S.; Liong, S.Y. Ensemble rainfall forecasting with numerical weather prediction and radar-based nowcasting models. Hydrol. Process 2013, 27, 1560–1571. [Google Scholar] [CrossRef]
- Hsiao, L.F.; Yang, M.J.; Lee, C.S.; Kuo, H.C.; Shih, D.S.; Tsai, C.C.; Wang, C.J.; Chang, L.Y.; Chen, D.Y.C.; Feng, L.; et al. Ensemble forecasting of typhoon rainfall and floods over a mountainous watershed in Taiwan. J. Hydrol. 2013, 506, 55–68. [Google Scholar] [CrossRef]
- Yu, W.; Nakakita, E.; Kim, S.; Yamaguchi, K. Improvement of rainfall and flood forecasts by blending ensemble NWP rainfall with radar prediction considering orographic rainfall. J. Hydrol. 2015, 531, 494–507. [Google Scholar] [CrossRef]
- Rodrigo, C.; Kim, S.; Jung, I.H. Sensitivity Study of WRF Numerical Modeling for Forecasting Heavy Rainfall in Sri Lanka. Atmosphere 2018, 9, 378. [Google Scholar] [CrossRef]
- Diomede, T.; Marsigli, C.; Nerozzi, F.; Papetti, P.; Paccagnella, T. Coupling high-resolution precipitation forecasts and discharge predictions to evaluate the impact of spatial uncertainty in numerical weather prediction model outputs. Meteorol. Atmos. Phys. 2008, 102, 37–62. [Google Scholar] [CrossRef]
- Jiang, H.; Zipser, E.J. Contribution of tropical cyclones to the global precipitation from eight seasons of TRMM data: Regional, seasonal, and interannual variations. J. Climate 2010, 23, 1526–1543. [Google Scholar] [CrossRef]
- Palmer, T.; Buizza, R. Fifteenth anniversary of EPS. ECMWF Newslett. 2007, 114, 14. [Google Scholar]
- Cloke, H.L.; Pappenberger, F. Ensemble flood forecasting: A review. J. Hydrol. 2009, 375, 613–626. [Google Scholar] [CrossRef]
- Ebert, E.E. Ability of a poor man’s ensemble to predict the probability and distribution of precipitation. Mon. Weather Rev. 2001, 129, 2461–2480. [Google Scholar] [CrossRef]
- Lee, C.S.; Ho, H.Y.; Lee, K.T.; Wang, Y.C.; Guo, W.D.; Chen, D.Y.C.; Hsiao, L.F.; Chen, C.H.; Chiang, C.C.; Yang, M.J.; et al. Assessment of sewer flooding model based on ensemble quantitative precipitation forecast. J. Hydrol. 2013, 506, 101–113. [Google Scholar] [CrossRef]
- Shih, D.S.; Chen, C.H.; Yeh, G.T. Improving our understanding of flood forecasting using earlier hydro-meteorological intelligence. J. Hydrol. 2014, 512, 470–481. [Google Scholar] [CrossRef]
- Yang, S.C.; Yang, T.H. Uncertainty assessment: Reservoir inflow forecasting with ensemble precipitation forecasts and HEC-HMS. Adv. Meteorol. 2014, 581756. [Google Scholar] [CrossRef]
- Yang, T.H.; Yang, S.C.; Ho, J.Y.; Lin, G.F.; Hwang, G.D.; Lee, C.S. Flash flood warnings using the ensemble precipitation forecasting technique: A case study on forecasting floods in Taiwan caused by typhoons. J. Hydrol. 2015, 520, 367–378. [Google Scholar] [CrossRef]
- Fritsch, J.M.; Hilliker, J.; Ross, J.; Vislocky, R.L. Model consensus. Weather Forecast. 2000, 15, 571–582. [Google Scholar] [CrossRef]
- Gneiting, T.; Raftery, A.E. Weather forecasting with ensemble methods. Science 2005, 310, 248–249. [Google Scholar] [CrossRef] [PubMed]
- Gneiting, T.; Raftery, A.E.; Westveld, A.H.; Goldman, T. Calibrated probabilistic forecasts using ensemble model output statistics and minimum CRPS estimation. Mon. Weather Rev. 2005, 133, 1098–1118. [Google Scholar] [CrossRef]
- Krasnopolsky, V.M.; Lin, Y. A neural network nonlinear multimodel ensemble to improve precipitation forecasts over continental US. Adv. Meteorol. 2012, 2012, 649450. [Google Scholar] [CrossRef]
- Messner, J.W.; Mayr, G.J.; Zeileis, A.; Wilks, D.S. Heteroscedastic extended logistic regression for post-processing of ensemble guidance. Mon. Weather Rev. 2014, 142, 448–456. [Google Scholar] [CrossRef]
- Cheng, L.Y.; AghaKouchak, A. A methodology for deriving ensemble response from multimodel simulations. J. Hydrol. 2015, 522, 49–57. [Google Scholar] [CrossRef]
- Kumar, A.; Singh, R.; Jena, P.P.; Chatterjee, C.; Mishra, A. Identification of the best multi-model combination for simulating river discharge. J. Hydrol. 2015, 525, 313–325. [Google Scholar] [CrossRef]
- Pappenberger, F.; Ramos, M.H.; Cloke, H.L.; Wetterhall, F.; Alfieri, L.; Bogner, K.; Mueller, A.; Salamon, P. How do I know if my forecasts are better? Using benchmarks in hydrological ensemble prediction. J. Hydrol. 2015, 522, 697–713. [Google Scholar] [CrossRef]
- Wu, M.C.; Hong, J.S.; Hsiao, L.F.; Hsu, L.H.; Wang, C.J. Effective use of ensemble numerical weather predictions in Taiwan by means of a SOM-based cluster analysis technique. Water 2017, 9, 836. [Google Scholar] [CrossRef]
- Hsiao, L.F.; Chen, D.S.; Kuo, Y.H.; Guo, Y.R.; Yeh, T.C.; Hong, J.S.; Fong, C.T.; Lee, C.S. Application of WRF 3DVAR to operational typhoon prediction in Taiwan: Impact of outer loop and partial cycling approaches. Weather Forecast. 2012, 27, 1249–1263. [Google Scholar] [CrossRef]
- Wu, M.C.; Lin, G.F. The very short-term rainfall forecasting for a mountainous watershed by means of an ensemble numerical weather prediction system in Taiwan. J. Hydrol. 2017, 546, 60–70. [Google Scholar] [CrossRef]
- Fotovatikhah, F.; Herrera, M.; Shamshirband, S.; Chau, K.W.; Ardabili, S.F.; Piran, Md.J. Survey of Computational Intelligence as Basis to Big Flood Management: Challenges, research directions and Future Work. Eng. Appl. Comp. Fluid. 2018, 12, 411–437. [Google Scholar] [CrossRef]
- Wang, W.C.; Xu, D.M.; Chau, K.W.; Chen, S. Improved annual rainfall-runoff forecasting using PSO-SVM model based on EEMD. J. Hydroinform. 2013, 15, 1377–1390. [Google Scholar] [CrossRef]
- Cheng, C.T.; Wu, X.Y.; Chau, K.W. Multiple criteria rainfall-runoff model calibration using a parallel genetic algorithm in a cluster of computer. Hydrol. Sci. J. 2005, 50, 1069–1087. [Google Scholar] [CrossRef]
- Chau, K.W. Use of Meta-Heuristic Techniques in Rainfall-Runoff Modelling. Water 2017, 9, 186. [Google Scholar] [CrossRef]
Figure 1.
Three nested domains used in TTFRI-EPS.

Figure 2.
Ensemble forecasts of 72 h typhoon track and 24 h rainfall provided by TTFRI-EPS during typhoon Saola in 2012.
Figure 2.
Ensemble forecasts of 72 h typhoon track and 24 h rainfall provided by TTFRI-EPS during typhoon Saola in 2012.

Figure 3.
Illustration of the proposed genetic algorithm (GA)-based methodology for providing effective quantitative forecasts of 24 h typhoon rainfall.
Figure 3.
Illustration of the proposed genetic algorithm (GA)-based methodology for providing effective quantitative forecasts of 24 h typhoon rainfall.

Figure 4.
Flowchart of the determination of the optimal weights using GA in the Past step.

Figure 5.
Observed maximum 24 h rainfall of (a) Saola; (b) Soulik; (c) Fung-Wong; (d) Soudelor; (e) Meranti; and (f) Megi.
Figure 5.
Observed maximum 24 h rainfall of (a) Saola; (b) Soulik; (c) Fung-Wong; (d) Soudelor; (e) Meranti; and (f) Megi.

Figure 6.
Performance of the ensemble rainfall forecasts (box-and-whisker plot) of TTFRI-EPS and the conventional ensemble mean (blue dot) during typhoon Saola.
Figure 6.
Performance of the ensemble rainfall forecasts (box-and-whisker plot) of TTFRI-EPS and the conventional ensemble mean (blue dot) during typhoon Saola.

Figure 7.
Observed and forecasted 24 h rainfall from the conventional and the proposed methodologies of 6 typhoons: (a) Saola; (b) Soulik; (c) Fung-Wong; (d) Soudelor; (e) Meranti; and (f) Megi (* and ** are the CC and RMSE values, respectively).
Figure 7.
Observed and forecasted 24 h rainfall from the conventional and the proposed methodologies of 6 typhoons: (a) Saola; (b) Soulik; (c) Fung-Wong; (d) Soudelor; (e) Meranti; and (f) Megi (* and ** are the CC and RMSE values, respectively).


Table 1.
List of typhoons used in this study.
| Name | Warning Period (UTC) | Maximum 24 h Rainfall (mm) | Number of Forecast Runs Used |
|---|---|---|---|
| Saola | 30 July–3 August 2012 | 1024.5 | 6 |
| Soulik | 11–13 July 2013 | 949 | 4 |
| Fung-Wong | 19–21 September 2014 | 797 | 3 |
| Soudelor | 6–9 August 2015 | 1178 | 6 |
| Meranti | 12–15 September 2016 | 891.5 | 5 |
| Megi | 25–28 September 2016 | 943 | 5 |
Table 2.
CC and RMSE of the conventional and the proposed methodologies for 6 typhoons.
| Name | Run | Initial Time (UTC) | RMSE (mm) | CC | ||
|---|---|---|---|---|---|---|
| Conventional | Proposed | Conventional | Proposed | |||
| Saola | 1 | 2012/07/31 12z | 78.59 | 75.02 | 0.64 | 0.64 |
| 2 | 2012/07/31 18z | 88.16 | 85.71 | 0.77 | 0.80 | |
| 3 | 2012/08/01 00z | 81.22 | 80.43 | 0.84 | 0.84 | |
| 4 | 2012/08/01 06z | 93.77 | 92.92 | 0.82 | 0.82 | |
| 5 | 2012/08/01 12z | 74.65 | 70.39 | 0.88 | 0.89 | |
| 6 | 2012/08/01 18z | 47.10 | 46.28 | 0.92 | 0.92 | |
| Soulik | 7 | 2013/07/11 18z | 56.26 | 59.32 | 0.84 | 0.83 |
| 8 | 2013/07/12 00z | 62.18 | 61.55 | 0.90 | 0.90 | |
| 9 | 2013/07/12 06z | 63.75 | 67.18 | 0.91 | 0.90 | |
| 10 | 2013/07/12 12z | 55.03 | 56.04 | 0.92 | 0.90 | |
| Fung Wong | 11 | 2014/09/20 00z | 93.07 | 83.22 | 0.67 | 0.71 |
| 12 | 2014/09/20 06z | 84.46 | 69.70 | 0.72 | 0.72 | |
| 13 | 2014/09/20 12z | 71.77 | 56.17 | 0.76 | 0.77 | |
| Soudelor | 14 | 2015/08/06 12z | 46.83 | 46.73 | 0.72 | 0.63 |
| 15 | 2015/08/06 18z | 74.35 | 67.72 | 0.80 | 0.81 | |
| 16 | 2015/08/07 00z | 83.72 | 62.47 | 0.83 | 0.85 | |
| 17 | 2015/08/07 06z | 78.16 | 70.31 | 0.83 | 0.81 | |
| 18 | 2015/08/07 12z | 68.12 | 63.96 | 0.85 | 0.83 | |
| 19 | 2015/08/07 18z | 61.93 | 54.87 | 0.87 | 0.87 | |
| Meranti | 20 | 2016/09/13 06z | 106.24 | 81.89 | 0.70 | 0.71 |
| 21 | 2016/09/13 12z | 105.20 | 89.96 | 0.72 | 0.73 | |
| 22 | 2016/09/13 18z | 93.02 | 77.38 | 0.78 | 0.75 | |
| 23 | 2016/09/14 00z | 65.26 | 65.58 | 0.76 | 0.73 | |
| 24 | 2016/09/14 06z | 42.76 | 43.30 | 0.75 | 0.72 | |
| Megi | 25 | 2016/09/26 00z | 62.37 | 59.76 | 0.76 | 0.72 |
| 26 | 2016/09/26 06z | 77.13 | 76.12 | 0.72 | 0.76 | |
| 27 | 2016/09/26 12z | 75.40 | 66.38 | 0.83 | 0.87 | |
| 28 | 2016/09/26 18z | 70.25 | 75.05 | 0.88 | 0.85 | |
| 29 | 2016/09/27 00z | 72.81 | 74.05 | 0.85 | 0.83 | |
Note: The boldface means the run with higher CC or lower RMSE values.
© 2018 by the authors. Licensee MDPI, Basel, Switzerland. This article is an open access article distributed under the terms and conditions of the Creative Commons Attribution (CC BY) license (http://creativecommons.org/licenses/by/4.0/).
Share and Cite
MDPI and ACS Style
Wu, M.-C.; Yang, S.-C.; Yang, T.-H.; Kao, H.-M. Typhoon Rainfall Forecasting by Means of Ensemble Numerical Weather Predictions with a GA-Based Integration Strategy. Atmosphere 2018, 9, 425. https://doi.org/10.3390/atmos9110425
AMA Style
Wu M-C, Yang S-C, Yang T-H, Kao H-M. Typhoon Rainfall Forecasting by Means of Ensemble Numerical Weather Predictions with a GA-Based Integration Strategy. Atmosphere. 2018; 9(11):425. https://doi.org/10.3390/atmos9110425
Chicago/Turabian StyleWu, Ming-Chang, Sheng-Chi Yang, Tsun-Hua Yang, and Hong-Ming Kao. 2018. "Typhoon Rainfall Forecasting by Means of Ensemble Numerical Weather Predictions with a GA-Based Integration Strategy" Atmosphere 9, no. 11: 425. https://doi.org/10.3390/atmos9110425
Note that from the first issue of 2016, this journal uses article numbers instead of page numbers. See further details here.