Article

Differences in Sulfate Aerosol Radiative Forcing between the Daytime and Nighttime over East Asia Using the Weather Research and Forecasting model coupled with Chemistry (WRF-Chem) Model

1
Key Laboratory for Semi-Arid Climate Change of the Ministry of Education, Lanzhou University, Lanzhou 730000, China
2
Key Laboratory of Virtual Geographic Environment of Ministry of Education, School of Geography Science, Nanjing Normal University, Nanjing 210023, China
*
Authors to whom correspondence should be addressed.
Atmosphere 2018, 9(11), 441; https://doi.org/10.3390/atmos9110441
Submission received: 19 May 2018 / Revised: 31 October 2018 / Accepted: 8 November 2018 / Published: 13 November 2018
(This article belongs to the Special Issue Regional Scale Air Quality Modelling)

Abstract

:
The effect of aerosols is an important indicator of climate change. Sulfate aerosols, as the major scattering aerosols, which have attracted more and more attention in recent years. The Weather Research and Forecasting model coupled with Chemistry (WRF-Chem) were utilized to investigate the spatial distribution of sulfate aerosols and their radiative forcing characteristics over East Asia in 2010. Results showed that sulfate aerosols were mainly distributed over eastern China (24–43° N, 101–126° E), especially in the Sichuan Basin. The concentration of sulfate aerosols decreased with increasing altitude over East Asia. It also exhibited obvious seasonal variations, where the largest range of sulfate aerosol concentrations was found in summer, with a maximum of 2.4 μg kg−1 over eastern China. Although sulfate aerosol concentrations varied slightly during day and night, there was still a significantly difference in the sulfate aerosol radiative forcing. Specifically, the magnitude of the direct radiative forcing induced by sulfate aerosols at the surface was approximately −3.02 W m−2 in the daytime, while that was +0.24 W m−2 in the nighttime. This asymmetric change that was caused by the radiative forcing of sulfate aerosols between day and night would have significant impacts on climate change at the regional scale.

1. Introduction

Aerosols are active components of Earth’s atmosphere. Scholars were increasingly concerned about their contributions to global climate change [1,2,3,4]. Previous studies suggested that aerosol concentrations were largely increased in 2000–2014 as compared to 1980–2000 in China [5]. Aerosol particles can scatter and absorb the incoming solar radiation, resulting in cooling or heating the atmosphere, which is called as direct effect. The aerosol indirect effect refers to that aerosols as cloud condensation nuclei and ice nuclei alter the lifetime, microphysical, and optical properties of cloud droplets [6,7]. According to the Intergovernmental Panel on Climate Change (IPCC, 2013) report and Wang et al. (2008) [8,9], the aerosol direct radiative forcing was −0.35 (−0.85 to +0.15) W m−2, and radiative forcing that was caused by greenhouse gas was 2.83 (2.54 to 3.12) W m−2. Aerosol radiative forcing exerted a net cooling effect on surface temperatures, thus slowing the warming trend caused by greenhouse gas.
The scattering aerosols could reduce the temperature by affecting the radiation budget in the Earth’s system [10,11,12,13,14]. As a major scattering aerosols, the radiative forcing of sulfate aerosols played an important role in climate change [15,16,17,18,19,20]. Both observations and numerical simulations indicated that three high-value centers of sulfate aerosols had formed in North America, Europe, and East Asia [21]. With the rapid development of industry, the concentration of sulfate aerosols over East Asia had increased significantly in the last few decades. Zhang et al. (2009) [22] pointed out that the emissions of SO2 had increased by 36% between 2001 and 2006. The studies of the radiative forcing of sulfate aerosols by using models simulating began in the early 1990s [23,24,25]. Charlson et al. (1989, 1991) [24,25] estimated the radiative forcing induced by sulfate aerosols with −1.6 W m−2. Kiehl et al. (1993) [26] changed model and suggested that direct radiative forcing of anthropogenic sulfate was −0.28 W m−2 at the global scale. After that, Wang et al. (2001) and Haywood et al. (1995) [27,28] simulated the spatial distribution of anthropogenic sulfate over East Asia in 1990s. More specifically, the global average value of direct radiative forcing induced by sulfate aerosols was (−0.2 to −0.8) W m−2 at the top of the atmosphere (TOA) in 2001 [29,30]. Wu et al. (2005) [31] pointed out that the radiative forcing of sulfate aerosols was −0.39 W m−2 over China. Li et al. (2015) [32] used the Spectral Atmospheric Model of IAP LASG (SAMIL) and the National Center for Atmospheric Research (NCAR) model to quantify the value of direct radiative forcing induced by anthropogenic sulfate aerosols of −0.37 W m−2 at the global scale.
The spatio-temporal variability of aerosols is affected by different factors, including complex climate characteristics, various ecological effects, rapid urbanization, dramatic economic growth, and removal mechanisms [33,34]. Many studies simulated the spatial distribution of sulfate aerosols at global scale. One such study found that high sulfate aerosols concentrations were located in eastern and central China, especially in Sichuan Basin [35]. The seasonal variations of radiative forcing of sulfate aerosols was also was demonstrated in a number of studies. Wang et al. (2001) found that the variation of direct radiative forcing had two maximum values up to −3.00 W m−2, which occurred in May and September, respectively [27]. The annual average of direct radiative forcing caused by sulfate was −2.40 W m−2, with the maximum of −2.99 W m−2 in summer at the top of the atmosphere [35]. Another study indicated that the seasonal variations were related to conversion efficiency of SO2 to sulfate aerosol. The temperature changing in summer resulted in higher concentrations and radiative forcing of sulfate aerosols [36]. Moreover, sulfate aerosol radiative forcing had daily variations. Zhang et al. (2001) [37] and Houghton et al. (1994) [38] found that the direct radiative forcing of sulfate aerosols was dominated by shortwave forcing, where solar energy was concentrated. Due to the uncertainty in the emissions of sulfate aerosol, there are some open questions in direct radiative forcing of sulfate aerosols.
In this work, the Weather Research and Forecasting model coupled with Chemistry (WRF-Chem) was used to investigate the characteristics of direct radiative forcing induced by sulfate aerosols under the all-sky over East Asia. The observations and model data that are employed in this study are presented in Section 2. In Section 3, we describe the spatial and temporal distributions of sulfate aerosol optical depth (AOD) and we showed that the distribution of sulfate aerosols concentrations at different altitudes. We also focus on the seasonal and daily change of direct radiative forcing over East Asia in 2010. A summary of the study is provided in Section 4. The motivation of our study is to investigate the sulfate aerosol concentrations distribution and to understand the sulfate aerosols radiative forcing changing, reduce the uncertainty of the simulated radiative forcing induced by sulfate aerosol during the daytime and nighttime, and provide a scientific basis for the effects of sulfate aerosols on regional climate.

2. Model and Observational Data

2.1. WRF-Chem Model

The WRF-Chem model is an established air quality model, which simulates trace gases and aerosols simultaneously within meteorological fields. It is coupled with several parameterization schemes, including a gas-phase chemical mechanism, a photolysis scheme, and an aerosol mechanism. Moreover, several key processes, such as aerosol emission, formation, transport (advection, diffusion and convection), dry and wet deposition, radiative effects, and photolysis rates are taken into consideration [2,39,40,41]. When compared with other models, the WRF-Chem model has the advantage of the complete online coupling of meteorological and chemical models at high temporal and spatial resolution, which can describe in detail the feedback between aerosol and meteorological fields [42].
The aerosol modules the WRF-Chem model utilized in this simulation were the Modal Aerosol Dynamics Model for Europe with Secondary Organic Aerosol Model (MADE/SORGAM), coupled with the photochemical reaction mechanism Regional Acid Deposition Model 2 (RADM2). The MADE/SORGAM aerosol module utilized three lognormal-distributed modes (Aitken, accumulation, and coarse) to represent particle size distributions. Details of aerosol optical characteristics can be found in Fast et al. (2006) [43]. The homogeneous nucleation in the sulfuric acid-water system plays a crucial role in SO2 conversion. Wexler et al. (1994) [44] derived an expression of nucleation rates as:
Ccrit = 0.16 × exp(0.1 × T − 3.5 × RH − 27.7)
where T and RH represent the temperature (units: K) and relative humidity, respectively, and Ccrit is the critical concentration of sulfuric acid vapor. Their research [45,46] showed that new sulfate aerosol particles will be generated when the sulfuric acid vapor exceeds the critical concentration, indicating that the temperature and humidity conditions are quite essential in the form of sulfate aerosol. The homogeneous nucleation with the high relative humidity and low temperature need more SO2 emissions. Moreover, the sulfate aerosols were converted in the RADM2 by the oxidation of SO2 in both the gas-phase and liquid-phase [47]. The conversion of sulfate aerosol chemistry mechanisms reactions is as following (2)–(4) [48]:
SO2 + HO (+M) → HOSO2 (+M)
HOSO2 + O2 → SO3 + HO2
SO3 + H2O → H2SO4
The SO2-HO chain mechanisms demonstrated above were verified by many scholars [49,50,51], which is enough for obtaining the spatio-temporal distributions of sulfate aerosol based on the emission inventory of SO2 emissions.
In this study, WRF-Chem was configured to cover East Asia (10.7–59.8° N, 51.6–154.4° E) with 138 × 187 grid points at 36 km horizontal resolution, and 35 vertical layers up to 10 hPa. The initial and boundary conditions for trace gases and aerosols were derived from the National Center for Environmental Prediction final analysis (NCEP/FNL) reanalysis data with 1° horizontal resolution at 6 h temporal intervals. The simulation covered the time period from 1 December 2009 to 31 December 2010. To reduce instability in boundary conditions, only the time period from 1 January 2010 to 31 December 2010 was selected for analysis.
To better simulate real atmospheric circulation, the wind fields and temperature fields above the planetary boundary layer in the model were approximated to reanalysis data using the relaxation method, once every 6 h [52]. The simulation included all major precursors and components of aerosols, such as CO, NO2, SO2, VOCs, BC, OC, and other anthropogenic aerosols. We also use the Yonsei University (YSU) planetary boundary scheme [53], Noah land surface module [54], Morrison two-moment microphysical scheme [55], Kain-Fritsch cumulus parameterization scheme [56], and the Rapid Radiation Transfer Model for GCM (RRTMG) longwave and shortwave radiation scheme [57]. The anthropogenic emissions were derived from the 2006 emission inventory developed by David Street. The Global Fire Emissions Database version 3 with monthly temporal resolution and 0.5° × 0.5° spatial resolution was used as biomass burning emissions. The SO2 emission inventory that was used in this study is from EDGAR-HTAP global inventory with the horizontal resolution of 0.1° × 0.1° and monthly temporal resolution. The HTAP inventory has been developed by complementing various regional emissions with EDGAR data, in which Asian region including India is represented by the Model Intercomparison Study for Asia (MICS-Asia) inventory at the horizontal resolution of 0.25° × 0.25° (Carmichael et al., 2008) [58]. The resultant global inventory is re-gridded at the spatial resolution of 0.1° × 0.1° and temporal resolution of 1-month HTAP, including emissions of CO, NOx, SO2, nonmethane volatile organic compounds (NMVOCs), particulate matter (PM), black carbon (BC), and organic carbon (OC) from power, industry, residential, agriculture, ground transport, and shipping sectors.
Moreover, shortwave (SW) and longwave (LW) radiative process induced by sulfate aerosols were both simulated by using the Rapid Radiative Transfer Model (RRTMG). The radiative forcing was calculated by the following formulas. Moreover, only the anthropogenic sulfate emissions were considered in the study.
RTOA = ∆FTOA (all) − ∆FTOA (no-sulfate)
RSUR = ∆FSUR (all) − ∆FSUR (no-sulfate)
RATM = RTOA − RSUR
where R represents the radiative forcing induced by sulfate aerosols and the ∆F is the net radiation flux; TOA, SUR, and ATM represent the top of the atmosphere, the surface and the atmosphere at all sky, respectively. This configuration and implementation are detailed in Chen et al. (2014, 2017) [2,40,59].

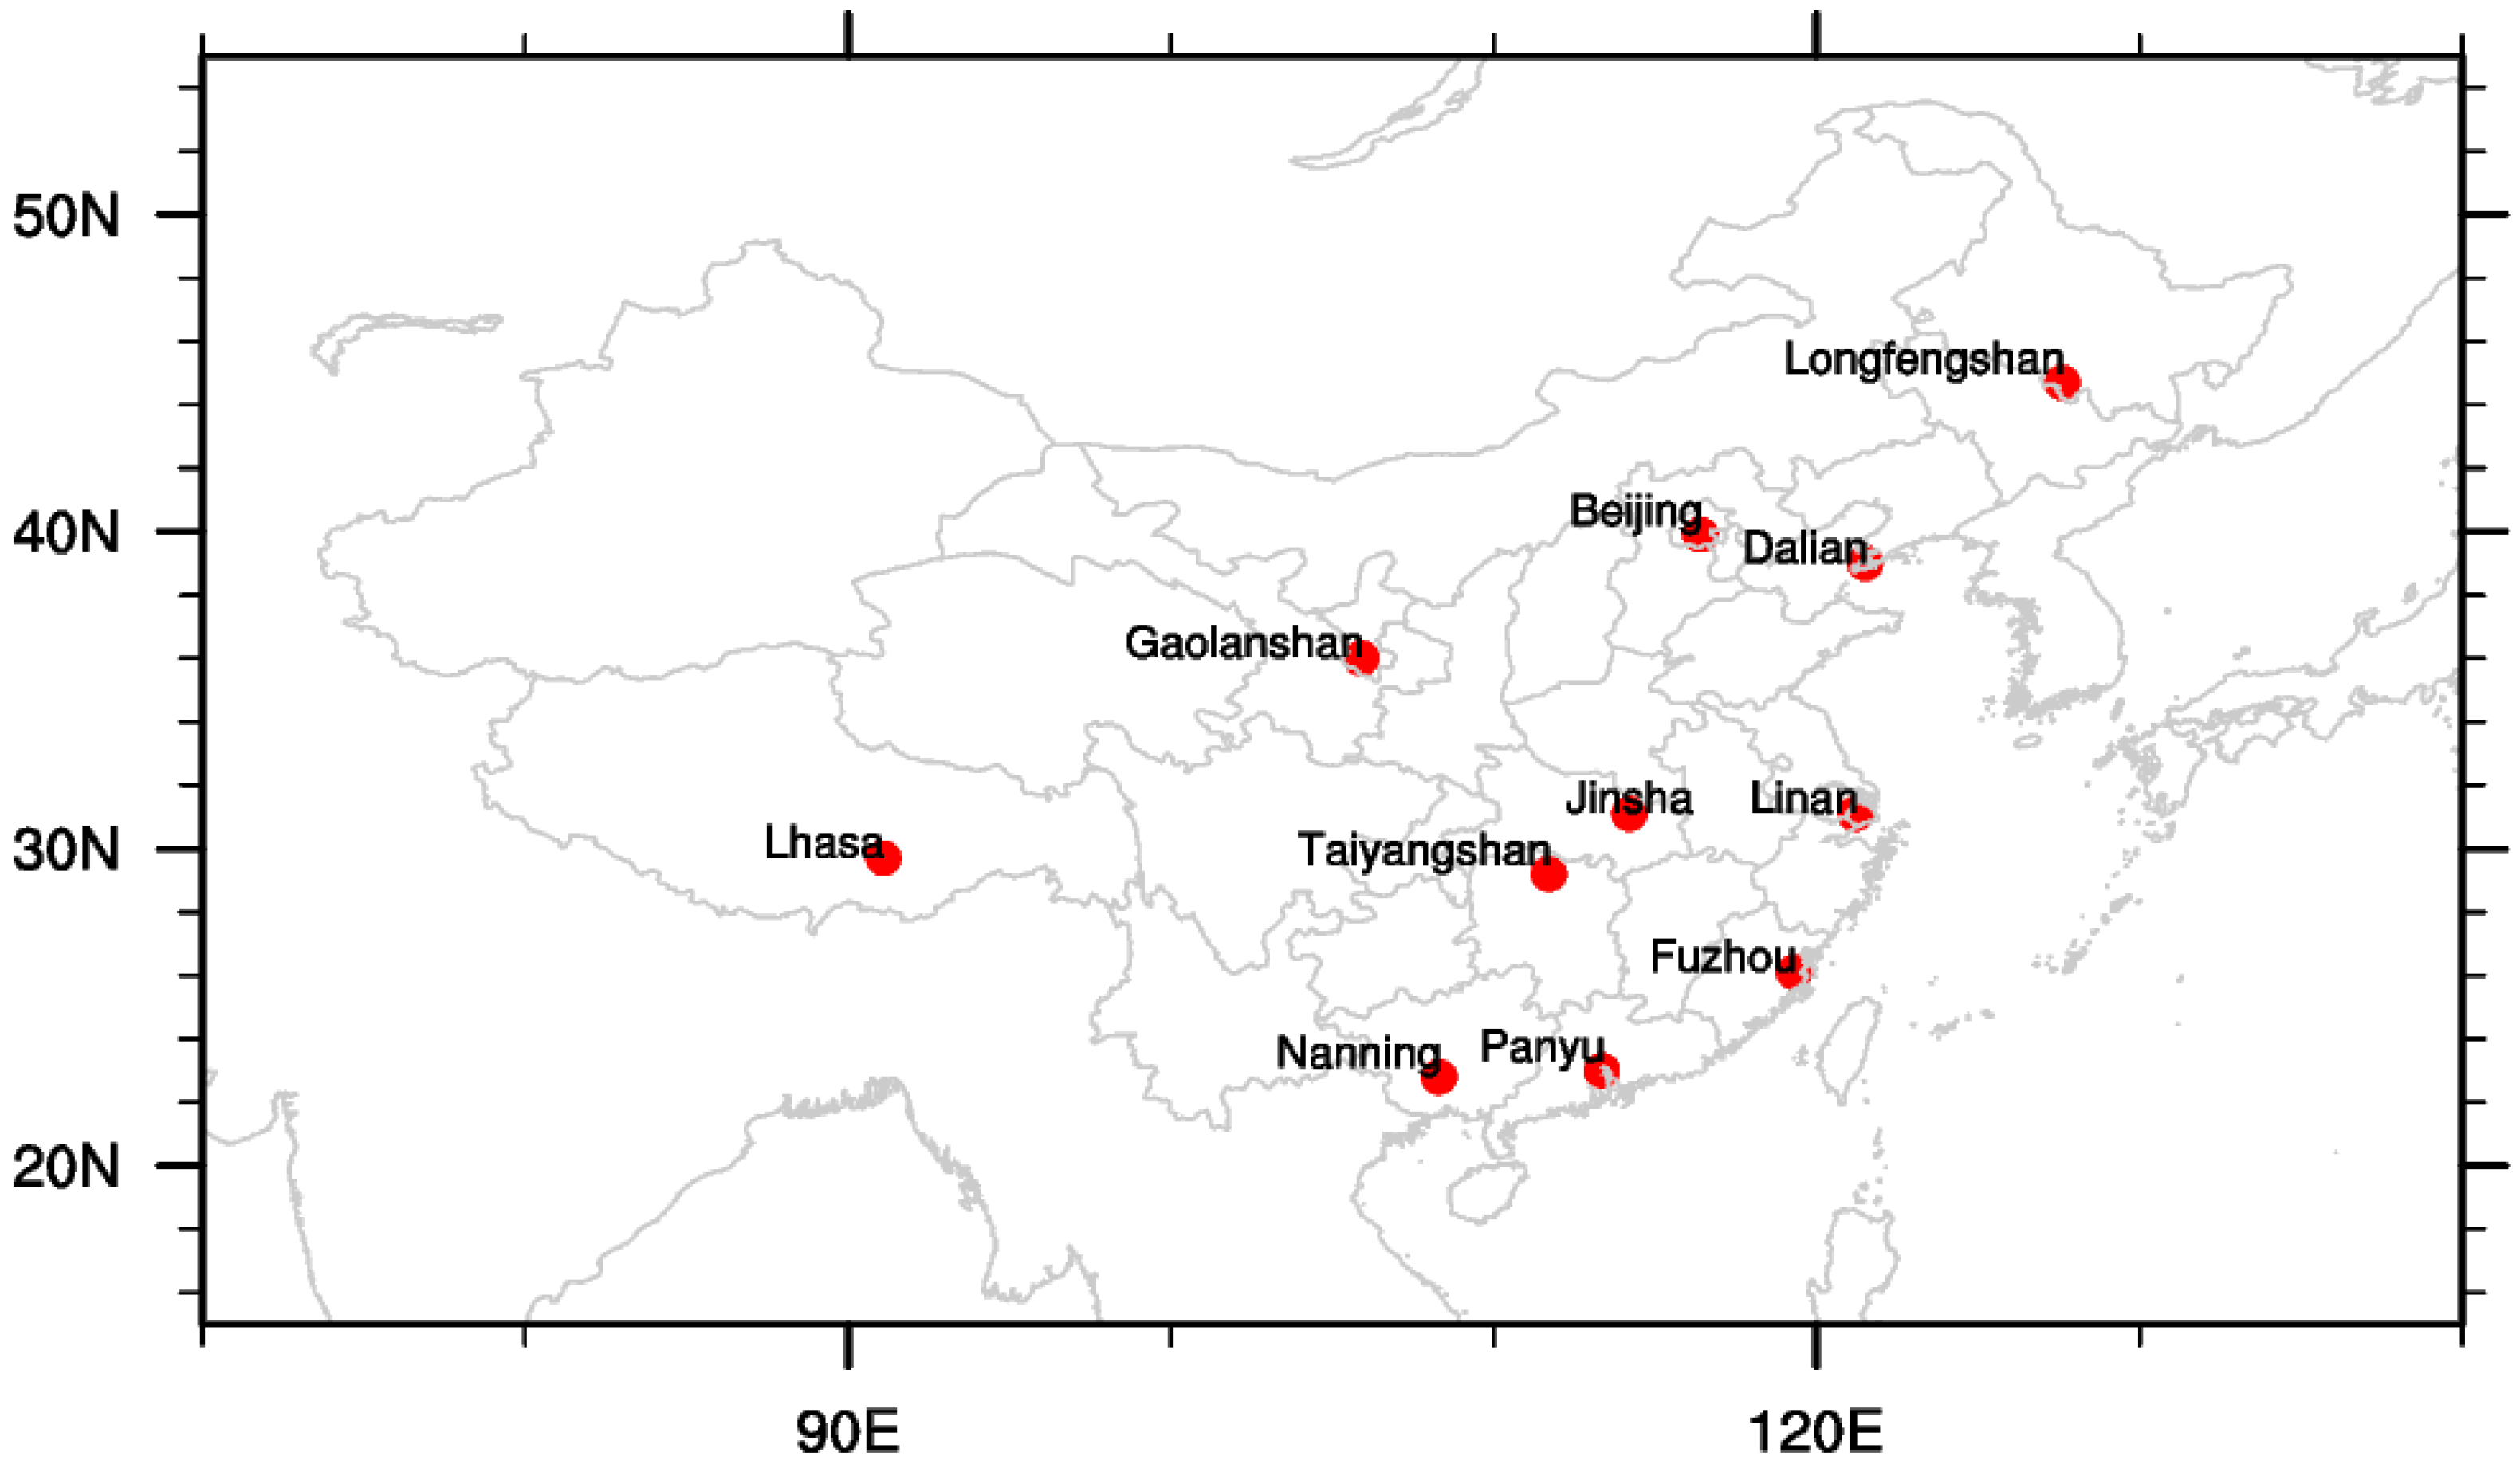
2.2. Observational Data

The Aerosol Robotic Network (AERONET) program that was established by the National Aeronautics and Space Administration (NASA) provides measurements of spectrally resolved aerosol optical characteristics with more than 500 sites around the globe. The AERONET program plays an important role in the studies of aerosol optical properties and it has been regarded as a validation tool for radiative transfer models and satellite retrievals. AOD data products are divided into three levels based on data quality: Level 1.0 (unscreened), Level 1.5 (cloud-screened), and Level 2.0 (cloud-screened and quality-assured) [60,61]. In this paper, Level 2.0 AERONET AOD data obtained from four sites in East Asia in 2010 were selected to validate the WRF-Chem model: Osaka (34.65° N, 135.59° E), Xianghe (39.75° N, 116.96° E), Taihu (31.42° N, 120.21° E) and Hong Kong PolyU (22.30° N, 114.18° E) (Table 1).
The Moderate Resolution Imaging Spectroradiometer (MODIS), operating on the Terra and Aqua satellites since 1999, is an important instrument for observing biological and physical processes over land and ocean at the global scale [62]. The MODIS is a broom-type scanning imaging sensor, with scanning observations of the ground at a swath width of 2330 km, a scanning bandwidth of 10 km, and a viewing angle range of ±55°. It has 36 discrete spectral bands with a spectral range from 0.4 μm (visible light) to 14.4 μm (thermal infrared), including three spatial resolutions at 250 m (1–2 bands), 500 m (3–7 bands), and 1000 m (8–36 bands). The MODIS obtains global coverage in two days and it acquires images of land and ocean temperatures, primary productivity, land surface cover, clouds, aerosols, water vapor and fires. The uncertainty in MODIS AOD products was ±0.05 over land and ±0.03 over oceans [63]. In this study, the AOD data of MODIS, in different seasons of 2010, were chosen to validate simulations based on the WRF-Chem model.
In December 1999, the Multi-angle Imaging SpectroRadiometer (MISR) was launched into a Sun-synchronous orbit that was carried by the Terra spacecraft of the NASA Earth Observing System. The MISR aerosol product retrieves information on single scattering albedo, AOD, aerosol radiative forcing and aerosol plume height [64,65,66,67,68,69]. The MISR produces 36 simultaneous images (nine angles, including 0°, ±26.1°, ±45.6°, ±60.0°, and ±70.5° at each of the four wavelengths of 446, 558, 672, and 866 nm) with a swath width of 360 km. Previous studies showed that AOD data retrieved from MISR were reliable (on the order of 0.05 precision) [70,71,72]. The MISR aerosol product was selected to evaluate the simulated AOD in 2010 over East Asia in this study.

3. Results

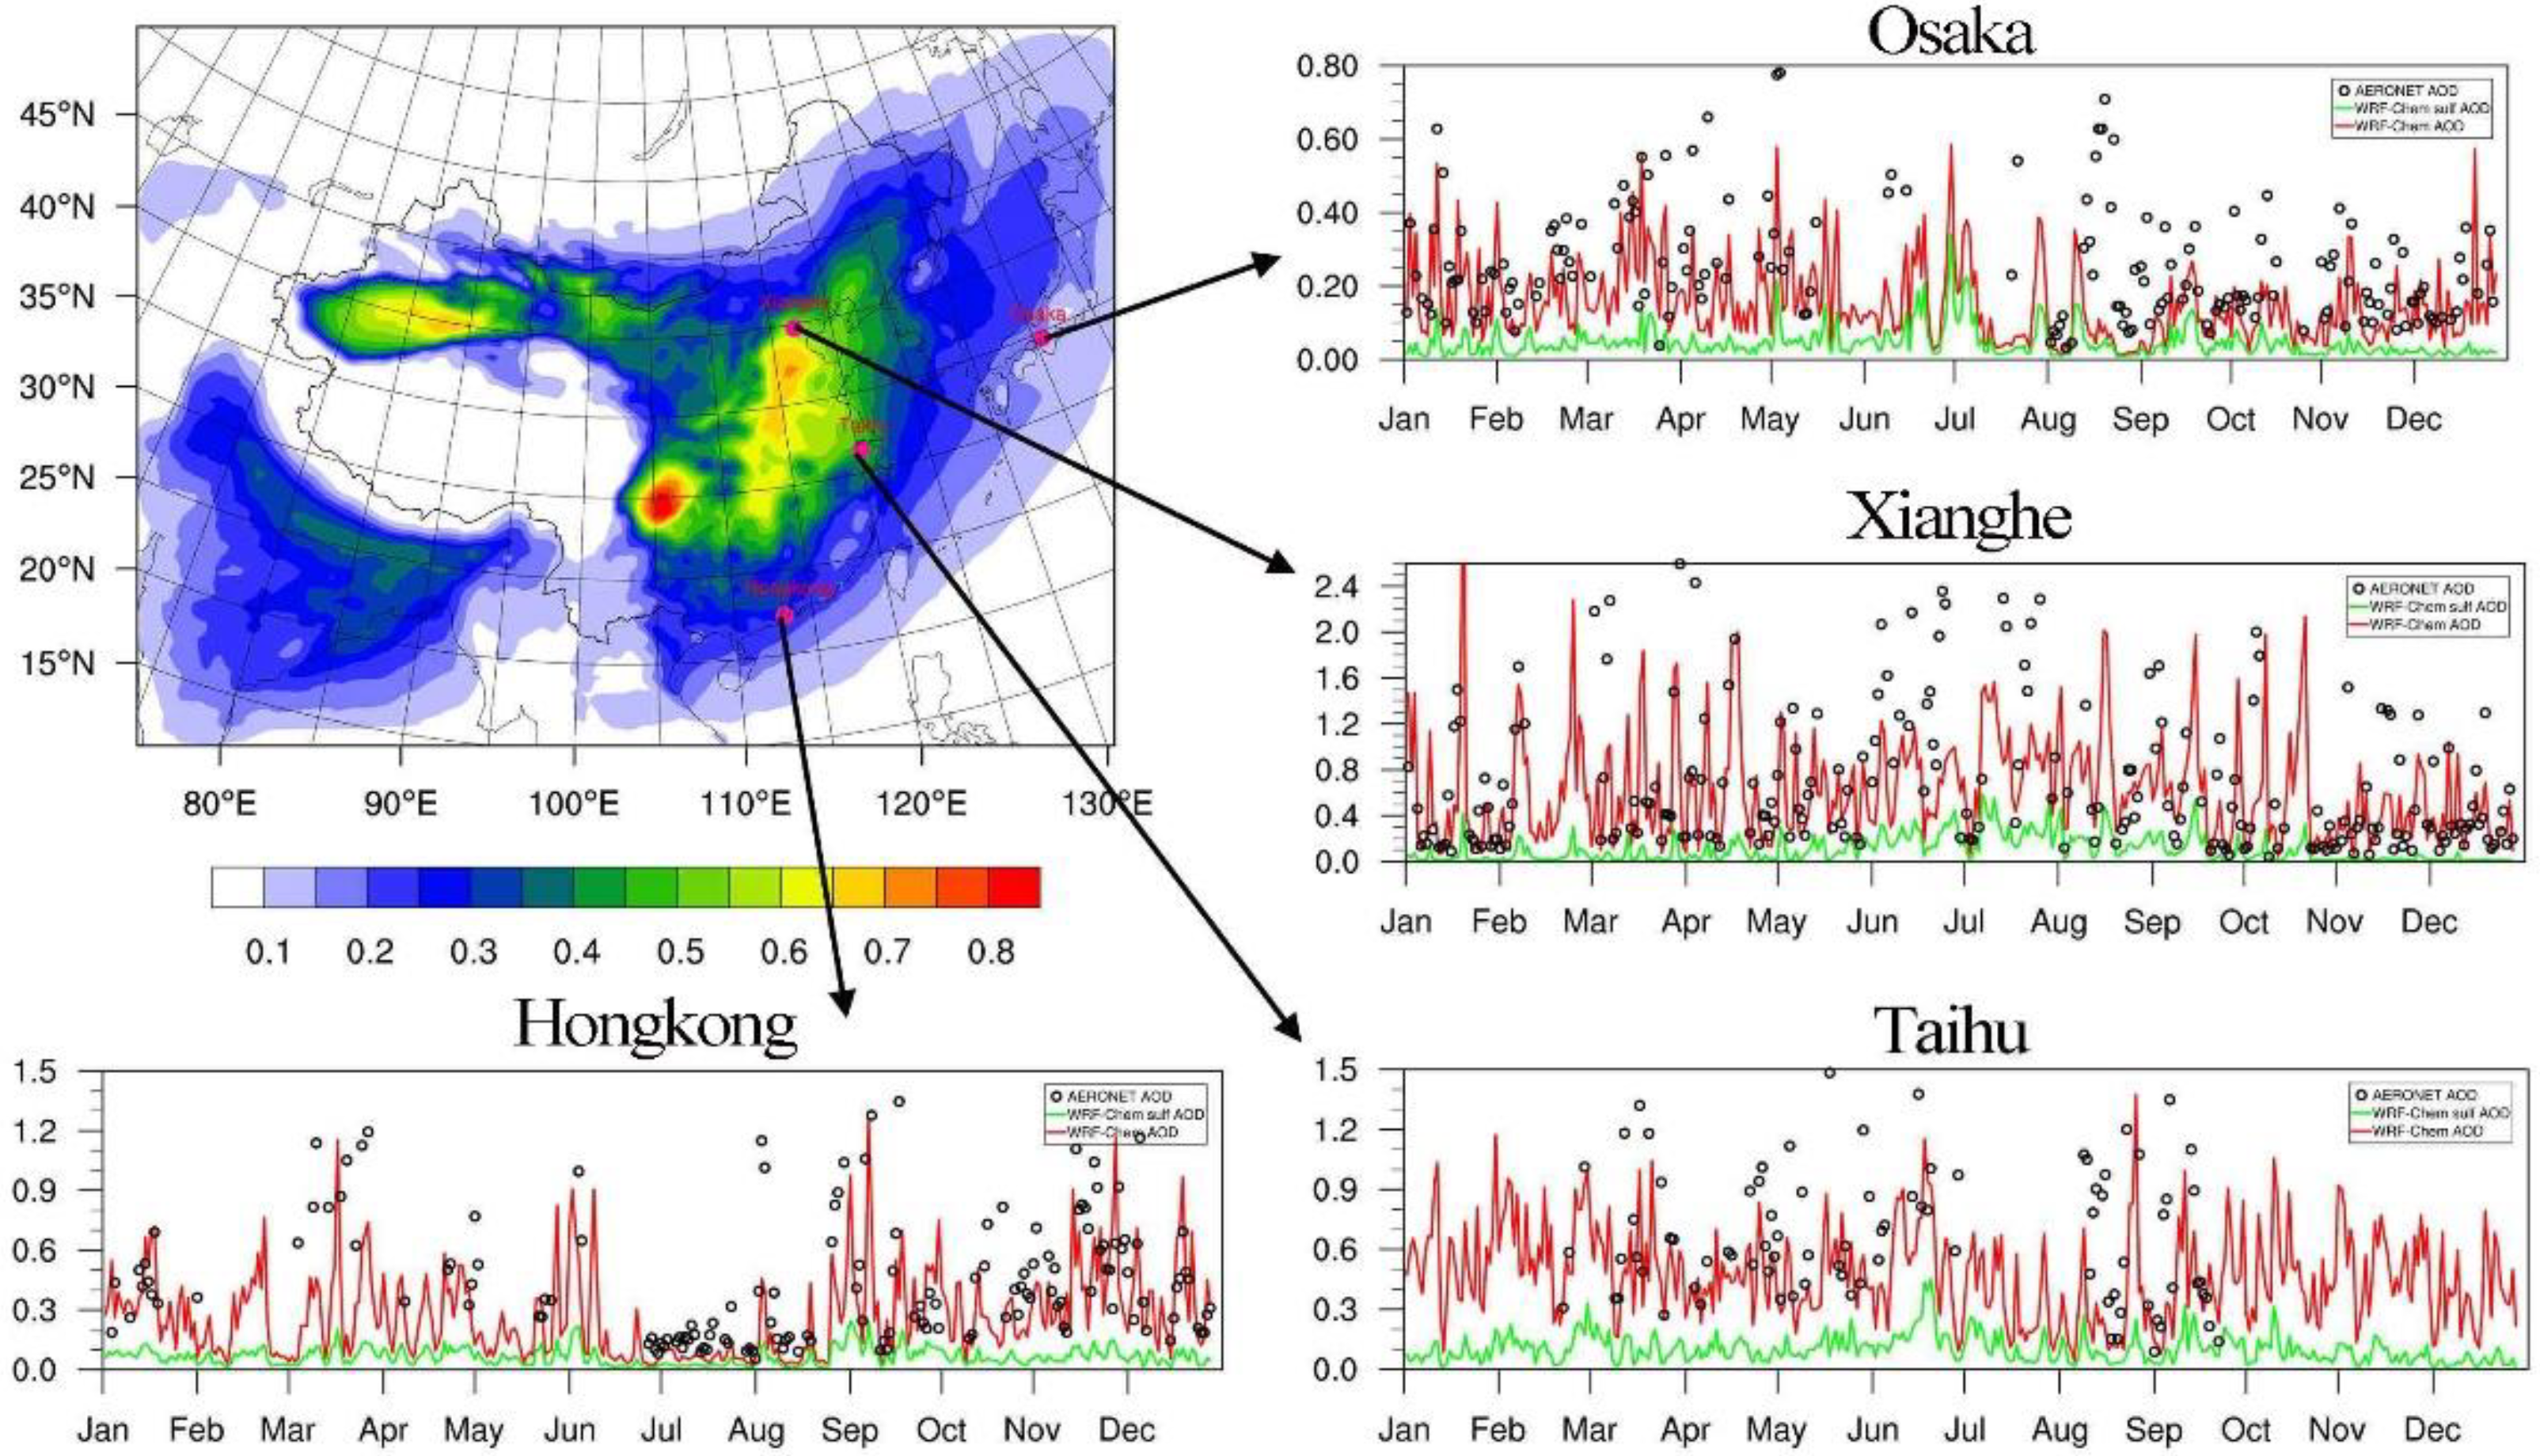
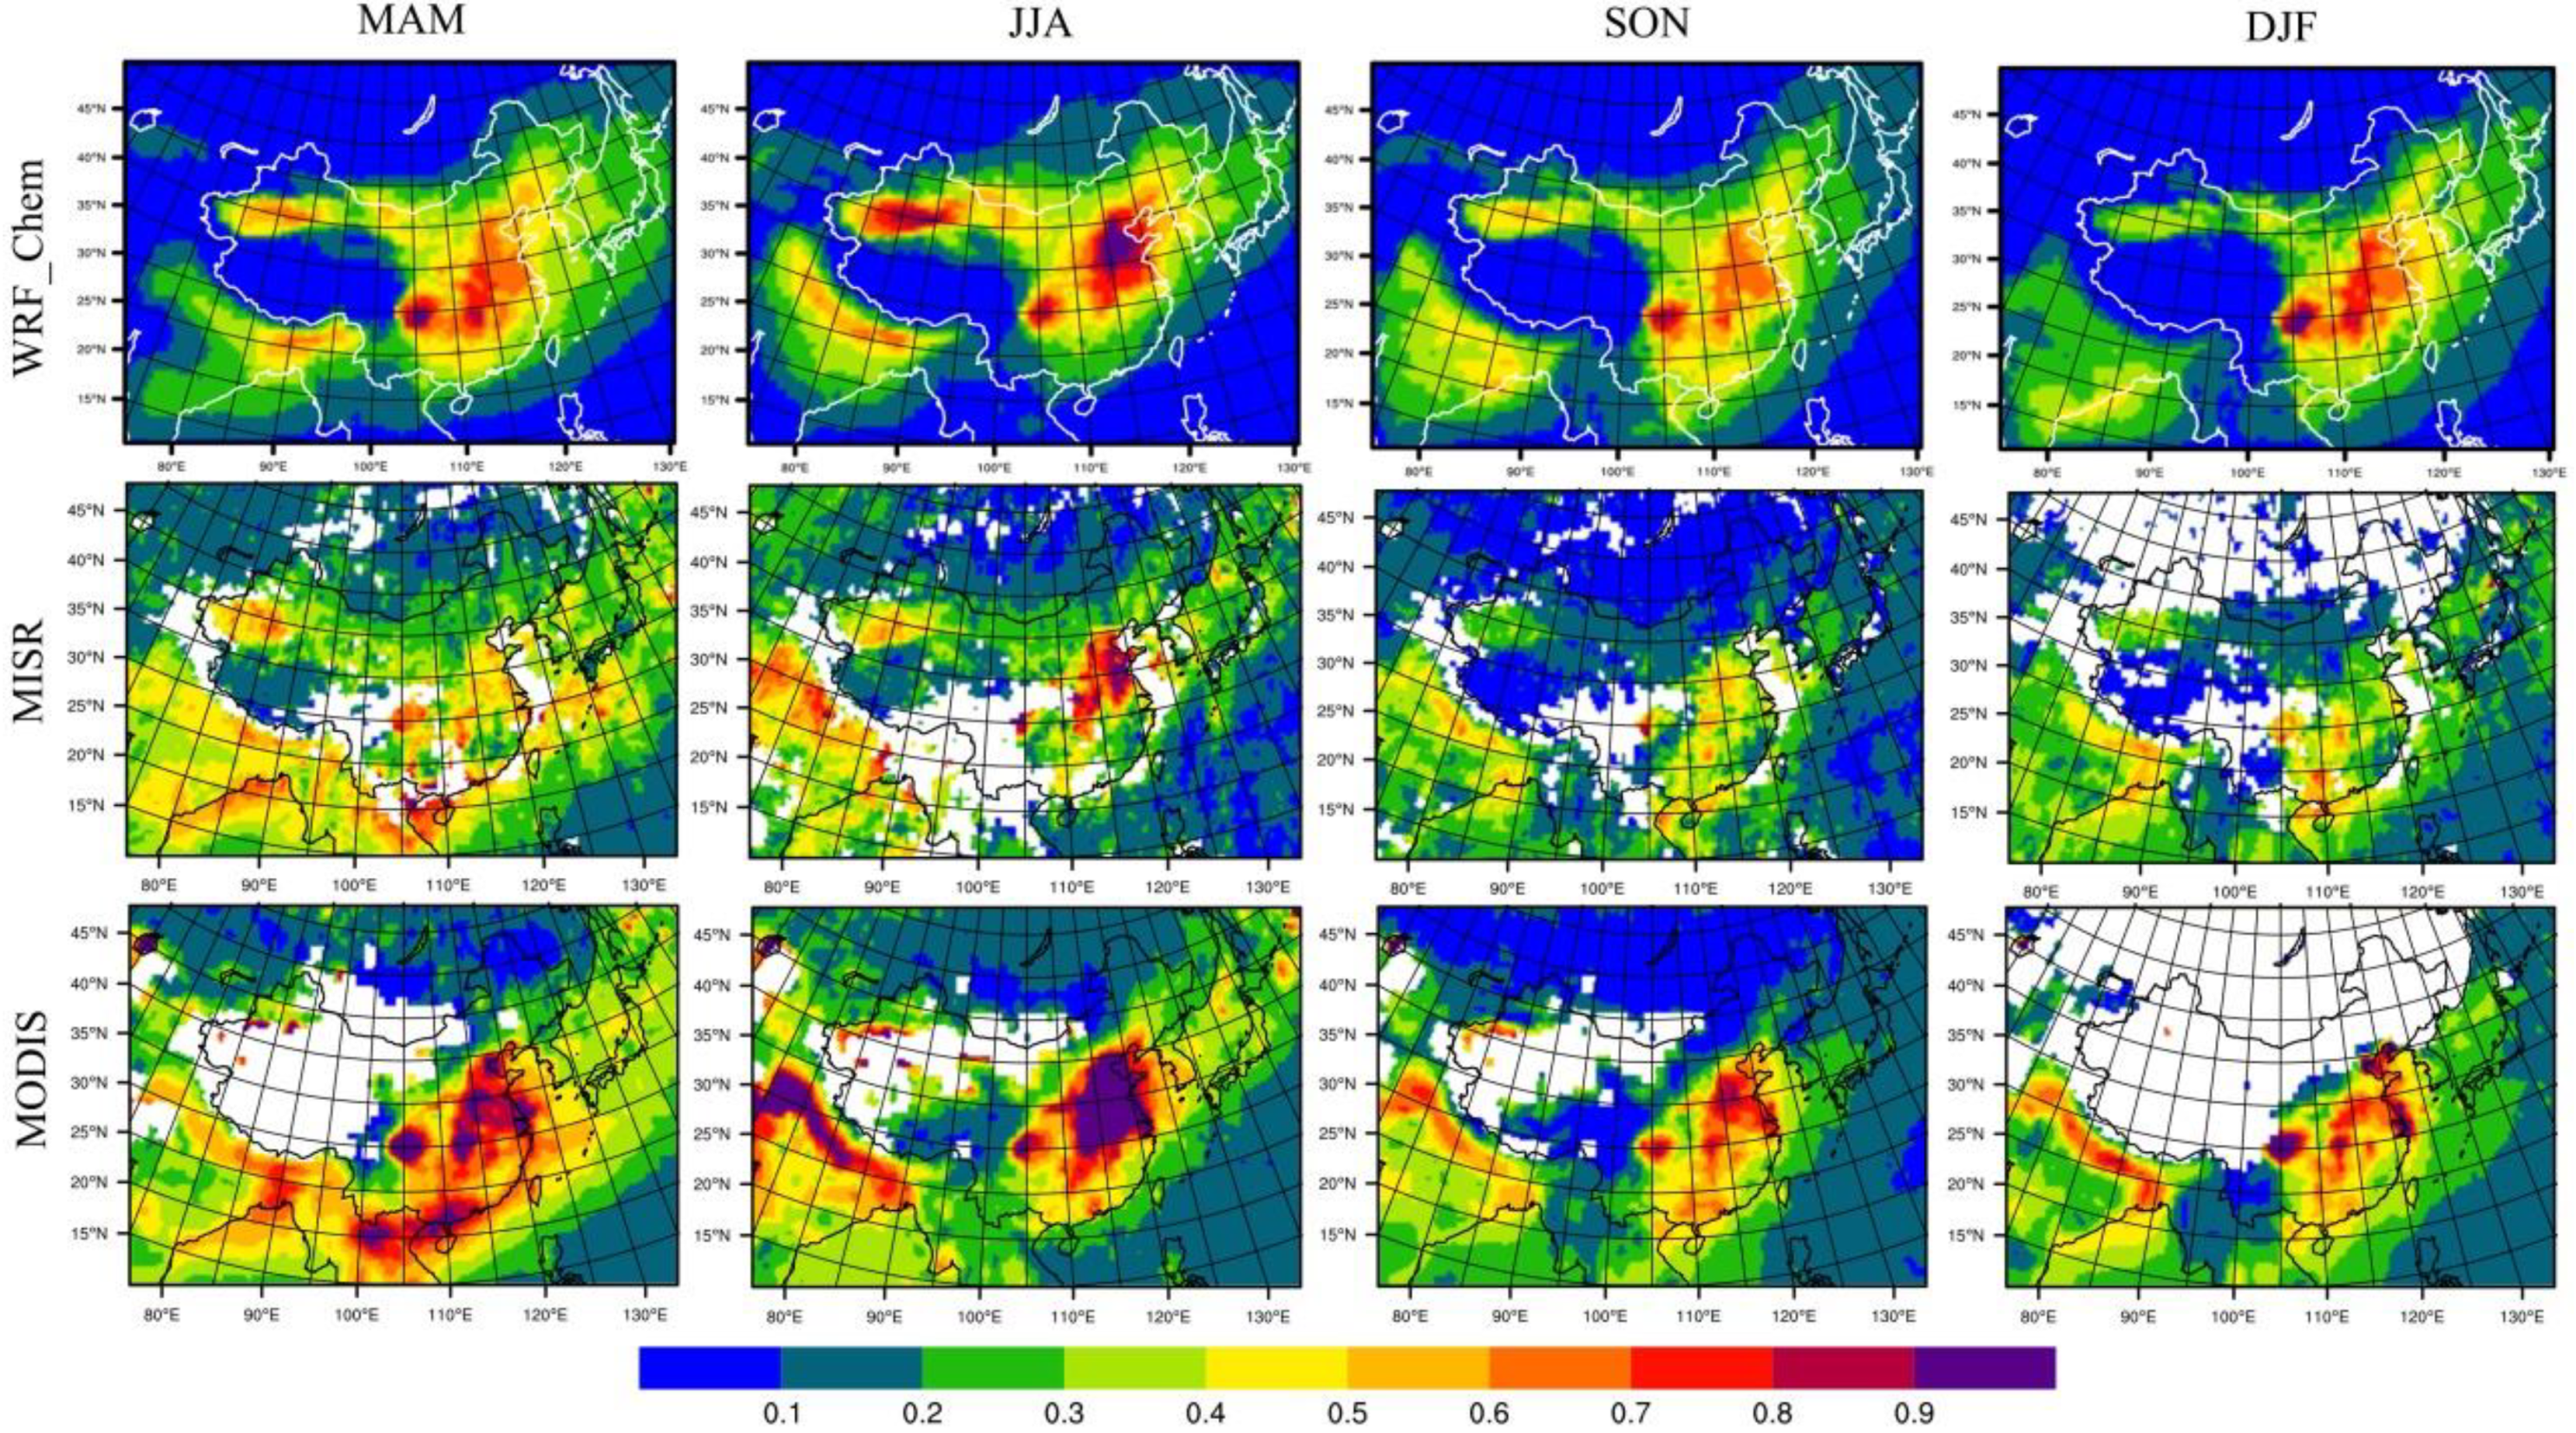
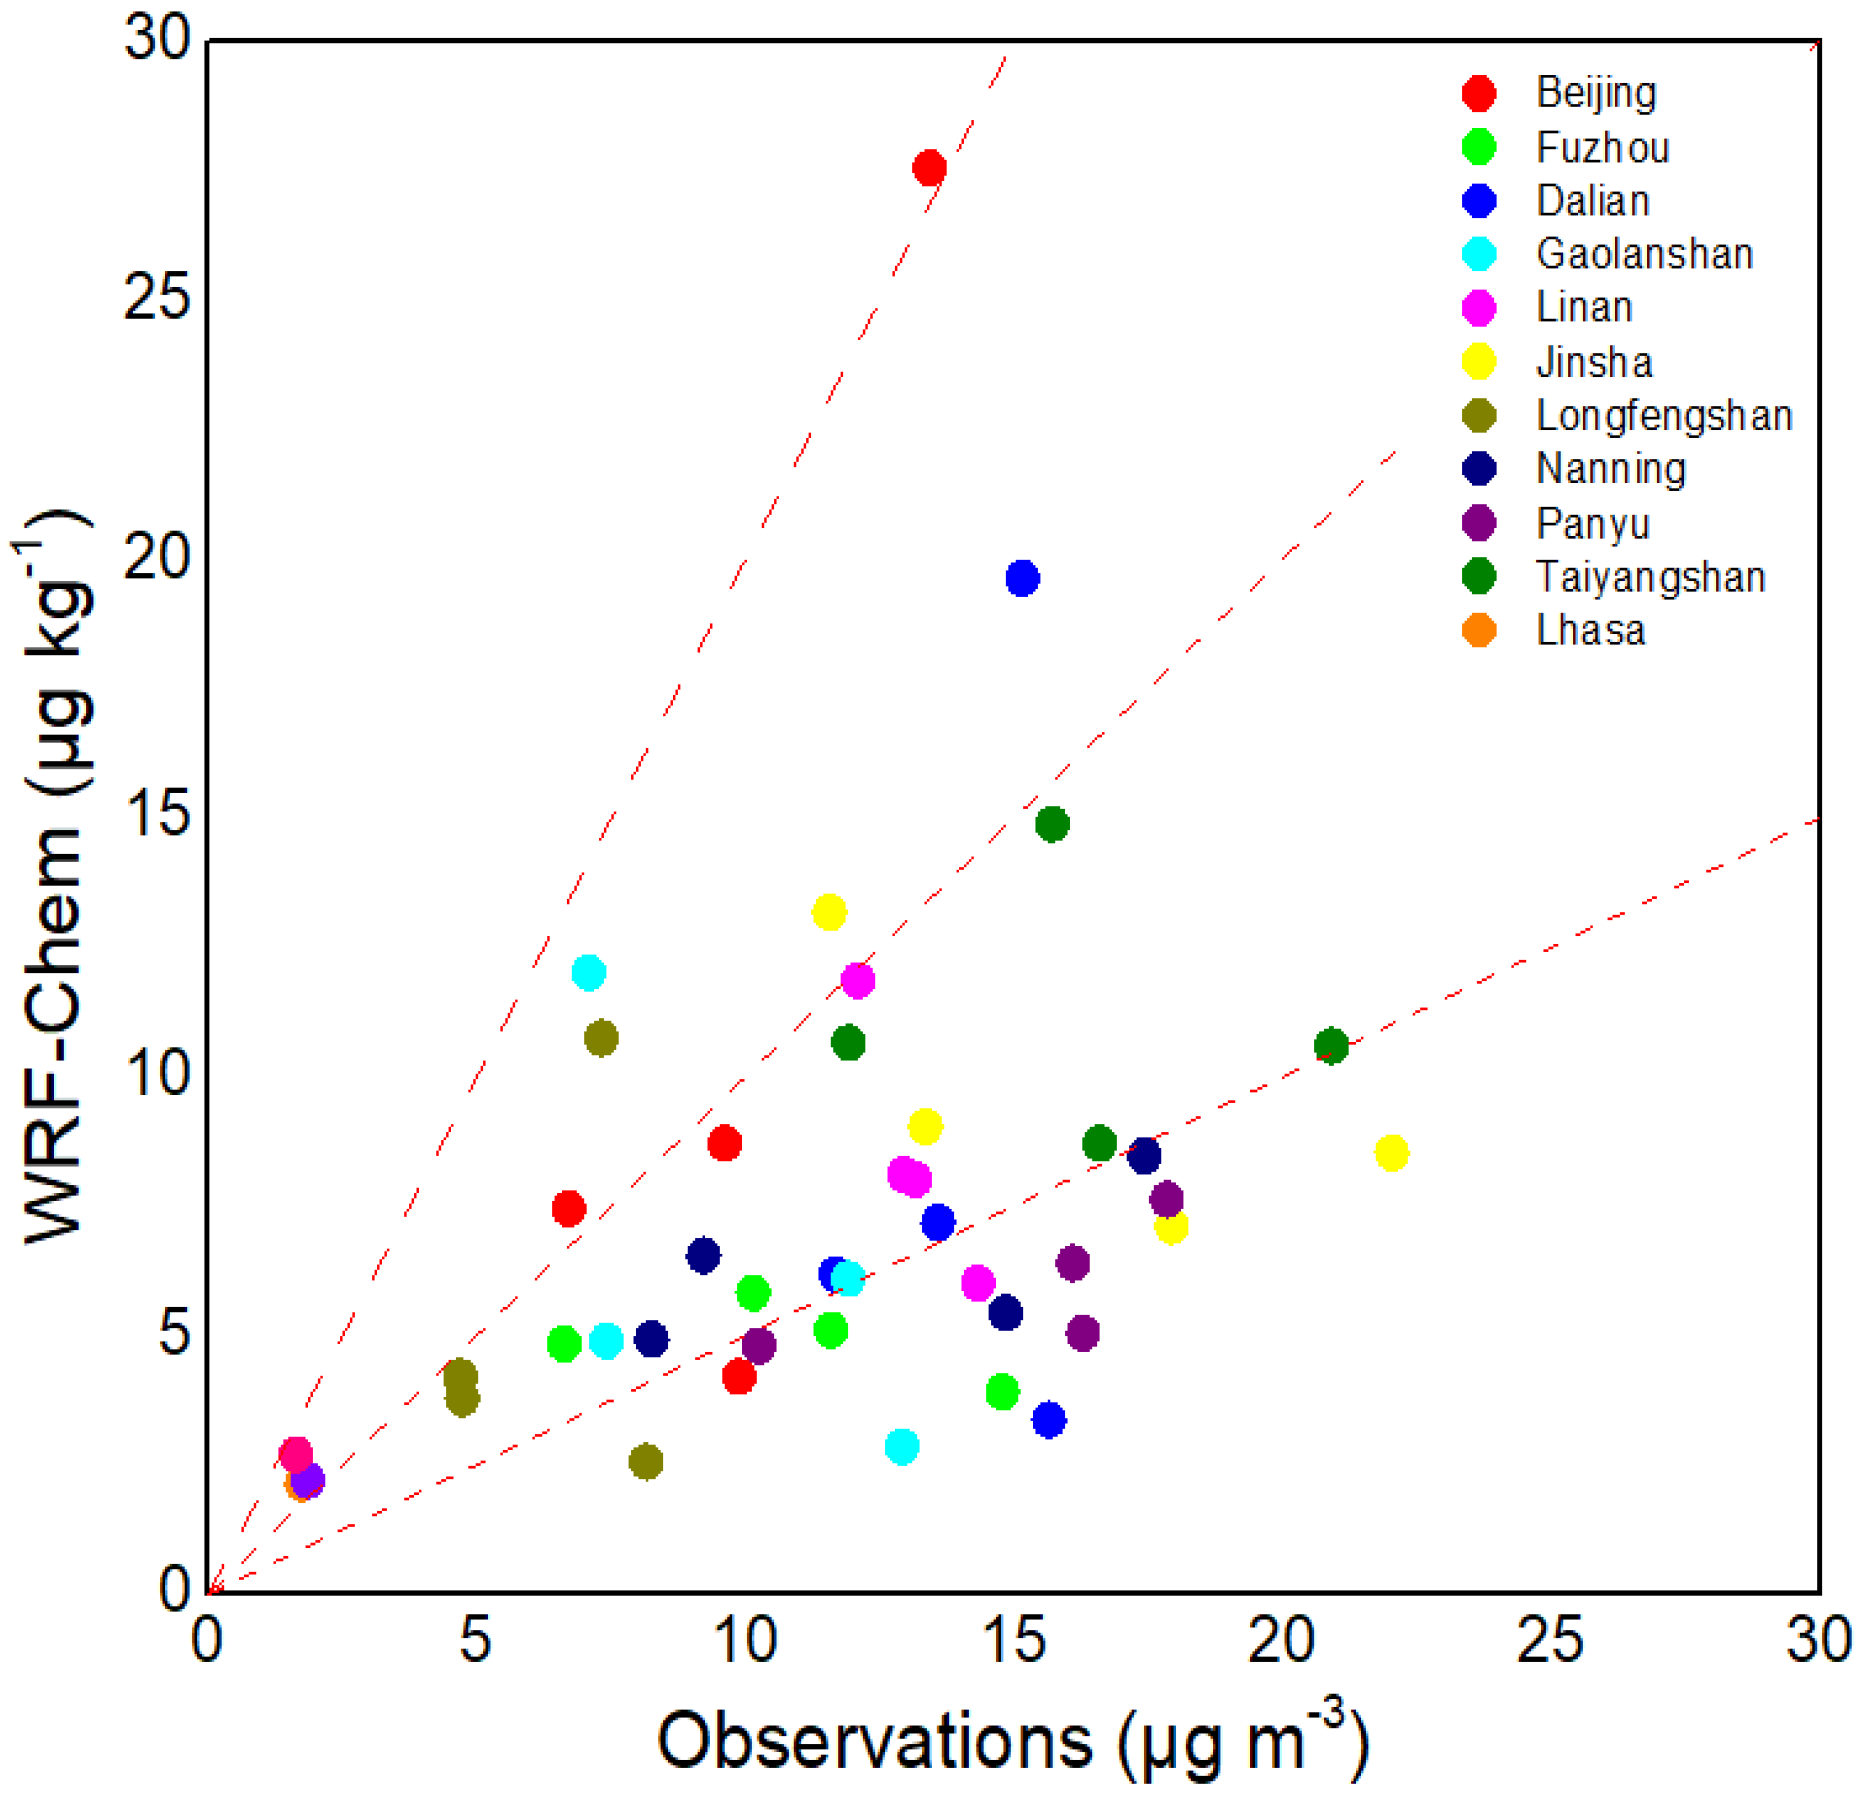
3.1. WRF-Chem Validation

To assess the performance of the WRF-Chem model, data from four sites (Taihu, Xianghe, Hong Kong and Osaka) of the AERONET were selected for analysis. Figure 1 shows the daily AOD at 500 nm from AERONET and the corresponding total AOD and sulfate AOD at 550 nm from WRF-Chem simulation during 2010 at the four sites over East Asia. In general, the model results were consistent with the observed AOD over East Asia. Results showed that the correlation coefficient was 0.75, 0.61, 0.60, and 0.57 in Xianghe, Hong Kong, Osaka, and Taihu, respectively, whose significance were all above the 95% level. The normalized mean bias was 13%, 18%, 29%, and 32% in Xianghe, Hong Kong, Osaka, and Taihu, respectively. Furthermore, temporal variations in AOD exhibited different characteristics at the various sites, with low values over Hong Kong and high values over Xianghe in July. The minimum average value of observed AOD was found at the Osaka site and that maximum at Xianghe site, which also corresponded to the two sites with the best agreement between model data and observations. However, due to uncertainties in local emissions over East Asia, the model underestimated the value of areas with large emissions, especially in summer.
Figure 2 compares the spatial distributions of seasonal AOD at 550 nm over East Asia in 2010 from MODIS and MISR retrieval to the corresponding WRF-Chem simulations. Especially, the model results were sampled at the transit time of satellite retrieval data to better match the simulations and observations. It shows that AOD values over eastern China and the Sichuan Basin were higher than 0.9, which is closer to the observations from MODIS retrieval. In addition, the WRF-Chem model simulation showed good agreement with observed seasonal variations in aerosol over East Asia, with the highest AOD values in summer and the lowest in winter. In the whole of China, the model slightly overestimated AOD values when compared with MISR retrieval in different seasons. When compared to MODIS retrieval, the WRF-Chem model underestimated AOD values over central and southern China, especially in spring and autumn. It overestimated AOD values over northeast China, Korea, and Japan. Furthermore, the model underestimated AOD value when compared with both MODIS and MISR retrievals, especially in winter.
The locations of the surface observation sites are displayed in Figure 3. Comparisons of simulated sulfate aerosol seasonal average concentrations from WRF-Chem (μg kg−1) with that of surface observations (μg m−3) are provided in Figure 4, indicating that the simulation results underestimated the sulfate aerosol concentration slightly because most markers are located under the 1:1 dashed line. The underestimation can be attributed to the low bias of anthropogenic SO2 emission and a lack of volcanic emission of SO2 in the model, which is consistent with the simulation results of Gao et al. (2014) [73]. Therefore, the feasibility of WRF-Chem model on capturing the temporal-spatio distributions of sulfate aerosol concentrations can be guaranteed. More information about the location selected in this study for sulfate aerosol observations can be referred in the Supplemental Table S1 in Jiang et al. (2013) [74]. In general, the model captured the spatial and temporal distributions of aerosols over East Asia reasonably well, providing strong support for the following discussions.

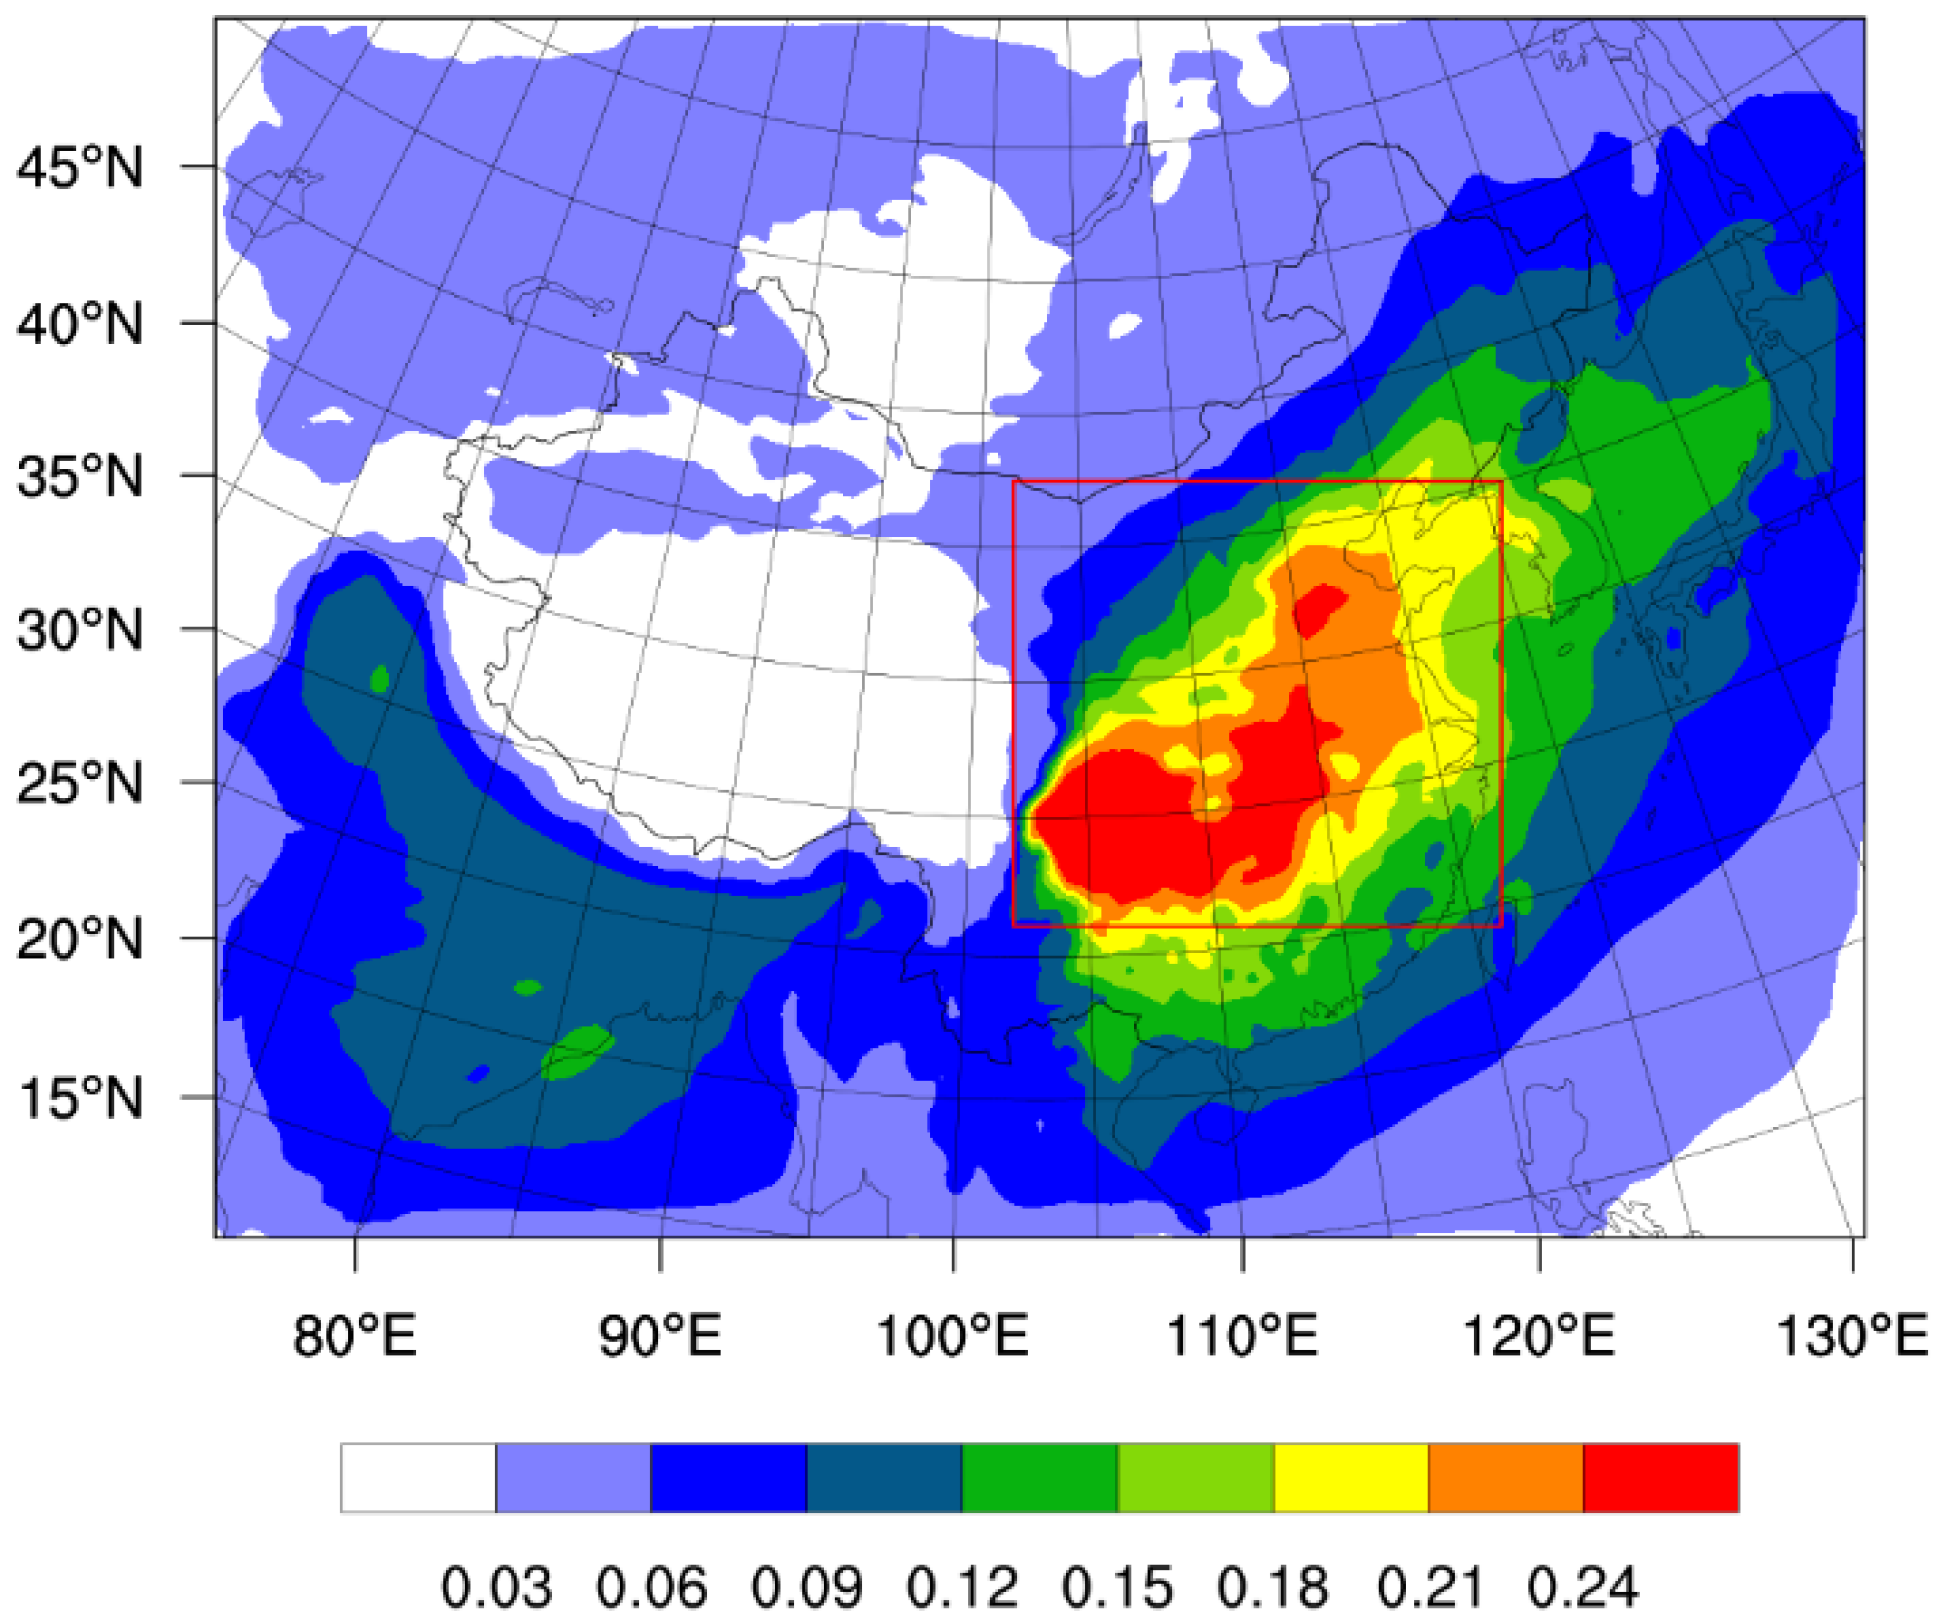
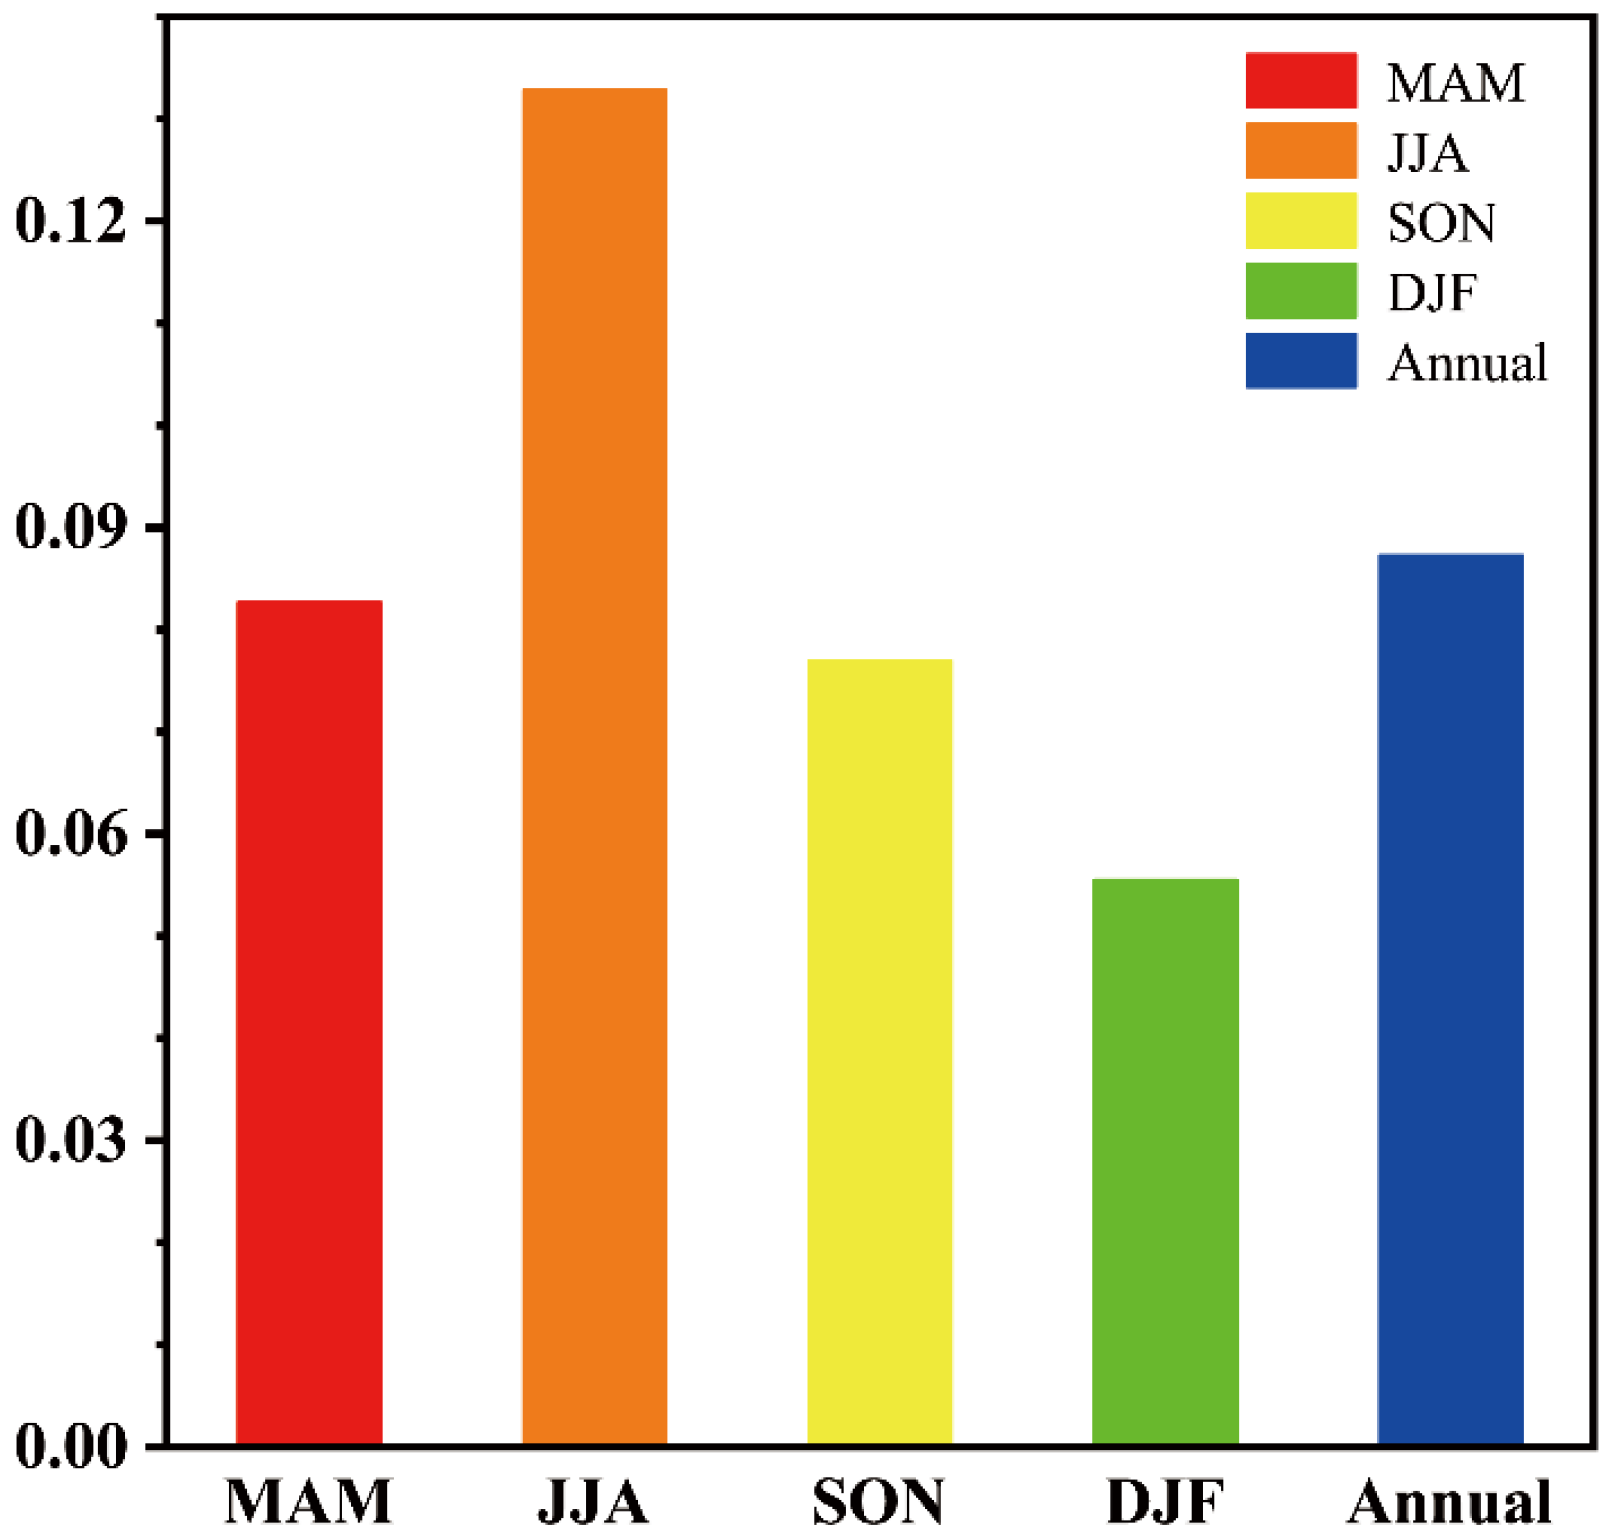
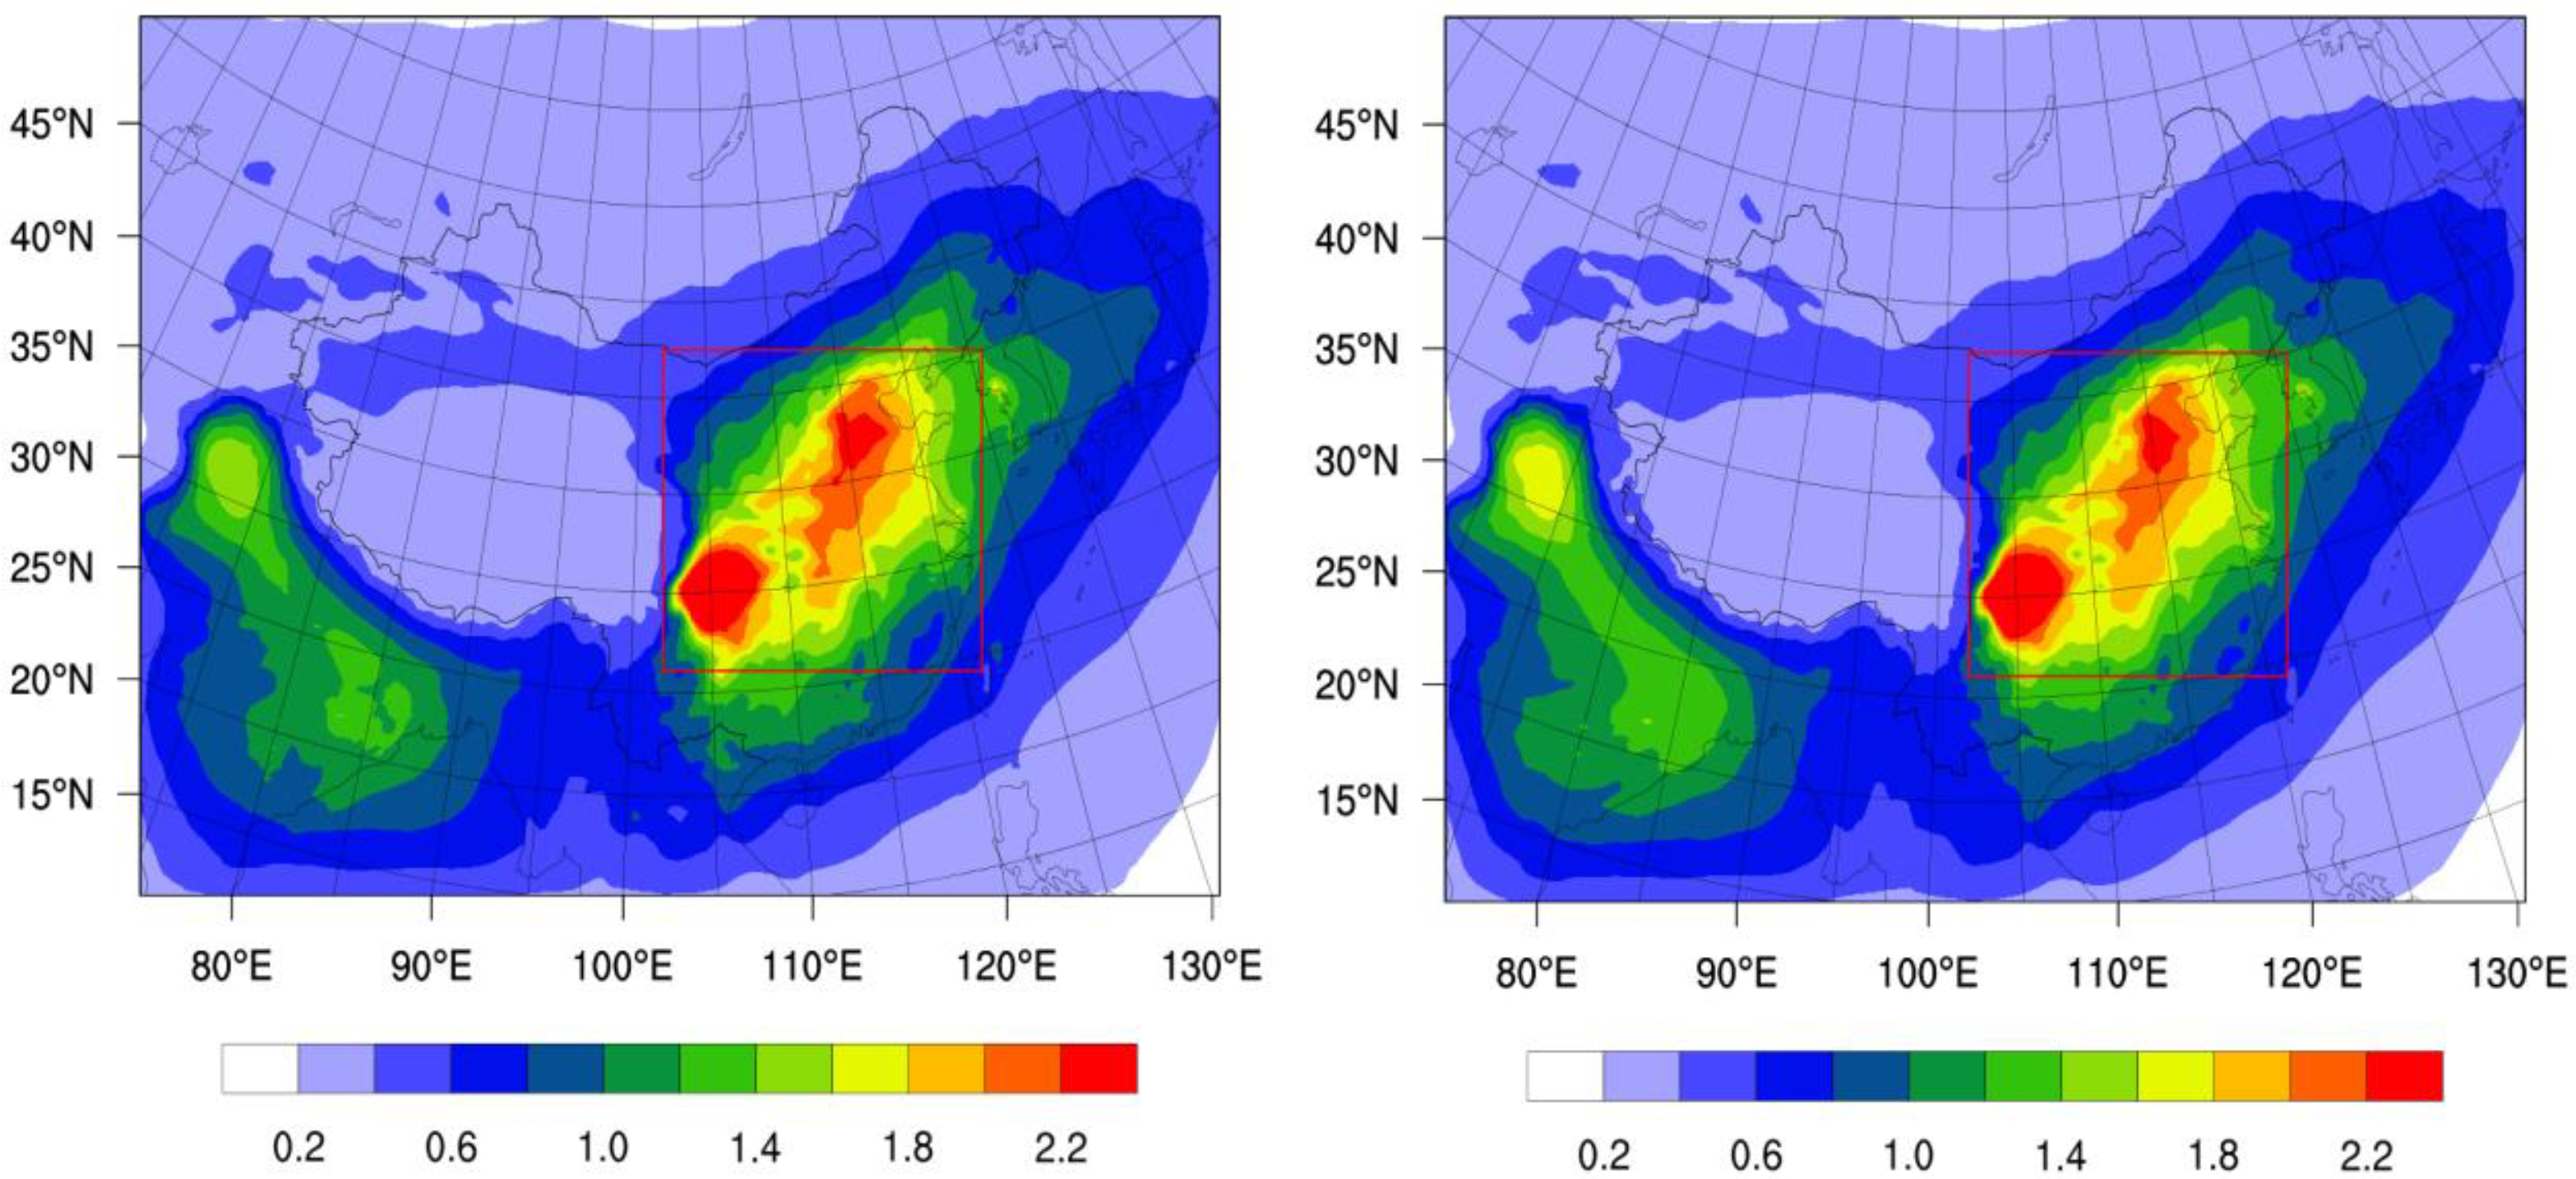
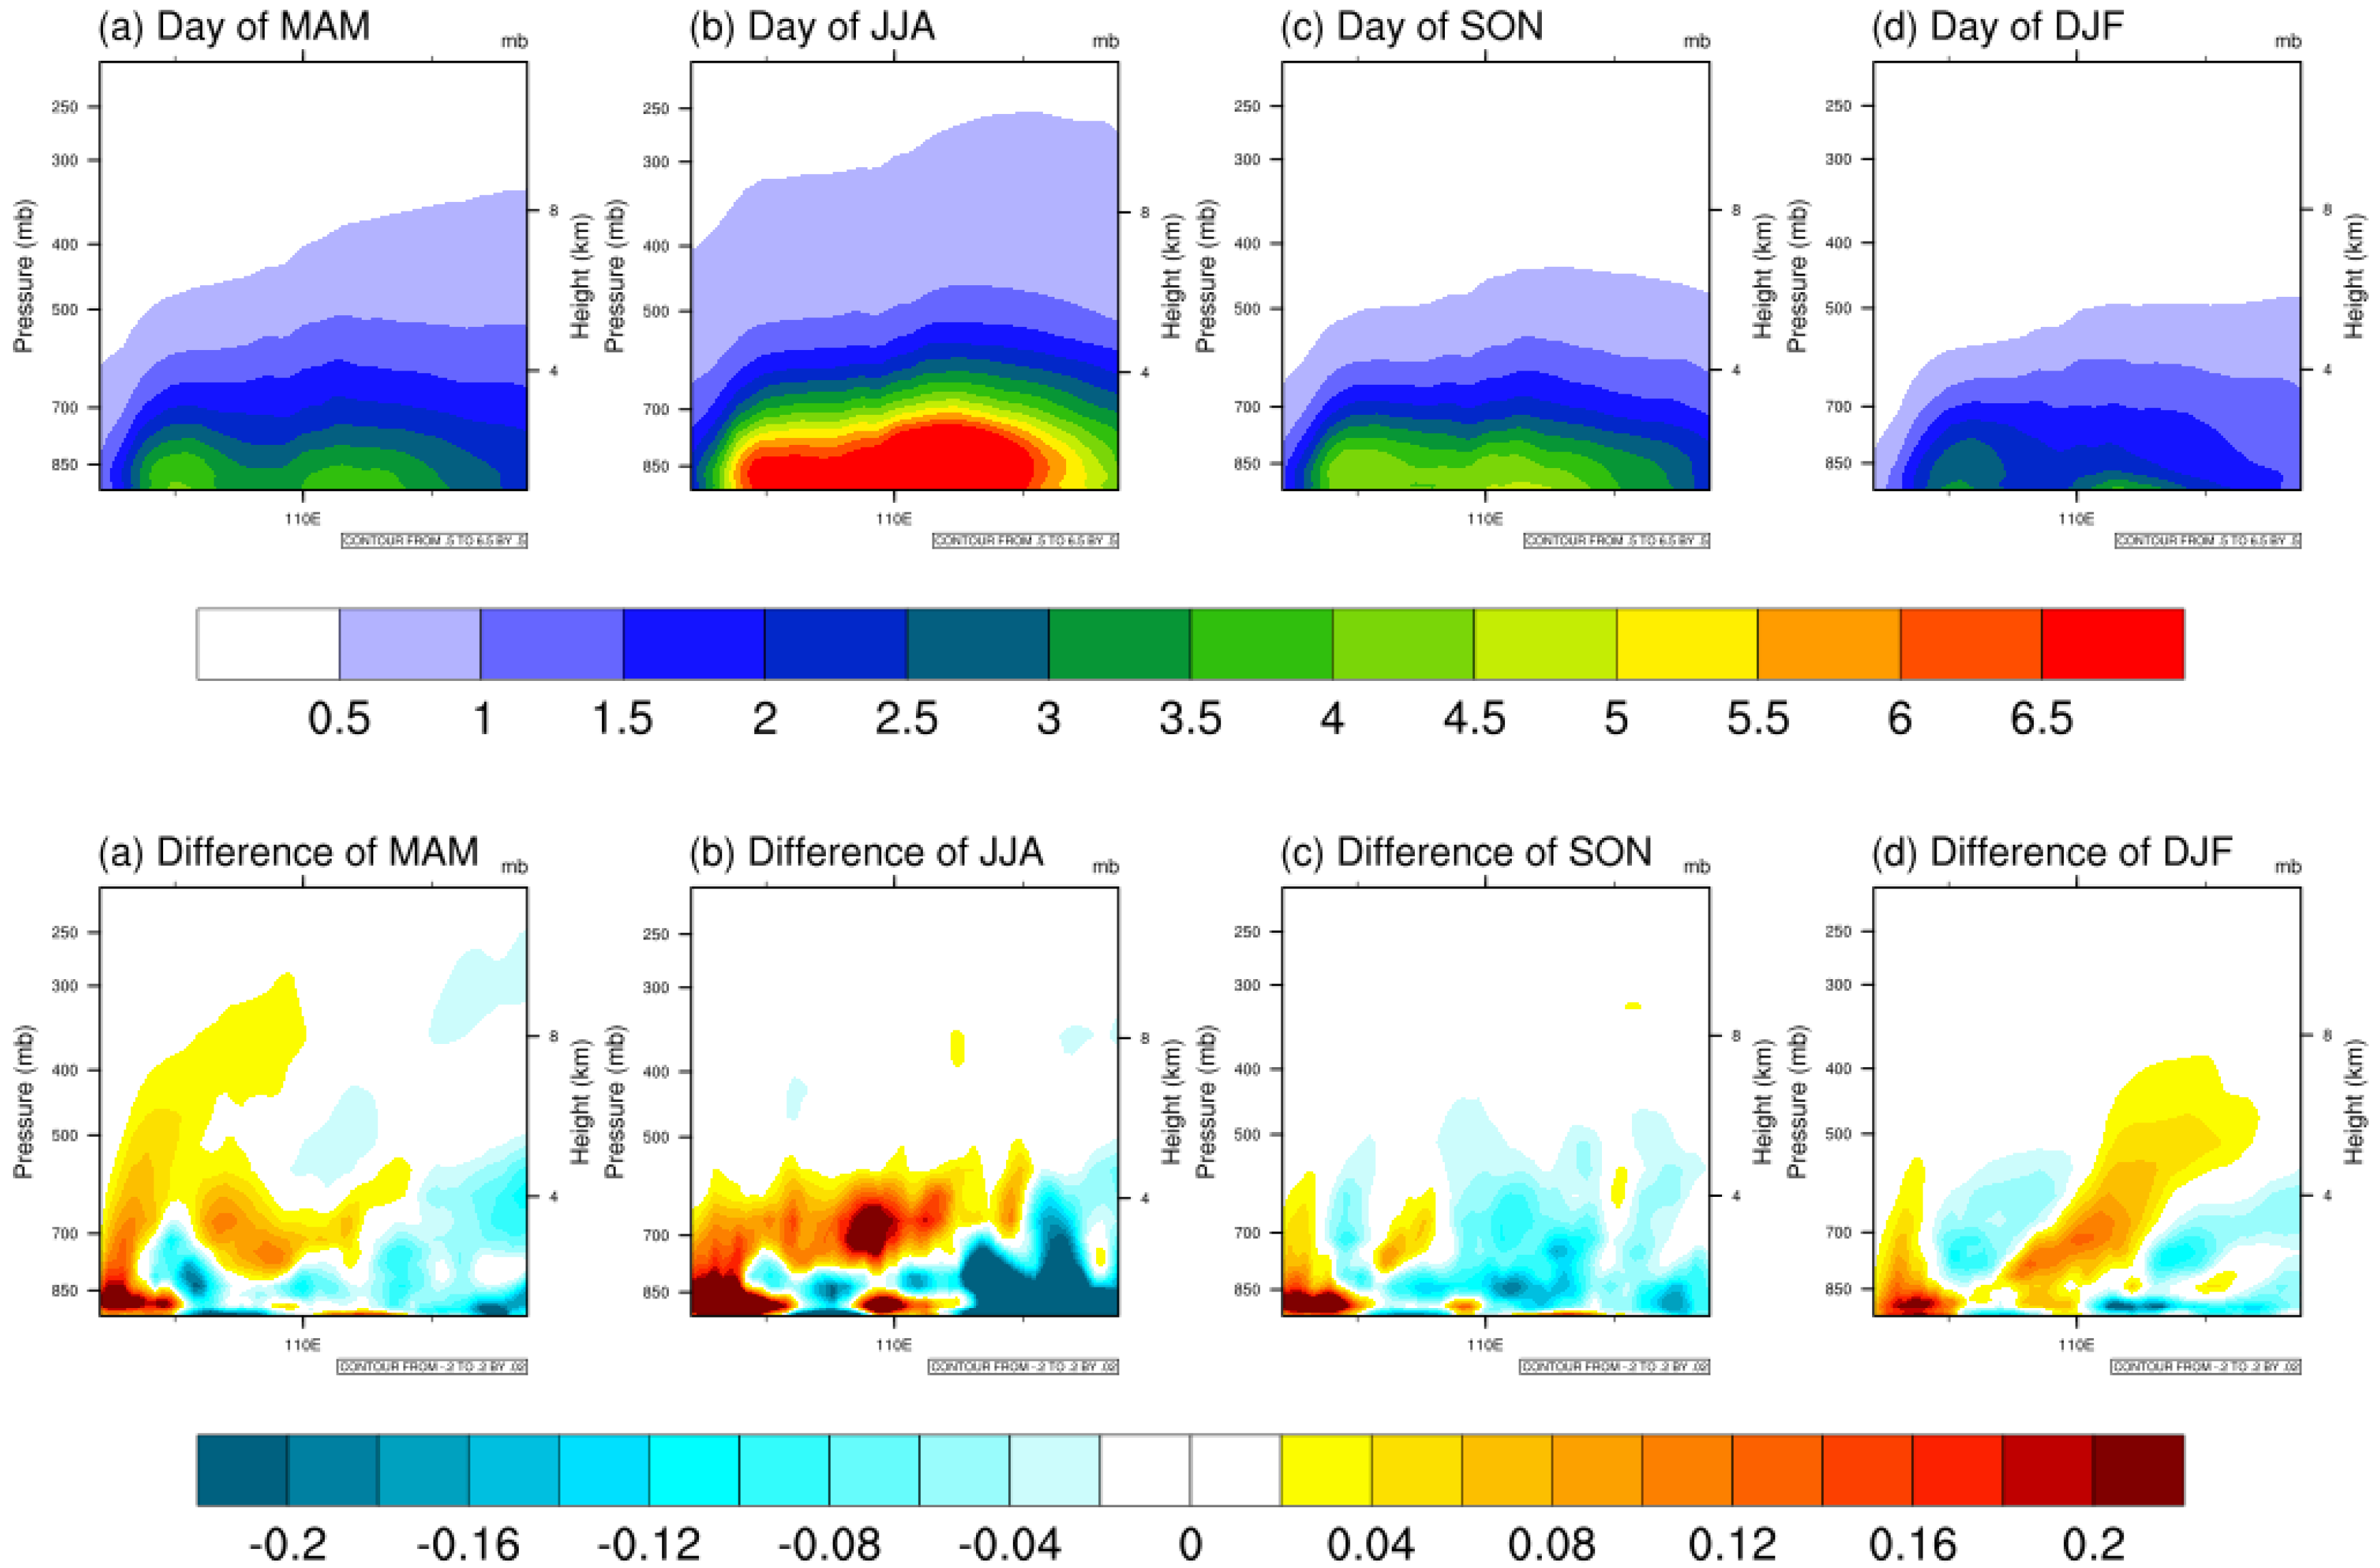
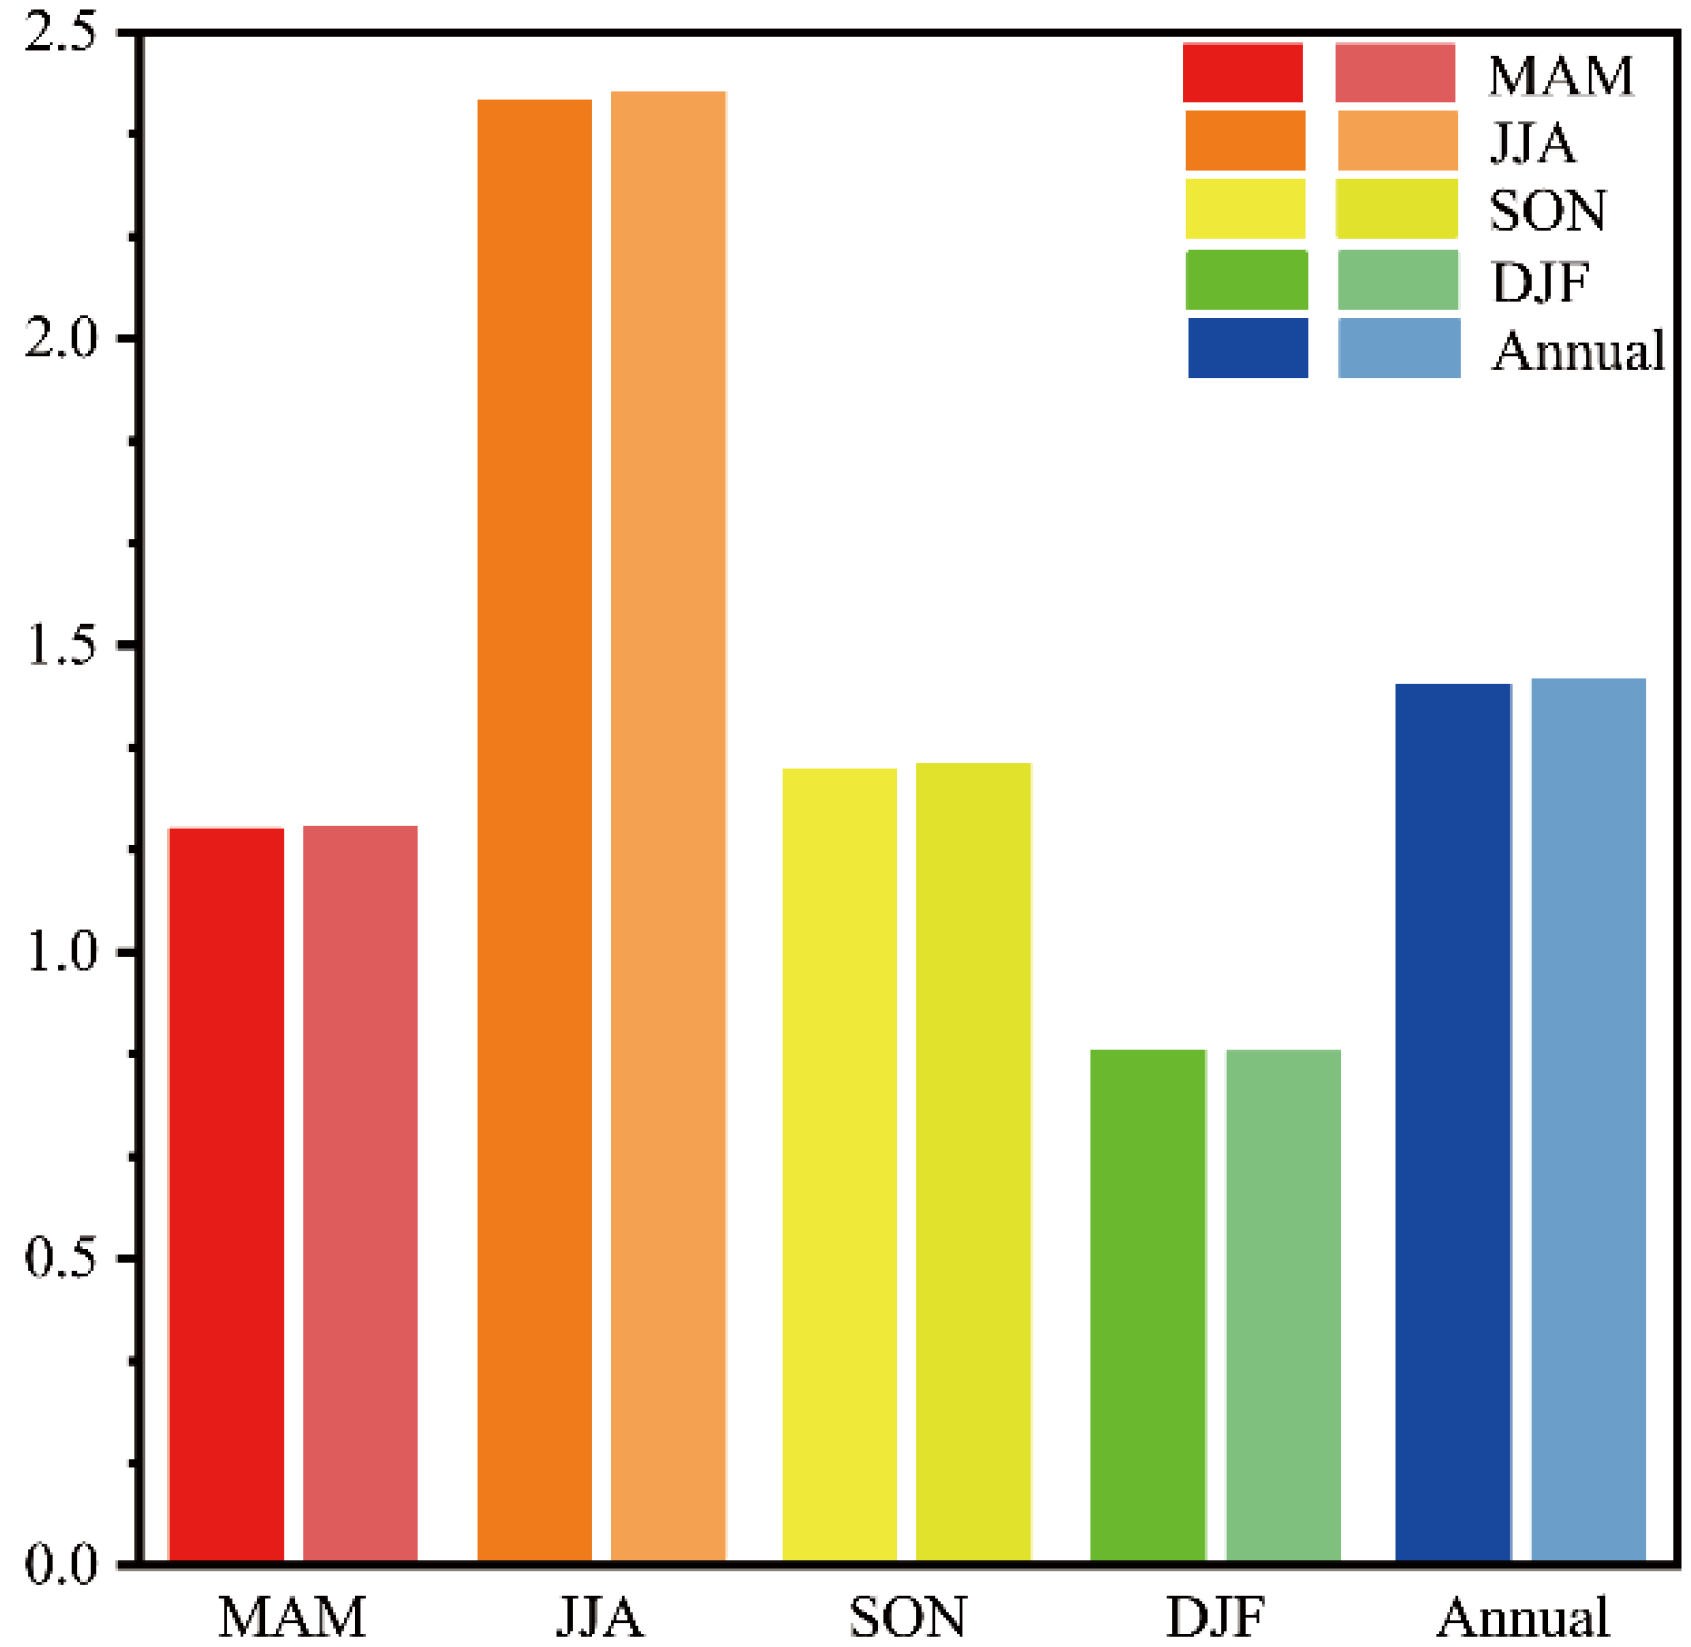
3.2. Spatial and Temporal Distributions of Sulfate Aerosols

In order to understand the characteristics of sulfate aerosol radiative forcing, we simulated the spatial and temporal distributions of sulfate aerosols. The spatial distribution of sulfate AOD at 550 nm in 2010 is shown in Figure 5. The annual average value of sulfate AOD over eastern China was 0.09, as compared with a higher value over Sichuan Basin (>0.21) and lower values over northwestern China and Qinghai-Tibet Plateau. The research of Li et al. (2015) [35] demonstrated that the distribution of sulfate aerosol was closely relevant to SO2 emission sources, whose high value centers were located in industrially developed areas. Therefore, northwestern China exhibited low values of sulfate AOD, as there were less SO2 emission sources. In addition, the sulfate AOD shows significant seasonal variations in Figure 6. The average sulfate AOD was up to 0.13 in summer, nearly doubling the winter’s. Subsequently, Li et al. (2015) [32] suggested that monsoon effects were also drivers of the peak value in sulfate aerosol observed in summer over eastern China, and noted that the stronger moisture tended to intensify aerosol optical depth due to hydrophilic sulfate aerosol. In the WRF-Chem model, sulfate was mainly produced by the liquid phase chemical reaction of SO2, and the increase of cloud amount and water vapor in summer promoted this process.
Both sulfate aerosol concentrations and AOD show similar spatio-temporal distributions in Figure 5 and Figure 7, with their maximum values in summer and minimum values in winter over eastern and northwestern China, respectively. Also, the average concentration of sulfate aerosol reached up to 2.2 μg kg−1 in the Sichuan Basin and the North China Plain in 2010, with the maximum of over 6.5 μg kg−1 in summer. The distribution of sulfate aerosols was constantly changing. Wang et al. (2002) [75] suggested that the sulfate aerosols were mainly distributed in East, Central, and Southwest China, especially in Chongqing, which was up to 11 μg m−3 in 1995. The distribution of sulfate aerosols in 1966 found by Wang et al. (2000) [10] was different from the WRF-Chem model, with maximum value 21.58 mg m−2 in the Yangtze River. Gao et al. (2004) [76] found that the column concentration of sulfate aerosols had reached 25 mg m−2 over southwestern and eastern China in 2000 using the meso-scale meteorological model and Eulerian transport model. However, they suggested that the concentration of sulfate aerosols was the highest in spring, instead of summer in WRF-Chem model. Moreover, the distribution of sulfate aerosols in WRF-Chem was most similar to the distribution in 2008 found by Li et al. (2015) [35]. They suggested that the Sichuan Basin had been a peak center of sulfate aerosols in four seasons, with the maximum of over 27 mg m−2. In addition, Ma et al. (2004) [77] found that sulfate aerosol concentrations at the surface comprised most of the total sulfate column. Figure 8 shows that sulfate aerosols are distributed between 600 hPa and surface in the troposphere, with two high value regions (Sichuan Basin and the North China Plain). Surface concentrations center over China were greater than 4.5 μg kg−1 and they varied with height, decreasing to 0.5 μg kg−1 at 8 km. Furthermore, high surface concentrations were found in Sichuan Basin due to topographic blocking. In summer, increasing cloud cover and water vapor resulted in enhancing sulfate aerosol production rates, which were also driven partly by the summer monsoon circulation and interactions with the subtropical high. In winter, sulfate aerosols were concentrated over a smaller area, as the subtropical high moved southward [30]. The positive difference of sulfate aerosol concentrations at the surface mainly appeared in Sichuan Basin and North China Plain, reaching up to 0.2, while the negative one primarily occurred and was largely concentrated in the eastern China, indicating the significant direct radiative forcing induced by sulfate aerosol in these regions.
As shown in Figure 9 and Figure 10, the spatio-temporal distributions of sulfate aerosol concentrations exhibit obvious seasonal variations. Sulfate aerosol concentrations over eastern China reached the maximum of 2.4 μg kg−1 in summer and the minimum of 0.8 μg kg−1 in winter. Figure 9 demonstrates that sulfate aerosols are distributed between 500 hPa and surface, with the value above 6.5 μg kg−1 over the Sichuan Basin in summer. When compared with the summer, the range in sulfate aerosol concentrations was reduced by a factor of two in winter. In addition, sulfate aerosols were transported from the Indian Ocean to eastern China in summer. Under the influence of the subtropical high, sulfate aerosol concentrations were also high over northeastern China. In contrast, the sulfate aerosol spatial distribution was more confined in winter due to the southward movement of the subtropical high. Furthermore, the spatial distributions and seasonal variations in sulfate aerosols were similar during the daytime and nighttime, with the difference of 0.01 μg kg−1 in eastern China. The positive difference of sulfate aerosol at surface in Sichuan Basin and North China Plain and the negative difference in eastern China were the strongest and the most extensive in summer. The positive difference was sloping and shrinking in autumn, but was gradually extended from winter to spring, while the negative difference was getting slight and subtle from autumn to winter, with little recovery in spring.

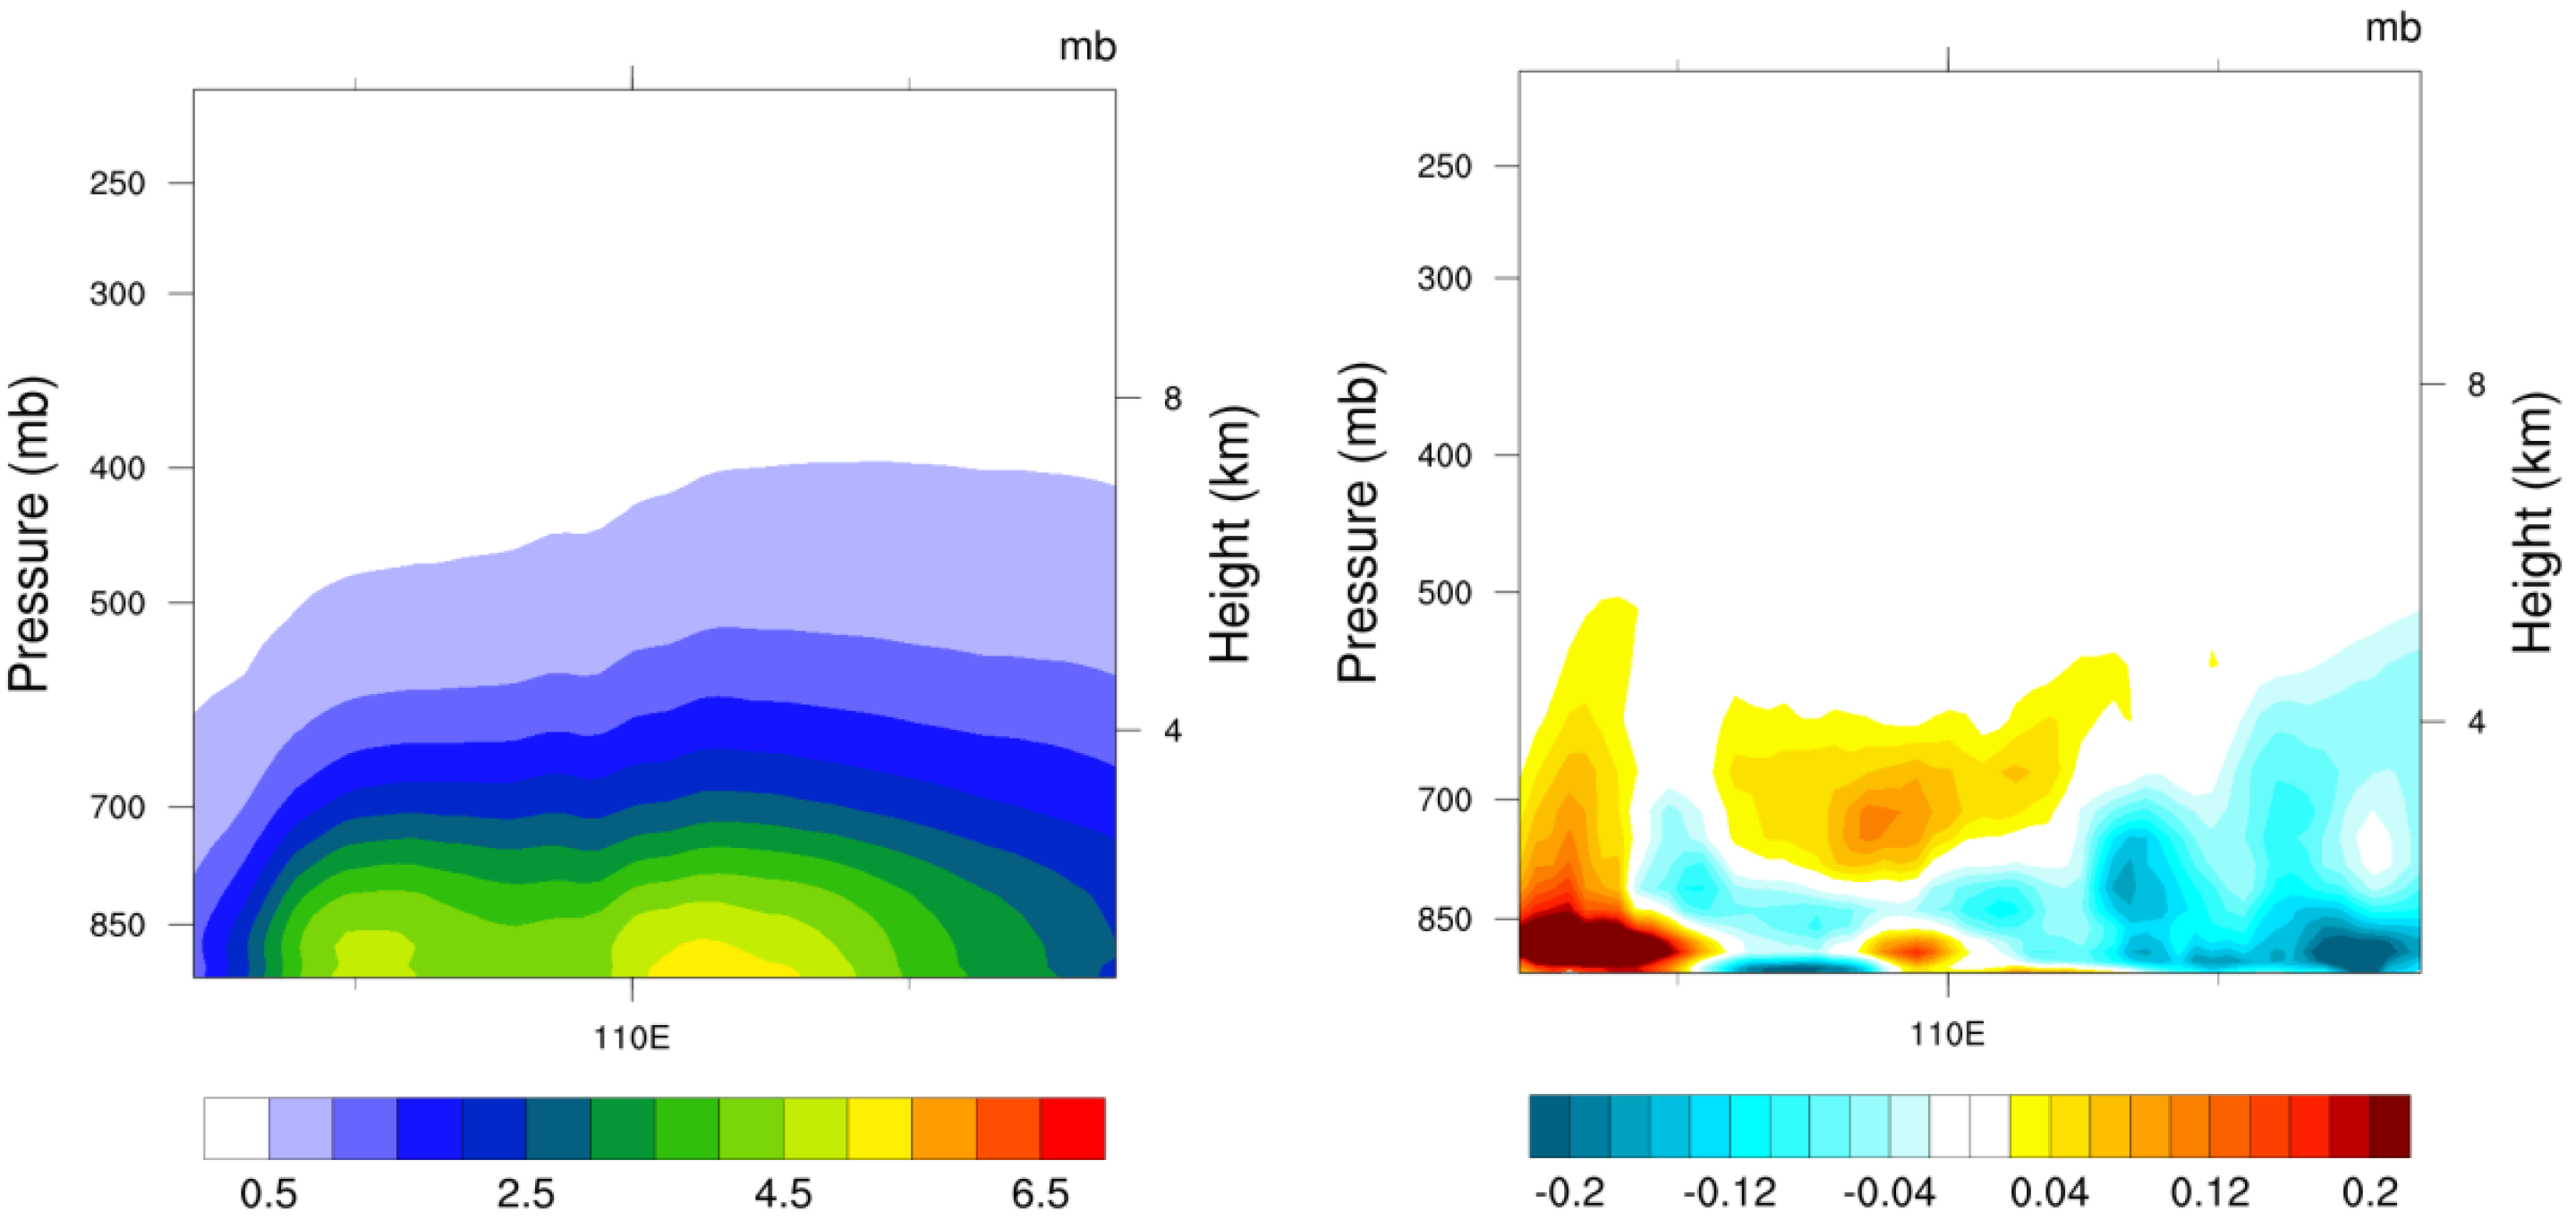
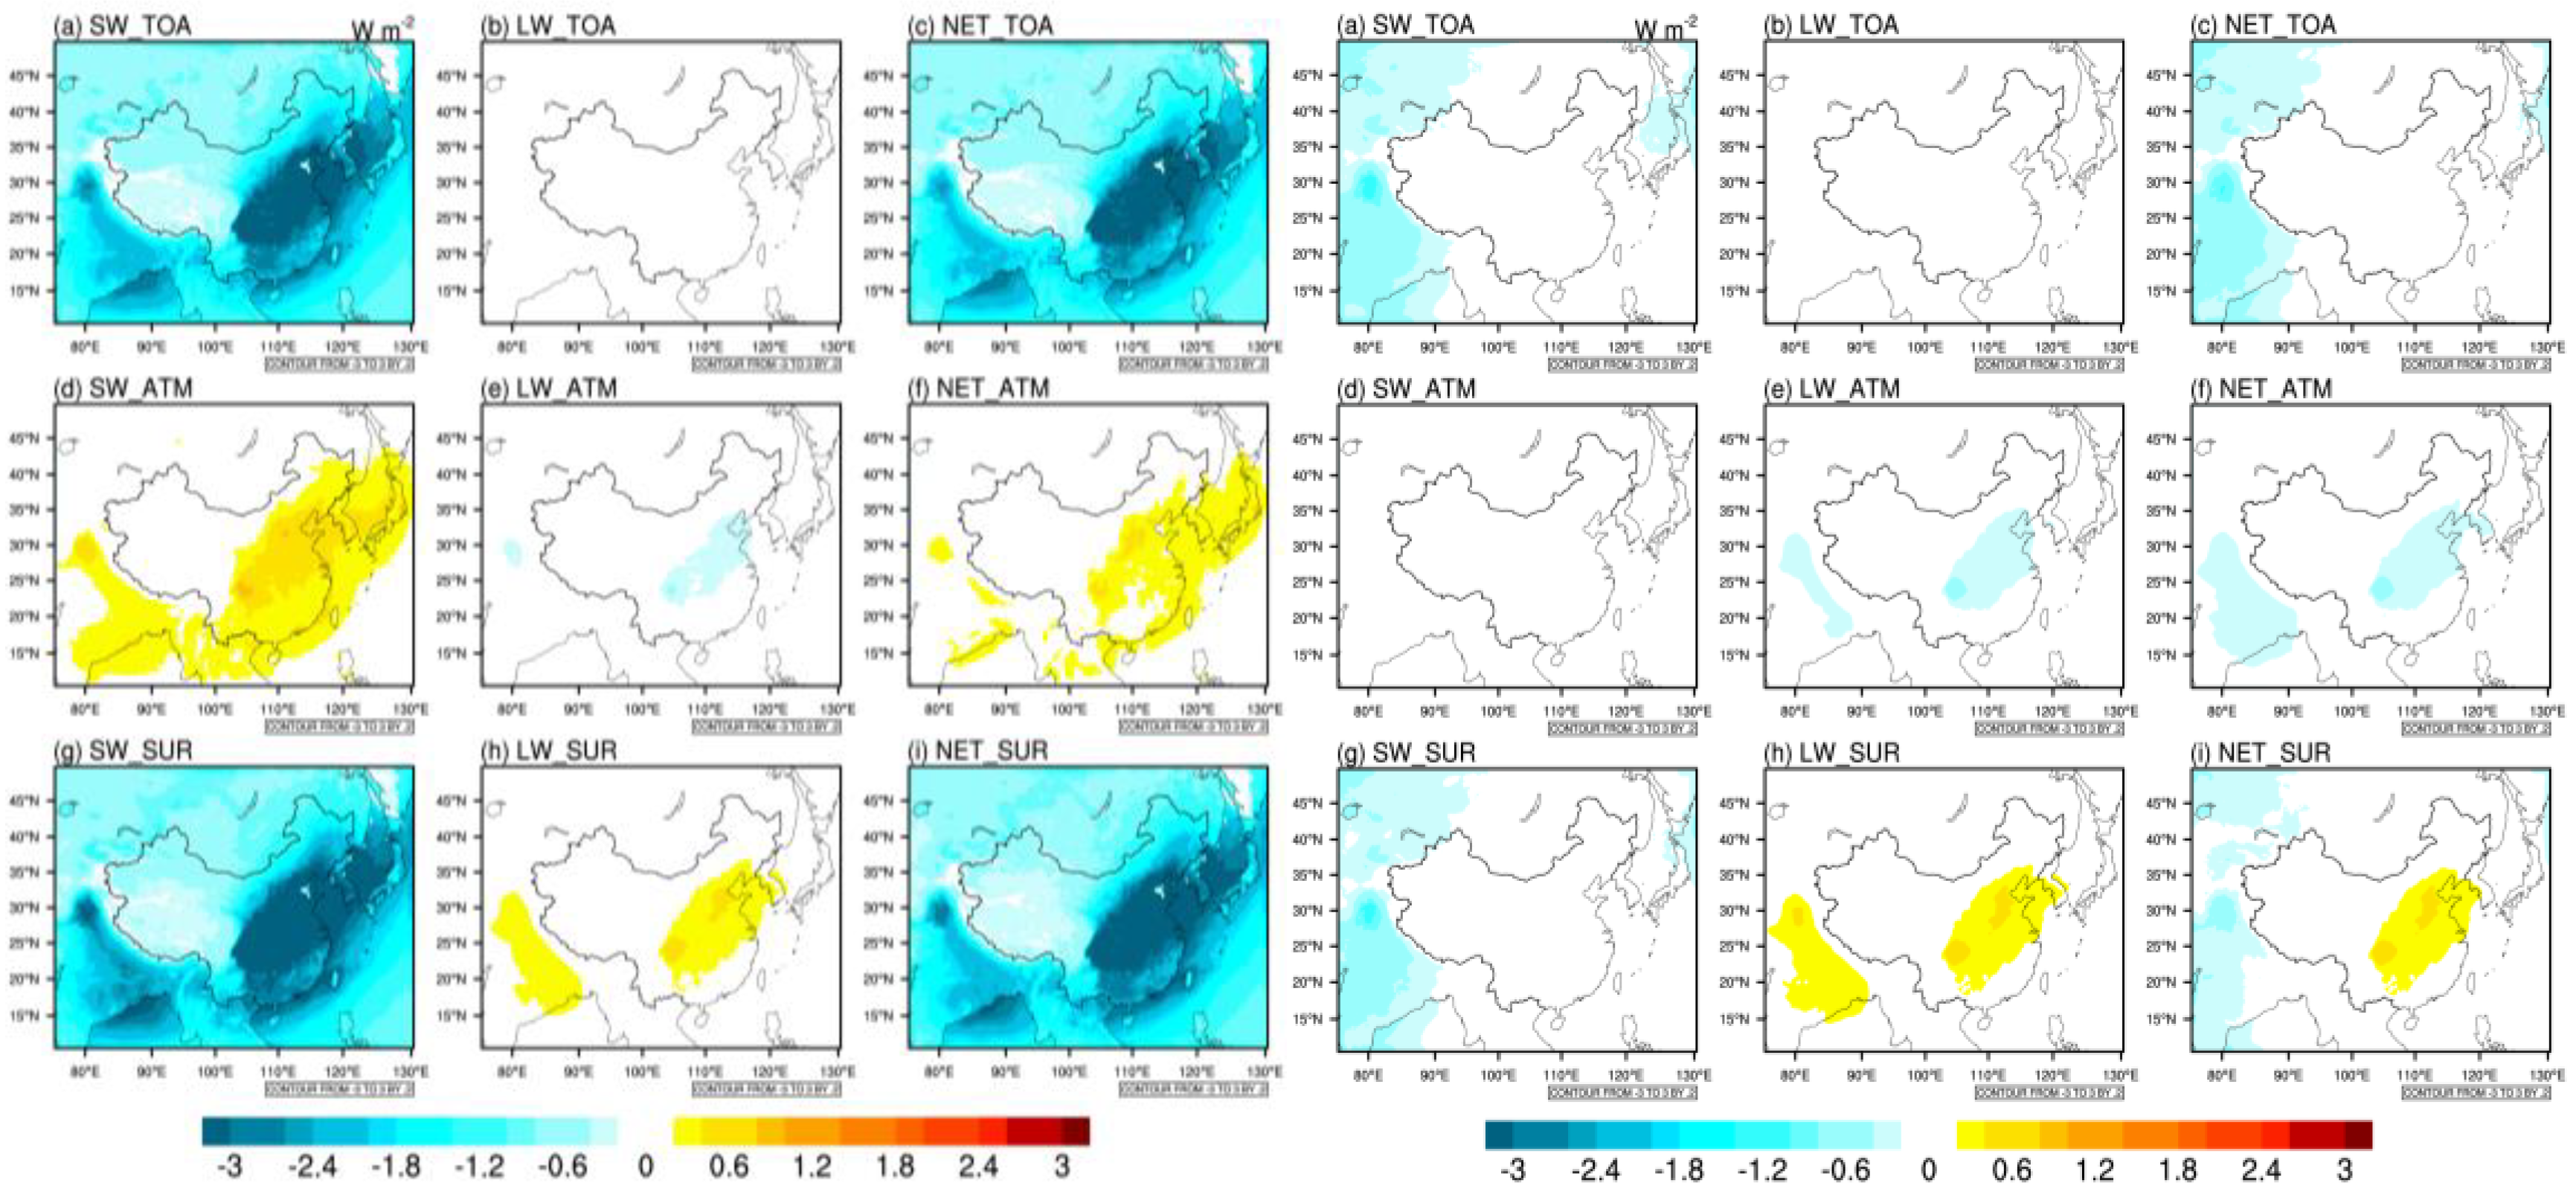
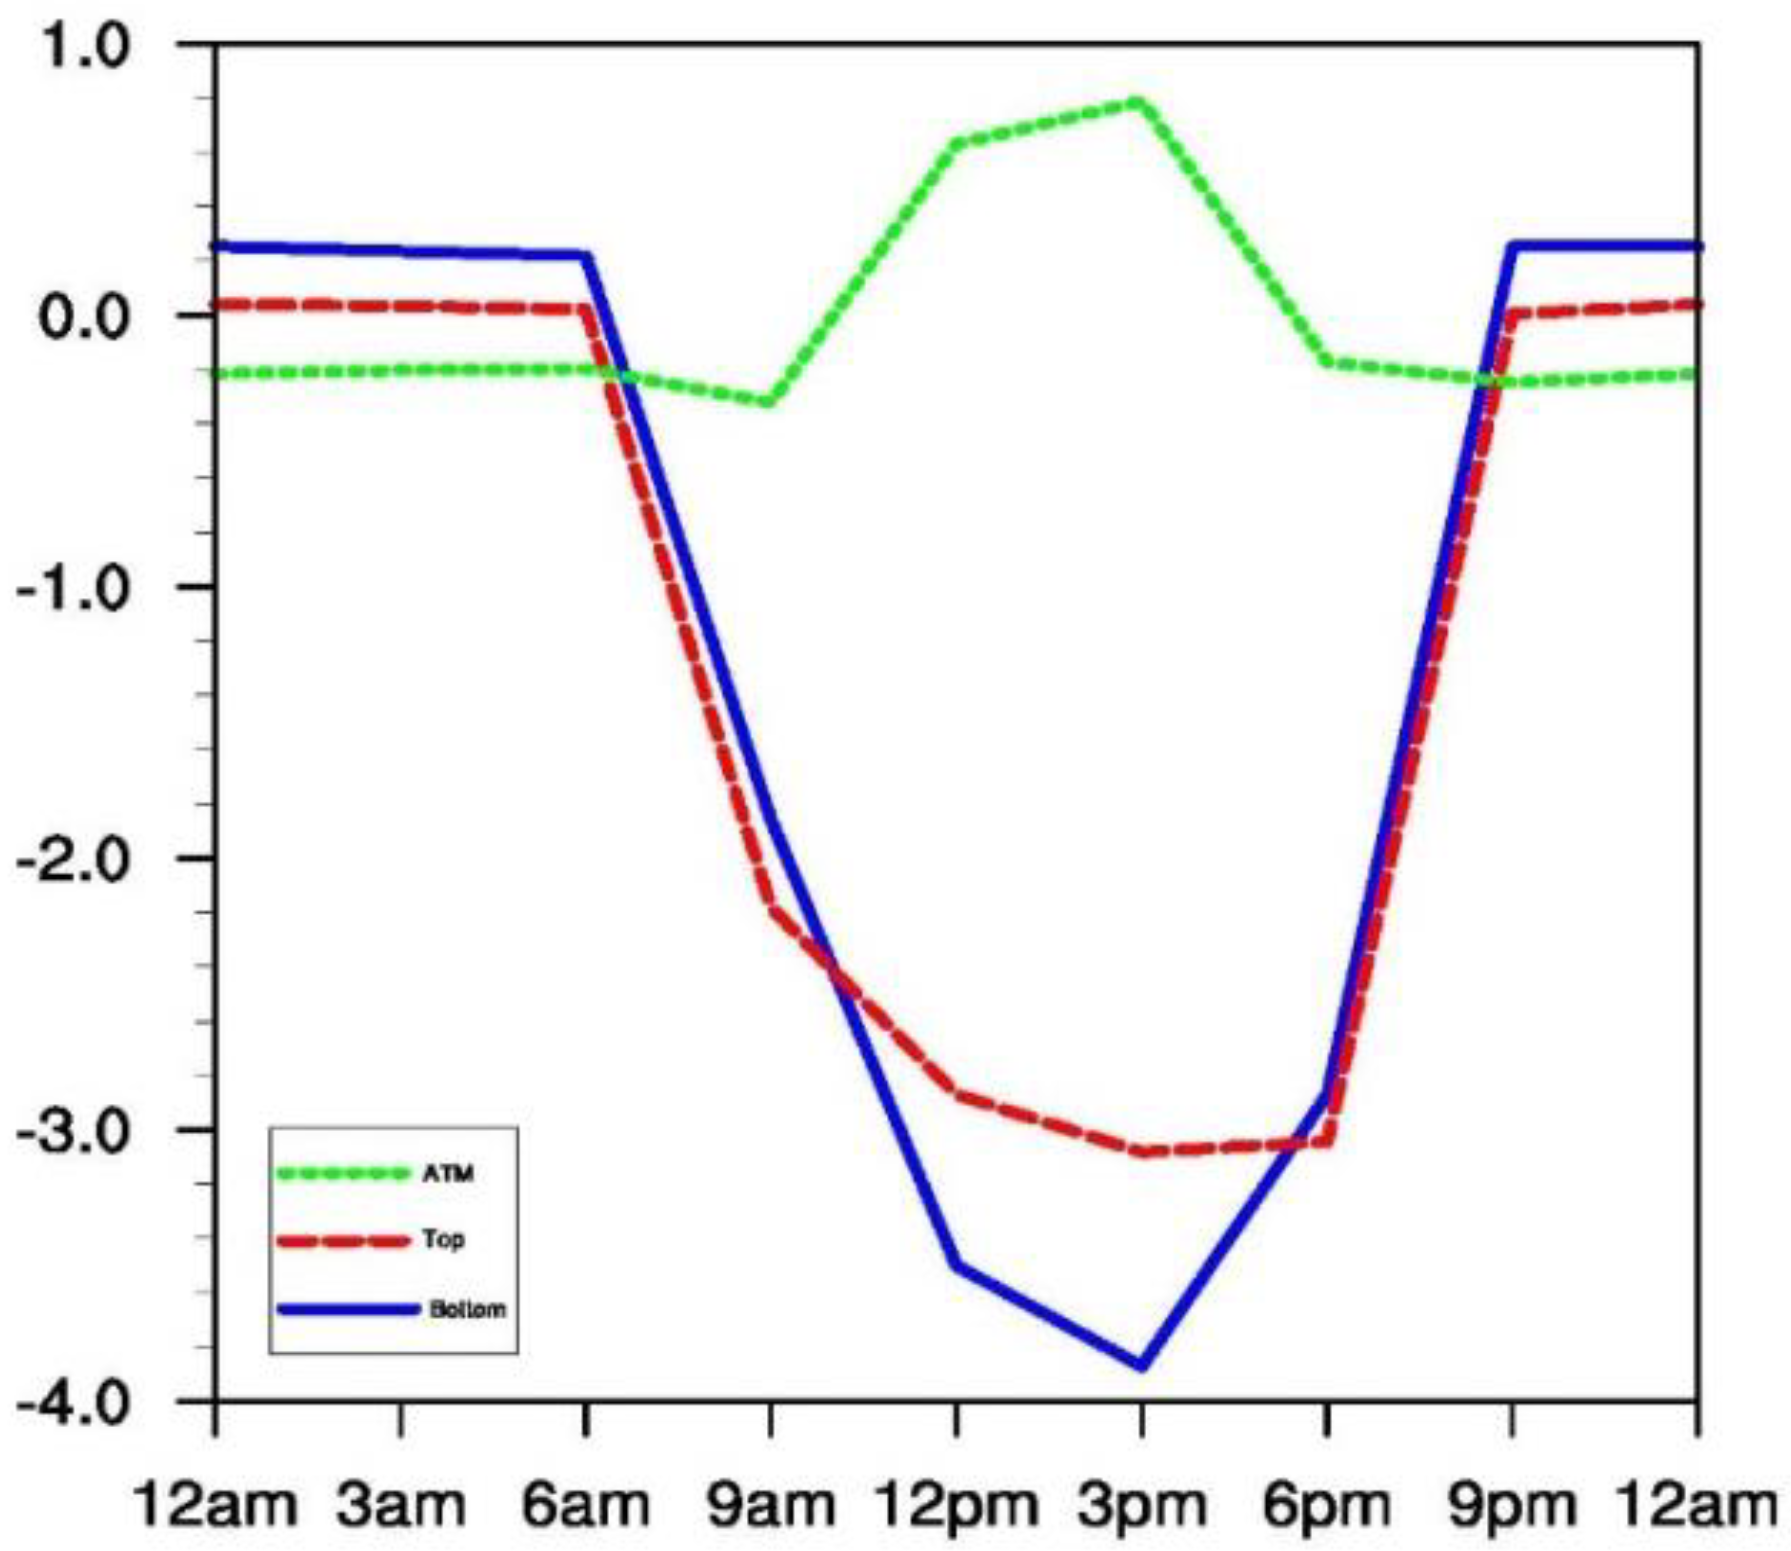
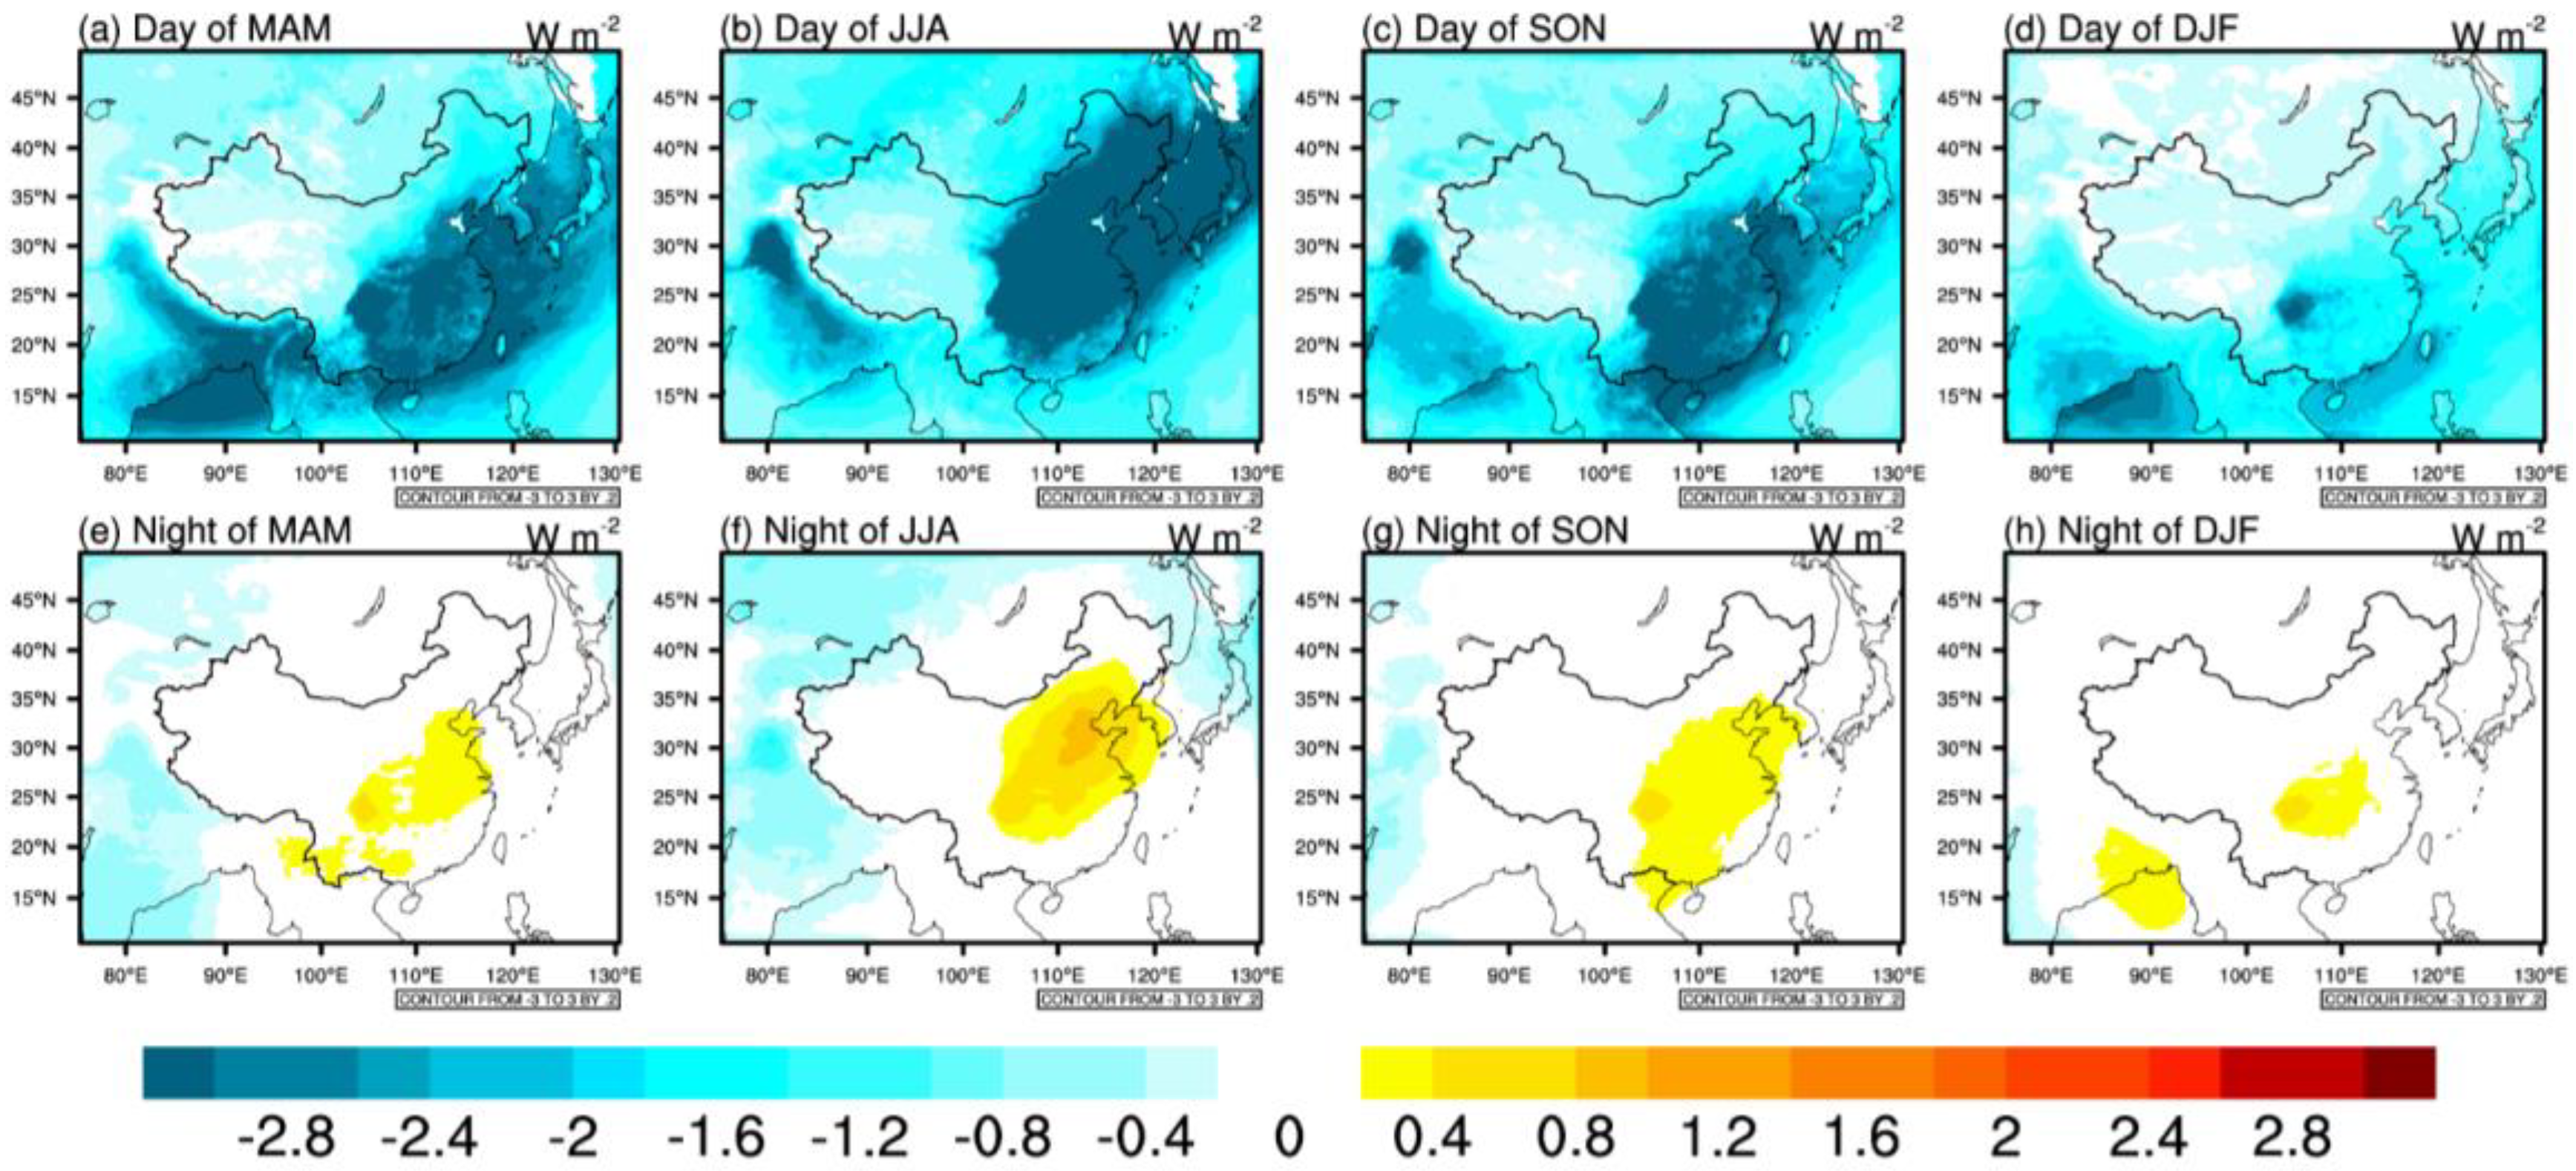
3.3. Sulfate Aerosol Direct Radiative Forcing

The direct radiative forcing induced by sulfate aerosols during the daytime and nighttime over East Asia is presented in Figure 11. The daytime shortwave direct radiative forcing of sulfate aerosols exhibited strong negative values at both top of the atmosphere (TOA) and surface, while the nighttime direct radiative forcing was approximately zero. In contrast, the longwave radiative forcing was positive during both the daytime and nighttime, with only slight differences in their spatial distributions. The spatial distributions of the sulfate aerosol radiative forcing showed a general increase from northeast to southwest. During the daytime, the annual mean value of the sulfate aerosol direct radiative forcing at surface over eastern China was −3.02 W m−2 (i.e., a cooling effect). However, it sharply increased (up to +0.24 W m−2) at night, owing to the lack of solar shortwave radiation. The effect of longwave radiative forcing was quite weak.
To summarize, the spatial distributions of sulfate aerosols during the daytime was similar to that of nighttime, but there was a large difference in radiative forcing in day and night. During the daytime, the radiative forcing that was induced by sulfate aerosols showed a strong cooling effect on surface temperatures, and a slight warming effect at night.
We further investigated diurnal variations of the sulfate aerosol direct radiative forcing, where the 24-h trends at TOA, surface, and atmosphere are shown in Figure 12. The magnitude of radiative forcing was approximately −2.79 W m−2 and +0.025 W m−2 at the top of the atmosphere during the daytime and nighttime, respectively. It was evident that the surface radiative forcing began to decline from about 6 a.m. and it reached the minimum value at 3 p.m. Then, it grew consistently until 9 p.m. and after that, the surface radiative forcing remained almost unchanged. The trend in radiative forcing at the TOA was similar to that at the surface. After sunrise, the sulfate aerosols began to scatter the solar shortwave radiation, causing an increase in the direct radiative forcing of sulfate aerosols, which then weakened when the solar shortwave radiation decreased in the afternoon and remained essentially constant during the nighttime. Consequently, the direct radiative forcing induced by sulfate aerosols had a strong cooling effect during daytime, but only subtle effects during nighttime, and there was even a slight warming effect at night over eastern China.
The value of sulfate aerosol direct radiative forcing over eastern China is displayed in Figure 13 and it exhibits significant seasonal variations with the maximum in summer, followed by spring and autumn, and the minimum in winter (approximately −5.67 W m−2, −2.64 W m−2, −2.49 W m−2 and −1.21 W m−2, respectively). According to Figure 13, those seasonal variations were consistent with changes in sulfate aerosol concentrations and AOD throughout the year. In addition, it also showed regional variations in the direct radiative forcing of sulfate aerosols, as well as their associated impact on surface temperature were slightly higher in southern regions than in northern regions, owing to the stronger solar radiation and elevated humidity in southern regions. Besides, the direct radiative forcing still showed large differences in the daytime and nighttime over East Asia, particularly in the Sichuan Basin. The nighttime direct radiative forcing of sulfate aerosols exhibited its maximum positive value, reaching approximately +0.39 W m−2 in summer over eastern China. Furthermore, temperature reduction that was caused by radiative forcing in eastern China was more significant than that in western China. In addition, the cooling effect in the Sichuan Basin was greater than that in other regions, in which the strongest effect was in summer and the weakest in winter.

4. Conclusions

In this study, the WRF-Chem model simulated the spatial and temporal distributions of sulfate aerosols and revealed the characteristics of radiative forcing between day and night in 2010 over East Asia.
Comparison of daily AOD at four sites from 1st January to 31st December in 2010 showed that the model could reproduce both the day-to-day variations in AOD and the features that wer observed at different sites (such as the highest AOD in Xianghe was related to its distance from SO2 emission sources). When compared with the spatial distributions of MODIS and MISR measurements, the model results agreed reasonably well with observations, indicating that the WRF-Chem model can capture the characteristics of AOD seasonal variations, with the highest in summer and the lowest in winter. However, compared with MODIS measurements, the model simulation underestimated AOD over eastern and southern China. While compared with MISR measurements, the model simulation overestimated AOD over China but underestimated it in northern India.
The spatial distributions of sulfate aerosols over East Asia showed significant regional variations, with the highest sulfate AOD observed over eastern China. The annual value of the sulfate AOD in Sichuan basin, which was the highest of any regions throughout the four seasons, exceeded 0.24, while the annual average AOD of the selected area (24–43° N, 101–126° E) was 0.09. The simulations also suggested that sulfate aerosols generally accumulated below 500 hPa, and concentrations then decreased with the increasing of altitude. Furthermore, the model results also showed that the concentrations of sulfate aerosols exhibited an inhomogeneous distribution across different seasons over eastern China during the daytime, with the value of 1.2 μg kg−1 in spring, 2.4 μg kg−1 in summer, 1.3 μg kg−1 in autumn, and 0.8 μg kg−1 in winter. In addition, the maximum concentrations of sulfate aerosols in summer probably resulted from the effects of the summer monsoon, atmospheric circulation, and the subtropical high. However, it should be noted that the concentrations of sulfate aerosols were effectively the same in the daytime and nighttime.
Furthermore, the direct radiative forcing of sulfate aerosols during the daytime ranged from −3 to 0 W m−2 at TOA, 0 to 0.6 W m−2 in atmosphere, and −3 to 0 W m−2 at surface. During the nighttime, the range was from −0.6 to 0 W m−2 at TOA, −0.6 to 0 W m−2 in atmosphere, and −0.6 to 0.6 W m−2 at the surface. It can be seen that the direct radiative forcing of sulfate aerosols was determined mainly by shortwave radiation, which resulted in a significant difference in the daytime and nighttime. Comparison of the radiative forcing among different seasons showed that the direct radiative forcing of sulfate aerosols over eastern China was negative during the day, with values of approximately −2.49 W m−2 in spring, −5.67 W m−2 in summer, −2.64 W m−2 in autumn, and −1.21 W m−2 in winter. During the nighttime, the direct radiative forcing was +0.18 W m−2, +0.39 W m−2, +0.23 W m−2, and +0.14 W m−2, from spring to winter. The asymmetric effects of direct radiative forcing on temperature cannot be ignored, especially in summer.
As a final remark, due to the indirect radiative forcing of sulfate aerosols, the complexity of the processes involved and the challenging nature of the measurements required, there remain many unknowns and uncertainties regarding the climatic effects of sulfate aerosols. We would further investigate the features of the long-time trend of sulfate aerosols and its indirect radiative forcing impacts, as well as additionally use the WRF-Chem model to investigate their divergences based on sensitivity experiments in the future. Moreover, continual development of theoretical research and better use of observations to constrain climate models are essential for reducing uncertainty in model simulations and improving the reliability of future projections of climate change.

Author Contributions

Conceptualization, S.C.; Methodology, S.C. and J.L.; Software, H.Z. and D.W.; Validation, H.Z., N.J., X.W., Y.L., and X.Z.; Formal Analysis, H.Z., N.J., Z.Z., D.Z., and T.Y.

Funding

This research is funded by the Foundation for National Natural Science Foundation of China (No. 41775003), Innovative Research Groups of the National Science Foundation of China (Grant No. 41521004), and the Foundation of Key Laboratory for Semi-Arid Climate Change of the Ministry of Education in Lanzhou University, the Strategic and Special Frontier Project of Science and Technology of the Chinese Academy of Sciences (Grant No. XDA05080800), the National Natural Science Foundation of China (Grant Nos. 41371209 and 41420104002), the Special Research Fund for the Doctoral Program of Higher Education of China (Grant No. 20133207110015), The Natural Science Foundation of the Jiangsu Higher Education Institutions of China (Grant No. 14KJA170002), and The Priority Academic Program Development of the Jiangsu Higher Education Institutions (Grant No. 164320H101).

Conflicts of Interest

The authors declare no conflict of interest.

References

  1. Shi, G.; Wang, B.; Zhang, H.; Zhao, J.; Tan, S. The radiative and climatic effects of atmospheric aerosols. Chin. J. Atmos. Sci. 2008, 32, 826–840. [Google Scholar]
  2. Chen, S.; Huang, J.; Li, J.; Jia, R.; Jiang, N.; Kang, L.; Ma, X.; Xie, T. Comparison of dust emissions, transport, and deposition between the Taklimakan Desert and Gobi Desert from 2007 to 2011. Sci. China Earth Sci. 2017, 60, 1338–1355. [Google Scholar] [CrossRef]
  3. Chen, S.Y.; Jiang, N.X.; Huang, J.P.; Xu, X.G.; Zhang, H.W.; Zang, Z.; Huang, K.N.; Xu, X.C.; Wei, Y.; Guan, X.D.; et al. Quantifying contributions of natural and anthropogenic dust emission from different climatic regions. Atmos. Environ. 2018, 191, 94–104. [Google Scholar] [CrossRef]
  4. Zhang, X.Y. Aerosol over china and their climate effect. Adv. Earth Sci. 2007, 22, 12–16. [Google Scholar]
  5. Yang, Y.; Wang, H.; Smith, S.J.; Zhang, R.; Lou, S.; Yun, Q.; Ma, P.L.; Rasch, P.J. Recent intensification of winter haze in China linked to foreign emissions and meteorology. Sci. Rep. 2018, 8, 2107. [Google Scholar] [CrossRef] [PubMed]
  6. Charlson, R.J.; Hofmann, D.J. Climate forcing by anthropogenic aerosols. Science 1992, 255, 423. [Google Scholar] [CrossRef] [PubMed]
  7. Hansen, J.; Sato, M.; Ruedy, R. Radiative forcing and climate response. J. Geophys. Res. 1997, 102, 6831–6864. [Google Scholar] [CrossRef] [Green Version]
  8. Wang, X.; Huang, J.; Ji, M.; Higuchi, K. Variability of East Asia dust events and their long-term trend. Atmos. Environ. 2008, 42, 3156–3165. [Google Scholar] [CrossRef]
  9. Stocker, T.F.; Qin, D.; Plattner, G.K.; Tignor, M.; Allen, S.K.; Boschung, J.; Nauels, A.; Xia, Y.; Bex, B.; Midgley, B.M.; et al. Climate Change 2013: The Physical Science Basis. Contribution of Working Group I to the Fifth Assessment Report of the Intergovernmental Panel on Climate Change. Computat. Geom. 2013, 18, 95–123. [Google Scholar]
  10. Wang, X.; Shi, G. A Numerical Study on Temporal and Spatial Variations of Anthropogenic Sulfate Column Burden over Eastern Asia. Clim. Environm. Res. 2000, 1, 10. [Google Scholar]
  11. Jones, A.; Roberts, D.L.; Slingo, A. A climate model study of indirect radiative forcing by anthropogenic sulphate aerosols. Nature 1994, 370, 450–453. [Google Scholar] [CrossRef]
  12. Zhang, T.; Wang, Y.; Cheng, B. Long-term variation of aerosol optical depth over Sichuan Basin of China during 1961–2013 and its relationship with temperature. Acta Sci. Circumst. 2017, 37, 793–802. [Google Scholar]
  13. Sun, W.; Liu, J.; Wang, Z. Simulation of centennial-scale drought events over eastern china during the past 1500 years. J. Meteorol. Res. 2017, 31, 17–27. [Google Scholar] [CrossRef]
  14. Weiyi, S.; Jian, L. A “La Niña-like” state occurring in the second year after tropical volcanic eruptions during the 1500 years. Clim. Dyn. 2018. [Google Scholar] [CrossRef]
  15. Lou, S.; Russell, L.M.; Yang, Y.; Xu, L.; Lamjiri, M.A.; DeFlorio, M.J.; Miller, A.J.; Ghan, S.J.; Liu, Y.; Singh, B. Impacts of the East Asian Monsoon on springtime dust concentrations over China. J. Geophys. Res. Atmos. 2016, 121, 8137–8152. [Google Scholar] [CrossRef]
  16. Stone, D.; Weaver, A. Factors contributing to diurnal temperature range trends in twentieth and twenty-first century simulations of the CCCMA coupled model. Clim. Dyn. 2003, 20, 435–445. [Google Scholar] [CrossRef]
  17. Yang, Y.; Russell, L.M.; Lou, S.; Liao, H.; Guo, J.; Liu, Y.; Singh, B.; Ghan, S.J. Dust-wind interactions can intensify aerosol pollution over eastern China. Nat. Commun. 2017, 8, 15333. [Google Scholar] [CrossRef] [PubMed]
  18. Lou, S.; Russell, L.M.; Yang, Y.; Liu, Y.; Singh, B.; Ghan, S.J. Impacts of interactive dust and its direct radiative forcing on interannual variations of temperature and precipitation in winter over East Asia. J. Geophys. Res. Atmos. 2017, 122, 8761–8780. [Google Scholar] [CrossRef]
  19. Hu, R.; Shi, G. The radiative forcing and climate effect due to anthropogenic sulfate aerosols over china. Sci. Atmos. Sin. 1998, 22, 919–925. [Google Scholar]
  20. Qian, Y.; Congbin, F.U. Sulfur dioxide emissions, sulfate aerosol and climate change. Adv. Earthences 1997, 12, 440–446. [Google Scholar]
  21. Penner, J.E.; Hales, J.M.; Laulainen, N.S.; Travis, L.; Leifer, R.; Novakov, T.; Ogren, J.A.; Radke, L.F.; Schwartz, S.E.; Travis, L. Quantifying and minimizing uncertainty of climate forcing by anthropogenic aerosols. Bull. Am. Meteorol. Soc. 1993, 75, 375–400. [Google Scholar] [CrossRef]
  22. Zhang, Q.; Streets, D.G.; Carmichael, G.R.; He, K.B.; Huo, H.; Kannari, A.; Klimont, Z.; Park, I.S.; Reddy, S.; Fu, J.S.; et al. Asian emissions in 2006 for the nasa intex-b mission. Atmos. Chem. Phys. 2009, 9, 5131–5153. [Google Scholar] [CrossRef] [Green Version]
  23. Qian, Y.; Giorgi, F. Interactive coupling of regional climate and sulfate aerosol models over eastern Asia. J. Geophys. Res. Atmos. 1999, 104, 6477–6499. [Google Scholar] [CrossRef] [Green Version]
  24. Charlson, R.J.; Langner, J.; Rodhe, H.; Leovy, C.B.; Warren, S.G. Perturbation of the northern hemisphere radiative balance by backscattering from anthropogenic sulfate aerosols. Tellus 1991, 43, 152–163. [Google Scholar]
  25. Charlson, R.J.; Lovelock, J.E.; Andreae, M.O.; Warren, S.G. Sulphate aerosols and climate. Nature 1989, 340, 437–438. [Google Scholar] [CrossRef]
  26. Kiehl, J.T.; Briegleb, B.P. The relative roles of sulfate aerosols and greenhouse gases in climate forcing. Science 1993, 260, 311–314. [Google Scholar] [CrossRef] [PubMed]
  27. Wang, X.; Shi, G. Estimation of the Direct Radiative Forcing Due to Anthropogenic Sulfate over Eastern Asia. Plateau Meteorol. 2001, 20, 258–263. [Google Scholar]
  28. Haywood, J.M.; Shine, K.P. The effect of anthropogenic sulfate and soot aerosol on the clear sky planetary radiation budget. Geophys. Res. Lett. 1995, 22, 603–606. [Google Scholar] [CrossRef]
  29. Theodore, J. Climate Change 2001; Cambridge University Press: Cambridge, UK, 2001. [Google Scholar]
  30. Zhao, C.; Chen, S.; Leung, L.R.; Qian, Y.; Kok, J.; Zaveri, R.; Huang, J. Uncertainty in modeling dust mass balance and radiative forcing from size parameterization. Atmos. Chem. Phys. 2013, 13, 10733–10753. [Google Scholar] [CrossRef] [Green Version]
  31. Jian, W.U.; Luo, Y.; Wang, W.G. The comparison of different simulation methods for the climate responses of the radiative forcing of anthropogenic sulfate aerosol over East Asia. J. Yunnan Univ. 2005, 27, 323–331. [Google Scholar]
  32. Jian-Dong, L.I.; Mao, J.Y.; Wang, W.C. Anthropogenic Eastern Asian radiative forcing due to sulfate and black carbon aerosols and their time evolution estimated by an AGCM. Chin. J. Geophys. 2015, 58, 1103–1120. [Google Scholar]
  33. Luo, Y.F.; Zhou, X.J.; Li, W.L. Advances in the study of atmospheric aerosol radiative forcing and climate change. Adv. Earthences 1998, 13, 572–581. [Google Scholar]
  34. Nemesure, S.; Wagener, R.; Schwartz, S.E. Direct shortwave forcing of climate by the anthropogenic sulfate aerosol: Sensitivity to particle size, composition, and relative humidity. J. Geophys. Res. Atmos. 1995, 100, 26105–26116. [Google Scholar] [CrossRef]
  35. Yang, L.I.; Song, J.; Sun, L. A numerical study of sulfate aerosol direct effect and its impact on the East Asia climate. J. Meteorol. Res. Appl. 2015, 36, 13–21. [Google Scholar]
  36. Yin, Y.; Cui, Z.L.; Zhang, H.; Xin, J.Y.; Wang, L.L. Numerical Simulations of Mass Distribution of Aerosols over China in 2006. Trans. Atmos. Sci. 2009, 32, 595–603. [Google Scholar]
  37. Zhang, L.; Shi, G. The Simulation and Estimation of Radiative Properties and Radiative Forcing due to Sulfate and Soot Aerosols. Chin. J. Atmos. Sci. 2001, 25, 231–242. [Google Scholar]
  38. Houghton, J.T.; Filho, M.L.G.; Bruce, J.; Lee, H.; Callander, B.A.; Haites, E.; Harris, N.; Maskell, K. Climate Change 1994: Radiative Forcing of Climate Change and an Evaluation of the IPCC IS92 Emissions Scenarios; Cambridge University Press: Cambridge, UK, 1995. [Google Scholar]
  39. Chen, S.; Huang, J.; Zhao, C.; Qian, Y.; Leung, L.R.; Yang, B. Modeling the transport and radiative forcing of Taklimakan dust over the Tibetan Plateau: A case study in the summer of 2006. J. Geophys. Res. Atmos. 2013, 118, 797–812. [Google Scholar] [CrossRef]
  40. Chen, S.; Zhao, C.; Qian, Y.; Leung, L.R.; Huang, J.; Huang, Z.; Bi, J.; Zhang, W.; Shi, J.; Yang, L. Regional modeling of dust mass balance and radiative forcing over East Asia using WRF-Chem. Aeolian Res. 2014, 15, 15–30. [Google Scholar] [CrossRef]
  41. Chen, S.; Huang, J.; Kang, L.; Wang, H.; Ma, X.; He, Y.; Yuan, T.; Yang, B.; Huang, Z.; Zhang, G. Emission, transport, and radiative effects of mineral dust from the Taklimakan and Gobi deserts: Comparison of measurements and model results. Atmos. Chem. Phys. 2017, 17, 1–43. [Google Scholar] [CrossRef]
  42. Grell, G.A.; Schmitz, P.R.; Mckeen, S.A.; Frost, G.; Skamarock, W.C.; Eder, B. Fully coupled ‘online’ chemistry within the WRF model. Atmos. Environ. 2005, 39, 6957–6975. [Google Scholar] [CrossRef]
  43. Fast, J.D., Jr.; Easter, R.C.; Zaveri, R.A.; Barnard, J.C.; Chapman, E.G.; Grell, G.A.; Peckham, S.E. Evolution of ozone, particulates, and aerosol direct radiative forcing in the vicinity of Houston using a fully coupled meteorology-chemistry-aerosol model. J. Geophys. Res. Atmos. 2006, 111, 5173–5182. [Google Scholar] [CrossRef]
  44. Wexler, A.S.; Lurman, F.W.; Seinfeld, J.H. Modeling urban and regional aerosols, I. Model development. Atmos. Environ. 1994, 28, 531–546. [Google Scholar] [CrossRef]
  45. Ackermann, I.J.; Hass, H.; Memmesheimer, M.; Ebel, A.; Binkowski, F.S.; Shankar, U. Modal aerosol dynamics model for Europe: Development and first applications. Atmos. Environ. 1998, 32, 2981–2999. [Google Scholar] [CrossRef]
  46. Schell, B.; Ackermann, I.J.; Hass, H.; Binkowski, F.S.; Ebel, A. Modeling the formation of secondary organic aerosol within a comprehensive air quality model system. J. Geophys. Res. Atmos. 2001, 106, 28275–28293. [Google Scholar] [CrossRef] [Green Version]
  47. Stockwell, W.R.; Middleton, P.; Chang, J.S.; Tang, X. The second generation regional acid deposition model chemical mechanism for regional air quality modeling. J. Geophys. Res. Atmos. 1990, 95, 16343–16367. [Google Scholar] [CrossRef]
  48. Stockwell, W.R.; Calvert, J.G. The mechanism of the HO-SO2 reaction. Atmos. Environ. 1983, 17, 2231–2235. [Google Scholar] [CrossRef]
  49. Margitan, J.J. Cheminform abstract: Mechanism of the atmospheric oxidation of sulfur dioxide. catalysis by hydroxyl radicals. J. Phys. Chem. 1984, 88, 129–130. [Google Scholar] [CrossRef]
  50. Meagher, J.F.; Olszyna, K.J.; Luria, M. The effect of SO2 gas phase oxidation on hydroxyl smog chemistry. Atmos. Environ. 1984, 18, 2095–2104. [Google Scholar] [CrossRef]
  51. Gleason, J.F.; Sinha, A.; Howard, C.J. Kinetics of the gas-phase reaction HOSO2 + O2 -> HO2 + SO3. J. Phys. Chem. 1987, 91, 719–724. [Google Scholar] [CrossRef]
  52. Stauffer, D.R.; Seaman, N.L. Use of Four-Dimensional Data Assimilation in a Limited-Area Mesoscale Model. Part I: Experiments with Synoptic-Scale Data. Mon. Weather Rev. 1990, 118, 1250–1277. [Google Scholar] [CrossRef] [Green Version]
  53. Hong, S.Y.; Noh, Y.; Dudhia, J. A New Vertical Diffusion Package with an Explicit Treatment of Entrainment Processes. Mon. Weather Rev. 2006, 134, 2318. [Google Scholar] [CrossRef]
  54. Chen, F.; Dudhia, J. Coupling an Advanced Land Surface Hydrology Model with the Penn State NCAR MM5 Modeling System. Part I: Model Implementation and Sensitivity. Mon. Weather Rev. 2001, 129, 569–585. [Google Scholar] [CrossRef]
  55. Morrison, H.; Curry, J.A.; Khvorostyanov, V.I. A New Double-Moment Microphysics Parameterization for Application in Cloud and Climate Models. Part I: Description. J. Atmos. Sci. 2005, 62, 1665–1677. [Google Scholar] [CrossRef]
  56. Kain, J.S. The Kain Fritsch Convective Parameterization: An Update. J. Appl. Meteorol. 2004, 43, 170–181. [Google Scholar] [CrossRef]
  57. Zhao, C.; Liu, X.; Leung, L.R.; Johnson, B.; McFarlane, S.A.; Gustafson, W.I.; Fast, J.D.; Easter, R. The spatial distribution of mineral dust and its shortwave radiative forcing over North Africa: Modeling sensitivities to dust emissions and aerosol size treatments. Atmos. Chem. Phys. 2010, 10, 8821–8838. [Google Scholar] [CrossRef]
  58. Carmichael, G.R.; Sakurai, T.; Streets, D.; Hozumi, Y.; Ueda, H.; Park, S.U. Mics-ASIA II: The model intercomparison study for Asia Phase II methodology and overview of findings. Atmos. Environ. 2008, 42, 3468–3490. [Google Scholar] [CrossRef]
  59. Chen, S.; Huang, J.; Qian, Y.; Ge, J.; Su, J. Effects of aerosols on autumn precipitation over mid-eastern China. J. Trop. Meteorol. 2014, 20, 242–250. [Google Scholar]
  60. Holben, B.N.; Eck, T.F.; Slutsker, I.; Tanré, D.; Buis, J.P.; Setzer, A.; Vermote, E.; Reagan, J.A.; Kaufman, Y.J.; Nakajima, T. AERONET—A Federated Instrument Network and Data Archive for Aerosol Characterization. Remote Sens. Environ. 1998, 66, 1–16. [Google Scholar] [CrossRef] [Green Version]
  61. Holben, B.N.; Tanré, D.; Smirnov, A.; Eck, T.F.; Slutsker, I.; Abuhassan, N.; Newcomb, W.W.; Schafer, J.S.; Chatenet, B.; Lavenu, F. An emerging ground-based aerosol climatology: Aerosol optical depth from AERONET. J. Geophys. Res. Atmos. 2001, 106, 12067–12097. [Google Scholar] [CrossRef] [Green Version]
  62. Kaufman, Y.J.; Tanré, D.; Remer, L.A.; Vermote, E.F.; Chu, A.; Holben, B.N. Operational remote sensing of tropospheric aerosol over land from EOS moderate resolution imaging spectroradiometer. J. Geophys. Res. Atmos. 1997, 102, 17051–17067. [Google Scholar] [CrossRef] [Green Version]
  63. Remer, L.A.; Kaufman, Y.J.; Tanré, D.; Mattoo, S.; Chu, D.A.; Martins, J.V.; Li, R.R.; Ichoku, C.; Levy, R.C.; Kleidman, R.G. The MODIS Aerosol Algorithm, Products, and Validation. J. Atmos. Sci. 2005, 62, 947–973. [Google Scholar] [CrossRef] [Green Version]
  64. Kahn, R.; Banerjee, P.; Mcdonald, D. Sensitivity of multiangle imaging to natural mixtures of aerosols over ocean. J. Geophys. Res. Atmos. 2001, 106, 18219–18238. [Google Scholar] [CrossRef] [Green Version]
  65. Kahn, R.A.; Li, W.H.; Moroney, C.; Diner, D.J.; Martonchik, J.V.; Fishbein, E. Aerosol source plume physical characteristics from space-based multiangle imaging. J. Geophys. Res. Atmos. 2007, 112, 236–242. [Google Scholar] [CrossRef]
  66. Kahn, R.; Banerjee, P.; Mcdonald, D.; Diner, D.J. Sensitivity of Multiangle imaging to Aerosol Optical Depth, and to Pure-Particle Size Distribution and Composition Over Ocean. J. Geophys. Res. Atmos. 1998, 103, 32195–32213. [Google Scholar] [CrossRef]
  67. Zhang, J.; Christopher, S.A. Longwave radiative forcing of Saharan dust aerosols estimated from MODIS, MISR, and CERES observations on Terra. Geophys. Res. Lett. 2003, 30, 343–354. [Google Scholar] [CrossRef]
  68. Kim, D.; Ramanathan, V. Solar radiation budget and radiative forcing due to aerosols and clouds. J. Geophys. Res. Atmos. 2008, 113, 194–204. [Google Scholar] [CrossRef]
  69. Chen, Y.; Li, Q.; Kahn, R.A.; Rerson, J.T.; Diner, D.J. Quantifying aerosol direct radiative effect with Multiangle Imaging Spectroradiometer observations: Top-of-atmosphere albedo change by aerosols based on land surface types. J. Geophys. Res. Atmos. 2009, 114, 356–360. [Google Scholar] [CrossRef]
  70. Diner, D.J.; Abdou, W.A.; Bruegge, C.J.; Conel, J.E.; Crean, K.A.; Gaitley, B.J.; Helmlinger, M.C.; Kahn, R.A.; Martonchik, J.V.; Pilorz, S.H. MISR aerosol optical depth retrievals over southern Africa during the SAFARI-2000 Dry Season Campaign. Geophys. Res. Lett. 2001, 28, 3127–3130. [Google Scholar] [CrossRef] [Green Version]
  71. Martonchik, J.V.; Diner, D.J.; Kahn, R.; Gaitley, B.; Holben, B.N. Comparison of MISR and AERONET aerosol optical depths over desert sites. Geophys. Res. Lett. 2004, 31, 171–184. [Google Scholar] [CrossRef]
  72. Christopher, S.A.; Wang, J. Intercomparison between MISR and Sunphotometer AOT in dust source regions over China: Implication for satellite retrievals and radiative forcing calculations. Tellus Seri. B-Chem. Phys. Meteorol. 2004, 56, 451–456. [Google Scholar] [CrossRef]
  73. Gao, Y.; Zhao, C.; Liu, X.; Zhang, M.; Leung, L.R. WRF-Chem simulations of aerosols and anthropogenic aerosol radiative forcing in East Asia. Atmos. Environ. 2014, 92, 250–266. [Google Scholar] [CrossRef]
  74. Jiang, H.; Liao, H.; Pye, H.O.T.; Wu, S. Projected effect of 2000–2050 changes in climate and emissions on aerosol levels in China and associated transboundary transport. Atmos. Chem. Phys. 2013, 13, 7937–7960. [Google Scholar] [CrossRef]
  75. Wang, T.J.; Min, J.Z.; Sun, Z.B.; Li, Z.K.; Jin, L.S. Characteristics of sulphate aerosol distribution in China. Clim. Environ. Res. 2000, 2, 7. [Google Scholar]
  76. Gao, L.J.; Wang, T.J.; Xu, Y.F.; Min, J.Z. Modeling Sulfate Aerosol and Its Radiative Forcing over China. Plateau Meteorol. 2004, 23, 612–619. [Google Scholar]
  77. Ma, X.; Shi, G.; Guo, Y.; Zhang, L. Simulation of Radiative Forcing by Sulfate Aerosols. Clim. Environ. Res. 2004, 9, 454–464. [Google Scholar]
Figure 1. Daily aerosol optical depth (AOD) from the Aerosol Robotic Network (AERONET) measurements (black dots) at 500 nm and the total AOD (red) and sulfate AOD (green) at 500 nm from Weather Research and Forecasting model coupled with Chemistry (WRF-Chem) simulations during the simulation period at four sites over East Asia in 2010.
Atmosphere 09 00441 g001
Figure 2. Seasonal average AOD at 550 nm over East Asia in 2010 from WRF-Chem simulations (top), and from Multi-angle Imaging SpectroRadiometer (MISR) (middle) and Moderate Resolution Imaging Spectroradiometer (MODIS) (bottom) retrievals.
Atmosphere 09 00441 g002
Figure 3. Locations of surface observations sites.
Atmosphere 09 00441 g003
Figure 4. Comparisons between simulated sulfate aerosol seasonal average concentrations from Weather Research and Forecasting model coupled with Chemistry (WRF-Chem) (μg kg−1) with that of surface observations (μg m−3) (the dashed lines indicate 2:1, 1:1, and 1:2 relationships from top to bottom, respectively).
Atmosphere 09 00441 g004
Figure 5. Spatial distribution of annual average sulfate AOD over East Asia in 2010, based on the WRF-Chem model.
Atmosphere 09 00441 g005
Figure 6. Seasonal and annual average sulfate AOD in 2010 over eastern China (24–43° N, 101–126° E).
Atmosphere 09 00441 g006
Figure 7. Spatial distributions of annual average sulfate aerosol concentrations (μg kg−1) over East Asia during the daytime (left) and nighttime (right) in 2010.
Atmosphere 09 00441 g007
Figure 8. Vertical distributions of annual average sulfate aerosol concentrations (μg kg−1) in the eastern China (24–43° N, 101–126° E) during the daytime (left) and the difference between daytime and nighttime (right) in 2010.
Atmosphere 09 00441 g008
Figure 9. Vertical distributions of seasonal average sulfate aerosol concentrations (μg kg−1) in eastern China (24–43° N, 101–126° E) during the daytime (top) and the difference between daytime and nighttime (bottom) in different seasons of 2010.
Atmosphere 09 00441 g009
Figure 10. Seasonal and annual average sulfate aerosol concentrations (μg kg−1) over eastern China (24–43° N, 101–126° E) during the daytime (left) and nighttime (right) in 2010.
Atmosphere 09 00441 g010
Figure 11. Spatial distributions of the annual average sulfate aerosol direct radiative forcing (W m−2) during the daytime (left grid) and nighttime (right grid) in 2010 based on the WRF-Chem model. The direct radiative forcing at the top of the atmosphere (TOA) and the surface are shown at top and bottom of each grid, and that in the atmosphere is shown at middle of each grid. From left to right: shortwave, longwave and net radiation.
Atmosphere 09 00441 g011
Figure 12. Diurnal profile of sulfate aerosol direct radiative forcing (W m−2) over East Asia in 2010.
Atmosphere 09 00441 g012
Figure 13. Spatial distributions of seasonal average sulfate aerosol net direct radiative forcing (W m−2) at the surface over East Asia during the daytime (top) and nighttime (bottom) in different seasons of 2010.
Atmosphere 09 00441 g013
Table 1. Information about the selected Aerosol Robotic Network (AERONET) stations.
NameLatitude (°N)Longitude (°E)Elevation (m)
Taihu (China)31.42120.2120
Osaka (Japan)34.65135.5950
Xianghe (China)39.75116.9636
Hong Kong PolyU (China)22.30114.1830

