Article

Influential Factors and Dry Deposition of Polychlorinated Biphenyls (PCBs) in Atmospheric Particles at an Isolated Island (Pingtan Island) in Fujian Province, China

1
Guangdong Province Key Laboratory for Coastal Ocean Variation and Disaster Prediction, Guangdong Ocean University, Zhanjiang 524088, China
2
Key Laboratory of Global Change and Marine-Atmospheric Chemistry of State Oceanic Administration (SOA), Third Institute of Oceanography, SOA, Xiamen 361005, China
*
Author to whom correspondence should be addressed.
These authors contributed equally to this work.
Atmosphere 2018, 9(2), 59; https://doi.org/10.3390/atmos9020059
Submission received: 10 January 2018 / Revised: 5 February 2018 / Accepted: 5 February 2018 / Published: 9 February 2018
(This article belongs to the Special Issue Air Quality in China: Past, Present and Future)

Abstract

:
To explore the polychlorinated biphenyl (PCB) pollution characteristics of atmospheric particles, influential factors, and dry deposition fluxes, 28 PCB congeners were examined over a 2-year period in the environment of an isolated island in Fujian Province. In 2006 and 2007, PCB concentrations ranged from 1.12 to 87.32 pg m−3 and ND (not detected) to 44.93 pg m−3, respectively, and were predominantly highly-chlorinated PCBs. The levels were much lower than those from industrial, urban, and rural areas, but slightly higher than those found in coastal areas of Europe and in the ocean. Obvious seasonal variations were found in the PCB levels, with high levels appearing in the winter, whereas low levels appeared in the summer, which indicated a significant positive correlation with the atmospheric particle mass level. The distribution pattern of the PCB concentration was largely affected by the meteorological conditions and total organic carbon (TOC) levels. Moreover, air mass originating from Northern China may be responsible for the higher PCB levels over Pingtan Island during the winter, and tracing the source of atmospheric particles by the stable carbon isotope suggested that the PBC levels may be influenced by coal combustion during the “heating season” of Northern China. The total dry deposition flux of the 28 PCBs on Pingtan Island was 3.94 ng m−2 d−1 and 2.94 ng m−2 d−1 in 2006 and 2007, respectively, and the average yearly input to the adjacent waters was 7531.2 g y−1.

Graphical Abstract

1. Introduction

Polychlorinated biphenyls (PCBs) are classified as persistent organic pollutants (POPs) under the Stockholm Convention, due to their persistence, bioaccumulation, high toxicity, and long-range atmospheric transport (LRAT). Evidence has demonstrated that LRAT is a major source of these contaminants in remote areas regarded as clean areas [1,2].
In the past, PCBs were produced and used widely on a global scale, and the global cumulative production of commercial PCBs reached approximately 1.3 million tons [3]; they generally entered the environment (e.g., soil, air, water and sediment) during their manufacture and use [4,5]. Although PCB production has been banned in most countries since the 1980s, primary emissions still continue from old electrical equipment, inadequate management of waste and electronic equipment, and leakage or improper disposal of transformer and capacitor oil [3,6,7]. In addition, the total emissions from unintentionally produced PCBs (UP-PCBs) in China from 1950 to 2010 was estimated to be 146.1 tons [8]. Despite the fact that the production of PCBs has been banned for many years, high concentrations of PCBs can still be detected in the environment, and their effects are still a global environmental problem [9,10,11].
It is generally true that atmospheric particles are regarded as dominant carriers for POP transfer, and their atmospheric transport and deposition are important mechanisms determining the fate of POPs in the environment [12,13]. Once emitted into the environment, semi-volatile PCBs can be absorbed into atmospheric particles and undergo LRAT to clean remote areas [9,14]. However, during the transportation process, the occurrence of PCBs in the atmosphere is susceptible to various factors. Particles coupled with PCBs can be re-suspended into ambient air by wind and human activities [15,16]. Additionally, the PCB levels in atmospheric particles are closely related to meteorological conditions and the origin of the air mass [7,17,18]. Recently, studies of PCBs in the atmosphere have become more common, but most have focused on urban, industrial, and e-waste recycling sites [7,15,18,19,20]. However, systematic research into PCBs in atmospheric particles from background areas of isolated islands in Southeast China, which is important for evaluating the transportation of PCBs from pollution sources to offshore aquatic systems, has been scarce until now.
Pingtan Island, isolated on the southeast coast of China (between 25°15′–25°45′ N, 119°32′–120°10′ E), is the largest island in Fujian Province. The southeast coast of China is the most highly developed and populated area in China, and accounts for 40% of China’ population. In addition, with the urban waste incineration industry, e-waste recycling sites, and coal-burning power plants along the southeast coast of China, the region has historically reported high levels of PCBs in the environment [4,7,18,19,20]. However, there is no PCB pollution source on Pingtan Island, making it the ideal area to research PCB influx to offshore environments through the atmosphere. Ambient PCB levels were recently measured nearby the coastal area of Pingtan, but mostly focusing on aquatic systems, such as seawater, sediment, and marine organisms [21,22,23,24]. However, little information is available on the atmospheric PCB levels on the isolated island, or potential inputs to adjacent waters.
In this study, atmospheric particle samples were collected for 2 years, and the target contaminants were 28 PCB congeners, including indicator PCBs and dioxin-like PCBs (DL-PCBs). The objectives of this work were (1) to illuminate the concentration characteristics and seasonal variations of 28 PCBs in atmospheric particles from the island, (2) to discuss the influential factors, and (3) to estimate the flux of PCBs into waters adjacent to this ecosystem through dry deposition.

2. Materials and Methods

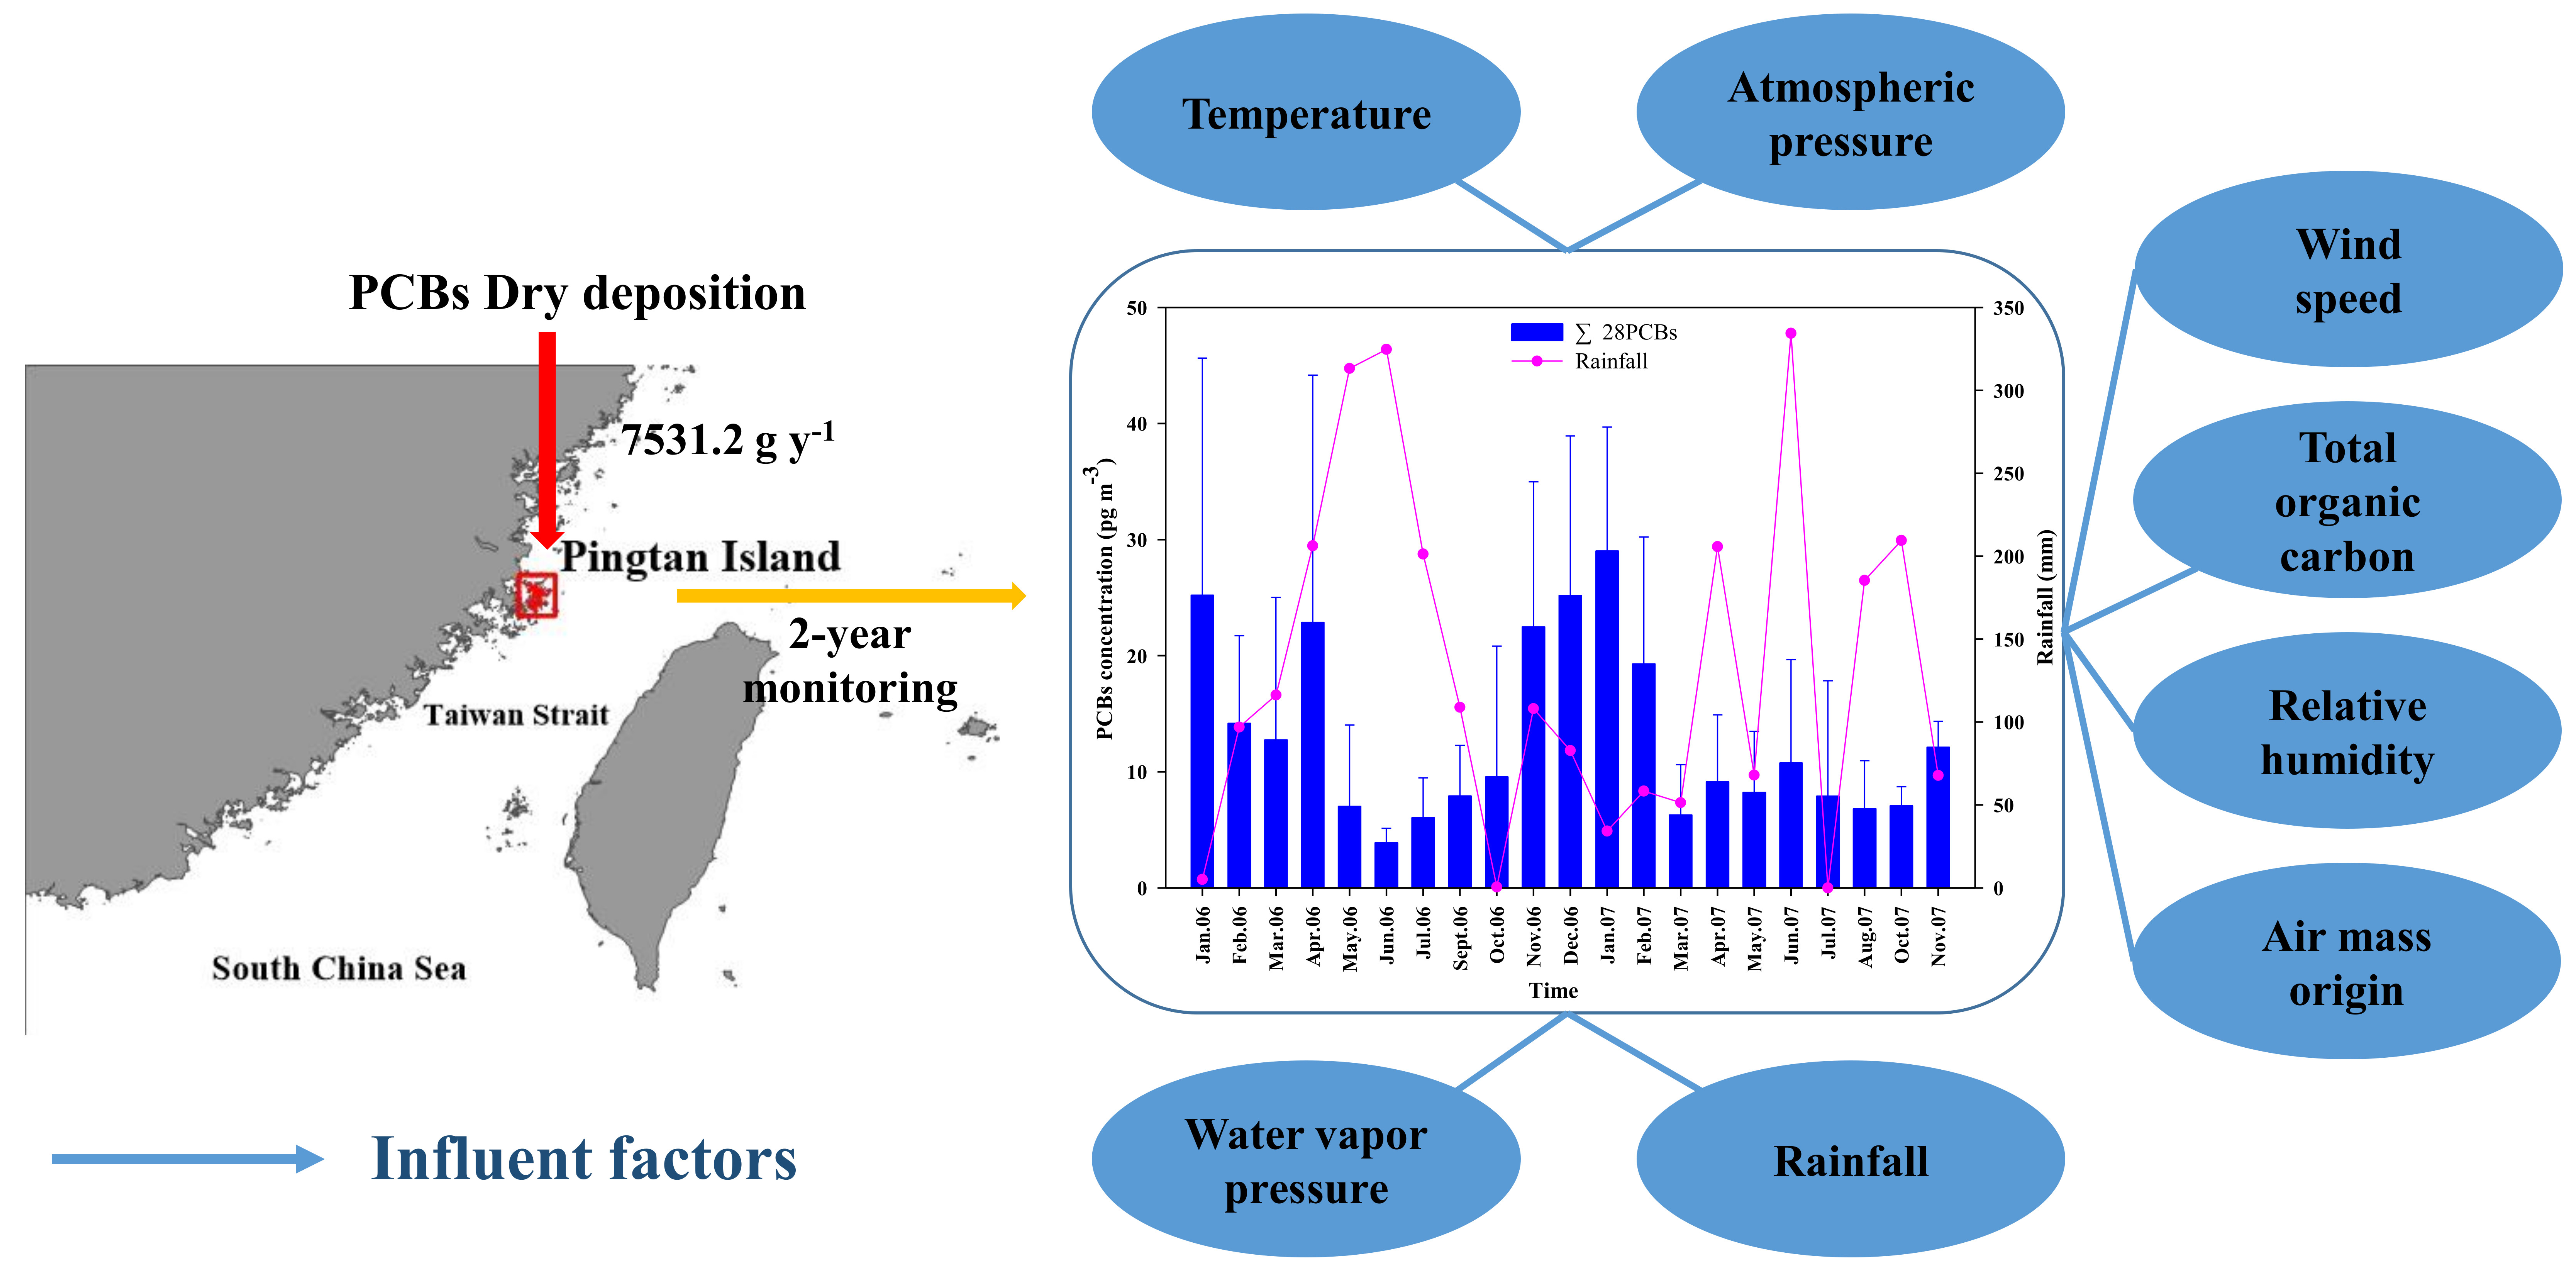
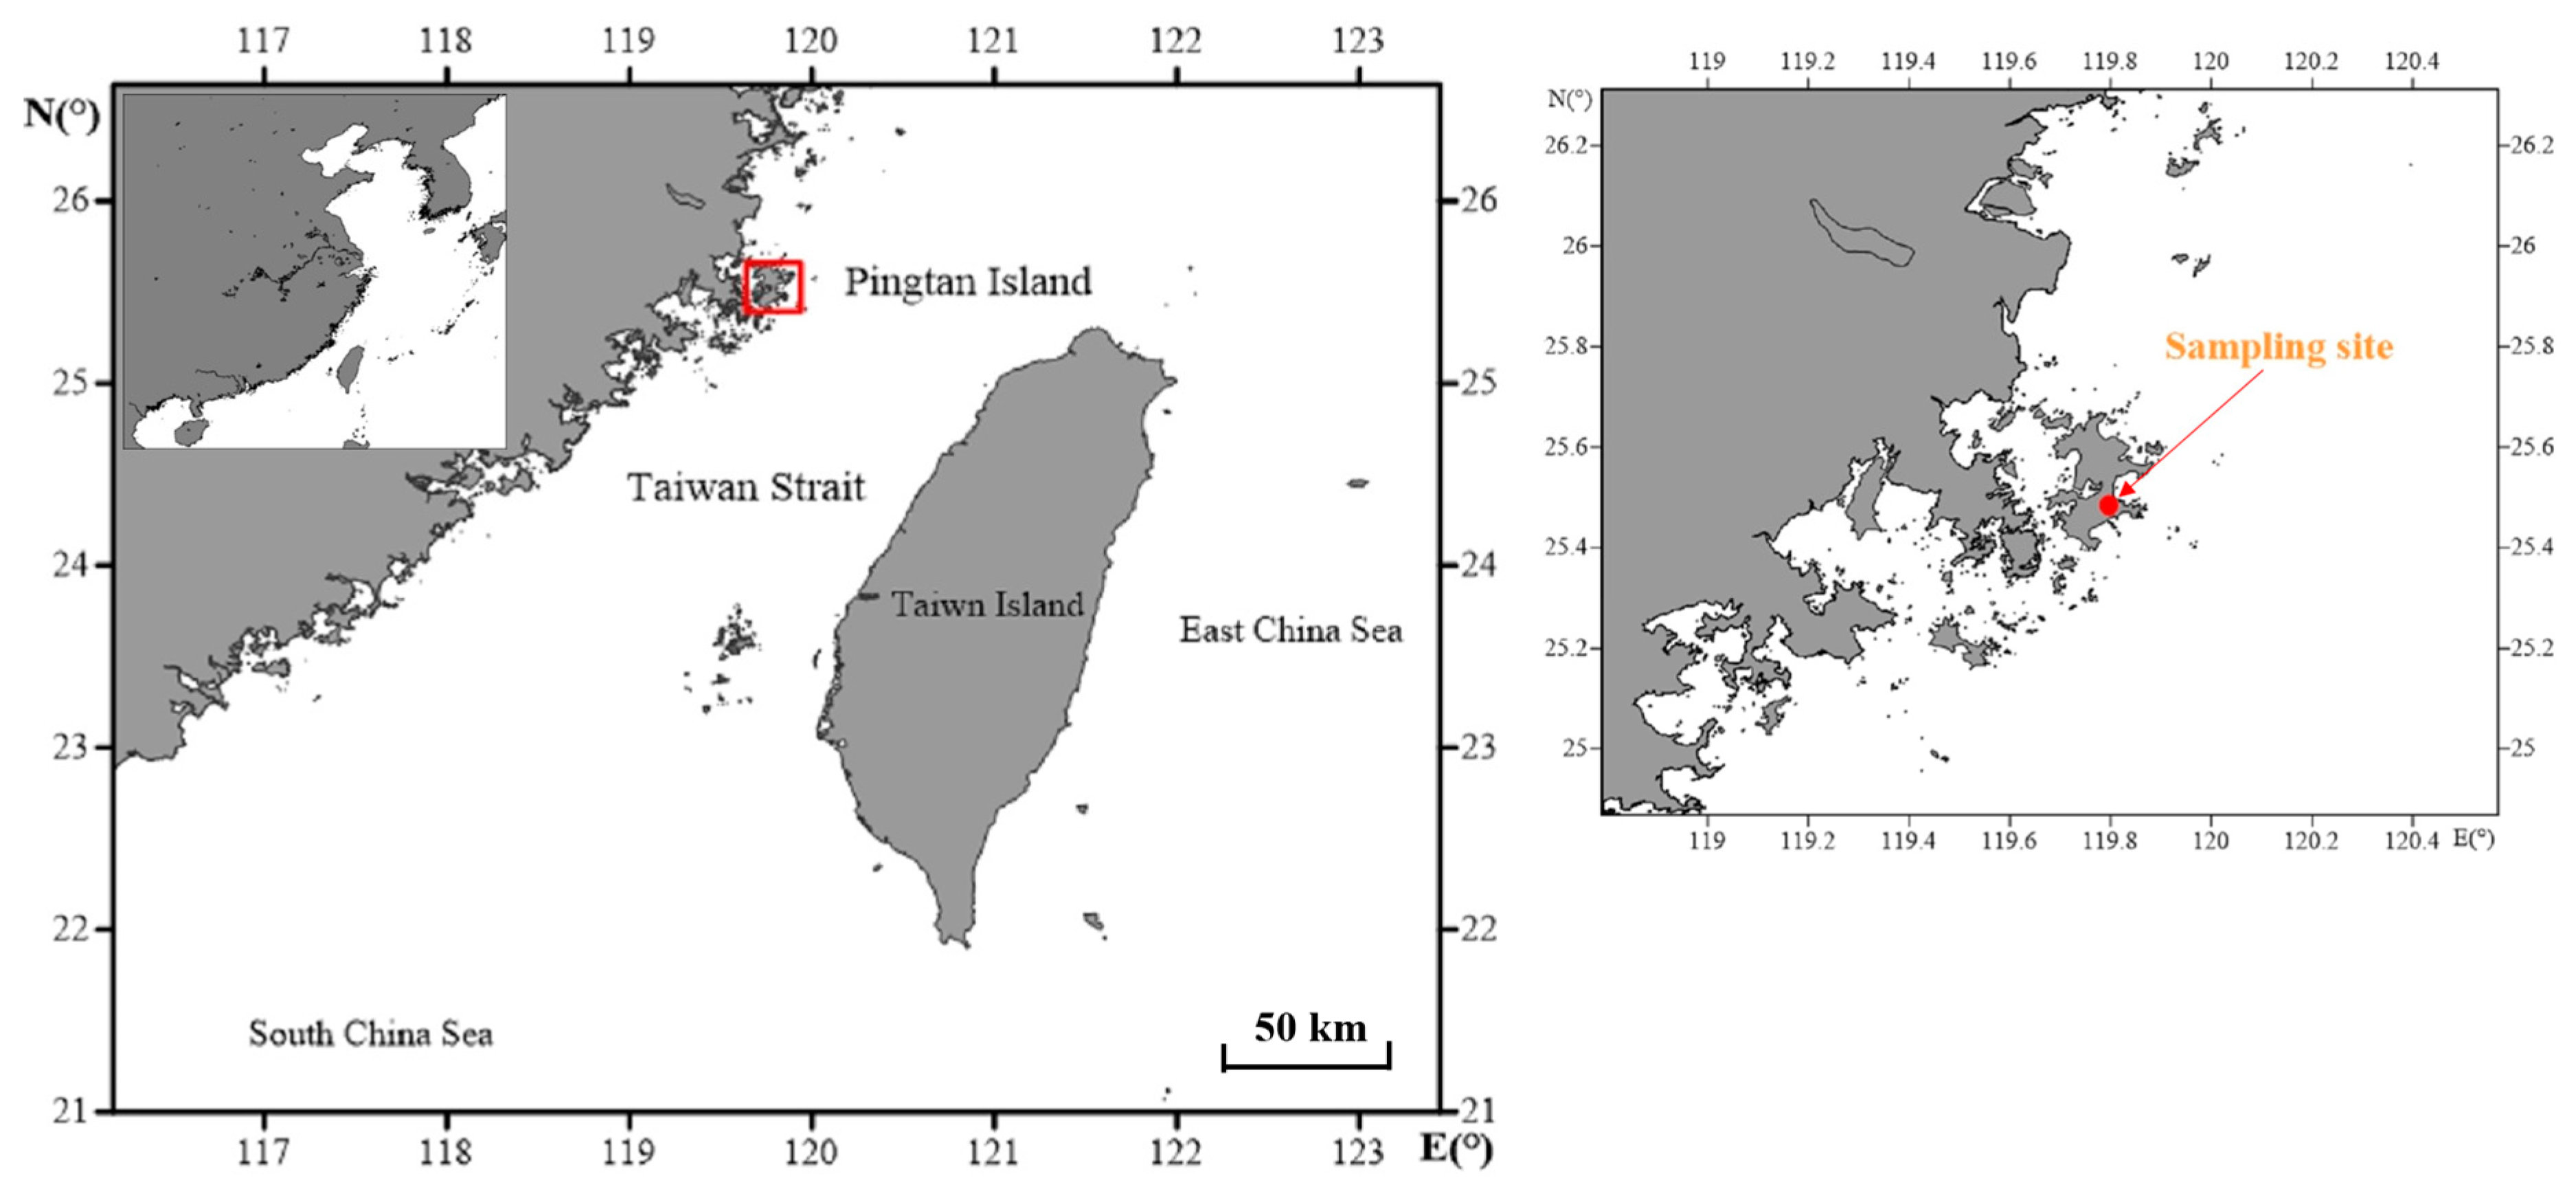
2.1. Sampling Location and Air Sampling

The sampler was set up on the top of a coastal mountain, located on the shore of Pingtan Island, about 15 meters above sea level (see Figure 1). The island has a typical subtropical monsoon climate. Air sampling was conducted from January 2006 to November 2007 using a high-volume air sampler, and the average gas flow rate of the sampler was 62.88 m3 h−1. Atmospheric particle samples were collected in glass fibre filters (GFFs; 200 mm × 250 mm, 0.4 μm diameter, Whatman, Piscataway, NJ, USA). The GFFs were incinerated in an oven at 450 °C for 4 h to remove organic residue before sampling. After sampling, the samples were wrapped with aluminum foil and placed in a dry-box for 48 h before being weighed. Then, they were stored in a fridge at −20 °C until extraction.

2.2. Sample Pretreatment and Analysis

Details about the sample pretreatment and analysis are presented in Text S1 (Supplementary Material). Briefly, the GFFs were extracted using an accelerated solvent extraction instrument. Before extraction, the system was spiked with 60 μL of an internal standard, using 1:1 dichloromethane/hexane as the extraction solvent. The extract was concentrated to 1 mL by a rotary evaporator and then purified, eluting it with 100 mL hexane/dichloromethane (v/v 1:1). The eluate was concentrated to 100 μL under nitrogen (99.999%) and transferred into hexane for determination. All samples were spiked with PCB internal standards (PCB30 and PCB209) to quantify the recovery. Twenty-eight PCB congeners, including PCB8, 18, 28, 44, 52, 66, 77, 81, 101, 105, 114, 118, 123, 126, 128, 138, 153, 156, 157, 167, 169, 170, 180, 187, 189, 195, 206, and 209, as well as the number of chlorines for the various congeners, are presented in Table S1. Analysis of the 28 PCB congeners was performed by gas chromatography/electron capture detection (GC/ECD) (Agilent 7890A (Agilent Technologies, Shanghai, China) with 63Ni ECD) equipped with a DB-5 MS column (60 m × 0.25 mm × 0.25 μm film thickness). The temperature of the injector and detector was 270 °C and 300 °C, respectively. Splitless injection was used, and 1 μL of the extract was injected. The oven temperature was initially set at 80 °C, increased to 210 °C at a rate of 10 °C min−1, then to 250 °C at 0.8 °C min−1 and held for 1 min, and at last reached 290 °C at a rate of 10 °C min−1 and held for 12 min. High-purity nitrogen (99.999%) was used as the carrier gas with a flow rate of 30 mL min−1.

2.3. Quality Control and Quality Assurance (QA/QC)

All instruments (except those for quantitative use) were cleaned by ultrasonic cleaning, flushed again after drying with aluminum foil, and then incinerated at 450 °C for 4 h. The instruments were washed three times by acetone and hexane before use. The blank samples are the GFFs, which went through hexane/dichloromethane (1:1) Soxhlet extraction for 24 h, which was repeated three times before drying. When the samples were treated and measured, a blank sample was added to every 20 unknown samples, and no 28 PCBs target compounds were detected in the blank samples. Before extraction, all samples were added to the known concentration internal standard (2,4,6-trichlorobiphenyl), which was used to monitor the recovery rate of the extraction process, and the recovery rate ranged from 81.4 to 115.3%. The results of all samples were corrected by the recovery rate.

2.4. Meteorological Parameters

All meteorological parameters, including air temperature (T), atmospheric pressure (AP), wind speed (WS), wind direction (WD), relative humidity (RH), water vapour pressure (WVP), and rainfall, were downloaded from the Pingtan meteorological observation station in the China Meteorological Data Sharing Service System (CMDSS) (http://data.cma.cn/site/index.html), and the distance from the station to the sampling site was less than 1000 m. Temporal variations of several meteorological parameters at Pingtan Island during the sampling periods are plotted in Figures S1 and S2.

2.5. Back Trajectories

Three-day (72 h) back trajectories (BTs) were computed utilizing the web version of the HYSPLIT model. Trajectories were generated from the sampling site at three different heights (100, 500, and 1000 m) above sea level. These heights are frequently used [17,25] and ensure that the BT starts in the atmospheric boundary layer [26].

2.6. Dry Deposition Fluxes

Dry deposition fluxes were estimated in this work using the estimation model formula given in Equation (1), which was derived in previous studies [12,27].
Fd = Caerosol × vd
where Fd is the dry deposition flux of PCBs in the atmospheric particles (M m−2 t−1), Caerosol is the PCB concentration in the atmospheric particles (M m−3), and vd is the dry deposition velocity of the atmospheric particles (cm t−1). However, due to the lack of field measurement data for the deposition velocities of particles, we assumed an average deposition velocity of 0.28 cm s−1, in accordance with previous studies at areas adjacent to Pingtan Island [27,28,29].

3. Results and Discussion

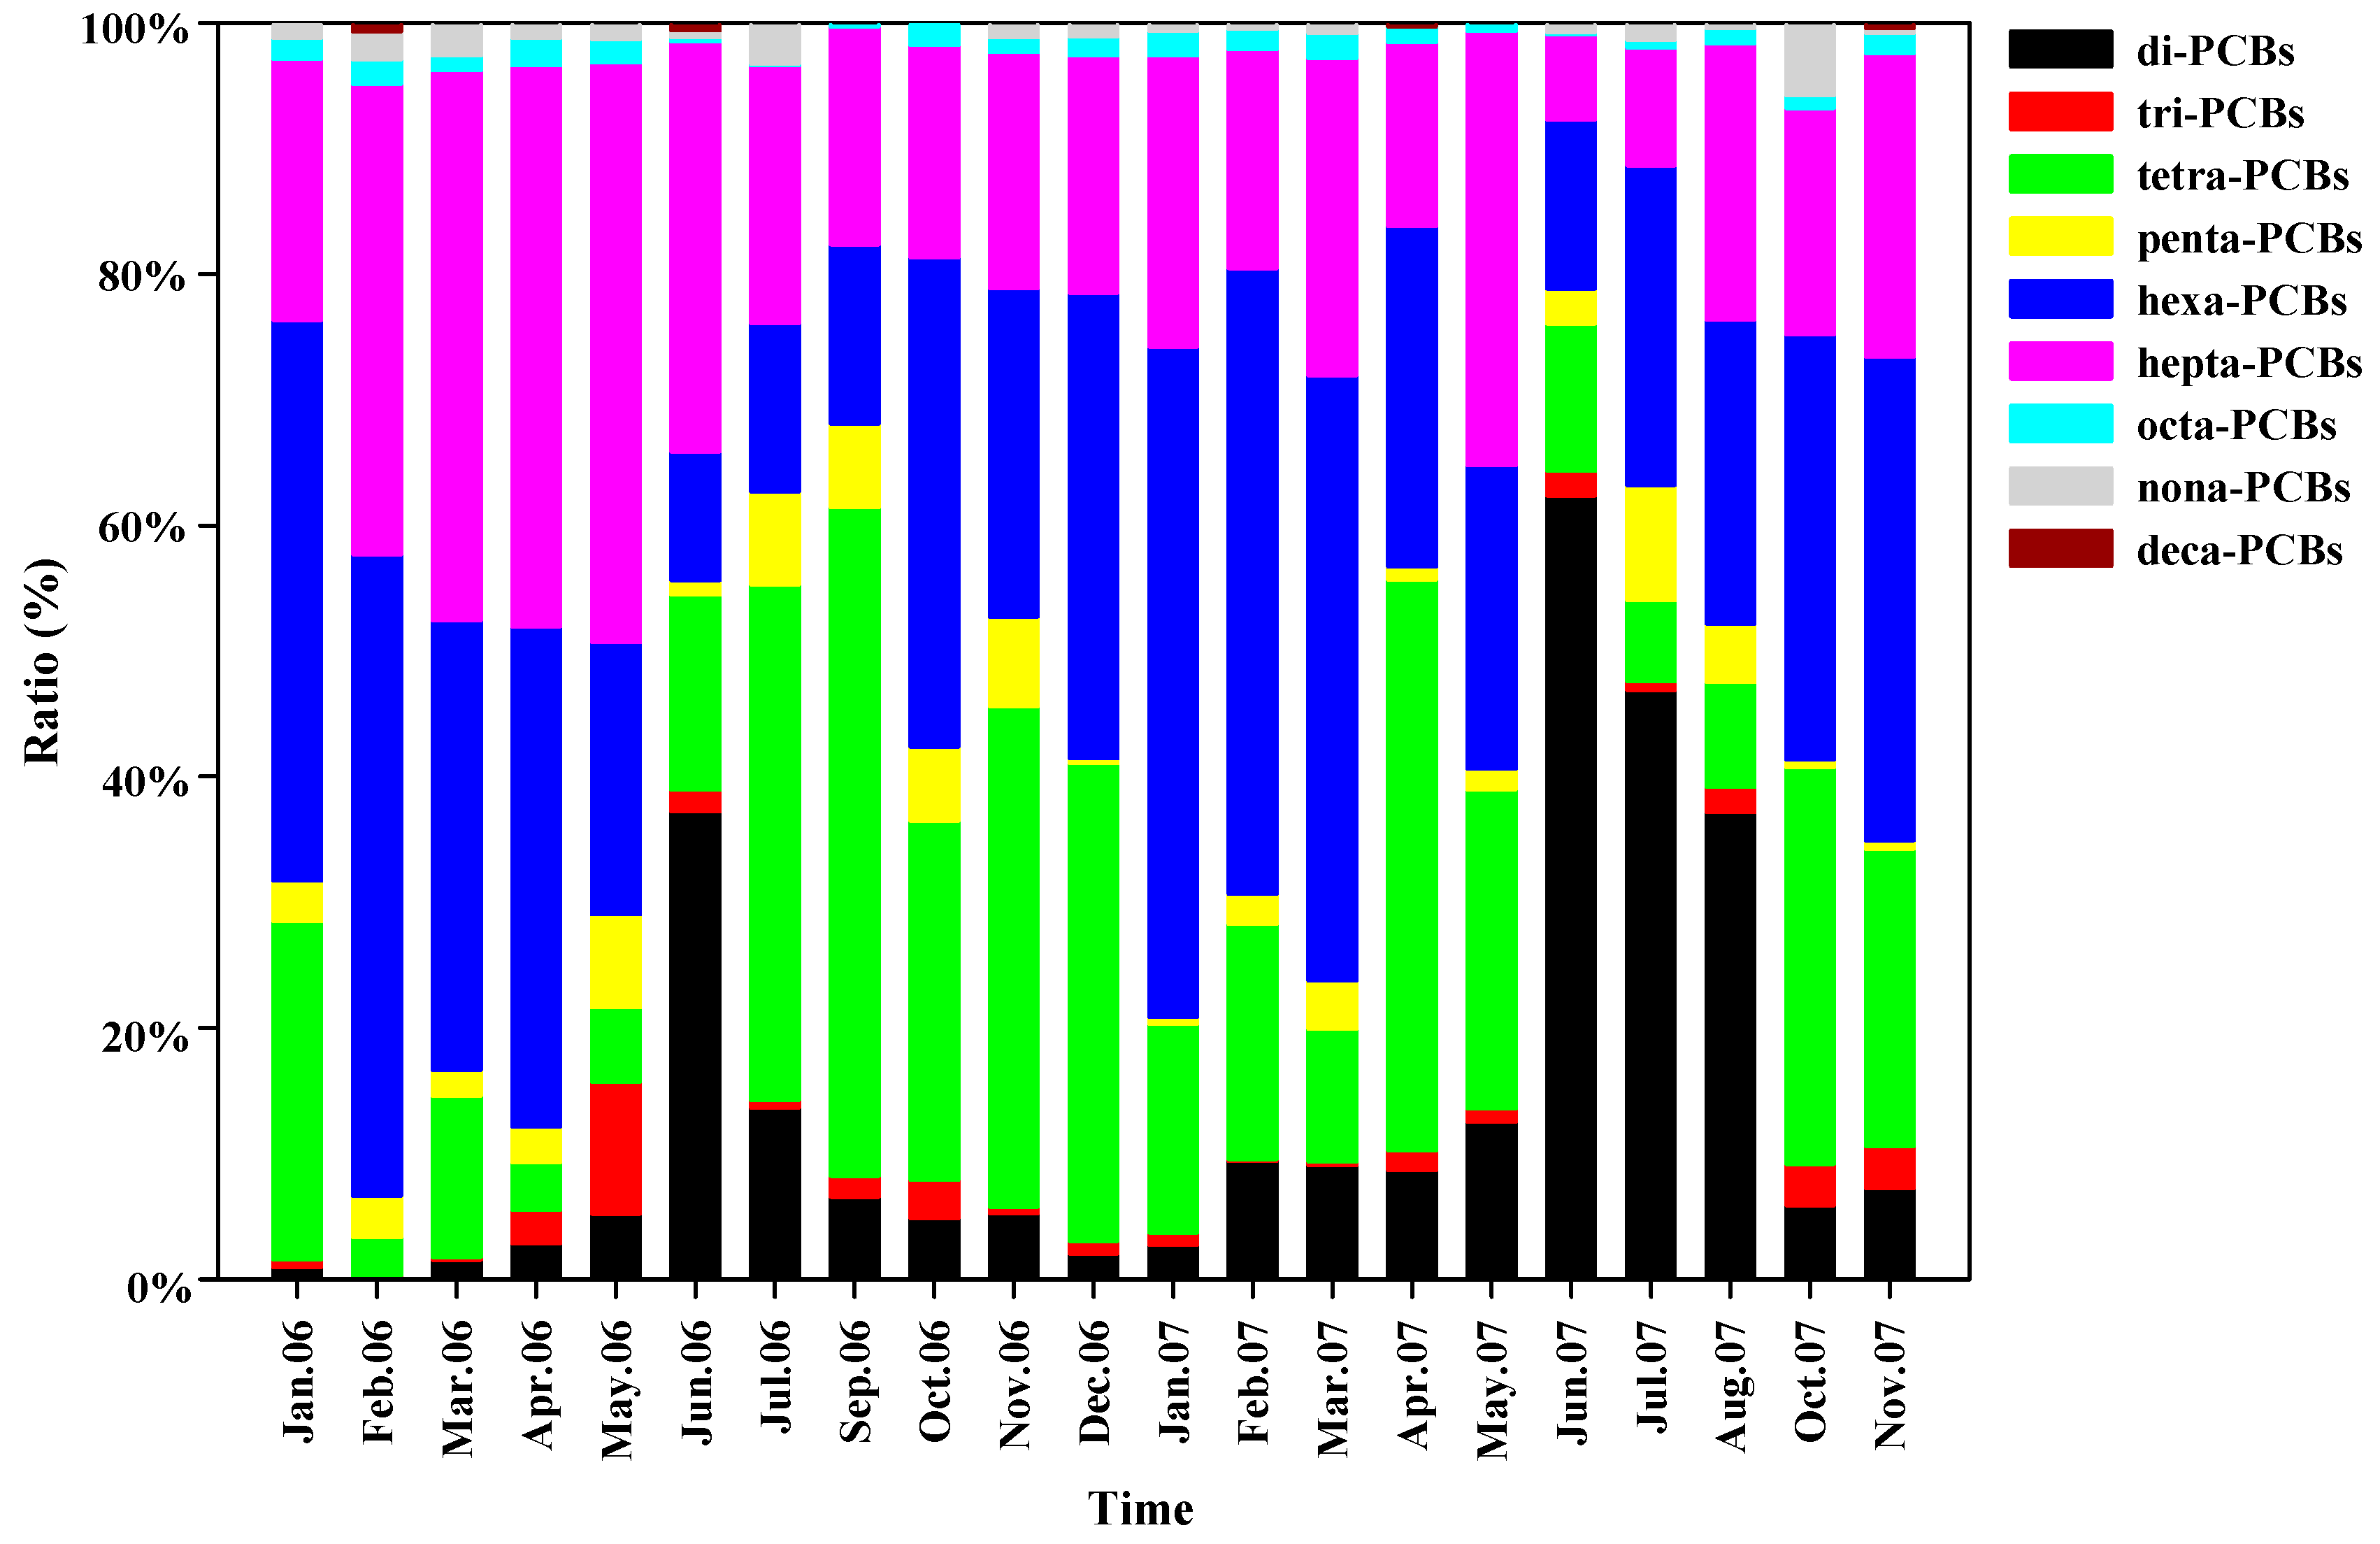
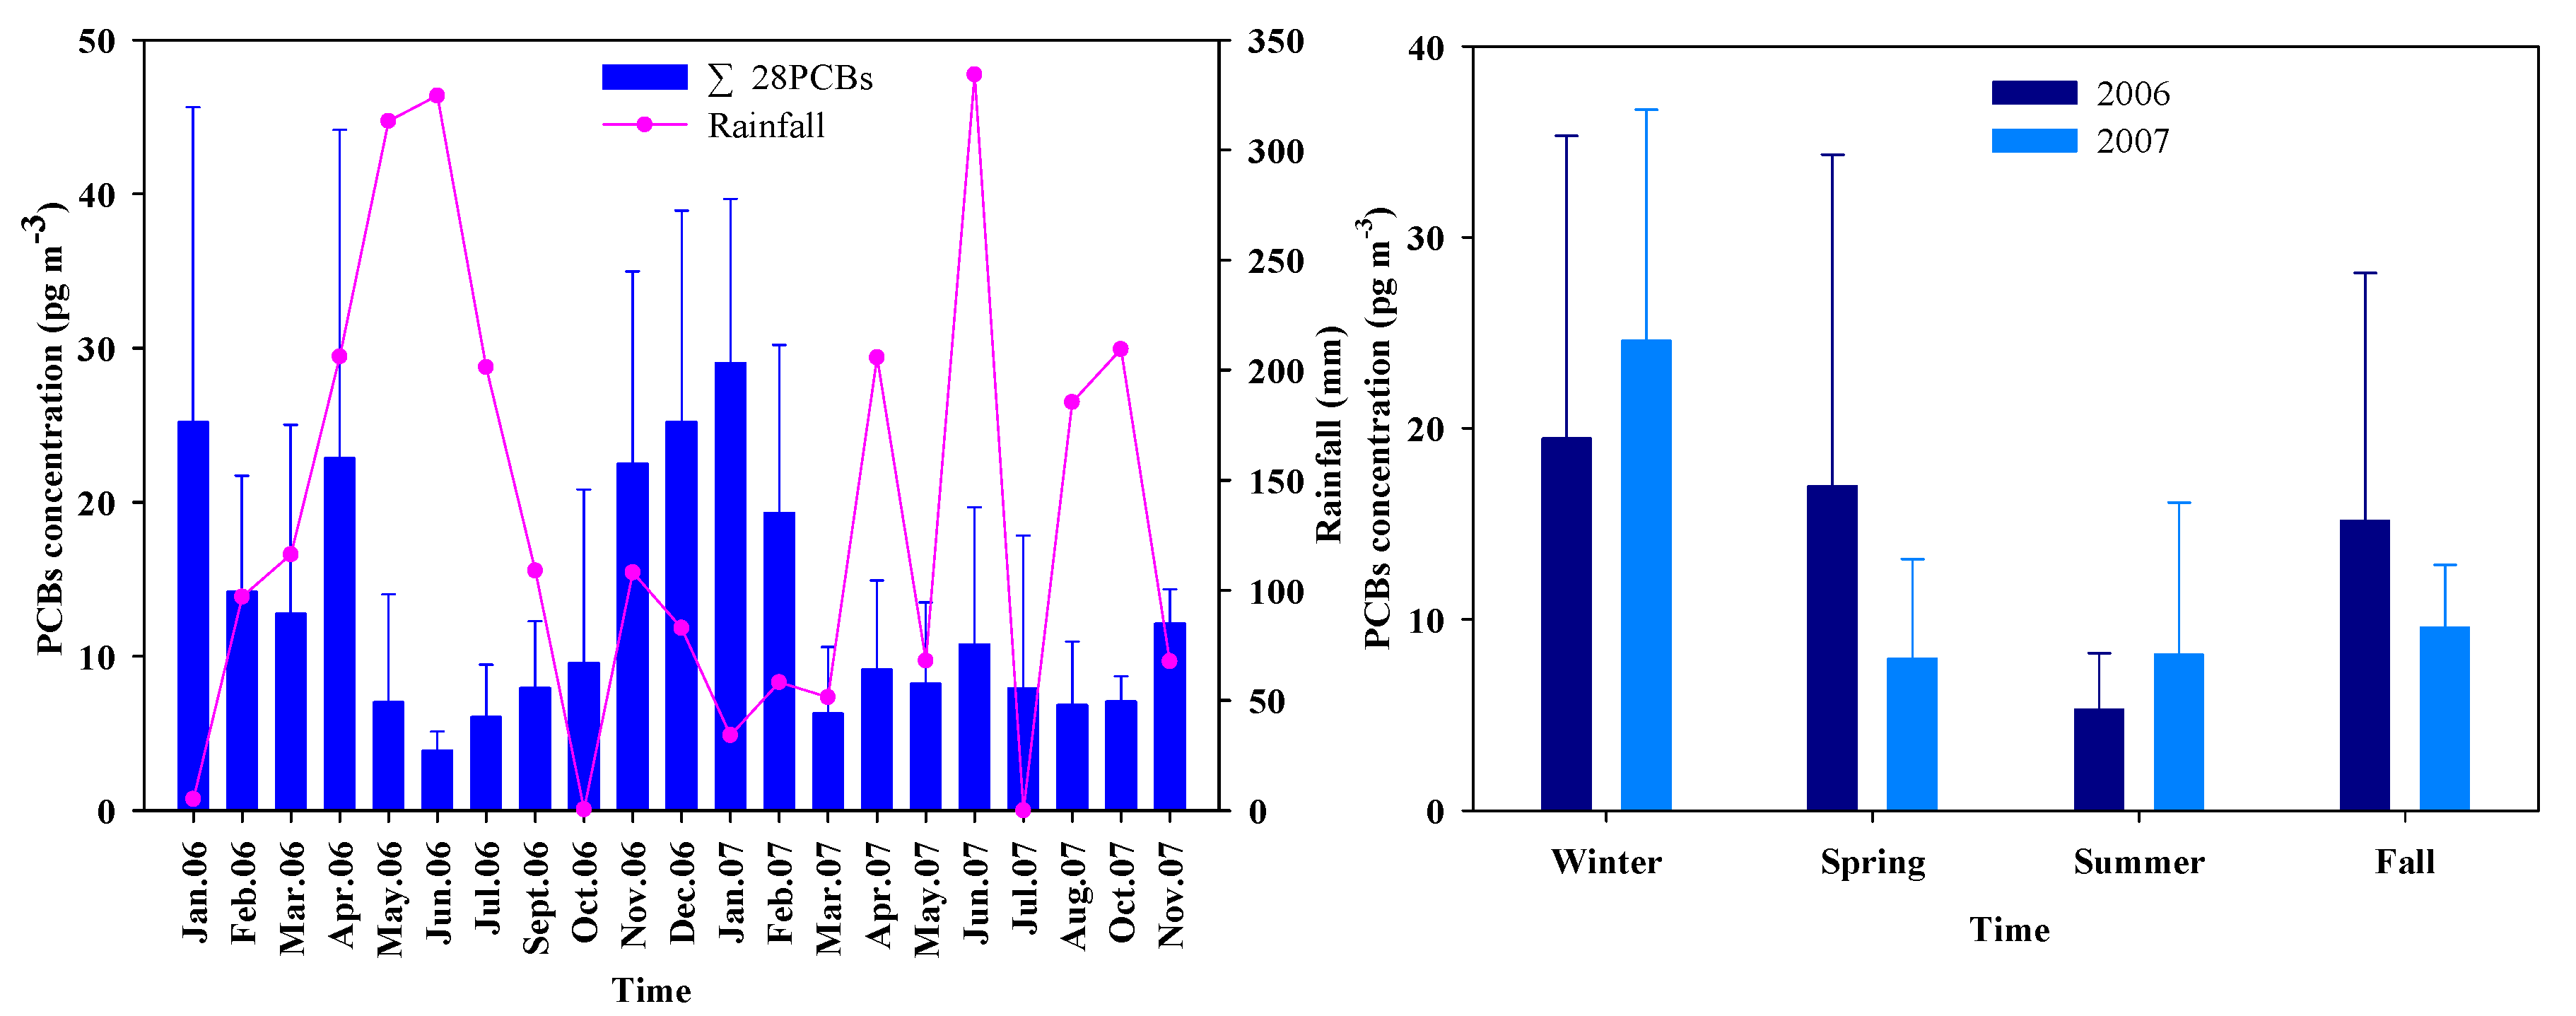
3.1. Characteristics of Atmospheric Concentrations

A total of 207 samples were collected at Pingtan Island from January 2006 to November 2007 (the lack of data in August 2006 and September 2007 was due to sampler maintenance). The results of the PCB and total suspended particle (TSP) levels are summarized in Figure 2. The monthly average PCB concentrations in 2006 and 2007 are presented in Tables S2 and S3, respectively (Supplementary Material). The concentration of all 28 PCBs was 1.12~87.32 pg m−3 (mean, 16.27 ± 14.90 pg m−3) and not detected (ND) ~44.93 pg m−3 (mean, 12.16 ± 10.59 pg m−3) in 2006 and 2007, respectively. The atmospheric concentration of DL-PCBs (PCB-81, 77, 126, 169, 105, 114, 118, 123, 156, 157 and 189) and indicators (PCB-28, 52, 101, 118, 153, 138 and 189) are also reported in Tables S1 and S2. The concentration of ∑indicator PCBs varied from ND ~47.68 pg m−3 to ND ~24.44 pg m−3 (mean, 6.22 ± 7.89 pg m−3 and 4.22 ± 5.52 pg m−3) in 2006 and 2007, accounting for 38.2% and 34.7% of ∑28PCBs, respectively. On the other hand, the ∑DL-PCB level ranged from 0.46 to 76.84 pg m−3 and ND ~22.53 pg m−3 (mean, 7.91 ± 9.76 pg m−3 and 5.23 ± 5.08 pg m−3) in 2006 and 2007, accounting for 48.6% and 43.0% of ∑28PCBs, respectively. Of the individual congeners, PCB-138 exhibited the highest concentration, followed by PCB-189 and PCB-77, while PCB-81 and PCB-44 were all below the detection limit during the sampling period. In general, the PCB concentration in the atmospheric particles was dominated by highly-chlorinated PCBs (Figure 3). The concentration of hexa-PCBs and hepta-PCBs accounted for 64.7% and 59.8% of the total PCBs in 2006 and 2007, making them the most abundant homologues in the samples.
To assess the danger of the DL-PCBs levels found in the atmospheric particulate samples, the toxic equivalent quantity (TEQ) was calculated by multiplying the contents of every DL-PCB congener by their related toxic equivalency factor (TEF) [18]. The TEQ levels (DL-PCBs) ranged from 0.02 to 2575 fg m−3 and 0 to 72.56 fg m−3 in 2006 and 2007, respectively, and the average level of TEQs in 2006 (45.56 fg m−3) was much higher than that in 2007 (3.05 fg m−3). The TEQ level was clearly dominated by PCB-126, whose TEF level (0.1) was much higher than the other congeners (which ranged from 0.03 to 0.00003) [18]. The concentration of PCB-126 in 2006 (0.44 pg m−3) was also much higher than in 2007 (0.02 pg m−3). PCB-126 is one of congeners of penta-PCBs, and penta-PCBs are used mainly as a paint additive [5]. Paint may have been used nearby the coastal area of Pingtan Island in 2006, for purposes such as house decoration and fishing boat painting, resulting in the increase of PCB-126 level in the atmosphere.
Table 1 and Table 2 show the PCB and TEQ concentrations in atmospheric particles from different areas. The levels of particle-bound PCBs in the Pingtan Island atmosphere were much lower than those in industrial, urban, and rural areas, but slightly higher than those from coastal areas of Europe and in the ocean, generally showing the trend of industrial > urban > rural > coastal areas. The TEQ concentrations were also lower than Taizhou industrial areas [19] but generally within the range of levels reported for urban and coastal areas around the world (Table 2). The slightly higher concentrations observed in Pingtan than the coastal areas of Europe suggest that the TEQ concentration may be affected by adjacent pollution sources, such as the e-waste recycling areas in Taizhou [19] and Guiyu [20], which are located north and southwest of the island, respectively; additionally, PCBs may transported through LRAT to the atmosphere of the island. Urban areas, especially discarded electronics dismantling areas and industrial sites, are the main source of PCBs in the atmosphere [19,20]. The further the distance from the source area, the less the effect the source of the pollution has on PCBs in the atmosphere. Therefore, the PCB concentrations in the atmosphere of the coastal isolated island were relatively low. In the ocean area, far away from human activity, PCBs in the atmosphere are mainly derived from long-distance atmospheric transport.

3.2. Seasonal Variations

The highest concentrations in Pingtan were measured during the coldest season (January) in 2006 and 2007, while the lowest concentration was measured during the summer (2006). Generally, seasonal variations exhibited higher concentrations in winter (dry season) and lower concentrations in summer (rainy season) (Figure 4). In addition, the profiles of the PCB homologues during the sampling period were also found to exhibit seasonal trends (Figure 3). The proportion of highly-chlorinated PCBs was higher during the cold season (fall, winter, and spring), and the level of lowly-chlorinated PCBs was markedly elevated during the summer.
Seasonal variations in the particle-bound PCB levels in the Pingtan atmosphere were similar to those reported in urban areas, such as Shanghai [18], Jinan [40], and a Mediterranean coastal site [17]. However, the levels were significantly different from those in an abandoned e-waste recycling site in South China (Qingyuan, Guangdong Province, China), which exhibited approximately one order-of-magnitude-higher concentrations during the summer than during the winter [7,41].
The PCB concentrations correlated well with TSP (R2 = 0.755, p < 0.01, Figure 2). Therefore, TSP is an important factor affecting seasonal variations in the PCB concentrations, which were significantly higher during the winter than during the summer. Once these contaminants are released to the atmosphere, they tend to be absorbed into particles before reaching equilibrium between the gas and particle phase [42]. Thus, PCBs in the gas phase are continuously absorbed into particulate matter (PM) until reaching equilibrium, especially in the winter. In particular, more highly-chlorinated PCBs prefer to attach to particles, due to their lower volatility [43].
The seasonal cycle of the atmospheric mixing layer height is one of the main factors affecting the diffusion of atmospheric contaminants [17]. Its height was substantially lower during the winter, and was therefore unfavourable for the dispersal of local contaminants, resulting in the contaminants gradually accumulating in the local atmospheric environment. However, Pingtan Island is rainy during the summer (Figure 4), and PCB levels in atmospheric particles are decreased by rain removing particles from the atmosphere. In addition, the lowest PCB levels appeared in summer 2006, which may have been affected by typhoon events. During this period, Fujian province experienced typhoons “Saomai”, “Kaemi”, and “Bilis”, as well as heavy precipitation. The increasing concentration of lowly-chlorinated PCBs in the summer was mainly due to their high vapour pressure and volatility, as they can re-volatilize from soil or water at high temperatures (average 28.7 °C) in the summer and gradually be absorbed into particles [5,12]. Moreover, the levels may also have been partly caused by LRAT from PCB sources. Among PCBs emitted from urban, industrial, or e-waste areas into the atmosphere, higher molecular weight (HMW) congeners were gradually deposited during LRAT, while lower molecular weight (LMW) congeners could be transported farther [5,44]. However, the abandoned e-waste recycling sites in Qingyuan, whose distance to Pingtan sampling site is about 800 kilometers, still act as important sources of PCBs [7]. Wang et al. (2016) [7] observed significant linear correlations between In P (gaseous PCBs pressure) and 1/T (temperature) for both winter and summer, but in this instance, there were no correlations in summer and only weak significant correlations in winter, indicating that PCBs in the atmosphere were strongly controlled by temperature-driven volatilization from the abandoned e-waste recycling sites. Therefore, PCB volatilization and re-volatilization in local surfaces (e.g., e-waste, e-waste burning residues, and contaminant soils) under relatively high temperature increased in the summer; in addition, e-waste recycling activities in the area may have been more active during the summer than during the winter, resulting in the higher concentrations of PCBs in the atmosphere during summer than winter.

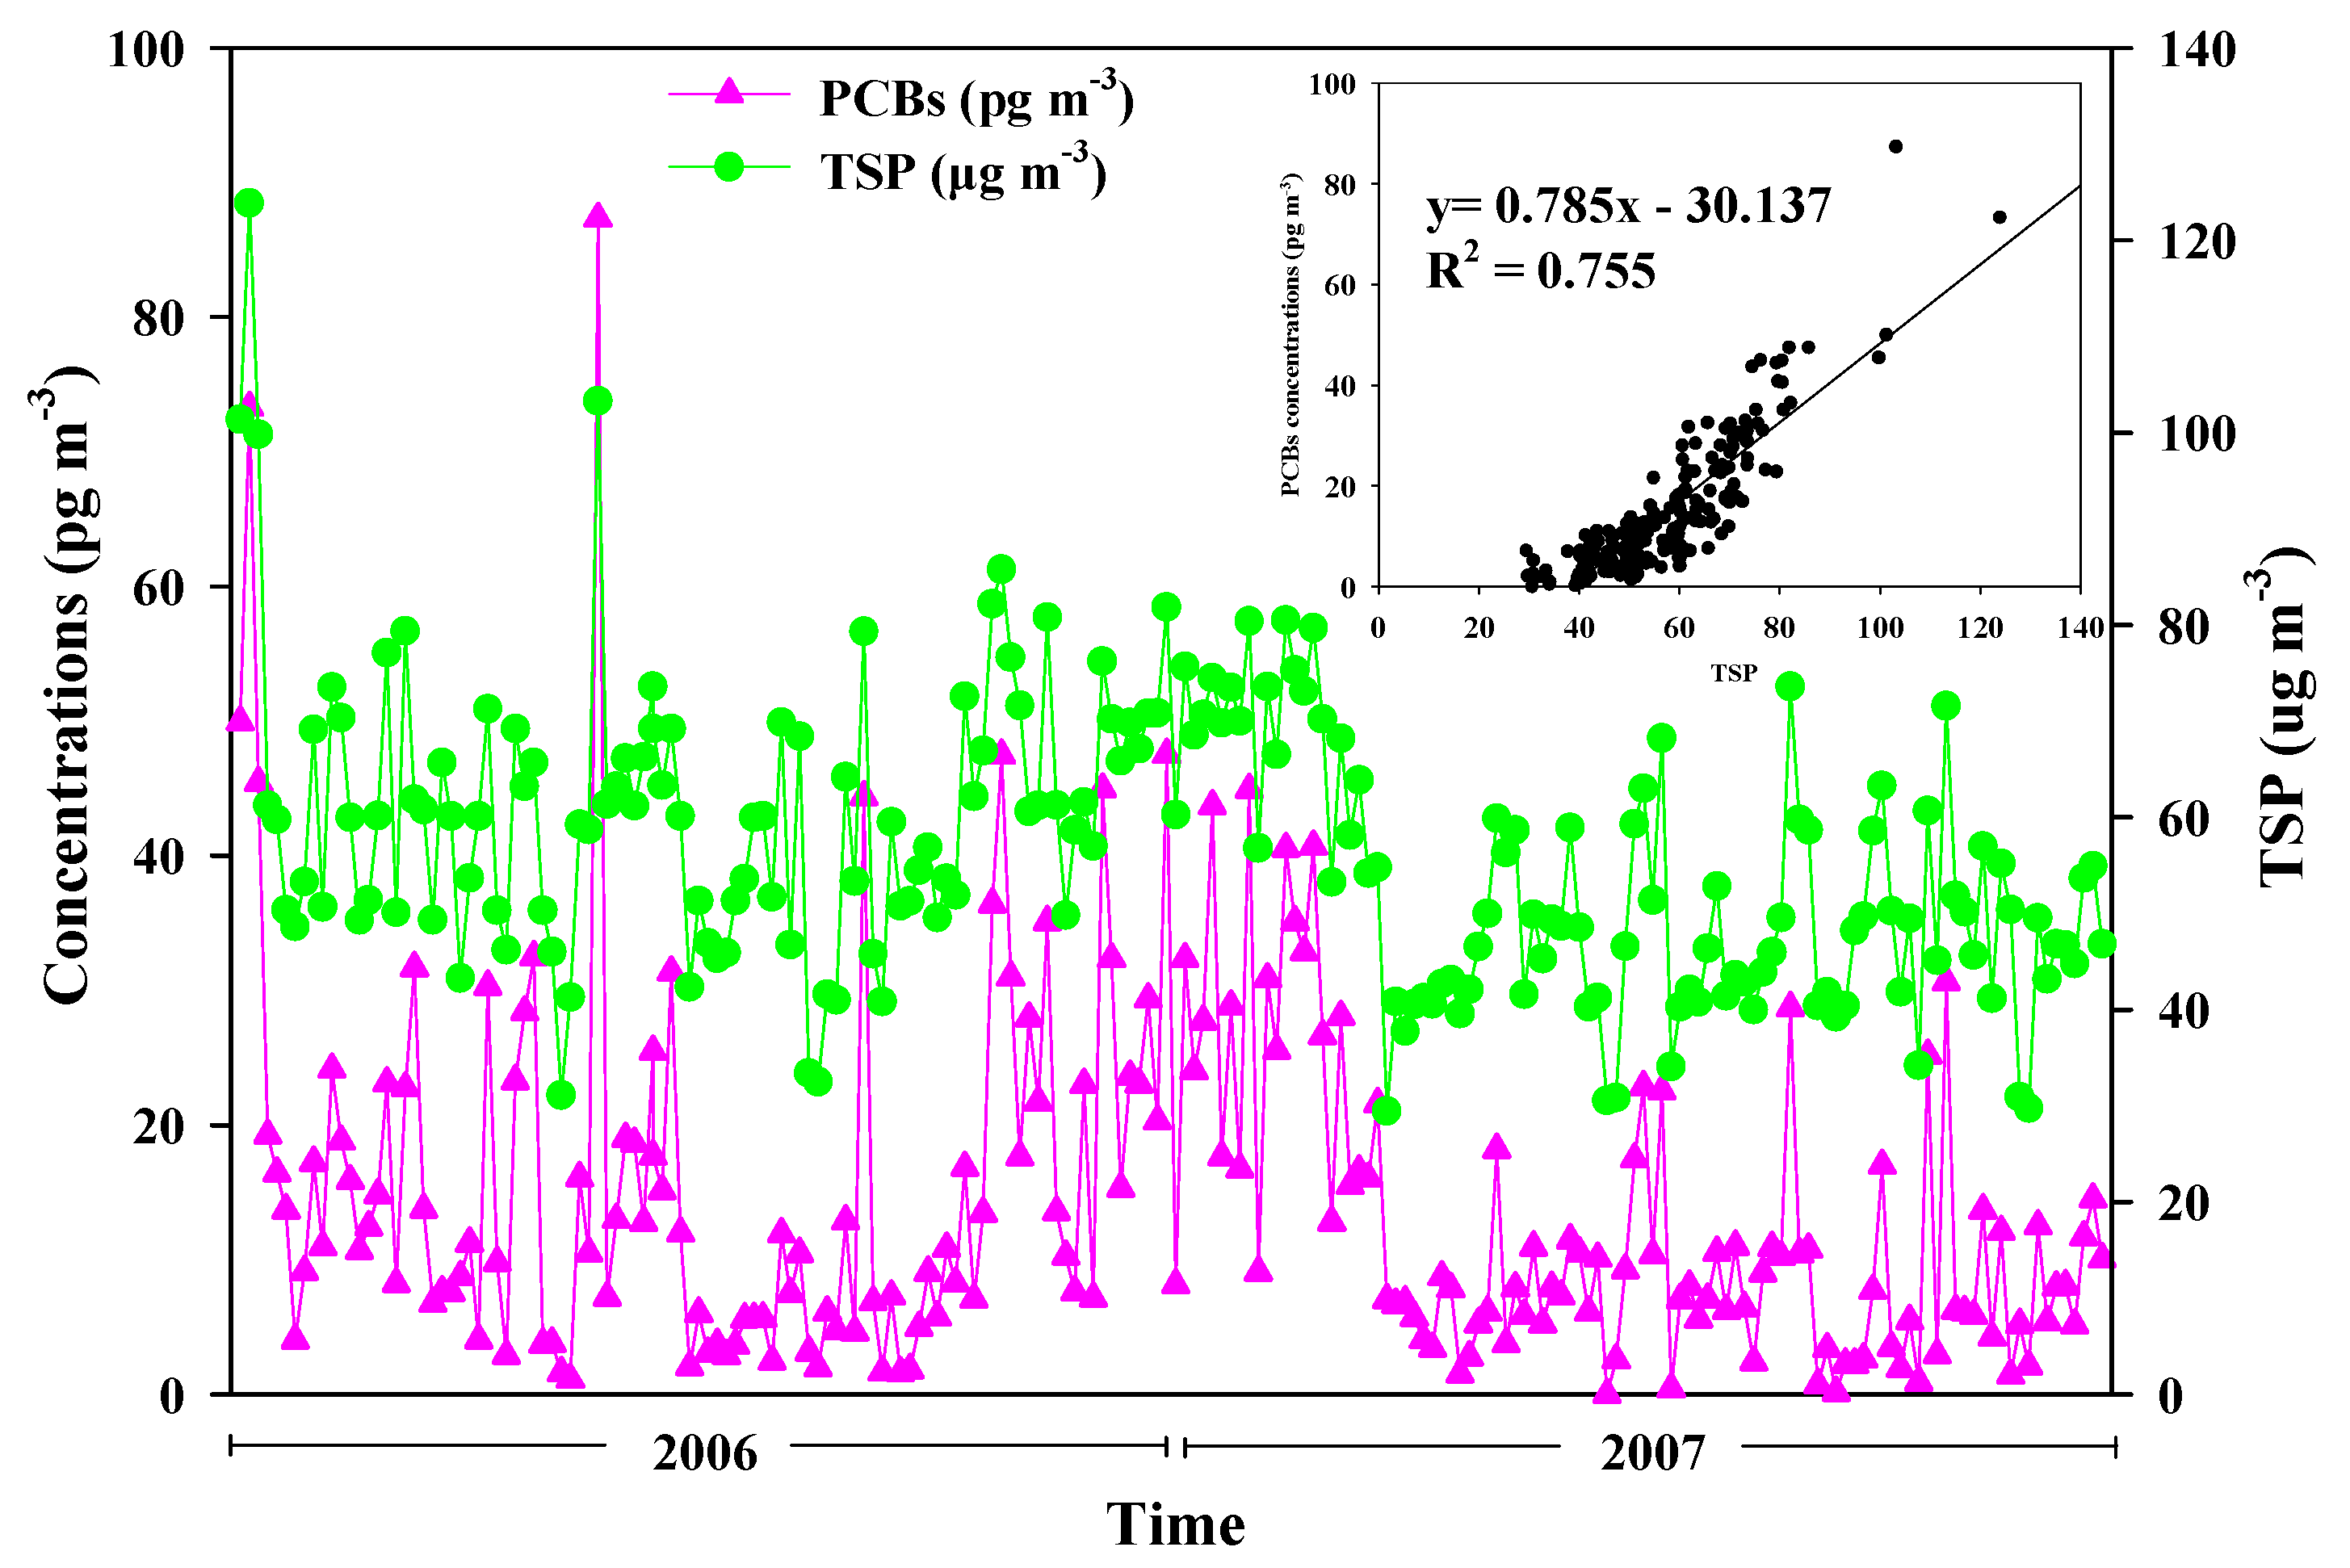
3.3. Influential Factors

3.3.1. Meteorological Conditions

In addition to the influence of local sources, the level of PCBs, as semi-volatile organic compounds, in atmospheric particles from Pingtan is likely driven by meteorological conditions [7,25,45,46]. The results of a correlation analysis between the PCB concentrations and meteorological parameters are presented in Table 3. Negative correlations were observed between most of the individual PCB concentrations and temperature, suggesting that higher temperatures assist in the re-volatilization of PCBs from the particle phase to the gas phase. Among the meteorological parameters, the PCB levels showed a positive correlation with atmospheric pressure, but negative correlations with relative humidity and water vapour pressure. In Pingtan Island, the relative humidity and water vapour pressure were relatively high (especially during the summer) and uniform throughout the year, due to frequent rain and the surrounding marine environment; in addition, the scavenging effects of PCBs in atmospheric particles can be caused by water drop adsorption and precipitation [25]. Atmospheric pressure mainly affects the atmospheric mixing layer height. The higher the atmospheric pressure, the lower the atmospheric mixing layer height. Therefore, PCBs absorbed into particles gradually accumulate in the local atmosphere during the winter. For wind speed, previous studies suggested that higher wind speeds had a dilution effect on the local contaminant levels [15,17]. In contrast, positive correlations with wind speed were observed among PCB-105, 138, 187, and 170, as well as the indicator PCBs. In addition, when we considered only those 110 samples for which the wind speed was <4.0 m s−1, the average PCB concentration was 6.14 pg m−3, far below the concentration (15.64 pg m−3) at high wind speed (>4.0 m s−1). This observation suggests that wind could also play an important role in increasing the PCB concentration via re-suspension of particulate matter from soil or the ground under higher wind speeds in isolated island areas, or by transmission of PCBs from the mainland to the isolated island. In general, the meteorological conditions are important factors influencing the seasonal distribution pattern, fate, and behaviour of PCBs in atmospheric particles from Pingtan Island.

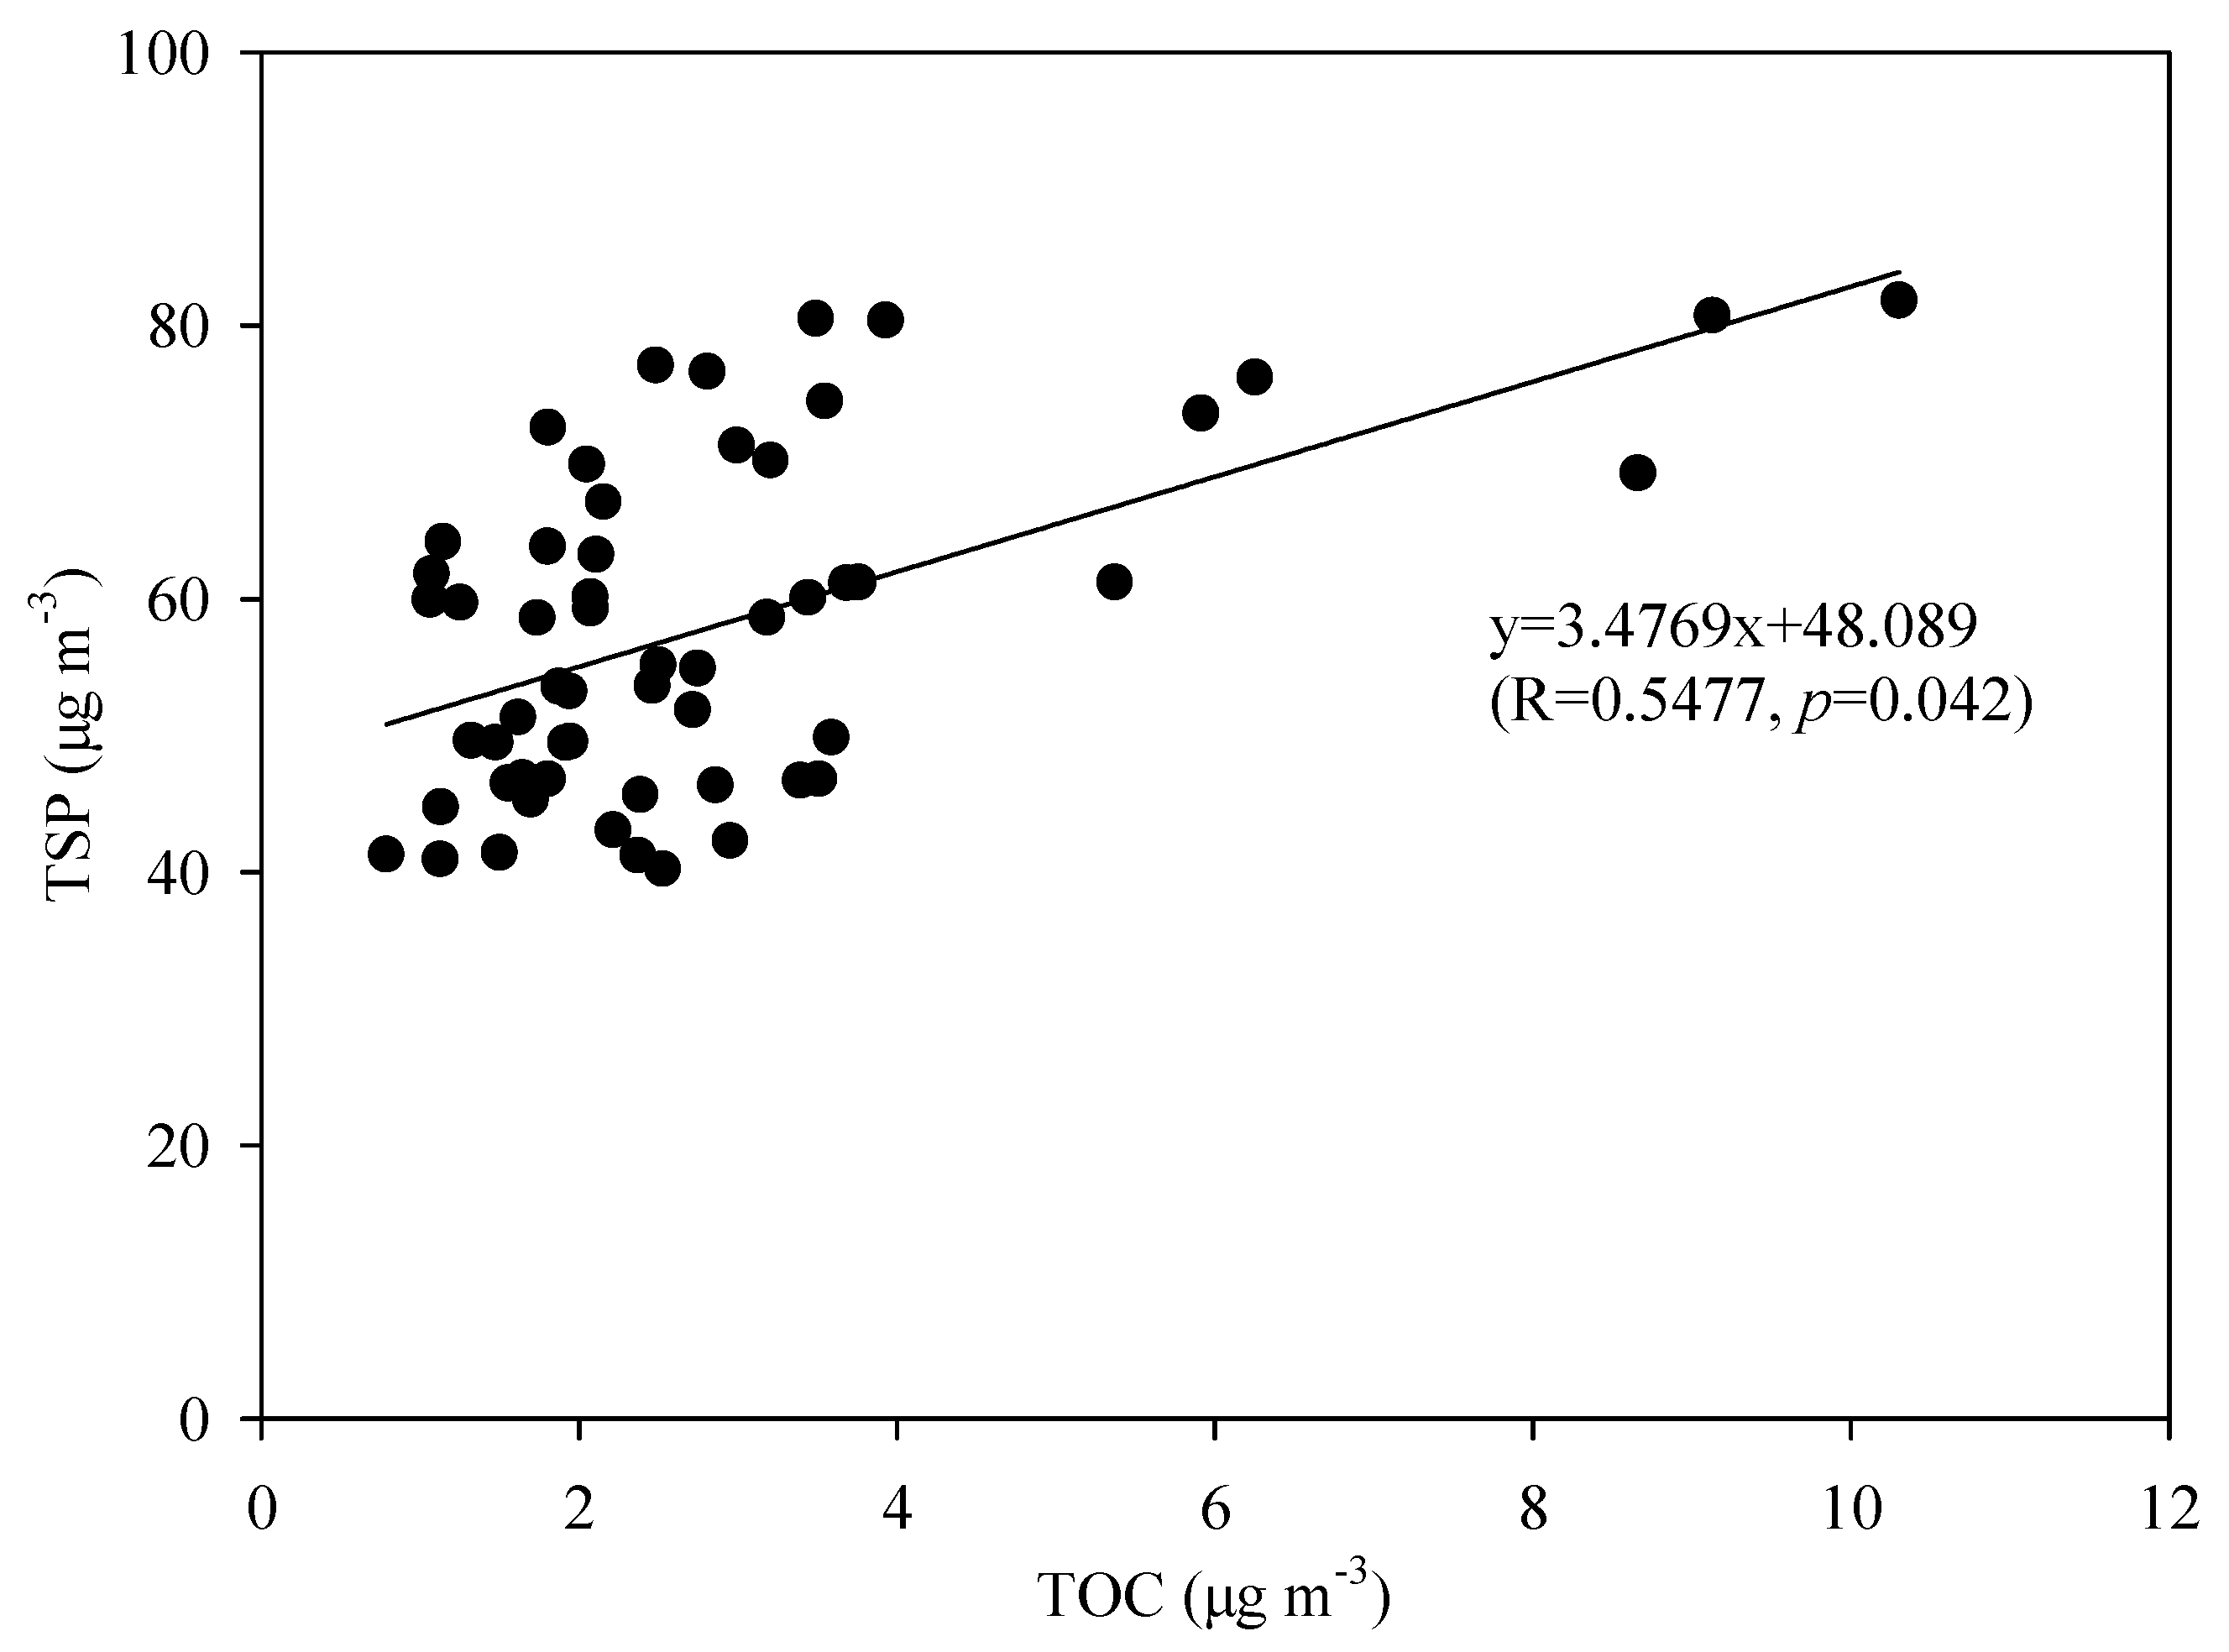
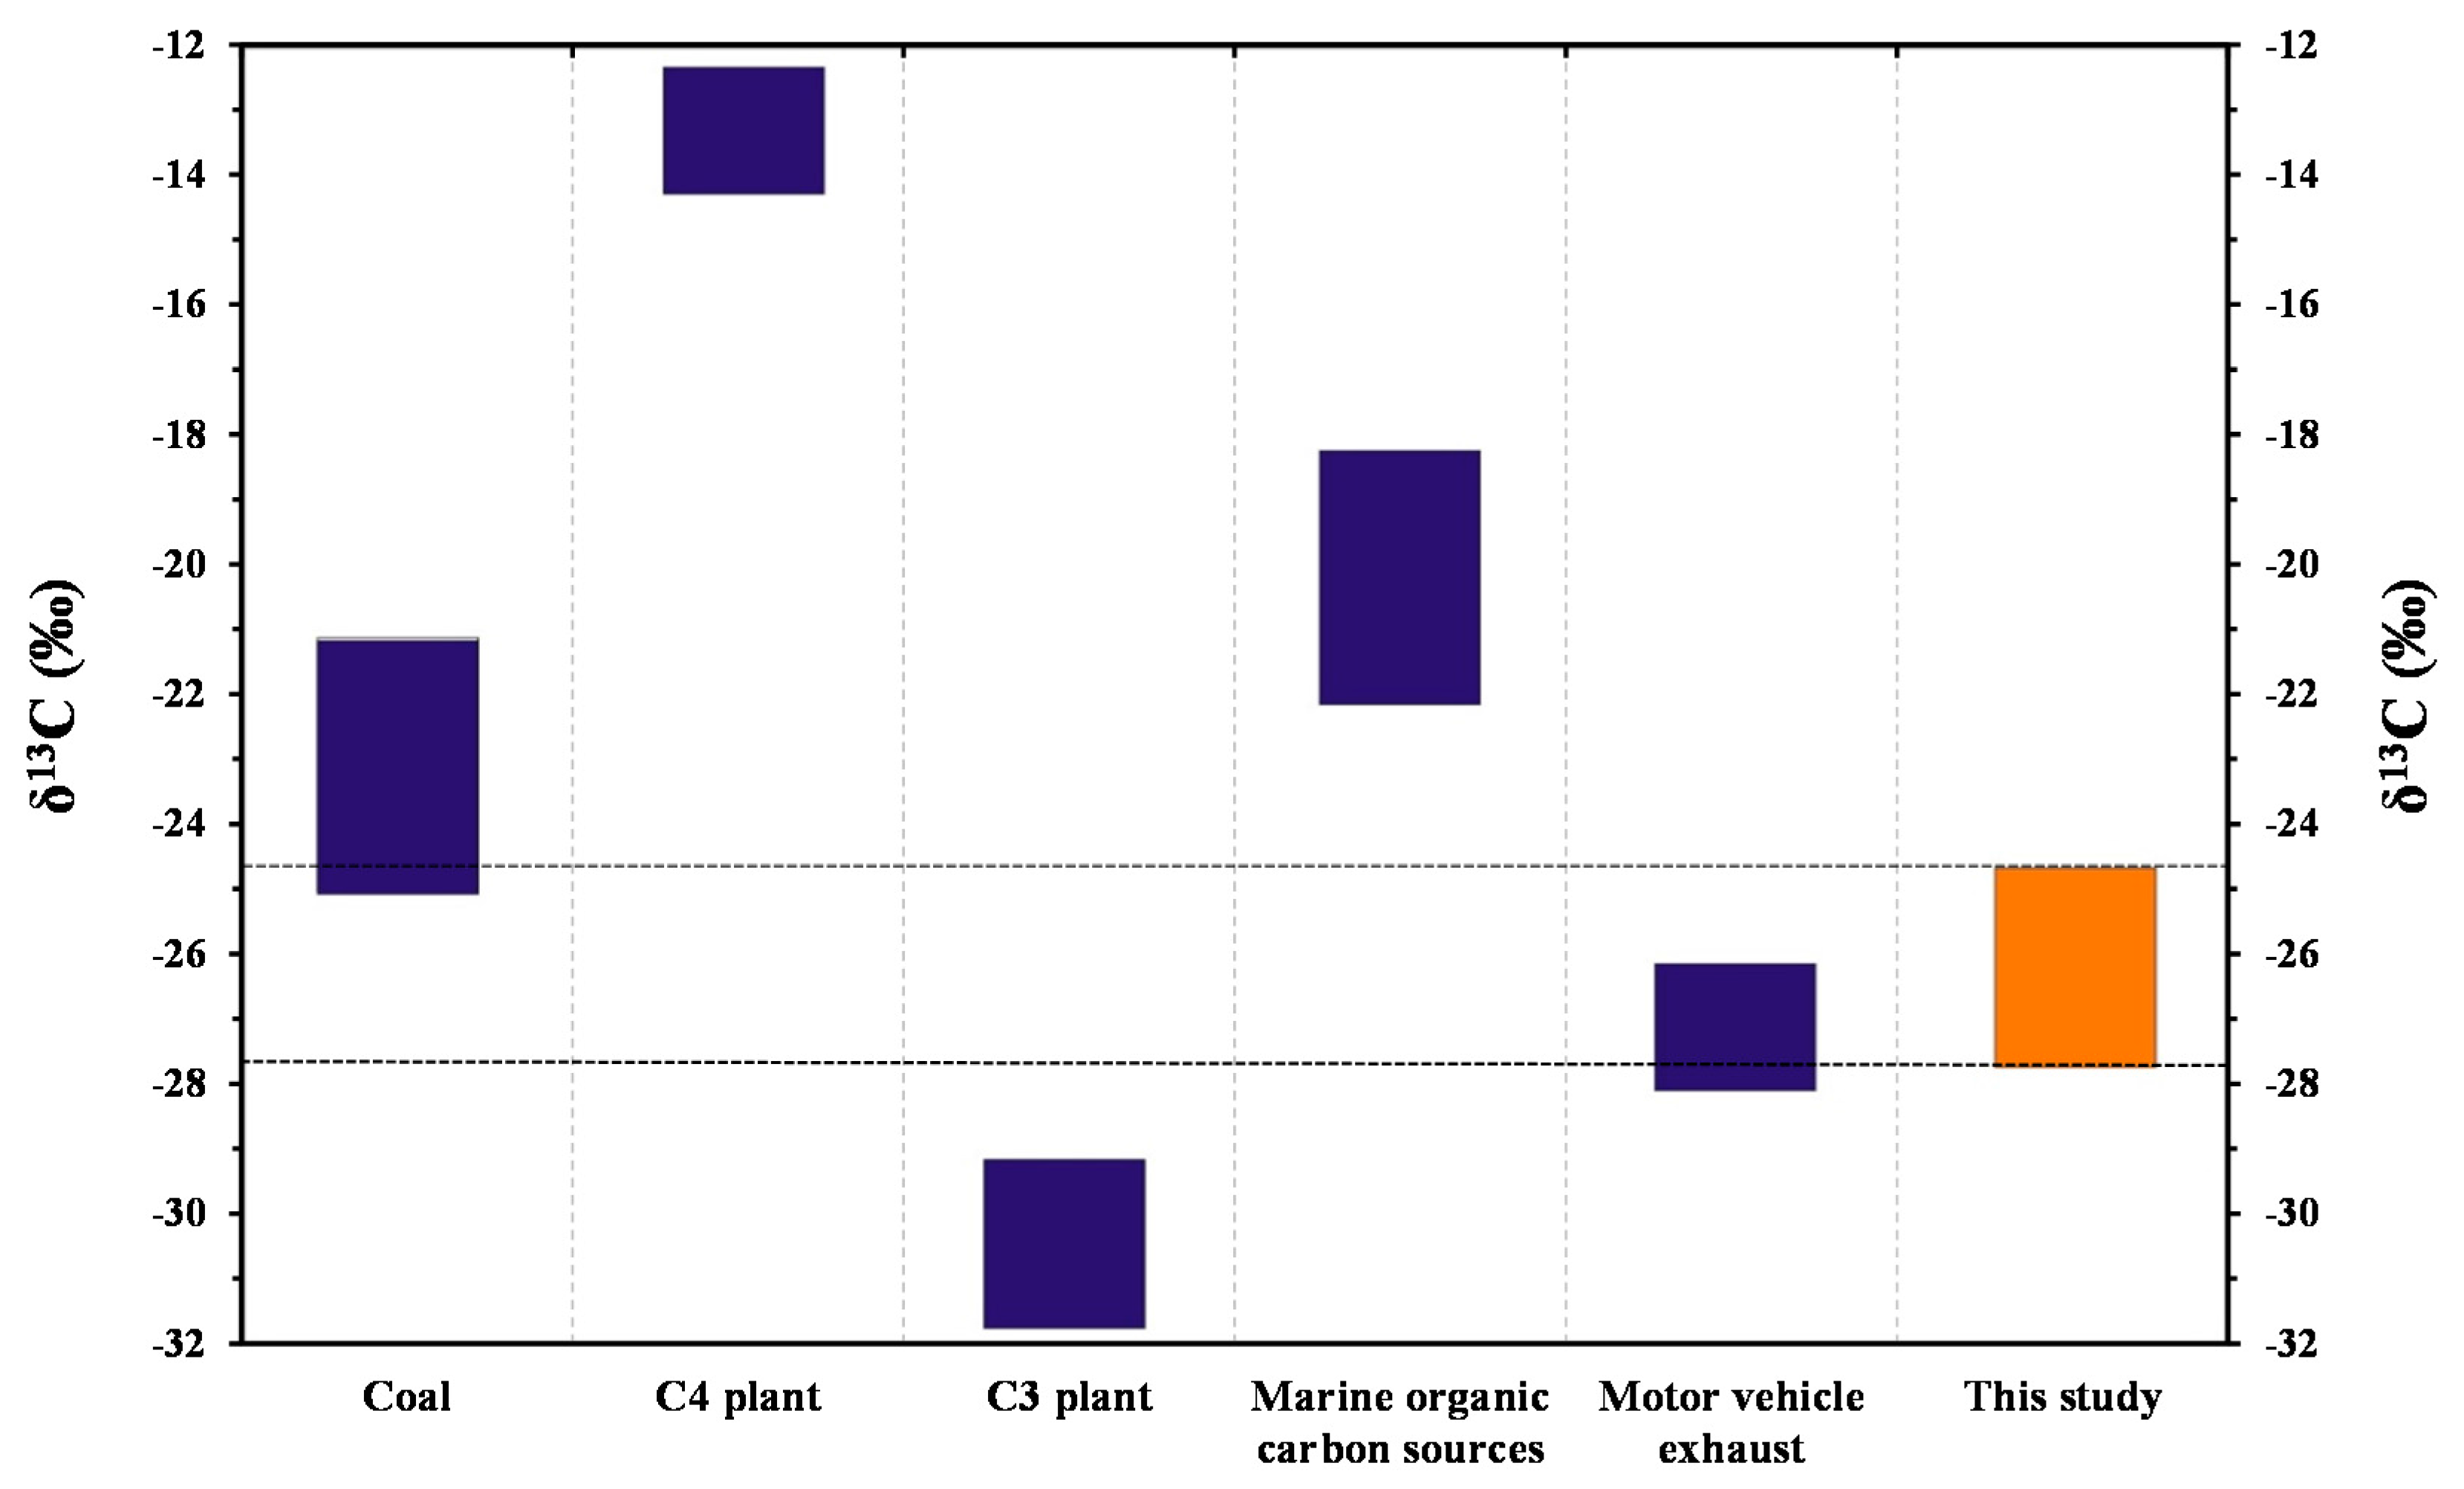
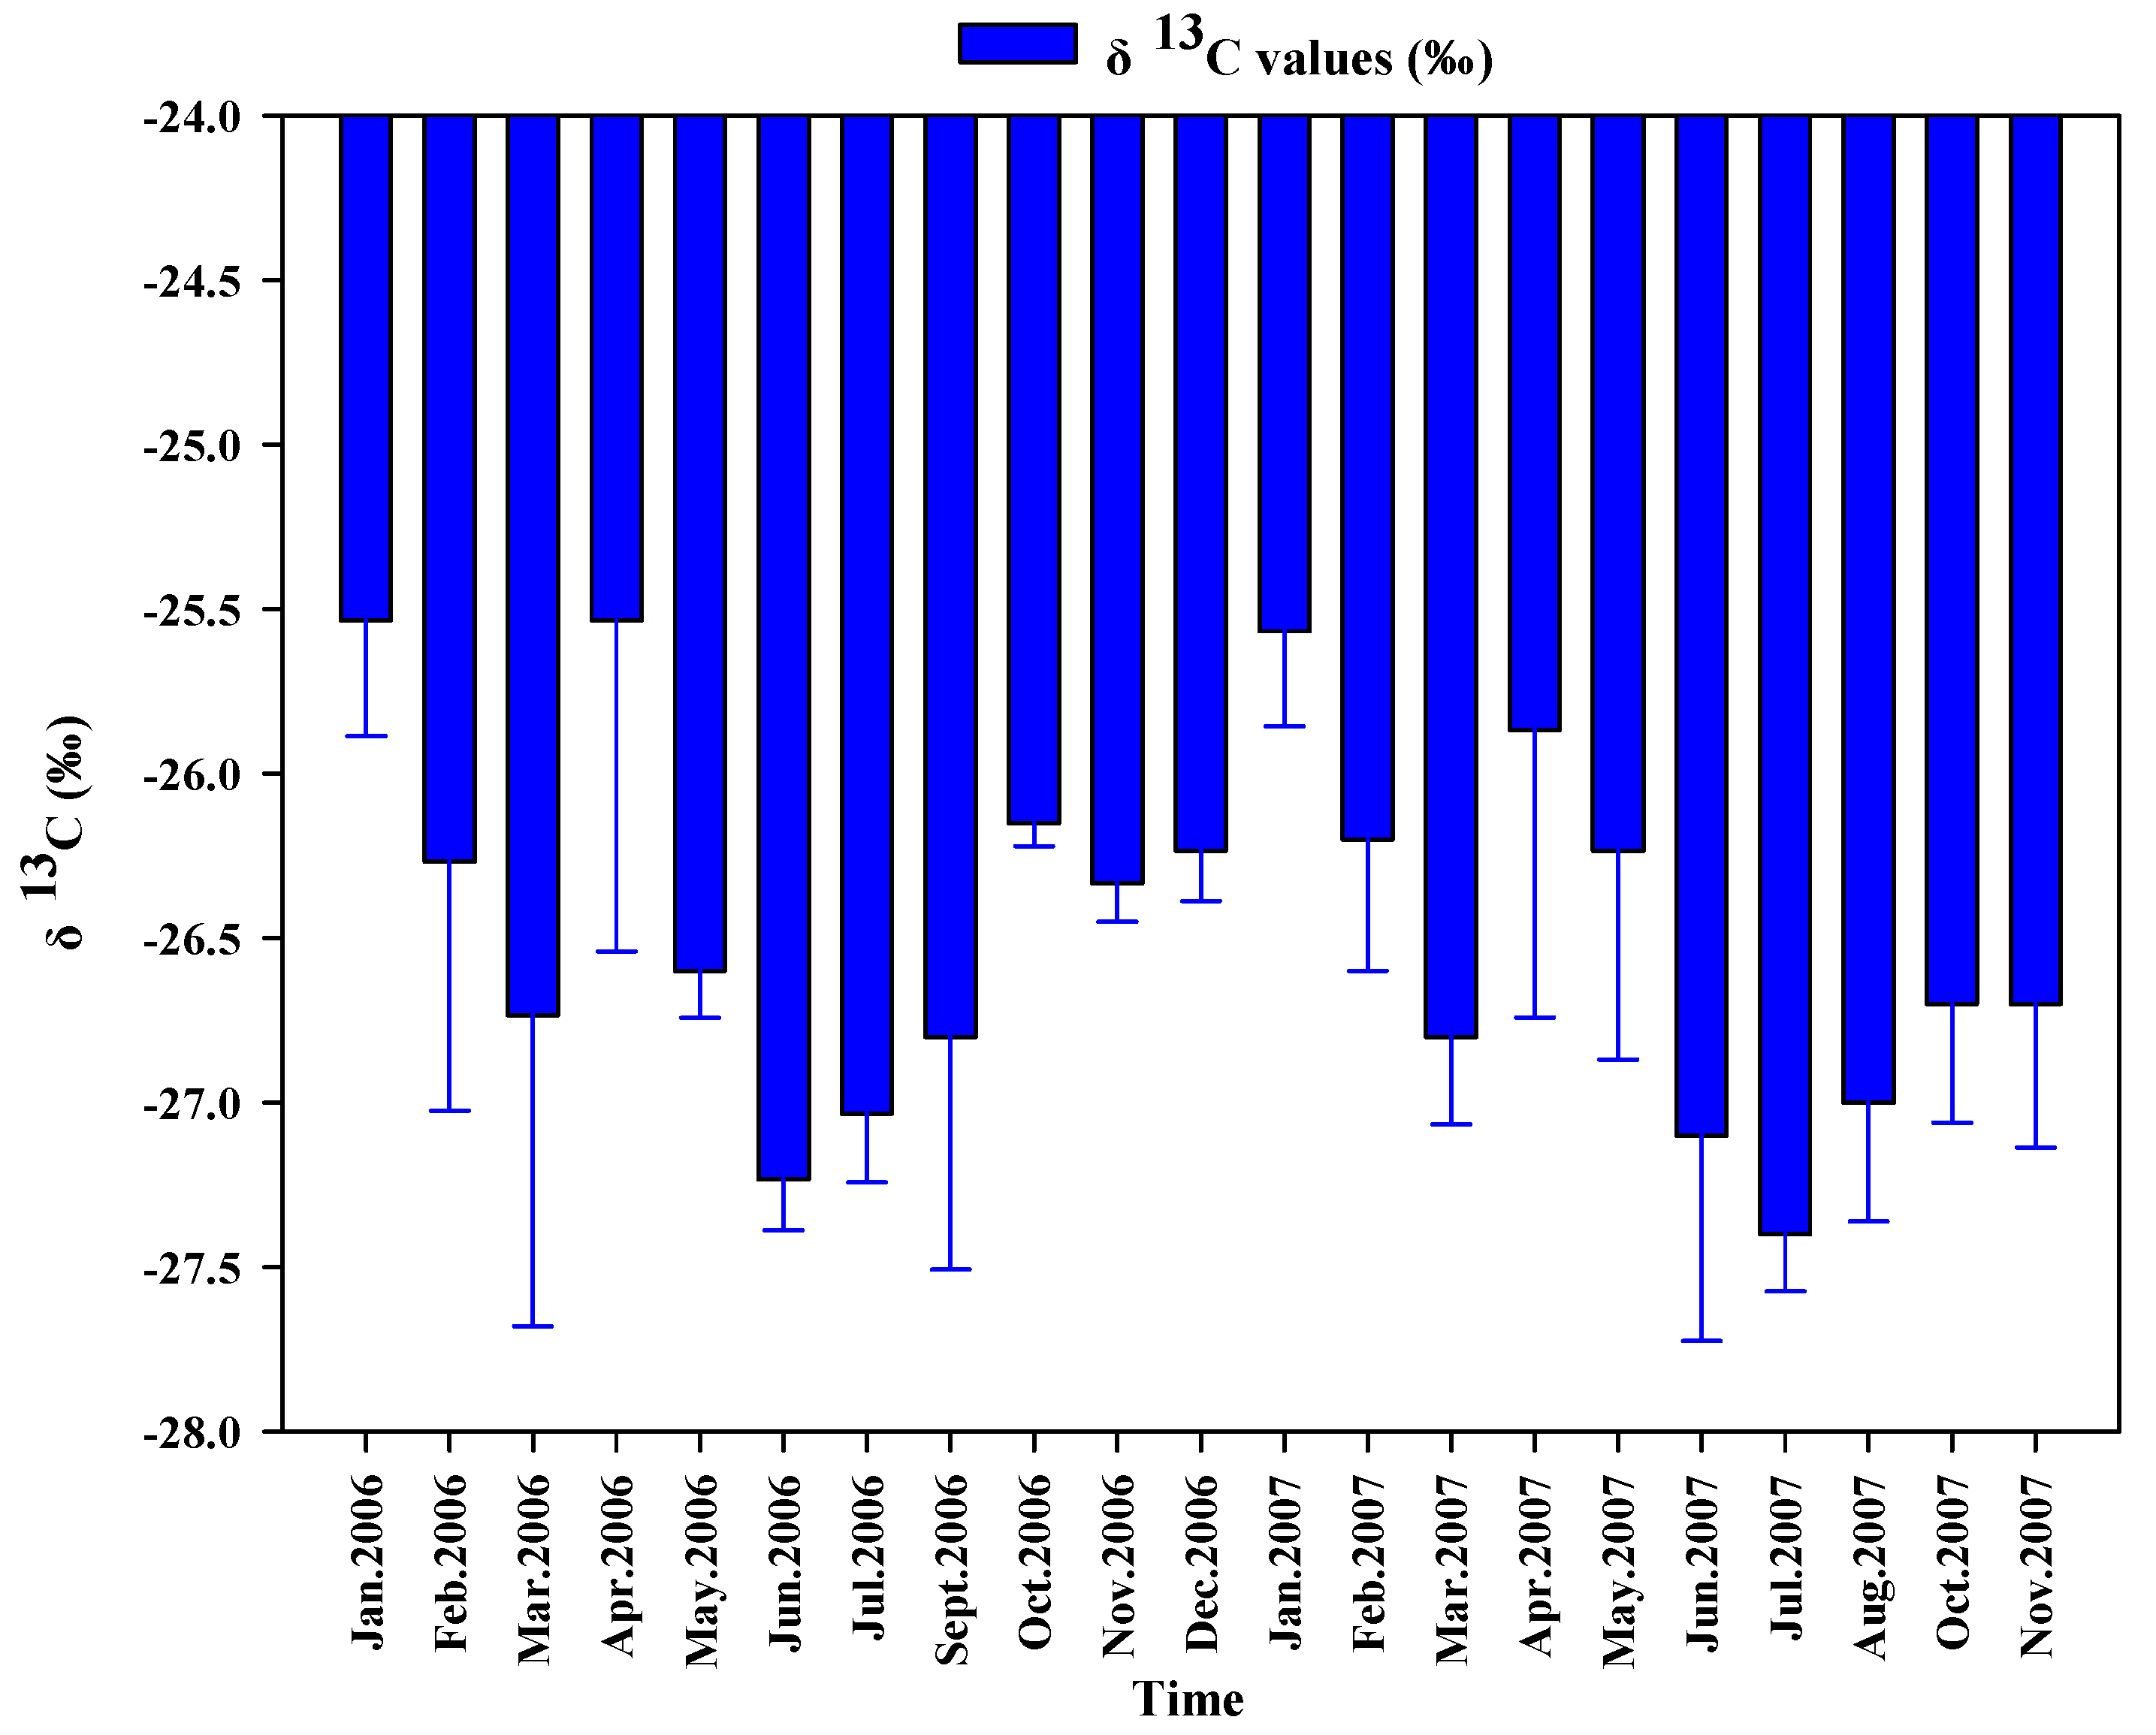
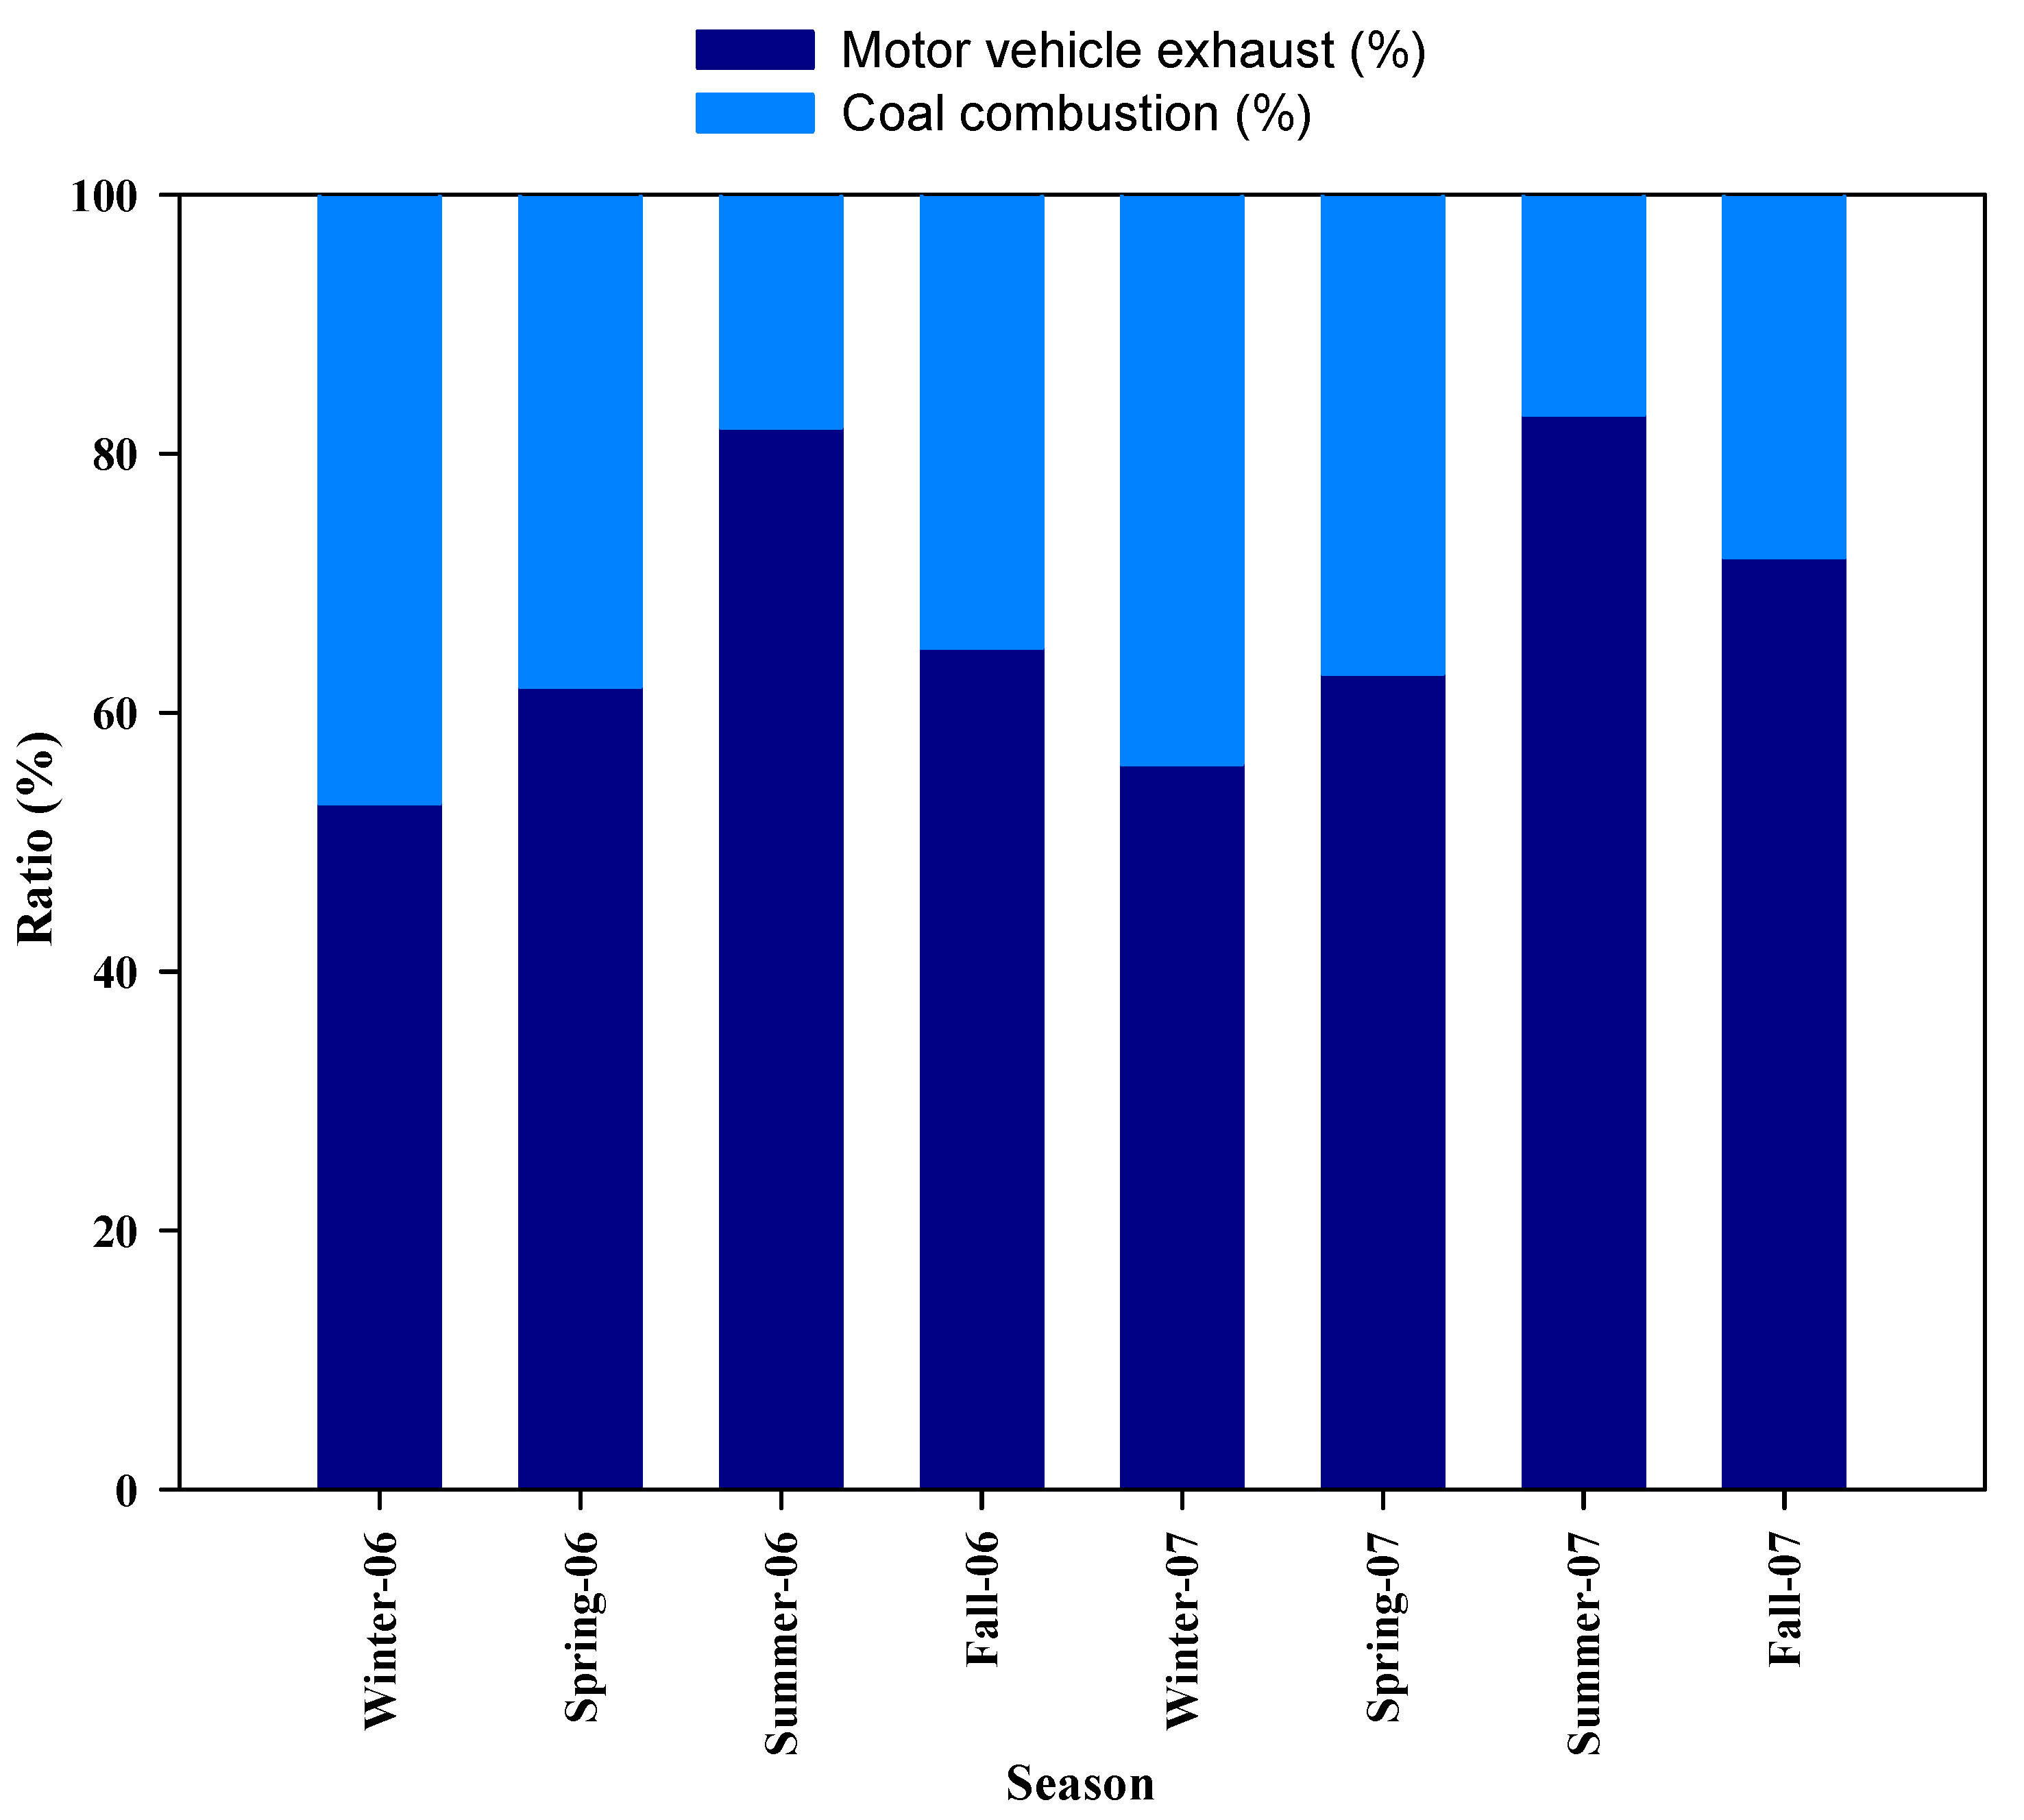
3.3.2. Influence of Total Organic Carbon and Possible Sources

Total organic carbon (TOC) is another significant variable that affects behaviour of POPs in particles. POPs in the atmosphere have a tendency to be absorbed by organic particulate matter, owing to their hydrophobicity. As shown in Table 3, the concentrations of PCB-28, 153, 187, 180, 189, 195, and 206 exhibited a significant positive correlation with TOC, and were dominated by highly-chlorinated PCBs, suggesting that TOC is also a significant variable affecting the distribution of these contaminants in atmospheric particles. The viscosity of PCBs increases with increasing number of chlorine atoms, and their hydrophobicity is also enhanced. However, no correlations were observed between other PCB congeners and TOC (p > 0.05). In general, the concentration of POPs was in proportion to the content of organic particulate matter for a particle-air system in equilibrium [47]. The results therefore indicate that the geographical distribution of PCB congeners does not reach equilibrium with organic matter in the atmospheric particles, due to interference from other factors. Certain artificial conditions may contribute to the disequilibrium [48], such as the constant fluctuations of TOC content resulting from waste incineration.
However, the correlations between TOC and TSP were significant during the sampling periods (Figure 5), indicating that they have similar sources. To further investigate the factors influencing the higher PCB concentrations in atmospheric particles in the winter, the stable carbon isotope (13C) of the TOC in particulate matter was measured to trace the sources of the particulate matter. As shown in Figure 6, the δ13C values in our study ranged from −27.8‰ to 24.6‰ during the sampling events, and were closer to the values from motor vehicle emissions and coal combustion than those from marine sources and biomass burning. A clear seasonal distribution pattern of the δ13C values was observed during the sampling period. Larger δ13C values were found during the cold season (winter and spring), whereas lower values were found during the summer (Figure 7), which is consistent with the seasonal variations in PCB concentrations (Figure 2). According to the δ13C values, the sources of atmospheric particulates in Pingtan are mainly influenced by motor vehicle emissions and coal combustion (Figure 6). Thus, the contribution rate of motor vehicle exhaust and coal combustion was calculated during the sampling period by a dyadic formula. The results showed that the contribution of atmospheric particulates was, on average, 67% from motor vehicle exhaust emissions and 33% from coal combustion. However, the contribution rate of coal combustion increased significantly from summer (18% and 17% in 2006 and 2007) to spring (38% and 37%) to winter (47% and 44%) (Figure 8). The results demonstrate that higher PCB and TSP concentrations appearing during the winter may be influenced by coal burning during the heating season.

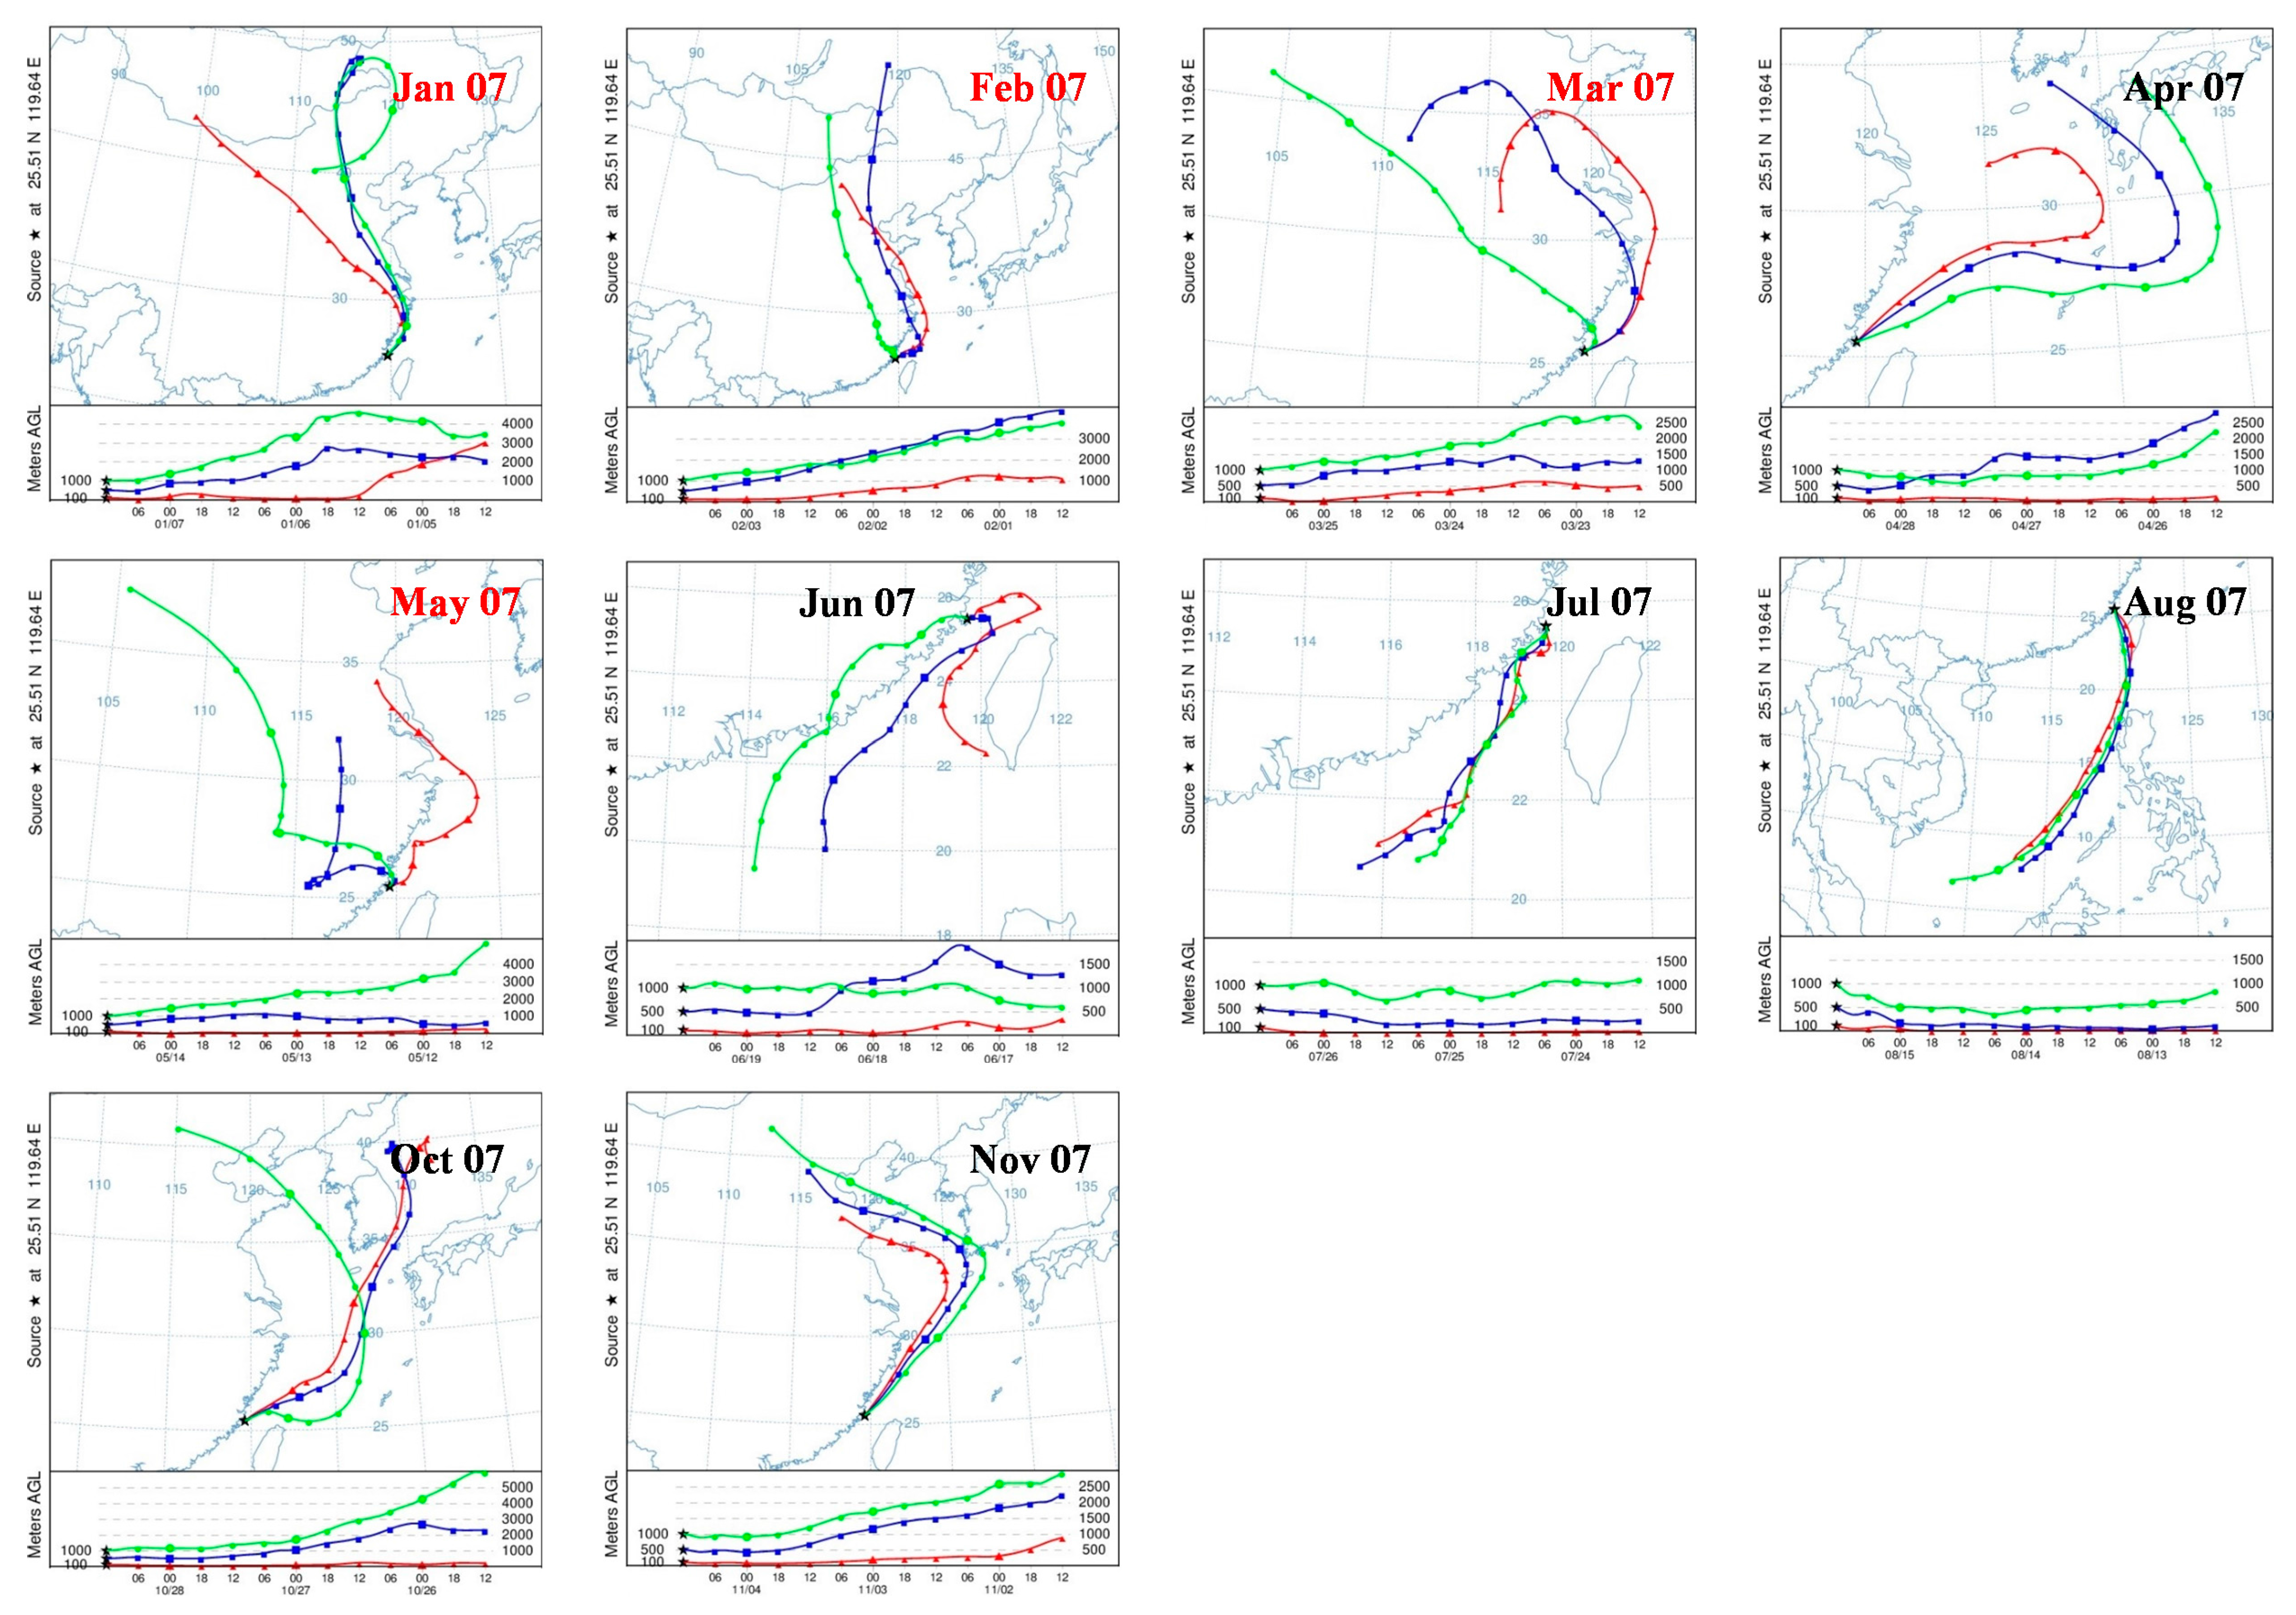
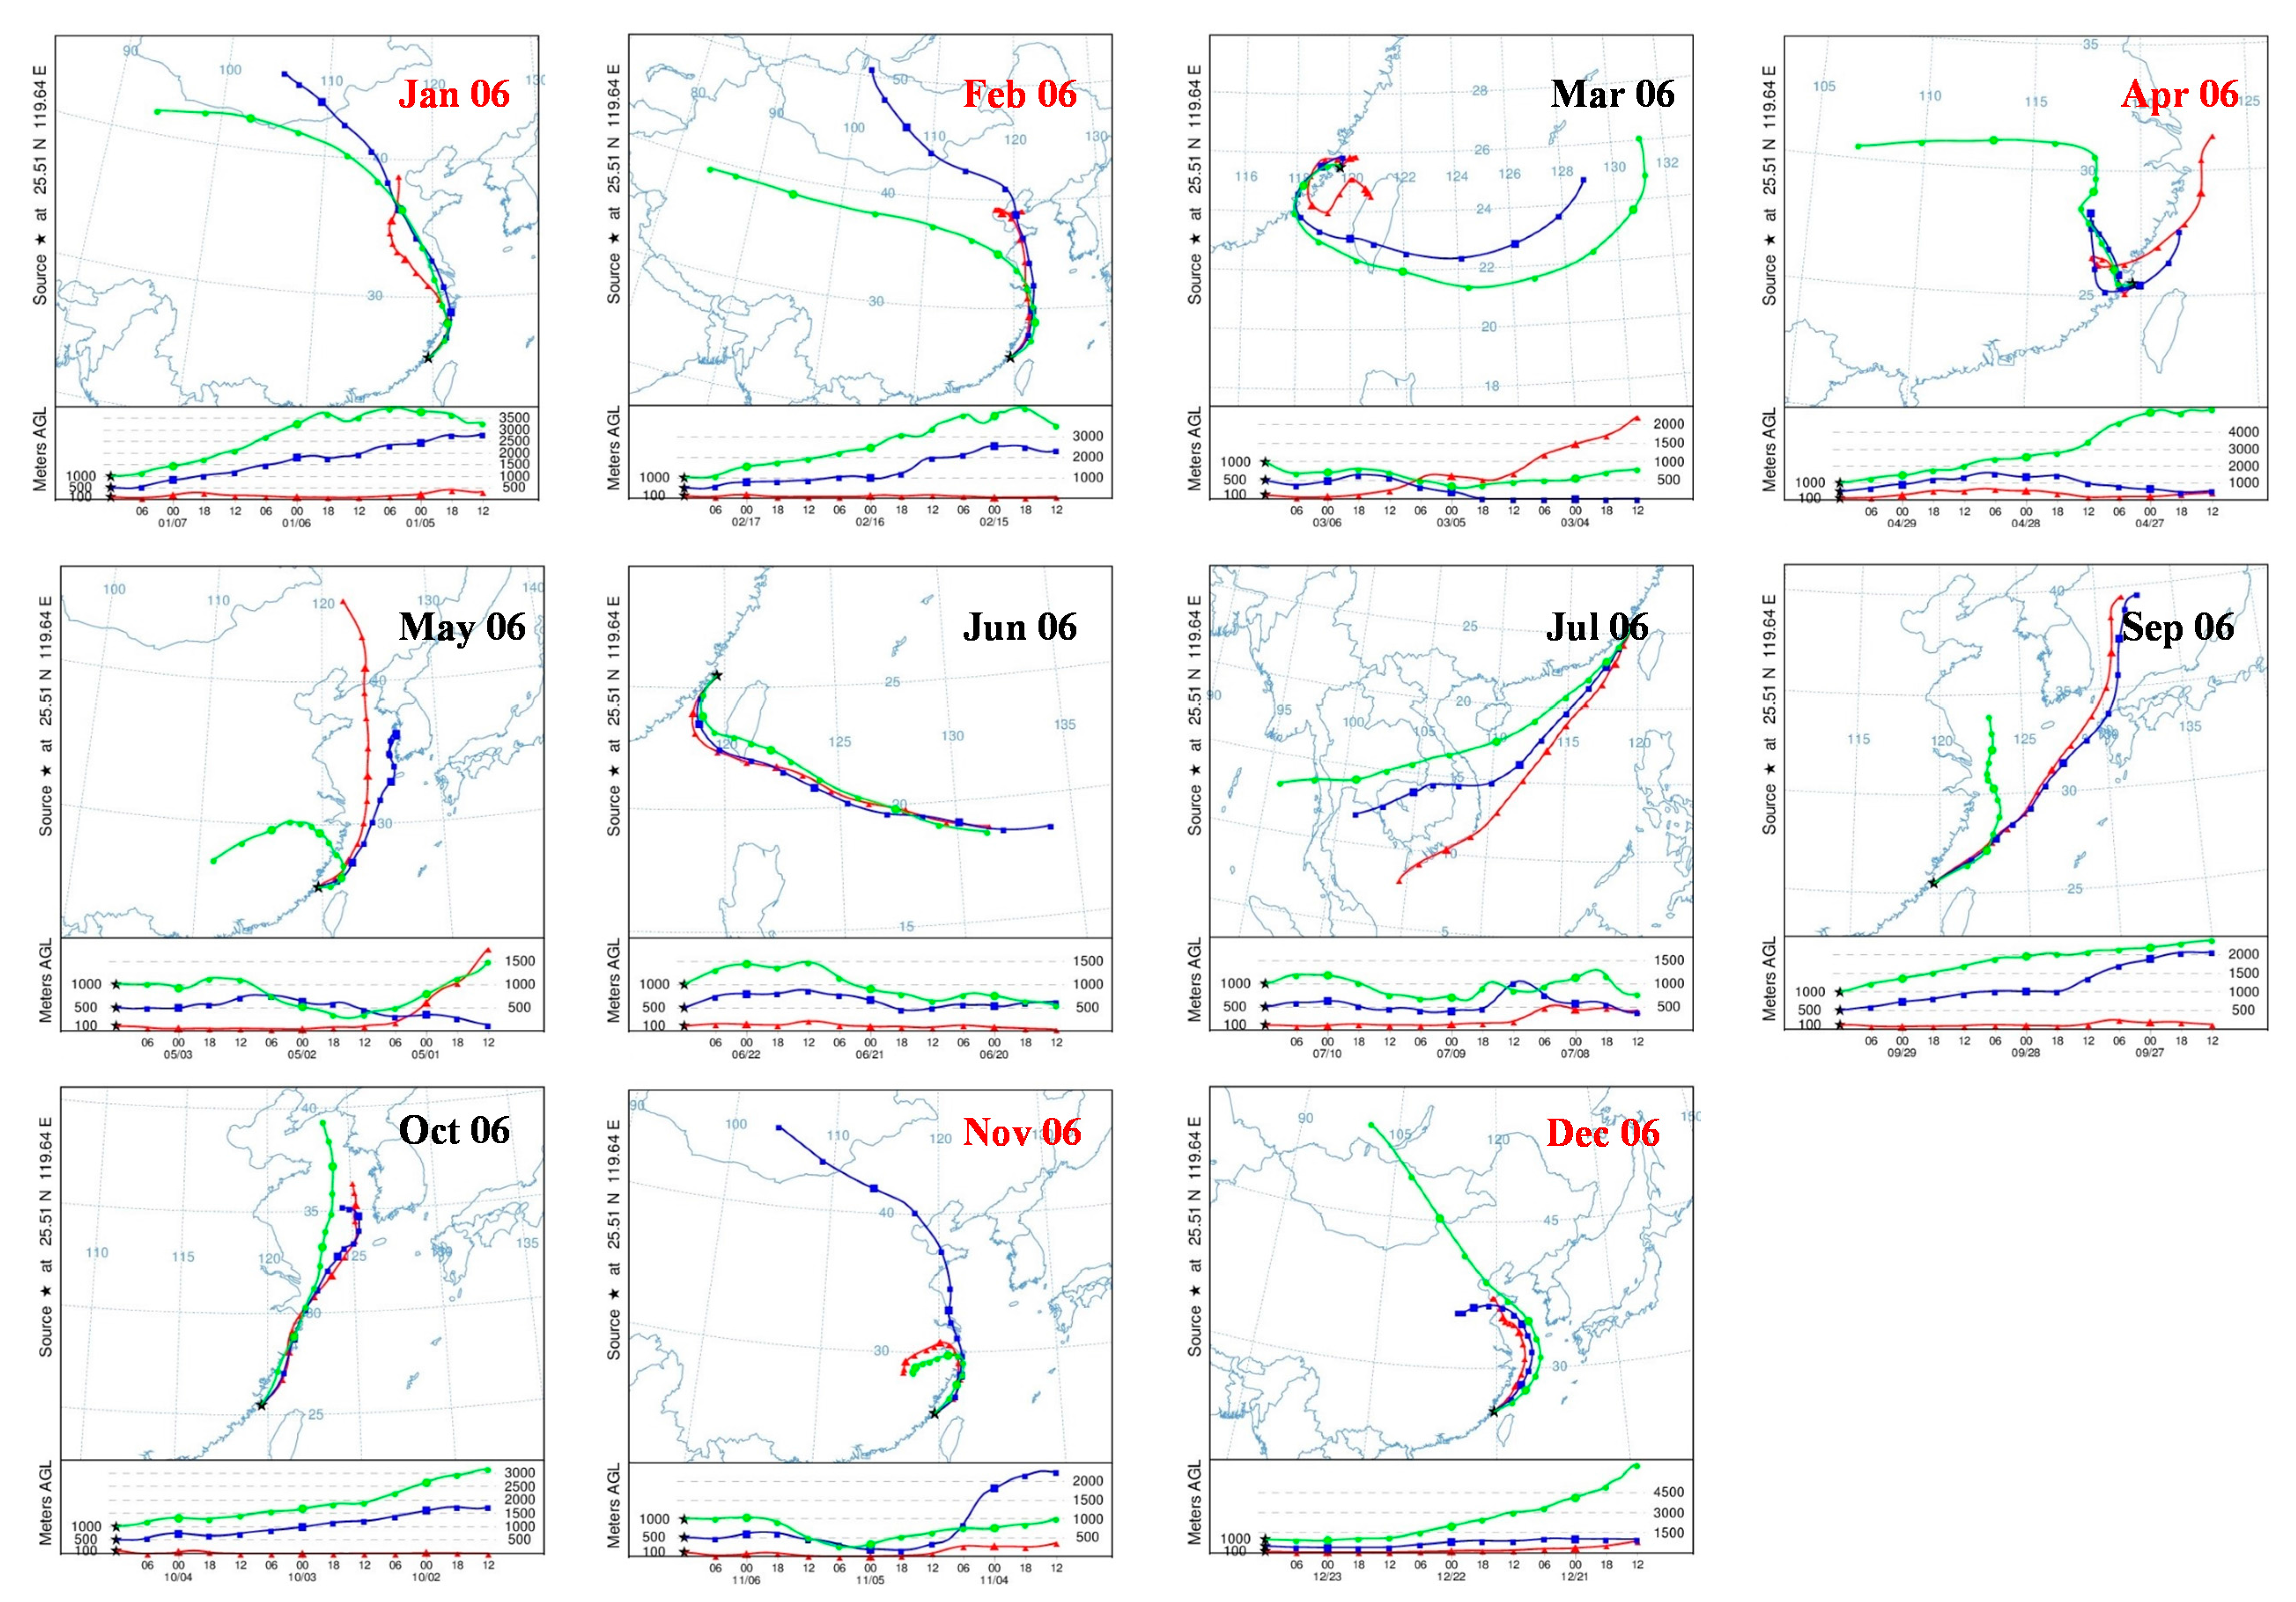
3.3.3. Influence of Air Mass Origin
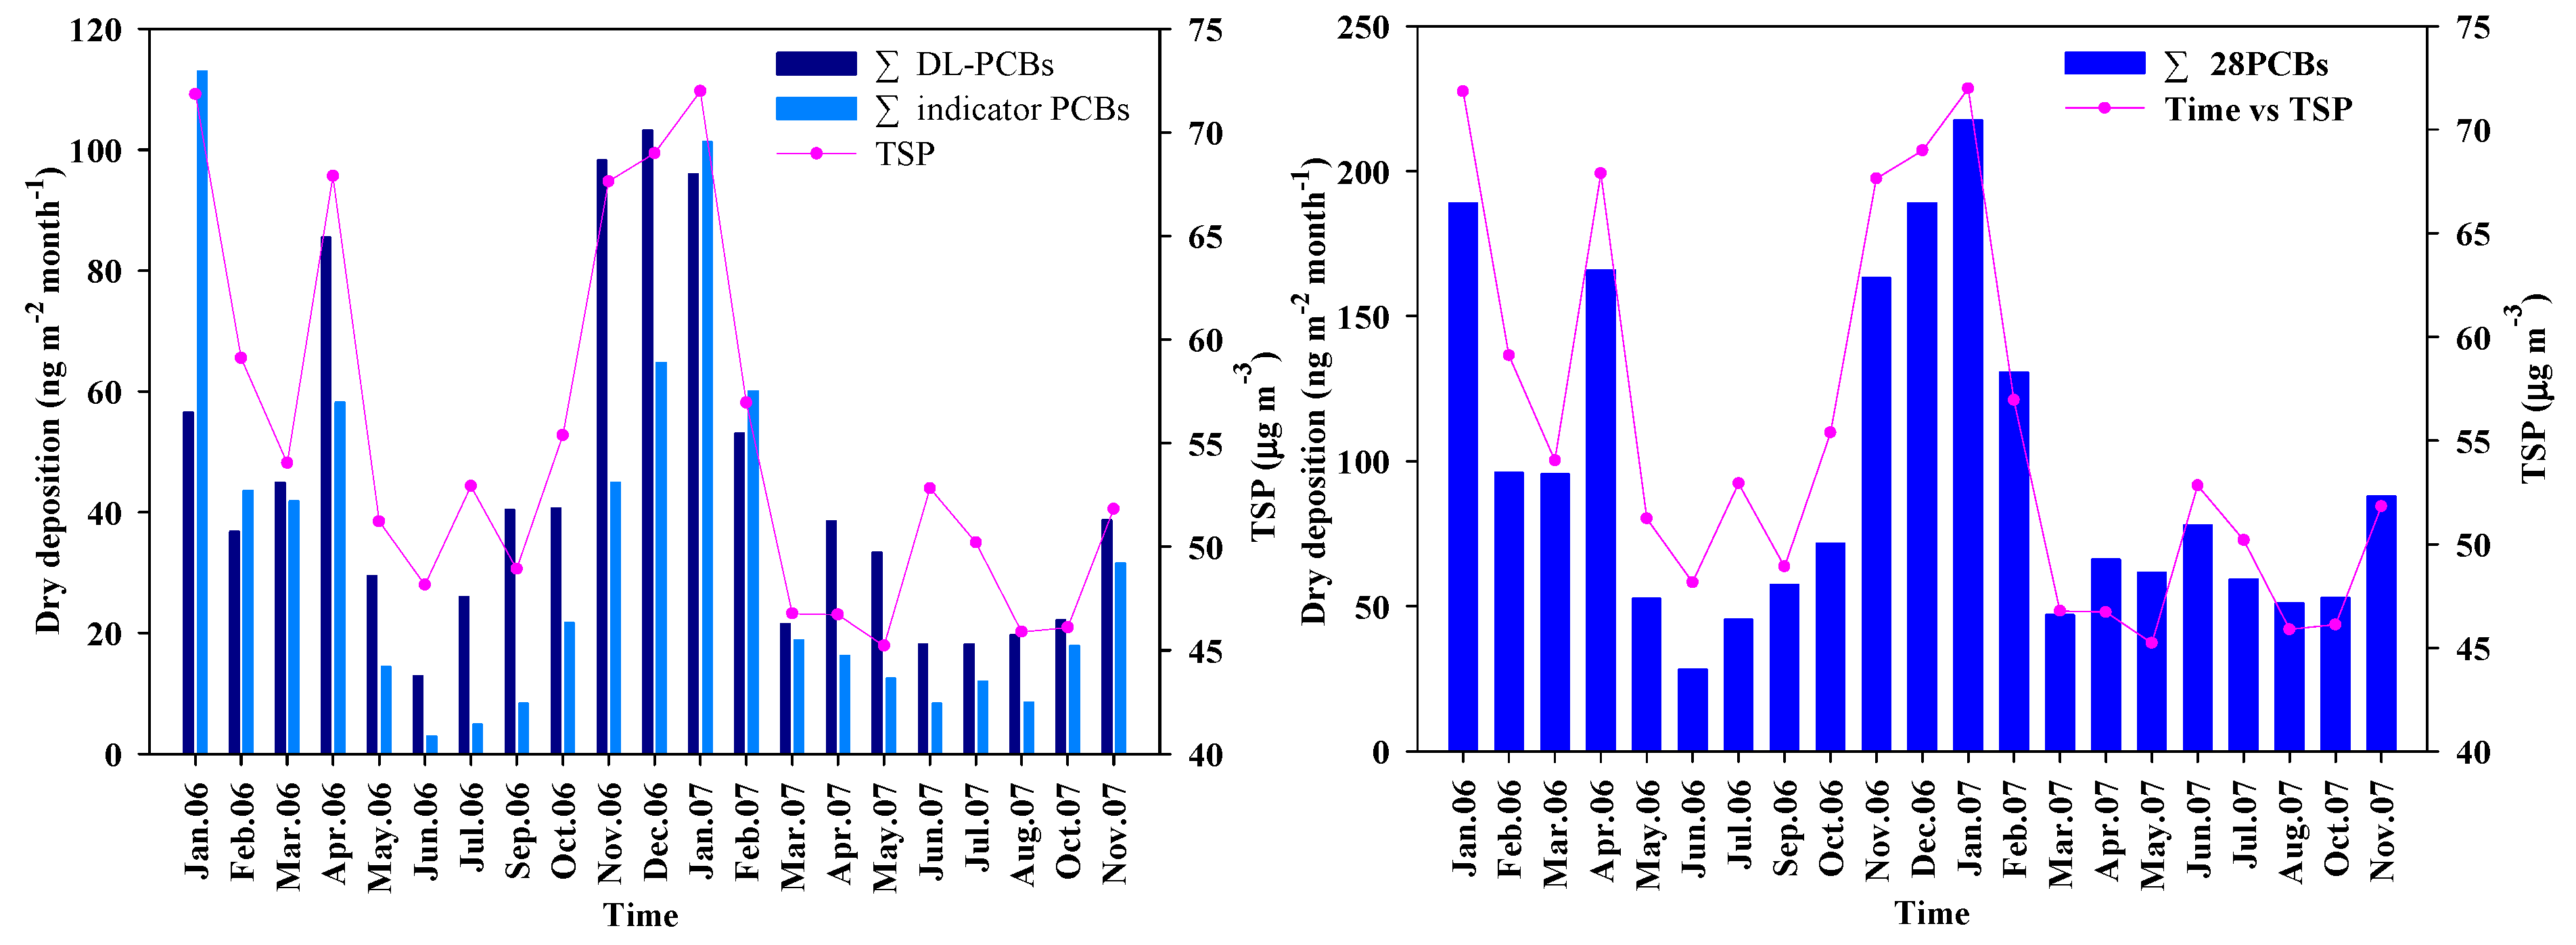
As shown in Figure 9, the air mass sources had distinct seasonal variations. The highest PCB concentrations (January 2006 and January 2007, Figure 4) were associated with influences from Northern Continental China air mass, whereas lower concentrations were observed in the months of May, June, and July 2006, and the trajectories exhibited a predominantly marine influence. Therefore, the higher PCB concentrations observed in the winter may be due to Northern Continental China air masses, whereas lower concentrations in the summer may be due to the “cleaner” marine air masses. In addition, the high wind speed at Pingtan Island mainly occurred in the winter; therefore, the higher PCB concentrations in atmospheric particles from Northern Continental China would have been transported to Pingtan Island during this period. However, upon further analysis, as mentioned above, the higher δ13C values appearing during the cold season may be influenced by coal combustion or marine sources, but the air mass origin was mainly Northern Continental China during this period. Therefore, slightly enriched δ13C values during the winter can be interpreted as being derived from coal combustion in the Northern Continental China during the heating season, and marine organic carbon sources were unlikely during this period. This provides further evidence that higher PCB concentrations in atmospheric particles appearing during the winter may be strongly influenced by coal burning during the heating season of Northern China.
Remarkably, the PCB levels observed in April 2006 were more than 2.5 times higher than the levels observed in April 2007 (Figure 3). The precipitation in April 2006 (206.2 mm) was similar to that in 2007 (205.7 mm), but the air mass origin differed greatly (Figure 9). Trajectories in April 2006 came from continental China, potentially importing a higher load of contaminants from the e-waste recycling area [19], whereas air mass trajectories in 2007 had a Western Pacific influence. This provides further evidence that different air mass sources have a great influence on the PCB levels in atmospheric particles from the coastal area.

3.4. Dry Deposition

The dry deposition flux of the 28 PCBs was 3.94 ng m−2 d−1 and 2.94 ng m−2 d−1 in 2006 and 2007, respectively. The monthly variations in the dry deposition fluxes of DL-PCBs, indicator PCBs, and ∑28 PCBs were strongly correlated with the TSP concentration, which exhibited an obvious seasonal pattern, generally with higher fluxes during the winter and lower fluxes in the summer (Figure 10). The deposition flux of DL-PCBs was higher than that of the indicator PCBs (Table 4).
The dry deposition of PCBs in Pingtan Island was much higher than that reported in the literature for coastal areas in Europe, but lower than that in urban and industrial areas of Europe (Table S4). Due to the combined effects of the particulate matter level, meteorological conditions, and northern continental air mass sources, the dry deposition fluxes of PCBs were significantly higher in the winter and lower in the summer. However, the dry deposition fluxes of DL-PCBs were much higher than those of indicator PCBs, partly because indicator PCBs include fewer PCB congeners and more volatile PCBs (28, 52 and 101), which easily volatilize into the gas phase [17]. It has been reported that dry particle deposition is the predominant route for the atmospheric deposition of POPs in coastal and inland surface waters [17,28,54]. According to the sea coverage area of Pingtan Island (6000 km2 surface), the total dry mass input of the 28 PCBs to Pingtan Island waters was 8620.2 g y−1 and 6442.2 g y−1 in 2006 and 2007, respectively, giving a yearly average of 7531.2 g y−1. But, it is worth noting that although the dry deposition fluxes of PCBs were relatively low in the summer, PCBs are likely to be input to the marine environment through wet deposition, due to frequent heavy rainfall during this period. This may increase the flux of PCBs into the adjacent waters.

4. Conclusions

A two-year dataset of PCB concentrations in atmospheric particles from Pingtan Island was generated. This study focused on potential factors influencing the concentration of particulate PCBs, seasonal variation, sources, and deposition at an isolated island in the coastal area of Southeast China. The PCB levels in atmospheric particles from Pingtan Island were dominated by highly-chlorinated PCBs, and the levels were lower than those in industrial, urban, and rural areas, but slightly higher than those in coastal areas in Europe and in the ocean. Clear seasonal variations in the PCB concentrations correlated significantly with the levels of particulates. Elevated PCB levels were found during the winter, whereas lower levels were observed in the summer. The seasonality of the atmospheric particle levels, meteorological conditions, and air mass origin were responsible for the distribution pattern. Moreover, TOC was also an important factor affecting the occurrence of some PCB congeners in atmospheric particles. Utilizing the stable carbon isotope (13C) to trace the source of the particulate matter, the results indicated that the higher PCB concentrations in atmospheric particles appearing in the winter may be strongly influenced by coal burning during the heating season in Northern China. According to the sea coverage area of Pingtan Island (6000 km2 surface), the total dry mass input of the 28 PCBs to Pingtan Island waters was, on average, 7531.2 g y−1.

Supplementary Materials

The following are available online at https://www.mdpi.com/2073-4433/9/2/59/s1, Figure S1: Frequency of wind direction at Pingtan Island from January 2006 to November 2007, Figure S2: Temporal variations of wind speed and ambient air temperature at Pingtan Island during the sampling periods, Text S1: Details on the sample pretreatment and analysis, Table S1: The number of chlorines for the various congeners, Table S2: Monthly average concentrations of PCBs in the atmospheric particulates of Pingtan Island in 2006, Table S3: Monthly average concentrations of PCBs in the atmospheric particulates of Pingtan Island in 2007, Table S4: PCB deposition fluxes reported in literature from different sites.

Acknowledgments

This work was supported by the Scientific Research Foundation of the Third Institute of Oceanography, SOA (2013012), the National Natural Science Foundation of China (41602360 and 41476066), the National Social Welfare Research Project (2004DIB5J178), the Foundation for Distinguished Young Teacher in Higher Education of Guangdong (YQ2014004), the Project of Enhancing School with Innovation of Guangdong Ocean University (GDOU2014050201) and Guangdong Natural Science Foundation of China (2016A030312004).

Author Contributions

Qibin Lao and Liping Jiao conceived and designed the study, analyzed the data, and wrote the manuscript; Fajin Chen and Liqi Chen collaborated in discussing the manuscript and modified the manuscript; Xia Sun helped perform the statistical analysis.

Conflicts of Interest

The authors declare no conflict of interest.

References

  1. Galbánmalagón, C.; Berrojalbiz, N.; Ojeda, M.J.; Dachs, J. The oceanic biological pump modulates the atmospheric transport of persistent organic pollutants to the arctic. Nat. Commun. 2012, 3, 862–870. [Google Scholar] [CrossRef] [PubMed]
  2. Kallenborn, R.; Oehme, M.; Wynn-Williams, D.D.; Schlabach, M.; Harris, J. Ambient air levels and atmospheric long-range transport of persistent organochlorines to Signy Island, Antarctica. Sci. Total Environ. 1998, 220, 167–180. [Google Scholar] [CrossRef]
  3. Breivik, K.; Sweetman, A.; Pacyna, J.M.; Jones, K.C. Towards a global historical emission inventory for selected PCB congeners—A mass balance approach: 1. Global production and consumption. Sci. Total Environ. 2002, 290, 181–198. [Google Scholar] [CrossRef]
  4. Xing, Y.; Lu, Y.; Dawson, R.W.; Shi, Y.; Zhang, H.; Wang, T.; Liu, W.; Ren, H. A spatial temporal assessment of pollution from PCBs in China. Chemosphere 2005, 60, 731–739. [Google Scholar] [CrossRef] [PubMed]
  5. Zhang, Z.; Liu, L.; Li, Y.F.; Wang, D.; Jia, H.; Harner, T.; Sverko, E.; Wan, X.; Xu, D.; Ren, N. Analysis of polychlorinated biphenyls in concurrently sampled Chinese air and surface soil. Environ. Sci. Technol. 2008, 42, 6514–6518. [Google Scholar] [CrossRef] [PubMed]
  6. Li, Y.F.; Harner, T.; Liu, L.; Zhang, Z.; Ren, N.Q.; Jia, H.; Ma, J.; Sverko, E. Polychlorinated biphenyls in global air and surface soil: Distributions, air−soil exchange, and fractionation effect. Environ. Sci. Technol. 2010, 44, 2784–2790. [Google Scholar] [CrossRef] [PubMed]
  7. Wang, Y.; Wu, X.; Hou, M.; Zhao, H.; Chen, R.; Luo, C.; Zhang, G. Factors influencing the atmospheric concentrations of PCBs at an abandoned e-waste recycling site in South China. Sci. Total Environ. 2016, 578, 34–39. [Google Scholar] [CrossRef] [PubMed]
  8. Cui, S.; Qi, H.; Liu, L.Y.; Song, W.W.; Ma, W.L.; Jia, H.L.; Ding, Y.S.; Li, Y.F. Emission of unintentionally produced polychlorinated biphenyls (up-PCBs) in China: Has this become the major source of PCBs in Chinese air? Atmos. Environ. 2013, 67, 73–79. [Google Scholar] [CrossRef]
  9. Friedman, C.L.; Selin, N.E. Pcbs in the arctic atmosphere: Determining important driving forces using a global atmospheric transport model. Atmos. Chem. Phys. 2016, 15, 30857–30894. [Google Scholar] [CrossRef]
  10. Shunthirasingham, C.; Gawor, A.; Hung, H.; Brice, K.A.; Su, K.; Alexandrou, N.; Dryfhout-Clark, H.; Backus, S.; Sverko, E.; Shin, C. Atmospheric concentrations and loadings of organochlorine pesticides and polychlorinated biphenyls in the canadian great lakes basin (GLB): Spatial and temporal analysis (1992–2012). Environ. Pollut. 2016, 217, 124–133. [Google Scholar] [CrossRef] [PubMed]
  11. Breivik, K.; Sweetman, A.; Pacyna, J.M.; Jones, K.C. Towards a global historical emission inventory for selected PCB congeners—A mass balance approach: 3. An update. Sci. Total Environ. 2007, 377, 296–307. [Google Scholar] [CrossRef] [PubMed]
  12. Castro-Jiménez, J.; Dueri, S.; Eisenreich, S.J.; Mariani, G.; Skejo, H.; Umlauf, G.; Zaldívar, J.M. Polychlorinated biphenyls (PCBs) in the atmosphere of sub-alpine Northern Italy. Environ. Pollut. 2009, 157, 1024–1032. [Google Scholar] [CrossRef] [PubMed]
  13. Gai, N.; Pan, J.; Tang, H.; Chen, S.; Chen, D.; Zhu, X.; Lu, G.; Yang, Y. Organochlorine pesticides and polychlorinated biphenyls in surface soils from ruoergai high altitude prairie, east edge of qinghai-tibet plateau. Sci. Total Environ. 2014, 478, 90–97. [Google Scholar] [CrossRef] [PubMed]
  14. Wania, F.; Mackay, D. Global fractionation and cold condensation of low volatility organochlorine compounds in Polar Regions. Ambio 1993, 22, 10–18. [Google Scholar]
  15. Ding, S.; Dong, F.; Wang, B. Polychlorinated biphenyls and organochlorine pesticides in atmospheric particulate matter of northern china: Distribution, sources, and risk assessment. Environ. Sci. Pollut. Res. 2015, 22, 1–11. [Google Scholar] [CrossRef] [PubMed]
  16. Wang, H.S.; Zhao, Y.G.; Man, Y.B. Oral bioaccessibility and human risk assessment of organochlorine pesticides (OCPs) via fish consumption, using an in vitro gastrointestinal model. Food Chem. 2011, 127, 1673–1679. [Google Scholar] [CrossRef]
  17. Castro-Jiménez, J.; Mariani, G.; Vives, I.; Skejo, H.; Umlauf, G.; Zaldívar, J.M.; Dueri, S.; Messiaen, G.; Laugier, T. Atmospheric concentrations, occurrence and deposition of persistent organic pollutants (POPs) in a mediterranean coastal site (Etang de Thau, France). Environ. Pollut. 2011, 159, 1948–1956. [Google Scholar] [CrossRef] [PubMed]
  18. Die, Q.; Nie, Z.; Liu, F.; Tian, Y.; Fang, Y.; Gao, H.; Tian, S.; He, J.; Huang, Q. Seasonal variations in atmospheric concentrations and gas–particle partitioning of PCDD/Fs and dioxin-like PCBs around industrial sites in Shanghai, China. Atmos. Environ. 2015, 119, 220–227. [Google Scholar] [CrossRef]
  19. Li, Y.M.; Jiang, G.B.; Wang, Y.W.; Pu, W.; Zhang, Q.H. Concentrations, profiles and gas-particle partitioning of PCDD/Fs, PCBs and PBDEs in the ambient air of an e-waste dismantling area, Southeast China. Sci. Bull. 2008, 53, 521–528. [Google Scholar] [CrossRef]
  20. Xing, G.H.; Chan, J.K.; Leung, A.O.; Wu, S.C.; Wong, M.H. Environmental impact and human exposure to PCBs in Guiyu, an electronic waste recycling site in China. Environ. Int. 2009, 35, 76–82. [Google Scholar] [CrossRef] [PubMed]
  21. Zhang, Z.L.; Hong, H.S.; Zhou, J.L.; Huang, J.; Yu, G. Fate and assessment of persistent organic pollutants in water and sediment from Minjiang River estuary, Southeast China. Chemosphere 2003, 52, 1423–1430. [Google Scholar] [CrossRef]
  22. Fu, J.; Mai, B.; Sheng, G.; Zhang, G.; Wang, X.; Peng, P.A.; Xiao, X.; Ran, R.; Cheng, F.; Peng, X. Persistent organic pollutants in environment of the pearl river delta, china: An overview. Chemosphere 2003, 52, 1411–1422. [Google Scholar] [CrossRef]
  23. Wang, H.S.; Du, J.; Leung, H.M.; Leung, A.O.W.; Liang, P.; Giesy, J.P.; Wong, C.K.C.; Wong, M.H. Distribution and source apportionments of polychlorinated biphenyls (PCBs) in mariculture sediments from the Pearl River delta, South China. Mar. Pollut. Bull. 2011, 63, 516–522. [Google Scholar] [CrossRef] [PubMed]
  24. Xing, Y.; Lü, Y.L.; Liu, W.B.; Shi, Y.J.; Luo, W.; Ren, H.C. Assessment of PCB pollution in spatial distribution and analysis of the PCB sources in sediments in China. Environ. Sci. 2006, 27, 228–234. [Google Scholar]
  25. He, J.; Balasubramanian, R. Semi-volatile organic compounds (SVOCs) in ambient air and rainwater in a tropical environment: Concentrations and temporal and seasonal trends. Chemosphere 2010, 78, 742–751. [Google Scholar] [CrossRef] [PubMed]
  26. Dvorská, A.; Lammel, G.; Holoubek, I. Recent trends of persistent organic pollutants in air in central Europe—Air monitoring in combination with air mass trajectory statistics as a tool to study the effectivity of regional chemical policy. Atmos. Environ. 2009, 43, 1280–1287. [Google Scholar] [CrossRef]
  27. Mi, H.H.; Wu, Z.S.; Lin, L.F.; Lai, Y.C.; Lee, Y.Y.; Wang, L.C.; Chang-Chien, G.P. Atmospheric dry deposition of polychlorinated dibenzo-p-dioxins/dibenzofurans (PCDD/Fs) and polychlorinated biphenyls (PCBs) in Southern Taiwan. Aerosol Air Qual. Res. 2012, 12, 1016–1029. [Google Scholar] [CrossRef]
  28. Yue, Q.; Zhang, K.; Zhang, B.Z.; Li, S.M.; Zeng, E.Y. Occurrence, phase distribution and depositional intensity of dichlorodiphenyltrichloroethane (DDT) and its metabolites in air and precipitation of the Pearl River delta, China. Chemosphere 2011, 84, 446–451. [Google Scholar] [CrossRef] [PubMed]
  29. Lee, W.J.; Su, C.C.; Sheu, H.L.; Fan, Y.C.; Chao, H.R.; Fang, G.C. Monitoring and modeling of PCB dry deposition in Urban area. J. Hazard. Mater. 1996, 49, 57–88. [Google Scholar] [CrossRef]
  30. Lee, W.J.; Lewis, S.J.L.; Chen, Y.Y.; Wang, Y.F.; Sheu, H.L.; Su, C.C.; Fan, Y.C. Polychlorinated biphenyls in the ambient air of petroleum refinery, urban and rural areas. Atmos. Environ. 1996, 30, 2371–2378. [Google Scholar] [CrossRef]
  31. Bozlaker, A.; Odabasi, M.; Muezzinoglu, A. Dry deposition and soil-air gas exchange of polychlorinated biphenyls (PCBs) in an industrial area. Environ. Pollut. 2008, 156, 784–793. [Google Scholar] [CrossRef] [PubMed]
  32. Yang, G.S.; Ma, L.L.; Xu, D.D.; Li, J.; Gong, C.; Zhang, B.; Chen, Y.; Chai, Z.F. Characterization of polychlorinated biphenyls in summer precipitation and atmosphere in Shijingshan district, Beijing. China Environ. Sci. 2012, 32, 1234–1240. [Google Scholar]
  33. Pan, J.; Yang, Y.L.; Zhang, G.; Shi, J.L.; Zhu, X.H.; Li, Y.; Yu, H.Q. Simultaneous observation of seasonal variations of beryllium-7 and typical pops in near-surface atmospheric aerosols in Guangzhou, China. Atmos. Environ. 2011, 45, 3371–3380. [Google Scholar] [CrossRef]
  34. Zhao, J.P.; Zhang, F.W.; Chen, J.S.; Ya, X.U. Pollution characteristics of atmospheric polychlorinated biphenyls in coastal city. Environ. Sci. Technol. 2011, 34, 59–65. [Google Scholar]
  35. Yeo, H.G.; Choi, M.; Chun, M.Y.; Kim, T.W.; Cho, K.C.; Sunwoo, Y. Concentration characteristics of atmospheric PCBs for urban and rural area, Korea. Sci. Total Environ. 2004, 324, 261–270. [Google Scholar] [CrossRef] [PubMed]
  36. Mandalakis, M.; Tsapakis, M.; Tsoga, A.; Stephanou, E.G. Gas–particle concentrations and distribution of aliphatic hydrocarbons, PAHs, PCBs and PCDD/Fs in the atmosphere of Athens (Greece). Atmos. Environ. 2002, 36, 4023–4035. [Google Scholar] [CrossRef]
  37. Wang, Z.; Na, G.; Gao, H.; Wang, Y.; Yao, Z. Atmospheric concentration characteristics and gas/particle partitioning of PCBs from the north pacific to the Arctic Ocean. Acta Oceanol. Sin. 2014, 33, 32–39. [Google Scholar] [CrossRef]
  38. Kim, K.S.; Masunaga, S. Behavior and source characteristic of PCBs in urban ambient air of Yokohama, Japan. Environ. Pollut. 2005, 138, 290–298. [Google Scholar] [CrossRef] [PubMed]
  39. Shin, S.K.; Jin, G.Z.; Kim, W.I.; Kim, B.H.; Hwang, S.M.; Hong, J.P.; Park, J.S. Nationwide monitoring of atmospheric PCDD/Fs and dioxin-like PCBs in South Korea. Chemosphere 2011, 83, 1339–1344. [Google Scholar] [CrossRef] [PubMed]
  40. Luo, J.; Cui, Z.J.; Du, S.Y.; Fan, G.L. Temporal variation and meteorological dependence of polychlorinated biphenyls in atmospheric pm10 of Jinan, China. Adv. Mater. Res. 2013, 780, 1250–1253. [Google Scholar] [CrossRef]
  41. Wang, Y.; Luo, C.; Wang, S.; Cheng, Z.; Li, J.; Zhang, G. The abandoned e-waste recycling site continued to act as a significant source of polychlorinated biphenyls: An in situ assessment using fugacity samplers. Environ. Sci. Technol. 2016, 50, 8623–8630. [Google Scholar] [CrossRef] [PubMed]
  42. Simcik, M.F.; Franz, T.P.; Zhang, H.; Eisenreich, S.J. Gas-particle partitioning of PCBs and PAHs in the Chicago urban and adjacent coastal atmosphere:  States of equilibrium. Environ. Sci. Technol. 2015, 32, 251–257. [Google Scholar] [CrossRef]
  43. Shen, L.; Wania, F.; Lei, Y.D.; Teixeira, C.; Muir, D.C.; Xiao, H. Polychlorinated biphenyls and polybrominated diphenyl ethers in the North American atmosphere. Environ. Pollut. 2006, 144, 434–444. [Google Scholar] [CrossRef] [PubMed]
  44. Chen, S.J.; Hsieh, L.T.; Hwang, P.S. Concentration, phase distribution, and size distribution of atmospheric polychlorinated biphenyls measured in Southern Taiwan. Environ. Int. 1996, 22, 411–423. [Google Scholar] [CrossRef]
  45. Gouin, T.; Thomas, G.O.; Cousins, I.; Barber, J.; Mackay, D.; Jones, K.C. Air-surface exchange of polybrominated diphenyl ethers and polychlorinated biphenyls. Environ. Sci. Technol. 2002, 36, 1426–1434. [Google Scholar] [CrossRef] [PubMed]
  46. He, J.; Balasubramanian, R.; Burger, D.F.; Hicks, K.; Kuylenstierna, J.C.I.; Palani, S. Dry and wet atmospheric deposition of nitrogen and phosphorus in Singapore. Atmos. Environ. 2011, 45, 2760–2768. [Google Scholar] [CrossRef]
  47. Qu, C.; Yang, D.; Zhang, J.; Chen, W.; Sandy, E.H.; Xing, X.; Qi, S.; Huang, H.; Yohannes, H.K.; Yang, J. Risk assessment and influence factors of organochlorine pesticides (OCPs) in agricultural soils of the hill region: A case study from Ningde, Southeast China. J. Geochem. Explor. 2015, 149, 43–51. [Google Scholar] [CrossRef]
  48. Gao, J.; Zhou, H.; Pan, G.; Wang, J.; Chen, B. Factors influencing the persistence of organochlorine pesticides in surface soil from the region around the Hongze Lake, China. Sci. Total Environ. 2013, 443, 7–13. [Google Scholar] [CrossRef] [PubMed]
  49. Widory, D. Combustibles, fuels and their combustion products: A view through carbon isotopes. Combust. Theory Model. 2006, 10, 831–841. [Google Scholar] [CrossRef]
  50. Gleason, J.D.; Kyser, T.K. Stable isotope compositions of gases and vegetation near naturally burning coal. Nature 1984, 307, 254–257. [Google Scholar] [CrossRef]
  51. Fry, B.; Sherr, E.B. δ13C Measurements as Indicators of Carbon Flow in Marine and Freshwater Ecosystems; Springer: New York, NY, USA, 1989; pp. 196–229. [Google Scholar]
  52. Moura, J.M.S.; Martens, C.S.; Moreira, M.Z.; Lima, R.L.; Sampaio, I.C.G.; Mendlovitz, H.P.; Menton, M.C. Spatial and seasonal variations in the stable carbon isotopic composition of methane in stream sediments of Eastern Amazonia. Tellus Ser. B Chem. Phys. Meteorol. 2008, 60, 21–31. [Google Scholar] [CrossRef]
  53. Cao, J.J.; Chow, J.C.; Tao, J.; Lee, S.C.; Watson, J.G.; Ho, K.F.; Wang, G.H.; Zhu, C.S.; Han, Y.M. Stable carbon isotopes in aerosols from Chinese cities: Influence of fossil fuels. Atmos. Environ. 2011, 45, 1359–1363. [Google Scholar] [CrossRef]
  54. Jin, G.; Cong, L.; Fang, Y.; Li, J.; He, M.; Li, D. Polycyclic aromatic hydrocarbons in air particulates and its effect on the Tumen River area, Northeast China. Atmos. Environ. 2012, 60, 298–304. [Google Scholar] [CrossRef]
Figure 1. Pingtan Island and sampling site location.
Atmosphere 09 00059 g001
Figure 2. Concentrations of total polychlorinated biphenyls (PCBs) and total suspended particles (TSP) in the air in Pingtan Island from January 2006 to November 2007.
Atmosphere 09 00059 g002
Figure 3. Compositions of PCBs in atmospheric particles above Pingtan Island.
Atmosphere 09 00059 g003
Figure 4. Monthly and seasonal variations in the total concentrations of the 28 PCBs and rainfall from January 2006 to November 2007.
Atmosphere 09 00059 g004
Figure 5. Relationships between TOC and TSP from Pingtan Island during the sampling periods.
Atmosphere 09 00059 g005
Figure 6. Comparison of the δ13C values of major emission sources in this study with δ13C values of major emission sources, including coal combustion [49,50], marine organic carbon sources [51,52], biomass burning from C3 and C4 plants [52,53], and motor vehicle exhaust [49].
Atmosphere 09 00059 g006
Figure 7. Monthly average δ13C values from January 2006 to November 2007 in Pingtan Island.
Atmosphere 09 00059 g007
Figure 8. Seasonal variations in the contribution of motor vehicle exhaust and coal combustion.
Atmosphere 09 00059 g008
Figure 9. Backward air mass trajectories during the sampling periods. Red lines: 100 m; blue lines: 500 m; green lines: 1000 m. Red labels represent trajectories with a continental influence, and black labels represent trajectories with a marine influence.
Atmosphere 09 00059 g009aAtmosphere 09 00059 g009b
Figure 10. Dry deposition fluxes of DL-PCBs, indicator PCBs and total 28 PCBs to Pingtan Island and adjacent surface waters from January 2006 to November 2007.
Atmosphere 09 00059 g010
Table 1. Comparison of the PCB concentrations in atmospheric particles from different regions (pg m−3).
LocationRegion Time Number of PCB CongenersConcentration Reference
Taizhou, ChinaIndustrial200718287[19]
Guiyu, ChinaIndustrial20083614800[20]
TaiwanIndustrial1996 18500[30]
Izmir, TurkeyIndustrialSummer, 2004413370[31]
Izmir, TurkeyIndustrialWinter, 2005411164[31]
Beijing, ChinaurbanSummer, 200932113.6[32]
Guangzhou, Chinaurban2006–200733317.6[33]
Xiamen, Chinaurban2008–2009281.28–606.16[34]
Koreaurban1999–2000 38130.4[35]
Korearural1999–20003839.7[35]
MediterraneanCoastal area2007–2008182.63[17]
Lake MaggioreCoastal area2005–200673–10[12]
Athens, GreeceCoastal area2000544.00[36]
Arctic OceanOcean2012264.01[37]
PingtanCoastal area2006–2007285.53This study
Table 2. TEQ Concentration in different areas around world (fg m−3).
LocationRegionTime ConcentrationReference
Shanghai, ChinaurbanSummer in 20131.08–17.0 [18]
Shanghai, ChinaurbanWinter in 20135.26–55.90 [18]
Yokohama, JapanurbanMarch, 2002 and Feburuary, 20032.00–14.00[38]
South Koreaurban2008ND–16.00[39]
Taizhou, ChinaIndustrial200750–859[19]
Etang de Thau, Francecoastal2007–20082.77–103.30[17]
Pingtan, Chinacoastal200643.82This study
Pingtan, Chinacoastal20072.28This study
Table 3. Correlation analysis between the PCB concentrations and meteorological parameters and total organic carbon (TOC) for all samples (n = 205).
PCBWSAPTWVPRHTOC
8---0.297 b-−0.291 a
18----−0.170 a-
28-----0.497 b
52------
44------
66----0.142 a-
101------
81------
77-0.236 b-−0.143 a−0.154-
123------
118-−0.152 a0.156 a0.167 a--
114-0.181 b−0.197 b−0.212 b--
153-----0.324 a
1050.162 a0.195 b-−0.147 a−0.233 b-
1380.165 a0.56 b−0.544 b−0.555 b−0.342 b-
126------
1870.160 a0.215 b−0.290 b−0.278 b-0.304 a
128 + 167------
156-0.36 b−0.305 b−0.313 b−0.299 b-
157------
180-−0.146 a---0.272 a
169----−0.235 b-
1700.246 b0.156 a−0.152 a−0.156 a−0.180 b-
189-0.168 a−0.223 b−0.211 b 0.260 a
195-0.432 b−0.432 b−0.448 b−0.150 a0.304 a
206--−0.186 b−0.159 a-0.265 a
209------
∑DL-PCBs-0.256 b−0.224 b−0.241 b--
∑indicator PCBs0.144 b0.486 b−0.479 b−0.485 b−0.289 b-
∑28PCBs-0.398 b−0.361 b−0.371 b−0.230 b-
WS: wind speed; AP: atmospheric pressure; T: temperature; WVP: water vapour pressure; RH: relative humidity; - indicates no significant correlation; a Correlation is significant at the 0.05 level; b Correlation is significant at the 0.01 level.
Table 4. Annual atmospheric inputs of PCBs to Pingtan Island (dry deposition, ng m−2 y−1).
∑DL-PCBs∑indicator PCBs∑28PCBs
2006698.5546.61436.7
2007461.8362.01073.7

