Article

Day-Night Differences, Seasonal Variations and Source Apportionment of PM10-Bound PAHs over Xi’an, Northwest China

1
Department of Environmental Sciences and Engineering, Xi’an Jiaotong University, Xi’an 710049, China
2
Key Lab of Aerosol Chemistry & Physics, Institute of Earth Environment, Chinese Academy of Sciences, Xi’an 710049, China
3
Multiphase Chemistry Department, Max Planck Institute for Chemistry, 55128 Mainz, Germany
*
Author to whom correspondence should be addressed.
Atmosphere 2018, 9(2), 62; https://doi.org/10.3390/atmos9020062
Submission received: 29 December 2017 / Revised: 31 January 2018 / Accepted: 3 February 2018 / Published: 11 February 2018
(This article belongs to the Section Aerosols)

Abstract

:
Day-night PM10-bound PAHs were studied at an urban site of Xi’an from 20 December 2006 to 28 October 2007. The annual mean concentration of nighttime PAHs (285.0 ng m−3) was higher than that in daytime (239.4 ng m−3). A significant difference of PAH concentrations between daytime and nighttime was found in autumn with a coefficient of divergence (CD) of 0.23 (significant level 0.2). However, no distinct difference was observed in other seasons (with CD values < 0.2), although the difference of PAHs partition capacity in PM10 between daytime and nighttime was significant in the four seasons. Remarkable seasonal variations were observed in the total PAH levels, with a highest mean concentration of 344.6 ng m−3 in winter and a lowest mean concentration of 177 ng m−3 in summer. Positive matrix factorization results revealed that residential emission for heating is the major contributor of the elevated PAH levels in winter, accounting for 49% of the total PAH levels. The coal combustion including industrial and residential usage, contributed over 40% of the PAH emissions in PM10 of Xi’an during the one-year sampling period. These results can provide guidance for taking measures in reducing PAHs levels in the air.

1. Introduction

Polycyclic aromatic hydrocarbons (PAHs) are a group of ubiquitous air pollutants, primarily emitted from incomplete combustion of almost any fuels. They are of great concern mainly because of their carcinogenic and mutagenic properties. It has been estimated that 1.6% for lung cancer was caused by inhalation exposure to PAHs in China [1], where the PAH emissions were among the highest levels in the world [2,3]. To reduce the potential health risk of PAHs, efforts on numerous modelling and field investigations have been made to elucidate the sources, spatiotemporal distributions as well as transformations and fate of PAHs in the atmosphere [4,5,6].
Previous studies have shown that approximately 90% of PAHs are emitted from anthropogenic sources, with primary sources from combustion of fossil fuel and biofuel for residential and industrial purposes [2,7]. As semi-volatile organic compounds (SVOCs), PAHs may undergo gas-particle partitioning once emitted into the atmosphere, which is strongly influenced by ambient temperature [5,8,9]. In addition, the abundance and profiles of PAHs in ambient air are also dependent on their sources and meteorological conditions [10,11], which vary from region to region. More researches are still needed to characterize the abundance, spatiotemporal distributions and potential sources of ambient PAHs, particularly inhalable particle-bound PAHs, as carcinogenic 5, 6-ring PAHs are predominantly associated with particles [12,13].
Due to rapid urbanization and industrialization, particulate pollution has become a serious environmental problem in China [14]. Xi’an (area = 1066 km2, population = 8.5 million), the capital of Shaanxi province, located in the center of the Guanzhong Plain, is one of the Chinese cities suffering from severe air pollution. A series of studies have investigated the chemical and physical characteristics of particulate matter (PM) and gaseous pollutants in different sampling sites of Xi’an [15,16,17,18,19,20,21,22]. However, research of PAHs in PM10 (aerodynamic diameter less than 10 µm) from Xi’an is still limited. Shen et al. [23] reported the concentrations of PM10-bound PAHs in roadside ambient air over Xi’an in April 2008, but to our knowledge, no follow-up studies investigated the PM10-bound PAH levels in Xi’an. In particular, the study of day–night differences and seasonal variations of PAHs in PM10 has not yet been reported. Although nowadays PM2.5 (aerodynamic diameter less than 2.5 µm) is the dominant value in air quality index (AQI), PM10 is still a big problem of air quality in Xi’an or northwest China since fugitive dust is one of the major components in aerosol particles in such semiarid regions. In this study, one-year day–night PM10 samples were collected in Xi’an and PAHs were analyzed. The objectives of this study were: (1) to investigate the concentration levels, day–night and seasonal variations of PAHs in PM10 collected at Xi’an; (2) to explore the partition capacity of PAHs; and (3) to identify the emission sources of PAHs and apportion their contribution. The study could be helpful in developing strategies to reduce PAHs levels in the air.

2. Experimental

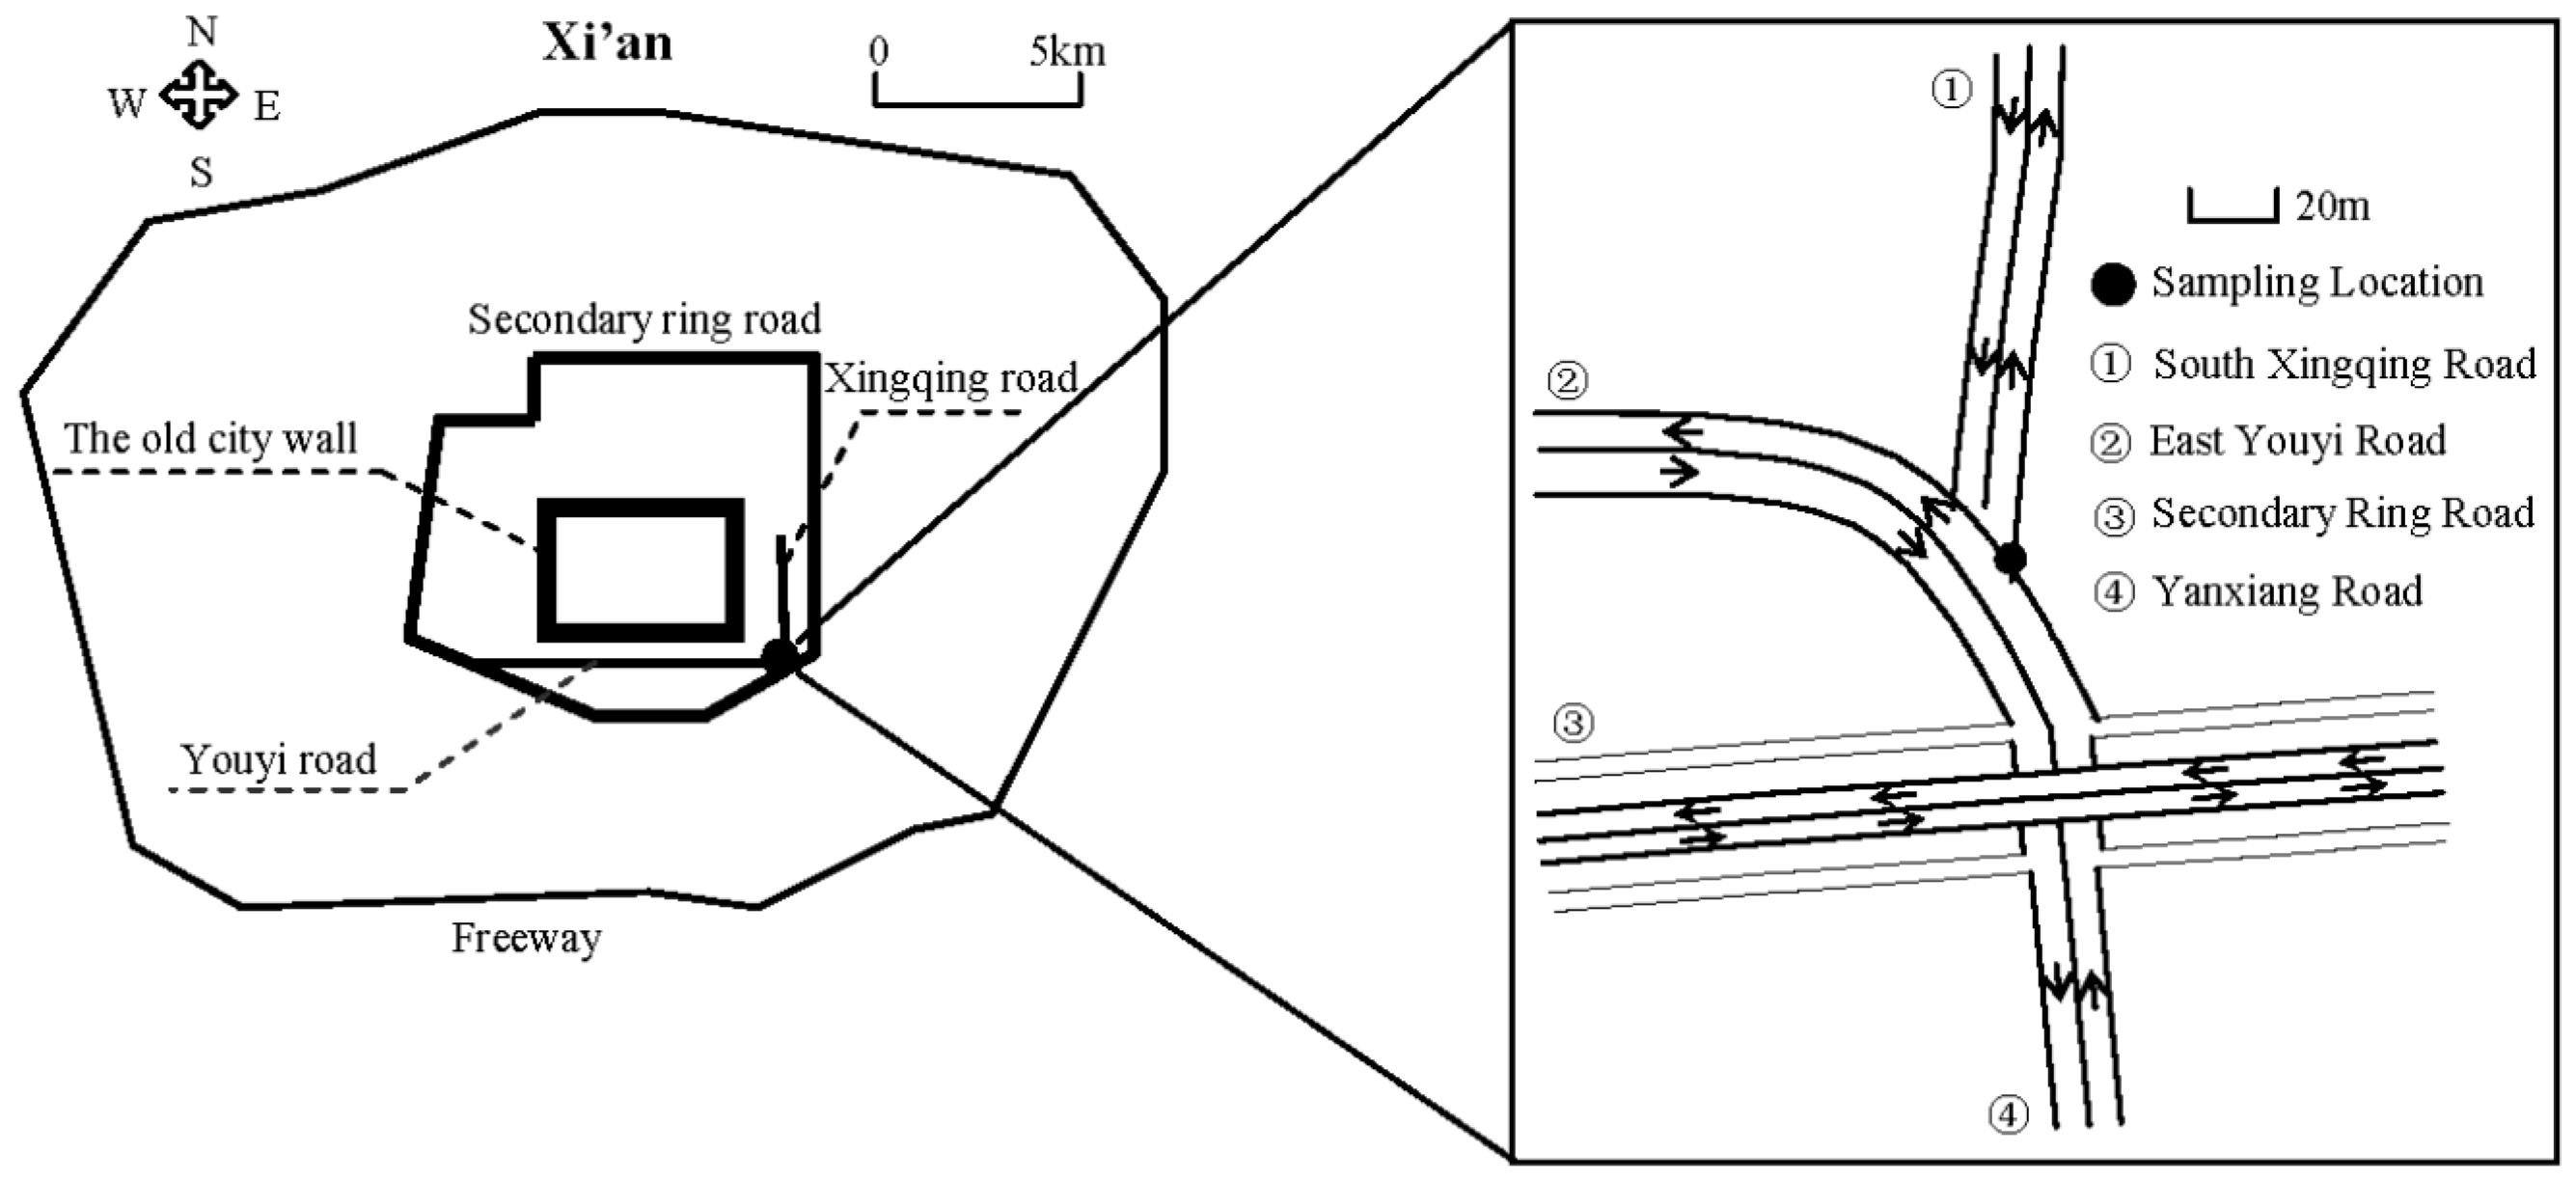
2.1. Sample Collections

The sampling site was located in an urban area of Xi’an (Figure 1), surrounded by residential areas and heavy traffic roads. The sampling campaign was conducted on selected days representing typical seasons or special events, i.e., winter (20 December 2006 to 20 January 2007), spring (1 April 2007 to 29 April 2007), summer (1 July 2007 to 31 July 2007), autumn (15 October 2007 to 12 November 2007), dust storms (31 March 2007 and 4 May 2007), and biomass burning (10 June 2007 to 12 June 2007). A medium-volume PM10 sampler (KC-120H, Qingdao Laoshan Electric CO., Ltd., Laoshan, China) was installed on the roof of a 15-m high building. Every two days of daytime (from 8 am to 6 pm) and nighttime (from 8 pm to next 6 am) PM10 samples as well as filed blank filters were collected on Φ90 mm quartz micro-fiber filters (Whatman QMA, Maidstone, England). The filters were preheated in 900 °C muffle furnace for at least 3 h to avoid inherent carbonaceous contaminants before using. In order to minimize the evaporation of volatile components in PM10 samples, the sampled filters were sealed in aluminum foil and stored at −4 °C until they were extracted. All analyses were conducted within one month of sample collection.
The mass loadings of PM10 samples were determined gravimetrically using electronic microbalance (Model MC5, Sartorius AG, Goettingen, Germany) with a sensitivity of ±1 µg. The filters were equilibrated for 24 h at a constant temperature between 20 °C and 23 °C and relative humidity between 35% and 45% before weighing. Each filter was weighed three times before and after sampling following the 24-h equilibration period. The mean net mass for each filter was obtained by subtracting the pre-deployment weight from the average of the post-sampling readings. PM10 concentrations were calculated from the net masses divided by the recorded sampling volumes.
The meteorological conditions (e.g., wind speed, relative humidity, temperature, precipitation) and, concentrations of the major chemical components in PM10 including nine ionic species (SO42−, NO3, Cl, F, Na+, NH4+, K+, Mg2+, and Ca2+) as well as organic carbon (OC) and elemental carbon (EC) during the sampling can be found in Shen et al. [24].

2.2. PAHs Analysis

A quarter of the aerosol filter samples were Soxhlet-extracted with 200 mL of dichloromethane (DCM) for 24 h and the solvent extracts were concentrated to 1 mL using a rotary evaporator. Afterwards, total extracted organics were separated by flash column chromatography on a silica gel, the fractions were washed with 20 mL hexane and then eluted by 15 mL of a mixture of hexane and DCM (1:1 by volume). The eluent solvent was evaporated to 1 mL and blow down to 0.5 mL under a gentle stream of nitrogen prior to GC–MS analysis.
GC–MS analyses were performed on a Hewlette–Packard model 6890 GC coupled to Hewlette–Packard model 5975 mass selective detector. Separation was achieved on a fused silica capillary column coated with HP5 (30 m × 0.25 mm × 0.25 µm). The GC operating conditions were as follows: temperature was hold at 70 °C for 2 min, increased from 70 to 120 °C at a rate of 10 °C min−1 and then increased from 120 to 300 °C at a rate of 6 °C min−1 with final isothermal hold at 300 °C for 5 min. Helium was used as carrier gas at a constant flow rate of 1.0 mL min−1. The sample was injected splitless with an injector temperature at 270 °C. The mass spectrometer was operated in the electron impact mode at 70 eV. Thirteen priority-controlled PAHs concentrations by USEPA were determined: fluorine (Flu, 3-ring), phenanthrene (Phe, 3-ring), antharacene (Ant, 3-ring), fluoranthene (Fla, 4-ring), pyrene (Pyr, 4-ring), benzo[a]fluoranthene (BaA, 4-ring), chrysene (Chr, 4-ring), benzo[b]fluoranthene (BbF, 5-ring), benzo[k]fluoranthene (BkF, 5-ring), benzo[a]pyrene (BaP, 5-ring), indeno[1,2,3-cd]pyrene (IP, 6-ring), dibenzo[a,h]anthracene (dBahA, 5-ring), Benzo[ghi]-perylene (BghiP, 6-ring). Due to the high volatility, naphthalene (Nap, 2-ring) and acenapthylene (AcY, 3-ring) were non-detectable for field samples in this study and only have a low recovery of standards (Nap of 36% and AcY of 58%). Recoveries for the 13 PAHs were between 70–120%. Phenanthrene-D10 and perylene-D12 were added into the samples as internal standards prior to Soxhlet extraction to monitor performance and matrix effects. The recoveries of phenanthrene-D10 and perylene-D12 were 66–109% and 76–122%, respectively.

2.3. Positive Matrix Factorization (PMF) Analysis

The PMF model (EPA PMF 5.0) was used for the source apportionment of PAHs in PM10. Detailed concepts and applications of PMF model for source apportionment can be found in EPA PMF 5.0 Fundamentals and User Guide [25]. Before the PMF analysis, both the concentration file and uncertainty file for 13 PAH species were inserted into the model. An uncertainty of 40% for 13 PAHs was selected based on the recoveries from GC–MS analysis. PMF model was run with 3–7 factors and the 5-factor was considered to be the optimal one. Although lower Q values (the weighted least-squares of difference between the observations and the model) could be obtained when adding more factors, it did not result in much improvement to interpret the factor profiles. The 5-factor solution indeed could explain over 90% of total PAH emission in 6-factor solutions.

3. Results and Discussion

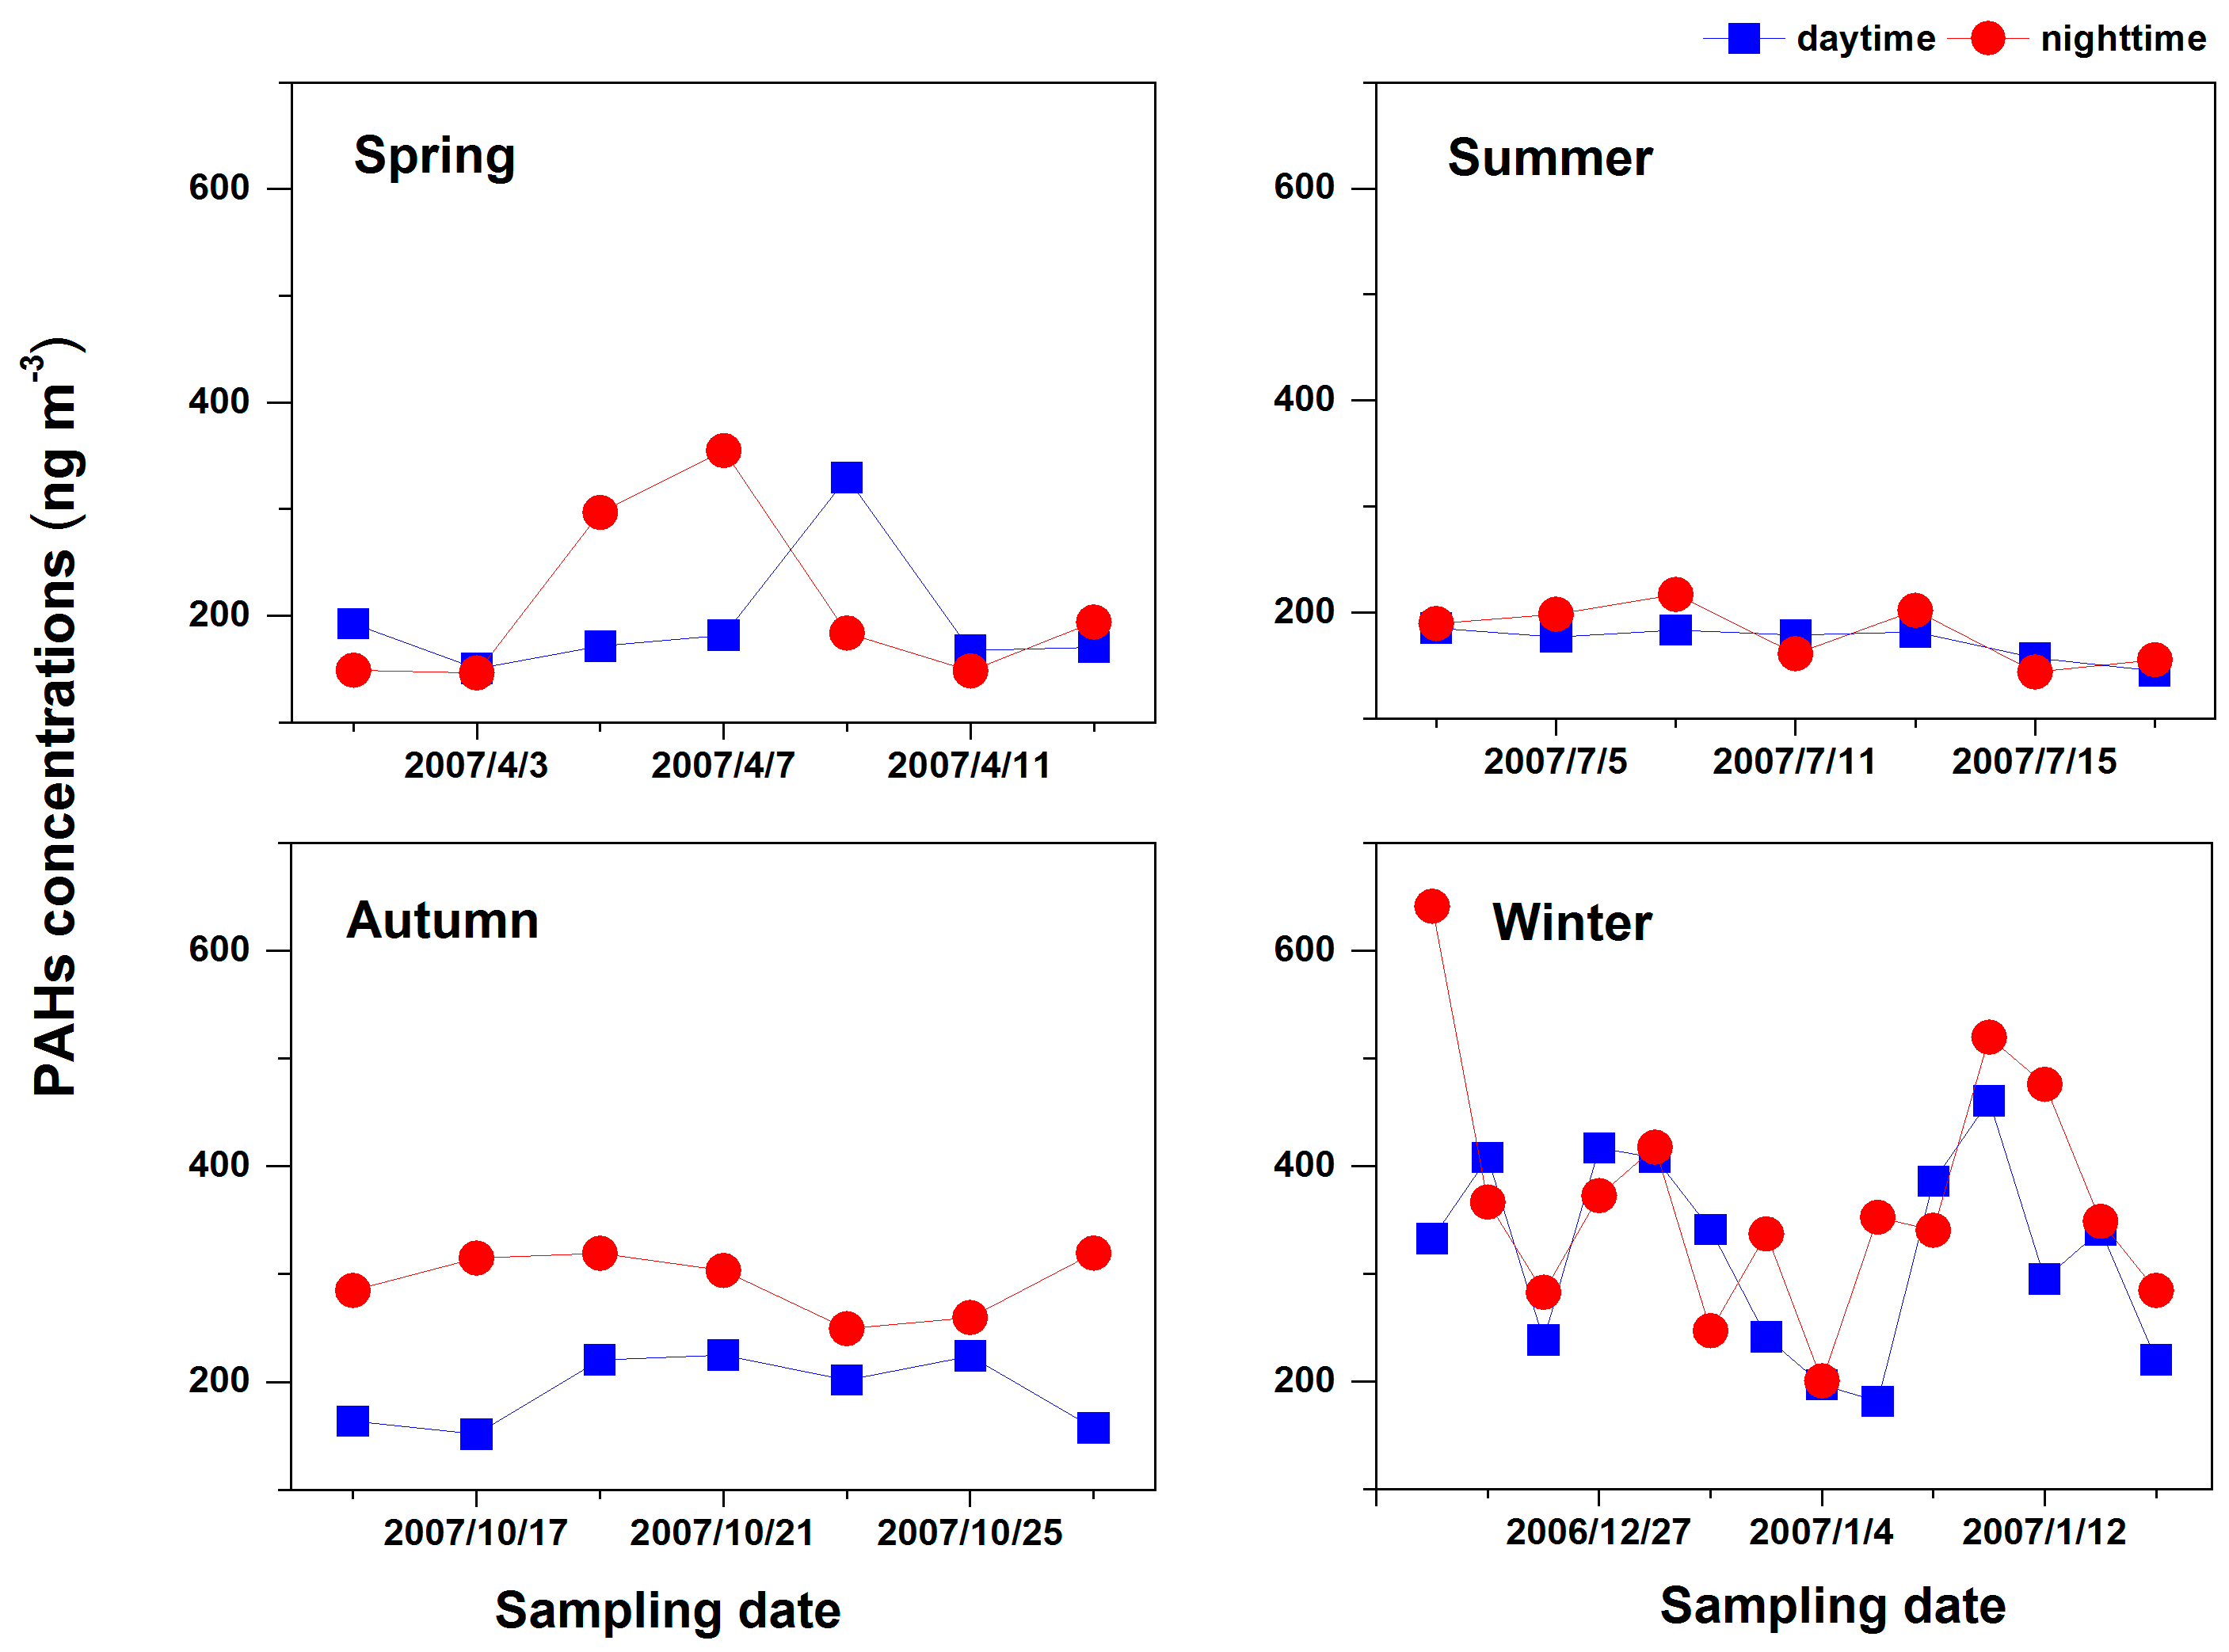
3.1. Concentration Levels and Day–Night Differences

Table 1 summarizes PM10 PAH concentrations over Xi’an in the four sampling seasons. The mean annual value of total PAH concentration reached 262.2 ± 105.1 ng m−3, with a range of 144.0–640.8 ng m−3. This result was comparable to the value (278.6 ng m−3) reported for PM10-bound PAHs in roadside ambient air over Xi’an, which was sampled in 2008 [23]. Note that the PAH concentrations may have evolved since 2007, but to our knowledge, no recent studies reported the levels of PM10-bound PAHs in Xi’an. Nevertheless, PM2.5-bound PAH concentrations in Xi’an did not show a distinct difference between two case studies in 2008–2009 [20] and 2012–2013 [22]. Moreover, we also compared our results with those from the four most developed cities in China, which were sampled in urban roadside or industrial areas within 2002 to 2007. The observed PAH levels in the current study was much higher than those in Shanghai (0.07–270 ng m−3, mean 64.85 ng m−3) [26], Guangzhou (8.1–106.3 ng m−3, mean 41.0 ng m−3) [27] and Shenzhen (15.2–30.7 ng m−3, mean 26.7 ng m−3, results of total suspended particulate) [28], but was relatively comparable to that in Beijing (22.4–1014.3 ng m−3, mean 130 ng m−3) [29]. It should be noted that Shanghai, Guangzhou and Shenzhen are all located in coastal regions, whereas Beijing and Xi’an are inland cities. This may indicate that the meteorological conditions (e.g., wind speed, relative humidity) have a strong effect on PAHs concentrations.
The most dominant compound of PAHs species in this study was BghiP, accounting for 15.3% of total PAHs mass, followed by BbF (12.4%), Chy (9.8%). The observed high BghiP levels could be due to a heavy traffic near the sampling site, as BghiP was considered to be the major matter from traffic related emission [30]. In addition, the annual mean concentration of BaP was 22.4 ng m−3. This result exceeded both the China National Ambient Air Quality Standard for annual BaP concentration (1.0 ng m−3) and yearly concentration limit in the air-quality guidelines of the World Health Organization (1.0 ng m−3, WHO, 2010) by more than a factor of 22. Thus, mitigation efforts for PAH levels in Xi’an are highly needed in order to reduce human health risk.
Figure 2 shows the day- and nighttime PAHs concentrations in each season. The daytime concentrations of total PAHs ranged from 145.1 to 460.4 ng m−3, with a mean value of 239.4 ng m−3. The nighttime PAHs concentrations with a mean value of 285.0 ng m−3, were higher than those in daytime over the four seasons. To look into whether the day–night difference is significant or not, the coefficient of divergence (CD), a self-normalizing parameter, was applied to quantify day-night difference. CD has been widely used to identify similarities for mean values composed of multiple chemical components in different sampling periods or from different sites [31,32,33,34,35]. It was calculated using the following equation:
C D j k = 1 p i = 1 p ( x i j x i k x i j + x i k ) 2
where j and k represent for the two sampling periods, p is the number of investigated components, xij and xik represent the average concentration for a chemical component i at sampling periods j and k. CD ranges from 0 to 1. A low CD value (<0.2) indicates a high level of homogeneity in PAHs concentrations between day and night, while a CD value higher than 0.2 indicates that the difference is significant. In this study, 13 PAHs species were used to calculate the CDs for the day- and nighttime. The CD values were 0.08, 0.18, 0.23, and 0.09 for day–night differences from spring to winter (Figure S1). These results indicated that the day–night difference of PAHs levels was not remarkable. Whereas the CD value in autumn was higher than 0.2, indicating the day–night difference was distinct in autumn. Student’s t test also showed that there is a significant difference between daytime and nighttime in autumn (Table S1). This should be mainly due to the distinct differentiation of meteorological conditions between day and nighttime. For example, the daytime mixed layer was higher than that in nighttime; in addition, the high temperature and favorable atmospheric diffusion conditions could dilute the daytime PAHs levels compared to a PAH accumulation at low mixed layer in the nighttime [34,36,37]. Furthermore, the relative humidity was highest (>60%, [24]) in the daytime of autumn over the four seasons, which might favor that the photooxidation (aging) of PAHs adsorbed on aerosol particles [38]. It should also be noted that Xi’an was conducting a truck control policy in the daytime, which only allowed trucks and construction vehicles to enter into the downtown (inside second ring road) daily from 8:00 pm to 6:00 am, resulting in a stronger diesel vehicle activity in nighttime. Consequently, higher IP concentrations were observed in the nighttime, as IP was the typical tracer of diesel emission [39].

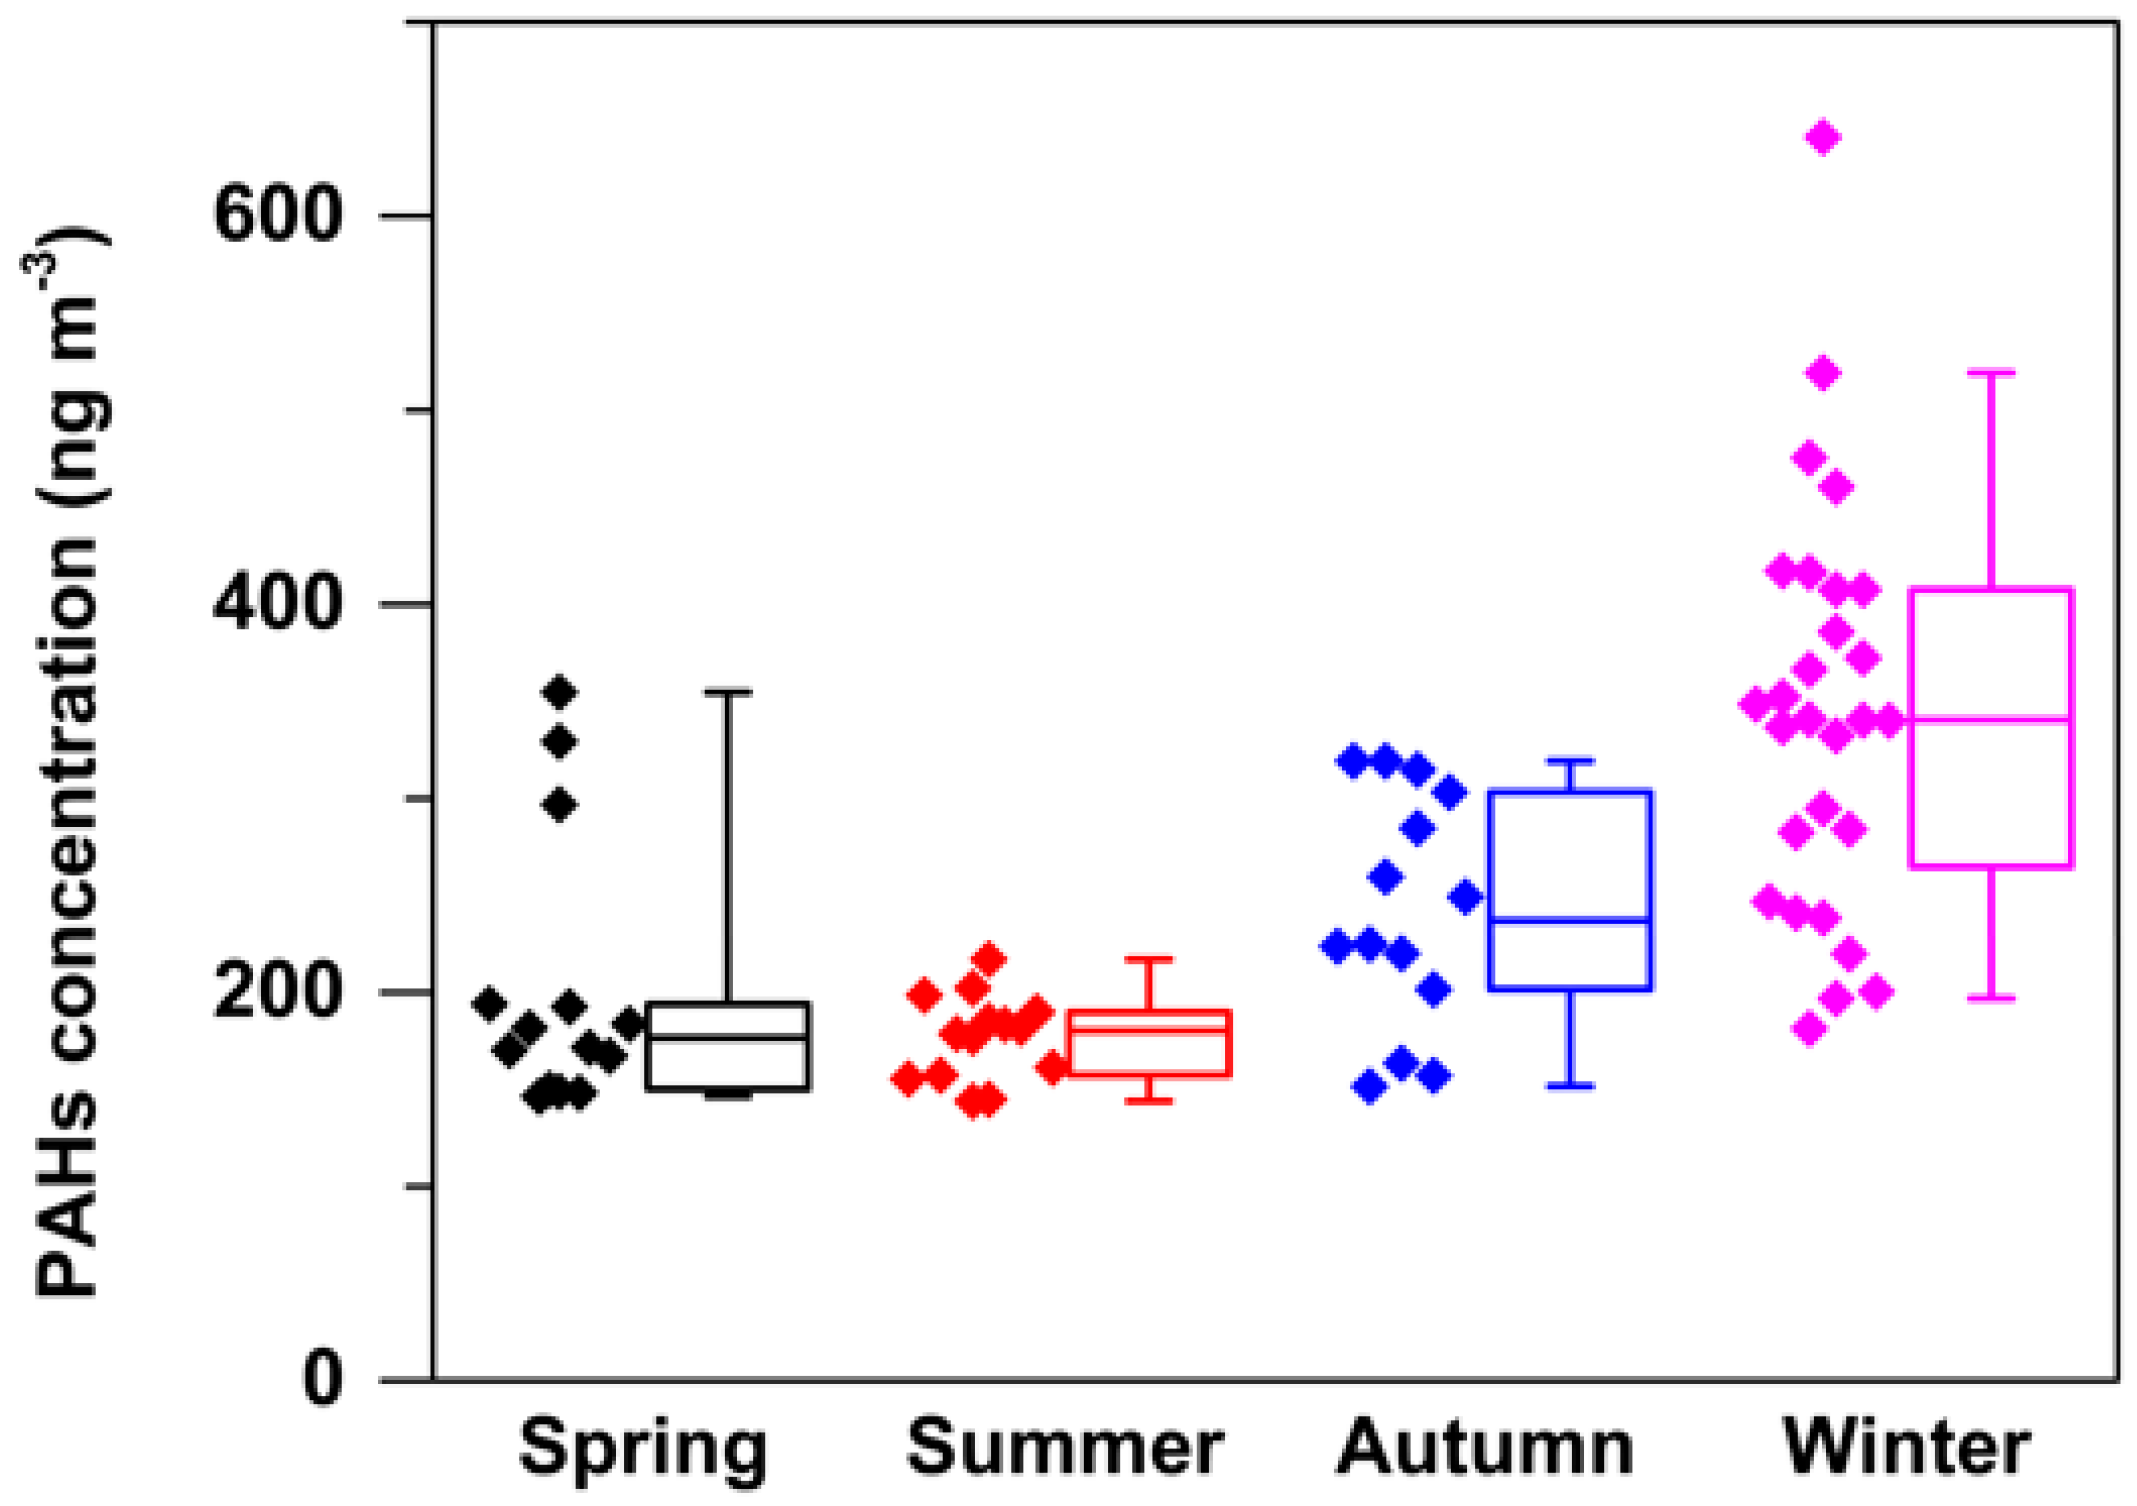
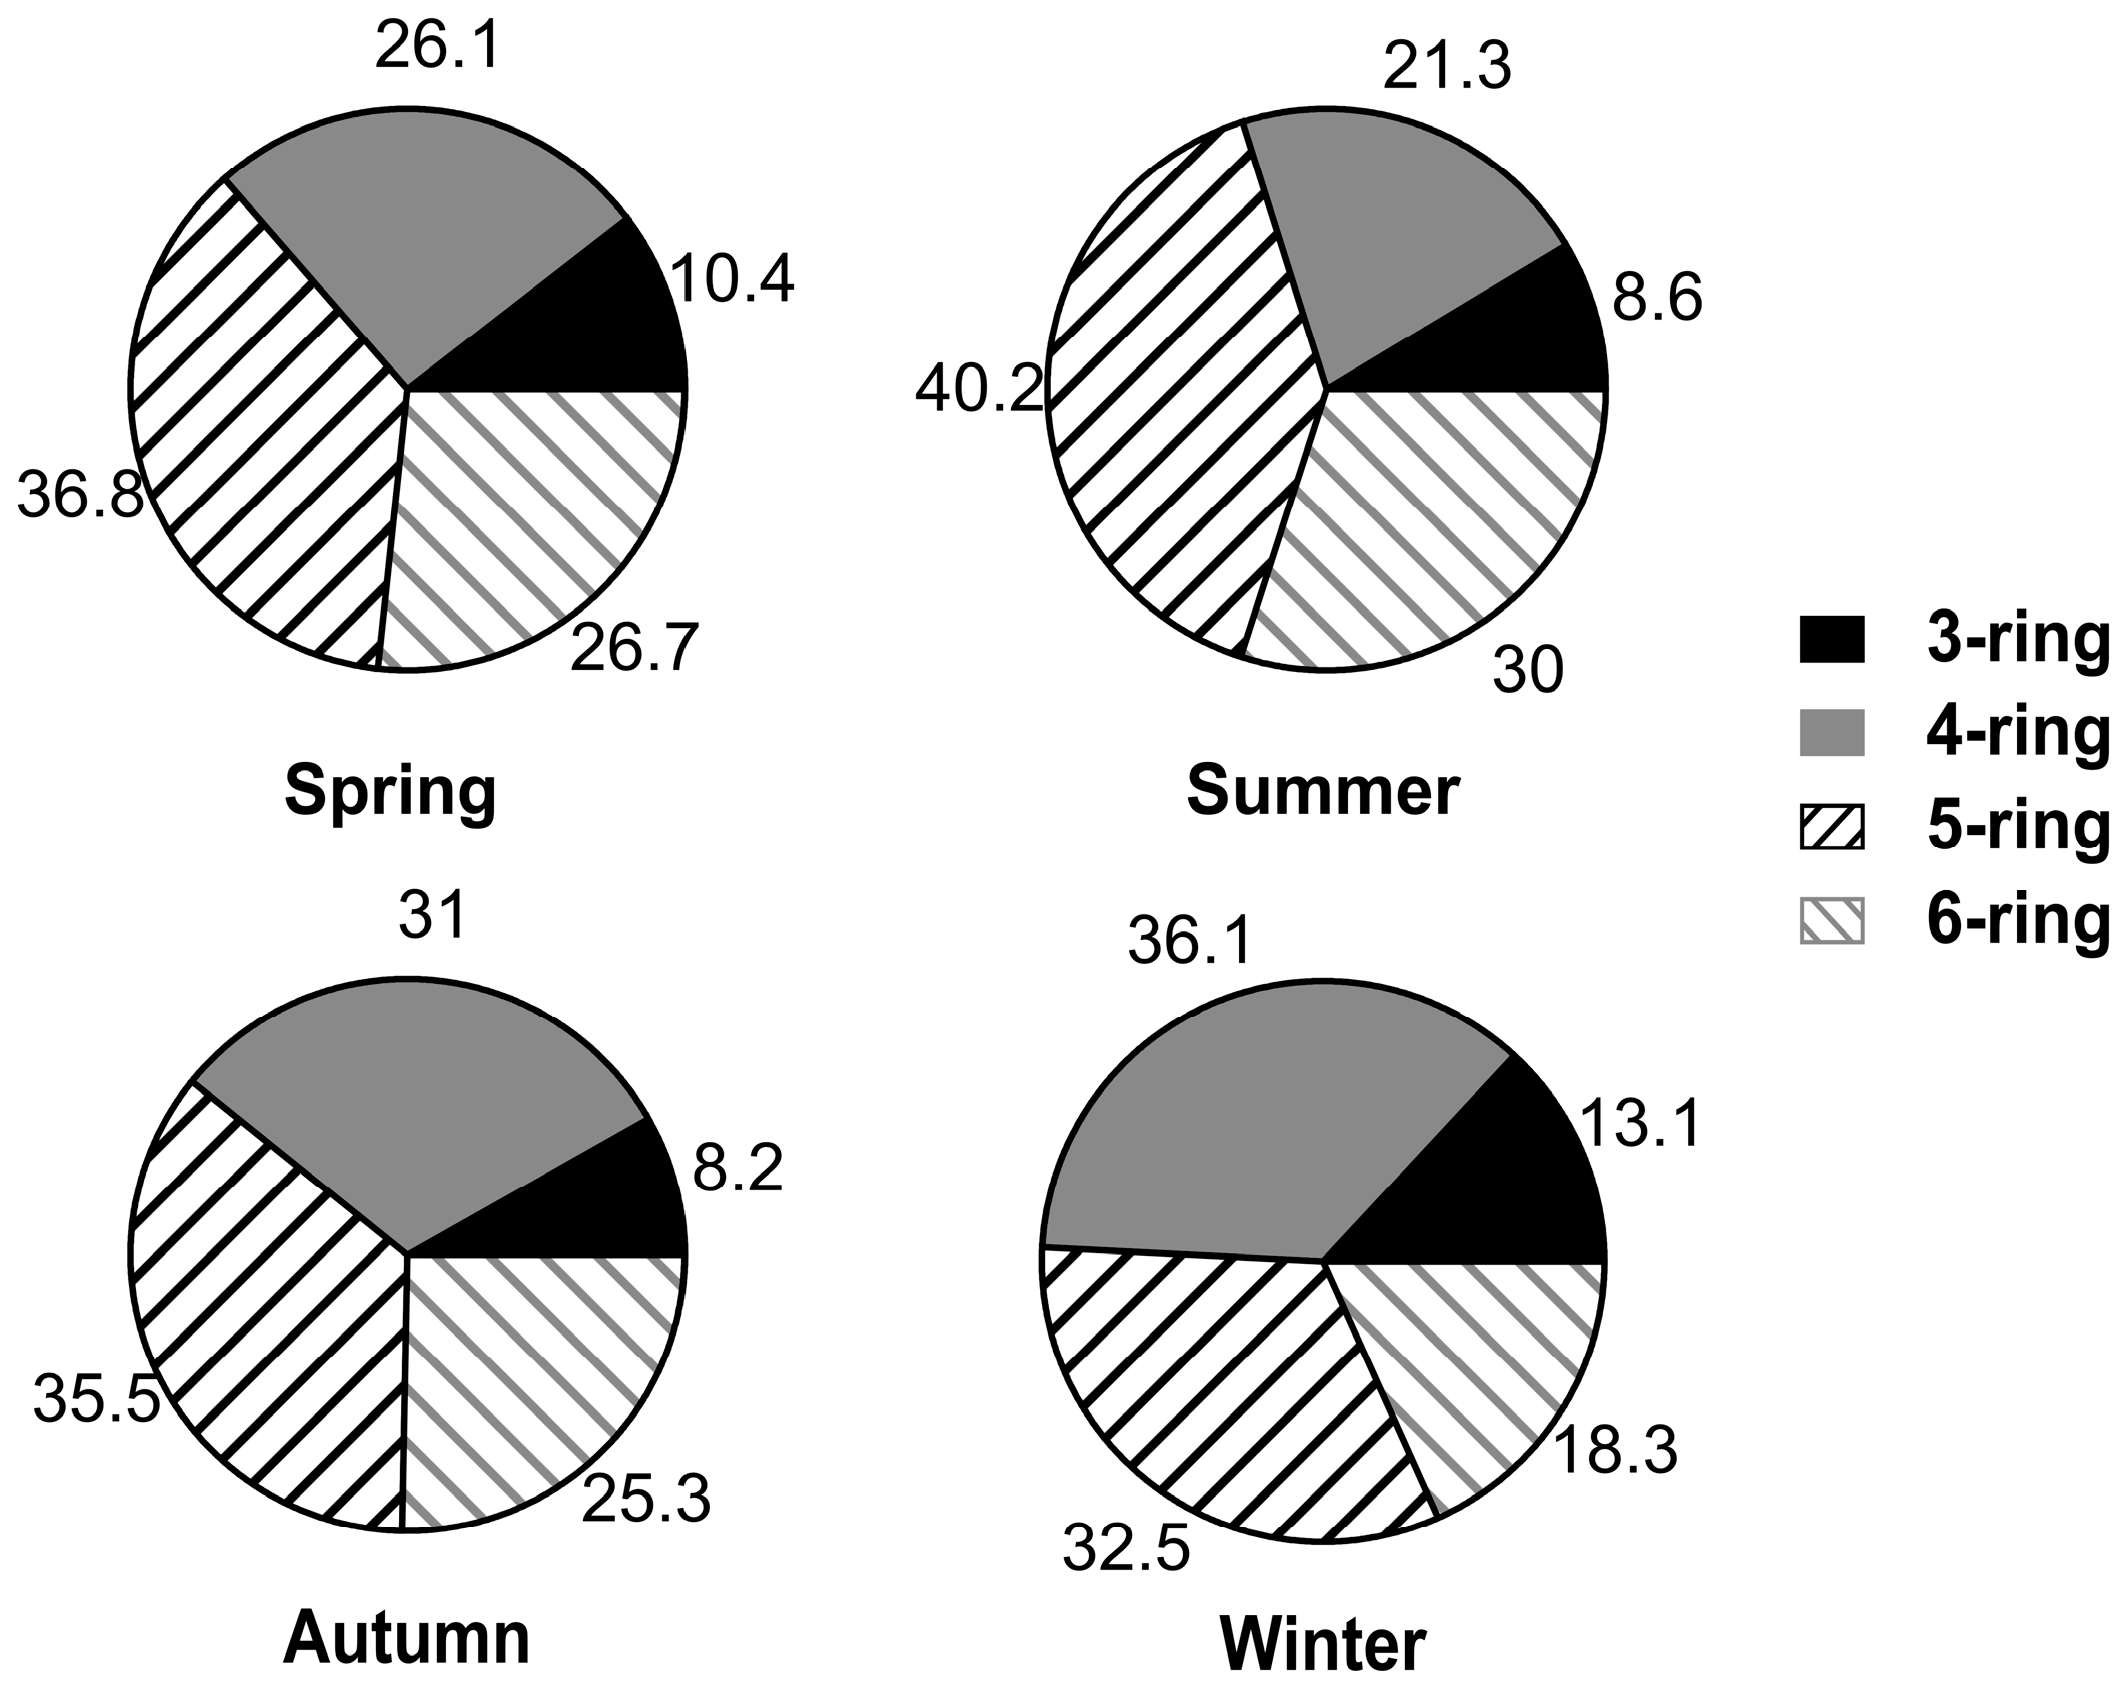
3.2. Seasonal Variations

The total mean concentrations of PAHs showed a clear seasonal variation, following a decreasing order of winter > autumn > spring > summer (see Table 1 and Figure 3). The mean value of PAHs concentration in winter was approximately twice compared to that in summer (p = 0.001, student t-test). High winter PAHs concentrations could be mainly attributed to the consumption of the extra coal combustion and biomass burning for heating in urban and surrounding areas (wind speed data refer to Shen, et al. [24]). The observed high levels of sulfate (62.3 μg m−3), organic carbon (63.6 μg m−3), and water-soluble K+ (6.0 μg m−3) [24], which have strong correlations with coal combustion and biomass burning [15,19,24], suggested a higher consumption of extra energy in winter. In contrast, no extra energy was consumed for heating in summer. Moreover, the PAH concentrations in aerosol could be affected by meteorological conditions such as temperature, precipitation and wind speed (temperature, precipitation and wind speed data refer to Shen, et al. [24]). Low temperature and wind speed in winter are not efficient to spread and dilute atmospheric PAHs as well as other air pollutants. Whereas in summer conditions with high temperature, strong solar radiation and high O3 level, PAHs favor to partition in the gas phase or convert to their oxidative derivatives via heterogeneous reactions with gas-phase oxidants [5,40]. The frequent rainfall in summer is also an important factor reducing the particulate PAHs levels through wet scavenging process [41].
Figure 4 shows a seasonal variation of the proportions of PAHs species grouped by different ring numbers. The 4-, 5- and 6-rings PAHs were predominant, accounting for 87.0–92.1% of total PAHs mass. Low concentrations for the 2- and 3-rings PAHs in PM10 should be mainly attributed to their high volatility. The 3- and 4-rings PAHs, commonly existing in both vapor and particulate phases, showed a clear seasonal variation. The contribution of 3- and 4-rings PAHs, 50% in winter, was significantly higher than that in summer, with a proportion less than 30%. This profile could be attributed to the vapor-particle partitioning for SVOCs driven by temperature (detailed discussion in Section 3.3) [5]. The 5- and 6-rings PAHs are mainly in the particulate phase [13,42,43]. However, as 3- and 4-rings PAHs are more likely to occur in the gas phase in seasons with high temperature, e.g., summer, the 5- and 6- rings PAHs are more predominated in non-heating season, with a proportion of 70%.

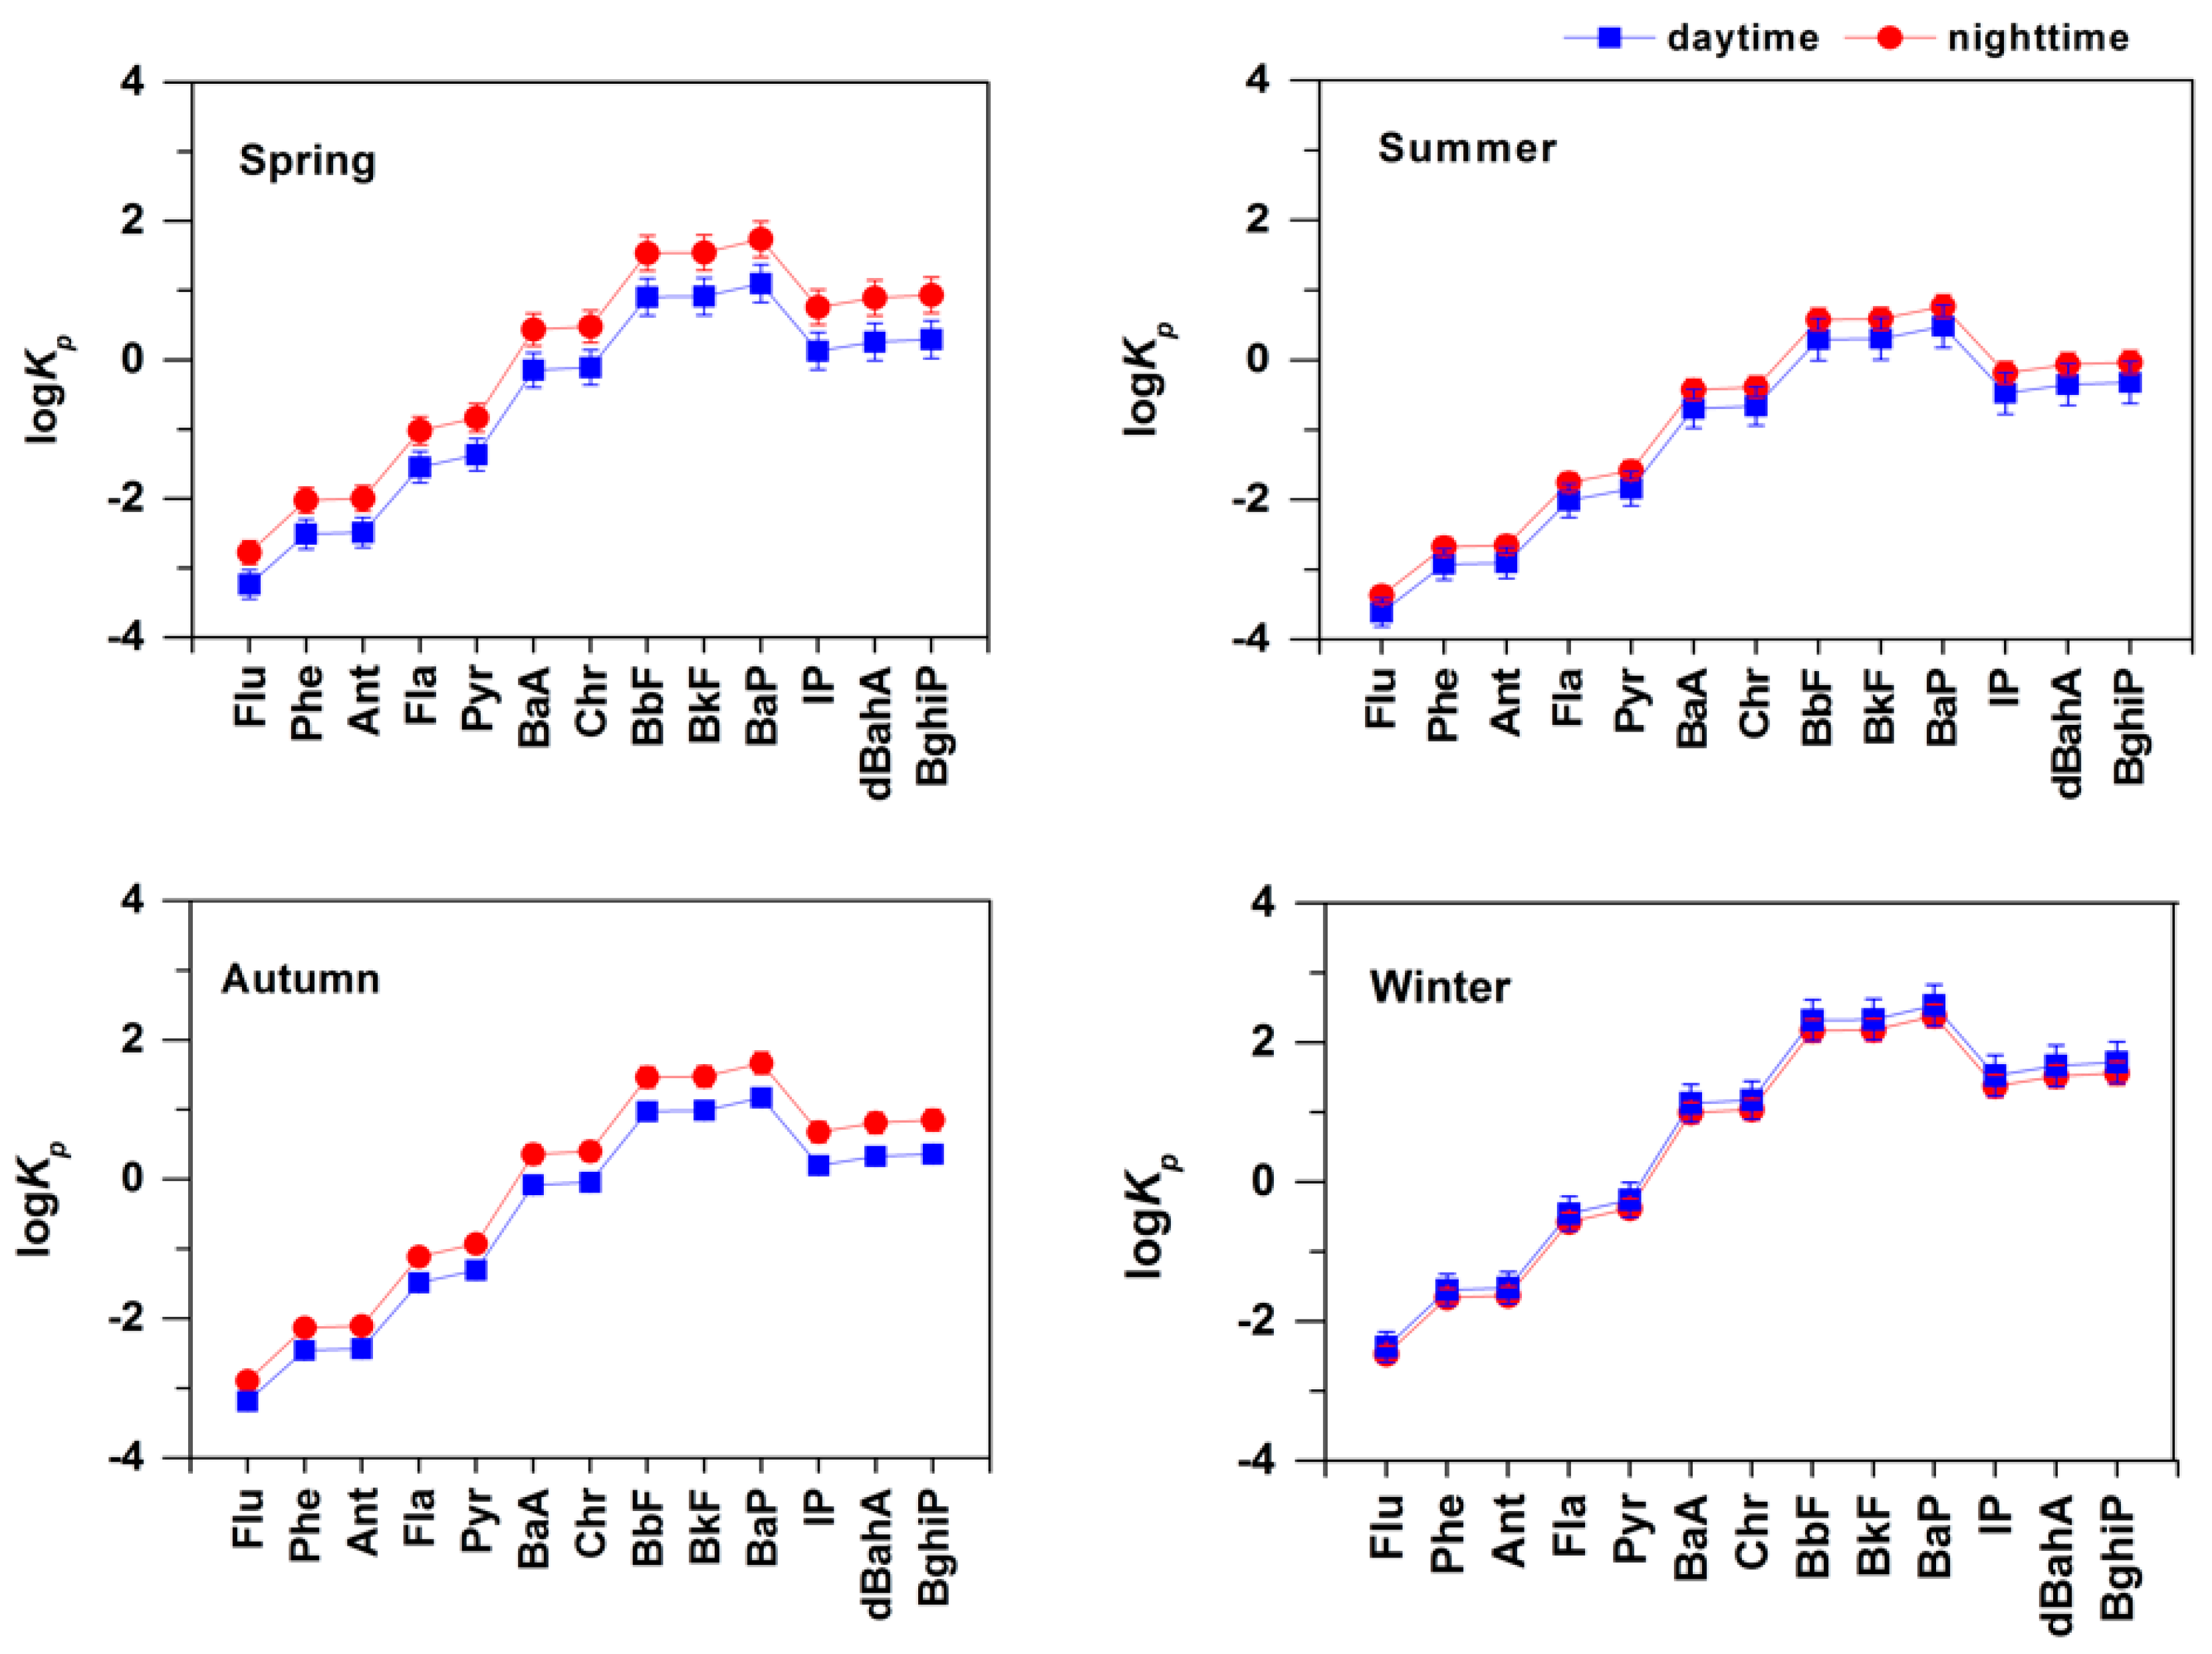
3.3. PAH Partition Capacity in PM10

Partitioning of atmospheric organic compounds between the gas and particulate phases is parameterized using the gas-particle partition coefficient—Kp, which can be derived by the following equation [44]:
K p = f O M M W O C T ζ O C T K O A ρ O C T M W O M ζ O M 10 12 +   f E C a E C K S A a A C 10 12
where fOM is the fraction of organic matter; ρOCT is the density of octanol (0.820 kg L−1); MWOCT and MWOM are the mean molecular weights of octanol and the OM phase (g mol−1); ζOCT is the activity coefficient of the absorbing compound in octanol; ζOM is the activity coefficient of the compound in the OM phase; aEC and aAC are the specific surface areas of elemental carbon and activated carbon, respectively; fEC is the fraction of elemental carbon in the aerosol; KOA and KSA are the octanol-air partitioning coefficient and the soot-air partition coefficient, respectively. They can be estimated by Equations (3) and (4) [44,45]:
l o g K S A = 10.85 log P L 0 + 7.74
l o g K O A = 10.97 log P L 0 + 6.65
where P L 0 is the liquid vapor pressure, which can be calculated for each compound by the formulas listed in Table S2.
It was assumed that aEC/aAC = 1, fOM = 1.6 fTOC, and fOC/fEC = 3 where fTOC is the fraction of total organic carbon in PM10 mass concentration [43,44]. The total organic carbon is defined as the sum of OC and EC, which was calculated from the OC and EC data in Shen et al. [24]. Under these assumptions, Kp values for both absorptive and adsorptive partitioning were calculated using Equation (2), and the log Kp results were shown in Figure 5. Elevated log Kp values were found with the increasing of the molecular weight of PAHs, while highest log Kp values were found for BbF, BkF and BaP. PAHs with molecular weight less than 202 (i.e., Flu, Phe, Ant, Fla and Pyr) tend to be less adhesive to particle phase, as the log Kp values of these five PAHs species were all lower than 0. In addition, the partition capacity of PAHs exhibited a clear seasonal variation. The log Kp values reached highest in winter and lowest in summer, indicating temperature strongly influenced the gas-particle partitioning. Hence, high partition capacity in particle phase could be an important factor contributing to the highest PAH levels in winter except for more primary emissions. The difference of log Kp between day and night was also found, whereas it was not significant in winter. To explicitly check how significant of the day–night difference, the CD values of day and night for log Kp over the four seasons were also calculated according to Equation (1). The result was shown in Figure S2. The CD values were mostly higher than 0.2, indicating that the difference between day and night was significant. In a comparison of the four seasons, CD values followed a decreasing order of spring > autumn > summer > winter. The variation of partition capacity between the day and night were most remarkable in spring, while in winter the difference was not apparent. One possible reason is that the sources of OC and EC had been changing rapidly in spring but relatively stable in winter [24]. Besides, the temperature difference between day and night has a highest distinction in spring and lowest in winter [24], leading to the most distinct difference of log Kp between day and night in spring.

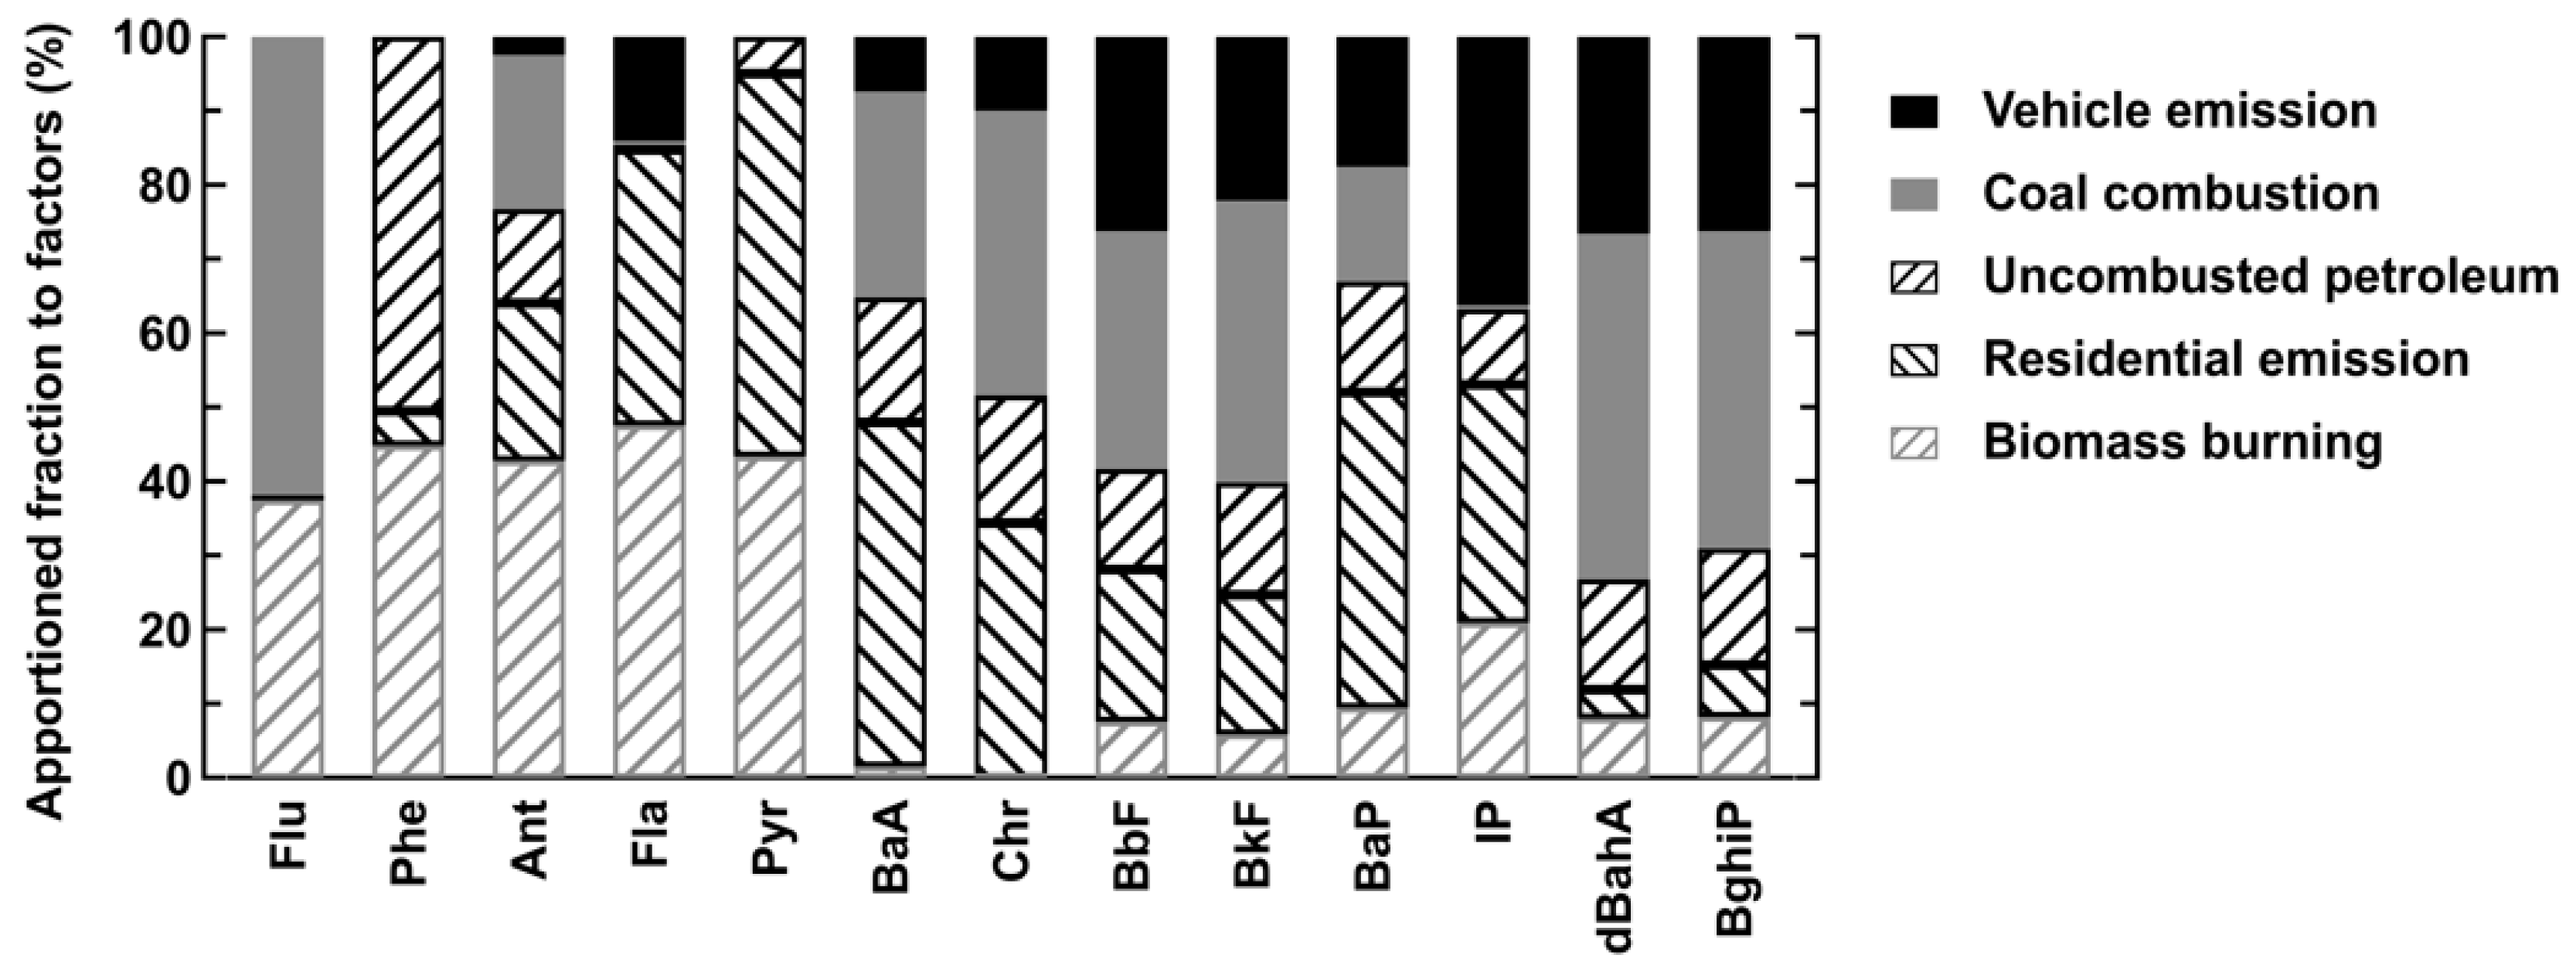
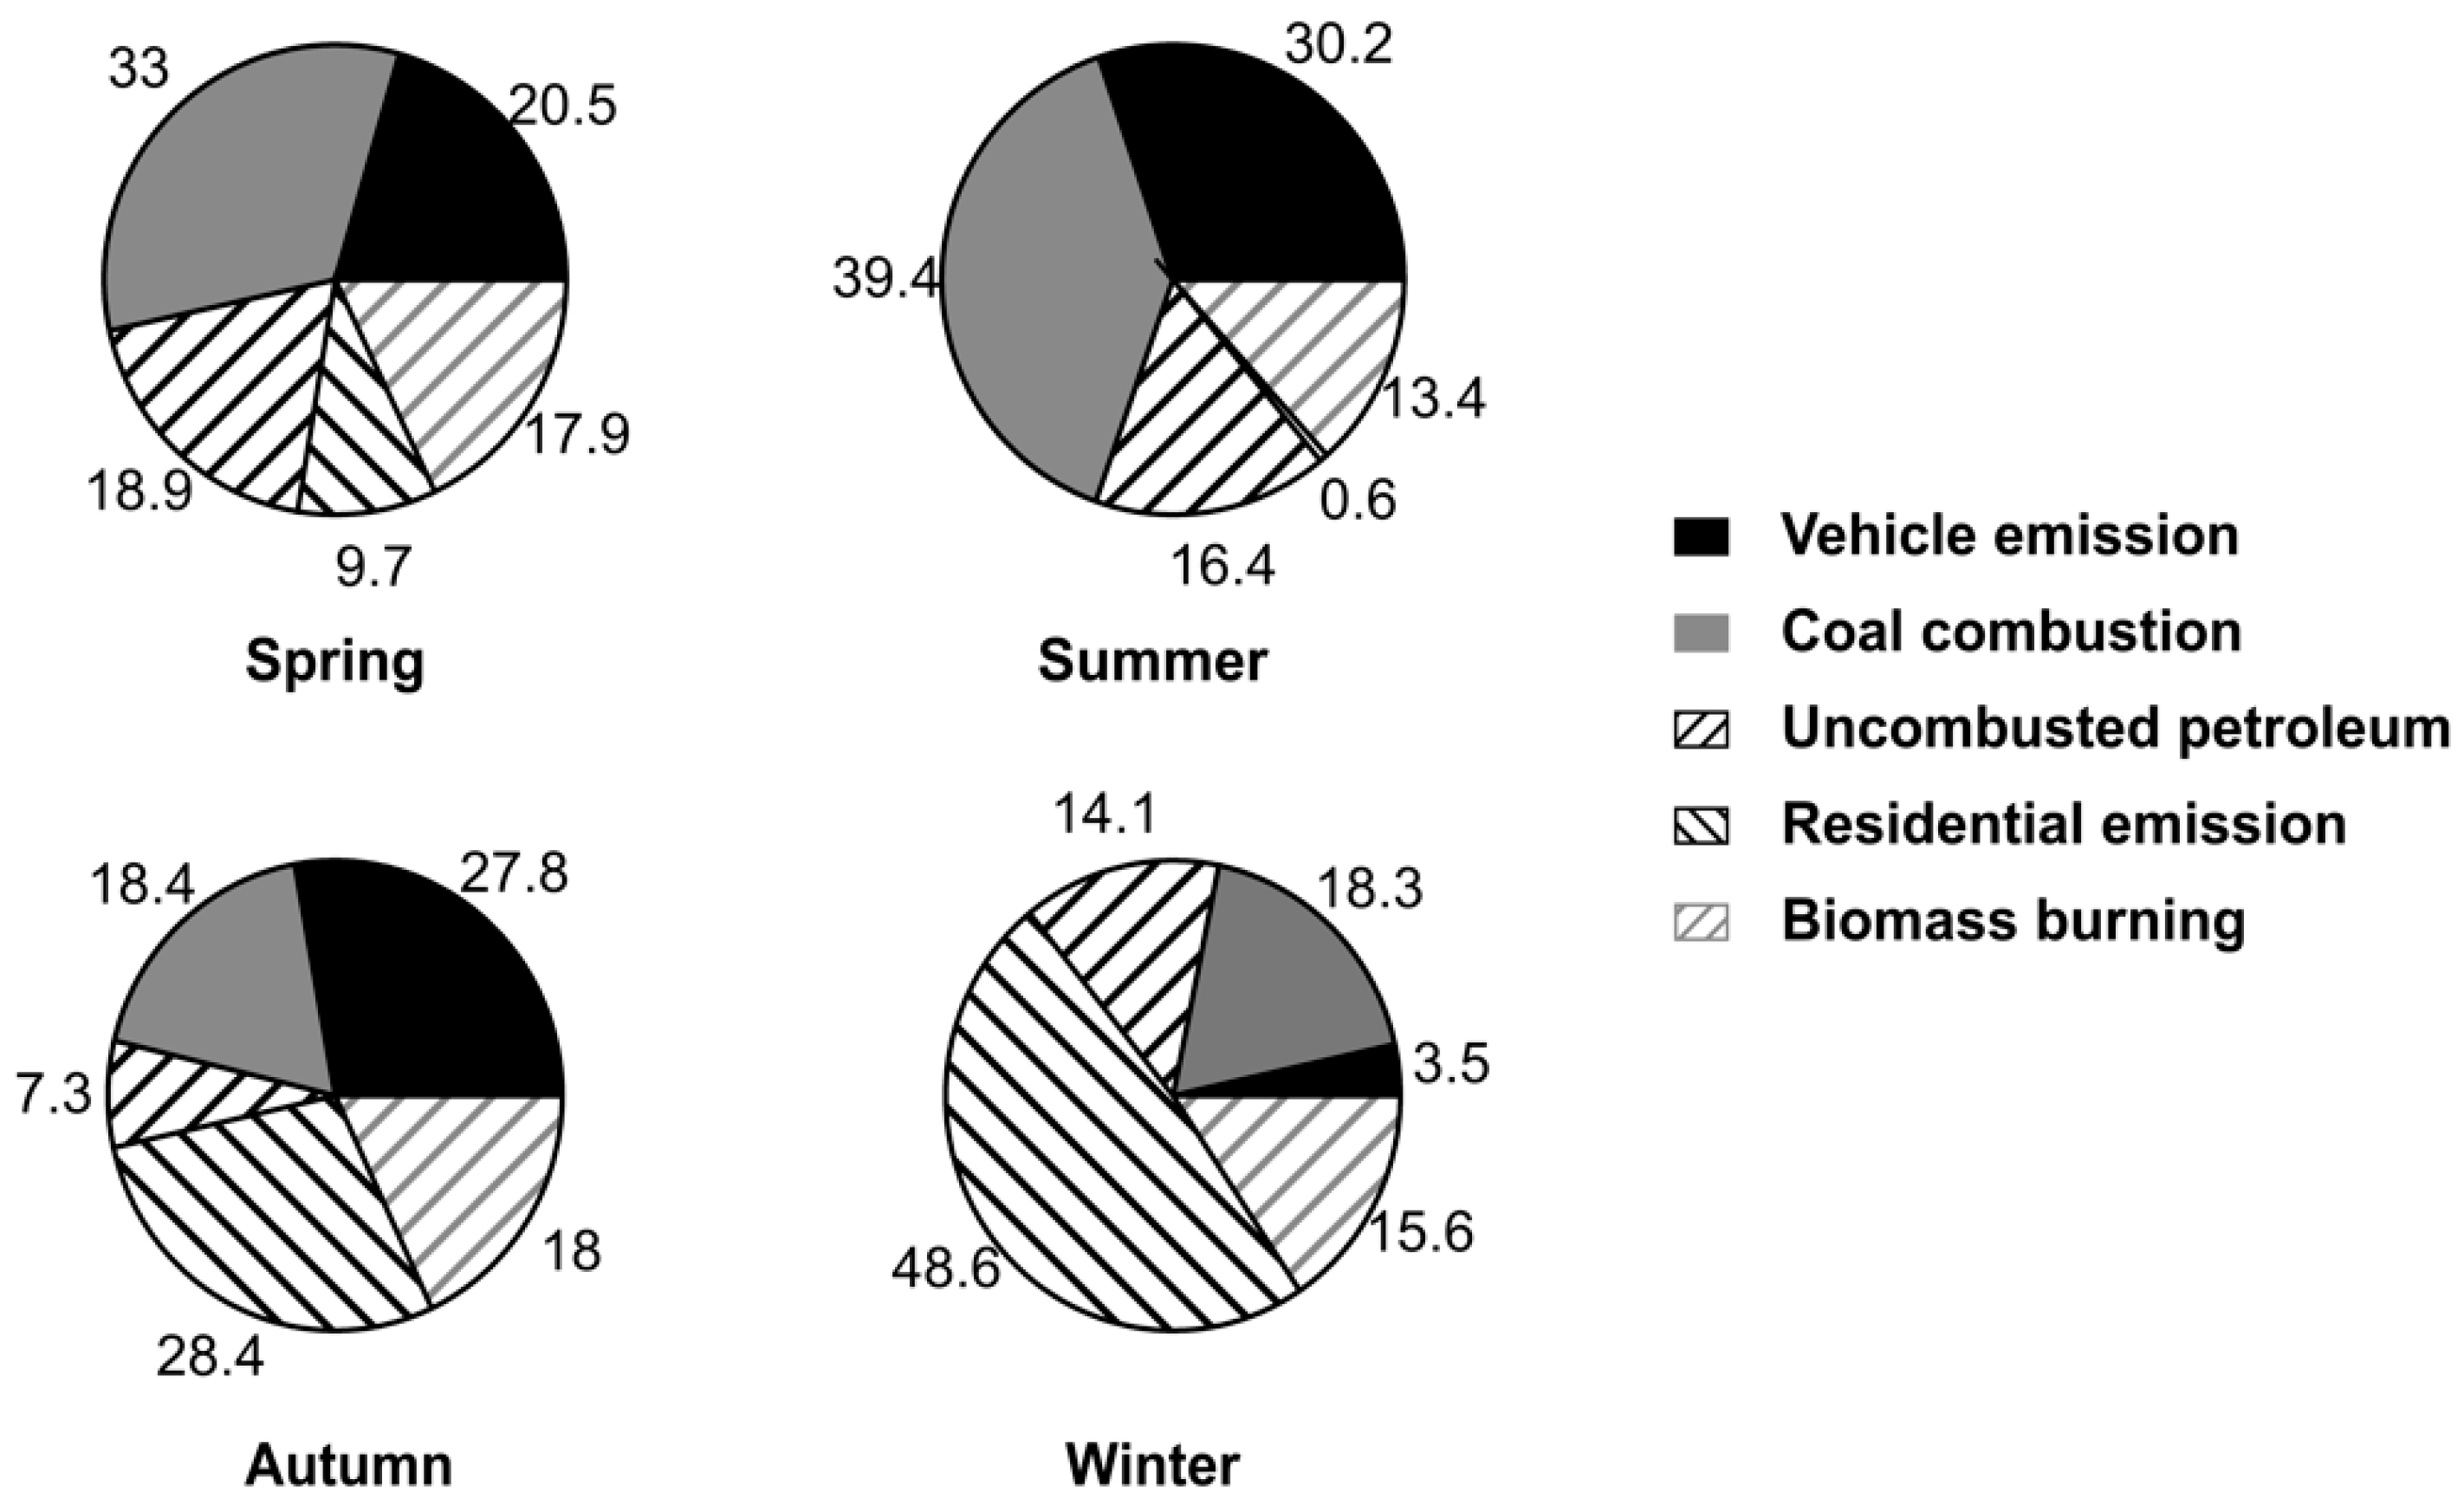
3.4. Source Apportionment by PMF

The source profiles obtained by the PMF model is shown in Figure 6. Each profile was compared with several profiles reported in previous studies as well as PAH source markers. Factor 1 was dominated by 5- to 6-ring PAHs such as IP, BghiP, dBahA, BbF, BkF and BaP. These high molecular weight (MW) PAHs are highly relevant to vehicle emissions. Several studies have considered IP and BghiP as tracers of automobile emissions in traffic tunnels, roadsides and urban environments [46,47]. Gupta, et al. [48] also suggested that BkF, BbF, BaP, IP and dBahA were indicative of gasoline exhaust. Thus, factor 1 was considered as vehicle emissions. Factor 2 is characterized by the dominance of Flu, BaA, Chr, BbF, BkF, dBahA and BghiP. This is similar to that of high-temperature coal combustion derived from coking power plants, and the steel and iron industries [49,50] and thus this factor refers to coal combustion. Factor 3 was predominantly composed of Phe with small amounts of high MW PAHs. A similar profile was given for evaporative/uncombusted petroleum sources [51] and thus this factor was suggested to be indicative of volatilization or spill of petroleum-related products. Factor 4 showed a profile that is very similar to that for coal combustion at low temperature, i.e., for residential heating and cooking [52]. A clear seasonal trend of high in winter and low in summer also suggested, that this factor is corresponding to coal combustion used for residential heating. Therefore, we considered factor 4 to represent a source as residential emission. Factor 5 mainly consisted of 3- and 4-ring PAHs such as Flu, Phe, Ant, Fla and Pyr. High emissions of 3- and 4-ring PAHs are associated with biomass burning [49] and thus this factor was attributed to biomass burning.
The pie charts in Figure 7 show the contributions of each source to total PAHs over four seasons. As abovementioned, we found a clear seasonal trend of residential emission, which is high in winter and low in summer. The contribution from residential emission accounted for almost 172 ng m−3 (50%) in winter and only 1.1 ng m−3 (0.6%) in summer. This indicates that the elevated PAHs levels in winter (see Section 3.2) were mainly due to the high demand for residential heating. The coal consumption including coal combustion at high and low temperature was a major contributor of total PAHs, which is consistent with coal-dominated energy consumption structure in Xi’an. More than 104.9 ng m−3 (40%) of the PAHs emissions were from coal combustion over the four seasons, which even reached 230.5 ng m−3 (67%) in winter. The contribution from vehicle emission also showed a seasonal variation. It accounted for 53.1 ng m−3 (30%) of PAHs in summer and 10.3 ng m−3 (3.5%) in winter. The remaining contributions were primarily from biomass burning and petrogenic source of PAHs. Note that although a lower proportion of biomass burning was found in winter, the concentration of biomass burning-derived PAHs was indeed highest in winter (ΣPAH = 344 ng m−3 × 15.6%), followed by autumn (ΣPAH = 242.4 ng m−3 × 18%), spring (ΣPAH = 202.6 ng m−3 × 17.9%) and summer (ΣPAH = 177.0 ng m−3 × 13.4%). This result is in accord with the order of OC/EC ratio observed in Shen et al. [24] for the same investigated filter samples, indicating the important contribution of biomass burning to PAHs levels in autumn and winter.

4. Conclusions

PM10-bound PAHs were investigated on their abundance, day–night differences, seasonal variations and potential emission sources in Xi’an, based on a year-round dataset. The concentration of total PAHs ranged from 144.0 to 640.8 ng m−3. A significant difference of PAHs concentrations between daytime and nighttime was found in autumn, while the differences were insignificant in other seasons. The PAHs concentrations, however, showed a distinct seasonal variation. The highest level was observed in winter and the lowest was in summer. The average concentration of total PAHs was twice higher than that in summer. The PAHs partition capacity in PM10 also showed a seasonal variation and day–night difference. PAHs have a highest partition capacity in the particulate phase in winter while the day–night difference was most significant in spring. Results of source apportionment obtained from the PMF analysis revealed that the residential coal combustion for heating accounted for almost 50% of the high PAHs levels in winter. In addition, over 40% of the PAHs emissions were from coal combustion over the four seasons. Based on the source apportionment results, we suggest that the most effective measure to mitigate the PAHs levels in the air of Xi’an is to implement and enforce control on the coal combustion sources, such as the ongoing project of changing fuel from coal to natural gas for residential heating in northern China. To accurately assess the effects of such control measures, more studies also need to be carried out to monitor and report the up-to-date PAHs levels in the air.

Supplementary Materials

The following are available online at https://www.mdpi.com/2073-4433/9/2/62/s1, Figure S1: Comparison of PAHs levels between day- and nighttime over four seasons, Figure S2: Coefficient of divergence (CD) of gas-particle partition coefficient (KP) of individual PAH compound in the four seasons, Table S1: Results of Student’s t test to assess the significance of difference between daytime and nighttime measurements, Table S2: Liquid vapor pressures ( P L 0 ) of PAHs.

Acknowledgments

This research was supported by the National Natural Science Foundation of China (41573101), the Fundamental Research Funding for Central Universities in China (xkjc2015002), and a grant from SKLLQG, Chinese Academy of Sciences (SKLLQG1616).

Author Contributions

Zhenxing Shen, Hongmei Xu and Junji Cao conceived and designed the experiments; Xin Wang, Yaling Zeng and Qian Zhang performed the experiments; Xin Wang, Yali Lei and Zhenxing Shen analyzed the data; Xin Wang, Zhenxing Shen, Fobang Liu and Liu Yang wrote the paper.

Conflicts of Interest

The authors declare no conflict of interest.

References

  1. Zhang, Y.; Tao, S.; Shen, H.; Ma, J. Inhalation exposure to ambient polycyclic aromatic hydrocarbons and lung cancer risk of Chinese population. Proc. Natl. Acad. Sci. USA 2009, 106, 21063–21067. [Google Scholar] [CrossRef] [PubMed]
  2. Shen, H.; Huang, Y.; Wang, R.; Zhu, D.; Li, W.; Shen, G.; Wang, B.; Zhang, Y.; Chen, Y.; Lu, Y. Global atmospheric emissions of polycyclic aromatic hydrocarbons from 1960 to 2008 and future predictions. Environ. Sci. Technol. 2013, 47, 6415–6424. [Google Scholar] [CrossRef] [PubMed]
  3. Kim, K.-H.; Jahan, S.A.; Kabir, E.; Brown, R.J. A review of airborne polycyclic aromatic hydrocarbons (PAHs) and their human health effects. Environ. Int. 2013, 60, 71–80. [Google Scholar] [CrossRef] [PubMed]
  4. Ravindra, K.; Sokhi, R.; Van Grieken, R. Atmospheric polycyclic aromatic hydrocarbons: Source attribution, emission factors and regulation. Atmos. Environ. 2008, 42, 2895–2921. [Google Scholar] [CrossRef] [Green Version]
  5. Keyte, I.J.; Harrison, R.M.; Lammel, G. Chemical reactivity and long-range transport potential of polycyclic aromatic hydrocarbons—A review. Chem. Soc. Rev. 2013, 42, 9333–9391. [Google Scholar] [CrossRef] [PubMed]
  6. Li, X.; Yang, Y.; Xu, X.; Xu, C.; Hong, J. Air pollution from polycyclic aromatic hydrocarbons generated by human activities and their health effects in China. J. Clean. Prod. 2016, 112, 1360–1367. [Google Scholar] [CrossRef]
  7. Ravindra, K.; Bencs, L.; Wauters, E.; De Hoog, J.; Deutsch, F.; Roekens, E.; Bleux, N.; Berghmans, P.; Van Grieken, R. Seasonal and site-specific variation in vapour and aerosol phase PAHs over flanders (Belgium) and their relation with anthropogenic activities. Atmos. Environ. 2006, 40, 771–785. [Google Scholar] [CrossRef]
  8. Wei, C.; Han, Y.; Bandowe, B.A.M.; Cao, J.; Huang, R.-J.; Ni, H.; Tian, J.; Wilcke, W. Occurrence, gas/particle partitioning and carcinogenic risk of polycyclic aromatic hydrocarbons and their oxygen and nitrogen containing derivatives in Xi’an, central China. Sci. Total Environ. 2015, 505, 814–822. [Google Scholar] [CrossRef] [PubMed]
  9. Liu, J.; Li, J.; Lin, T.; Liu, D.; Xu, Y.; Chaemfa, C.; Qi, S.; Liu, F.; Zhang, G. Diurnal and nocturnal variations of PAHs in the Lhasa atmosphere, Tibetan Plateau: Implication for local sources and the impact of atmospheric degradation processing. Atmos. Res. 2013, 124, 34–43. [Google Scholar] [CrossRef]
  10. Duan, J.; Tan, J.; Wang, S.; Chai, F.; He, K.; Hao, J. Roadside, urban, and rural comparison of size distribution characteristics of PAHs and carbonaceous components of Beijing, China. J. Atmos. Chem. 2012, 69, 337–349. [Google Scholar] [CrossRef]
  11. He, J.; Fan, S.; Meng, Q.; Sun, Y.; Zhang, J.; Zu, F. Polycyclic aromatic hydrocarbons (PAHs) associated with fine particulate matters in Nanjing, China: Distributions, sources and meteorological influences. Atmos. Environ. 2014, 89, 207–215. [Google Scholar] [CrossRef]
  12. Boström, C.-E.; Gerde, P.; Hanberg, A.; Jernström, B.; Johansson, C.; Kyrklund, T.; Rannug, A.; Törnqvist, M.; Victorin, K.; Westerholm, R. Cancer risk assessment, indicators, and guidelines for polycyclic aromatic hydrocarbons in the ambient air. Environ. Health Perspect. 2002, 110, 451–488. [Google Scholar] [CrossRef] [PubMed]
  13. Bi, X.; Sheng, G.; Peng, P.A.; Chen, Y.; Zhang, Z.; Fu, J. Distribution of particulate-and vapor-phase n-alkanes and polycyclic aromatic hydrocarbons in urban atmosphere of Guangzhou, China. Atmos. Environ. 2003, 37, 289–298. [Google Scholar] [CrossRef]
  14. Huang, R.-J.; Zhang, Y.; Bozzetti, C.; Ho, K.-F.; Cao, J.-J.; Han, Y.; Daellenbach, K.R.; Slowik, J.G.; Platt, S.M.; Canonaco, F. High secondary aerosol contribution to particulate pollution during haze events in China. Nature 2014, 514, 218–222. [Google Scholar] [CrossRef] [PubMed] [Green Version]
  15. Cao, J.; Wu, F.; Chow, J.; Lee, S.; Li, Y.; Chen, S.; An, Z.; Fung, K.; Watson, J.; Zhu, C. Characterization and source apportionment of atmospheric organic and elemental carbon during fall and winter of 2003 in Xi’an, China. Atmos. Chem. Phys. 2005, 5, 3127–3137. [Google Scholar] [CrossRef]
  16. Han, Z.; Zhang, R.; Wang, Q.G.; Wang, W.; Cao, J.; Xu, J. Regional modeling of organic aerosols over China in summertime. J. Geophys. Res. Atmos. 2008, 113. [Google Scholar] [CrossRef]
  17. Shen, Z.; Arimoto, R.; Cao, J.; Zhang, R.; Li, X.; Du, N.; Okuda, T.; Nakao, S.; Tanaka, S. Seasonal variations and evidence for the effectiveness of pollution controls on water-soluble inorganic species in total suspended particulates and fine particulate matter from Xi’an, China. J. Air Waste Manag. Assoc. 2008, 58, 1560–1570. [Google Scholar] [PubMed]
  18. Cao, J.-J.; Zhang, T.; Chow, J.C.; Watson, J.G.; Wu, F.; Li, H. Characterization of atmospheric ammonia over Xi’an, China. Aerosol Air Qual. Res. 2009, 9, 277–289. [Google Scholar] [CrossRef]
  19. Shen, Z.; Cao, J.; Arimoto, R.; Han, Z.; Zhang, R.; Han, Y.; Liu, S.; Okuda, T.; Nakao, S.; Tanaka, S. Ionic composition of TSP and PM2.5 during dust storms and air pollution episodes at Xi’an, China. Atmos. Environ. 2009, 43, 2911–2918. [Google Scholar] [CrossRef]
  20. Bandowe, B.A.M.; Meusel, H.; Huang, R.-J.; Ho, K.; Cao, J.; Hoffmann, T.; Wilcke, W. PM2.5-bound oxygenated PAHs, nitro-PAHs and parent-PAHs from the atmosphere of a Chinese megacity: Seasonal variation, sources and cancer risk assessment. Sci. Total Environ. 2014, 473, 77–87. [Google Scholar] [CrossRef] [PubMed]
  21. Xu, H.; Ho, S.S.H.; Gao, M.; Cao, J.; Guinot, B.; Ho, K.F.; Long, X.; Wang, J.; Shen, Z.; Liu, S. Microscale spatial distribution and health assessment of PM2.5-bound polycyclic aromatic hydrocarbons (PAHs) at nine communities in Xi’an, China. Environ. Pollut. 2016, 218, 1065–1073. [Google Scholar] [CrossRef] [PubMed]
  22. Wang, J.; Cao, J.; Dong, Z.; Guinot, B.; Gao, M.; Huang, R.; Han, Y.; Huang, Y.; Ho, S.S.H.; Shen, Z. Seasonal variation, spatial distribution and source apportionment for polycyclic aromatic hydrocarbons (PAHs) at nineteen communities in Xi’an, China: The effects of suburban scattered emissions in winter. Environ. Pollut. 2017, 231, 1330–1343. [Google Scholar] [CrossRef] [PubMed]
  23. Shen, Z.; Han, Y.; Cao, J.; Tian, J.; Zhu, C.; Liu, S.; Liu, P.; Wang, Y. Characteristics of traffic-related emissions: A case study in roadside ambient air over Xi’an, China. Aerosol Air Qual. Res. 2010, 10, 292–300. [Google Scholar] [CrossRef]
  24. Shen, Z.; Cao, J.; Zhang, L.; Liu, L.; Zhang, Q.; Li, J.; Han, Y.; Zhu, C.; Zhao, Z.; Liu, S. Day–night differences and seasonal variations of chemical species in PM10 over Xi’an, northwest China. Environ. Sci. Pollut. Res. 2014, 21, 3697–3705. [Google Scholar] [CrossRef] [PubMed]
  25. USEPA. Positive Matrix Factorization 5.0 Fundamentals and User Guide. Available online: https://www.epa.gov/air-research/epa-positive-matrix-factorization-50-fundamentals-and-user-guide (accessed on 4 February 2018).
  26. Cheng, J.; Yuan, T.; Wu, Q.; Zhao, W.; Xie, H.; Ma, Y.; Ma, J.; Wang, W. PM10-bound polycyclic aromatic hydrocarbons (PAHs) and cancer risk estimation in the atmosphere surrounding an industrial area of Shanghai, China. Water Air Soil Pollut. 2007, 183, 437–446. [Google Scholar] [CrossRef]
  27. Tan, J.-H.; Bi, X.-H.; Duan, J.-C.; Rahn, K.A.; Sheng, G.-Y.; Fu, J.-M. Seasonal variation of particulate polycyclic aromatic hydrocarbons associated with PM10 in Guangzhou, China. Atmos. Res. 2006, 80, 250–262. [Google Scholar] [CrossRef]
  28. Liu, G.; Tong, Y.; Luong, J.H.; Zhang, H.; Sun, H. A source study of atmospheric polycyclic aromatic hydrocarbons in Shenzhen, south China. Environ. Monit. Assess. 2010, 163, 599–606. [Google Scholar] [CrossRef] [PubMed]
  29. Li, X.; Wang, Y.; Guo, X.; Wang, Y. Seasonal variation and source apportionment of organic and inorganic compounds in PM2.5 and PM10 particulates in Beijing, China. Environ. Sci. 2013, 25, 741–750. [Google Scholar] [CrossRef]
  30. Harrison, R.M.; Smith, D.; Luhana, L. Source apportionment of atmospheric polycyclic aromatic hydrocarbons collected from an urban location in Birmingham, UK. Environ. Sci. Technol. 1996, 30, 825–832. [Google Scholar] [CrossRef]
  31. Clark, P.J. An extension of the coefficient of divergence for use with multiple characters. Copeia 1952, 2, 61–64. [Google Scholar] [CrossRef]
  32. Wongphatarakul, V.; Friedlander, S.; Pinto, J. A comparative study of PM2.5 ambient aerosol chemical databases. Environ. Sci. Technol. 1998, 32, 3926–3934. [Google Scholar] [CrossRef]
  33. Yang, F.; Ye, B.; He, K.; Ma, Y.; Cadle, S.H.; Chan, T.; Mulawa, P.A. Characterization of atmospheric mineral components of PM2.5 in Beijing and Shanghai, China. Sci. Total Environ. 2005, 343, 221–230. [Google Scholar] [CrossRef] [PubMed]
  34. Shen, Z.; Cao, J.; Liu, S.; Zhu, C.; Wang, X.; Zhang, T.; Xu, H.; Hu, T. Chemical composition of PM10 and PM2.5 collected at ground level and 100 meters during a strong winter-time pollution episode in Xi’an, China. J. Air Waste Manag. Assoc. 2011, 61, 1150–1159. [Google Scholar] [CrossRef] [PubMed]
  35. Shen, Z.; Wang, X.; Zhang, R.; Ho, K.; Cao, J.; Zhang, M. Chemical composition of water-soluble ions and carbonate estimation in spring aerosol at a semi-arid site of Tongyu, China. Aerosol Air Qual. Res. 2011, 11, 360–368. [Google Scholar] [CrossRef]
  36. Wang, X.; Shen, Z.; Cao, J.; Zhang, L.; Liu, L.; Li, J.; Liu, S.; Sun, Y. Characteristics of surface ozone at an urban site of Xi’an in northwest China. J. Environ. Monit. 2012, 14, 116–126. [Google Scholar] [CrossRef] [PubMed]
  37. Zhang, Q.; Shen, Z.; Cao, J.; Zhang, R.; Zhang, L.; Huang, R.-J.; Zheng, C.; Wang, L.; Liu, S.; Xu, H. Variations in PM2.5, TSP, BC and trace gases (NO2, SO2, and O3) between haze and non-haze episodes in winter over Xi’an, China. Atmos. Environ. 2015, 112, 64–71. [Google Scholar] [CrossRef]
  38. Sousa, G.; Kiselev, D.; Kasparian, J.; George, C.; Ferreira, J.; Favreau, P.; Lazzarotto, B.; Wolf, J.-P. Time-resolved monitoring of polycyclic aromatic hydrocarbons adsorbed on atmospheric particles. Environ. Sci. Pollut. Res. 2017, 24, 19517–19523. [Google Scholar] [CrossRef] [PubMed]
  39. Fang, G.-C.; Wu, Y.-S.; Chen, J.-C.; Fu, P.P.-C.; Chang, C.-N.; Ho, T.-T.; Chen, M.-H. Characteristic study of polycyclic aromatic hydrocarbons for fine and coarse particulates at pastureland near industrial park sampling site of central Taiwan. Chemosphere 2005, 60, 427–433. [Google Scholar] [CrossRef] [PubMed]
  40. Tsapakis, M.; Stephanou, E.G. Occurrence of gaseous and particulate polycyclic aromatic hydrocarbons in the urban atmosphere: Study of sources and ambient temperature effect on the gas/particle concentration and distribution. Environ. Pollut. 2005, 133, 147–156. [Google Scholar] [CrossRef] [PubMed]
  41. Shen, Z.; Zhang, L.; Cao, J.; Tian, J.; Liu, L.; Wang, G.; Zhao, Z.; Wang, X.; Zhang, R.; Liu, S. Chemical composition, sources, and deposition fluxes of water-soluble inorganic ions obtained from precipitation chemistry measurements collected at an urban site in northwest China. J. Environ. Monit. 2012, 14, 3000–3008. [Google Scholar] [CrossRef] [PubMed]
  42. Ho, K.; Ho, S.S.H.; Lee, S.; Cheng, Y.; Chow, J.C.; Watson, J.G.; Louie, P.K.K.; Tian, L. Emissions of gas-and particle-phase polycyclic aromatic hydrocarbons (PAHs) in the Shing Mun Tunnel, Hong Kong. Atmos. Environ. 2009, 43, 6343–6351. [Google Scholar] [CrossRef]
  43. Tan, J.; Guo, S.; Ma, Y.; Duan, J.; Cheng, Y.; He, K.; Yang, F. Characteristics of particulate PAHs during a typical haze episode in Guangzhou, China. Atmos. Res. 2011, 102, 91–98. [Google Scholar] [CrossRef]
  44. Dachs, J.; Eisenreich, S.J. Adsorption onto aerosol soot carbon dominates gas-particle partitioning of polycyclic aromatic hydrocarbons. Environ. Sci. Technol. 2000, 34, 3690–3697. [Google Scholar] [CrossRef]
  45. Odabasi, M.; Cetin, E.; Sofuoglu, A. Determination of octanol–air partition coefficients and supercooled liquid vapor pressures of PAHs as a function of temperature: Application to gas–particle partitioning in an urban atmosphere. Atmos. Environ. 2006, 40, 6615–6625. [Google Scholar] [CrossRef]
  46. Miguel, A.H.; Kirchstetter, T.W.; Harley, R.A.; Hering, S.V. On-road emissions of particulate polycyclic aromatic hydrocarbons and black carbon from gasoline and diesel vehicles. Environ. Sci. Technol. 1998, 32, 450–455. [Google Scholar] [CrossRef]
  47. Ma, Y.; Cheng, Y.; Qiu, X.; Lin, Y.; Cao, J.; Hu, D. A quantitative assessment of source contributions to fine particulate matter (PM2.5)-bound polycyclic aromatic hydrocarbons (PAHs) and their nitrated and hydroxylated derivatives in Hong Kong. Environ. Pollut. 2016, 219, 742–749. [Google Scholar] [CrossRef] [PubMed]
  48. Gupta, S.; Kumar, K.; Srivastava, A.; Srivastava, A.; Jain, V. Size distribution and source apportionment of polycyclic aromatic hydrocarbons (PAHs) in aerosol particle samples from the atmospheric environment of Delhi, India. Sci. Total Environ. 2011, 409, 4674–4680. [Google Scholar] [CrossRef] [PubMed]
  49. Wang, J.; Ho, S.S.H.; Huang, R.; Gao, M.; Liu, S.; Zhao, S.; Cao, J.; Wang, G.; Shen, Z.; Han, Y. Characterization of parent and oxygenated-polycyclic aromatic hydrocarbons (PAHs) in Xi’an, China during heating period: An investigation of spatial distribution and transformation. Chemosphere 2016, 159, 367–377. [Google Scholar] [CrossRef] [PubMed]
  50. Liu, D.; Lin, T.; Syed, J.H.; Cheng, Z.; Xu, Y.; Li, K.; Zhang, G.; Li, J. Concentration, source identification, and exposure risk assessment of PM2.5-bound parent PAHs and nitro-PAHs in atmosphere from typical Chinese cities. Sci. Rep. 2017, 7, 10398. [Google Scholar] [CrossRef] [PubMed]
  51. Callén, M.S.; Iturmendi, A.; López, J.M. Source apportionment of atmospheric PM2.5-bound polycyclic aromatic hydrocarbons by a PMF receptor model. Assessment of potential risk for human health. Environ. Pollut. 2014, 195, 167–177. [Google Scholar] [CrossRef] [PubMed]
  52. Okuda, T.; Okamoto, K.; Tanaka, S.; Shen, Z.; Han, Y.; Huo, Z. Measurement and source identification of polycyclic aromatic hydrocarbons (PAHs) in the aerosol in Xi’an, China, by using automated column chromatography and applying positive matrix factorization (PMF). Sci. Total Environ. 2010, 408, 1909–1914. [Google Scholar] [CrossRef] [PubMed]
Figure 1. Location map of the sampling site in Xi’an.
Atmosphere 09 00062 g001
Figure 2. Day–night variations of PAHs in each season.
Atmosphere 09 00062 g002
Figure 3. Seasonal distribution of PAHs concentrations. The box plots show median values (the band inside the box), 25th and 75th percentiles (lower and upper box bounds, respectively), and 5th and 95th percentiles (lower and upper whiskers, respectively).
Atmosphere 09 00062 g003
Figure 4. Seasonal variation of the proportions of 3- to 6-ring PAHs.
Atmosphere 09 00062 g004
Figure 5. Day–night difference and seasonal variation of partition capacity of individual PAH compounds in PM10.
Atmosphere 09 00062 g005
Figure 6. Factor profiles obtained by positive matrix factorization (PMF) analysis from data of 13 PAHs species in PM10 of Xi’an.
Atmosphere 09 00062 g006
Figure 7. Contributions of the five sources to the total PAHs in PM10 of Xi’an over four seasons.
Atmosphere 09 00062 g007
Table 1. Statistical summary for the mass concentrations of PAHs over four seasons.
PAHs Concentrations (ng m−3)∑PAHs (ng m−3)
SeasonFluPheAntFLAPyrBaAChrBbFBkFBaPIPdBahABghiP
Spring6.59.84.915.010.28.918.827.818.814.213.713.740.4202.6
Summer5.26.73.310.05.36.715.724.419.312.211.815.341.3177.0
Autumn5.37.57.223.518.911.920.231.520.820.822.013.439.5242.4
Winter6.99.428.635.631.120.737.139.327.132.423.413.339.6344.6
Annual6.28.514.523.919.313.825.832.522.622.418.813.840.1262.2

