Variability and Trends in Global Precipitable Water Vapor Retrieved from COSMIC Radio Occultation and Radiosonde Observations


1
School of Hydrology and Water Resources, Nanjing University of Information Science and Technology, Nanjing 210044, China
2
College of Atmospheric Science, Nanjing University of Information Science and Technology, Nanjing 210044, China
*
Author to whom correspondence should be addressed.
Atmosphere 2018, 9(5), 174; https://doi.org/10.3390/atmos9050174
Submission received: 3 April 2018
/
Revised: 3 May 2018
/
Accepted: 3 May 2018
/
Published: 7 May 2018
(This article belongs to the Section Meteorology)
Abstract
:The spatial and temporal variations in global precipitable water (PW) derived from satellite and radiosonde observations during 2007–2016 are compared and analyzed in this study. The two observations show a good agreement in global spatiotemporal distributions and trends in PW. Generally, PW shows apparent latitudinal and seasonal variations. The averaged PW peaks in the tropical region, with the value of 40 mm or higher, and then decreases apparently to the polar region, less than 10 mm. PWs are larger in warm seasons and smaller in cold seasons for both hemispheres. It is indicated that the spatial and seasonal variabilities of PW are highly related to water vapor source and surface temperature as a direct heat source. The global PWs have changed in the past 60 years and, to some extent, strongly in the recent 10 years. It is found that PWs at Australian stations present statistically significant decreasing trends in last 60 years, while PWs at most stations in the United States have increasing trends. According to the global observations, it is found that PWs show uptrends over land and downtrends over the ocean in last 10 years, implying the widespread increase of water vapor in the troposphere over land.
1. Introduction
As one of the most significant constituents in the atmosphere, water vapor has been a major concern for decades. Variations in the water vapor concentration are closely linked to changes in global radiation budget, which may have impacts on the atmospheric temperature structure, the characteristics of rainfalls and droughts [1]. Accurate and consistent water vapor measurements in the troposphere are significant for studying the water vapor feedbacks on the clouds, precipitation and other parts of the hydrological cycles, which is still one of the largest uncertainties in understanding the global warming mechanism. Precipitable water (PW), also known as tropospheric water vapor and integrated column water vapor, is a quantitative measurement of water vapor in the upper atmosphere for numerical weather model and climate studies [2].
Nowadays, there are various kinds of methods to obtain PW from observations, and they are usually divided into two types: ground-based and space-based measurements. Among these observations, radiosondes and satellites are two popular instruments to detect water vapor in the atmosphere. Radiosondes have provided detailed measurements of global atmospheric water vapor since 1938 [3] and now there are over 2700 stations distributed all over the world, which provides us the chance to study the characteristics of PW for global climate change and weather prediction. In 1963, Reitan [4] calculated the regression equation of monthly mean surface dew point and monthly mean PW using 15 stations’ observations in America, which provided a new method to access PW with the limited observations. In 1981, Sinha and Sinha [5] used the relationship between PW and dew point temperature to study the PW under the control of the India monsoon and found the maximum correlation between dew point temperature at 850 hPa and PW. However, the regression equation of the relationship changes with the latitude, altitude and other climate elements of the regions and the method only provides the approximation of the PW value. In 1996, Ross and Elliott [6] pointed out the fact of the bad performance of earlier radiosonde sensors over 300 hPa, even 500 hPa in middle and high latitudes. In addition, in Ross and Elliott’s later research in 2000 [7], the increase of PW during 1973–1995 in the Northern Hemisphere, except Europe, was found after identifying and excluding stations with the problems of inhomogeneity and incomplete records. After that, Durre et al. [8] updated the trends of water vapor of the Northern Hemisphere through 2006 and widespread significant increases of tropospheric water vapor from the surface to the highest observing level in the Northern Hemisphere were presented.
With the development of sensor techniques and launches of satellites, space-based observations with global coverage and a higher resolution of space and time are possible. In 2010, Ho et al. [2] compared specific humidity profiles obtained by the global positioning system radio occultation (GPS RO) technique with radiosonde observations retrieved by different sensors and European Center for Medium Range Forecasts (ECMWF) reanalysis data; comparisons show overall agreements among these data sets and the usefulness of the new GPS RO water vapor profiles retrievals. Similar results can be found in Huang et al.’s [9] research of comparisons in PW with three data sets of GPS RO, ground-based GPS observations and NCEP reanalyses. Wick et al. [10] studied the variations in the lowest perigee height of the wet profiles by using GPS RO observations and a special sensor microwave imager (SSM/I) and the result demonstrates that the variation itself does not bring systematic errors to PW differences. In Xu et al.’s [11] research of wet profiles obtained from GPS RO and radiosonde over China, temperature differences between two observations were found positively correlated with station altitudes in the Qinghai–Tibet Plateau region, while pressure, water vapor pressure, as well as refractivity differences, were negatively correlated with altitudes. Authors speculated the differences between GPS RO and radiosonde observations at high altitude area might be caused by the complex topography and the limitation in the background models used in GPS RO retrievals. Also, Xu et al. pointed out that a negative refractivity difference of two observations occurs below 5 km and is related to humid atmosphere and super-refraction. Similar results can be found in Xie et al.’s [12] research of negative refractivity over the ocean. The differences are found after comparing to the reanalysis data and show a seasonal clustered variation over oceans where super-refraction often occurs.
Earlier studies about the validation of GPS RO and radiosonde PW observations make weather and climate research using these observations convincing. With the water vapor obtained from GPS RO technique, special cases such as storm events and baroclinic disturbances in certain regions are detected and analyzed in higher temporal and spatial resolution [13]. Chou et al. [14] compared the humidity variations during a strong typhoon by using radiosonde observations and GPS RO observations; the result confirms the superiority of the satellite GPS RO observations of atmospheric water vapor during extreme weather when radiosondes cannot function fully. Moreover, in Ho et al.’s study of 2018 [15], GPS RO observations of atmospheric total water vapor were compared to microwave radiometers, and they found that GPS RO retrievals are rarely affected by weather such as clouds and precipitation, which is one of the advantages of RO observations.
In recent years, more research has been focused on the relationships between PW (water vapor content) and specific meteorological variables, such as the temperature of different levels, the rainfall amount, atmospheric general circulation, etc. The climatological characteristics of PW in different regions have also been studied in the recent years. Zhai and Eskridge [16] studied atmospheric water vapor from 1970 to 1990 in China, and the positive correlation between PW and precipitation over China is confirmed; seasonal correlation differences are also observed. Barman et al. [17] studied the variability of PW over India in detail, and a diurnal cycle coinciding with the daily solar cycle is discovered in this country with differences in regions. Moreover, the relationship between PW and the Asia monsoon is revealed in China and India [16,17]; PWs in both countries show seasonal correlations. Studies of PW also show that PW is affected by North Atlantic Oscillation (NAO) in Turkey [18] and El Nino–southern oscillation (ENSO) events [19].
However, GPS RO records used in this study only have observations since 2006, which is not long enough for climate research; radiosonde observations only have measurements over land twice-daily and the global station distribution is uneven, which makes global climate research of PW incomplete. Using both GPS RO and radiosonde observations, the full coverage of global PW climate characteristics is studied in this study. We evaluated the consistency in PWs calculated from two observational datasets. Besides the spatial and temporal variations in global PW, the long-term trend (60-year radiosonde records) and most recent decade trend (10-year COSMIC data) in PW are also studied. The data and methods used in this study are presented in Section 2. Section 3 presents the results, firstly with a detailed comparison of two observation results and then followed by the results of variabilities and trends in PW. Section 4 consists of the conclusions.
2. Data and Method
Radiosonde data used in this paper are from the National Climatic Data Center (NCDC, Asheville, NC, USA) Integrated Global Radiosonde Data (IGRA) version 2 [20]. IGRA consists of radiosonde and pilot balloon observations over 2000 globally distributed stations and over 60 years (~1957–2016) of records. The records include various meteorological elements such as temperature, relative humidity, pressure, wind speed, wind direction at standard levels (including the surface level and 1000, 925, 825, 700, 500 hPa, etc.) and at significant levels.
Satellite-based global positioning system radio occultation soundings from the FORMOSAT-3/COSMIC (Formosa Satellite Mission 3/Constellation Observing System for Meteorology, Ionosphere, and Climate) have long-term, all-weather, global operational measurements of water vapor profiles, which provided additional observations over the oceans and the Southern Hemisphere for the most recent ten years (2007–2016) [2]. The FORMOSAT-3/COSMIC mission is a collaborative project held by the University Corporation for Atmospheric Research in the USA and the National Space Organization (NSPO) in Taiwan. The GPS radio-occultation receivers on the COSMIC satellites measure the phase delay of radio waves from satellites when occulted by the Earth’s atmosphere. Profiles of atmospheric refractivity can be derived from the bending angles of radio wave trajectories in the ionosphere, stratosphere, and troposphere. The GPS RO retrieved wet profiles from the COSMIC Data Analysis and Archive Center consisting of temperature, pressure and analyzed refractivity up to 40 km in each profile and containing over 1000 daily profiles distributed globally with high vertical resolution (100 m).
The raw data from the RO measurements can be processed to derive bending angles, which can be converted to the atmospheric refractivity (N) under the spherical symmetry assumption [21]. In the upper and middle troposphere, the refractivity is mainly used to obtain temperature. In the lower troposphere, the information of refractivity is mainly used to retrieve water vapor, since the atmospheric refractivity is more sensitive to water vapor variability than to the temperature [22]. Following Teng et al. [19], the water vapor pressure can be calculated by the relationship among N, temperature (T) in Kelvin, air pressure (P) in hPa and water vapor pressure (e) in hPa:
The specific humidity is easily calculated by water vapor pressure and air pressure using the Equation (2) [23]. ()
To calculate PW value of one single wet profile, the specific humidity of each height is integrated from the surface to the retrieved maximum height, using the Equation (3). In the Equation (3), W is the PW value in mm, ρ is the density of liquid water, P is air pressure, Ps is the surface air pressure, g is the gravitational acceleration value.
The existence of super-refraction in the lower troposphere might lead to negative refractivity [12], which might cause the biases of temperature and humidity and void data from the surface to the lowest perigee height. In this study, the void data of layers is compensated with the same value of the lowest perigee and, to reduce the uncertainty, profiles with a lowest perigee height higher than 1.0 km are discarded. It is noteworthy that, since the lowest ray perigee heights often happen in the drier atmosphere, some sampling errors may be introduced. However, Teng et al. [19] proved that this bias in PW will be less than 2 mm on average. The global PW values are then averaged into regular grid points with the resolution of 5° latitude by 5° longitude bins.
For IGRA dataset, the water vapor pressure is the derived parameter, and PW can be calculated with Equation (3) from the surface to 300 hPa pressure level. Since there are usually two observations or more in one day, the daily PW is the averaged value of all observations in one day. To derive reliable PW climatology, at least ten soundings in one month and at least 9 months of valid derived average PW values in one year are required. For better comparison with the COSMIC results, we used the IGRA data from 2007 to 2016, except the long-term trend results (~1957–2016).
Three-month seasons are defined as December–January–February (DJF, in short; Northern Hemisphere winter, Southern Hemisphere summer), June–July–August (JJA, in short; Northern Hemisphere summer and Southern
Hemisphere winter), etc. Trend analysis used the non-parametric median of pairwise slopes method [24] and the Spearman rank-order correlation method is used for confidence level test.
3. Results and Discussion
3.1. Comparisons of COSMIC and IGRA
In order to compare the PW derived from radiosonde observations with COSMIC satellite data in details, we selected eight stations for the case study, with consideration of latitude, elevation and the distance to the ocean. The locations are shown in Figure 1.
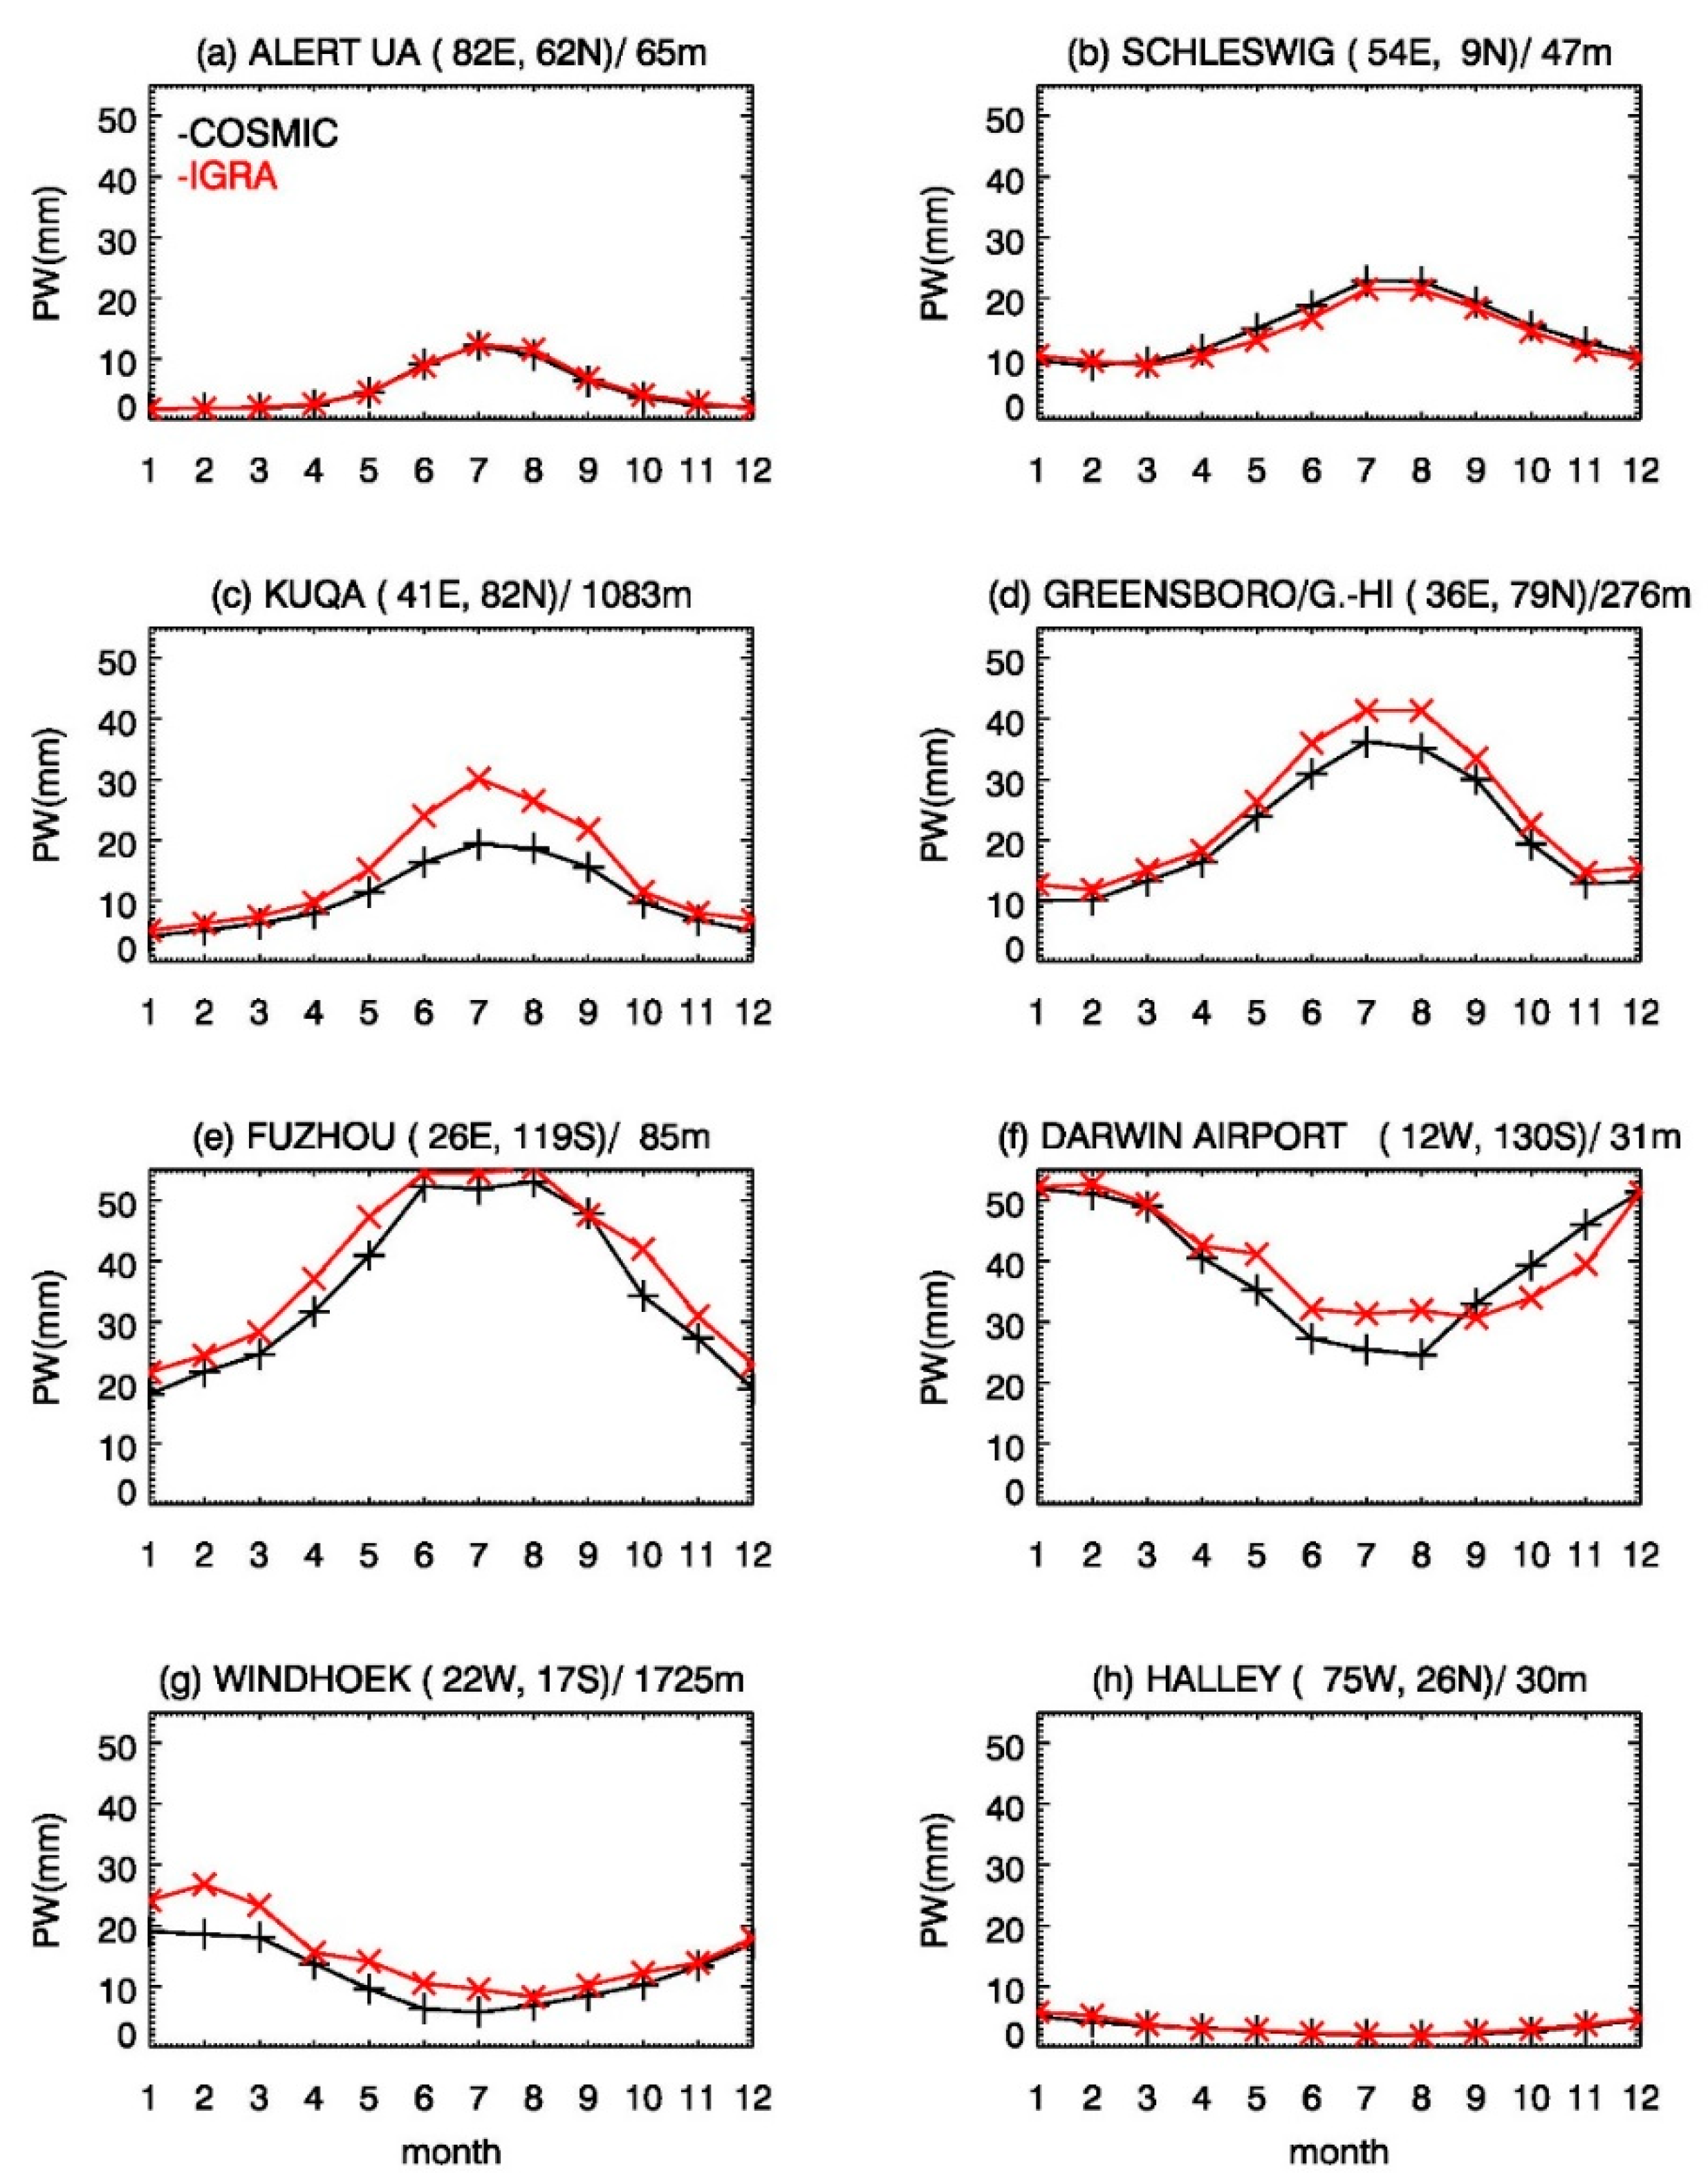
The variations of monthly averaged PW at selected stations are shown in Figure 2. In general, PWs derived from two datasets show consistent patterns. PWs are larger in warm seasons and smaller in cold seasons for both hemispheres. In the polar regions, PWs are quite small (Figure 2a,h) and the differences between two observations are relatively small. PWs at the Antarctic are below 10 mm throughout the whole year. In summer, stations in the Arctic (Figure 2a) have relatively larger PWs than other seasons. Overall, PWs derived from COSMIC have smaller values in the middle and lower latitudes than the ones from radiosonde observations, except for two stations (Figure 2b,f). The PWs from the satellite are relatively larger than the ones from the radiosonde observations at the European station Schleswig (Figure 2b) throughout the year. For the Darwin Airport station (Figure 2f), which is located in the Southern Hemisphere, the IGRA PWs are smaller than the COSMIC ones in springtime.
It is noteworthy that two stations with elevation over 1 km (Figure 2c,g) have larger IGRA PWs, especially for the summertime, with differences larger than 5 mm or even higher. As presented in Section 2, PW values are accumulated from the ground to the highest observing level for the COSMIC data. Because of the existence of the lowest perigee point, the void lower levels (from the surface to the lowest perigee point) are filled with PW value of the lowest water vapor observation of water vapor. This process might cause an averaged 2 mm or less bias of PW, as Teng et al. introduced in their research [19]. This might bring the differences between COSMIC and IGRA PW closer over stations, especially for those with higher elevations.
According to Figure 2, it is easily found that the PWs increase from the polar region to the tropical region. However, not all stations in the tropical area have larger PW values. PWs in summer at the tropics are usually about 50 mm (Figure 2e,f). However, for station Windhoek (Figure 2g), summer PWs have not reached 30 mm. This station might be influenced by Benguela Current, which is a cold current that constrains the evaporation of the sea surface and brings less water vapor to the coastal area. This implies that the coastal regions may not always be assumed to have sufficient water vapor supply and PWs at these areas may be impacted by the ocean current.
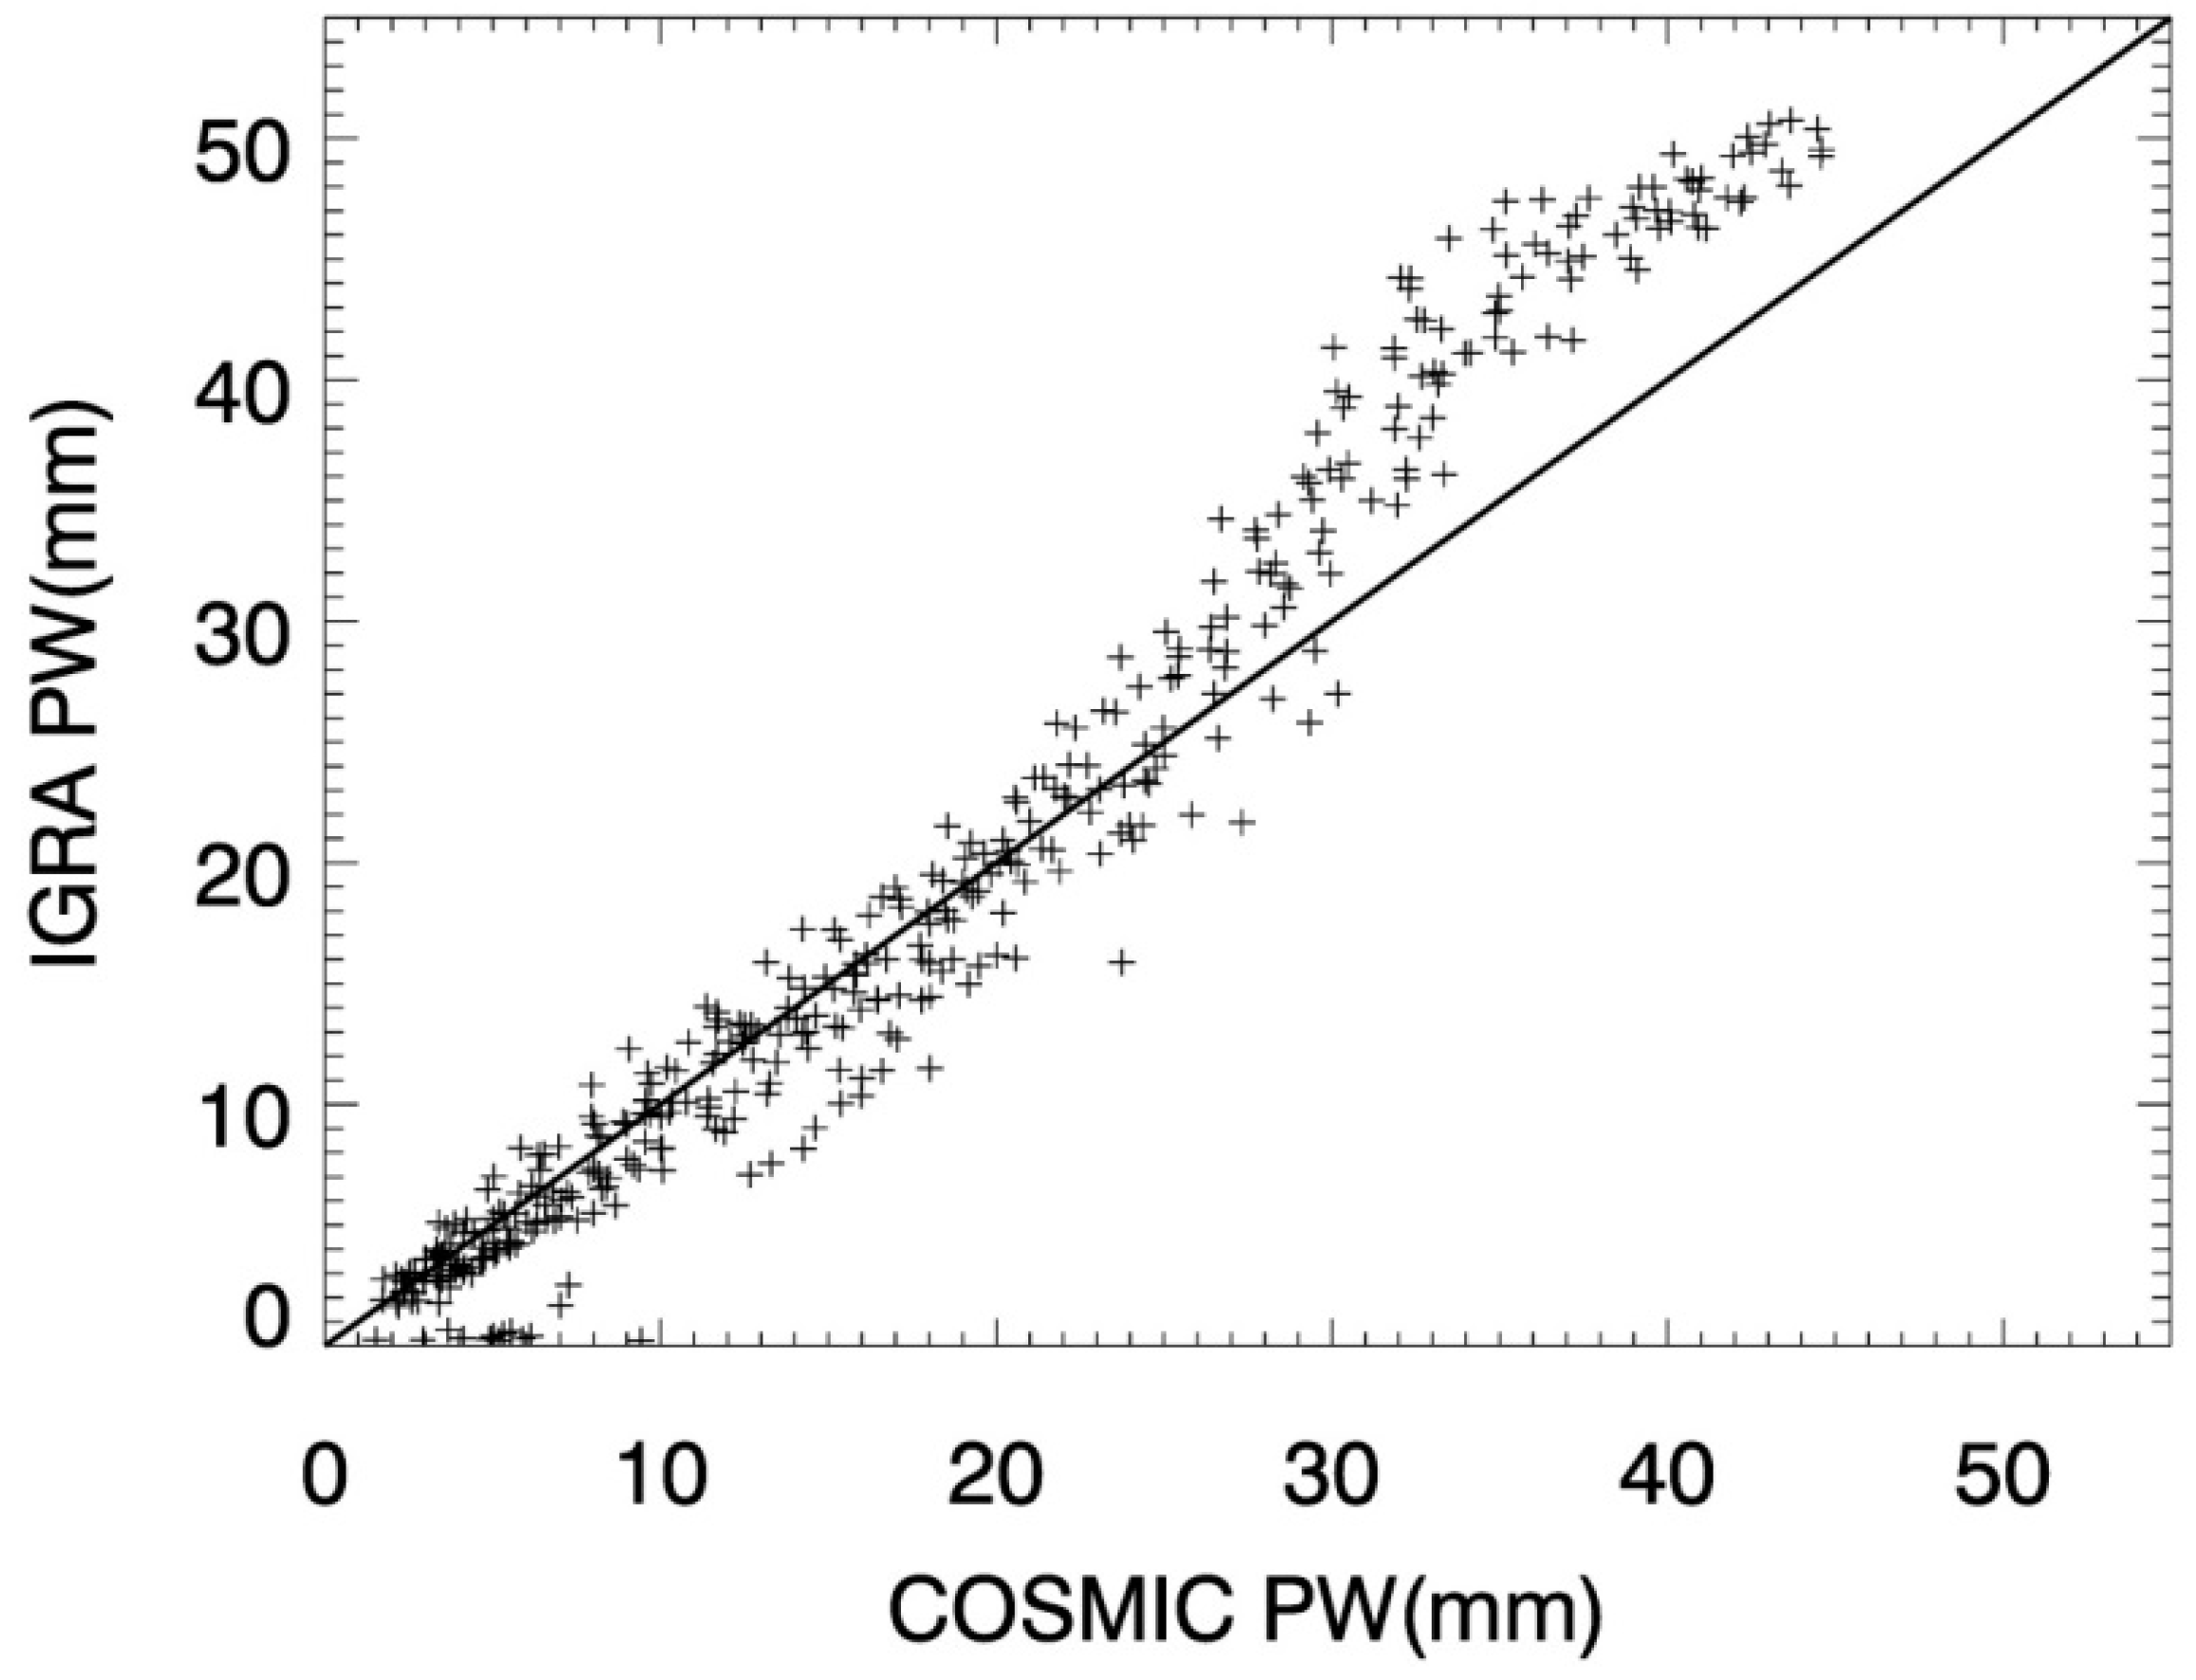
To further explore the differences in PW derived from COSMIC and radiosonde observations, the latitudinal monthly averaged PWs of both observations are compared in scatterplots (Figure 3). Note that the latitudinal mean values are obtained by the averaged values in 5° latitude width (36 bins). Two observations show a good agreement, and Spearman’s correlation is 0.98 (significant). When the PW values are smaller than 30 mm, two observations scatter around the y = x line evenly. However, when the PWs are larger than 30 mm, COSMIC PWs are systematically smaller than the ones derived from IGRA. This difference will be further explored in the following sections. Interestingly, there are a few spots with very small IGRA PW values scattered above the x-axis. This indicates that there are some areas with little atmospheric water vapor where radiosonde observations cannot fully capture the real circumstance of the water vapor content but COSMIC can.
3.2. Spatial and Seasonal Variations
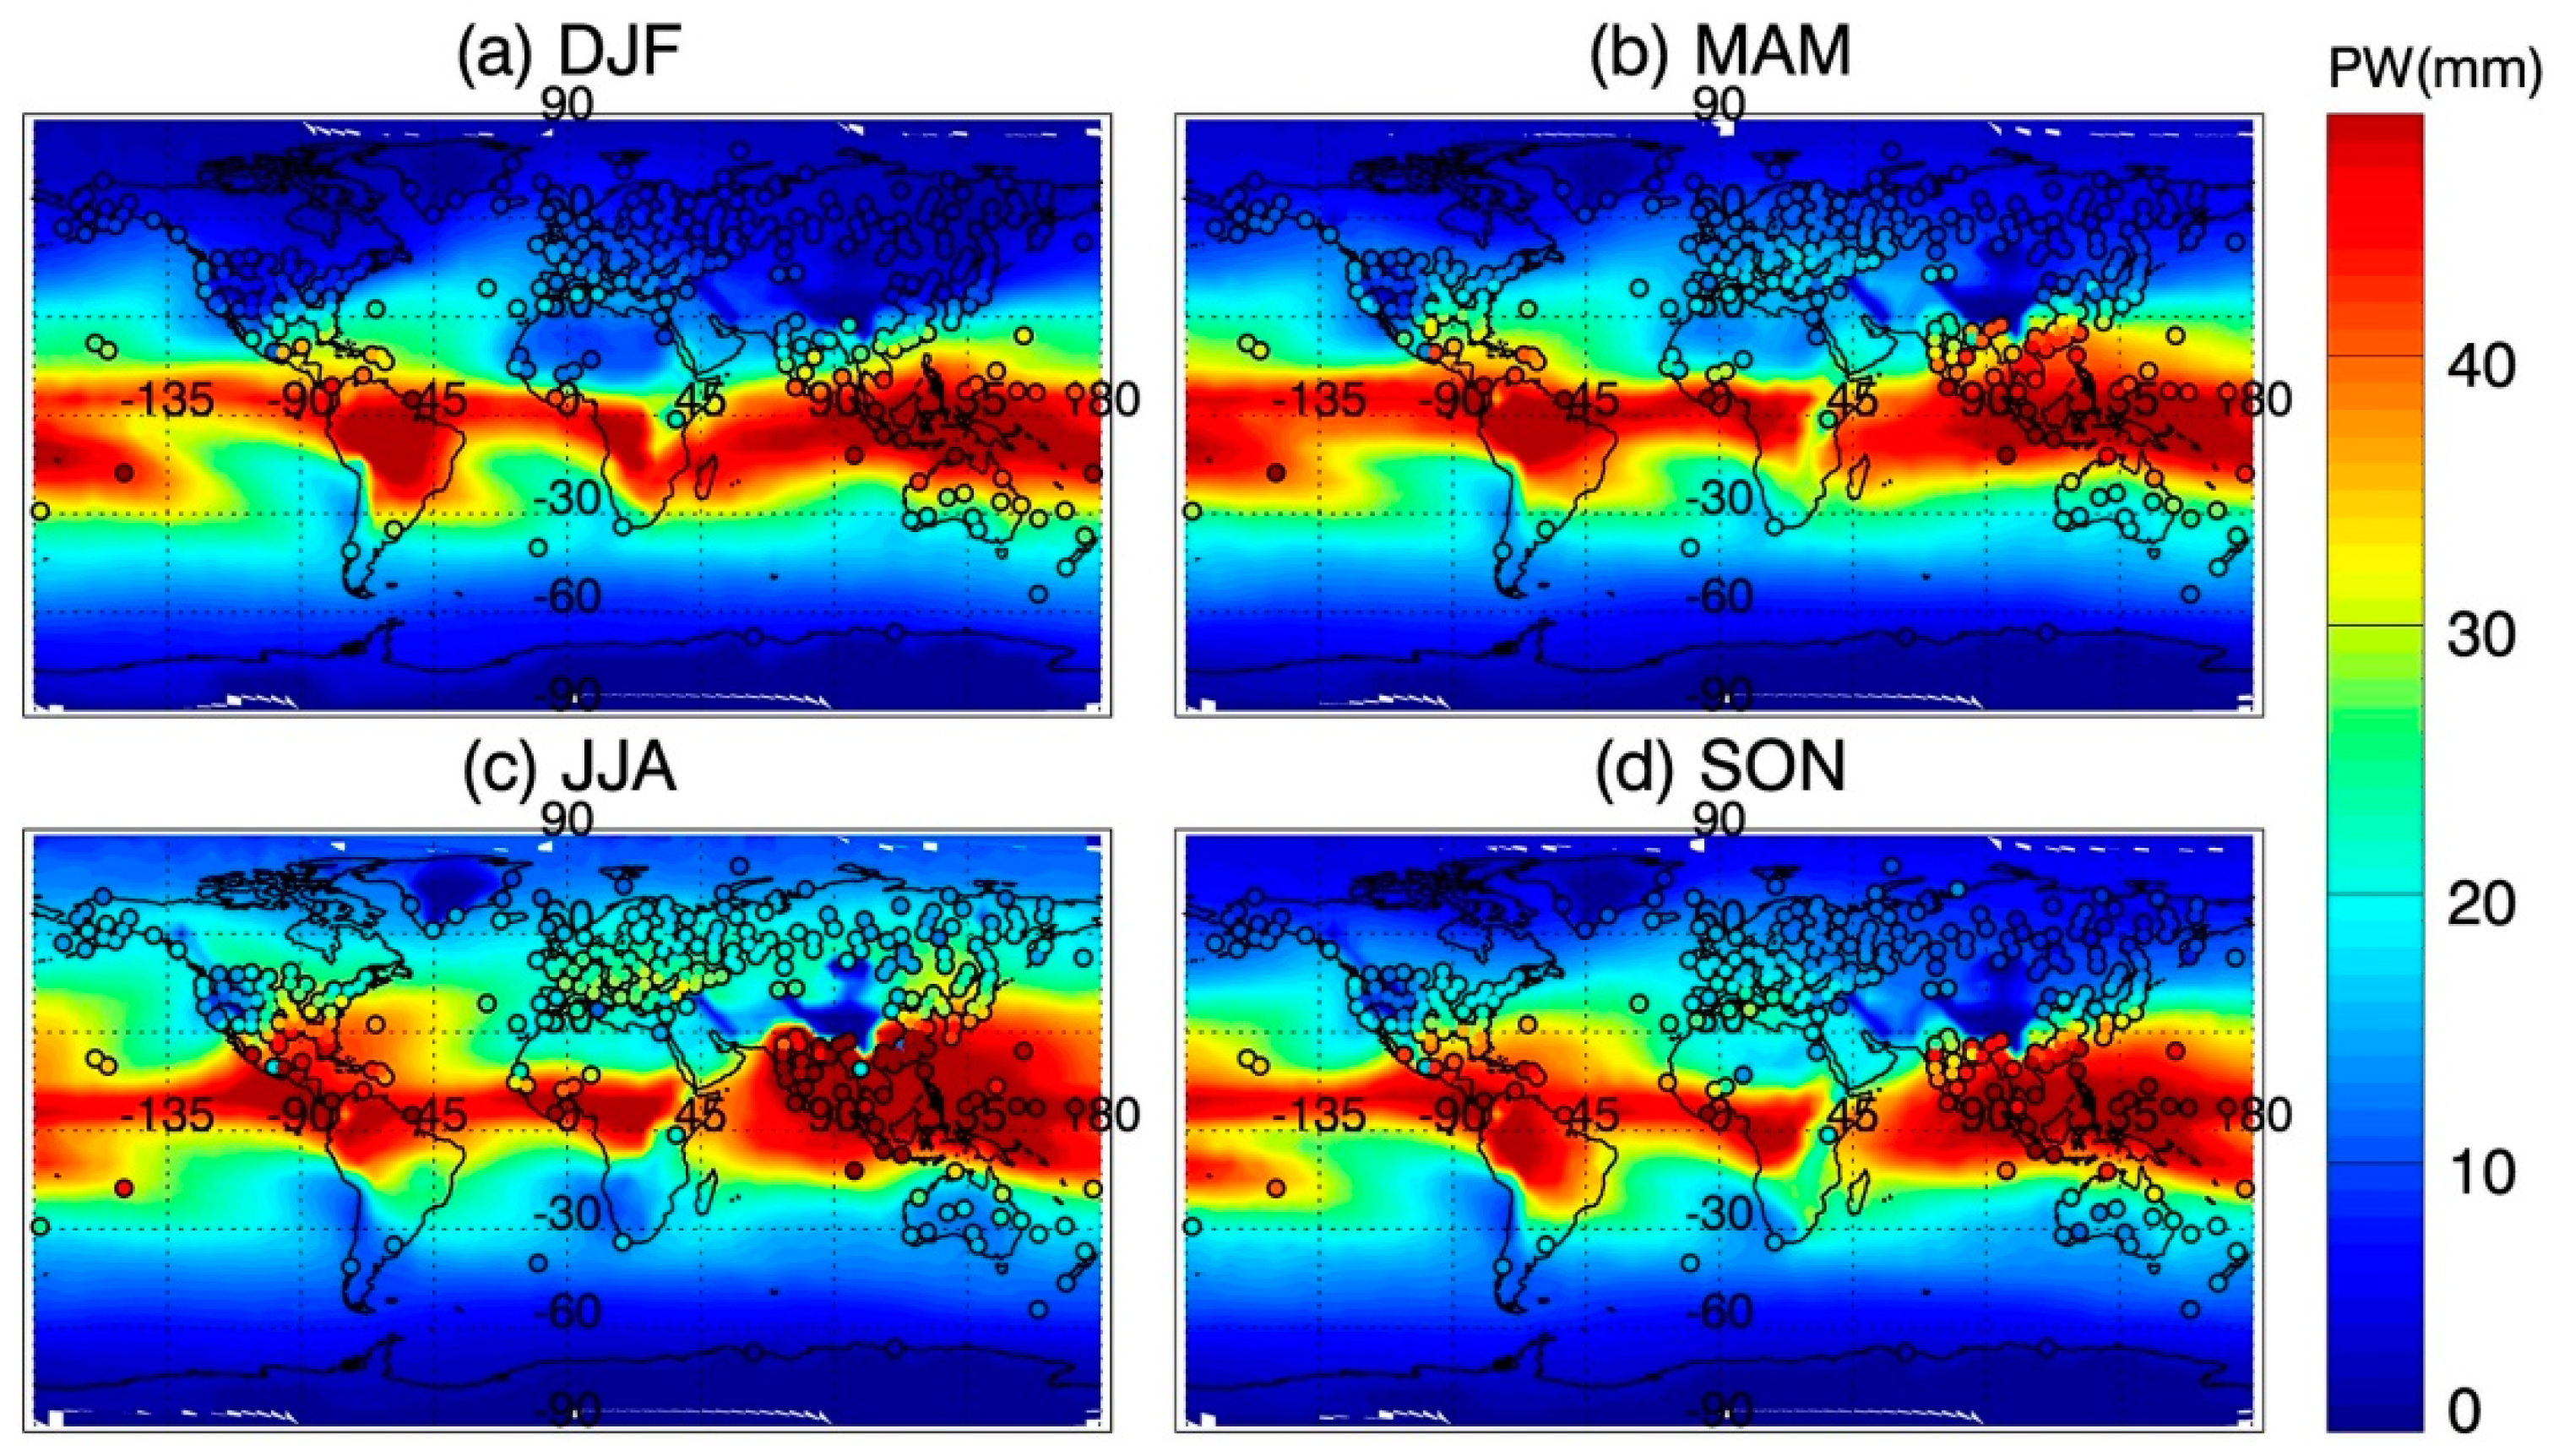
The comparison of global averaged PW between IGRA and COSMIC in four seasons during 2007–2016 is presented in Figure 4. The colored dots denote the results from IGRA radiosonde observations. The radiosonde stations are distributed unevenly in the Northern and Southern Hemispheres, and over 80% of radiosonde stations are in the Northern Hemisphere. Meanwhile, in the Southern Hemisphere, most stations are located in the continent of Australia and equatorial regions to the north of Australia. The dominant seasonal variations of PW derived from two observations are similar.
PW peaks in the tropical area with average values of 40 mm. The larger differences shown in Figure 3 are assumed to be in this region, where PWs are generally larger than 30 mm. The scatterplot in Figure 3 shows the latitudinal averaged results. The COSMIC PWs contain the information of both ocean and lands, while the IGRA PWs mainly show the results on land. According to Figure 4, the IGRA stations usually located in the hot spots in the tropical region. This may be the reason for the IGRA PWs being larger than the COSMIC PWs in the region with PWs larger than 30 mm.
There are 3 PW maxima regions in the tropical area. One is located in the Amazon Plain, the second in Southeast Asia and the last in Congo basin. For the first peak region, the river Amazon and the large cover of tropical rainforests supply the upper atmosphere with sufficient water vapor. In addition, under the control of the intertropical convergence zone (ITCZ), the continual upward flow makes the supply stronger. The second region is Southeast Asia, surrounded by ocean, having a great amount of water vapor sources to the upper atmosphere. The last and smallest region of peak PW value is Congo basin, which also has a large area of rainforest, providing abundant water vapor to the upper level. The pattern of variations in PW is similar to the distribution of annual mean precipitation presented by Good et al. [25] and Kuo et al.’s [26], and all PW maxima regions have larger precipitation. In Holloway and Neelin’s [27] research of the temporal relations of column water vapor and precipitation in the tropical area, they found an autocorrelation time of PW compared to precipitation and that PW increases consistently with mesoscale convective activity. This indicates that changes in PW can be used as a predictor of precipitation. In addition, in Kuo et al.’s [26] research, the two-way interaction between PW and convection is revealed. Most published results indicated the complicated relationships between PW and rainfall. The regions with large PWs may have a few amounts of rainfall or even no rain. The dynamical processes also play a role in determining whether it will rain. On the other side, the local PWs may be not enough to support one rainstorm and the water vapor transport is also important to the precipitation events.
For mid-latitudes, PW is much smaller than in the tropics and it varies obviously in four seasons. Summer PWs are generally larger than other seasons. However, there is a consistent low PW region in all four seasons, which is in the southwest of China. The elevations of this region are relatively high, at about 3000 m or even higher. Stations of Figure 2c with high elevation are only in this region. This implies that the elevation also has some impact on the PWs and that higher elevation has smaller PW.
In the polar regions, PW values decrease to less than 10 mm and do not show any seasonal variations. However, the Northern Hemisphere has a much brighter color in summer over the mid-latitude area, even over the Arctic, than that in the Southern Hemisphere summer. This might be associated with higher temperatures or active circulations in the summer of the Northern Hemisphere.
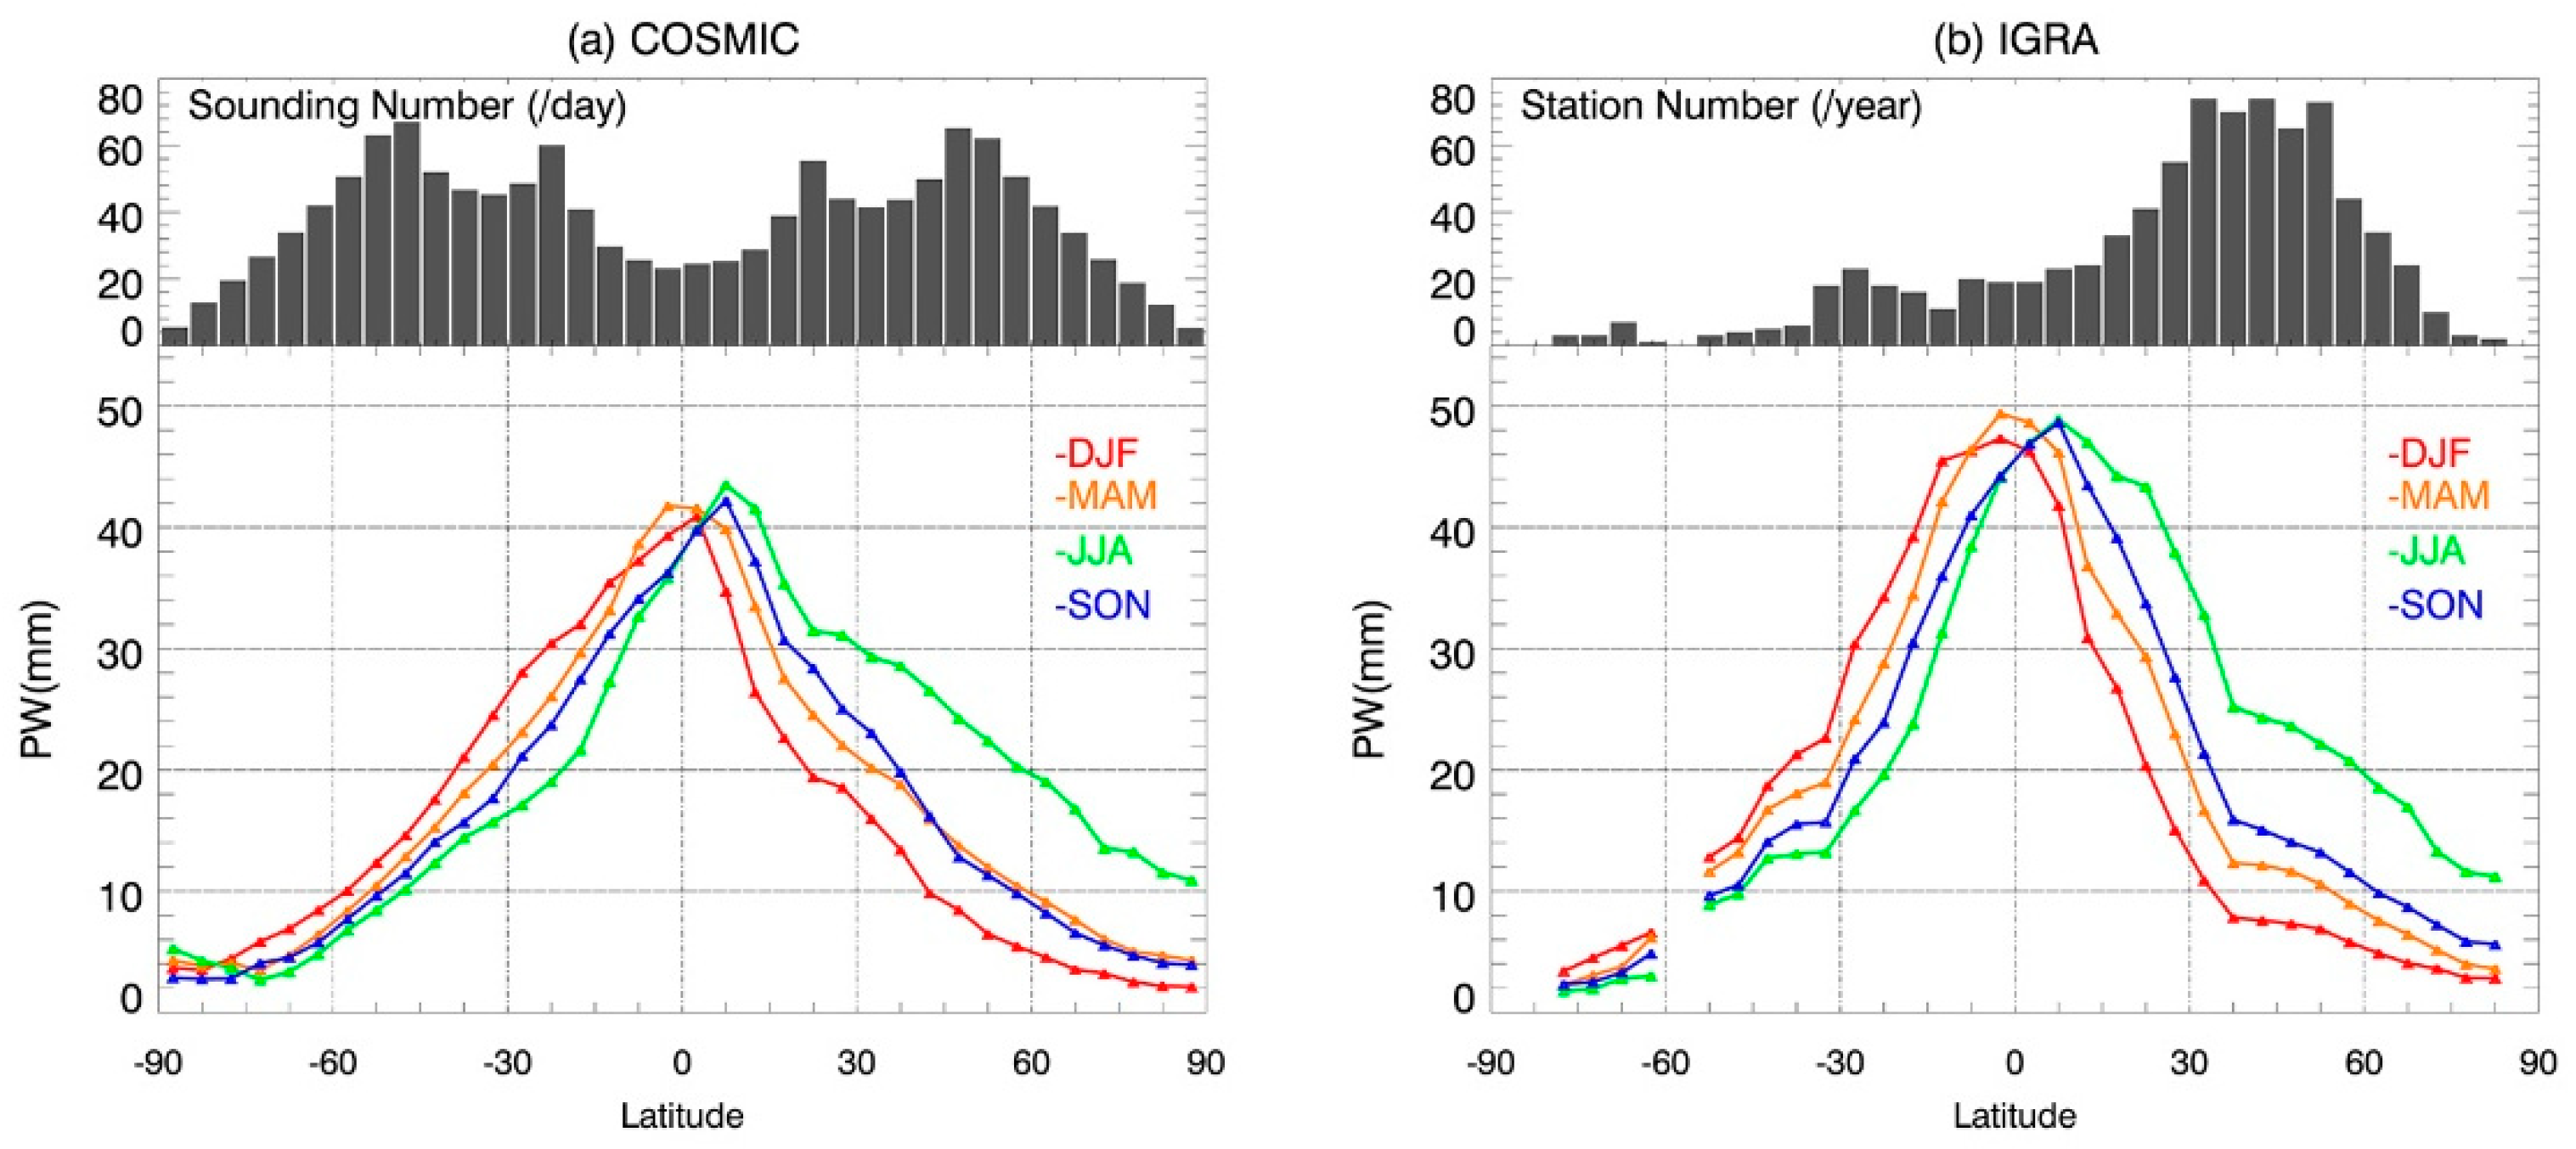
In order to investigate the detailed latitudinal variability of PW, zonal mean values are obtained in latitudinal bins. The numbers of soundings (COSMIC) and stations (IGRA) in each latitude bin are presented in Figure 5. Note the sparse radiosonde station distribution in the southern hemisphere, which brings a larger uncertainty to the radiosonde results in this region (Figure 5b). In general, the patterns of the latitudinal variation of two observational datasets are quite similar. These patterns are also consistent with the global precipitation variation decreasing from the tropics to two poles reported by Luo et al. [28]. In the Southern Hemisphere, PWs are very similar in different seasons; while in the Northern Hemisphere, PWs in four seasons show larger differences in magnitude. For example, PW in the Northern Hemisphere summer is obviously larger than in the other three seasons, especially for the region with latitudes larger than 30° N. It is consistent that larger PW values occur in the summer of the Northern Hemisphere, as mentioned in Figure 4.
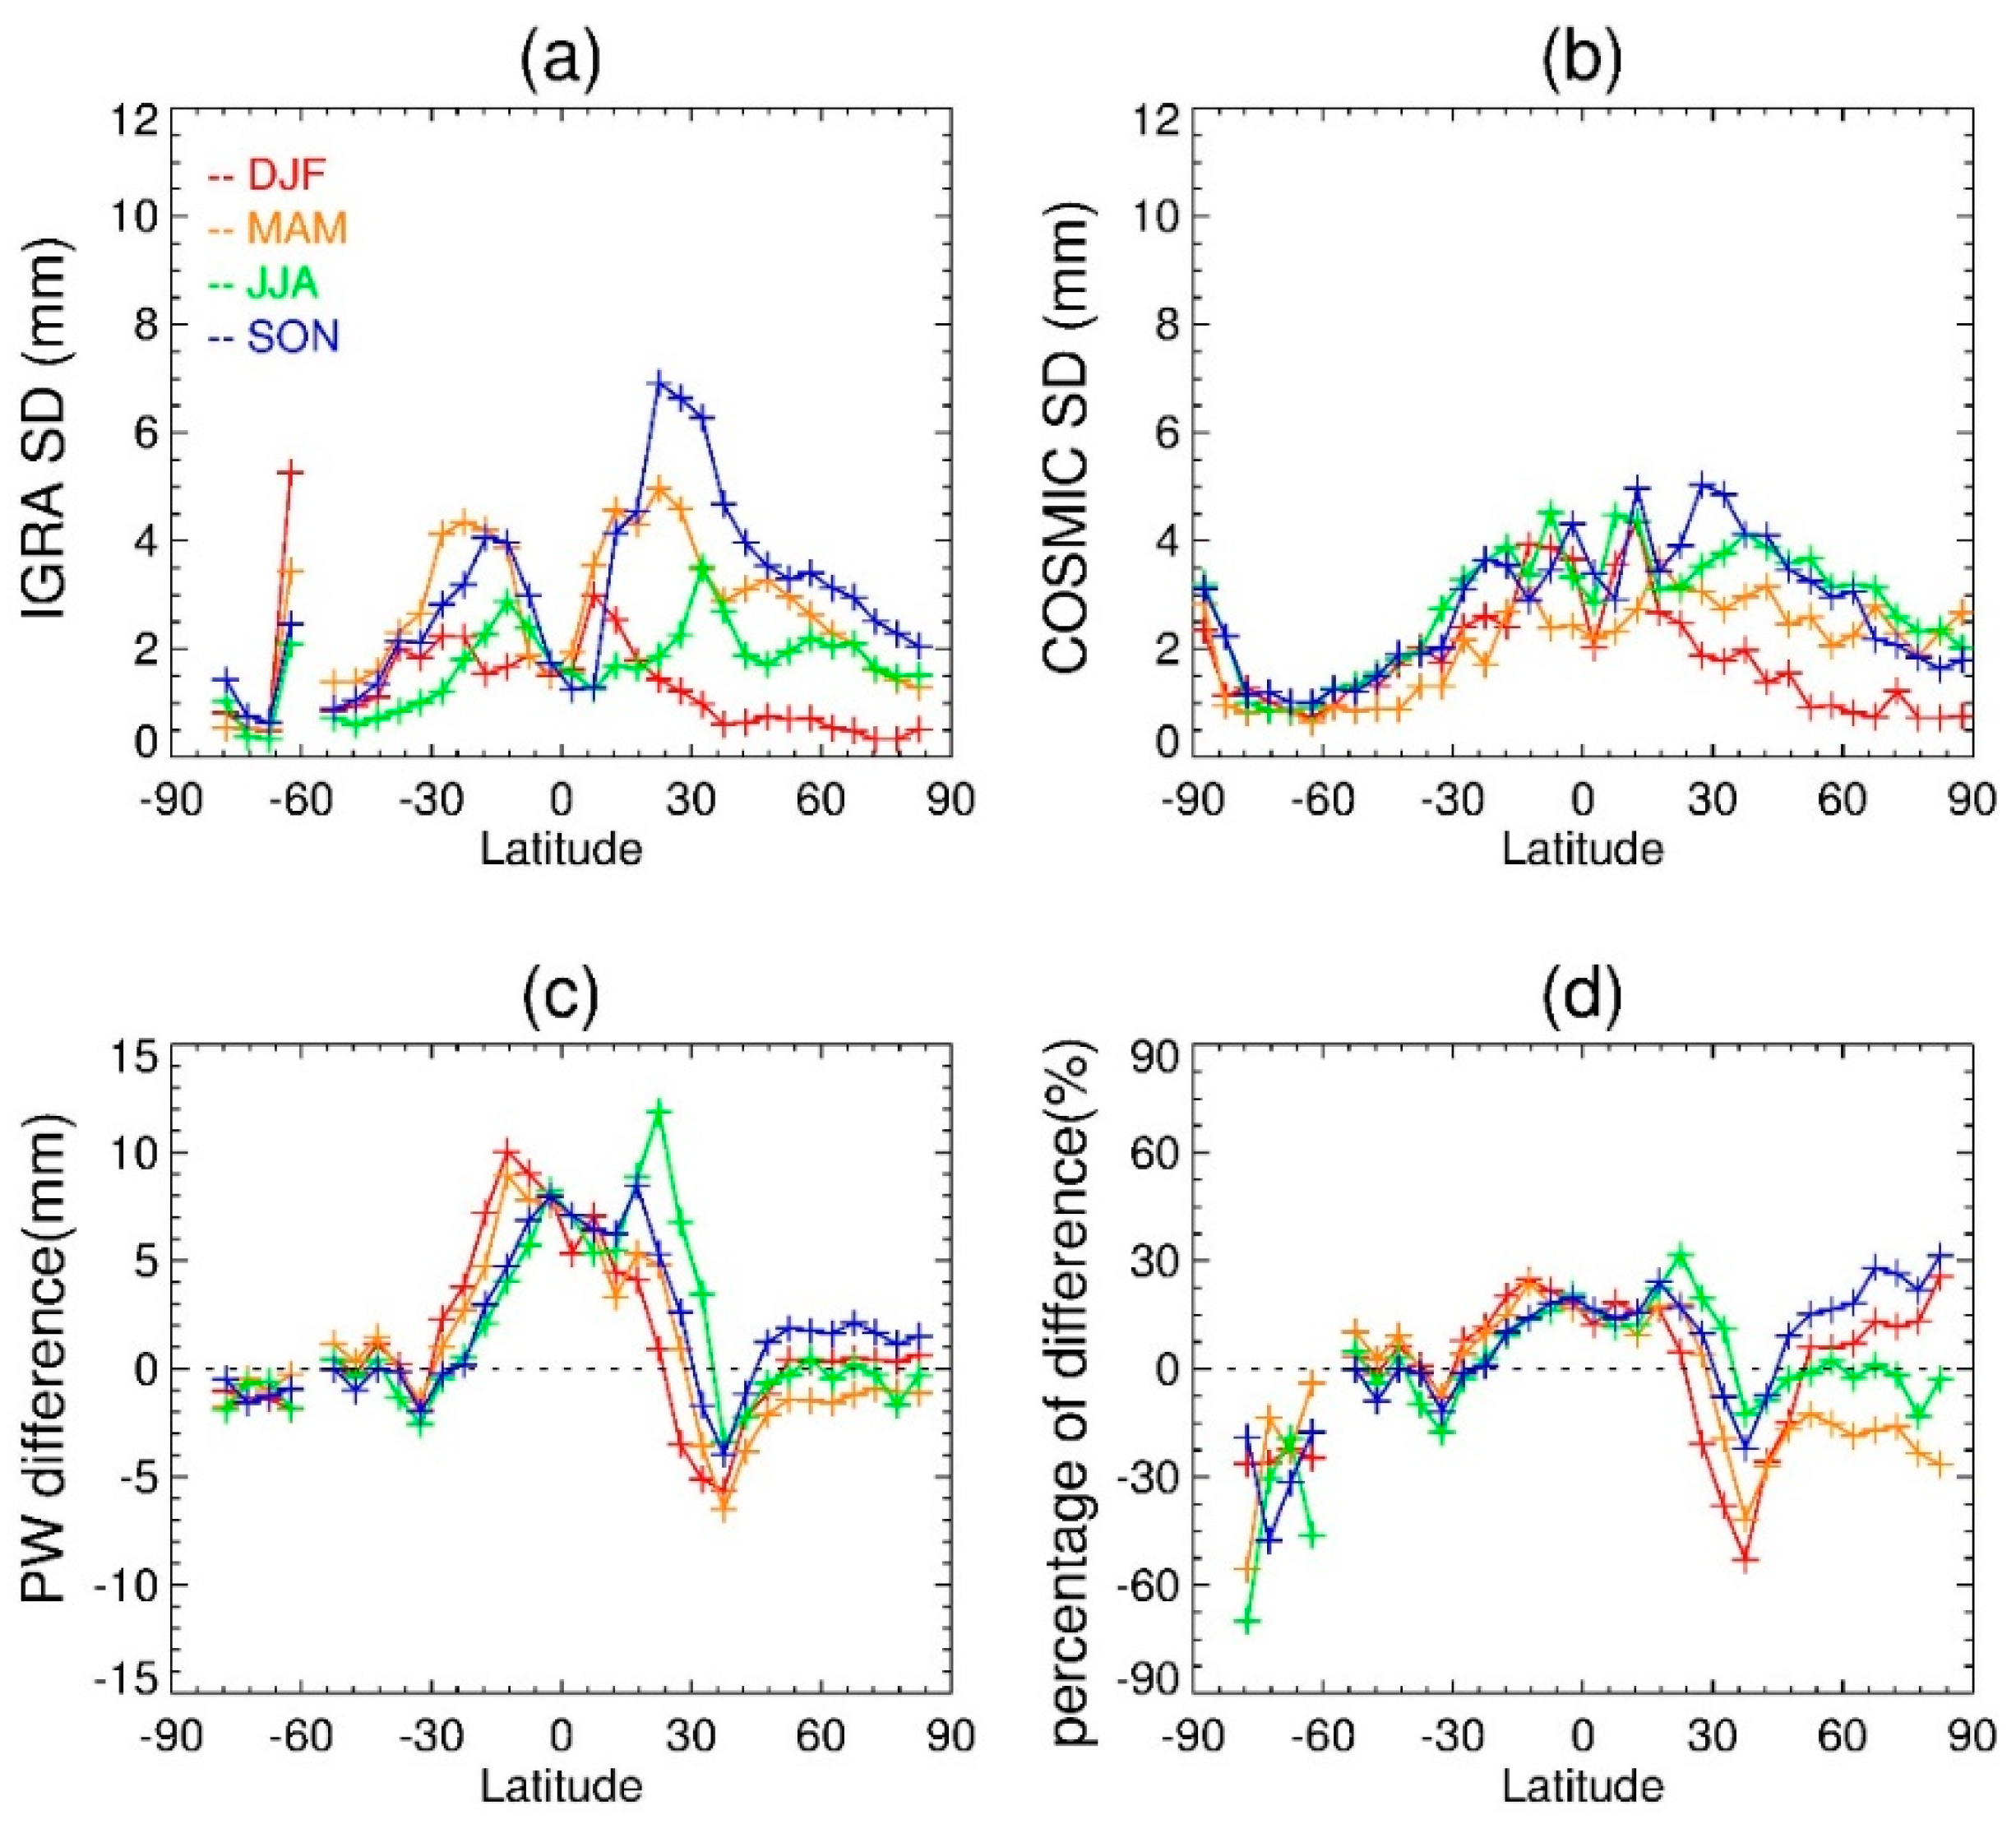
To quantify the differences between two observations, the PW differences of two observations in latitudinal variations are analyzed, along with the standard deviations of latitudinal seasonal results (Figure 6). Regarding the standard deviations of two datasets, they are generally larger in the Northern Hemisphere. The larger standard deviations for the IGRA PWs may result from the inhomogeneous stations’ distribution. The differences range from −6 mm to 12 mm and vary in latitude (Figure 6c). The distinct differences occur in the tropical area and they are generally more than 5 mm. The differences decrease linearly from the tropical region to the mid-latitudes. Overall, IGRA PW is larger than COSMIC PW. There are two exceptions. One is the high latitudes in the Southern Hemisphere, with a COSMIC PW 1 mm larger. The other one is the region around 30° N in the Northern Hemisphere: the COSMIC PWs are about 5 mm larger than the ones derived from radiosonde.
In addition, the different variations also show apparent seasonal features. For the 30° S to 30° N region, except for the equator region, differences in summer are usually greater than the ones in winter. No seasonal variations are found around the equator region. The seasonal differences are close there. Regarding the middle and high latitudes in the Southern Hemisphere, the differences do not show any seasonal variability either, and the values are around 0. On the other hand, for the middle and high latitudes in the Northern Hemisphere, the seasonal differences show a different pattern. The largest differences occur in autumn and spring, while differences in summer and winter are both close to 0. The IGRA PW is about 2 mm greater than the COSMIC PW in autumn, while it is the opposite situation for the spring. The PWs derived from COSMIC in autumn and spring are similar from about 40° N to 90° N (Figure 5a). However, the IGRA PWs in autumn are generally greater than the ones in spring in this region (Figure 5b), which may result in the different patterns in the seasonal differences (Figure 6c).
In Figure 6d, the percentage of PW differences of IGRA and COSMIC shows that large differences in magnitude do not equal large differences in percentage. Even though the differences in polar regions between two observations are small (Figure 6c), the corresponding percentages of differences are relatively larger than the ones in the tropical region. For the regions from 60° S to 30° N, the differences in percentages are within 20%, with little seasonal variations. There are two latitudinal bins with percentages larger than 50%. One is the difference in winter and autumn over the Antarctic. For this region, the observation itself may have large uncertainties. The other one is the difference in winter in the region of about 35° N. As mentioned above, there is a consistent low PW region in all seasons in the southwest of China, which is around the 35° N latitude bin. The change points in four seasons in Figure 5b may be related to this consistent low PW region, which results in the larger percentages in the differences between two data sets.
3.3. Trends in PW
Since the surface temperature has changed globally in recent decades, it is reasonable to ask whether PW has also changed in the past decades. Some earlier studies have reported PWs to have some significant changes regionally [1,6,7,8,9,13,16]. We will pay more attention to the changes in global PWs, especially for the most recent decade.
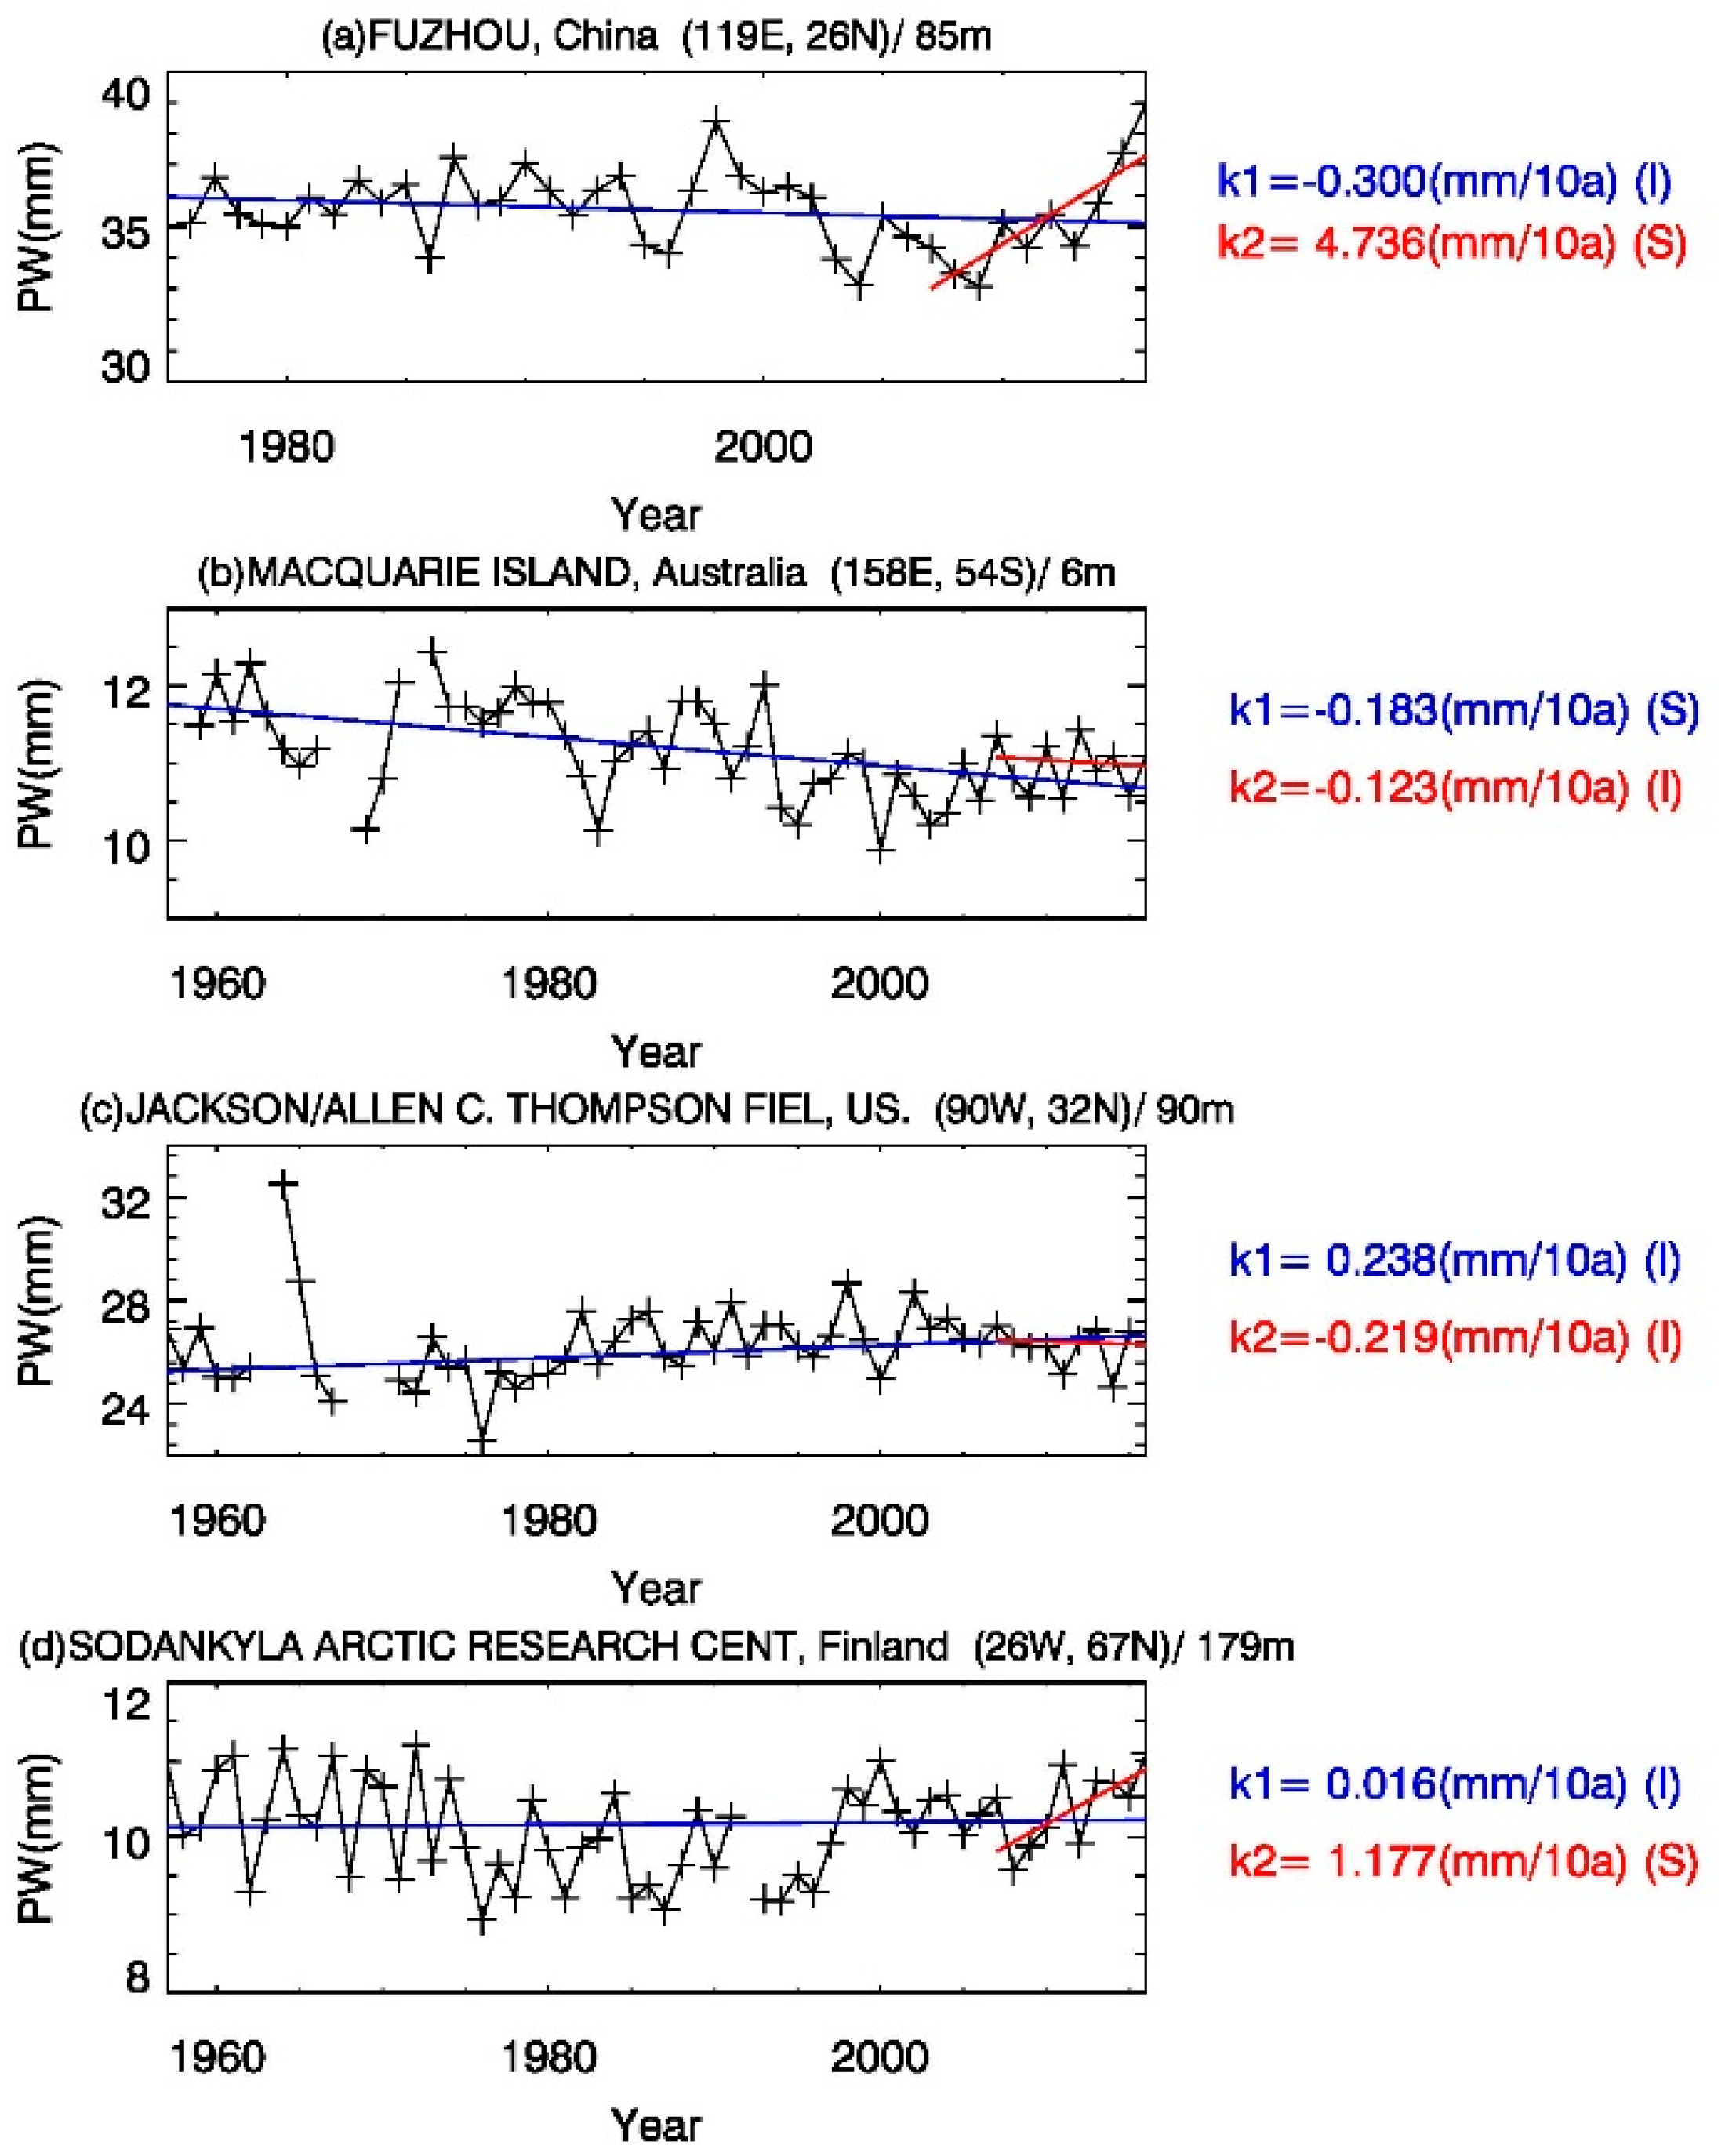
We firstly choose four stations from different countries (locations shown as blue triangles in Figure 1) to investigate their PW trends in the last 60 years and in the most recent 10 years (Figure 7). Different changes are found in the long-term periods and in the recent decade. For example, PWs at the station Fuzhou China (Figure 7a) present an insignificant decreasing for the past several decades. However, it exhibits a statistically significant increasing trend in the past 10 years. The opposite situation is found at station Jackson/Allen C. Thompson Fiel, US, although both trends are not statistically significant. PWs in Australia show a consistent decrease in both periods, while PWs at the Finland station have not changed much in the long trend, but experienced a significant increasing trend in the most recent decade.
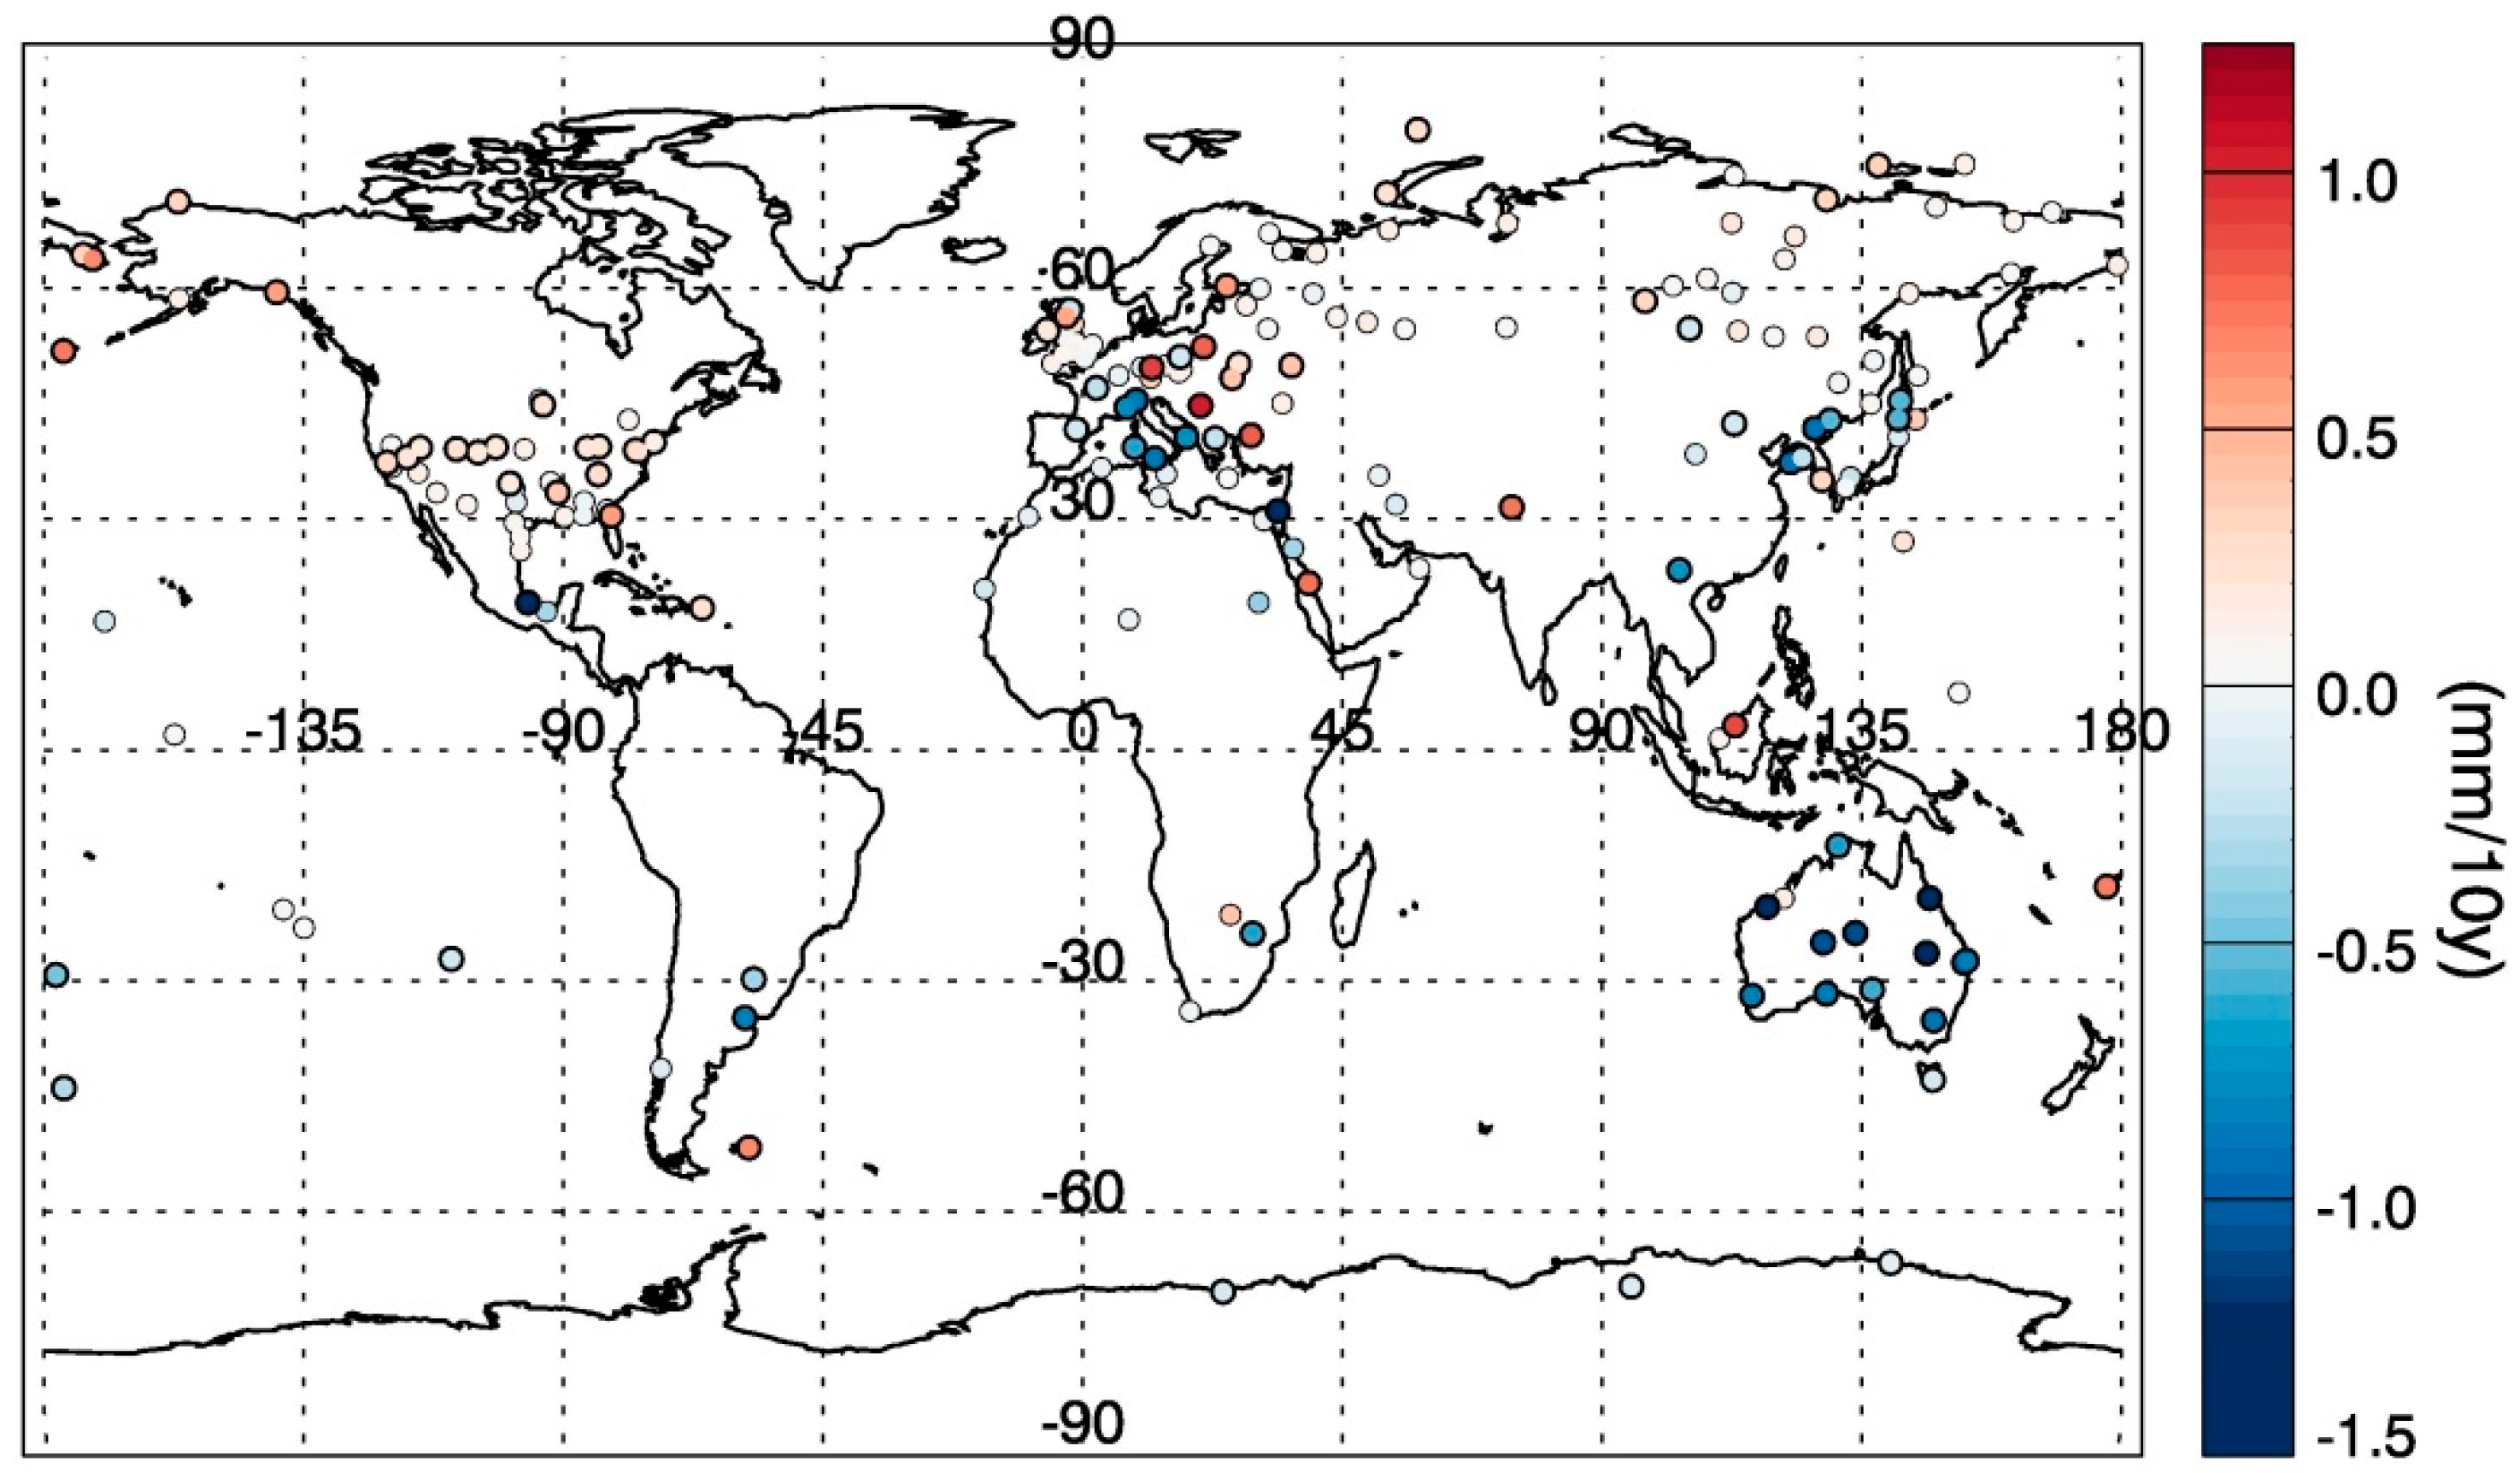
Since there are more than 60-year measurements from IGRA radiosonde observations, long-term changes in global PWs can be obtained. Stations with 60 complete years of PW observations are plotted and stations with significant trends are marked with bold black circles in Figure 8. It can be found that most significant trends occur at those stations of the United States (US), Europe and Australia. PWs at all Australian stations present statistically significant decreasing trends in the last 60 years, while PWs at most stations in the US have increasing trends. Ross and Elliott [6,7] and Durre et al. [8] both reported the increasing trends of PW in the US region during 1973–2006, which is consistent with our results.
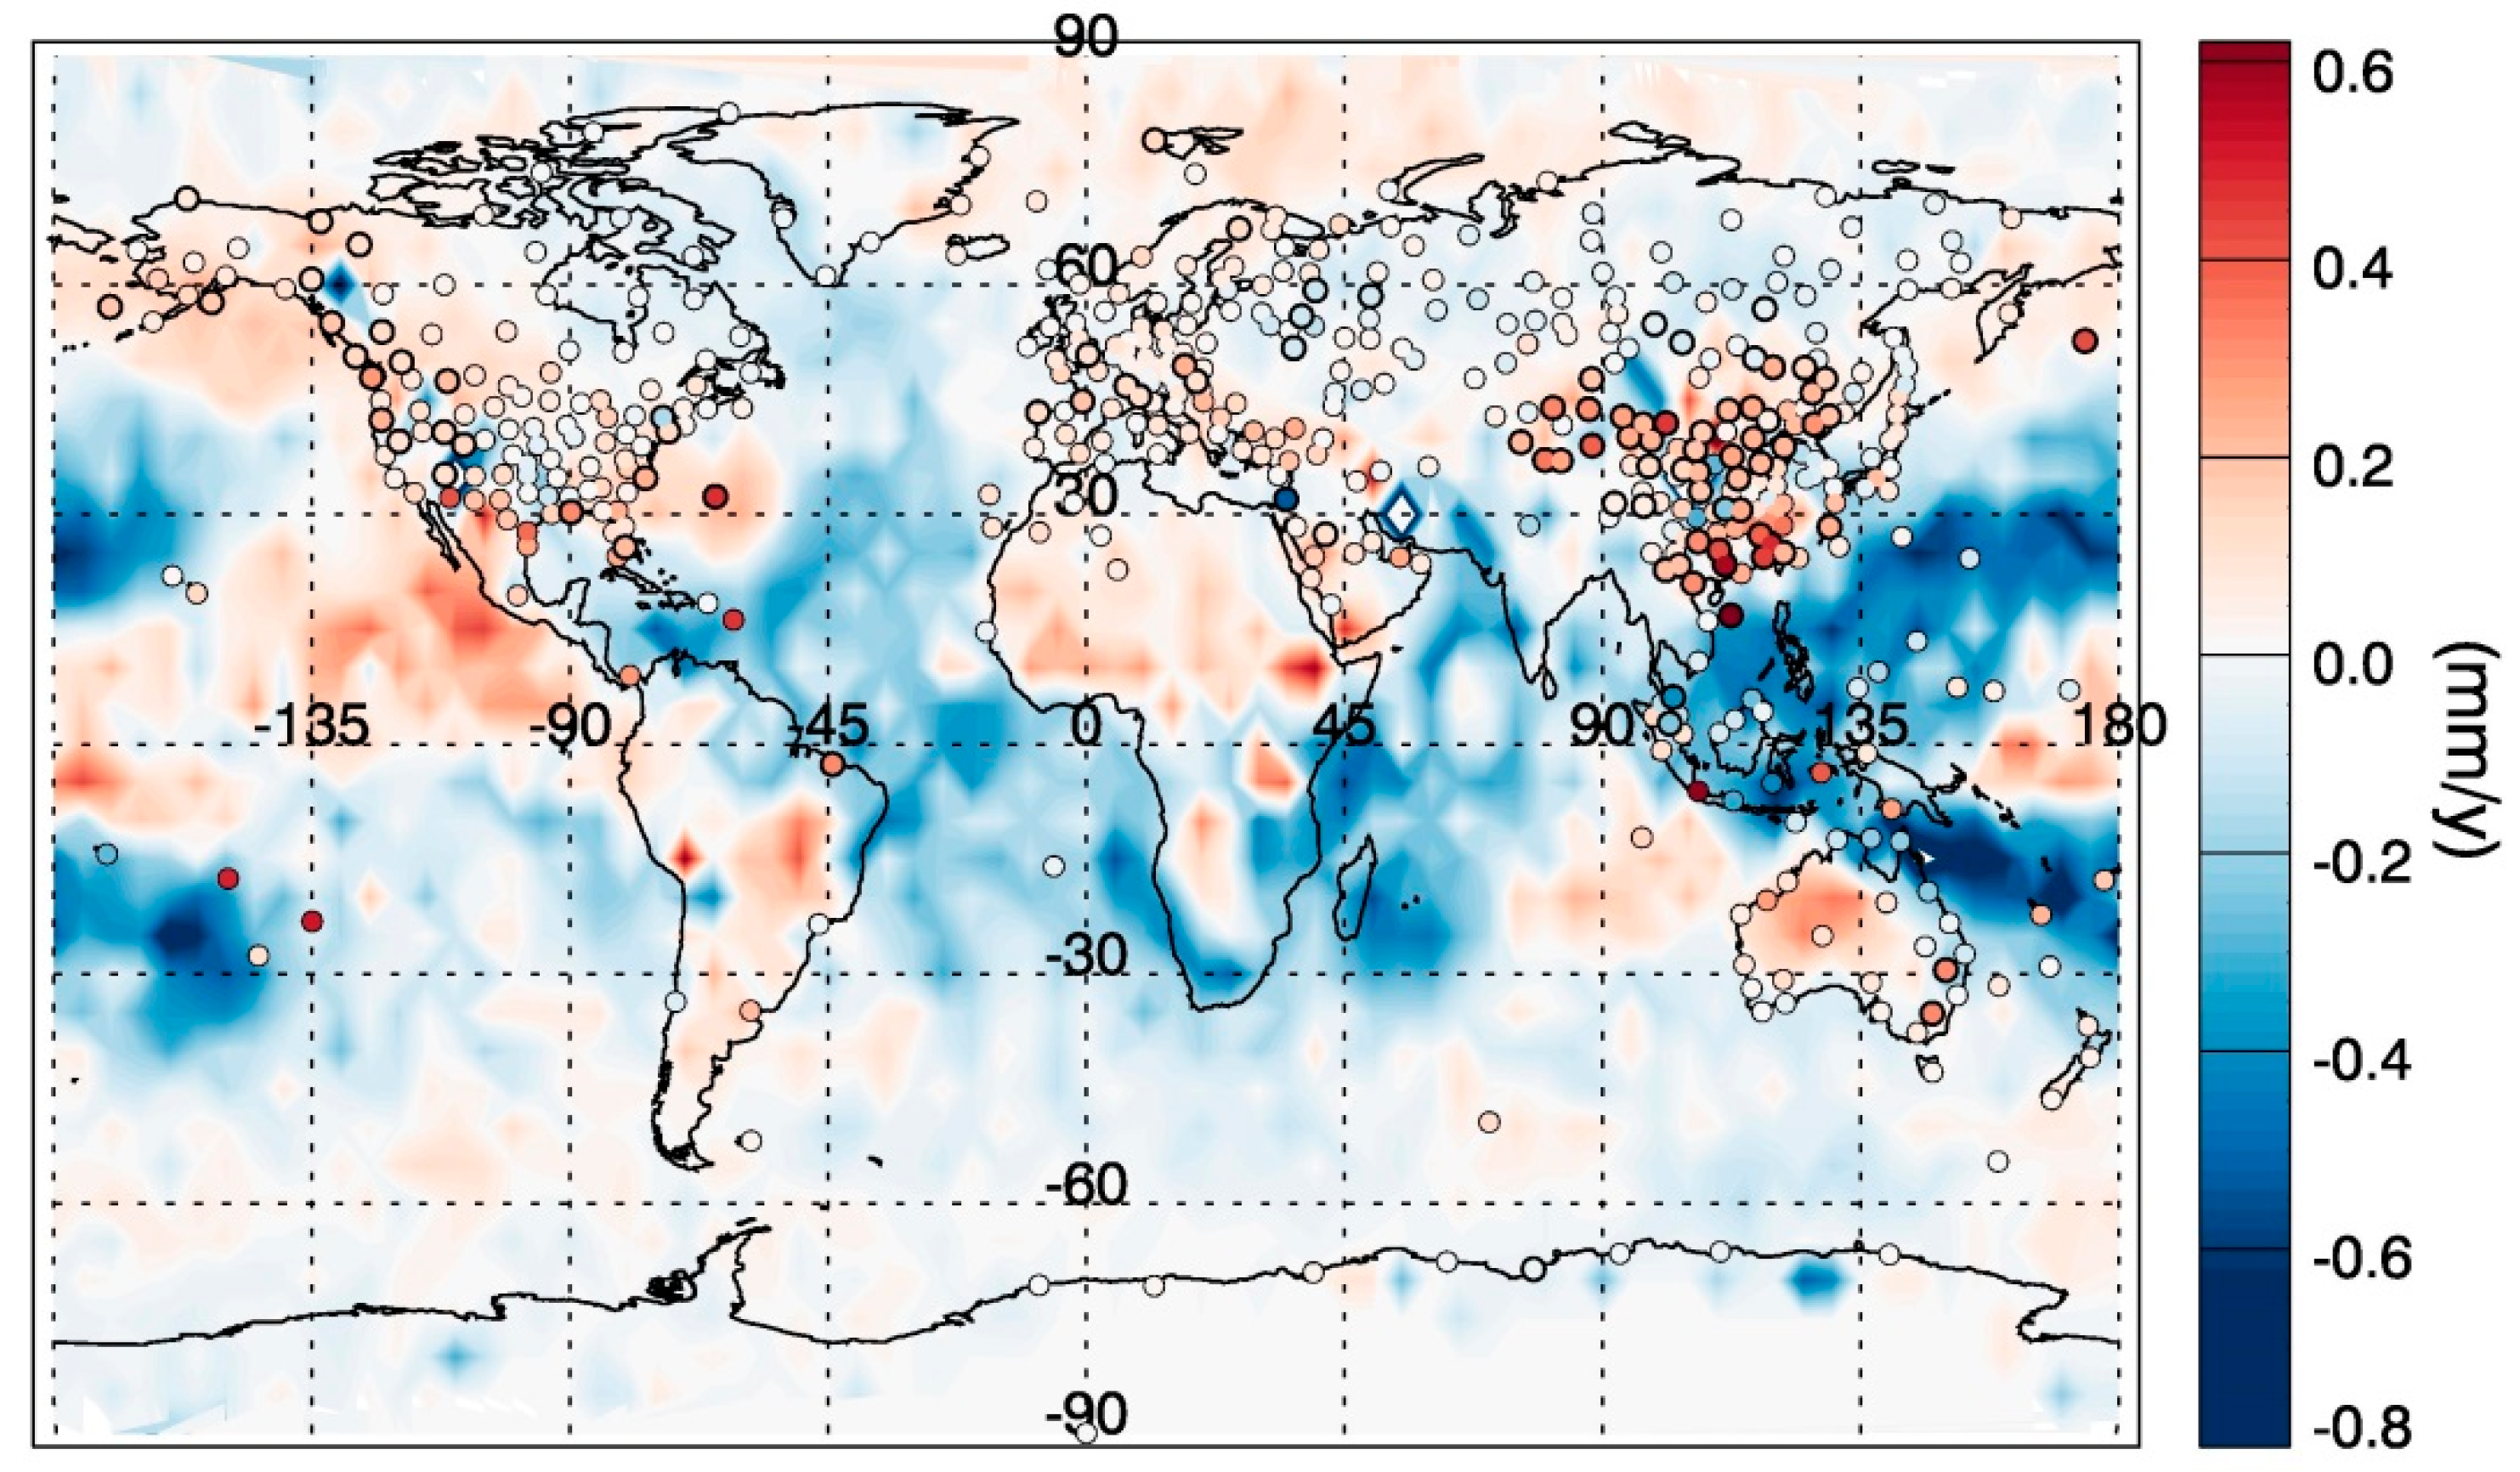
Besides the long-term trend in PW, we are more focused on PW changes in the recent 10 years. Since COSMIC observations perform quite well in comparison with radiosonde data and, more importantly, are covered globally and evenly, they can complement the limitation of IGRA observations. Based on COSMIC and radiosonde observations from 2007–2016, Figure 9 presents the global changes in PW during the most recent decade. It shows an overall similar trend pattern in PW. For most ocean regions, PW has been decreasing in the last 10 years, especially in the tropical area. Except for the Antarctic and inland of the Eurasian continent lands, most land areas show a statistically significant increasing trend in PW. In addition, for North America and European region, PWs have been increasing for the last 10 years and also for last 60 years. On the other side, in Australia, Eastern Asia, and Mediterranean region, PW has been decreasing for last 60 years, but with increasing trend in the recent decade. Due to the lack of data accumulations, most Asian stations are not suitable for long-term trend analysis but show statistically significant increasing trends in the last decade.
Wang et al. [23] analyzed the global PWs from 1988 to 2011 and found widespread positive trends of PW all over the world, including lands and oceans. However, according to Figure 9, for the most recent 10 years, PWs have shown uptrends over land and downtrends over oceans, which means the widespread increase of water vapor in the troposphere over land. This rise of tropospheric water vapor might result in the increase of intensity and frequency of precipitation over land [29,30]. Zhai and Eskridge studied the relationship between PW and precipitation over China using the radiosonde observations from 1970 to 1990, and a positive correlation between these two variables is revealed [16]. However, in recent research, more complicated relationships were reported between PW and precipitation. Wang et al. studied the variations in PWs and precipitation in mainland China during 1995–2012 and found that the regional trends in PW are not always consistent with the regional trends in precipitation [1]. These imply that not all changes in precipitation can be explained by the changes in PW. The variation of PW might affect the global precipitation as PW is one of the sources of precipitation. But earlier researches on the relationships between precipitation and PW all show complicated associations of these two and the results vary from region to region. The global relationship of PW and precipitation needs to be further investigated in the future.
4. Conclusions
The variability and trends in global PWs derived from COSMIC GPS RO retrievals and IGRA radiosonde observations during 2007–2016 are studied in this paper. Generally, PW shows apparent latitudinal and seasonal variations. The averaged PW peaks in the tropical region, with the value of 40 mm or higher, and then decreases apparently to the polar region, less than 10 mm. PWs are larger in warm seasons and smaller in cold seasons for both hemispheres. The variations in PW indicate atmospheric water vapor is closely related to the source of water vapor (oceans and seas) and heat (surface temperature). However, the contributions of these two aspects to water vapor in the upper atmosphere are still not very clear, which makes PW variabilities complicated.
The two observations agree quite well with PW variations, but with some differences in magnitude. Generally, IGRA PW is larger than COSMIC PW. In the tropical area, the IGRA PW is at least 5 mm larger than the ones derived from COSMIC. However, for the high latitudes in the Southern Hemisphere, COSMIC PWs are 1 mm larger. Moreover, around 30° N in the Northern Hemisphere, the COSMIC PWs are about 5 mm larger than the ones derived from radiosonde. The differences in two observations may result from the samplings of COSMIC RO profiles and the IGRA stations and the calculations of two observations. The averaged latitudinal PWs from COSMIC contain the information of both ocean and land. On the other hand, the averaged IGRA PWs are mainly the results from land. Regarding the calculations, the radiosonde measurements detect the real atmospheric humidity, while the COSMIC PW is retrieved from the refractivity profiles. It is noteworthy that these may both bring some uncertainties to the results.
The global PWs have been changing in the past 60 years and, to some extent, strongly in recent 10 years. Based on the analysis of the long-term accumulation of radiosonde observations, it is found that PWs at Australian stations present statistically significant decreasing trends in the last 60 years, while PWs at most stations in the US have increasing trends, which is consistent with previous studies. In light of the good performance of the comparisons between two observational data sets, COSMIC data can be a complement to the radiosonde observations due to world-wide measurements. We pay close attention to the global PW changes in the most recent decade. It is found that PWs show uptrends over land and downtrends over oceans in the last 10 years, implying the widespread increase of water vapor in the troposphere over land. The long-term increasing trends in PW for the US region are assumed to be consistent with the increases in temperature [8]. In addition, the variations in some of the regional PW time series indicate that the known modes of variability such as NAO [18] and ENSO [19] may also explain a portion of PW variability. However, these are the previously published results on some local regions. More investigation about the variability in global PW is needed.
Author Contributions
Y.Z. and J.X. conceived the idea, analyzed the data and wrote the paper; N.Y. and P.L. discussed the results and contribute helpful interpretation.
Acknowledgments
This work was jointly supported by Jiangsu Provincial Research Foundation for Basic Research (BK20161531) and Meteorological Research Open Foundation of Huaihe Basin (HRM201604). We are grateful to the COSMIC Data Analysis and Archive Center (CDAAC) and the National Climatic Data Center (NCDC) for providing observation data.
Conflicts of Interest
The authors declare no conflict of interest.
References
- Wang, R.; Fu, Y.; Xian, T.; Chen, F.; Yuan, R.; Li, R.; Liu, G. Evaluation of Atmospheric Precipitable Water Characteristics and Trends in Mainland China from 1995 to 2012. J. Clim. 2017, 30, 8673–8688. [Google Scholar] [CrossRef]
- Ho, S.; Zhou, X.; Kuo, Y.; Hunt, D.; Wang, J. Global evaluation of radiosonde water vapor systematic biases using GPS radio occultation from COSMIC and ECMWF analysis. Remote Sens. 2010, 2, 1320–1330. [Google Scholar] [CrossRef]
- Durre, I.; Vose, R.; Wuertz, D. Overview of the Integrated Global Radiosonde Archive. J. Clim. 2006, 19, 53–68. [Google Scholar] [CrossRef]
- Retain, C. Surface dew point and water vapor aloft. J. Appl. Meteor. 1963, 2, 776–779. [Google Scholar] [CrossRef]
- Sinha, S.; Sinha, S.K. Precipitable water and dew point temperature relationship during the India summer monsoon. Pure Appl. Geophys. 1981, 119, 913–921. [Google Scholar] [CrossRef]
- Ross, R.; Elliott, W. Tropospheric Water Vapor Climatology and Trends over North America: 1973–1993. J. Clim. 1996, 9, 3561–3573. [Google Scholar] [CrossRef]
- Ross, R.; Elliott, W. Radiosonde-based northern hemisphere tropospheric water vapor trends. J. Clim. 2000, 14, 1602–1612. [Google Scholar] [CrossRef]
- Durre, I.; Williams, C., Jr.; Yin, X.; Vose, R. Radiosonde-based trends in precipitation water vapor over the northern hemisphere: An update. J. Geophys. Res. 2009, 114, D05112. [Google Scholar] [CrossRef]
- Huang, C.; Teng, W.; Ho, S.; Kuo, Y. Global variation of COSMIC precipitable water over land: Comparisons with ground-based GPS measurements and NCEP reanalyses. Geophys. Res. Lett. 2013, 40, 5327–5331. [Google Scholar] [CrossRef]
- Wick, G.; Kuo, Y.; Ralph, F.; Wee, T.; Neiman, P. Intercomparison of integrated water vapor retrievals from SSM/I and COSMIC. Geophys. Res. Lett. 2008, 35, L21805. [Google Scholar] [CrossRef]
- Xu, G.; Yue, X.; Zhang, W.; Wan, X. Assessment of Atmospheric Wet Profiles Obtained from COSMIC Radio Occultation Observations over China. Atmosphere 2017, 8, 208. [Google Scholar] [CrossRef]
- Xie, F.; Wu, D.; Ao, C.; Kursinski, E.; Mannucci, A.; Syndergaard, S. Super-refraction effects on GPS radio occultation refractivity in marine boundary layers. Geophys. Res. Lett. 2010, 37, L11805. [Google Scholar] [CrossRef]
- Hierro, R.; Llamedo, P.; Torre, A.; Alexander, P.; Rolla, A. Climatological patterns over South America derived from COSMIC radio occultation data. J. Geophys. Res. 2012, 117, D03116. [Google Scholar] [CrossRef]
- Chou, M.; Weng, C.; Lin, P. Analyses of FORMOSAT-3/COSMIC humidity retrievals and comparisons with AIRS retrievals and NCEP/NCAR reanalyses. J. Geophys. Res. 2009, 114, D00G03. [Google Scholar] [CrossRef]
- Ho, S.; Peng, L.; Mears, C.; Anthes, R. Comparison of global observations and trends of total precipitable water derived from microwave radiometers and COSMIC radio occultation from 2006 to 2013. Atmos. Chem. Phys. 2018, 18, 259–274. [Google Scholar] [CrossRef]
- Zhai, P.; Eskridge, R. Atmospheric Water Vapor over China. J. Clim. 1997, 10, 2643–2652. [Google Scholar] [CrossRef]
- Barman, P.; Jade, S.; Kumar, A.; Jamir, W. Interannual, spatial, seasonal, and diurnal variability of precipitable water vapor over northeast India using GPS time series. Int. J. Remote Sens. 2017, 38, 391–411. [Google Scholar] [CrossRef]
- Gurbuz, G.; Jin, S. Long-time variations of precipitable water vapour estimated from GPS, MODIS and radiosonde observations in Turkey. Int. J. Climatol. 2017. [Google Scholar] [CrossRef]
- Teng, W.; Huang, C.; Ho, S.; Kuo, Y.; Zhou, X. Characteristics of global precipitable water in ENSO events revealed by COSMIC measurements. J. Geophys. Res. 2013, 118, 8411–8425. [Google Scholar] [CrossRef]
- Durre, I.; Yin, X. Enhanced radiosonde data for studies of vertical structure. Bull. Am. Meteor. Soc. 2008, 89, 1257–1262. [Google Scholar] [CrossRef]
- Kursinski, R.; Haij, G.; Leroy, S.; Herman, B. The GPS radio occultation technique. Terr. Atmos. Ocean. 2000, 11, 53–114. [Google Scholar] [CrossRef]
- Ho, S.; Kuo, Y.; Sokolovskiy, S. Improvement of the temperature and moisture retrievals in the lower troposphere using AIRS and GPS radio occultation measurements. J. Atmos. Ocean. Technol. 2007, 24, 1726–1739. [Google Scholar] [CrossRef]
- Wang, J.; Zhang, L. Systematic errors in global radiosonde precipitable water data from comparisons with ground-based GPS measurements. J. Clim. 2008, 21, 2218–2238. [Google Scholar] [CrossRef]
- Lanzante, J. Resistant, robust and non-parametric techniques for the analysis of climate data: Theory and examples including applications to historical radiosonde station data. Int. J. Climatol. 1996, 16, 1197–1226. [Google Scholar] [CrossRef]
- Good, S.; Guan, K.; Caylor, K. Global patterns of the contributions of storm frequency, intensity, and seasonality to interannual variability of precipitation. J. Clim. 2016, 29, 3–15. [Google Scholar] [CrossRef]
- Kuo, Y.; Neelin, J.; Mechoso, R. Tropical Convective Transition Statistics and Causality in the Water Vapor–Precipitation Relation. J. Atmos. Sci. 2017, 74, 915–931. [Google Scholar] [CrossRef]
- Hollway, C.; Neelin, J. Temporal Relations of Column Water Vapor and Tropical Precipitation. J. Atmos. Sci. 2010, 67, 1091–1105. [Google Scholar] [CrossRef]
- Luo, J.; Chen, Z.; Yi, L. Analysis of the global water vapor distribution with COSMIC radio occultation observation. In China Satellite Navigation Conference 2013 Proceedings; Lecture Notes in Electrical Engineering 224; Springer: Berlin/Heidelberg, Germany, 2013. [Google Scholar]
- Ben, N.; Schmidli, J.; Schär, C. Heavy precipitation in a changing climate: Does short-term summer precipitation increase faster? Geophys. Res. Lett. 2014, 42, 1165–1172. [Google Scholar] [CrossRef]
- Donat, M.; Lowry, A.; Alexander, L.; O’Gorman, P.; Maher, N. More extreme precipitation in the world’s dry and wet regions. Nat. Clim. Chang. 2016, 6, 508–513. [Google Scholar] [CrossRef]
Figure 1.
Distribution of selected stations ((a–h) are the stations selected in Figure 2; blue triangles are stations selected for trend analysis).
Figure 1.
Distribution of selected stations ((a–h) are the stations selected in Figure 2; blue triangles are stations selected for trend analysis).

Figure 2.
Variations of monthly mean precipitable water (PW) of selected stations (a–h) retrieved from Constellation Observing System for Meteorology, Ionosphere, and Climate (COSMIC) and Integrated Global Radiosonde Data (IGRA) observations for the period of 2007–2016.
Figure 2.
Variations of monthly mean precipitable water (PW) of selected stations (a–h) retrieved from Constellation Observing System for Meteorology, Ionosphere, and Climate (COSMIC) and Integrated Global Radiosonde Data (IGRA) observations for the period of 2007–2016.

Figure 3.
Scatterplot of latitudinal monthly mean COSMIC and IGRA PW.

Figure 4.
Global maps of mean seasonal PW from IGRA radiosonde observations (colored dots) and from COSMIC observations in the last 10 years.
Figure 4.
Global maps of mean seasonal PW from IGRA radiosonde observations (colored dots) and from COSMIC observations in the last 10 years.

Figure 5.
Latitudinal variation of seasonal mean PW derived from two observations (a: COSMIC; b: IGRA).
Figure 5.
Latitudinal variation of seasonal mean PW derived from two observations (a: COSMIC; b: IGRA).

Figure 6.
(a) One standard deviation of the seasonal PW in latitudes of IGRA data; (b) one standard deviation of the seasonal PW in latitudes of COSMIC data; (c) latitudinal variation of differences between IGRA and COSMIC (difference = IGRA PW − COSMIC PW); (d) latitudinal variation of percentage of PW differences between IGRA and COSMIC (percentage = difference/(IGRA PW + COSMIC PW)/2).

Figure 7.
Trends in PW at four stations: (a) Fuzhou, China; (b) Macquarie Island, Australia; (c) Jackson/Allen C. Thompson Fiel, US and (d) Sodankyla Arctic Research Cent, Finland. Blue linear lines represent trends during 1957–2016 and red linear lines represent trends for last decade (2007–2016). k1 and k2 represent the slopes of the linear lines. S represents trend significant at the 95% confidence level or greater; I denote the insignificant trend.

Figure 8.
Long-term trends in PW from radiosonde observations for the period of 1957–2016 (stations with bold black circles are stations with significant trends).
Figure 8.
Long-term trends in PW from radiosonde observations for the period of 1957–2016 (stations with bold black circles are stations with significant trends).

Figure 9.
Trends in PW from IGRA and COSMIC for the period of 2007–2016 (stations with bold black circles are stations with significant trends).
Figure 9.
Trends in PW from IGRA and COSMIC for the period of 2007–2016 (stations with bold black circles are stations with significant trends).

© 2018 by the authors. Licensee MDPI, Basel, Switzerland. This article is an open access article distributed under the terms and conditions of the Creative Commons Attribution (CC BY) license (http://creativecommons.org/licenses/by/4.0/).
Share and Cite
MDPI and ACS Style
Zhang, Y.; Xu, J.; Yang, N.; Lan, P. Variability and Trends in Global Precipitable Water Vapor Retrieved from COSMIC Radio Occultation and Radiosonde Observations. Atmosphere 2018, 9, 174. https://doi.org/10.3390/atmos9050174
AMA Style
Zhang Y, Xu J, Yang N, Lan P. Variability and Trends in Global Precipitable Water Vapor Retrieved from COSMIC Radio Occultation and Radiosonde Observations. Atmosphere. 2018; 9(5):174. https://doi.org/10.3390/atmos9050174
Chicago/Turabian StyleZhang, Yehui, Jiawei Xu, Na Yang, and Ping Lan. 2018. "Variability and Trends in Global Precipitable Water Vapor Retrieved from COSMIC Radio Occultation and Radiosonde Observations" Atmosphere 9, no. 5: 174. https://doi.org/10.3390/atmos9050174
Note that from the first issue of 2016, this journal uses article numbers instead of page numbers. See further details here.