Article

Cloud-Precipitation Parameters and Radiative Forcing of Warm Precipitating Cloud over the Tropical Pacific Ocean Based on TRMM Datasets and Radiative Transfer Model

School of Earth and Space Sciences, University of Science and Technology of China, Hefei 230026, China
*
Author to whom correspondence should be addressed.
Atmosphere 2018, 9(6), 206; https://doi.org/10.3390/atmos9060206
Submission received: 13 March 2018 / Revised: 1 May 2018 / Accepted: 10 May 2018 / Published: 25 May 2018

Abstract

:
An approach is proposed for combining observations from the Precipitation Radar (PR) and the Visible and Infrared Scanner (VIRS) onboard the TRMM (Topical Rainfall Measuring Mission) satellite to investigate the climatology of warm precipitating cloud (WPC) microphysical properties, such as cloud effective radius (Re), cloud optical depth (Tau), and liquid water path (LWP) in the tropical Pacific Ocean (20° S–20° N) from 1998 to 2012. The WPCs are captured by VIRS/PR and categorized into two extreme (light and heavy) rain rate types (EL-WPC, EH-WPC). Their radiative effects are also simulated by the Santa Barbara DISORT Atmospheric Radiative Transfer (SBDART) radiative transfer model. The results indicate that total, EL-WPC and EH-WPC reach their highest occurrence frequencies of 22%, 1.6% and 2.0% in the North-west Pacific, Intertropical Convergence Zone (ITCZ) and South Pacific Convergence Zone (SPCZ), respectively. Most of the EL-WPC has higher ratio to total WPC in the Pacific warm pool with warmer sea-surface temperature (SST), while the higher ratio for EH-WPC is located in SPCZ associated with deep convection. WPC has an average Re of 15.6 μm, Tau of 20, and LWP of 200 g m−2. EL-WPC is a little larger average Re than EH-WPC, and larger Re is distributed with higher echo top height (H). Moreover, for EH-WPC, the increased Re by the collision-coalescence process in lower H (<3.5 km) generates a stronger rain rate. In addition, although the H of EH-WPC decreases along the increased brightness temperature at 10.8 μm (BT4), this is not obvious in EL-WPC possibly due to a certain echo height to generate a light precipitation. With an increased rain rate of WPC, Re becomes larger in EL-WPC and smaller in EH-WPC. EL-WPC induces a cooling of approximately −0.5 W m−2 for radiative forcing, which is −3.0 W m−2 less than the EH-WPC.

1. Introduction

Warm precipitating cloud (WPC) refers to the cloud producing rain with cloud top temperature above 273 K. It constitutes an important component of cloud systems that contribute appreciable amounts to total precipitation in the tropics [1,2,3,4,5]. Because of its high albedo in contrast to that of the ocean surface, warm cloud also has a significant influence on regulating the radiative balance, which is a strong forcing of the climate, especially in the troposphere [6,7,8,9]. This prevalent marine cloud can increase the uncertainty in climate model simulations, because a full understanding of its cloud parameters and radiative forcing characteristics is currently lacking [10,11,12]. Shipborne or ground-based observations provide only a limited detection capability with regard to oceanic WPC [13]. Nonetheless, we do have an alternative, in the form of satellite remote-sensing techniques, which provide a great opportunity for us to obtain an extensive view of the characteristics of WPC [14].
Based on single or multi-satellite observations, many previous works of research have revealed detailed geographic distributions of warm precipitation [1,2,4,15,16,17,18]. Liu et al. [15] used retrieved passive microwave infrared and radiance imager data to analyze warm precipitation in the western Pacific Ocean. They found that 14% of the rainfall was associated with cloud-top infrared brightness temperatures greater than 273 K. In other work, microwave remote-sensing data from the International Satellite Cloud Climatology Project (ISCCP) were combined with a visible and infrared dataset, revealing that the proportion of warm precipitation in total rainfall was about 10–20% [16]. Petty [1] found that 20–40% of the precipitation was associated with warmer infrared temperatures (>273 K) over most of the ocean east of Australia and co-located the satellite infrared observations from Japan’s Geostationary Meteorological Satellite with surface synoptic reports of precipitation. Lau and Wu [4] found that warm precipitation accounted for 72% of the total precipitation area in the tropics. Based on their Tropical Rainfall Measurement Mission (TRMM) precipitation features database, Liu and Zipser [18] indicated that precipitation pixels with a cloud-top temperature above 273 K contributed 20% of the rainfall over the tropical ocean. More than 70% of low-cloud precipitation falls as drizzle for the South-eastern Pacific region of marine stratocumulus, and the average surface rain rate of low-cloud precipitation for this region is ~0.22 mm d−1 [19]. On the basis of the merged dataset of the Precipitation Radar (PR) and the Visible and Infrared Scanner (VIRS) onboard the TRMM, Qin and Fu [5] indicated that most of the WPC was distributed in the Intertropical Convergence Zone (ITCZ) and its flanks with the easterly trade winds; in summer, its frequency was more than 2.2% and its average near-surface rain rate (RR) was 2.4 mm h−1.
During the radiative transfer in cloud, the solar radiative reflection and transmission of cloud are determined by the cloud effective radius (Re) and cloud liquid water path (LWP) of cloud particles [20]. Re, defined as the ratio of the cubic sum to the quadratic sum of different cloud particle radius, is a parameter that evaluates the size of cloud droplets [21]. The cloud optical depth (Tau) is sensitive to Re, LWP and cloud phase. The LWP is generally considered a macrophysical variable, which is controlled by both cloud-scale dynamics and the thermodynamics of the ambient air [22]. Re is influenced by the size distribution of cloud particles and phase, while LWP is determined by the number density and cloud thickness. The Tau is proportional to the cloud LWP and inversely related to the cloud droplet effective radius. In addition, the process of particle growth in WPC also plays a key role in that it affects Earth’s atmospheric hydrological cycle [23,24]. WPC starts with condensation, with the particle size tending to increase with height from the cloud base in the early stage of cloud development [25]. Once particles become large enough (radius > 10 μm), they begin to coalesce. Then, if the particles grow large enough, they fall as drizzle or rain. Cloud parameters, such as the cloud effective radius, optical depth and so on, are the key indicators of this cloud phase and process. Besides, most of the nighttime marine boundary layer clouds in the Azores exceed their daytime counterparts with an annual mean LWP of 140 g m−2, which is ~30.9 g m−2 larger than daytime. The diurnal cycle with maximum LWP occurs at 05:00 and 21:00 LT based on the Atmospheric Radiation Measurement Program (ARM) [26]. Moreover, the low clouds could also reduce the net radiation balance on a globally annually averaged basis by nearly 15 W m−2, and these low clouds of mid-latitude stratus have a very strong impact on the net radiation budget with summer values of cloud forcing lower than −100 Wm−2 [6]. Knowledge of these important properties of WPCs has been enabled by the significant progress in satellite observations in the past several decades.
The ISCCP was established to improve knowledge on the characteristics of cloud at the global scale [27]. It collected the visible infrared channels signals from radiometers onboard on the polar-orbiting satellites and the geostationary constellation. The datasets generated include cloud type, effective radius, optical thickness, and so on. Utilizing these datasets, Rossow et al. [28,29] estimated the global cloud radiative forcing (CRF) effect for different types of cloud on the Earth–atmosphere system. Due to the use of visible infrared bands observation, the ISCCP datasets are not so good for identifying precipitation, although they have helped us to understand the characteristics of global cloud, Besides, using the liquid cloud water threshold (250 g m−2) to identify precipitating clouds is highly arbitrary [30]. Since the ISCCP, several cloud datasets have been compiled from the measurements of a variety of instruments, including the Moderate Resolution Imaging Spectroradiometer (MODIS) [31], the Advanced Very High Resolution Radiometer (AVHRR) [32] and the High-Resolution Infrared Radiation Sounder (HIRS) [33]. Moreover, the vertical structure of cloud is widely obtained from the CloudSat 94-GHz radar [34] and the Cloud–Aerosol Lidar with Orthogonal Polarization (CALIOP) [35]. From joint CloudSat and MODIS observations, Suzuki et al. [36] investigated the microphysical process of warm rain from cloud to precipitation on the global scale. They found that the slope of CloudSat reflectivity changes with MODIS optical depth to provide a gross measure of the collection efficiency factor. However, Liu et al. [37] indicated that warm clouds with a cloud effective radius (Re) below 12 μm or cloud optical depth (Tau) below 4 are very likely to be missed by cloud profiling radar (CPR) as inferred from MODIS and Cloud-Aerosol Lidar with Orthogonal Polarization (CALIOP), resulting in a globally averaged overestimation of 10–24% and 24–36%, respectively.
However, the problem of how to identify precipitating clouds best in these datasets remains unsolved. Therefore, it is necessary to organize visible infrared signal data simultaneously with vertical precipitation information at very high spatial resolution, as an effective approach to obtaining the characteristics of precipitation with cloud parameters, including cloud phases. On the other hand, merged CPR and MODIS data are often used to analyze WPC. These active and passive sensors have a unique ability to observe simultaneously different aspects of the cloud and precipitation system [14,36,38,39]. Importantly, however, both these satellites are part of the A-Train constellation, crossing the equator northbound at about 13:30 local time. Thus, there is little opportunity to evaluate the diurnal variation of WPC. Because the similar cross-track scanning modes of the PR and VIRS generate near instantaneous synchronization when observing the same target, it is feasible to combine the measurements from both these instruments in order to better analyze WPC in detail. Furthermore, TRMM is a sun-asynchronous orbiting satellite, meaning the observations from its instruments can be used to study the diurnal characteristics of precipitation in the tropics and subtropics [40,41,42,43].
To date, as alluded to above, knowledge regarding WPC parameters and their radiative effects is limited due to a lack of spatiotemporally synchronized data on cloud parameters and precipitation. The motivation behind the present study, therefore, is to try to solve these problems by using a spatiotemporally integrated dataset of the pixel-level precipitation profile and its cloud-top visible infrared signals measured by TRMM PR and VIRS, as demonstrated in Section 2. In Section 3, the geographic features of WPC, its cloud parameters, and radiative forcing are discussed. Finally, the study’s key findings are summarized in Section 4.

2. Data and Methods

In our study, the work reported here is mainly based on the merged datasets from TRMM PR and VIRS. As is well-known from previous rainfall studies based on these merged datasets, measurements derived from the PR and VIRS onboard the TRMM satellite provide a unique opportunity to adequately understand the three-dimensional structures of precipitation along with their corresponding spectral characteristics [40,44,45,46]. The TRMM PR 2A25 and VIRS 1B01 version 7 datasets issued by the Goddard Space Flight Center/National Aeronautics and Space Administration (NASA) are used. The similar cross-track scanning modes of VIRS and PR mean there is little lag in detecting the same target, which is convenient for matching the observational results derived from both instruments, i.e., 2A25 and 1B01, to obtain a merged dataset at the PR spatial resolution. The merged data contain the precipitation profile, together with its cloud-top visible infrared signals, at a spatiotemporally synchronized resolution [5,43,47,48].
Based on the merged dataset, the PR radar reflectivity profiles are used to identify precipitating pixels and the echo-top height (H) [49,50,51,52]. The wavelength of PR is about 2.2 cm, which causes the minimum detected echo reflectivity of PR to be about 17 dBZ [50]. According to related studies [1,2,53], using the infrared brightness temperature greater than 273 K to define the warm cloud is an effective method. In this study, WPC is defined by the infrared brightness temperature in the 10.8-μm VIRS channel (BT4) at the cloud top being greater than 273 K, together with a radar reflectivity greater than 17 dBZ. Its H is defined as the height of the first layer from top to near surface with a minimum radar echo exceeding 17 dBZ. Theoretically, the H should also be related to the droplet size, number density and radar wavelength, it reflects the strength of updrafts inside precipitating cloud [47,51,52].
After definition and statistics, the distribution of total pixel number for WPCs is shown in Figure 1. Most of the WPCs’ numbers are more than 102 in each 0.5 degree. Only sample sizes greater than 50 are used to ensure statistical significance [5]. Among WPCs, we emphasize two extreme WPC types in this study—namely, extreme-light (EL-WPC) and extreme-heavy (EH-WPC) WPC—because of their differences in both cloud parameters and radiative effects, knowledge of which is limited. Figure 1 also shows the probability distribution function of the RR for WPC calculated with the merged datasets. It varies from 0.4 mm h−1 to 12 mm h−1, but a proportion of about 10% of the EL-WPC (RR < 0.65 mm h−1) and EH-WPC (RR > 4.25 mm h−1) makes up the total WPC in the tropical Pacific Ocean (20° S–20° N, 120° E–70° W).
Our work reported here is mainly based on the merged data of cloud parameters retrieved from merged datasets [43,54,55,56,57]. The cloud parameters (Re and Tau) of WPC are retrieved simultaneously using the bispectral reflectance (BSR) method [58,59], which has been adapted by numerous satellite missions. The BSR algorithm takes advantage of the characteristics of negligible absorbing effect in visible bands and distinct absorbing effect in near-infrared bands to synchronously retrieve cloud Re and Tau. The reflection function of cloud in visible band is primarily a function of the Tau, whereas the near-infrared band is primarily a function of Re [59]. Therefore, the first step of the BSR is to acquire the simulated reflectance at the two bands with different Re and Tau by using the radiative transfer model, and create a lookup table (LUT) of Re and Tau from the reflectance of the two bands. The true Re and Tau values are obtained by comparing the observed reflectance with the simulated one. Moreover, the LWP is calculated by a simple equation of Re and Tau, that is L W P = 2 3 ρ × R e × T a u , where ρ is the liquid water density. The errors of the retrieved cloud parameters by employing this method are no more than 10% for most cases of realistic cloud [58].
In this study, this method is adopted with the reflectivity in the 0.63-μm visible band (RF1) and 1.6-μm near-infrared band (RF2) of VIRS, together with simulation results from the Santa Barbara DISORT (Discrete Ordinates) Atmospheric Radiative Transfer (SBDART) model, to retrieve the cloud parameters (i.e., Re, Tau and LWP) [56]. Due to the limitations of RF1 and RF2 when the solar radiation datasets are unavailable, only the daytime cloud parameters are retrieved.
Many radiative transfer models are used to retrieve cloud parameters [60,61,62,63]. The SBDART model [64], one of the simplified and efficient radiative transfer models which is widely used in visible and infrared radiative transfer fields, is used to retrieve the cloud parameters. The SBDART model integrates three transfer modes (DISORT, LOWTRAN, MODTRAN), and combines the new standard atmospheric profiles, atmospheric absorption database, standard aerosol database and so on. This model made by FORTRAN can be used for simple and efficient computation. It runs with 33 altitudinal layers and 4 radiation streams. According to the studies [64], the model can define 12 output options and about 60 initial parameters, which includes cloud parameters, aerosol characteristics, atmospheric parameters and underlying surface types. The greatest advantage of the model is the ability to calculate radiative transfer under the condition of no-clear sky compared with the LOWTRAN model. That is, the model could simulate the cloud-layer radiation with the input of the process in absorption, scattering of cloud, or rain droplets in an actual situation.
Because the spatial distribution of TRMM observations is uneven in the same period, normalization against all observational samples is needed to calculate the necessary statistics, such as the distribution of WPC frequency. To show the statistical results clearly, the spatial distributions of time-averaged parameters, such as RR, spectral signals, Re, Tau and LWP, are calculated statistically in 0.5° × 0.5° grid boxes in the tropical Pacific Ocean with the merged datasets during the 15-year period of 1998–2012. Furthermore, the WPC frequency is defined as the ratio of the number of identified WPC pixels to the total number of pixels measured by PR in 0.5° × 0.5° grid boxes. The EL-WPC (EH-WPC) ratio is defined as the proportion of extreme-light (extreme-heavy) pixels to total WPC pixels in 0.5° × 0.5° grid boxes. The WPC amount is calculated by the frequency multiplied by the averaged RR, and converted into daily amounts [5,65]. In order to analyze the climatic background where WPC occurs, NCEP/NCAR monthly averaged reanalysis data, e.g., potential temperature and sea surface temperature (SST), at a horizontal resolution of 0.5°, are used [66].
The SBDART model is also adopted to simulate the radiative forcing effect of WPC. CRF is defined as the difference between the net radiation flux under all-sky and clear-sky conditions at the top of the atmosphere (TOA), surface (SFC), and any other height. In this study, climate-mean WPC parameters (Re, Tau, top height, bottom height, and fraction) are at the SFC and TOA in each 0.5° grid box, while other input parameters come from the tropical ocean climate-mean database in SBDART. Due to the limited ability of PR and VIRS in cloud-base detection, the height of the cloud base is set to be a constant value for the averaged WPC. According to the study by Gao et al. [67], most of the lowest warm cloud-base cloud is about 0.5 km. The constant value of WPC cloud base is set to 0.5 km in our simulation. The ranges of shortwave radiative forcing (SWCRF) and longwave radiative forcing (LWCRF) are at 0.25–4 μm and 4–50 μm, respectively, both of which are simulated with SBDART. The total radiative forcing (TCRF) is the sum of the SWCRF and LWCRF.

3. Results

3.1. Geographic Distributions and Probability Density Distributions of Warm Precipitating Cloud (WPC)

We begin by presenting the geographic distributions of various quantities that characterize the total, EL-WPC and EH-WPC from macrophysical and microphysical characteristics, observed by both PR and VIRS.
The frequencies of occurrence across the tropical Pacific Ocean for the total, EL-WPC and EH-WPC are presented in Figure 2. It is clear that the total WPC mainly occurs in the North-west Pacific, and South Pacific Convergence Zone (SPCZ), accounting for approximately 22% of the total detected pixels. These two regions are in prevailing westerlies, accompanied by higher SST. The central ITCZ is also the high-frequency region for WPC. Schumacher and Houze [3] also suggested that shallow and isolated precipitation frequently occurs in the middle ITCZ flanks, which represents the transition from the warm to the cold water regions. Moreover, in warm pool and SPCZ where the frequency of WPC is over 12%, the SST is over 302 K (Figure 2a). The WPC frequency in general follows the underlying SST distribution. The lower SST in the South-east Pacific is influenced by the sea currents and generates less precipitation. Almost all of the precipitating clouds in this region are the stratocumulus with lower cloud top [19].
On the basis of the frequency of two extreme types and the total WPC, the ratio of two extreme types to the total WPC is also calculated, as well as their zonal means. The lower-tropospheric stability (LTS), which is defined as the difference in potential temperature between 700 hPa and 1000 hPa [13], is also calculated by using the NCEP-NCAR temperature profiles. As shown in Figure 3, two extreme types of WPC with a high ratio in total WPC is distributed in different regions. For the EL-WPC, the west Pacific warm pool is the main distribution where LTS values are lower than 13 K and SST warmer than 302 K (Figure 2a). This is the major region where most intense and persistent convections occur with strong atmospheric heating [68]. The EL-WPC in warm pool is largely associated with the cumulus congestus [4]. The warmer top cloud is evidently triggered by outflows from the large convective systems. Moreover, the subsequent decay of a large system may reduce the rain rate for the decaying cloud [69]. The intensity of WPC in this region tends to be weaker. Besides, a few EL-WPC also occur in the South-east Pacific. The WPC in this region is from shallow clouds or isolated showers [4], and most of the WPCs are defined as pure warm rain [5]. The rain rate of the WPC in this region tends to be much weaker.
Meanwhile, most of the EH-WPC is over the oceans around Indonesia, in the SPCZ, and along the north coast of Australia and west coast of Mexico. SPCZ is located in a region of low-level moisture convergence, which contains one of the most expansive and persistent cloud bands [70]. Part of the EH-WPC occurs with the higher gradient of SST (Figure 2a) and relatively larger lower-tropospheric stability (Figure 3a). Except for SPCZ, most of the EH-WPC occurrence is affected by the underlying topography of which ocean near a continent or islands. The ratios of EH-WPC in these regions are more than 16%. According to the previous study in the Pacific Ocean [5], WPC in SPCZ is mainly the phased warm rain, which occurs during the developing or declining stage of precipitation weather systems. The rain rate of WPC would be stronger in these cases.
Comparing the ratio of the EL-WPC with the EH-WPC in Figure 3c, besides the lower ratio in all the tropical latitude zones than the EH-WPC, the peak in the zonal mean of ratio distribution is located at 0°, which is the valley in the zonal mean of frequency distribution (Figure 2d). This indicates that although just a few WPCs occur in this latitude zone, most WPCs are the EL-WPC. This peak distribution is caused by the EL-WPC in the region of the south-east ITCZ where few precipitations occur. Moreover, the EH-WPC occurs more in the latitude of 0°–10° S. The latitude corresponds well to the SPCZ where most Pacific precipitation occurs. The large gradient of SST with lower instability would produce stronger precipitation.
Besides analyzing the frequencies and ratio distribution differences of EL-WPC and EH-WPC, their spectral characteristics are also indicative parameters. As we know, the 0.63 μm wavelength-reflected visible-light signal RF1, which is not a water-absorptive channel, and the reflected solar radiance from clouds within this band [31,71,72,73], are generally used as an ancillary index for cloud retrieval, especially in the daytime. As shown in Figure 4a, most of the total WPC is located in the North-west Pacific and SPCZ with a lower RF1 (~0.35) than eastern regions (~0.55), especially in the eastern ITCZ (~0.6). The similar distributions are also shown for its two extreme types in Figure 4d,g. Compared with the EL-WPC and EH-WPC, RF1 for the EL-WPC is dramatically lower than the EH-WPC more than 0.18 (Figure 4d,g). The probability distribution function (PDF) for three types is also show in Figure 4j. RF1 is mainly concentrated at 0.38–0.5 for total WPC, and the peaks in PDF for EL-WPC and EH-WPC are 0.32 and 0.5, respectively.
Moreover, another VIRS band brightness temperature, BT4, experiences little absorption from water vapor and other ingredients. Generally, the lower the BT4, the higher the cloud top for the lower liquid cloud [47,74]. In Figure 4b, higher BT4 (~284 K) is located in the North-west and South Pacific and the lower BT4 (~281 K) is in the eastern ITCZ. These distributions resemble the geographic distribution of the EL-WPC (Figure 4e), although it is much higher than the EH-WPC BT4 (Figure 4f). The PDF distribution for three types of BT4 (Figure 4k) also shows that there is a distribution of 279–285 K for the total WPC, as well as 278–287 K for EL-WPC and 277–284 K for EH-WPC. The peaks in the PDF of BT4 for total WPC is about 282 K, and the EL-WPC PDF peak occurs in the 282.5 K, which is 2.5 K warmer than the EH-WPC.
As shown in Figure 4c, most higher H (~4 km) is located in the west Pacific warm pool and west SPCZ. The South-east Pacific and east of Hawaii has lower H (<2.5 km), where less than 6% WPCs occur (Figure 2a). The location of higher H is consistent with the high ratio of EL-WPC (Figure 3a), the peak PDF of H for EL-WPC (~3.5 km) has also a little larger than the total averaged one (~3 km) (Figure 4l). In the H distribution, the EH-WPC could reach more than 4 km, but both the EL-WPC and EH-WPC of H are all lower than 5 km. Because BT4 is higher than 273 K for WPC, the H is lower than the freezing level. The freezing level in tropical Pacific is generally lower than 5 km [75], which makes the H for both EL-WPC and EH-WPC almost lower than 5 km. The lower H (Figure 4c) correspond to high static stability (Figure 3a), which is consistent with the findings of Klein and Hartmann [13] that the boundary layer depth is negatively correlated with LTS over the North-east and South-east Pacific. In the average standard deviation of statistics of Figure 4, the value of RF1, BT4 and H for total WPC is 0.18, 4.2 K and 1.0 km on average, while there are 0.13, 5.0 K, 1.3 km for EL-WPC and 0.17, 4 K, 0.8 km for EH-WPC in higher frequency regions (result figures are omitted).
Based on the retrieved datasets, the averaged cloud parameters of Re, Tau and LWP for total, EL-WPC and EH-WPC are shown in Figure 5, respectively. The results indicate that the Re of warm rain is mainly concentrated within a small range of 14–17 μm. Most of the larger Res are located in the west Pacific warm pool and South-east Pacific with about 16.5 μm of Re. The distributions of larger Re for EL-WPC and EH-WPC are not completely consistent with the total WPC. EL-WPC with higher ratio (Figure 3a) has larger Re (~17 μm) and the EH-WPC with higher ratio (Figure 3a) has smaller Re (~15 μm) than the total averaged. The PDF of Re (Figure 5j) also shows that the peak of PDF for total WPC is 15.6 μm, and the EL-WPC and EH-WPC are 15.2 μm and 15.8 μm, respectively. The Tau has a similar distribution to the RF1 (Figure 4b,e,h). Since RF1 is not a water-absorptive channel, the reflected solar radiance from clouds within this band is mostly related to Tau, and the higher the Tau the greater the RF1 [47]. Lower Tau values mainly occur in the North-west Pacific and SPCZ, whereas higher values are distributed in the eastern ITCZ, and the South-east Pacific (Figure 5b). Meanwhile, the EH-WPC has a more extensive range of Tau values (15–50) than the EL-WPC (5–30) (Figure 5c). In the North-west Pacific and SPCZ, EL-WPC has a lower H and cloud top with larger Re and smaller Tau/LWP when high in frequency, compared with the EH-WPC. In contrast to these regions, the larger Re and Tau values of WPC occur in the eastern SPCZ when low in frequency. However, high-frequency WPC with smaller Re and larger Tau is mostly distributed in the eastern ITCZ. In the statistical averaged standard deviation, Re, Tau and LWP for total WPC is 5.0 μm, 16, 170 g m−2 in average, while there are 5.6 μm, 8, 80 g m−2 for EL-WPC and 5.8 μm, 28, 230 g m−2 for EH-WPC in higher frequency regions (result figures are omitted).

3.2. Relationships between WPC Types and Their Cloud Parameters

WPC possesses the characteristics of both precipitation and cloud. The effects of the cloud structures on precipitation and spectral characters are different. The relationships between cloud parameters and precipitation features are also meaningful to analyze.
Firstly, two of the significant parameters for precipitation and spectral characteristics, H and BT4, are seen as typical representatives to calculate with cloud parameters. We know that BT4 is an indicator for cloud top height for lower cloud and the H is storm top which reflects the strength of updrafts inside precipitating cloud. The medium part, which excludes the EL-WPC and EH-WPC from total WPC, is also shown, to facilitate discussion on the process of warm rain. The joint probability density function of BT4 and H for EL-WPC, medium-WPC and EH-WPC are counted and superimposed in Figure 6 (contour lines). In order to reduce the noise, only frequencies larger than 0.1% are calculated.
Generally, the two-dimensional frequency diagrams (Figure 6a–c; contours) of total WPC shows that most WPCs are distributed at BT4 of 283 K and H of 2.5 km. H is slowly decreased (from 3.5 km to 2.5 km) with the increased BT4 (from 273 K to 293 K), then the BT4 has less influence on H when H is lower than 2.5 km. The variation of BT4 and H for EL-WPC (Figure 6d–f) is similar to the total WPC with H lower than 2.5 km, while most of EL-WPCs are in 285 K. Besides, for the EH-WPC (Figure 6j–l), the trend between BT4 and H is similar to the total WPC with H higher 2.5 km, but the maximum frequency appears at 3.5 km H and 281 K BT4, which is 2 K cooler and 1 km higher than the total WPC. In general, the warmer the BT4 (lower cloud top) is, the lower the H is. But the H cannot be lower than a certain threshold, which is the lowest level to produce precipitation. For this reason, the effect of increased BT4 on H would be not obvious for the EL-WPC, while most of the H for EH-WPC is higher than 2.5 km. The threshold of H for WPC approaches to about 2.5 km.
Based on the relationship of H and BT4, the average WPC cloud parameters with each H and BT4 are also calculated. As shown in Figure 6a (colored), the higher H and lower BT4 of the total WPC is more likely to be the smaller Re, and two extreme Re are located in the 278 K BT4 with 4 km H (minimum, 15.2 μm) and 285 K BT4 with 2 km H (maximum, 15.8 μm), respectively. Moreover, due to BT4 indicative to the cloud top, when the H is higher than 3.5 km and much closer to the cloud top the Re tends to be larger. However, for the EL-WPC (Figure 6d), BT4 makes a negligible impact on Re distribution when BT4 is lower than the 289 K. Beyond that, the Re becomes smaller as H reduces and the smaller Re is located at the H of 2 km with about 15 μm. The Re for EH-WPC (Figure 6j) is about 0.6μm smaller than the total WPC on the whole. The Re is increased with the decreased H (H < 4 km), more cloud droplets become larger through coalescence and the warm rain that is produced would be much heavier.
Secondly, for the Tau parameter of total WPC, the distribution in the two-dimensional diagram of BT4 and H is shown in Figure 6b. The increased H (H < 4 km) causes the larger Tau when BT4 is lower than about 278 K. Whereas Tau becomes smaller with the increase of H in warmer BT4, the larger Tau would be more caused by the cooler BT4 which means the higher cloud top. The largest Tau could reach 30 with the H of 5 km. For EL-WPC, the Tau increases along the BT4 with a decrease in H, and the largest Tau is about 22. The peak of Tau for EH-WPC could reach 42. The differences between the EL-WPC and EH-WPC types are significant, in which the EL-WPC is lower than the EH-WPC by around 18 on average.
Thirdly, although the LWP distribution is similar to that of Tau, the total WPC has a higher LWP not only at a BT4 of 273 K and H of 4.5 km H, but also at 280 K and 2.5 km. The difference of LWP between the EL-WPC and EH-WPC is more than 140 g m−2 at lower BT4.
Since these properties of WPC near the cloud top are retrieved by spectral signals, they play an important role in monitoring clouds. However, most satellite-based remote-sensing methods are limited in their ability to measure the characteristics of rain and cloud parameters at the same time. By adopting near-simultaneous observations from PR and VIRS, which are onboard the TRMM, retrieving cloud parameters corresponding to their RR can improve our understanding of the characteristics of WPC. To make our statistical results more robust, equal samples in each RR interval are guaranteed in calculating the relationship between the RR and its corresponding cloud parameter for the EL-WPC, medium-WPC and EH-WPC, separately. The results are then used to perform non-linear fitting calculations for the given data and to plot diagrams for their fitting functions (Figure 7).
For the EL-WPC, with an increase in RR, the mean Re increases significantly. Then, the mean RRs decrease gradually for the medium-type section. When the mean RR increases into the EH-WPC section, the decline in Re slows, indicating that precipitating clouds reach an ultimate radius and the increase in the mean RR does not only depend on the droplet radius of the precipitating cloud. Moreover, Re in EH-WPC is smaller than the EL-WPC. According to this characteristics, the relationship between the RR and Re obeys a Gompertz curve Function (1), i.e.,
Re = Re 0 + a 1 RR exp { 0.5 [ ln ( RR / RR 0 ) b 1 ] 2 }
where Re0, RR0, a1 and b1 are coefficients listed in Table 1. The correlation coefficients of regression are over 0.9, implying a notable exponential relationship between the RR and the Re, which may be useful for estimating Re and parameterizing precipitation in models.
Similarly, the relationship between the Tau and RR is also shown in Figure 7b. Generally, as the RR increases, the mean Tau of WPC increases gradually, especially under about 4.5 mm h−1. When the mean RR exceeds 4.5 mm h−1, the increase in Tau is more gradual. The RR has less influence on the growth rate of Tau. Based on its distribution, the fitting function of the relationship between Tau and RR is calculated as (2),
Tau = a 2 × RR b 2 + RR + c 2 × RR d 2 + RR
where a2, b2, c2 and d2 are coefficients shown in Table 1. Similar relationships between the mean RR and mean LWP are found, i.e.,
LWP = a 3 × RR b 3 + RR + c 3 × RR d 3 + RR
and the coefficients are defined as a3, b3, c3 and d3, respectively. This suggests that the LWP generally rises as the RR increases in Function (3). Furthermore, it can be seen in the curves that the RR of EL-WPC is more distinct than that of the EH-WPC.

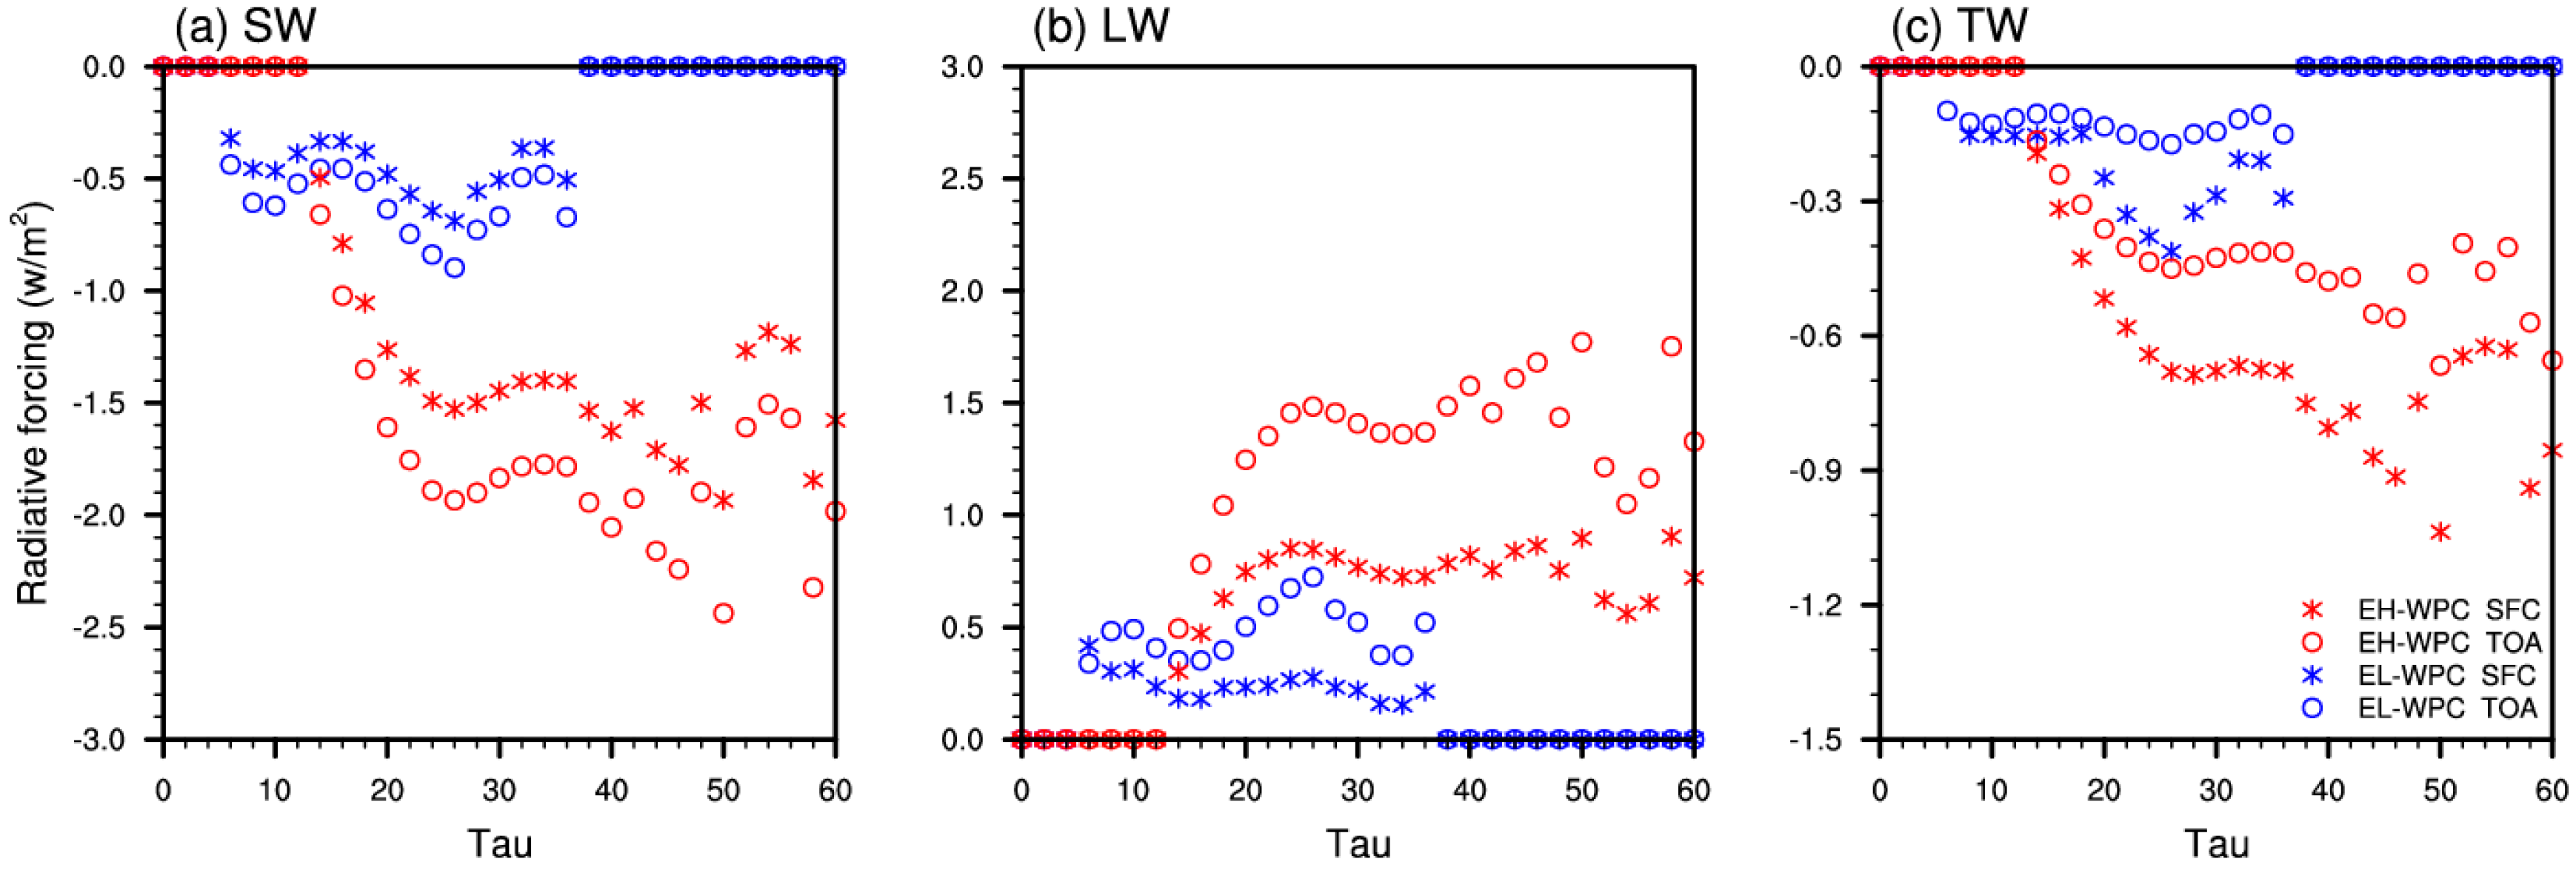
3.3. Radiative Forcing of WPC

Cloud radiative forcing is a key factor in evaluating the energy balance which is modulated by cloud. As we know that the Earth–atmosphere system obtains energy from cloud, radiative forcing is backward and the negative forcing is a loss of energy with respect to the clear-sky conditions.
Figure 8 shows the geographical distribution of the climatological mean SWCRF and LWCRF of the WPC, as well as their net (TOA + SFC) total (SWCRF + LWCRF) radiative forcing (TCRF). The total WPC induces strong negative SWCRF, ranging from −100 W m−2 to −30 W m−2 (Figure 8a). The ocean surface has a low albedo, which will cause considerably less shortwave radiation to be reabsorbed by WPC through multiple reflections. Over the tropical Pacific Ocean, therefore, there will be more outgoing shortwave radiation under precipitating cloud than that under clear sky, which presents strong negative SWCRF. In contrast, LWCRF induced by WPC over the Pacific Ocean heats the atmosphere, with values of 0–50 W m−2 (Figure 8b).
Furthermore, the total radiative effect of precipitating cloud is one of cooling, which means the Earth–atmosphere system obtains energy forced by WPC, ranging from −50 W m−2 to −5 W m−2. In addition, the larger shortwave/longwave cooling or heating values are mainly located over the ITCZ and SPCZ, all of which present higher fractions of WPC (Figure 2). The geographical distributions of climatological mean SWCRF and LWCRF of EL-WPC and EH-WPC and their net radiative effect are also shown in Figure 8. SWCRF expresses cooling for EL-WPC, ranging from −1.5 W m−2 to −0.2 W m−2. However, the SWCRF of EH-WPC ranges from −6 W m−2 to −0.5 W m−2, which is weaker than the EL-WPC by more than 4 W m−2. Compared to their LWCRF, both the EL-WPC and EH-WPC generate positive heating, varying between 0 and 0.6 W m−2, and between 0 and 4 W m−2, respectively. The total radiative forcing is a cooling of about −0.4 W m−2 for EL-WPC, and −0.8 W m−2 for the EH-WPC. Therefore, the net radiative effect induced by EH-WPC constitutes a cooling greater than that for the EL-WPC by more than −0.4 W m−2. The TCRF for WPC manifests as a negative radiative forcing, which means that thick WPC mainly induces relatively strong cooling over the tropical ocean. In addition, the regions of larger SWCRF/LWCRF are also well matched with those of higher fractions (i.e., frequency) of WPC.
Based on the radiative forcing of WPC and the merged dataset, the relationships of Tau with the shortwave, longwave and total net radiative forcing are shown in Figure 9. Basically, the radiative forcing increases as the Tau increases. The EL-WPC of shortwave radiative forcing ranges from −0.2 to −0.9 W m−2 with Tau 5–40 (Figure 9a). There are two minima of Tau (10 and 28), with radiative forcing at the TOA of −0.62 and −0.90 W m−2, as well as −0.47 and −0.69 W m−2 at the SFC. The difference between the TOA and SFC is less than −0.3 W m−2. Similarly, the EH-WPC also has two minima in its distribution of Tau, at 28 and 45, respectively. The radiative forcing corresponds to each minimum with values of −1.93 and −2.44 W m−2 at the TOA, and −1.53 and −1.93 W m−2 at the SFC. The Tau values at the first minimum for both EL-WPC and EH-WPC are highly consistent with the peak in the PDF distribution shown in Figure 5k. Both the EL-WPC and EH-WPC have stronger cooling at 20–30. The longwave radiative forcing is also different in its distributions for the EL-WPC and EH-WPC. Generally, for EH-WPC, when the Tau is less than 25, the LWCRF at the TOA and SFC increases with strengthening Tau for the EH-WPC. However, as the Tau rises, this radiative forcing declines slightly until the Tau reaches 35. Then, the radiative forcing increases to another peak at a Tau of 45, with 1.7 W m−2 at the TOA and 0.8 W m−2 at the SFC. For EL-WPC, the radiative forcing at the TOA also has a bimodal distribution, although not as obvious as for the radiative forcing at the SFC. The difference between a Tau of 20 and 30 is significant, at more than 1.0 W m−2. Compared with the radiative forcing at the SFC, the radiative forcing at the TOA produces stronger cooling for shortwave radiation, and stronger positive warming for longwave radiation, as compared to the EL-WPC. Based on this finding, the total radiative forcing at the SFC brings forth stronger cooling than at the TOA. Both the EL-WPC and EH-WPC have their peak at a Tau of 25, with the peak being −0.15 (−0.3) W m−2 for the EL-WPC and −0.45 (−0.7) W m−2 for the EH-WPC at the TOA (SFC). EH-WPC produces −0.3 W m−2 more than the EL-WPC at both the TOA and SFC when the Tau ranges from 20 to 30.

4. Discussion and Conclusions

This study documents the daytime WPC climatological-mean parameters and microphysical properties (e.g., frequency, RF1, BT4, H, RR, Re, Tau and LWP) by merged observations and retrieval cloud parameter datasets from TRMM PR and VIRS for the first time. Besides the total WPCs, two kinds of extreme RRs (EL-WPC and EH-WPC) WPC are selected as differential comparison objects from distribution, PDF characteristics, and the relationships between precipitation and cloud. Moreover, the WPC-induced SWCRFs, LWCRFs and total net radiative forcing effects are further simulated by the SBDART model, with the input of WPC parameters. We report the following conclusions:
(1)
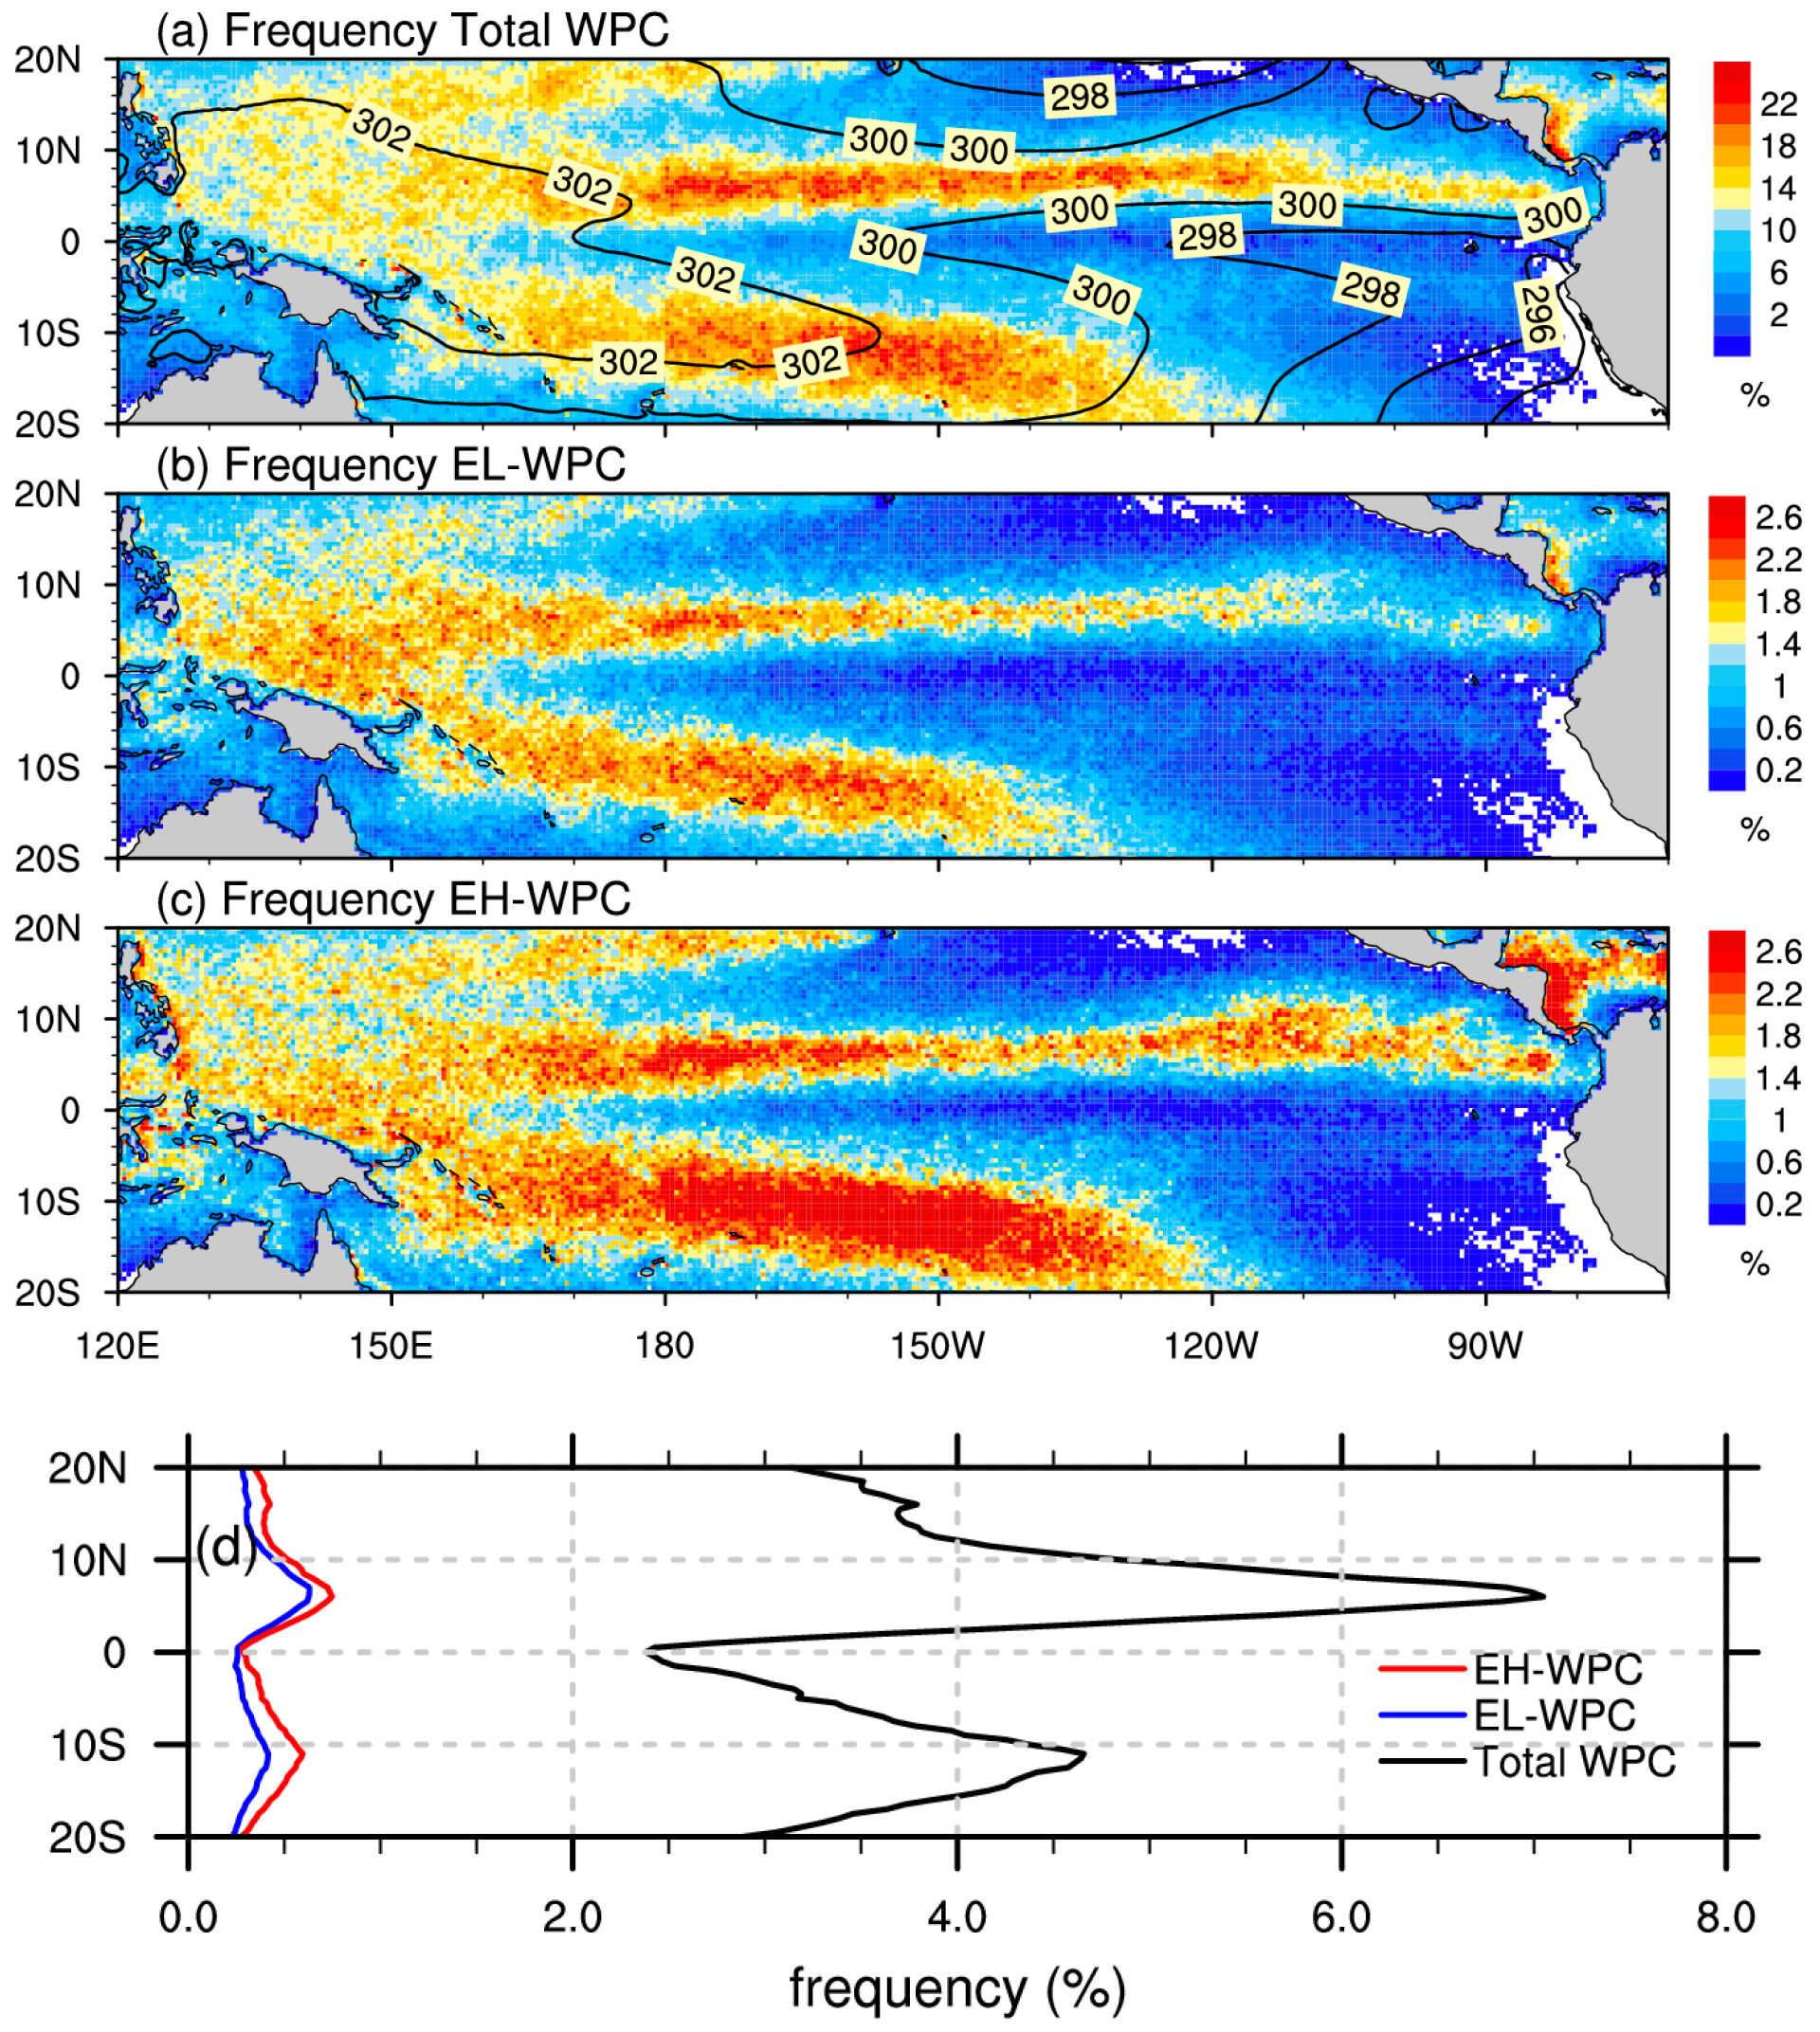
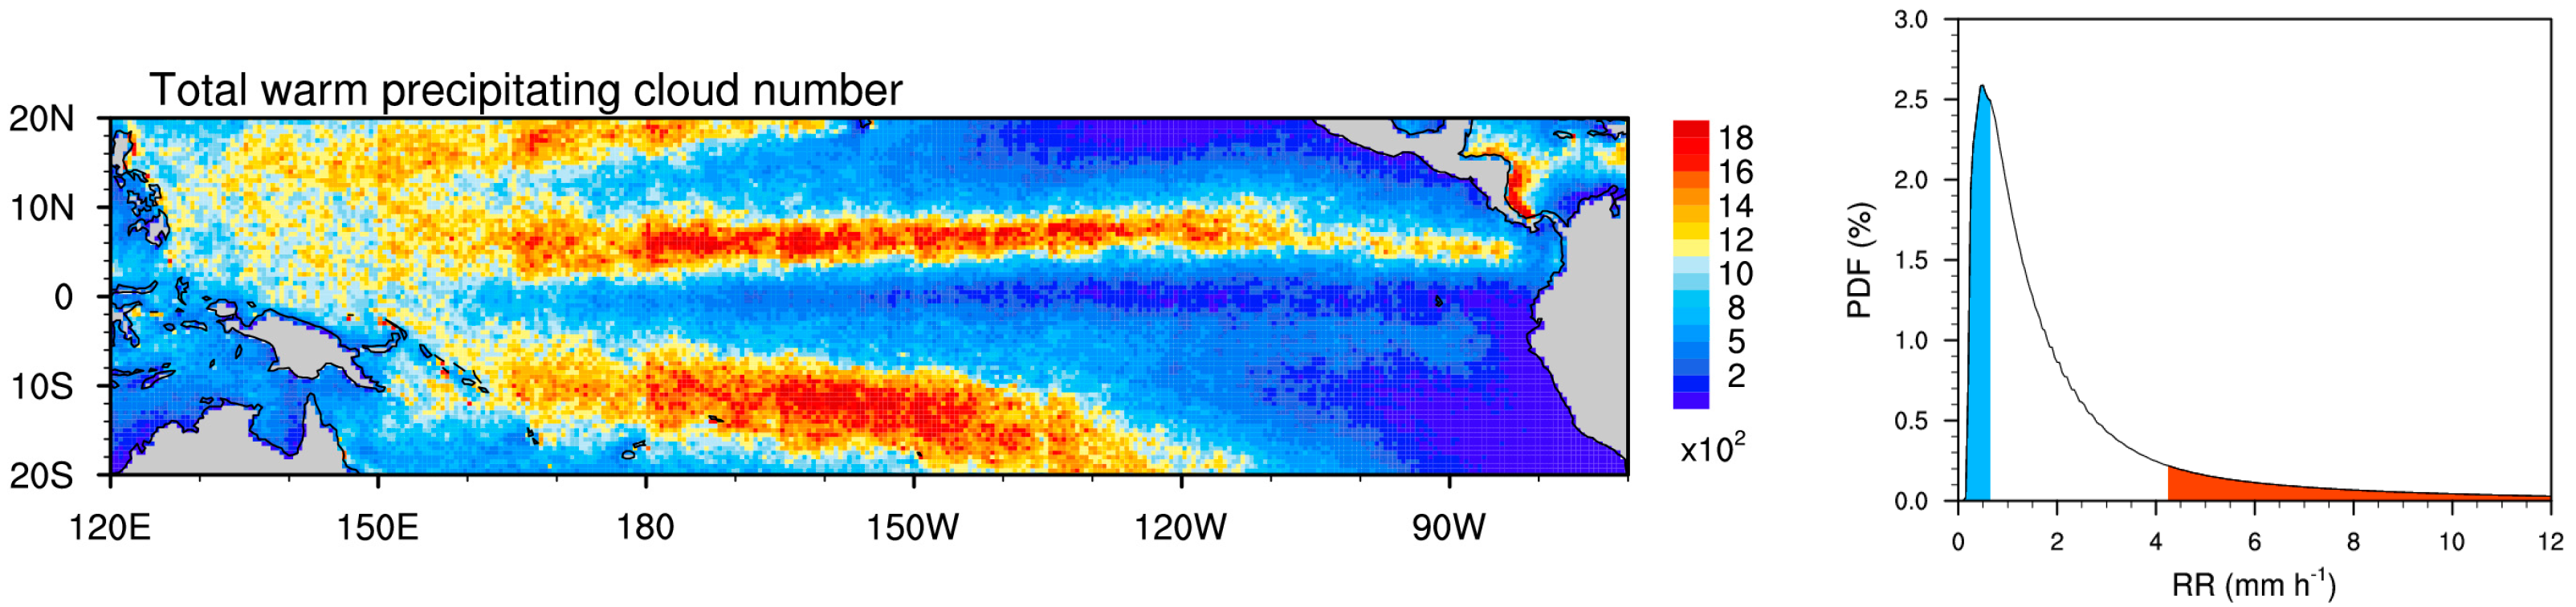
Total WPC mainly occurs in the North-west Pacific, ITCZ and SPCZ, accompanied by relatively warm SSTs, accounting for approximately 22% of the total. The total WPC has a Re of 15.6 μm, Tau of 20, and LWP of 200 g m−2 on average. In total WPC, EL-WPC occurs more in the west Pacific warm pool with higher instability and warmer SST, which includes cumulus congestus. The EH-WPC, meanwhile, is distributed more in the SPCZ with deep convection.
(2)
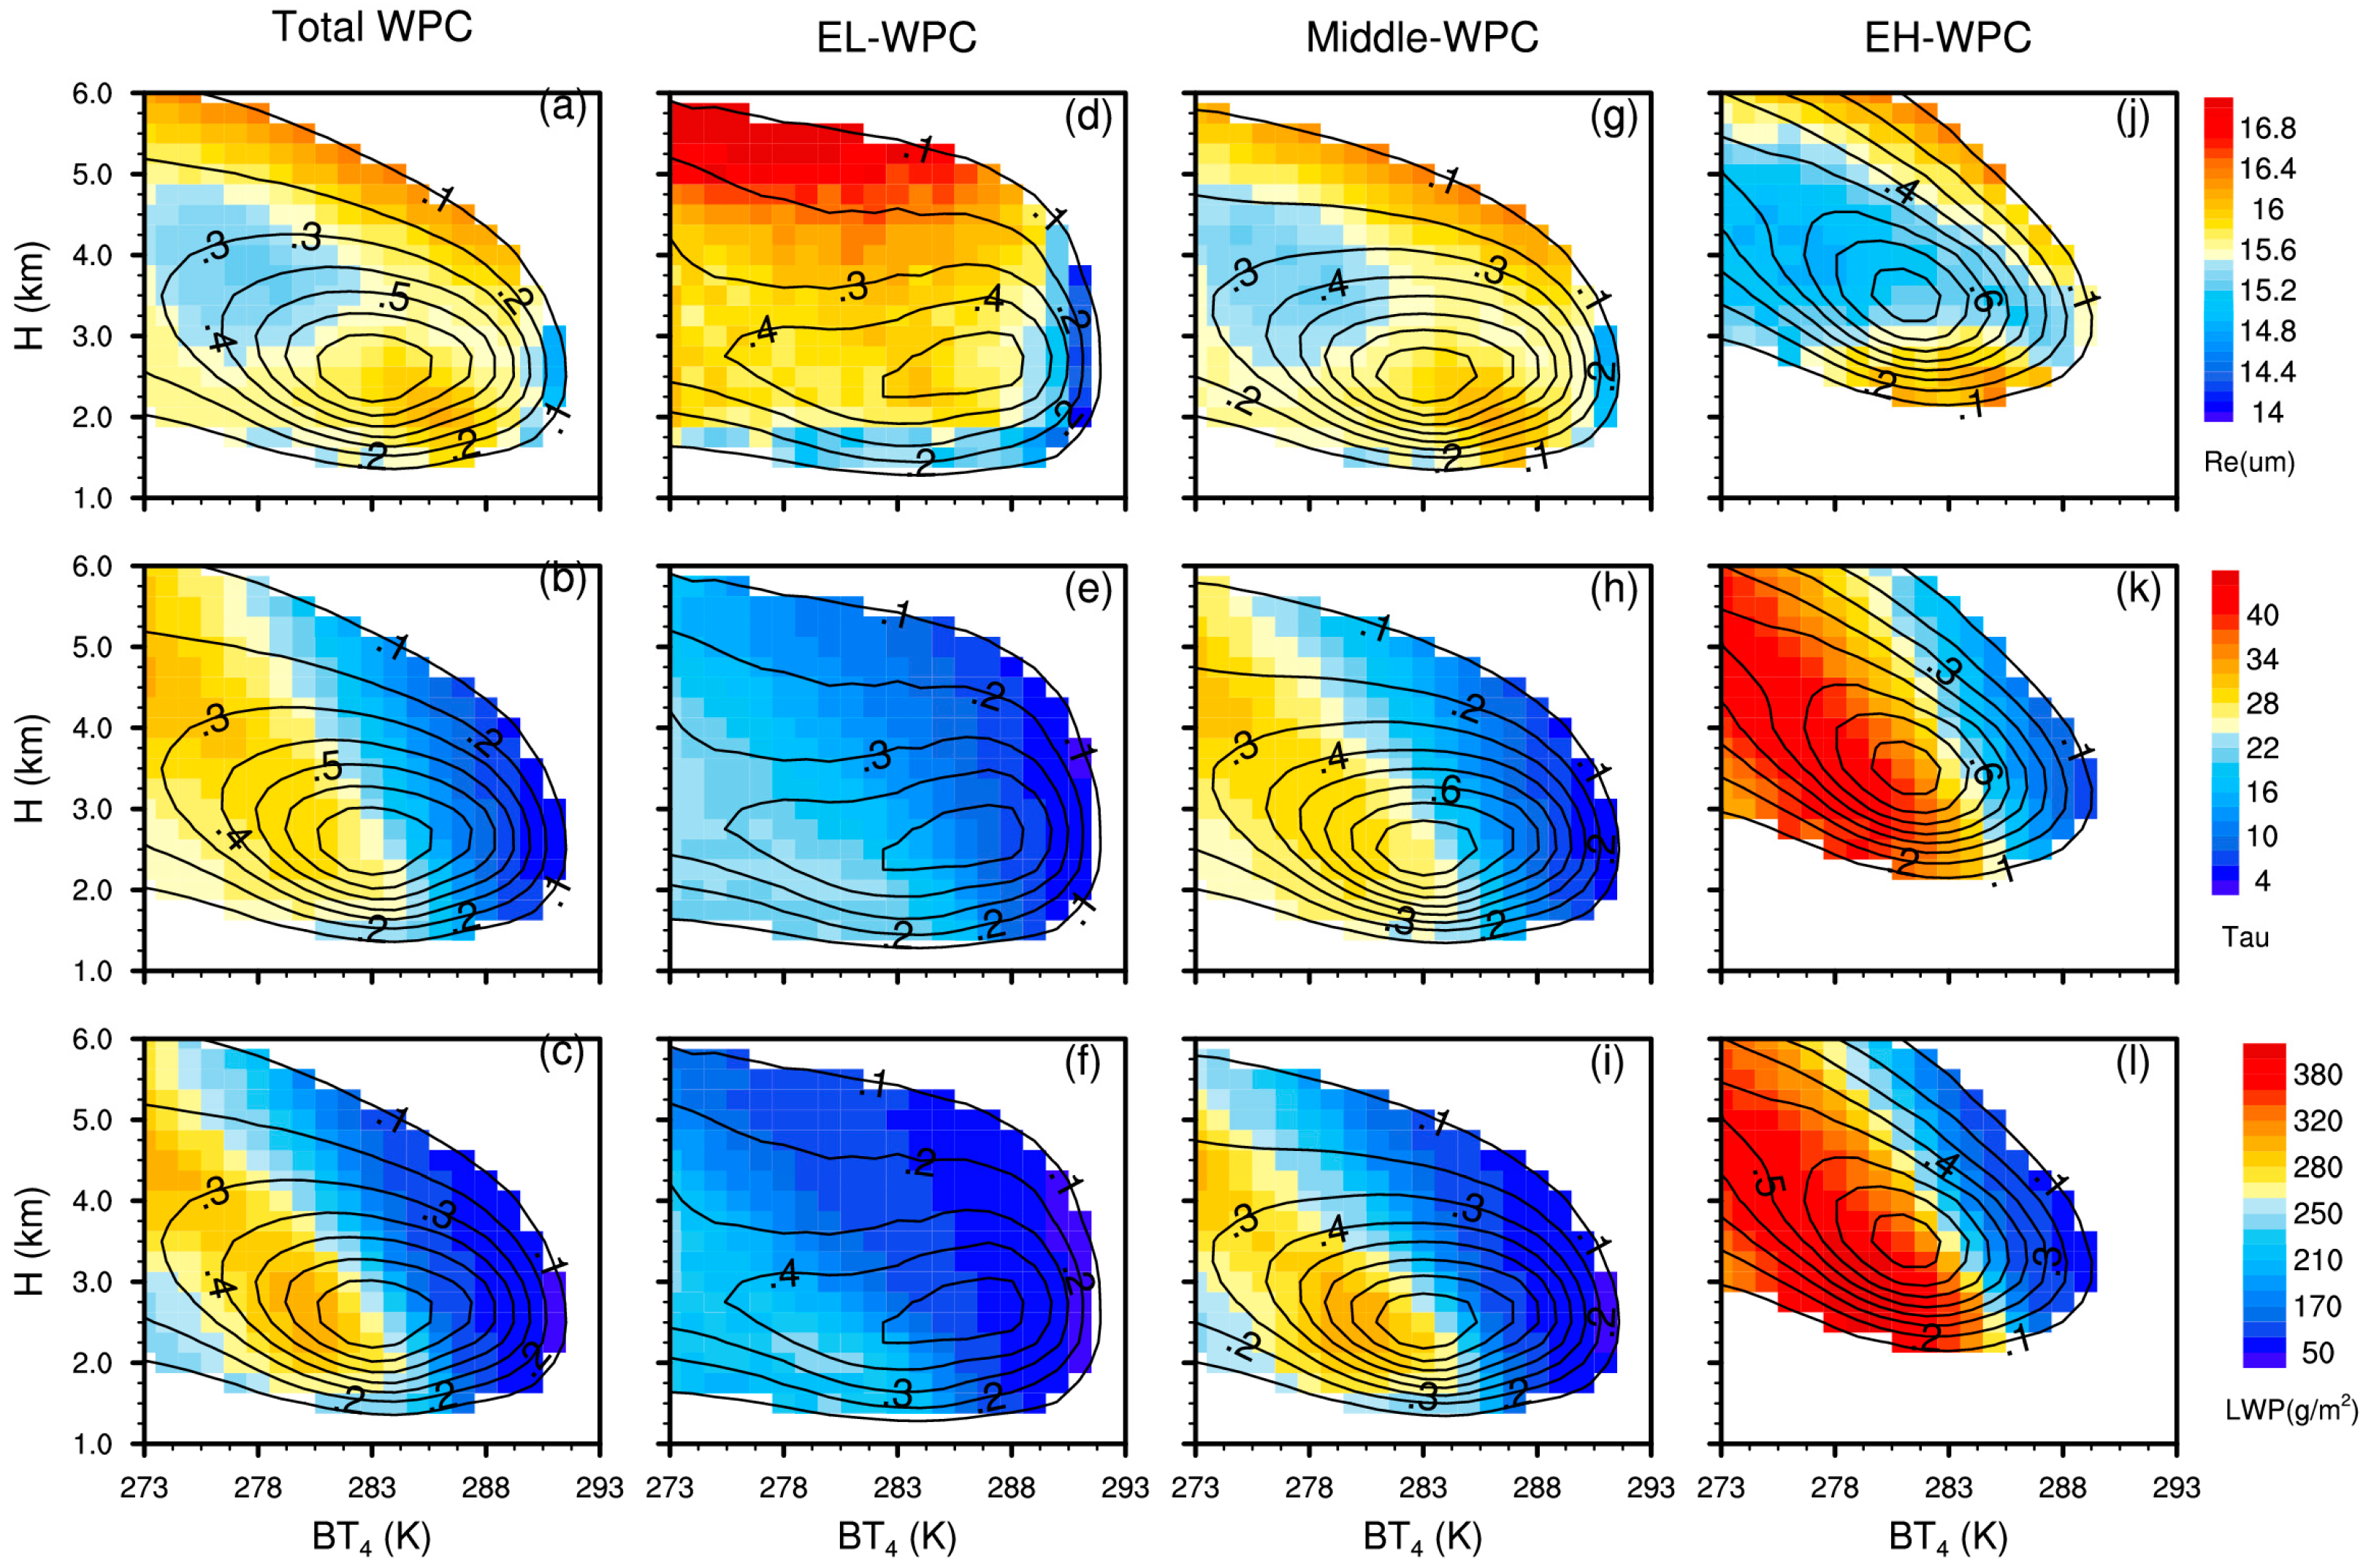
The EH-WPC has higher Tau (~28) and LWP (250 g m−2) with a smaller mean Re (15.2 μm) compared with EL-WPC. Most of the EH-WPCs occur at 3.5 km H with 280 K BT4, while the EH-WPCs are at 2.5 km with 285 K. In EL-WPC, due to lighter rain rate, smaller Re is distributed with decreased H for EL-WPC. While for the EH-WPC, higher ETH is characterized by stronger convective motion, the cloud collision-coalescence process makes the Re larger in the lower H and generates a stronger rain rate. When the WPC has a light rain rate, the Re is larger with the increased RR, while it decreases when in a heavy rain rate. The relationships between RR and cloud parameters are established by fitting statistics, which helps to deepen the connections between precipitation and cloud for WPC.
(3)
The TCRF is a cooling of about −0.4 W m−2 for EL-WPC, and −0.8 W m−2 for the EH-WPC. The EH-WPC induces stronger cooling net radiative effects (−0.4 W m−2) than the EL-WPC. Most of the WPC is regarded as the thick cloud, which could seem to be the black body. The cloud fraction, temperature and Tau would then be more important for radiative forcing than other microphysical properties and results in the distribution of radiative forcing being mostly controlled by the fraction.
This paper not only solves the limitation of datasets for observation and retrieved cloud parameters of WPCs, it also sets up two typical WPCs and makes the comparison between two extreme rain rate WPCs. Based on the advantage of the datasets, the semi-diurnal variations from both horizontal and vertical distributions are also calculated, as well as the radiative forcing simulation. In this work, the merged dataset-based scheme performs well in delineating the cloud and precipitation characteristics of WPC. However, it is also critical to understand the uncertainties and limitations in this study. The BSR method makes several important assumptions, which are that the cloud pixels are horizontally homogenous and independent of each other [76]. This method may introduce bias in the results [71]. Besides that, the bias of visible and infrared upwelling radiance observations may also produce uncertainties in the retrievals of Re and Tau [71]. Moreover, because the detection of very weak precipitation by PR is limited to its long wavelength (2.2 cm), drizzle is usually missed. Nevertheless, some WPCs can be categorized as of drizzle-type, and such drizzle can be distinguished effectively using CPR reflectivity (−15 to 0 dBZ), albeit limited by the detected time slot. Additionally, the effects of overlapping or multi-layer clouds on WPC radiative forcing are not considered in the present study. Therefore, more detailed research on WPC and its radiative forcing is still needed.

Author Contributions

This research work was mainly conducted by F.Q. at University of Science and Technology of China. She also compiled the manuscript. T.X. contributed with results analysis and revision of the manuscript. Y.F. is the principle investigator on the project.

Funding

This research was funded by the National Natural Science Foundation of China (NSFC Grants 41230419 and 41675041).

Acknowledgments

This work thanks to the Goddard Space Flight Center for providing PR 2A25 and VIRS 1B01 datasets.

Conflicts of Interest

The authors declare no conflict of interest.

References

  1. Petty, G.W. Prevalence of precipitation from warm-topped clouds over eastern Asia and the western Pacific. J. Clim. 1999, 12, 220–229. [Google Scholar] [CrossRef]
  2. Short, D.A.; Nakamura, K. TRMM radar observations of shallow precipitation over the tropical oceans. J. Clim. 2000, 13, 4107–4124. [Google Scholar] [CrossRef]
  3. Schumacher, C.; Houze, R.A., Jr. The TRMM precipitation radar’s view of shallow, isolated rain. J. Appl. Meteorol. 2003, 42, 1519–1524. [Google Scholar] [CrossRef]
  4. Lau, K.M.; Wu, H.T. Warm rain processes over tropical oceans and climate implications. Geophys. Res. Lett. 2003, 30, 2290. [Google Scholar] [CrossRef]
  5. Qin, F.; Fu, Y. TRMM-observed summer warm rain over the tropical and subtropical Pacific Ocean: Characteristics and regional differences. J. Meteorol. Res. 2016, 30, 371–385. [Google Scholar] [CrossRef]
  6. Hartmann, D.L.; Short, D.A. On the use of earth radiation budget statistics for studies of clouds and climate. J. Atmos. Sci. 1980, 37, 1233–1250. [Google Scholar] [CrossRef]
  7. Slingo, A. Sensitivity of the Earth's radiation budget to changes in low clouds. Nature 1990, 343, 49–51. [Google Scholar] [CrossRef]
  8. Webb, M.J.; Senior, C.A.; Sexton, D.M.H.; Ingram, W.J.; Williams, K.D.; Ringer, M.A.; Knutson, T. On the contribution of local feedback mechanisms to the range of climate sensitivity in two GCM ensembles. Clim. Dyn. 2006, 27, 17–38. [Google Scholar] [CrossRef]
  9. De Szoeke, S.P.; Fairall, C.W.; Pezoa, S. Ship observations of the tropical Pacific Ocean along the coast of South America. J. Clim. 2009, 22, 458–464. [Google Scholar] [CrossRef]
  10. Bony, S.; Dufresne, J.L. Marine boundary layer clouds at the heart of tropical cloud feedback uncertainties in climate models. Geophys. Res. Lett. 2005, 32. [Google Scholar] [CrossRef]
  11. Medeiros, B.; Stevens, B.; Held, I.M.; Zhao, M.; Williamson, D.L.; Olson, J.G.; Bretherton, C.S. Aquaplanets, climate sensitivity, and low clouds. J. Clim. 2008, 21, 4974–4991. [Google Scholar] [CrossRef]
  12. Stocker, T.F.; Qin, D.; Plattner, G.K.; Tignor, M.; Allen, S.K.; Boschung, J.; Midgley, P.M. IPCC 2013, Climate Change; IPCC: Geneva, Switzerland, 2013. [Google Scholar]
  13. Klein, S.A.; Hartmann, D.L. The seasonal cycle of low stratiform clouds. J. Clim. 1993, 6, 1587–1606. [Google Scholar] [CrossRef]
  14. Stephens, G.L.; Haynes, J.M. Near global observations of the warm rain coalescence process. Geophys. Res. Lett. 2007, 34. [Google Scholar] [CrossRef]
  15. Liu, G.; Curry, J.A.; Sheu, R.S. Classification of clouds over the western equatorial Pacific Ocean using combined infrared and microwave satellite data. J. Geophys. Res. Atmos. 1995, 100, 13811–13826. [Google Scholar] [CrossRef]
  16. Lin, B.; Rossow, W.B. Precipitation water path and rainfall rate estimates over oceans using special sensor microwave imager and International Satellite Cloud Climatology Project data. J. Geophys. Res. Atmos. 1997, 102, 9359–9374. [Google Scholar] [CrossRef]
  17. Tokay, A.; Short, D.A.; Williams, C.R.; Ecklund, W.L.; Gage, K.S. Tropical rainfall associated with convective and stratiform clouds: Intercomparison of disdrometer and profiler measurements. J. Appl. Meteorol. 1999, 38, 302–320. [Google Scholar] [CrossRef]
  18. Liu, C.; Zipser, E.J. “Warm rain” in the tropics: Seasonal and regional distributions based on 9 yr of TRMM data. J. Clim. 2009, 22, 767–779. [Google Scholar] [CrossRef]
  19. Rapp, A.D.; Lebsock, M.; L’Ecuyer, T. Low cloud precipitation climatology in the southeastern Pacific marine stratocumulus region using CloudSat. Environ. Res. Lett. 2013, 8, 014027. [Google Scholar] [CrossRef]
  20. Wood, R. Relationships between optical depth, liquid water path, droplet concentration, and effective radius in adiabatic layer cloud. Univ. Wash. 2006, 3, 4641–4654. [Google Scholar]
  21. Hansen, J.E.; Travis, L.D. Light scattering in planetary atmospheres. Space Sci. Rev. 1974, 16, 527–610. [Google Scholar] [CrossRef]
  22. Petty, G.W. A First Course in Atmospheric Radiation, 2nd ed.; Sundog Pub: Madison, WI, USA, 2006; p. 459. [Google Scholar]
  23. Krueger, S.K.; Fu, Q.; Liou, K.N.; Chin, H.N.S. Improvements of an ice-phase microphysics parameterization for use in numerical simulations of tropical convection. J. Appl. Meteorol. 1995, 34, 281–287. [Google Scholar] [CrossRef]
  24. Leach, M.J.; Raman, S. Role of radiative transfer in maintenance and destruction of stratocumulus clouds. Atmos. Environ. 1995, 29, 2009–2018. [Google Scholar] [CrossRef]
  25. Rogers, R.R.; Yau, M.K. A Short Course in Cloud Physics, 3rd ed.; Butterworth-Heinemann, International Series in Natural Philosophy: Woburn, MA, USA, 1989; p. 290. [Google Scholar]
  26. Dong, X.; Xi, B.; Wu, P. Investigation of the diurnal variation of marine boundary layer cloud microphysical properties at the Azores. J. Clim. 2014, 27, 8827–8835. [Google Scholar] [CrossRef]
  27. Rossow, W.B.; Schiffer, R.A. ISCCP cloud data products. Bull. Am. Meteorol. Soc. 1991, 72, 2–20. [Google Scholar] [CrossRef]
  28. Rossow, W.B.; Garder, L.C. Cloud detection using satellite measurements of infrared and visible radiances for ISCCP. J. Clim. 1993, 6, 2341–2369. [Google Scholar] [CrossRef]
  29. Rossow, W.B.; Schiffer, R.A. Advances in understanding clouds from ISCCP. Bull. Am. Meteorol. Soc. 1999, 80, 2261–2287. [Google Scholar] [CrossRef]
  30. Lin, B.; Rossow, W.B. Observations of cloud liquid water path over oceans: Optical and microwave remote sensing methods. J. Geophys. Res. Atmos. 1994, 99, 20907–20927. [Google Scholar] [CrossRef]
  31. Platnick, S.; King, M.D.; Ackerman, S.A.; Menzel, W.P.; Baum, B.A.; Riédi, J.C.; Frey, R.A. The MODIS cloud products: Algorithms and examples from Terra. IEEE Trans. Geosci. Remote Sens. 2003, 41, 459–473. [Google Scholar] [CrossRef]
  32. Heidinger, A.K.; Pavolonis, M.J. Gazing at cirrus clouds for 25 years through a split window. Part I: Methodology. J. Appl. Meteorol. Climatol. 2009, 48, 1100–1116. [Google Scholar] [CrossRef]
  33. Wylie, D.; Jackson, D.L.; Menzel, W.P.; Bates, J.J. Trends in global cloud cover in two decades of HIRS observations. J. Clim. 2005, 18, 3021–3031. [Google Scholar] [CrossRef]
  34. Stephens, G.L.; Vane, D.G.; Tanelli, S.; Im, E.; Durden, S.; Rokey, M.; L’Ecuyer, T. CloudSat mission: Performance and early science after the first year of operation. J. Geophys. Res. Atmos. 2008, 113. [Google Scholar] [CrossRef]
  35. Winker, D.M.; Pelon, J.; Coakley, J.A., Jr.; Ackerman, S.A.; Charlson, R.J.; Colarco, P.R.; Kubar, T.L. The CALIPSO mission: A global 3D view of aerosols and clouds. Bull. Am. Meteorol. Soc. 2010, 91, 1211–1229. [Google Scholar] [CrossRef]
  36. Suzuki, K.; Nakajima, T.Y.; Stephens, G.L. Particle growth and drop collection efficiency of warm clouds as inferred from joint CloudSat and MODIS observations. J. Atmos. Sci. 2010, 67, 3019–3032. [Google Scholar] [CrossRef]
  37. Liu, D.; Liu, Q.; Qi, L.; Fu, Y. Oceanic single-layer warm clouds missed by the Cloud Profiling Radar as inferred from MODIS and CALIOP measurements. J. Geophys. Res. Atmos. 2016, 121, 12947–12965. [Google Scholar] [CrossRef]
  38. Suzuki, K.; Stephens, G.L. Global identification of warm cloud microphysical processes with combined use of A-Train observations. Geophys. Res. Lett. 2008, 35. [Google Scholar] [CrossRef]
  39. Kubar, T.L.; Hartmann, D.L.; Wood, R. Understanding the importance of microphysics and macrophysics for warm rain in marine low clouds. Part I: Satellite observations. J. Atmos. Sci. 2009, 66, 2953–2972. [Google Scholar] [CrossRef]
  40. Kummerow, C.; Barnes, W.; Kozu, T.; Shiue, J.; Simpson, J. The tropical rainfall measuring mission (TRMM) sensor package. J. Atmos. Ocean. Technol. 1998, 15, 809–817. [Google Scholar] [CrossRef]
  41. Fu, Y.; Liu, G.; Wu, G.; Yu, R.; Xu, Y.; Wang, Y.; Liu, Q. Tower mast of precipitation over the central Tibetan Plateau summer. Geophys. Res. Lett. 2006, 33. [Google Scholar] [CrossRef]
  42. Yu, R.; Li, J.; Chen, H. Diurnal variation of surface wind over central eastern China. Clim. Dyn. 2009, 33, 1089. [Google Scholar] [CrossRef]
  43. Liu, Q.; Fu, Y. Comparison of radiative signals between precipitating and non-precipitating clouds in frontal and typhoon domains over East Asia. Atmos. Res. 2010, 96, 436–446. [Google Scholar] [CrossRef]
  44. Simpson, J.; Adler, R.F.; North, G.R. A proposed tropical rainfall measuring mission (TRMM) satellite. Bull. Am. Meteorol. Soc. 1988, 69, 278–295. [Google Scholar] [CrossRef]
  45. Fu, Y.; Liu, G. The variability of tropical precipitation profiles and its impact on microwave brightness temperatures as inferred from TRMM data. J. Appl. Meteorol. 2001, 40, 2130–2143. [Google Scholar] [CrossRef]
  46. Liu, G.; Fu, Y. The characteristics of tropical precipitation profiles as inferred from satellite radar measurements. J. Meteorol. Soc. Jpn. Ser. II 2001, 79, 131–143. [Google Scholar] [CrossRef]
  47. Fu, Y.F.; Liu, P.; Liu, Q.; Ma, M.; Sun, L.; Wang, Y. Climatological characteristics of VIRS channels for precipitating cloud in summer over the tropics and subtropics. J. Atmos. Environ. Opt. 2011, 6, 129–140. [Google Scholar]
  48. Yang, Y.J.; Lu, D.R.; Fu, Y.F.; Chen, F.J.; Wang, Y. Spectral characteristics of tropical anvils obtained by combining TRMM precipitation radar with visible and infrared scanner data. Pure Appl. Geophys. 2015, 172, 1717–1733. [Google Scholar] [CrossRef]
  49. Awaka, J. Early results on rain type classification by the Tropical Rainfall Measuring Mission (TRMM) precipitation radar. In Proceedings of the URSI-F Open Symposium on Wave Propagation and Remote Sensing, Aveiro, Portugal, 22–25 September 1998; pp. 143–146. [Google Scholar]
  50. Iguchi, T.; Kozu, T.; Kwiatkowski, J.; Meneghini, R.; Awaka, J.; Okamoto, K.I. Uncertainties in the rain profiling algorithm for the TRMM precipitation radar. J. Meteorol. Soc. Jpn. Ser. II 2009, 87, 1–30. [Google Scholar] [CrossRef]
  51. Fu, Y.; Cao, A.; Li, T.; Feng, S.; Zheng, Y.; Liu, Y.; Zhang, A. Climatic characteristics of the storm top altitude for the convective and stratiform precipitation in summer Asia based on measurements of the TRMM precipitation radar. Acta Meteor Sin. 2012, 70, 436–451. [Google Scholar]
  52. Chen, F.; Fu, Y.; Liu, P.; Yang, Y. Seasonal variability of storm top altitudes in the tropics and subtropics observed by TRMM PR. Atmos. Res. 2016, 169, 113–126. [Google Scholar] [CrossRef]
  53. Chen, R.; Li, Z.; Kuligowski, R.J.; Ferraro, R.; Weng, F. A study of warm rain detection using A-Train satellite data. Geophys. Res. Lett. 2011, 38. [Google Scholar] [CrossRef]
  54. Liu, Q.; Fu, Y.; Yu, R.; Sun, L.; Lu, N. A new satellite-based census of precipitating and nonprecipitating clouds over the tropics and subtropics. Geophys. Res. Lett. 2008, 35. [Google Scholar] [CrossRef]
  55. Liu, X.; Liu, Q.; Fu, Y.; Li, R. Daytime precipitation identification scheme based on multiple cloud parameters retrieved from visible and infrared measurements. Sci. China Earth Sci. 2014, 57, 2112–2124. [Google Scholar] [CrossRef]
  56. Fu, Y. Cloud parameters retrieved by the bispectral reflectance algorithm and associated applications. J. Meteorol. Res. 2014, 28, 965–982. [Google Scholar] [CrossRef]
  57. Chen, F.; Sheng, S.; Bao, Z.; Wen, H.; Hua, L.; Paul, N.J.; Fu, Y. Precipitation Clouds Delineation Scheme in Tropical Cyclones and Its Validation Using Precipitation and Cloud Parameter Datasets from TRMM. J. Appl. Meteorol. Climatol. 2018, 57, 821–836. [Google Scholar] [CrossRef]
  58. Twomey, S.; Seton, K.J. Inferences of gross microphysical properties of clouds from spectral reflectance measurements. J. Atmos. Sci. 1980, 37, 1065–1069. [Google Scholar] [CrossRef]
  59. Nakajima, T.Y.; Nakajma, T. Wide-area determination of cloud microphysical properties from NOAA AVHRR measurements for FIRE and ASTEX regions. J. Atmos. Sci. 1995, 52, 4043–4059. [Google Scholar] [CrossRef]
  60. Fu, Q.; Liou, K.N.; Cribb, M.C.; Charlock, T.P.; Grossman, A. Multiple scattering parameterization in thermal infrared radiative transfer. J. Atmos. Sci. 1997, 54, 2799–2812. [Google Scholar] [CrossRef]
  61. Hansen, J.E.; Hovenier, J.W. The doubling method applied to multiple scattering of polarized light. J. Quant. Spectrosc. Radiat. Transf. 1971, 11, 809–812. [Google Scholar] [CrossRef]
  62. Stamnes, K.; Tsay, S.C.; Wiscombe, W.; Jayaweera, K. Numerically stable algorithm for discrete-ordinate-method radiative transfer in multiple scattering and emitting layered media. Appl. Opt. 1988, 27, 2502–2509. [Google Scholar] [CrossRef] [PubMed]
  63. Anderson, G.P.; Berk, A.; Chetwynd, J.H.; Harder, J.; Fontenla, J.M.; Shettle, E.P.; Gardner, J.A. Using the MODTRAN5 radiative transfer algorithm with NASA satellite data: AIRS and SORCE. In Algorithms and Technologies for Multispectral, Hyperspectral, and Ultraspectral Imagery XIII; International Society for Optics and Photonics: Bellingham, WA, USA, 2007; Volume 6565, p. 65651. [Google Scholar]
  64. Ricchiazzi, P.; Yang, S.; Gautier, C.; Sowle, D. SBDART: A research and teaching software tool for plane-parallel radiative transfer in the Earth’s atmosphere. Bull. Am. Meteorol. Soc. 1998, 79, 2101–2114. [Google Scholar] [CrossRef]
  65. Fu, Y.; Zhang, A.; Liu, Y. Characteristics of seasonal scale convective and stratiform precipitation in Asia based on measurements by TRMM precipitation radar. Acta Meteorol. Sin. 2008, 66, 730–746. [Google Scholar]
  66. Kalnay, E.; Kanamitsu, M.; Kistler, R.; Collins, W.; Deaven, D.; Gandin, L.; Zhu, Y. The NCEP/NCAR 40-year reanalysis project. Bull. Am. Meteorol. Soc. 1996, 77, 437–471. [Google Scholar] [CrossRef]
  67. Gao, W.; Sui, C.H.; Hu, Z. A study of macrophysical and microphysical properties of warm clouds over the Northern Hemisphere using CloudSat/CALIPSO data. J. Geophys. Res. Atmos. 2014, 119, 3268–3280. [Google Scholar] [CrossRef]
  68. Weller, R.A.; Anderson, S.P. Surface meteorology and air-sea fluxes in the western equatorial Pacific warm pool during the TOGA Coupled Ocean-Atmosphere Response Experiment. J. Clim. 1996, 9, 1959–1990. [Google Scholar] [CrossRef]
  69. Chen, S.S.; Houze, R.A. Diurnal variation and life-cycle of deep convective systems over the tropical Pacific warm pool. Q. J. R. Meteorol. Soc. 1997, 123, 357–388. [Google Scholar] [CrossRef]
  70. Vincent, D.G. The South Pacific convergence zone (SPCZ): A review. Mon. Weather Rev. 1994, 122, 1949–1970. [Google Scholar] [CrossRef]
  71. Nakajima, T.; King, M.D. Determination of the optical thickness and effective particle radius of clouds from reflected solar radiation measurements. Part I: Theory. J. Atmos. Sci. 1990, 47, 1878–1893. [Google Scholar] [CrossRef]
  72. King, M.D.; Kaufman, Y.J.; Menzel, W.P.; Tanre, D. Remote sensing of cloud, aerosol, and water vapor properties from the Moderate Resolution Imaging Spectrometer (MODIS). IEEE Trans. Geosci. Remote Sens. 1992, 30, 2–27. [Google Scholar] [CrossRef]
  73. Platnick, S.; Twomey, S. Determining the susceptibility of cloud albedo to changes in droplet concentration with the Advanced Very High Resolution Radiometer. J. Appl. Meteorol. 1994, 33, 334–347. [Google Scholar] [CrossRef]
  74. Fu, Y.; Pan, X.; Yang, Y.; Chen, F.; Liu, P. Climatological characteristics of summer precipitation over East Asia measured by TRMM PR: A review. J. Meteorol. Res. 2017, 31, 142–159. [Google Scholar] [CrossRef]
  75. Harris, G.N., Jr.; Bowman, K.P.; Shin, D.B. Comparison of freezing-level altitudes from the NCEP reanalysis with TRMM precipitation radar brightband data. J. Clim. 2000, 13, 4137–4148. [Google Scholar] [CrossRef]
  76. Zhang, Z.; Werner, F.; Cho, H.M.; Wind, G.; Platnick, S.; Ackerman, A.S.; Meyer, K. A framework based on 2-D Taylor expansion for quantifying the impacts of subpixel reflectance variance and covariance on cloud optical thickness and effective radius retrievals based on the bispectral method. J. Geophys. Res. Atmos. 2016, 121, 7007–7025. [Google Scholar] [CrossRef]
Figure 1. Distribution of number (left) and the probability distribution function (PDF) of the near-surface rain rate (RR) for warm precipitating cloud (WPC) (right) in the tropical Pacific Ocean (blue: extreme-light WPC; red: extreme-heavy WPC).
Atmosphere 09 00206 g001
Figure 2. Distribution of the frequency (colored) for (a) total, (b) extreme-light warm precipitating cloud (EL-WPC), and (c) extreme-heavy warm precipitating cloud (EH-WPC), as well as (d) their zonal means. Sea-surface temperature (SST) distribution (contours; units: K) is overlapped on (a).
Atmosphere 09 00206 g002
Figure 3. Distribution of the ratio (to total WPC) of (a) EL-WPC and (b) EH-WPC, as well as (c) their zonal means. The lower-tropospheric stability (contours; units: K) is overlapped on (a).
Atmosphere 09 00206 g003aAtmosphere 09 00206 g003b
Figure 4. Distribution of (left) RF1 (reflectivity in the 0.63 μm), (middle) BT4 (brightness temperature at 10.8 μm) and (right) echo-top height (H) for (ac) total-WPC, (df) EL-WPC and (gi) EH-WPC, along with (jl) their probability distribution functions.
Atmosphere 09 00206 g004aAtmosphere 09 00206 g004b
Figure 5. Distribution of (left) cloud effective radius (Re), (middle) cloud optical depth (Tau) and (right) liquid water path (LWP) for (ac) total, (df) EL-WPC and (gi) EH-WPC, along with (jl) their probability distribution functions.
Atmosphere 09 00206 g005
Figure 6. Distribution of mean (top) cloud effective radius, (middle) cloud optical depth, and (bottom) liquid water path in a two-dimensional diagram of BT4 (brightness temperature at 10.8 μm; x-axis) and H (echo-top height; y-axis), for (ac) total-WPC, (df) EL-WPC, (gi) medium, and (jl) EH-WPC (colored), overlapped with their joint probability density functions of BT4 and H (contours).
Atmosphere 09 00206 g006
Figure 7. Relationship of RR with (a) Re (cloud effective radius), (b) Tau (cloud optical depth) and (c) LWP, for EL-WPC (blue points), EH-WPC (red points) and medium (medium-WPC) (all except EL-WPC and EH-WPC, black points) warm precipitating cloud.
Atmosphere 09 00206 g007
Figure 8. The (a,d,g) shortwave radiative forcing (SWCRF), (b,e,h) longwave radiative forcing (LWCRF), and (c,f,i) total radiative forcing (TCRF), for (ac) total, (df) extreme-light, and (gi) extreme-heavy warm precipitating cloud.
Atmosphere 09 00206 g008
Figure 9. Relationships of (a) shortwave (SW), (b) longwave (LW) and (c) total (TW) net radiative forcing with cloud optical depth (Tau) for extreme-light (EL-WPC) and extreme-heavy (EH-WPC) warm precipitating cloud at top of atmosphere (TOA) and surface (SFC).
Atmosphere 09 00206 g009
Table 1. Coefficients for the relationships between the RR and Re/Tau/ LWP.
Coefficienta1b1Re0RR0
0.3930.98115.4882.660
Coefficienta2b2c2d2
18.9340.25751.81526.597
Coefficienta3b3c3d3
195.7450.252345.80721.833

