1. Introduction
The Solomon Islands (Sis) is a South Pacific nation where tropical cyclones (TCs) frequently occur. The nation’s history documents several TCs that have devastated the region [
1]; people have lost their properties and the economy has been severely damaged due to extreme winds, torrential rain, and storm surges. Accurate information on TCs is critically important to the public because the SIs consists of many small, scattered islands, and people often travel from one to another by handcrafted small ships.
Considering the severity of disasters in the region, there is great concern over the effects that climate change and global warming are having on the genesis and intensity of TCs. Recent studies have indicated that the increasing number of intense TCs forming in the southwestern Pacific (from 1990 to 2004, compared to 1975–1989) may be related to increasing sea surface temperatures (SSTs) in the region [
2,
3]. In addition to the climatology of TCs, it is also important to consider various relevant natural variabilities. For example, Vincent et al. (2009) revealed that the interannual variability of the South Pacific Convergence Zone (SPCZ) [
4], which is strongly related to El Niño Southern Oscillation (ENSO), might have a significant influence on TC genesis in the South Pacific. Chand and Walsh (2010) examined the impact of the Madden–Julian Oscillation (MJO) on TC activities over Fiji [
5]. Klotzbach (2014) showed that TCs in the South Pacific basin are also influenced by convective enhancement in phases 6–8 of the MJO [
6]. Iizuka and Matsuura (2012) investigated similar intraseasonal and seasonal scale features impacting TCs over the Southern Hemisphere [
7]. They concluded that in El Niño (La Niña) years, the natural frequency of TCs increases (decreases) in the northeastern quadrant of the southwestern Pacific (the location of the SIs). The notable difference seen in cyclone displacement and frequency between El Niño and La Niña years can be explained by differing SSTs and large-scale environmental condition anomalies associated with ENSO [
8].
The abovementioned studies generally address the characteristics of the South Pacific at the basin scale, but for the purposes of decision making for the SIs, it is important to make sure that these tendencies are also robust for a nationwide scale. However, the statistical characteristics of TCs around the SIs have never been investigated to the authors’ knowledge. Therefore, it is important to investigate TC activity over the SIs. The main objectives of this study are (1) to clarify the long-term trend of TCs in the region and (2) to examine the modulation of TC genesis and intensity by ENSO and MJO in terms of large-scale environmental conditions (e.g., SST, low-level relative vorticity, vertical wind shear, upper level divergence, and outgoing longwave radiation (OLR)). This work will contribute to disaster prevention and mitigation in the SIs and surrounding countries. The structure of this paper is as follows:
Section 2 describes the data and methodology,
Section 3 describes long-term behaviour, and
Section 4 describes the modulation of TCs by MJO and ENSO, as well as by physical parameters. Finally,
Section 5 is comprised of a conclusion summarizing the findings of the study.
2. Data and Methodology
This study is based on the Southern Hemisphere TCs from January 1986 to December 2016. In this work, the term “TC season” refers to the period from 1 November of a given year to 30 April of the subsequent year. The best track dataset for TCs used in this study is the same as that used by the Solomon Islands Meteorological Services (SIMS). For this dataset, the Fiji Meteorological Service (FMS) serves as the Regional Specialized Meteorological Centre (RSMC) Nadi, and the Bureau of Meteorology (BoM) serves as the Tropical Cyclone Warning Centre (TCWC) Brisbane. When a TC centre was located to the east (west) of 160° E, the RSMC Nadi (TCWC Brisbane) dataset was used. This split follows the framework of World Weather Watch program of the World Meteorological organization. We used data from TCWC Wellington instead of RSMC Nadi until the 1991/1992 TC season due to data availability. We obtained these datasets from the International Best Track Archive for Climate Stewardship known as IBTrACS [
9].
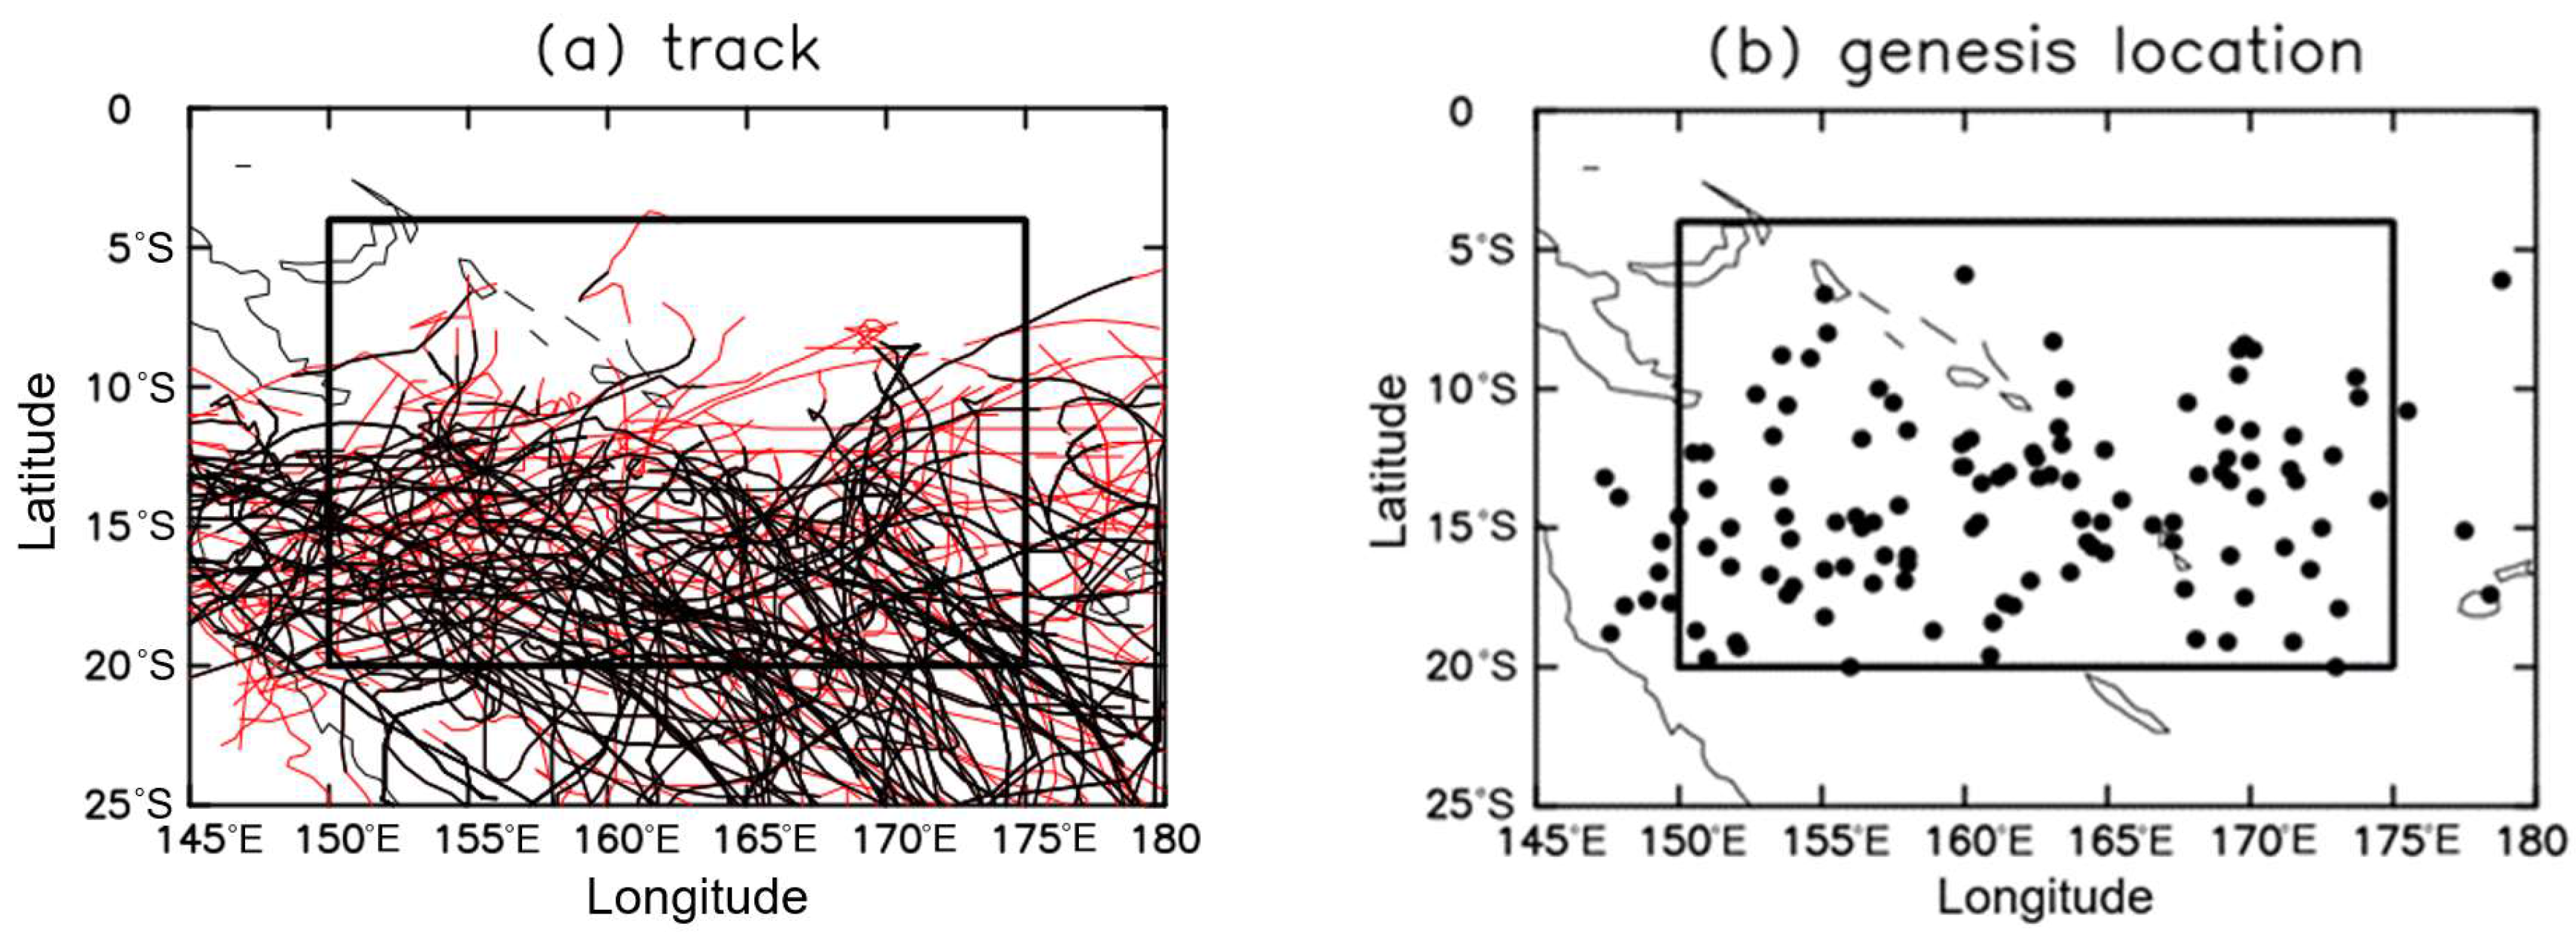
The study domain is defined as the area between 4–20° S and 150–175° E (
Figure 1). Note that this domain covers not only the nation of the SIs but also some regions in the south of the national border of the SIs. The maximum wind speeds of TCs Nina (1992), Sarah (1994), Theodore (1994), and Thomas (1994) were not used in this study because they were not recorded by RSMC Nadi. The best track data record has a time interval of six hours and the maximum wind speed (Vmax) record represents the maximum value of a 10-min sustained wind. For this study, a TC was defined as a tropical storm that achieved Vmax of ≥34 knots (~17.0 m/s). TC genesis was defined at the first appearance of a TC in the best track record.
In total, 126 TCs were identified for this study (
Figure 1). Among them, only 13% (17 TCs) passed over the lateral boundary of the study domain as they were generated outside the study domain (
Figure 1b). The number of TC genesis was 14, 64, and 48 in the latitudes of 4–10° S, 10–15° S, and 15–20° S, respectively. While 83 TCs achieved their maximum intensity in the latitude of 15–20° S, only 5 and 38 TCs achieved their maximum intensity in the latitudes of 4–10° S and 10–15° S. It shows that a TC tends to become stronger after travelling southward like TC Pam (2015).
The phases of the daily MJO and monthly ENSO indexes were obtained from BoM [
10,
11]. The air temperature and zonal and meridional wind datasets were taken from Reanalysis 1 of National Centre for Environmental Prediction (NCEP) [
12], same as in Matyas (2015) [
13]. The 850 hPa relative vorticities and 200 hPa relative divergences were calculated from the wind data. SST and OLR were obtained from the National Oceanic and Atmospheric Administration (NOAA)’s OI SST V2 High Resolution Dataset [
14] and Interpolated OLR Dataset [
15], respectively.
3. Long-Term Trend
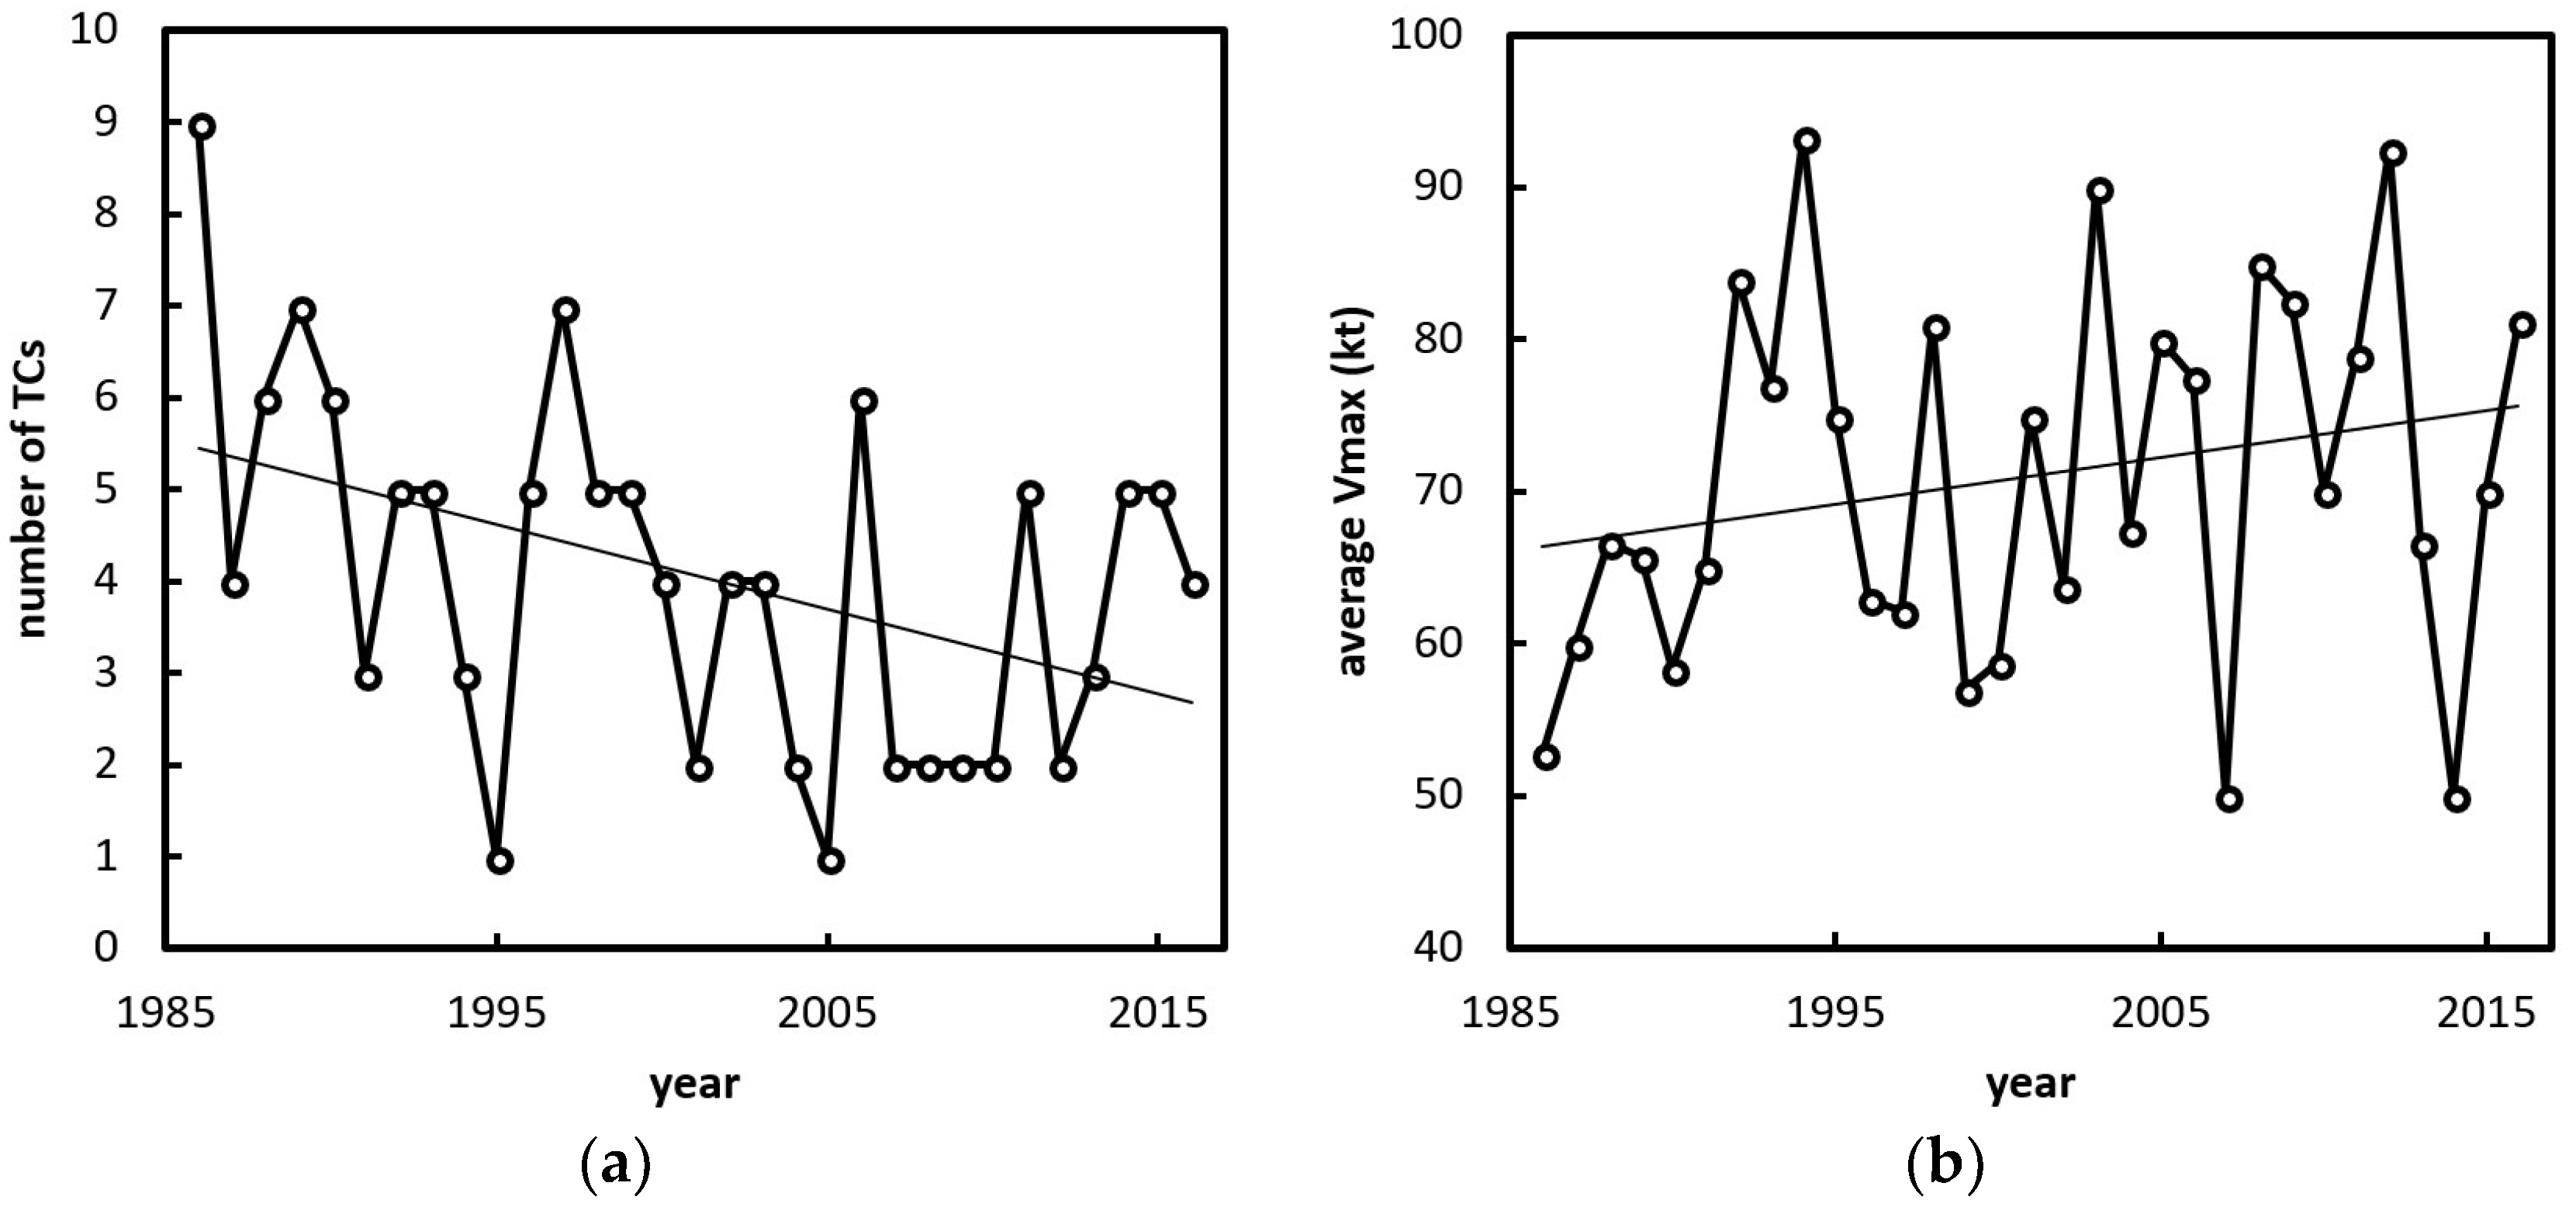
Analysing the long-term trends of the number of TCs (NTCs) and of Vmax averaged over the time in this domain shows that the frequency of TCs has been decreasing (
Figure 2a) over the SIs, while the average Vmax has increased (
Figure 2b). The number of TCs has decreased at a rate of −0.09 per year. In contrast, the average wind speed has increased at a rate of 0.31 kt per year. The decreasing trend in NTC was statistically significant at the 95% confidence level based on a two-tailed
t-test, while the increasing trend in the TC intensity was not.
The decreasing trend has been previously identified, and Sugi (2012) [
16] argued that significant warming of the upper troposphere strengthens atmospheric stability, and that reduction in the upward mass flux associated with the convective updrafts leads to a reduction in global TC frequency. However, it is important to confirm that this is true for the SIs because global TC tendencies are not necessarily the same as regional TC tendencies [
17].
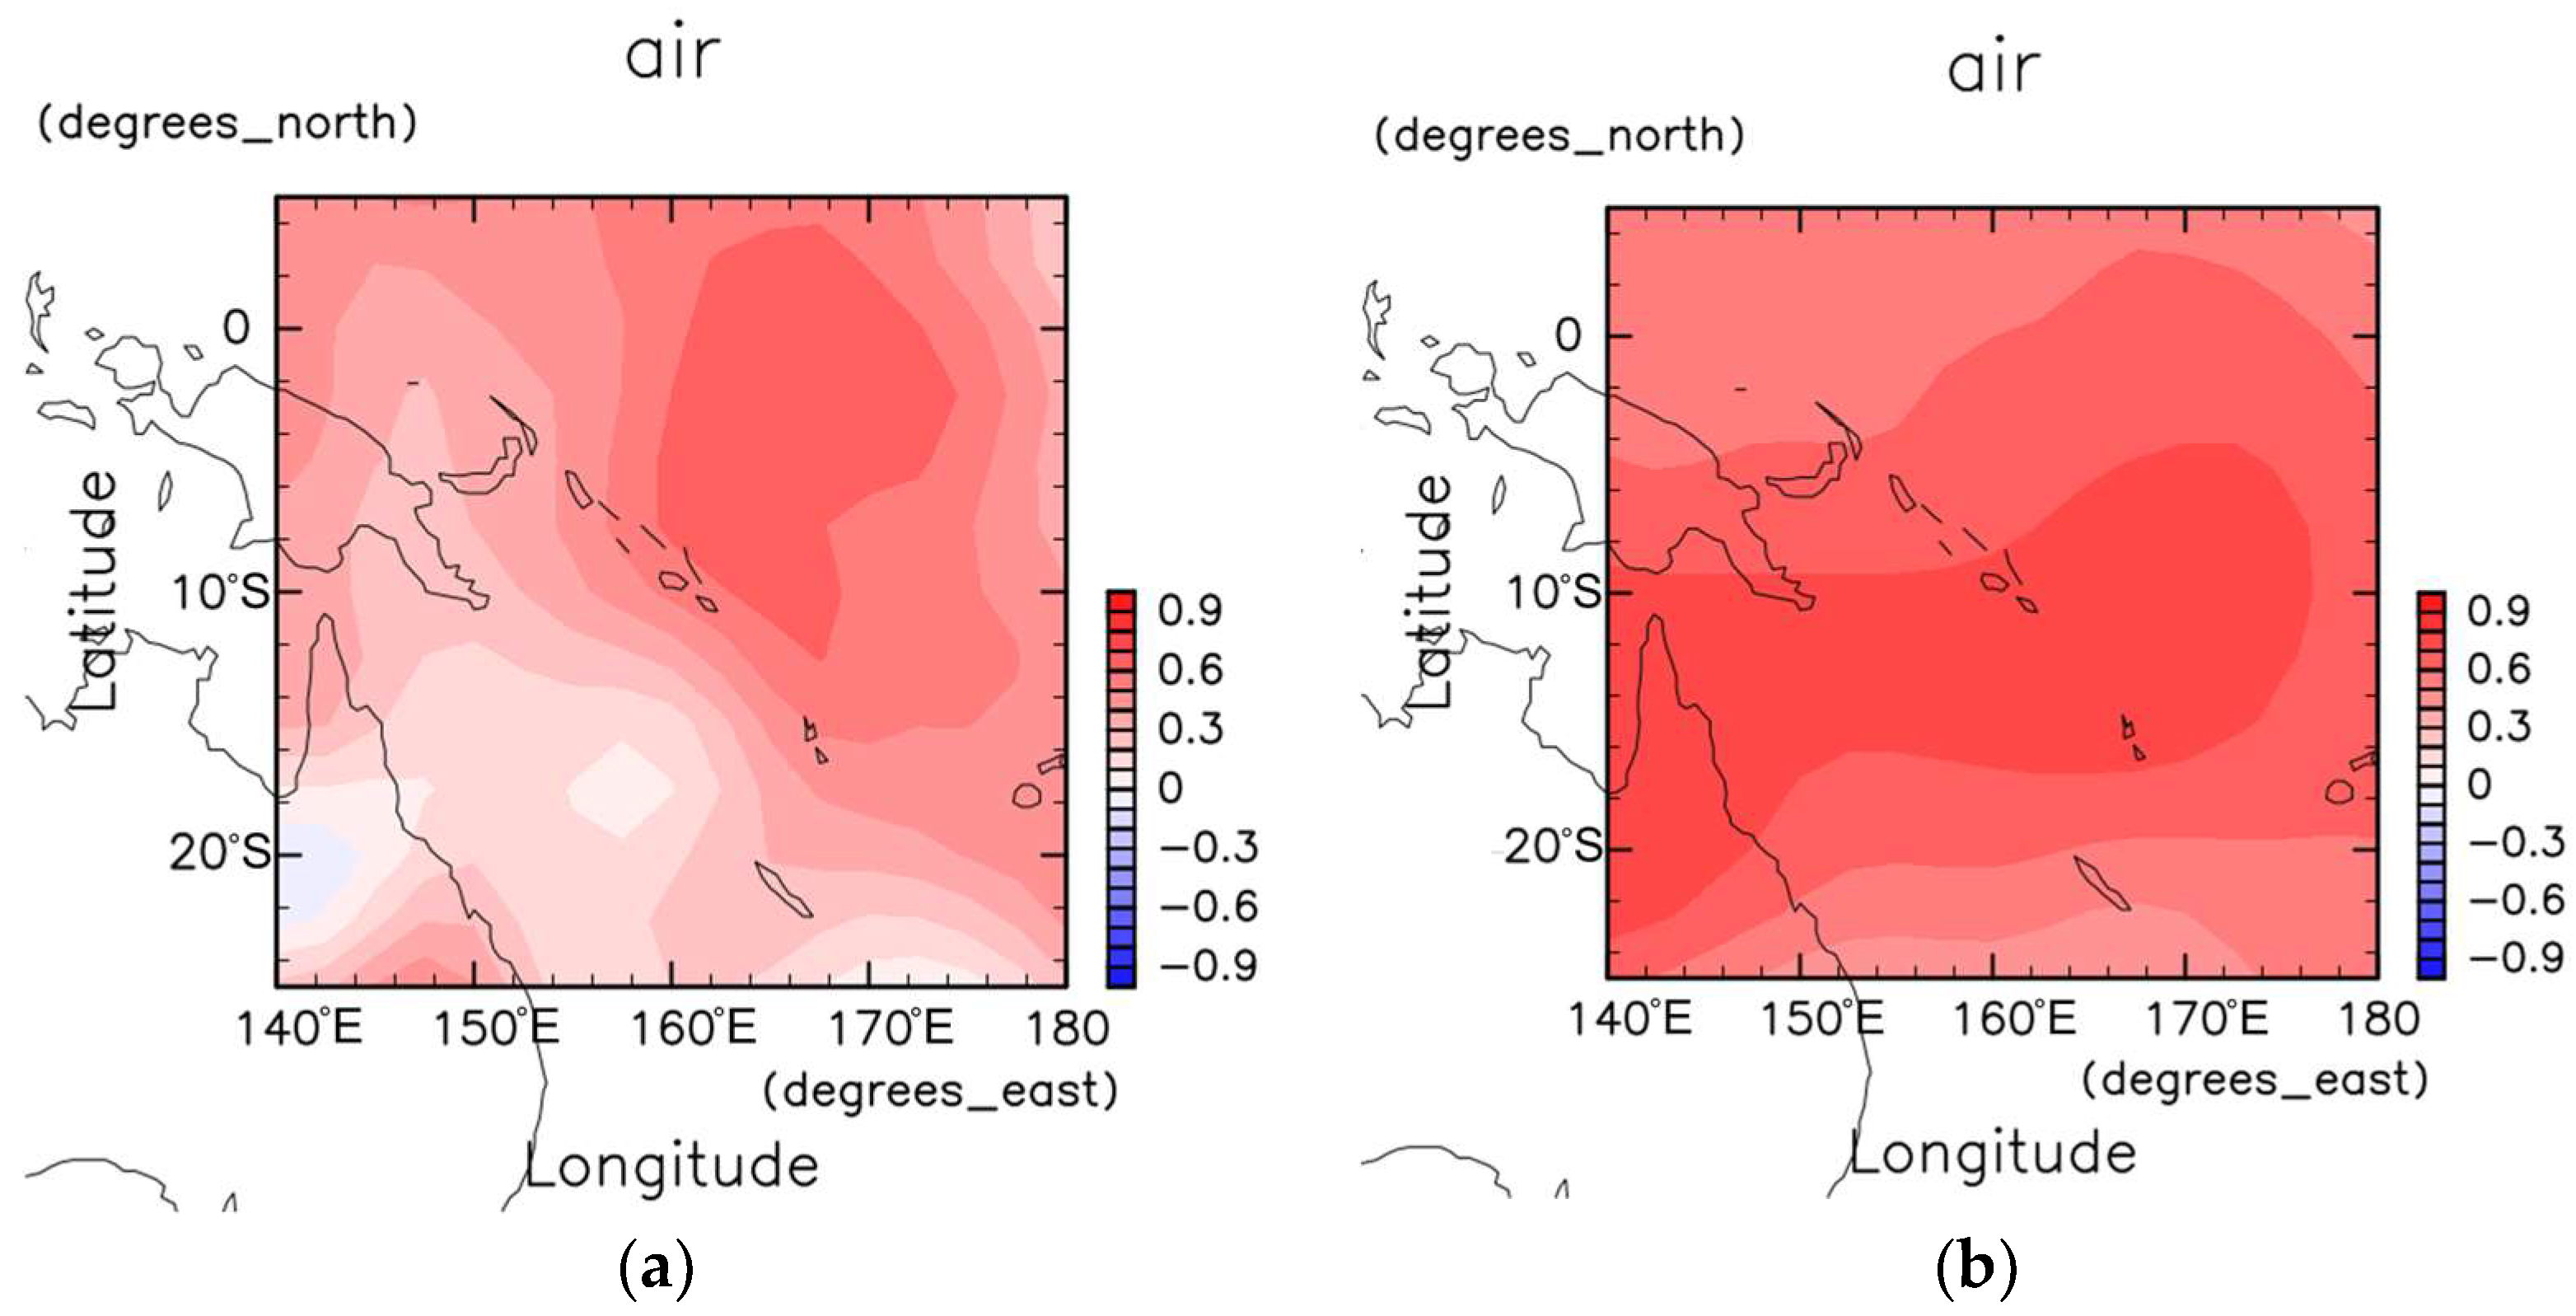
Therefore, changes in the average temperature for TC seasons 2000/2001–2015/2016 compared to TC seasons 1986/1987–2000/2001 were calculated at 850 hPa and 300 hPa (
Figure 3a,b, respectively). The upper tropospheric temperature increase is more significant than the lower tropospheric temperature increase. Particularly, the values south of 10° S indicate enhanced static stability in recent years. This may suppress deep convection, an observation that is consistent with studies addressing global NTCs. Note that there are some uncertainties in the quality of the upper tropospheric temperature in the NCEP Reanalysis 1 [
18]. The comparison with other datasets (e.g., the European Centre for Medium-Range Weather Forecasts Interim Re-Analysis (ERA-Interim) and the Japanese 55-year Reanalysis (JRA-55)) may help investigate the robustness of the large-scale features, which is left for future works.
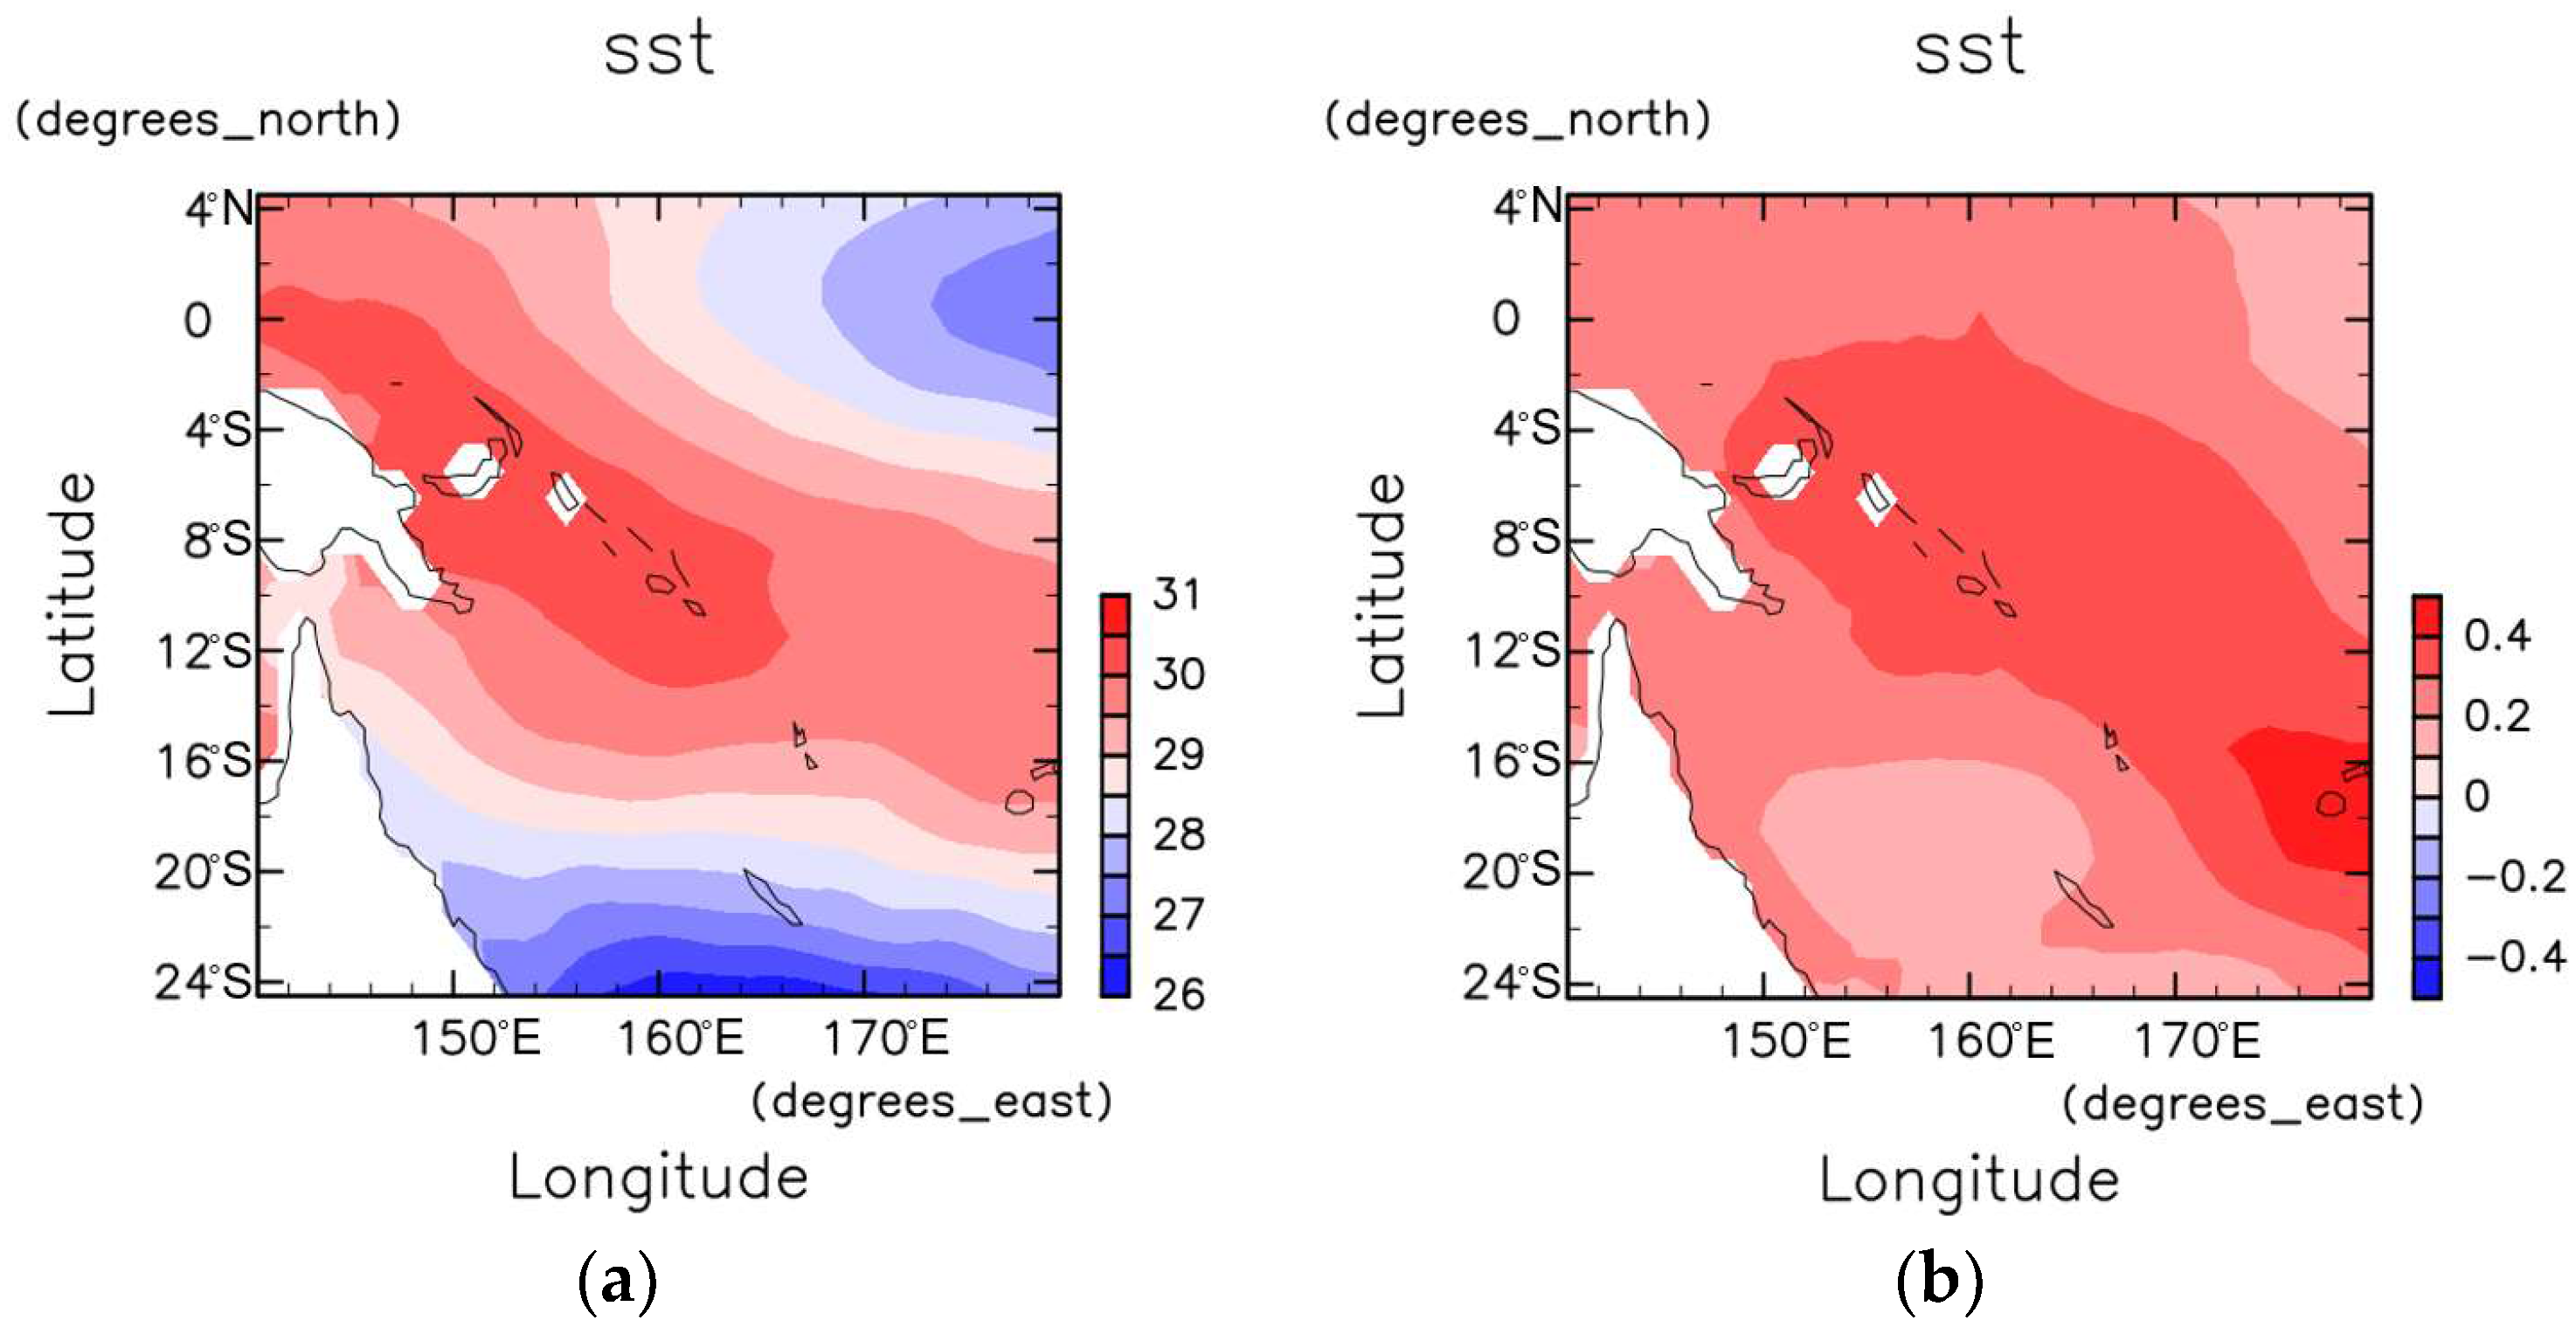
As for the TC intensity, the 15-year averaged SST during TC seasons 2000/2001–2015/2016 in the study domain (4–20° S and 150–175° E) is generally higher than the surrounding region and the highest value appears along the chain of islands from northwest to southeast (
Figure 4a). Compared to the first 15-season (1986/1987–2000/2001), it appears that average SSTs have increased in the period 2001–2015 throughout the region (
Figure 4b). This SST warming may have provided the thermodynamically favourable conditions for the observed increase in TC intensity. This interpretation is in line with previous studies [
2,
3,
19].
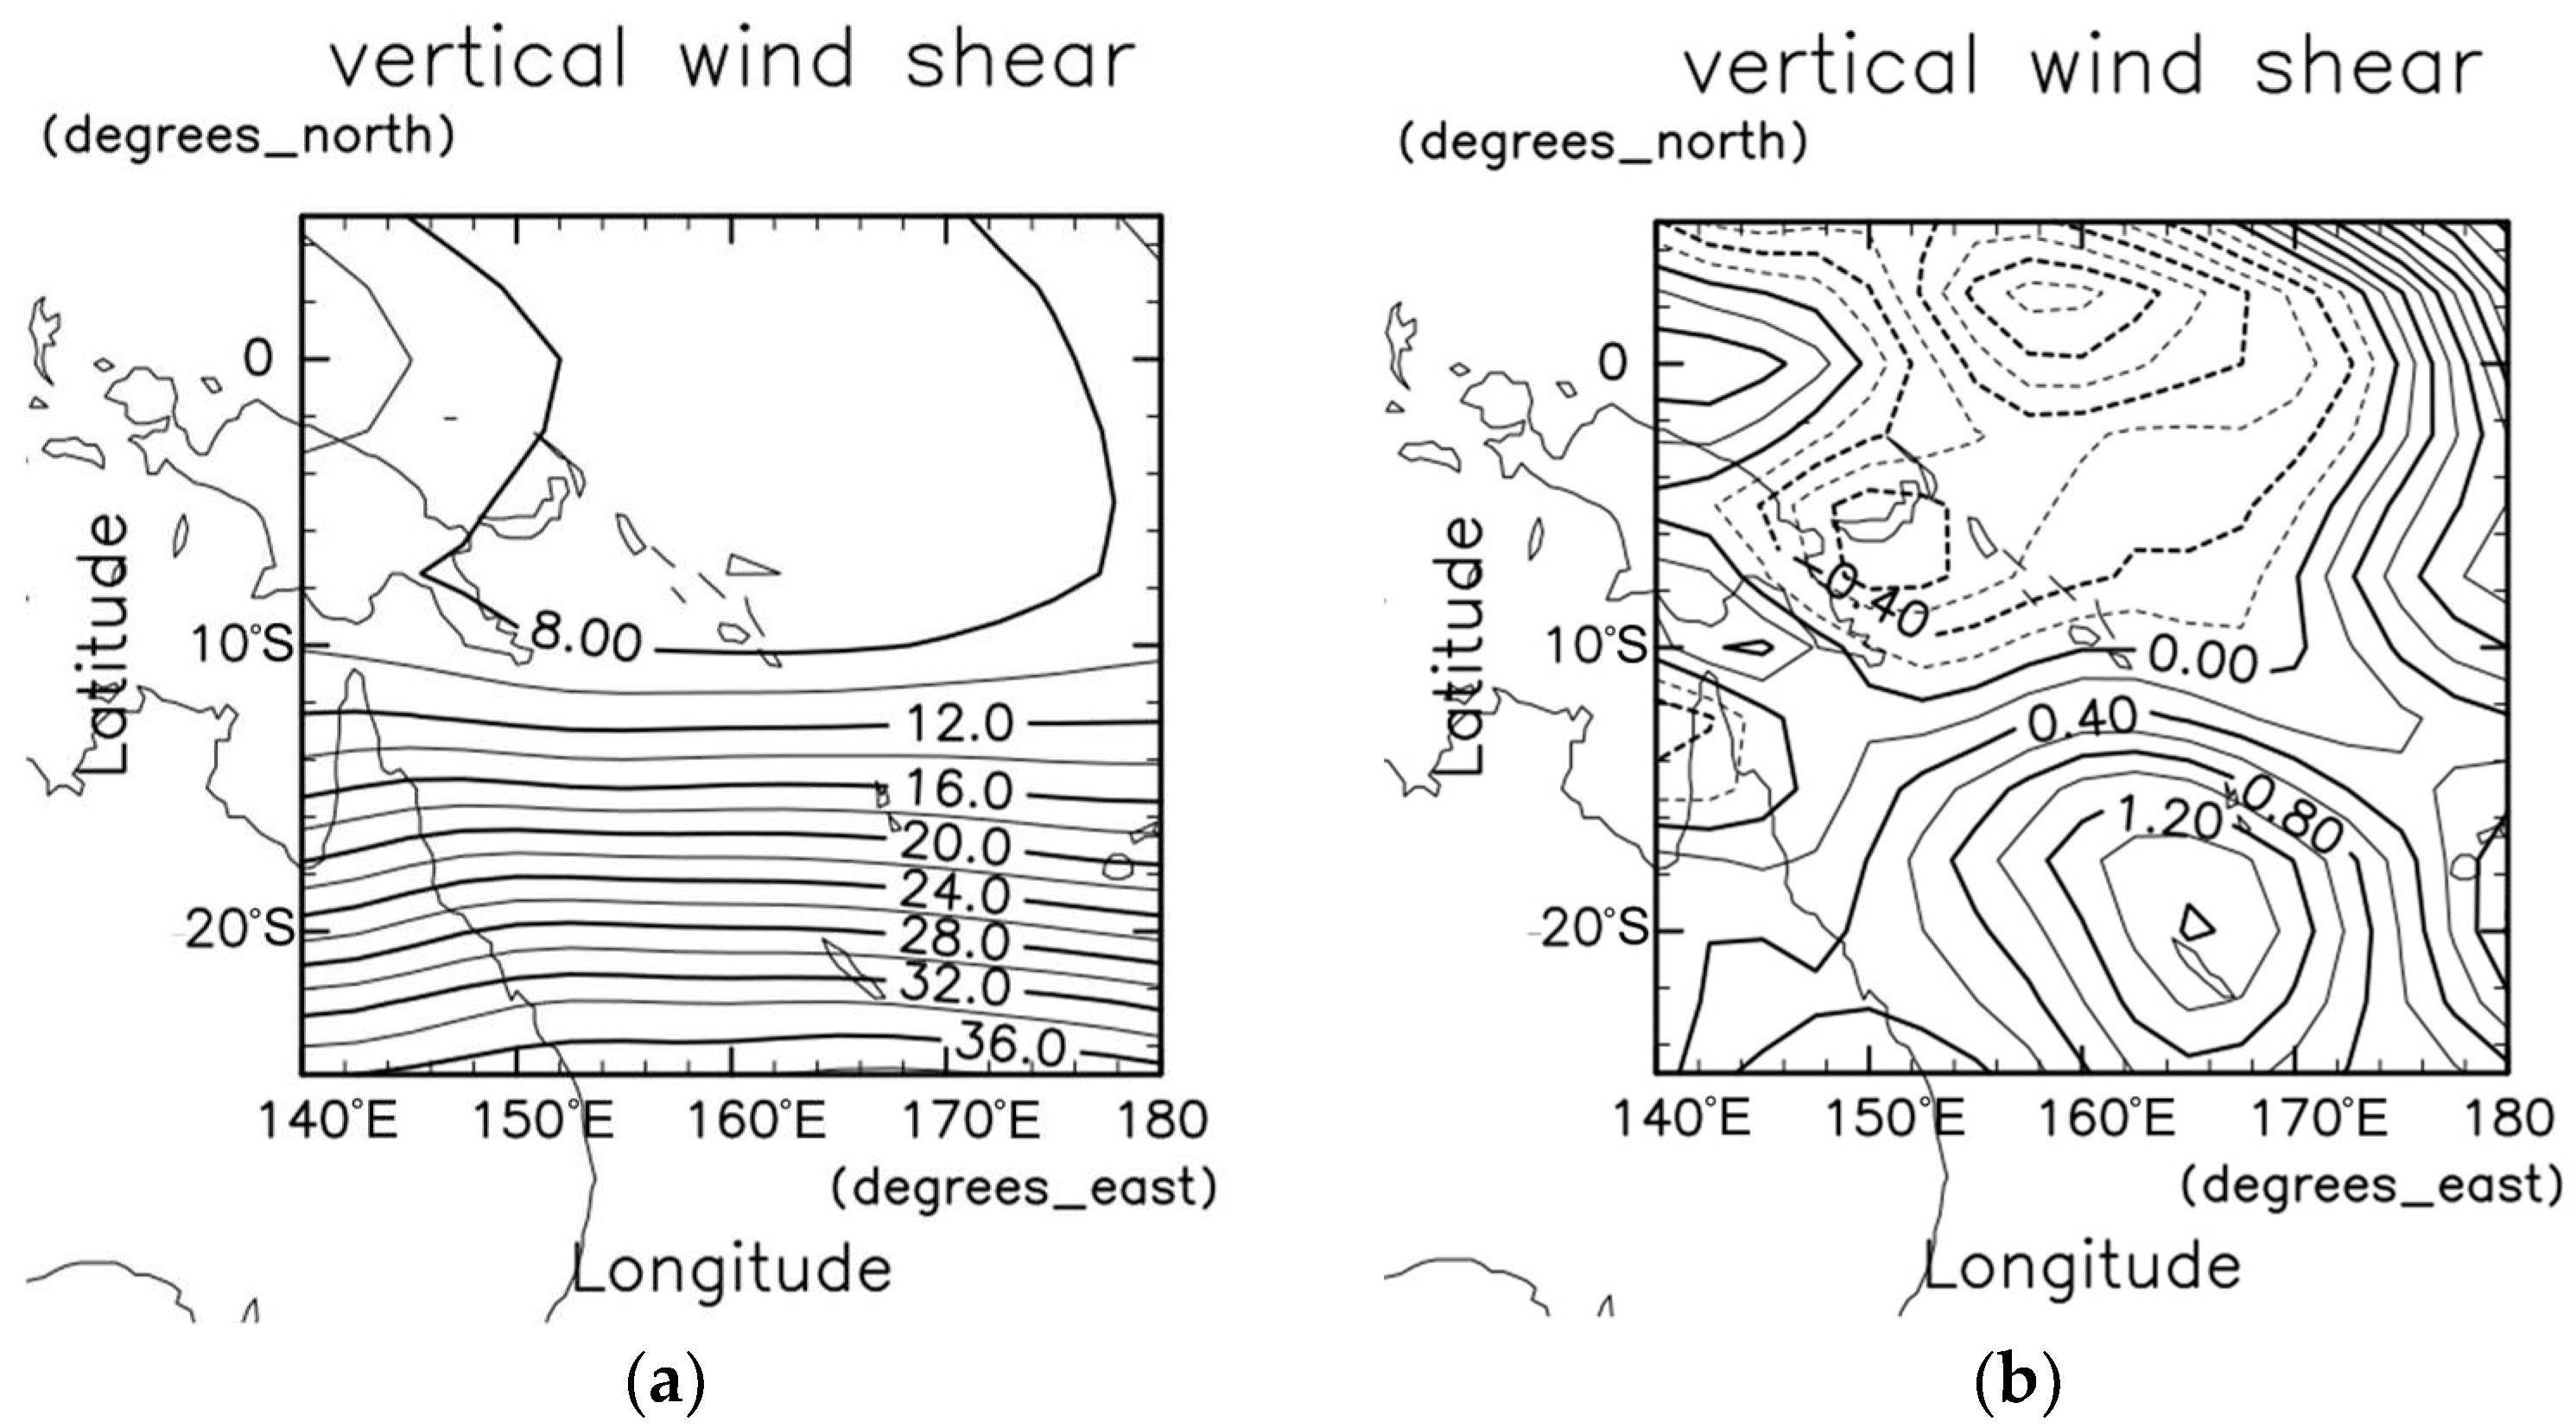
Another important factor is the vertical wind shear because it generally suppresses TC genesis and intensity. Here, vertical wind shear is defined as the magnitude of deep-layer horizontal wind vector difference between 850 hPa and 200 hPa. The vertical wind shear averaged over TC seasons 2001/2002–2015/2016 is less than 10 m s
−1 north of 10° S and becomes stronger towards the south due to the influence of the mid-latitude westerly jet (
Figure 5a). Studying the long-term change in vertical wind shear over the study domain shows that a slight weakening (increasing) is seen north (south) of 10° S in TC seasons 2001/2002–2015/2016, compared to 1986/1987–2000/2001 (
Figure 5b). Therefore, vertical wind shear has provided unfavourable conditions for TC genesis and intensification in the southern part of the SI region in recent years.
4. Modulation of TCs by MJO and ENSO
4.1. MJO-TC Relationship
The MJO is a large-scale mode of intraseasonal atmospheric variability that propagates eastward along the equatorial region with a period of ~30–60 days [
7]. It is also widely recognised as an important mode for TC genesis. During the passage of an active phase of the MJO, with increased convective activities, large-scale dynamic and thermodynamic fields become more favourable for TC genesis. The deep convection tends to be located in the Western Hemisphere in phase 1, in the Indian Ocean in phases 2–3, over the maritime continent in phases 4–5, in the western Pacific (which includes the SIs) in phases 6–7, and in Africa in phase 8 [
20].
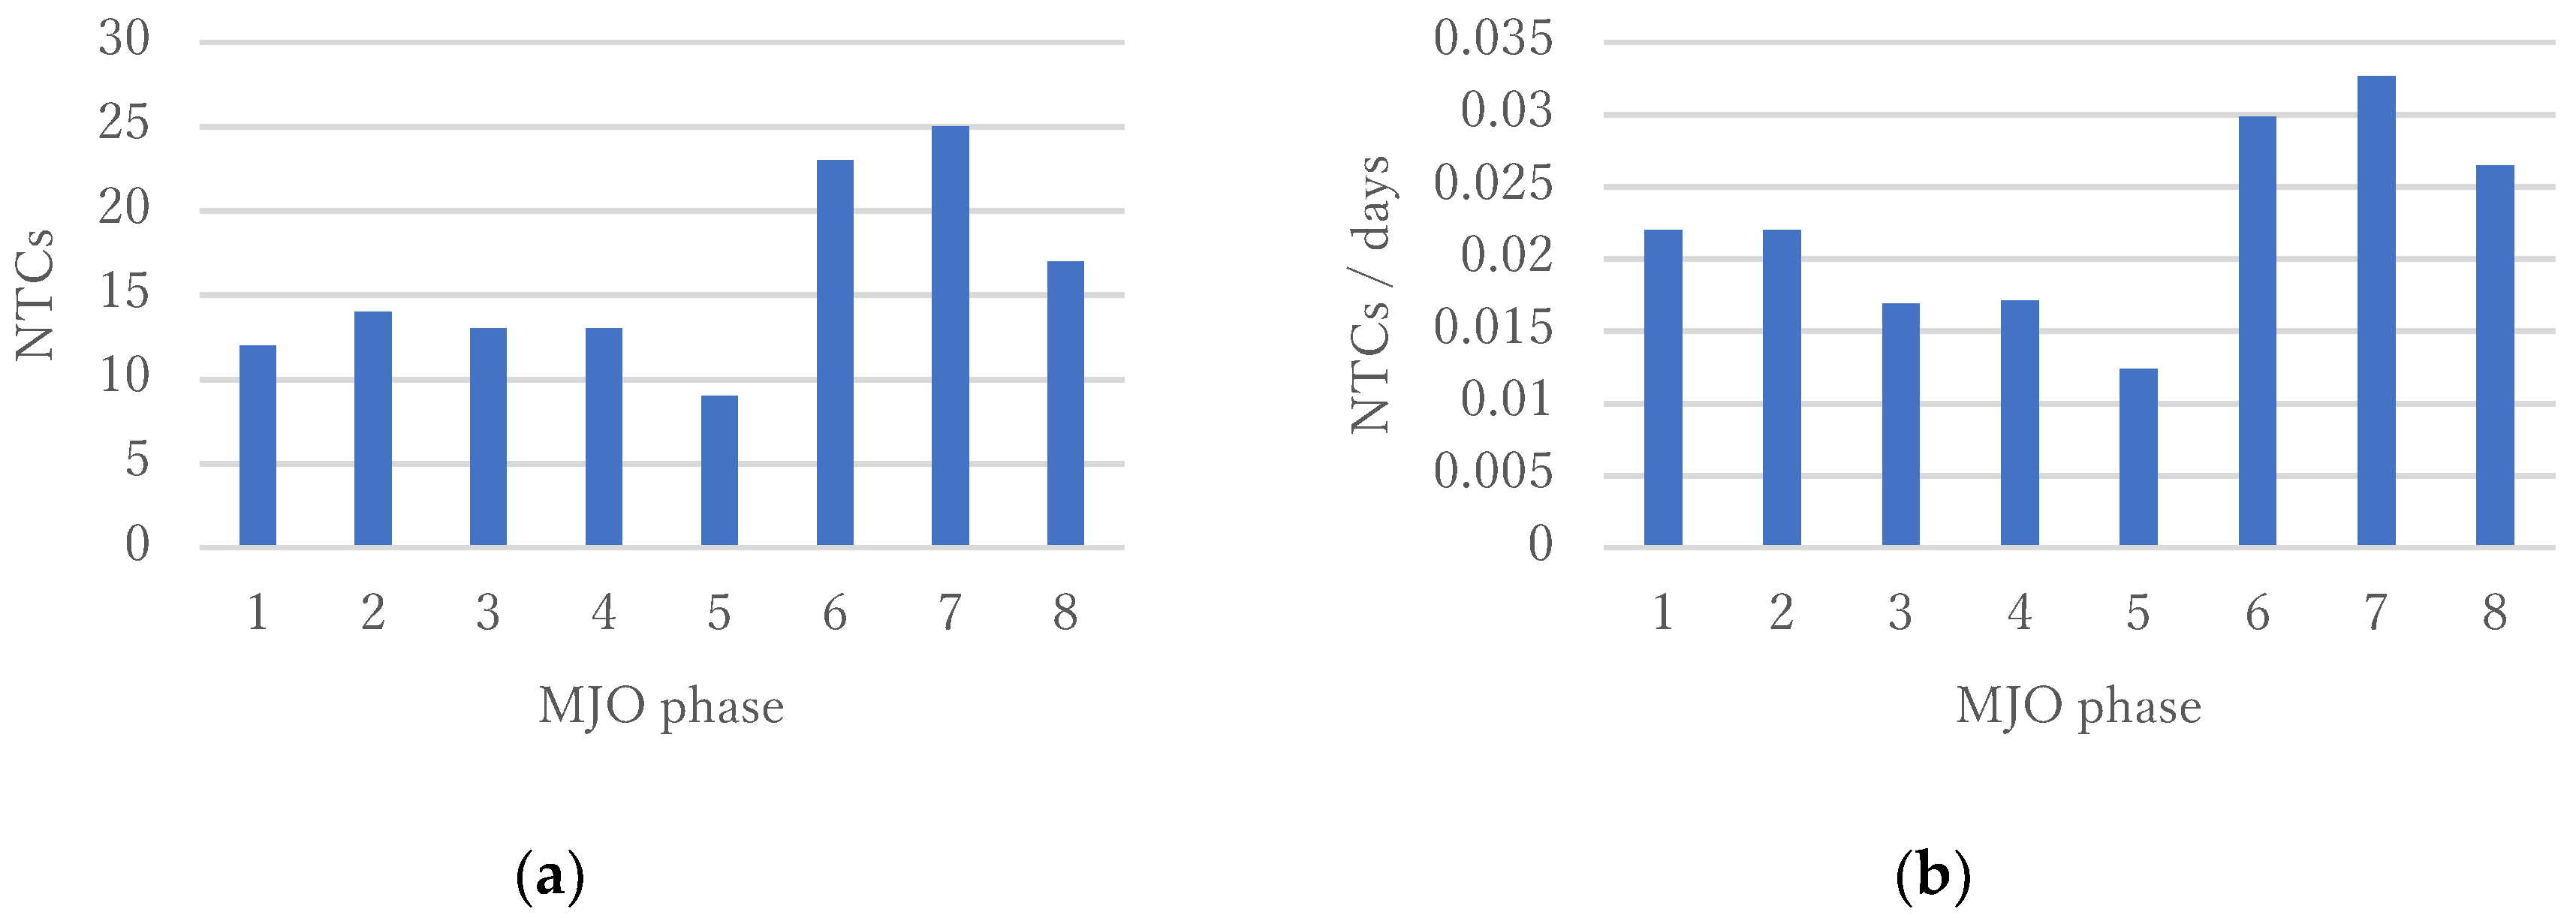
Stratifying the frequency of TCs over the 30-year study period (TC seasons 1986/1987–2015/2016) according to the phase of the MJO shows that the most TCs were generated in phases 6–8, with the largest number appearing in phase 7 (
Figure 6). Klotzbach (2014) indicated that TC activity in the South Pacific is associated with convective enhancement in phases 6–8 [
7]. According to the daily chart of Wheeler and Hendon (2004), phases 6 and 7 are associated with convective enhancement in the south Pacific [
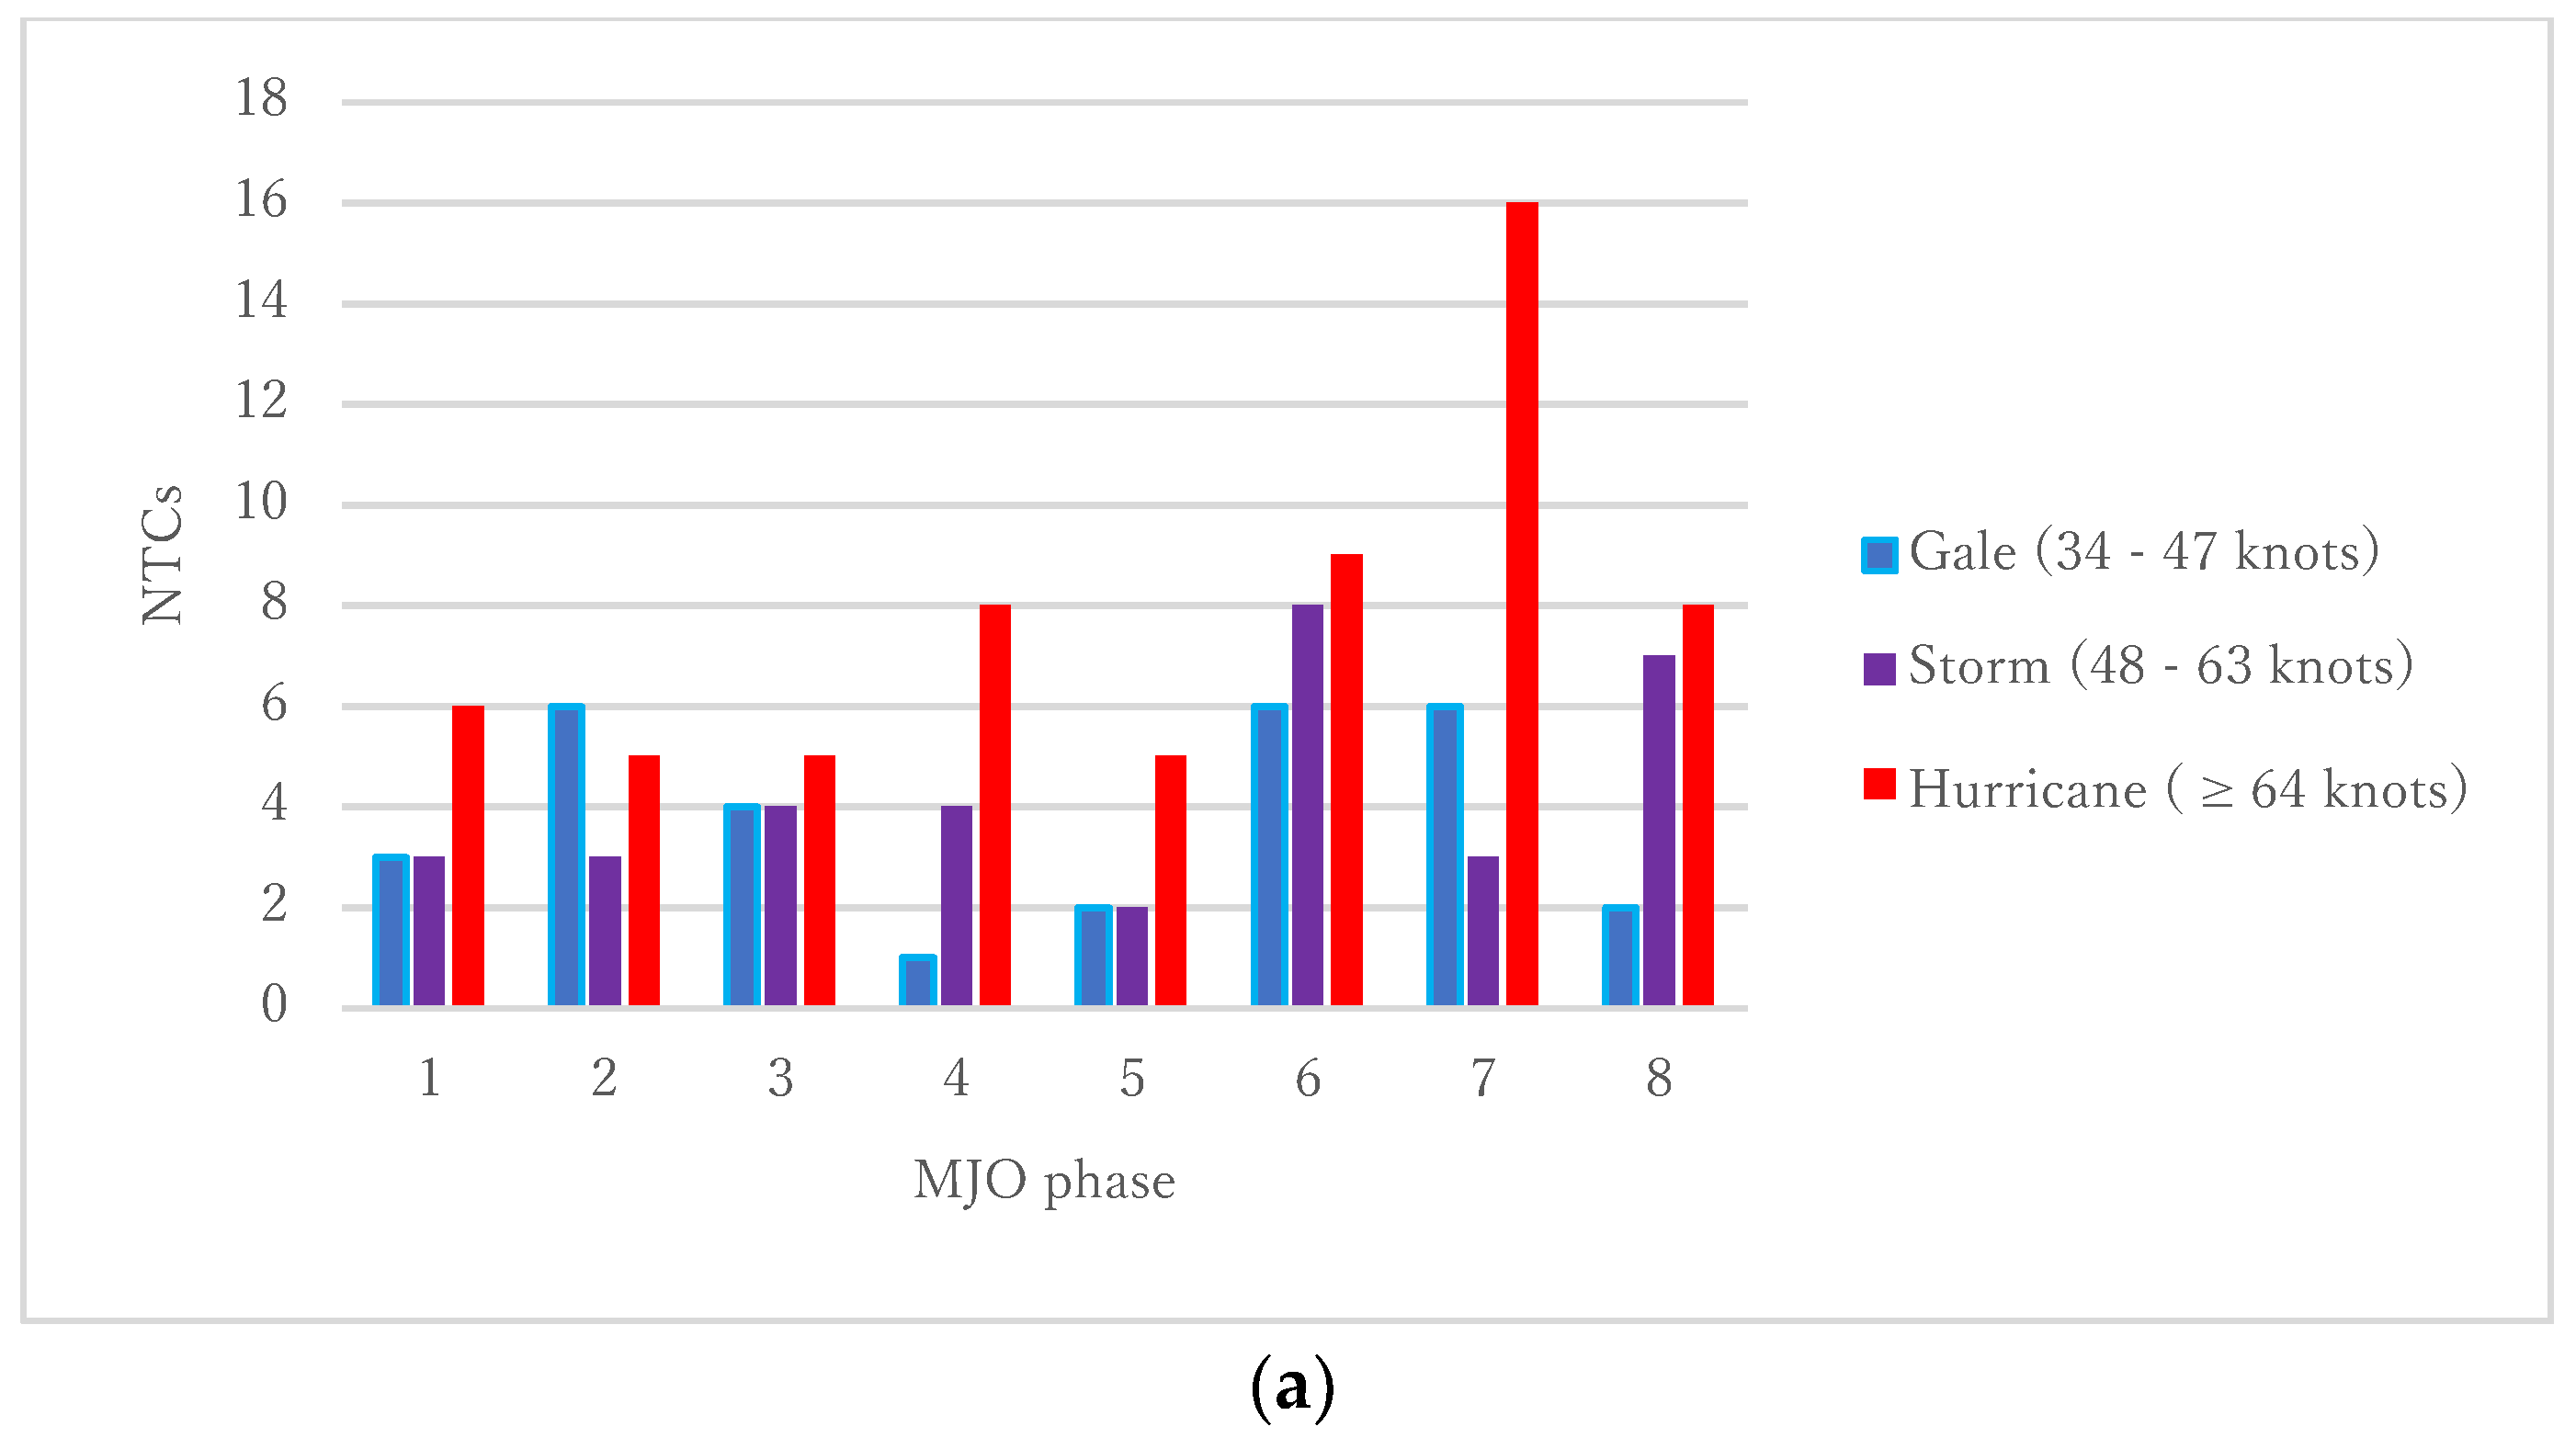
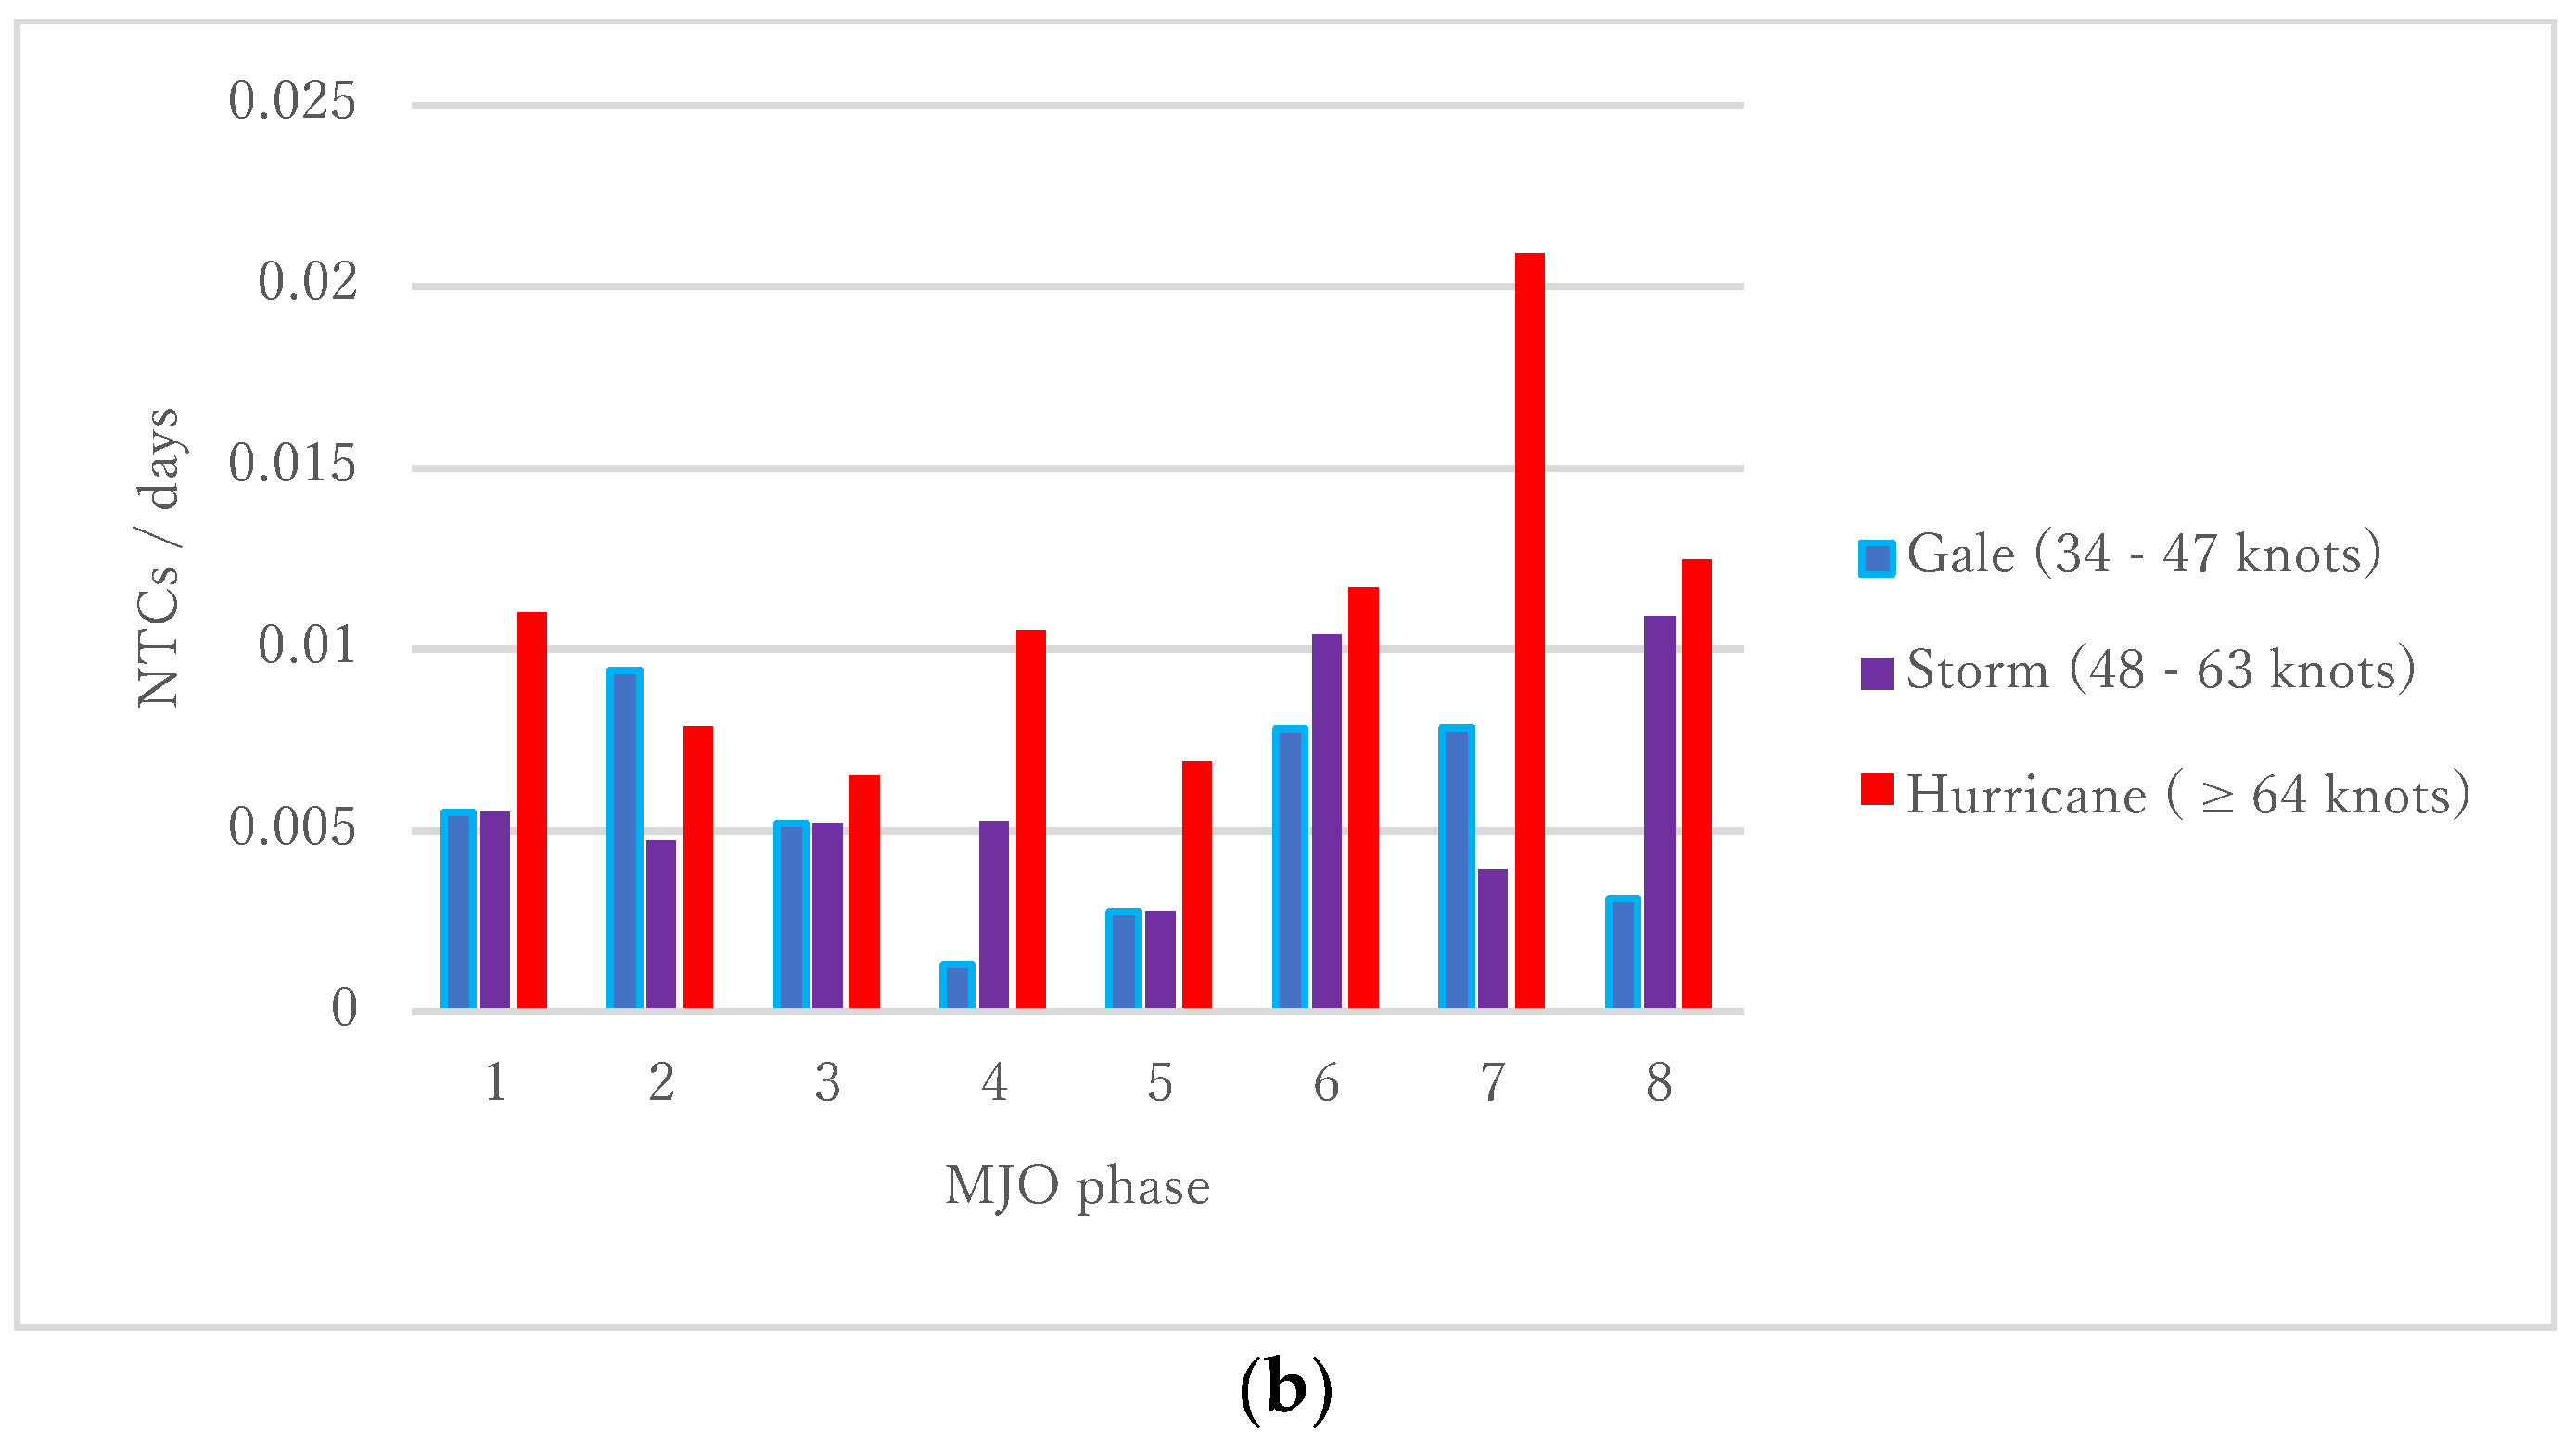
20]. It should be noted that very intense TCs can be generated even in phases 1–5. Very intense TCs (hurricanes) were generated at least five times in each phase, although they occur most frequently in phases 7 (
Figure 7).
To clarify the environmental factors that can explain the variability, divergence at 200 hPa, vertical wind shear, SST, OLR, and relative vorticity at 850 hPa were all calculated averaged over the study area. The large-scale environmental variables that are favourable for TC genesis and intensification in the Southern Hemisphere are (1) large upper tropospheric divergence, (2) weaker vertical wind shear, (3) higher SST, (4) lower OLR, and (5) stronger low-level negative vorticity (clockwise circulation) (
Table 1). To check if the difference from the mean is statistically significant, a two-tail
t-test was applied to daily dataset. The sample number was replaced by the effective sample number to account for the persistence of sequential data by using a lag-1 positive autocorrelation coefficient, similar to the method of Ito et al. (2016) [
21].
There are several important differences among the different phases of MJO (
Table 1). The high number of genesis and strong TCs in phases 6 and 7 can be explained by high upper tropospheric divergence, smaller vertical wind shear, low OLR, and a high negative vorticity field (
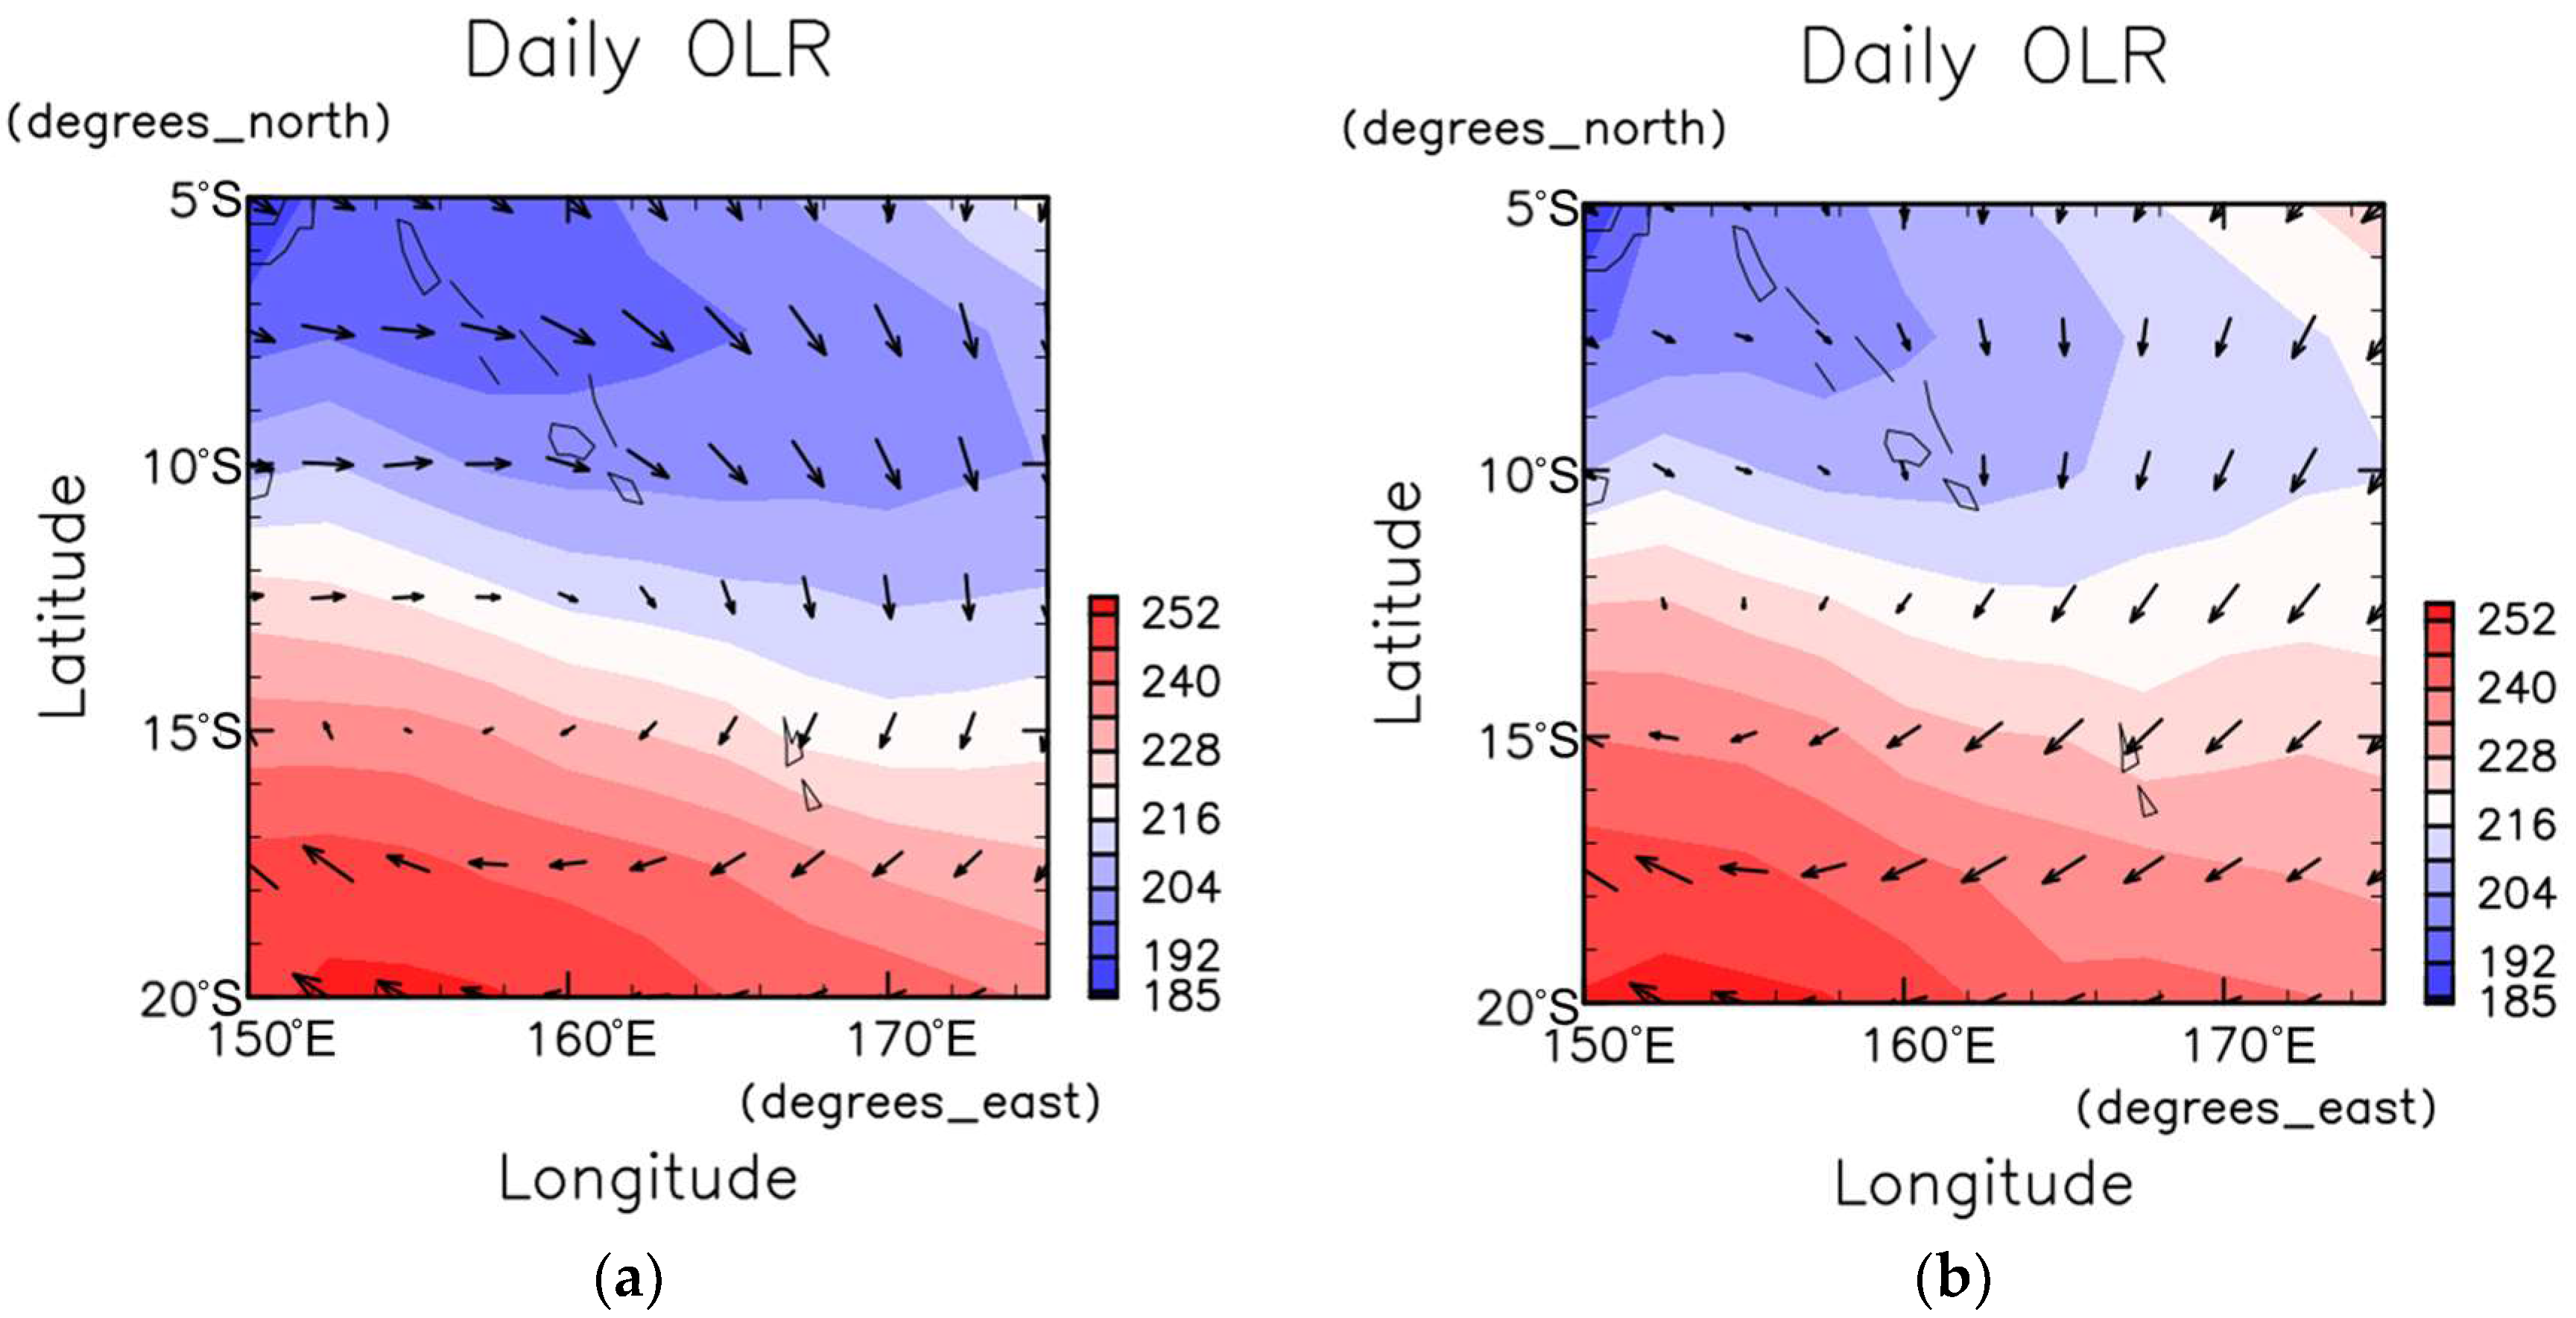
Table 1). In general, the OLR becomes lower along the chain of islands, and the horizontal wind field at 850 hPa flows in a clockwise circulation (
Figure 8). In contrast, phases 1–3 are characterized by the weaker upper tropospheric divergence, higher OLR, and weaker negative relative vorticity at 850 hPa (
Table 1). These values are generally consistent with lower frequency of TC genesis and lower TC intensity. Although there are some differences of SST between each phase, the largest difference was only 0.25 K. It is interesting that the number of TCs was small in phase 5. On closer inspection, MJO phase 5 is characterized by a low OLR region centred at 150° E on the equator preceding the major low OLR region at 120° E and 15° S, and the horizontal wind vector exhibits anticlockwise circulation over the SI region (see
Figure 8 of Wheeler and Hendon [
20]). The negative vorticity is relatively weak in phase 5. This weak negative vorticity could indicate that low-level circulation is not favourable for the initiation of the vortex in phase 5. It may result in the smaller number of TCs in the study domain. Care should be taken when making interpretations because only 126 TCs were investigated and the environmental conditions between phases 4 and 5 are similar to each other; in other words, the smaller NTCs in phase 5 might be merely a statistical artefact.
4.2. ENSO-TC Relationship
ENSO is regarded as the most prominent atmospheric and oceanic source of interannual variability and has a longer timescale than MJO [
22]. Several previous studies have revealed that ENSO has influenced of TC activity in most basins at an interannual variability [
6]. Lander (1994) also highlighted that the displacements of TC genesis location is robustly associated with ENSO [
23]. Therefore, the dataset was classified according to the three categories of ENSO: El Niño, La Niña, and neutral periods.
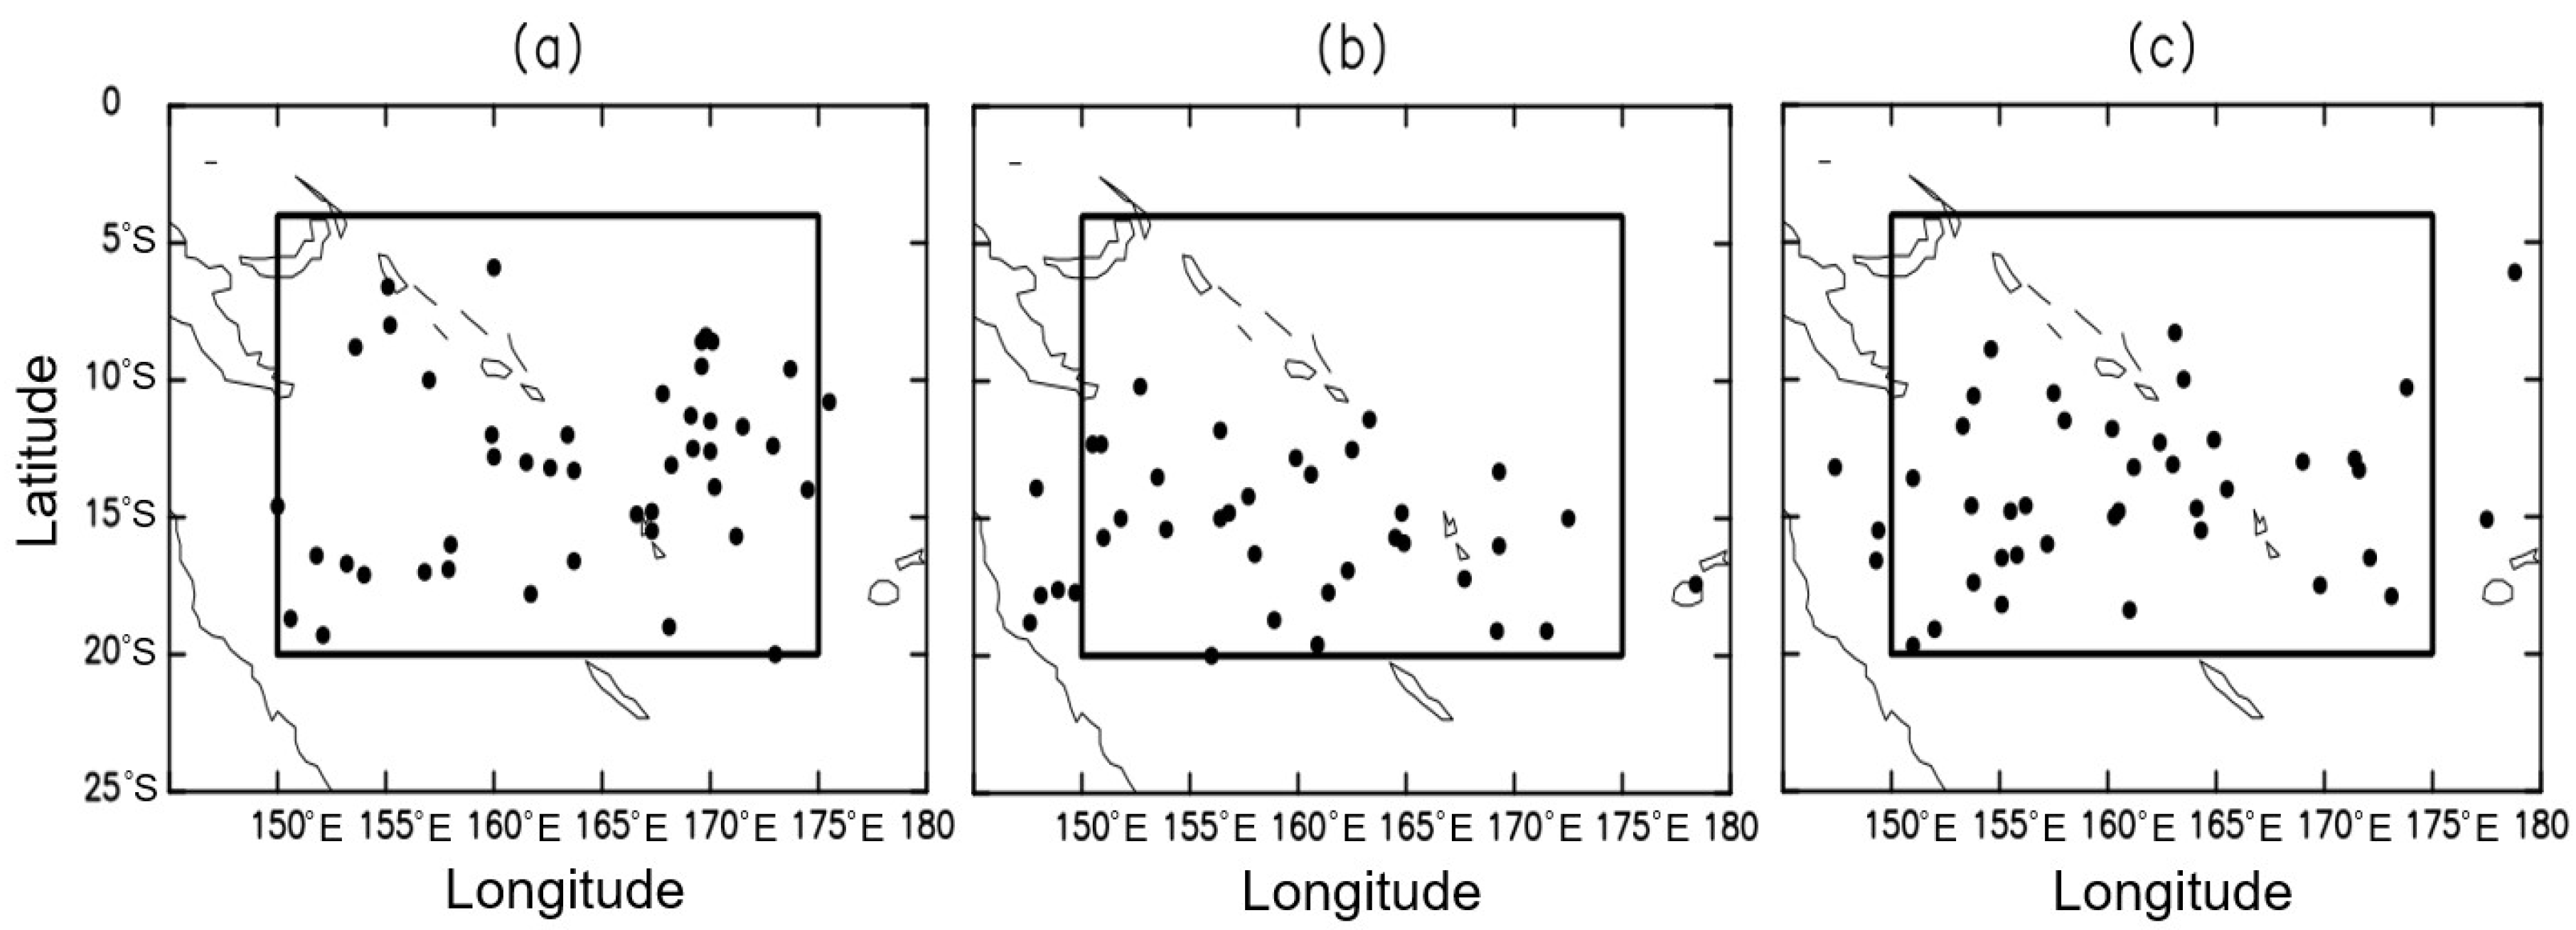
The genesis locations of TCs tend to be shifted to the south during La Niña periods, in comparison with El Niño period (
Figure 9). It was statistically significant at the 99% confidence level based on Mann–Whitney
U test. During La Niña periods, it is very rare to observe TC genesis between 0–10° S. The number of TCs also varies according to the ENSO index. TCs are observed more frequently during El Niño periods than during La Niña periods. During neutral years, the displacement and number of TC formations seems to be between the two (
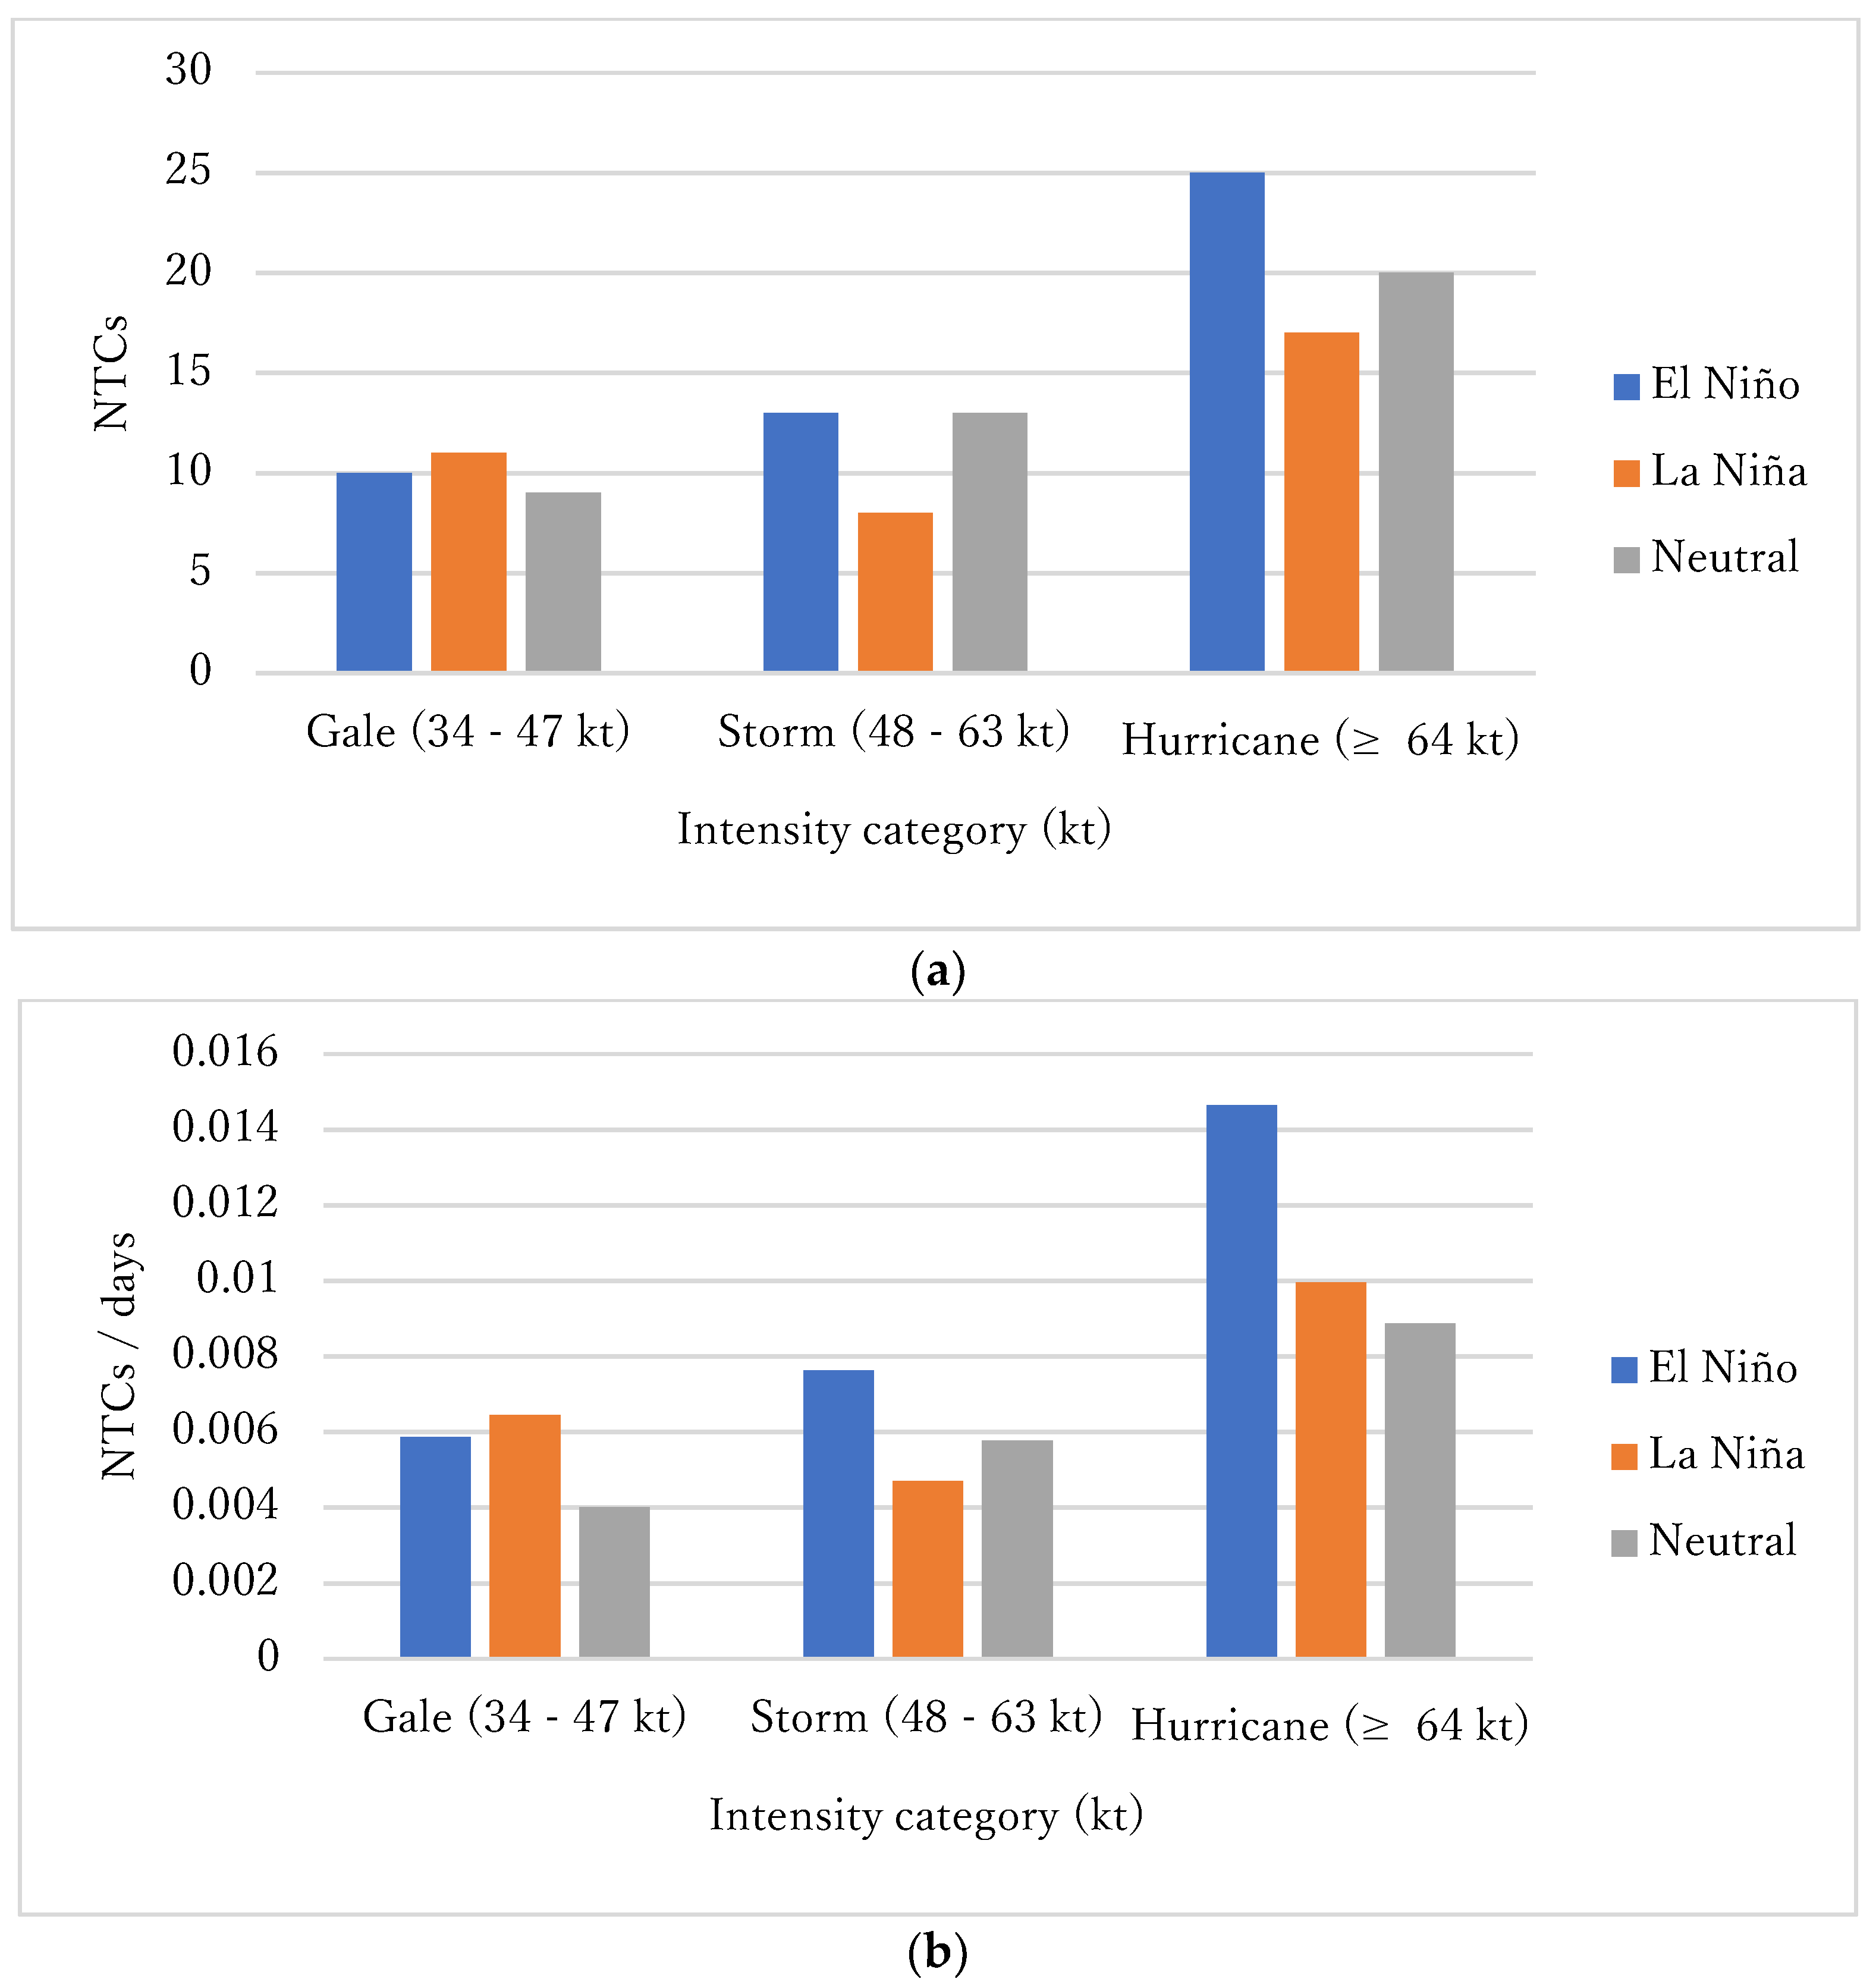
Figure 9). As for TC intensity, the number of hurricane category TCs (maximum wind speed of
64 kt) is larger in El Niño periods (
Figure 10). However, the number of TCs in gale wind category is comparable between El Niño and La Niña periods over the study domain.
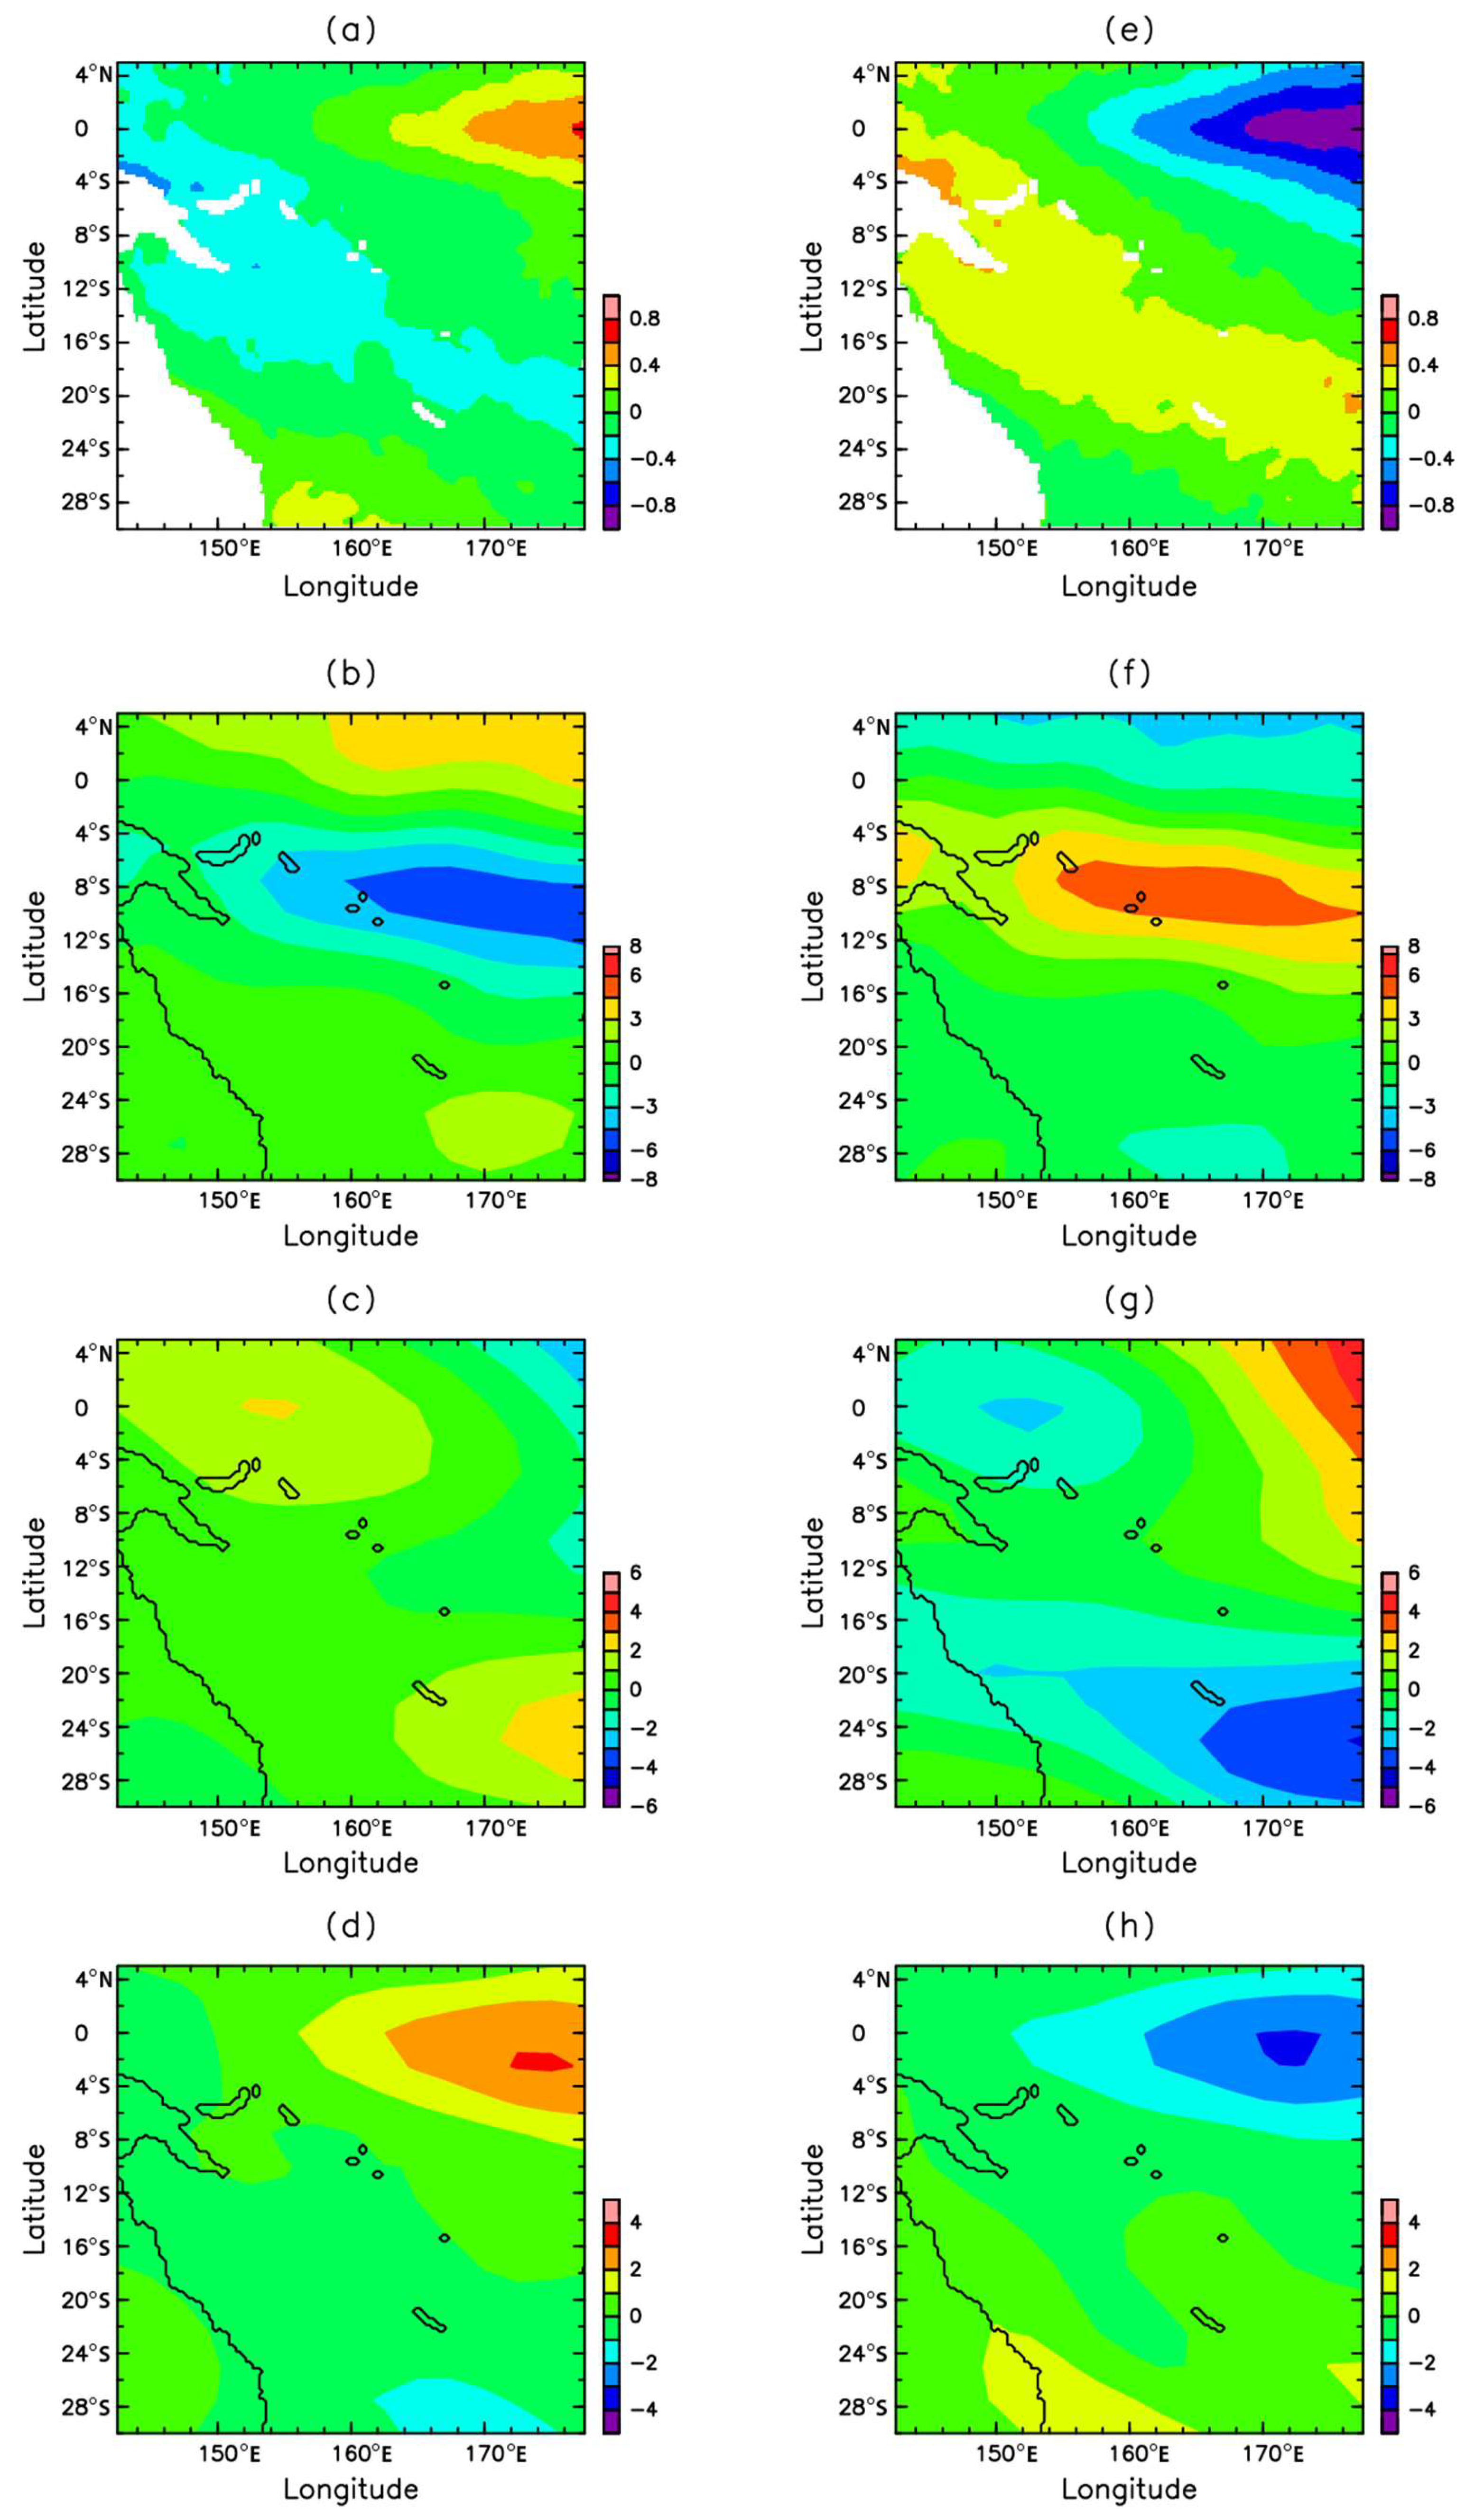
Physical parameters in the northern part of the study domain (lower SST, stronger vertical wind shear, weaker negative vorticity, and weaker upper tropospheric divergence) during La Niña periods seem to provide unfavourable environmental condition to TC genesis (
Figure 11). All of these conditions help suppress active convection in the northern part of the SI region. In particular, the mean SST is relatively low near the equator (
Figure 4a), meaning that the cold SST anomaly observed during La Niña shuts down the energy supply that would otherwise sustain active convection. Furthermore, because the SST anomaly significantly affects surface wind anomalies, the northeasterly and southeasterly trade winds enhance moisture convergence, triggering low-level vorticities and high moisture content during El Niño events. This is well-known feature of the SPCZ pattern [
4].
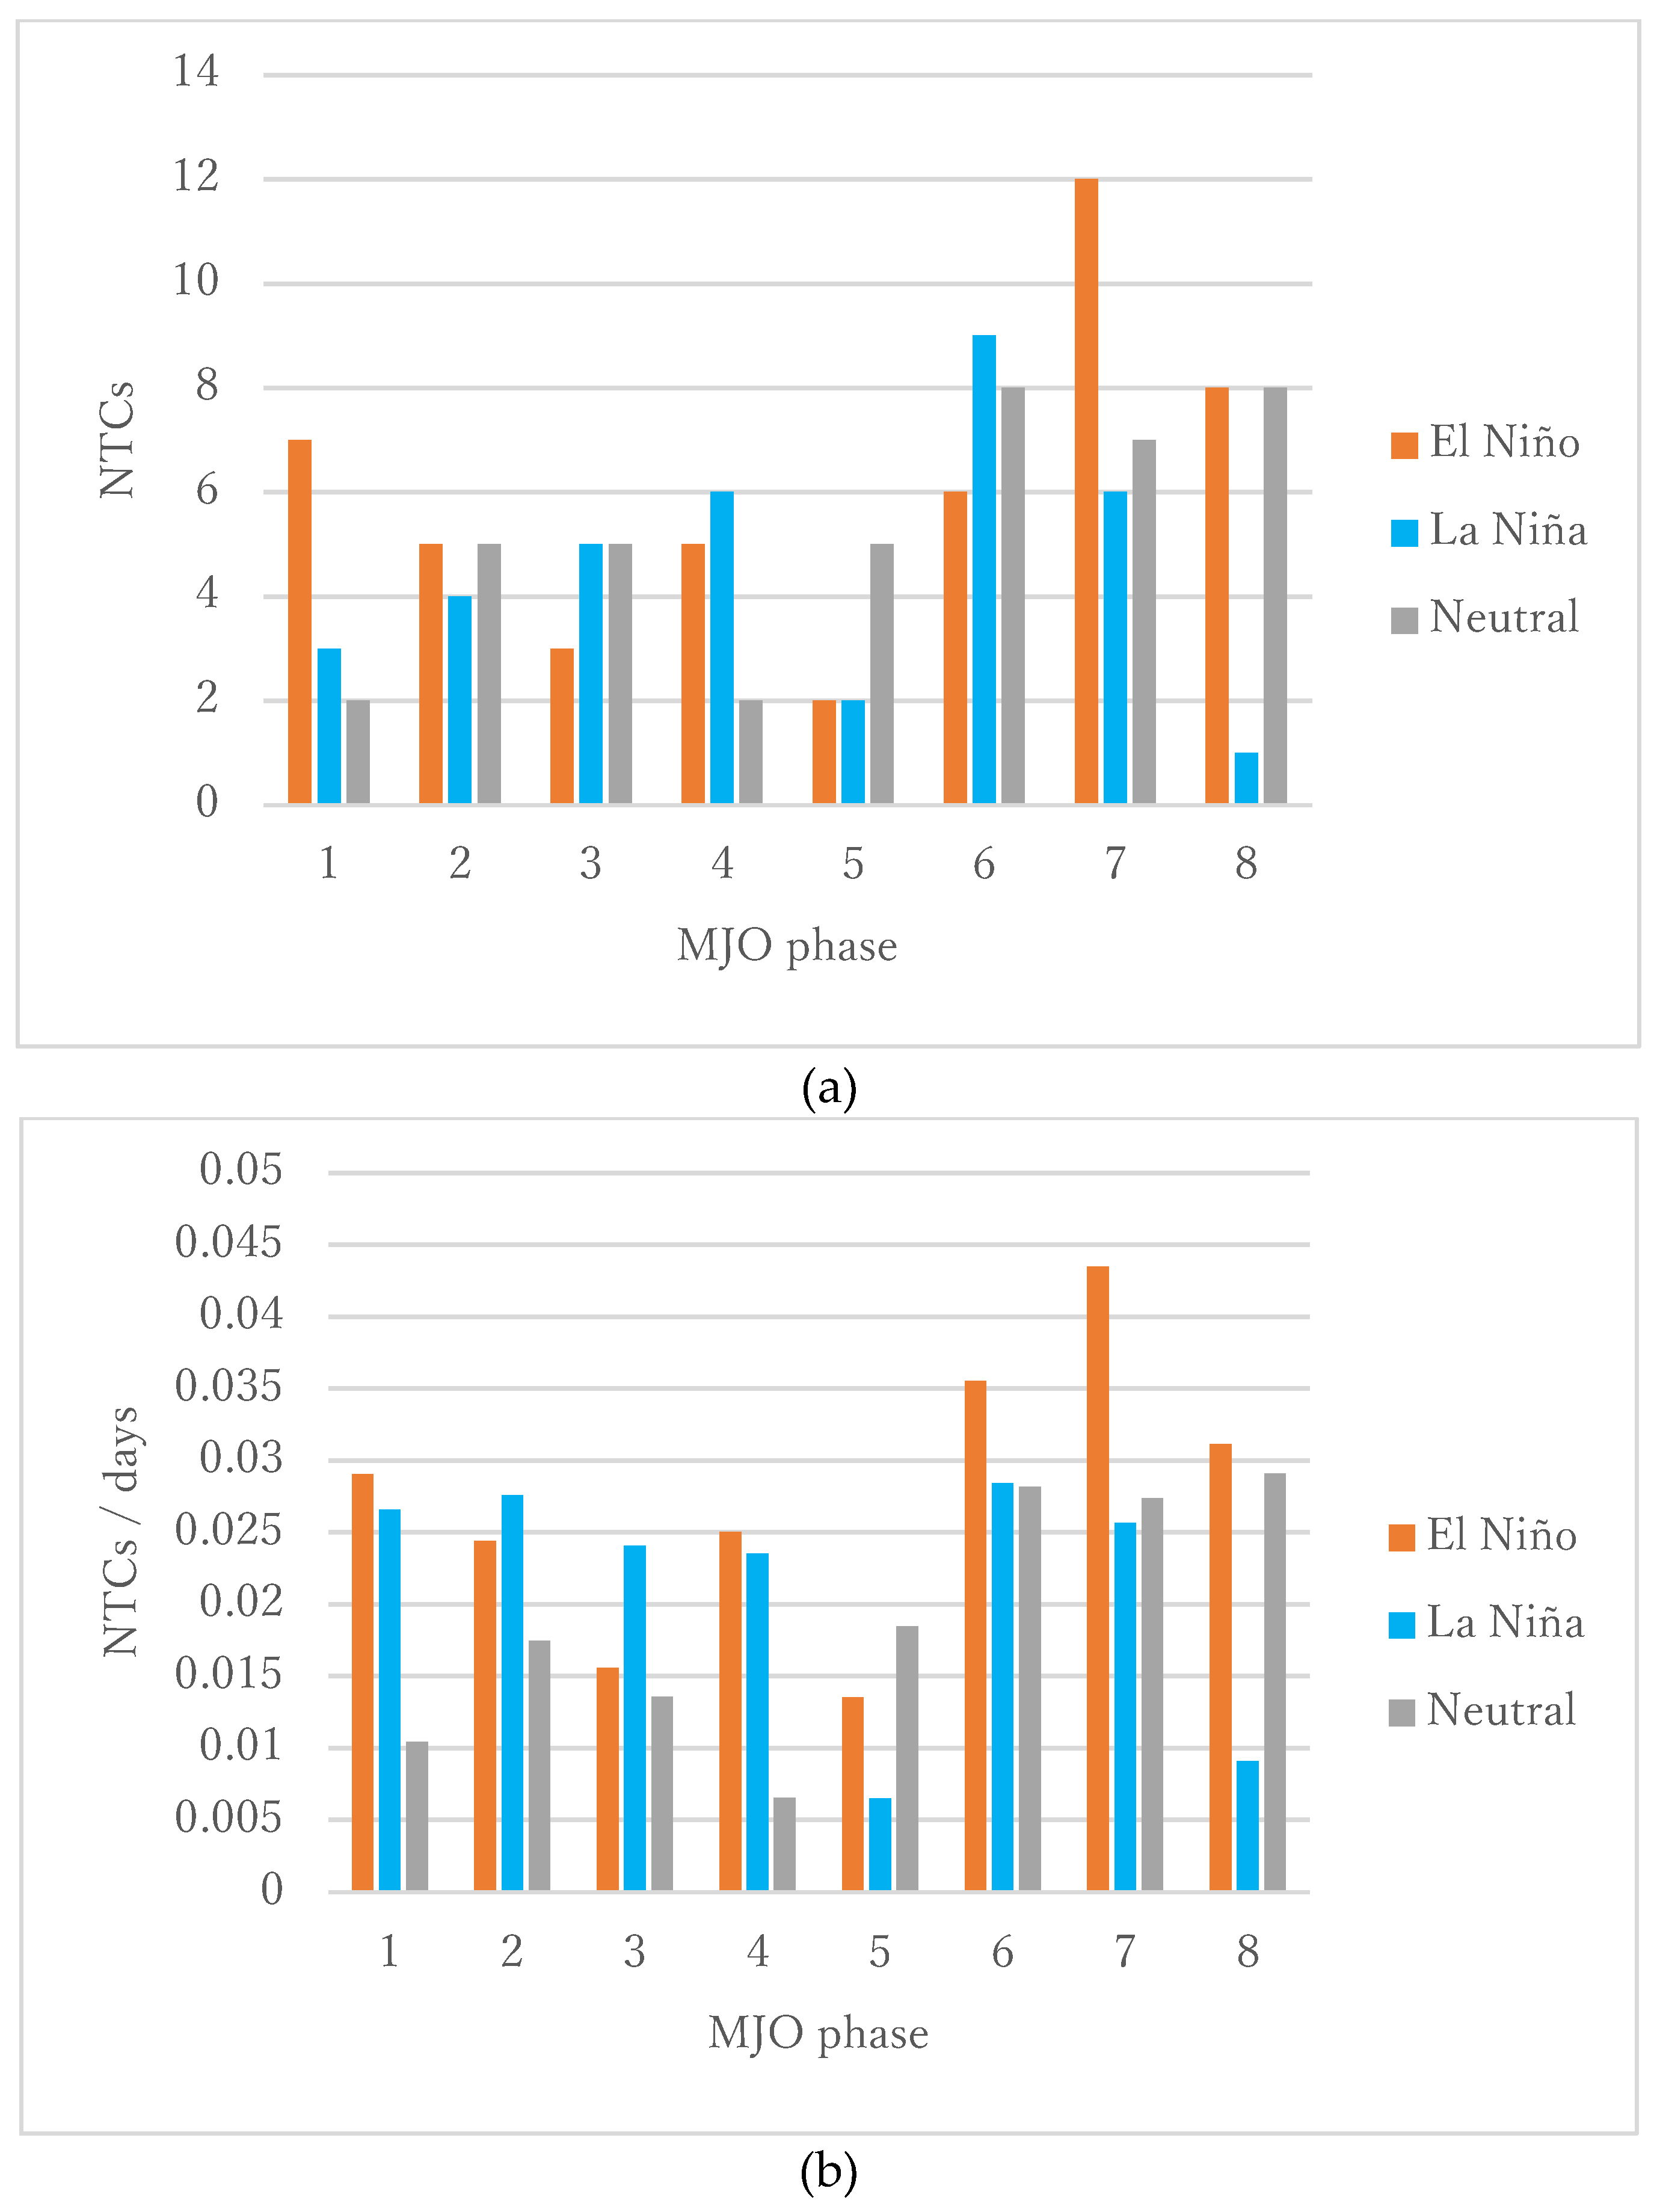
The positive anomalous SST during El Niño could be a possible clarification for the intensification and enhancement of TCs. In addition, a convectively enhanced phase of the MJO, in coexistence with the El Niño conditions (warming SST anomalies), influences low-level westerlies and large-scale fields robustly, generating more TCs as seen in phases 6–7 (
Figure 12). It is notable that the very intense TC Pam (2015) was generated during a combination of MJO phase 6 and El Niño conditions [
8]. Due to limitations created by the number of cases, it was not possible to address this issue further. However, the results highlight that the combination of MJO phases 6–7 and El Niño conditions could lead to intense TCs.
5. Conclusions
This study documents the long-term trends of TCs around the SIs and explores how TC activity in the study area is influenced by the MJO and the ENSO using statistical analysis of best track datasets. Over the 31-year study period (1986–2016), the frequency of TCs decreased but their maximum average intensity increased. The reduction of TC frequency is consistent with an increase in atmospheric stability, as explained by stronger warming in the upper troposphere than in the lower troposphere. In contrast, the increase in intensity may be attributed to the large sensitivity of TC intensity to SST. Although this work focused on nationwide characteristics, these results are consistent with previous studies that addressed the issue of TC frequency and intensity changes on a global scale, under a conceptual understanding of rising SSTs in a warming environment. Note that the decreasing trend in NTC was statistically significant at the 95% confidence level based on a two-tailed t-test, while the increasing trend in the TC intensity was not.
There were significant patterns in TC genesis associated with the phases of the MJO. A frequent TC genesis was seen in phases 6–8, with most geneses occurring in phase 7. In contrast, phases 1–5 tended to be associated with lower TC genesis, with the fewest TCs being generated in phase 5. That MJO phase 5 displayed the fewest TC generations is an unexpected result because this phase is characterized by active convection over the maritime continent close to the SIs. This may be explained by a weaker negative vorticity anomaly. The peak TC genesis observed in phase 7 is presumably associated with low OLR and low-level negative background relative vorticity, which are both known to be favourable conditions for TC genesis. Another notable feature is that, even in phases 1–5, many of the violent TCs were generated over the current domain. As for the influence of ENSO, more (less) TCs are generated during El Niño (La Niña) periods. The increase (decrease) and northerly (southerly) shift of TC genesis during El Niño (La Niña) periods is presumably due to SST anomalies, large negative (positive) low-level relative vorticity anomalies, and decreases (increases) of vertical wind shear. Therefore, it is concluded that both MJO phase and ENSO are vital for the frequency and distribution of TC genesis in the study domain.
These results are meaningful because they generally show that the nationwide scale features around the SI region are consistent with global-scale and/or basin-scale features. Though this might appear obvious, it is in fact very important to make sure that existing global-scale findings are generally valid at the nationwide scale because the activities and preparedness of a nation are informed by nationwide scale data. In particular, it is important to note local climatological features, such as the smaller number of TCs in MJO phase 5, might be merely a statistical artefact due to small sample numbers. The authors believe that this work will help mitigate and prevent TC-related disasters in the SIs and adjacent country such as Vanuatu through improving the preparedness of the authorities. It is also important to be cautious about very intense TCs, especially those generated in MJO phases 6–7 and El Niño conditions as remembering TC Pam (2015), which formed under these conditions, devastated Vanuatu.
Author Contributions
Funding acquisition, Kosuke Ito; Investigation, Edward Maru; Project administration, Kosuke Ito; Software, Taiga Shibata; Supervision, Kosuke Ito; Visualization, Taiga Shibata; Writing—original draft, Edward Maru and Kosuke Ito.
Acknowledgments
We thank the helpful comments from Hiroyuki Yamada and Toshiki Iwasaki and the data check from Miharu Kubo. This work was supported by JICA Pacific Leaders’ Educational Assistance for Development of State and MEXT KAKENHI 15K05294 and 18H01283.
Conflicts of Interest
The authors declare no conflict of interest.
References
- Yates, L.; Linda, A.B. The Societal and Environmental Impacts of Cyclone Zoë and the Effectiveness of the Tropical Cyclone Warning Systems in Tikopia and Anuta Solomon Islands. Aust. J. Emerg. Manag. 2004, 19, 16–20. [Google Scholar]
- Webster, P.J.; Holland, G.J.; Curry, J.A.; Chang, H.R. Changes in tropical cyclone number, duration, and intensity in a warming environment. Science 2005, 309, 1844–1846. [Google Scholar] [CrossRef] [PubMed]
- Emanuel, K. Increasing destructiveness of tropical cyclone over the past 30 years. Nature 2005, 436, 686–688. [Google Scholar] [CrossRef] [PubMed]
- Vincent, E.M.; Lengaigne, M.; Menkes, C.E.; Jourrdain, N.C.; Marchesiello, P.; Madec, G. Interannual variability of the South Pacific convergence zone and implications for tropical cyclone genesis. Clim. Dyn. 2009, 36, 1881–1896. [Google Scholar] [CrossRef]
- Chand, S.S.; Walsh, K.J. The Influence of the Madden-Julian Oscillation on Tropical Cyclone Activity in the Fiji Region. J. Clim. 2010, 23, 868–886. [Google Scholar] [CrossRef]
- Klotzbach, P.J. The Madden-Julian Oscillation’s Impacts on Worldwide Tropical Cyclone Activity. J. Clim. 2014, 27, 2317–2330. [Google Scholar] [CrossRef]
- Iizuka, S.; Matsuura, T. Analysis of Tropical Cyclone Activity in the Southern Hemisphere using Observation and CGCM Simulation. In Cyclones: Formation, Triggers, and Control; Nova Science Publishers: New York, NY, USA, 2012; pp. 37–59. [Google Scholar]
- Nakano, M.; Kubota, H.; Miyakawa, T.; Nasuno, T.; Satoh, M. Genesis of Super Cyclone Pam (2015): Modulation of Low-Frequency Large-Scale Circulations and the Madden-Julian Oscillation by Sea Surface Temperature Anomalies. Mon. Weather Rev. 2017, 145, 3143–3159. [Google Scholar] [CrossRef]
- NOAA. International Best Track Archive for Climate Stewardship (IBTrACS). Available online: https://www.ncdc.noaa.gov/ibtracs/index.php?name=wmo-data (accessed on 16 January 2017).
- Bureau of Meteorology (BoM) RMM Data. Available online: http://www.bom.gov.au/climate/mjo/graphics/rmm.74toRealtime.txt (accessed on 6 April 2017).
- Bureau of Meteorology (BoM) ENSO Data. Available online: http://www.bom.gov.au/climate/current/soihtm1.shtml (accessed on 7 April 2017).
- NCEP/NCAR Reanalysis 1. Available online: https://www.esrl.noaa.gov/psd/data/gridded/data.ncep.reanalysis.html (accessed on 1 March 2018).
- Matyas, C.J. Tropical cyclone formation and motion in the Mozambique Channel. Int. J. Climatol. 2015, 35, 375–390. [Google Scholar] [CrossRef]
- NOAA OI SST V2 High Resolution Dataset. Available online: https://www.esrl.noaa.gov/psd/data/gridded/data.noaa.oisst.v2.highres.html (accessed on 1 March 2018).
- NOAA Interpolated Outgoing Longwave Radiation (OLR). Available online: https://www.esrl.noaa.gov/psd/data/gridded/data.interp_OLR.html (accessed on 1 March 2018).
- Sugi, M. Reduction of Global Tropical Cyclone Frequency Due to Global Warming. In Cyclones: Formation, Triggers, and Control; Nova Science Publishers: New York, NY, USA, 2012; pp. 115–123. [Google Scholar]
- Tsutsui, J. Estimation of changes in tropical cyclone intensities and associated precipitation extremes due to anthropogenic climate change. In Cyclones: Formation, Triggers, and Control; Nova Science Publishers: New York, NY, USA, 2012; pp. 125–141. [Google Scholar]
- Vecchi, G.A.; Fueglistaler, S.; Held, I.M.; Knutson, T.R.; Zhao, M. Impacts of Atmospheric Temperature Trends on Tropical Cyclone Activity. J. Clim. 2013, 26, 3877–3891. [Google Scholar] [CrossRef]
- Lin, I.; Wu, C.; Pun, I.; Ko, D. Upper-Ocean Thermal Structure and the Western North Pacific Category 5 Typhoons. Part I: Ocean Features and the Category 5 Typhoons’ Intensification. Mon. Weather Rev. 2008, 136, 3288–3306. [Google Scholar] [CrossRef]
- Wheeler, M.C.; Hendon, H.H. An All-Season Real-Time Multivariate MJO Index: Development of an Index for Monitoring and Prediction. Mon. Weather Rev. 2004, 132, 1917–1932. [Google Scholar] [CrossRef]
- Ito, K.; Kunii, M.; Kawabata, T.; Saito, K.; Aonashi, K.; Duc, L. Mesoscale hybrid data assimilation system based on JMA nonhydrostatic model. Mon. Weather Rev. 2016, 144, 3417–3439. [Google Scholar] [CrossRef]
- Kubota, H. Variability of typhoon tracks and genesis over the Western North Pacific. In Cyclones: Formation, Triggers, and Control; Nova Science Publishes: New York, NY, USA, 2012; pp. 95–114. [Google Scholar]
- Lander, M.A. An Exploratory Analysis of the Relationship between Tropical Storm Formation in the Western North Pacific and ENSO. Mon. Weather Rev. 1994, 122, 636–651. [Google Scholar] [CrossRef]
Figure 1.
(a) Tracks (black lines) for all 126 TCs (tropical cyclones) analysed in this study and (b) the genesis locations (black dots). Red lines in (a) indicate the track for a cyclone that does not satisfy the criteria of TC (tropical cyclone).
Figure 1.
(a) Tracks (black lines) for all 126 TCs (tropical cyclones) analysed in this study and (b) the genesis locations (black dots). Red lines in (a) indicate the track for a cyclone that does not satisfy the criteria of TC (tropical cyclone).
Figure 2.
(a) The number of TCs from 1986 through 2016 and (b) the average wind speed (kt) per year over the same interval. Regressions for each dataset are indicated by a thin line.
Figure 2.
(a) The number of TCs from 1986 through 2016 and (b) the average wind speed (kt) per year over the same interval. Regressions for each dataset are indicated by a thin line.
Figure 3.
Air temperature change (K) in 2001/2002–2015/2016 TC seasons with respect to 1986/1987–2000/2001 TC seasons at (a) 850 hPa and (b) 300 hPa.
Figure 3.
Air temperature change (K) in 2001/2002–2015/2016 TC seasons with respect to 1986/1987–2000/2001 TC seasons at (a) 850 hPa and (b) 300 hPa.
Figure 4.
(a) Average SSTs (sea surface temperatures) from TC seasons 2001/2002–2015/2016 (K) and (b) SST change (K) between the recent 15 seasons (2001/2002–2015/2016) and earlier 15 seasons (1986/1987–2000/2001).
Figure 4.
(a) Average SSTs (sea surface temperatures) from TC seasons 2001/2002–2015/2016 (K) and (b) SST change (K) between the recent 15 seasons (2001/2002–2015/2016) and earlier 15 seasons (1986/1987–2000/2001).
Figure 5.
(a) The averaged vertical shear of horizontal wind (m s−1) from TC seasons 2001/2002–2015/2016, and (b) change in averaged vertical shear of horizontal wind (m s−1) between 2001/2002–2015/2016 and 1986/1987–2000/2001.
Figure 5.
(a) The averaged vertical shear of horizontal wind (m s−1) from TC seasons 2001/2002–2015/2016, and (b) change in averaged vertical shear of horizontal wind (m s−1) between 2001/2002–2015/2016 and 1986/1987–2000/2001.
Figure 6.
(a) NTC (number of tropical cyclone) for each MJO (Madden–Julian Oscillation) phase. The NTC divided by the number of days in each MJO phase is shown in (b).
Figure 6.
(a) NTC (number of tropical cyclone) for each MJO (Madden–Julian Oscillation) phase. The NTC divided by the number of days in each MJO phase is shown in (b).
Figure 7.
(a) Number of TCs categorized by phase of MJO and intensity class. The NTC divided by the number of days in each MJO phase is shown in (b).
Figure 7.
(a) Number of TCs categorized by phase of MJO and intensity class. The NTC divided by the number of days in each MJO phase is shown in (b).
Figure 8.
Composite of OLR (shade; W m−2) and wind vector at 850 hPa (arrows) for (a) phase 6 and (b) phase 5.
Figure 8.
Composite of OLR (shade; W m−2) and wind vector at 850 hPa (arrows) for (a) phase 6 and (b) phase 5.
Figure 9.
TC genesis locations (black dots) for (a) El Niño, (b) La Niña, and (c) neutral periods, respectively.
Figure 9.
TC genesis locations (black dots) for (a) El Niño, (b) La Niña, and (c) neutral periods, respectively.
Figure 10.
(a) NTC at different ENSO conditions, broken down by each intensity category (b) The NTC divided by the number of days in each category is shown in (b).
Figure 10.
(a) NTC at different ENSO conditions, broken down by each intensity category (b) The NTC divided by the number of days in each category is shown in (b).
Figure 11.
Anomalies in large-scale environmental variables for El Niño periods: (a) SST (°C), (b) 850 hPa relative vorticity (10−6 s−1), (c) vertical wind shear (m s−1), and (d) 200 hPa divergence (10−6 s−1). Panels (e–h) are the same as (a–d) but for La Niña periods.
Figure 11.
Anomalies in large-scale environmental variables for El Niño periods: (a) SST (°C), (b) 850 hPa relative vorticity (10−6 s−1), (c) vertical wind shear (m s−1), and (d) 200 hPa divergence (10−6 s−1). Panels (e–h) are the same as (a–d) but for La Niña periods.
Figure 12.
(a) Number of TCs formed during each ENSO condition for each MJO phase. The NTC divided by the number of days in each category is shown in (b).
Figure 12.
(a) Number of TCs formed during each ENSO condition for each MJO phase. The NTC divided by the number of days in each category is shown in (b).
Table 1.
Composite 200 hPa horizontal divergence (s−1), vertical wind shear (), SST (°C), OLR (outgoing longwave radiation) (W m−2), and 850 hPa relative vorticity () in each MJO (Madden–Julian Oscillation) phase and mean value. If the difference from the grand mean is statistically significant at the 95% confidence level, the value is marked in coloured bold. Favourable conditions to TCs are indicated in red, while unfavourable conditions are indicated in blue.
| Phase | Divergence | Vertical Wind Shear | SST | OLR | 850 hPa RV |
|---|
| 1 | 1.05 × 10⁻⁶ | 13.70 | 28.65 | 237.99 | −2.84 × 10⁻⁶ |
| 2 | 0.79 × 10⁻⁶ | 13.79 | 28.75 | 237.44 | −2.02 × 10⁻⁶ |
| 3 | 0.95 × 10⁻⁶ | 15.02 | 28.82 | 232.29 | −1.99 × 10⁻⁶ |
| 4 | 1.20 × 10⁻⁶ | 15.64 | 28.83 | 227.55 | −1.97 × 10⁻⁶ |
| 5 | 1.60 × 10⁻⁶ | 14.96 | 28.90 | 223.62 | −1.95 × 10⁻⁶ |
| 6 | 2.33 × 10⁻⁶ | 14.10 | 28.89 | 218.98 | −3.14 × 10⁻⁶ |
| 7 | 2.27 × 10⁻⁶ | 13.59 | 28.82 | 222.79 | −4.14 × 10⁻⁶ |
| 8 | 1.57 × 10⁻⁶ | 13.43 | 28.77 | 232.96 | −3.58 × 10⁻⁶ |
| Mean | 1.49 × 10⁻⁶ | 14.33 | 28.81 | 228.62 | −2.69 × 10⁻⁶ |
© 2018 by the authors. Licensee MDPI, Basel, Switzerland. This article is an open access article distributed under the terms and conditions of the Creative Commons Attribution (CC BY) license (http://creativecommons.org/licenses/by/4.0/).


