1. Introduction
Most categories of tourism are closely linked to climate [
1]. Weather and climate have a substantial influence on the tourism sector and are very important for recreation and outdoor activities [
2]. This influence notably affects the temporal distribution of tourists throughout the year.
Yet, as Becken and Wilson [
3] note, the interrelation between climate and tourism is insufficiently understood as well as little researched. For Algeria, to date, this relationship has not been a major field for research. Practically, few studies based on a deterministic approach, assessing the effect of climate conditions in Algeria upon human thermal comfort are available [
4,
5,
6]. Few investigations introducing useful information, aiming to help domestic and international tourists to anticipate their choice of the appropriate period to visit their targeted touristic sites and cities in Algeria are provided [
7,
8,
9,
10].
For tourism purposes, several indices are produced to provide direct and simple opinions about the intended destination and to interpret the combined effects of certain atmospheric components and to make possible the measurement and rating of climate conditions [
11].
One of these indices is the Tourism Climate Index (TCI), developed by Mieczkowski [
12]. This index is based on previous research in relation to climate classifications for tourism and theoretical factors from the biometeorological literature related to human comfort. The TCI results from the combination of seven independent and bioclimatic parameters. The limitation of the existing tourism indices, principally the TCI, is that all of them do not consider human thermal comfort/stress approaches, which rely on human-biometeorology [
2,
13]. Moreover, TCI remains not valid for winter tourism [
13].
Latifa Hénia [
14] conducted a study based on the use of the TCI in Tunisia. This index allows exploring the tourism climate and its variation at spatial and seasonal scale to assess the country’s potential climate and diversity of tourism products. The form of the TCI adopted in the study was based on the results of a questionnaire survey among tourists during their stay in Tunisia. The results of the survey show that sunshine, humidity and wind come almost equally with air temperature in the determination of climate comfort for tourists. The author evokes that the use of these indices and the thresholds for evaluating the effect of different climate elements on the level of comfort vary substantially, depending on the nationality of the tourist and therefore, according to the originating countries.
The flow of tourists could be mainly affected by extreme weather conditions as for the 2003 heatwave in Europe. The severe climate conditions caused 15.000 deaths in France and were responsible for major shifts in traditional tourist flows for this year away from the traditional resorts in the Mediterranean and towards Northern or Western beach locations [
15].
In this context, to assess the impacts of the significant meteorological parameters on tourism activities in the city of Djerba (southern Gulf of Gabès, Tunisia), the Tourism Seasonal Shift Index was used. This indicator is based on a threshold mean air temperature of 23 °C defining the start and end of the tourist season, calculated using five output CIRCE models for the period 1950–2050 [
16]. The authors concluded that the simulated start and end dates suggest a further prolonging of the summer tourist season for the period 2021–2050 for about 3 days earlier start, 13 days later end and 16 days longer duration. Such a change could bring benefits to tourism especially in the autumn.
Regionally and precisely in the southern Mediterranean, some studies revealed that the impacts of higher air temperatures could lead to a gradual decrease in beach-based tourism during summer (peak season) and would increase the attractiveness during shoulder seasons’ tourism (spring and autumn) due to the improvement of the climatic suitability [
17,
18].
Basic information about the influence that weather conditions have on key tourism stakeholders from tourists to governments like in Algeria is still missing [
15].
However, in spite of that, the country is still internationally one of a preferred destination for foreign tourists as well as for Algerian immigrants. According to “Tourism highlights” report of the World Organization of Tourism published in 2017 [
19], Algeria was the fifth tourist destination in Africa in 2015 with more than 1.7 million tourists.
In 2017, the country has attracted 2,097,000 international tourist arrivals. The total contribution of travel and tourism was 6.8% of gross domestic product (GDP) of the country and by 2027, international tourist arrivals are forecast to total 4,396,000 [
20].
On the economic side, the climate component in Algeria is rarely introduced in the tourism industry and is almost neglected in the elaboration of future strategies for this sector [
21,
22]. However, the knowledge of thermal bioclimatic conditions was demonstrated as a tool to help not only for existing and planned tourism resorts and areas but also in providing information about zones and periods where tourists may be negatively affected by weather and climate conditions [
23].
In this context, Sahabi and Matzarakis [
17] show the importance of the physiologically equivalent temperature (PET) in emphasizing the impacts of climate on human thermal comfort and stress in different seasonal and regional regimes over five (5) most attractive cities, representing different climate and geographical conditions of Algeria.
From an economic perspective, Bigano et al. [
24] examined the changes in international and domestic tourism up to 2100 using the Hamburg Tourism Model based on the IPCC Special Report on Emissions Scenarios (SRES) scenario A1B. This model simulates in 5-year time steps throughout the 21st century for 207 countries and territories. For Algeria, the authors found that international arrivals would be reduced to almost half (−52.1%) by 2100 in the scenario with climate change and the scenario of economic and population growth only, compared to a scenario without climate change. The simulations within the Integrated Research Project CIRCE over the Mediterranean region, show that the impact on domestic tourism is perceived not quite as dramatic (−17.4%) and the percentage difference in expenditure is −16.7% [
25].
Bioclimatic features of the local environment are determinant factors for all forms of tourism and the assessment of spatial differentiation of bioclimatic conditions in the local scale must be a fundamental part of bioclimatic evaluation [
2,
26].
Among the indices implementing this aspect, the Climate-Tourism-Information-Scheme (CTIS) gives a picture of climate and human thermal bioclimate information for tourism purposes based on thresholds of significant parameters and their frequency of occurrence. The results provided through CTIS could be directly used for the preparation of tourists about a destination and for the recreation activity for further appropriate planning [
7,
23,
27,
28].
Algeria has great tourism potential because of its beautiful Mediterranean coastline, the natural variability of its landscape, varieties of its natural ecosystems, historical and cultural wealth and majestic and fascinating Sahara. Whatever the specific type of holiday enjoyed, most outdoor tourism rests on the attraction of certain renewable biophysical resources, such as forests, lakes or beaches, all of which are climate-dependent [
29].
In this scope, the aim of this research is to assess the frequency distribution of climate and human bioclimate parameters at a 10-day and monthly timescale. This study is also intended to demonstrate the key role of the climate features on tourism activities and to highlight the importance of the employment of Climate-Tourism-Information-Schemes (CTIS) at a high time resolution as a user-friendly tool contributing in the development of the tourism industry and recreation activities in Algeria. The article focuses on the analysis of the decadal trend evolution of the annual frequency of days for different human thermal comfort thresholds based on PET, as well as aesthetic parameters used in the elaboration of the CTIS. More specifically, the authors elaborate and discuss the PET of the city of Ghardaia at 10-day and monthly timescales.
In this paper, the first section provides information on the study region as well as a brief climate classification and statistics of each city is given. Then, the methodology employed is described and the importance of the use of high time-scale resolution in the elaboration of PET as well as CTIS is emphasized. Finally, CTIS diagrams are produced and analyzed. The last section is devoted to the demonstration of the benefits and interests of this tool in the establishment of the future strategies in the tourism sector of the country.
2. Study Area and Data
Located in northern Africa and comprising about 2,400,000 km
2 of land, more than four-fifths of which is desert, Algeria is the largest country on the African continent and the 10th largest country in the world (
https://www.cia.gov/library/publications/the-world-factbook/geos/ag.html). With over 1400 km of largely unspoiled Mediterranean coastline holding 372 beaches and a fascinating hinterland, important and rich historical and cultural heritage, the Atlas mountain, magnificent Sahara Desert, which is the second largest desert in the world, Algeria is holding considerable potential for tourism.
The diversification of its natural areas and ecological systems, allow it to enjoy different types of climates.
The northern part of Algeria is dominated by a Mediterranean-style climate and influenced notably by the mid-latitudes atmospheric circulation variability systems. The transitional climate of the northern hills and mountains due to the elevation, affects considerably the climate of highlands and extensive high plains in the northern regions, while the desert climate interests the vast area occupied by the Sahara.
For the present study, six important Algerian cities, representing different climate regimes are considered due to their natural, historical and cultural features. These cities are among the most attractive destinations for tourism locally and universally: Two coastal cities, Algiers in the center and Oran in the west, Constantine—which is in the northeast highland—Bechar in the northwest of the Sahara, Ghardaia in the north-central of the Sahara and Tamanrasset in the extreme south of the country.
Algiers, the capital city with its popular sandy beaches based along the easterly turquoise coast, has several historic monuments including socialist-era monuments, public buildings and impressive-looking Roman Catholic Church sites “Basilica of Algiers” overlooking the Bay of Algiers. The capital’s top attractions are the old city “la Casbah” which is declared a World Heritage Site by UNESCO, the oldest botanic gardens and the zoological park.
Oran, Algeria’s second city, is a lively port with plenty of history (Spanish and French particularly) and a lot of rhythms. A number of buzzing beach resorts are built around the Oran region along a beautiful Mediterranean coastline. It is one of the best destination for the tourists in the summer.
Constantine, Algeria’s third bustling inland city, is known for its spectacularly spanned gorges and is one of the grand urban spectacles of Algeria, made by nature. Its museums and important historical sites around the city mostly attract tourists.
The city of Ghardaia is located in northern-central Algeria in the Sahara Desert. The M’zab valley of Ghardaia is inscribed under the UNESCO world heritage list. This city is given the title “the pearl of the oasis” and is one of the most visited tourist regions for its ancient cultural heritage in southern Algeria. Ghardaia also has a lot of painters, researchers, historians and anthropologists to explore its rich cultural, anthropological and architectural singularity.
Its unique architecture and red-mud buildings studded with spikes characterize Bechar, the largest oasis in the Grand Erg Occidental. Considerable flows of domestic tourists from all parts of the country spend their winter holidays in the wonderful city of Taghit in Bechar, where traditional New Year’s celebrations are regularly organized.
The Hoggar Mountains are one of the national parks of the country, located in Tamanrasset. This zone is a major location for biodiversity, including a number of relict species. The mountain range Tassili n’Ajjer (plateau of the rivers)—located in Tamanrasset—is an area of great archaeological interest. With an impressive collection of prehistoric cave paintings, UNESCO classifies the mountain range as a “world heritage site.”
To conduct this study, historical records of daily meteorological data (except for precipitation, where the daily total precipitation amount is considered), for the period (1986–2015) observed at 12.00 UTC are used. The choice of this time is dictated by the fact that at this time, tourists are supposed to be outside and therefore are more exposed to severe atmospheric conditions [
2]. These data are obtained from the Algerian Meteorological Office, a part of the World Meteorological Organization (WMO) regional basic synoptic network. Location of these stations on the map of Algeria is shown in
Figure 1. Furthermore, all meteorological data used in the study are quality controlled and homogenized.
The description of the selected stations, the annual average of the minimum and maximum air temperatures, as well as the mean annual total precipitation and the respective climate of each city based on the criteria of Köppen-Geiger classification [
7,
30], is given in
Table 1.
3. Method
As an integral assessment diagram, CTIS provides a detailed picture of the various factors influencing local climate [
31]. These factors can differ from one climate region to another. The selection of thresholds used for the elaboration of the CTIS is based on bibliographic references [
13] and are summarized in
Table 2. In addition, the thresholds used can be different for climate regions and cultures and can be adjusted with the relevant ones [
27,
32].
On this basis and to assess CTIS, the most relevant following climate aesthetic, physical and thermal parameters that might influence recreation and leisure in Algeria are therefore considered: human thermal comfort, heat and cold human stress, sunshine, fog, sultriness and precipitation [
2,
27].
One of the major pertinent parameters in the elaboration of CTIS is the PET. The PET reflects the grade and level of human comfort under the influence of meteorological and thermo-physiological variables [
33]. The frequency of a certain number of PET classes quantifies thermally suitable conditions for leisure and recreation and gives information about cold and heat stress. In this context, the human thermal comfort acceptability, heat and cold human stress are depicted by PET thresholds representing different grades of thermal perception by humans according to Matzarakis and Mayer [
23] and based on the RayMan Pro model [
13,
34] (
Table 3). This model employs observed air temperature, relative humidity, wind speed at 1.1 m height and cloud cover as a proxy value for the global radiation. Within CTIS, the sunshine is quantified through the cloudiness (nebulosity).
However, a PET ranging between 18 °C and 23 °C indicates comfortable conditions while thermally acceptable bioclimate conditions refer to a PET between 18 and 29 °C.
The humidity conditions are analyzed in terms of vapor pressure and relative humidity. The sultriness emphasizes the importance of the air temperature and the atmospheric moisture while a foggy day is declared when the relative humidity is equal to or above 93%. The day with wind velocity exceeding 8 m/s is considered as stormy and for which the observed precipitation is less than 1 mm is classified as dry; on the other hand, it is categorized as wet, when this amount is more than 5 mm.
Moreover, in addition to the above-mentioned parameters, another relevant and pertinent meteorological parameter affecting recreation and outdoor activities in Saharan cities, are sand or dust winds. To assess the evolution of this climate element, monthly mean number of days with sand or dust winds observed in Bechar, Ghardaia and Tamanrasset stations is calculated during the period of the study (1986–2015).
Representation of these thresholds, in all cases here at 12.00 UTC is done as frequencies of occurrence. These frequency classes expressed as a rate are treated on a 10-day time resolution and presented for each month. In fact, the use of frequencies of climate and human-biometeorological values and variables based on the several facets of climate in tourism is an easily understandable and all-embracing approach [
23].
In this case study, the following positive conditions for tourism and recreation activities are considered: Human thermal comfort acceptability for which 18 °C < PET < 29 °C, nebulosity < 5 octas and daily total rainfall dry <1 mm. On the contrary, the rest of parameters are assessed negatively.
The high frequency of the indicated parameters permits a positive effect on tourism activity and the higher the probability of occurrence is, the more favorable conditions for tourism are. Consequently, fewer recurrences of these parameters correspond to extremely poor conditions [
35], leading consequently to a less flow of tourists.
4. Results
4.1. PET Bioclimate Diagram at 10-Day and Monthly Timescale Resolution for Ghardaia
The daily bioclimate conditions based on PET values calculated at 12.00 UTC for the period from 1986 to 2015 is established for Ghardaia. The PET of the remaining cities can be found in the study of Sahabi and Matzarakis [
7].
Separated PET evolution diagrams elaborated at monthly and 10-day timescale according to Matzarakis [
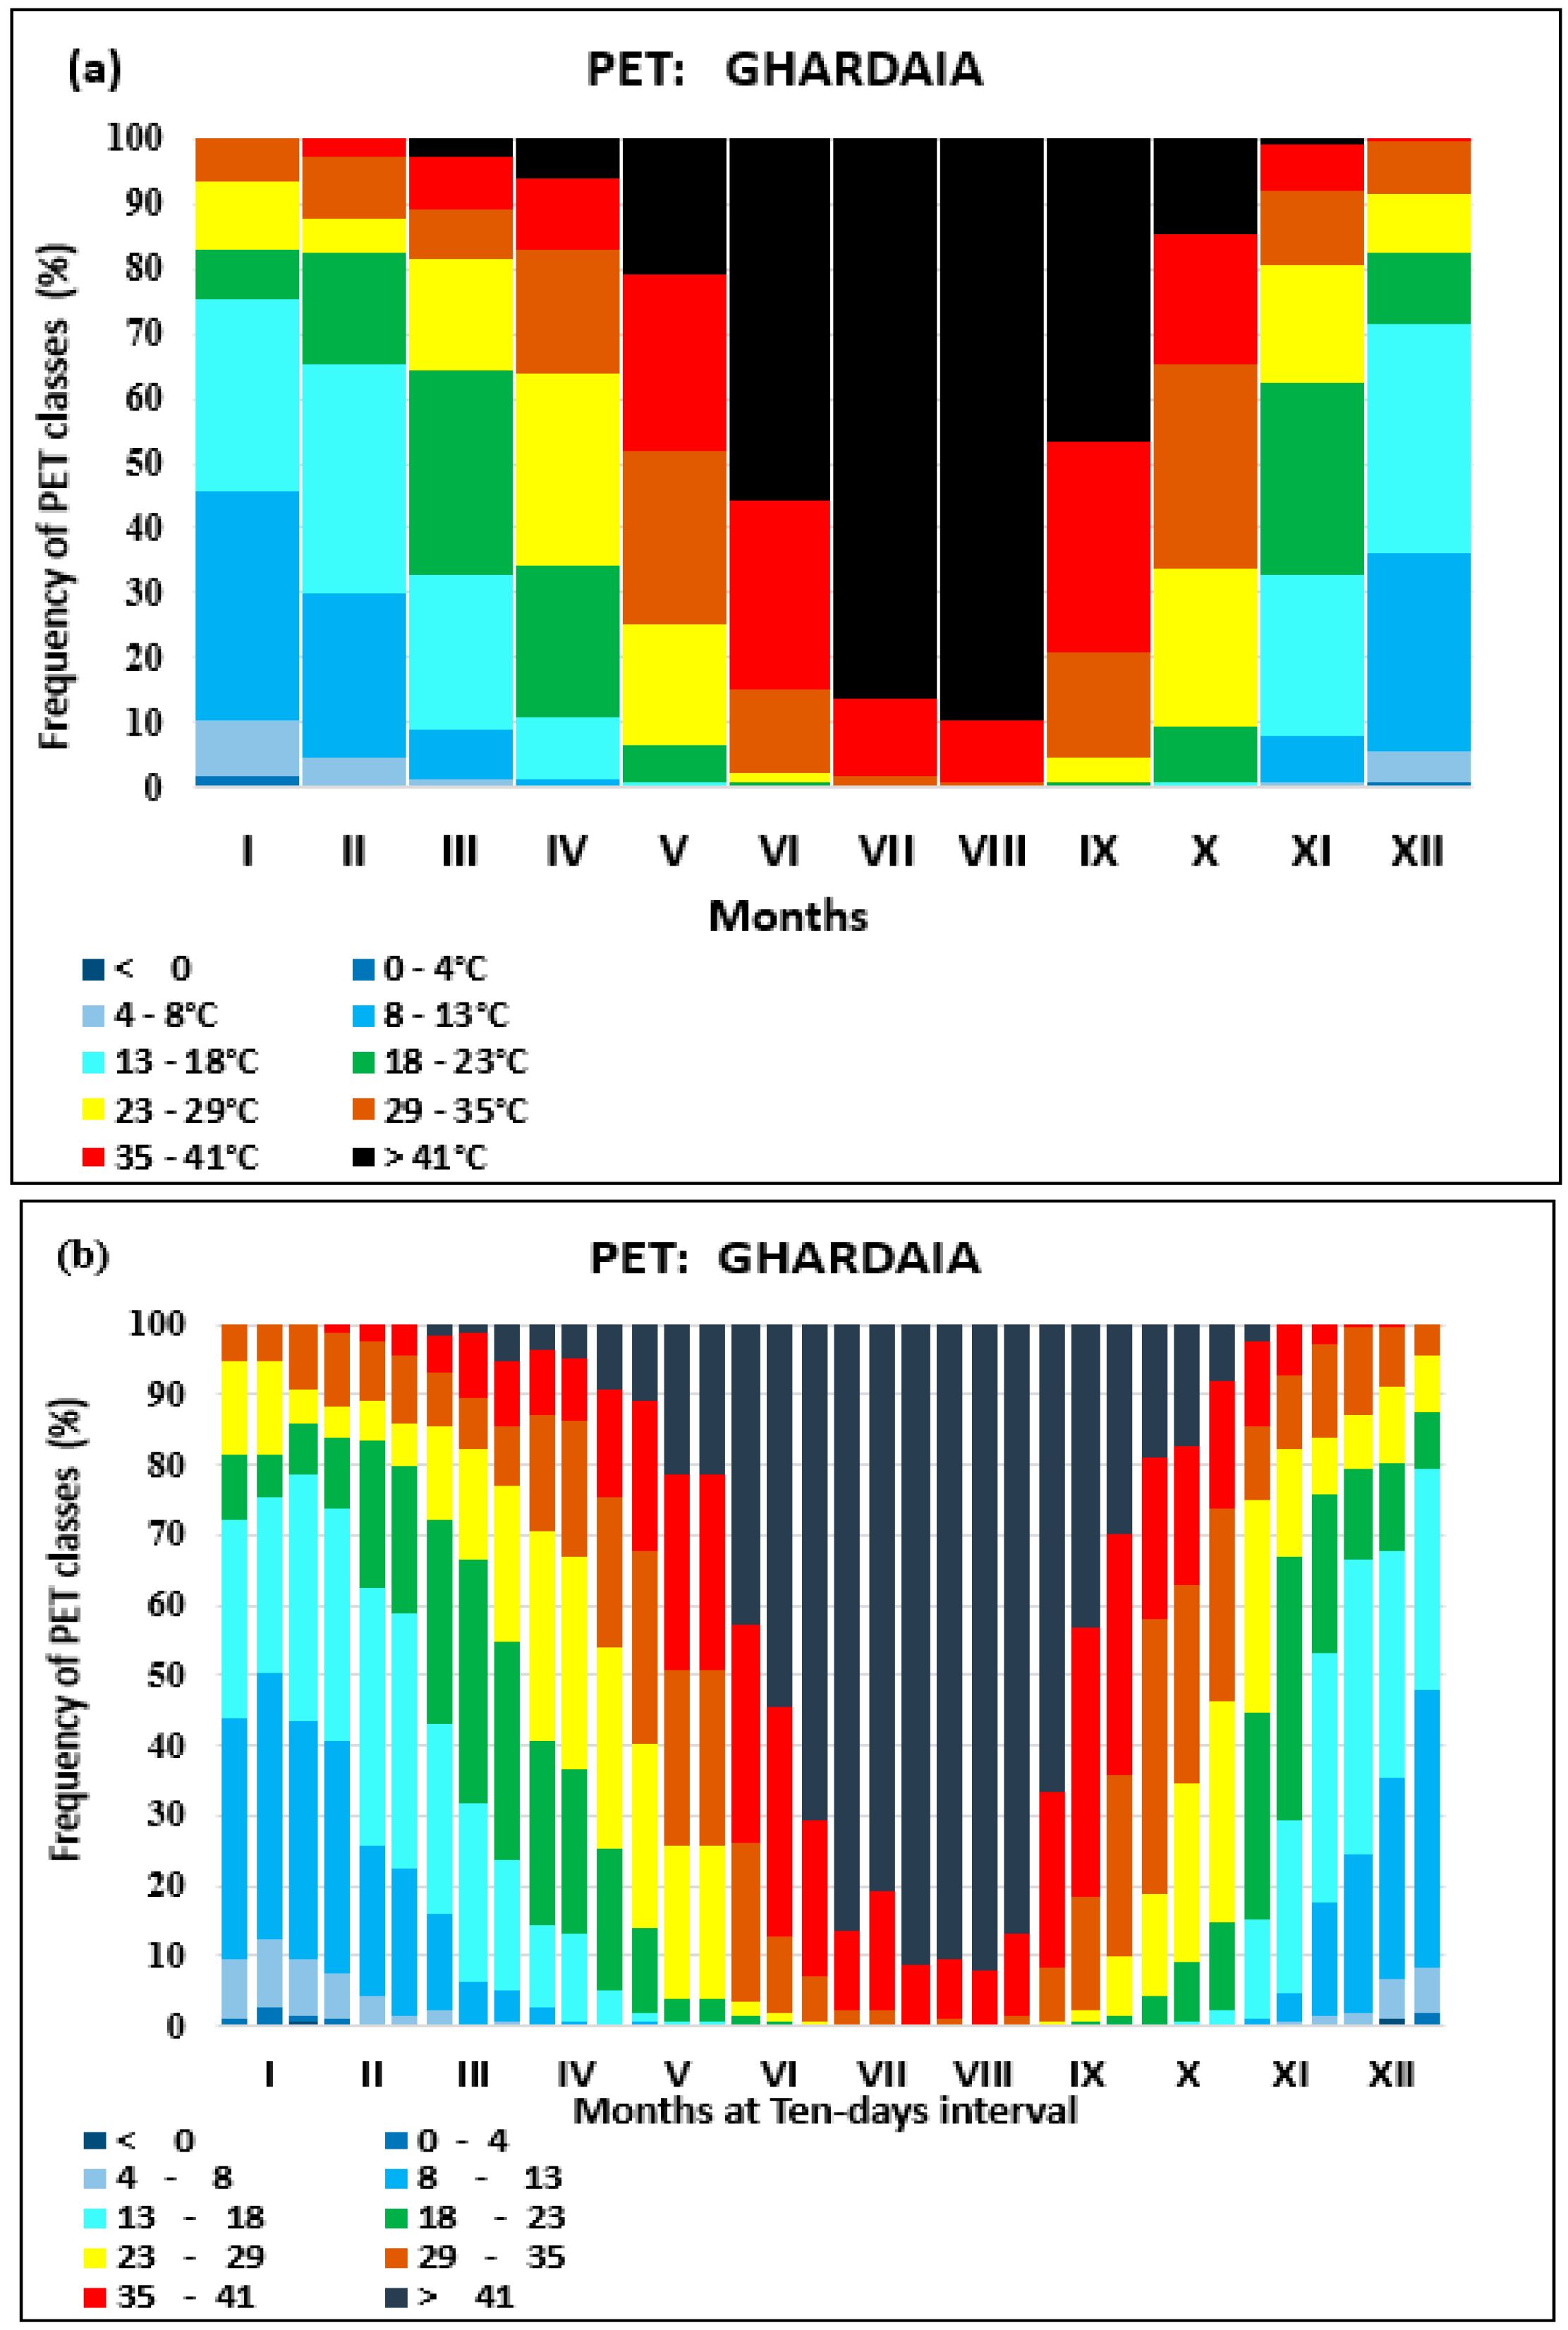
23] are elaborated and compared. In order to evaluate the different grades of thermal perception by humans,
Figure 2a,b illustrate the cumulated relative frequencies for PET values within the 10 classes of thermal perception according to
Table 3. The lowest PET values (<8 °C for cold and very cold thermal perception) are recorded during the winter (December–February) with less than 10% of the days. The majority of the remaining days in this season belong to the cool and slightly cool class with about 60%.
However, about 30% of the days with comfortable human comfort conditions (18 °C < PET < 23 °C) are observed in March and April. The hot and very hot days (PET > 35 °C and PET > 41 °C) are mainly observed for the period from the beginning of May to end September. The maximum rate of these two classes is observed in July and August reaching 99% of days. In terms of rating distribution, the average values of PET for Ghardaia presented at monthly temporal scale
Figure 2a shows that the percentage of the comfortable thermal perception in February is 17%. When considering a 10-day timescale resolution
Figure 2b, the repartition within this month shows that this class is rather observed in 21% of the days during the mid-February and last 10 days but only in 10% of days in the beginning. This class is however observed in May respectively at 12% of days during the first 10 days and only 3% for the remaining period. However, for the very hot thermal perception PET > 41 °C and during May, this class is observed during 11% of the days in first 10 days when it is 21% and 29% for the second and third 10 days, respectively.
Moreover, in September and at a monthly timescale, PET > 41 °C is observed at an average of 46% of days. This rate is not fairly distributed within this month at 10-day timescale. This class is rather observed for 66% of the days during the first 10 days while it is for almost the half (30%) for the last one in Ghardaia.
The outlined details of the time evolution of PET classes, given by the 10-day temporal resolution, consequently offer a wide variety of options for the choice of appropriate periods throughout the year in accordance with the type of desirable tourism and at an average duration of stay for tourists (which is not necessarily the month).
4.2. CTIS Diagrams
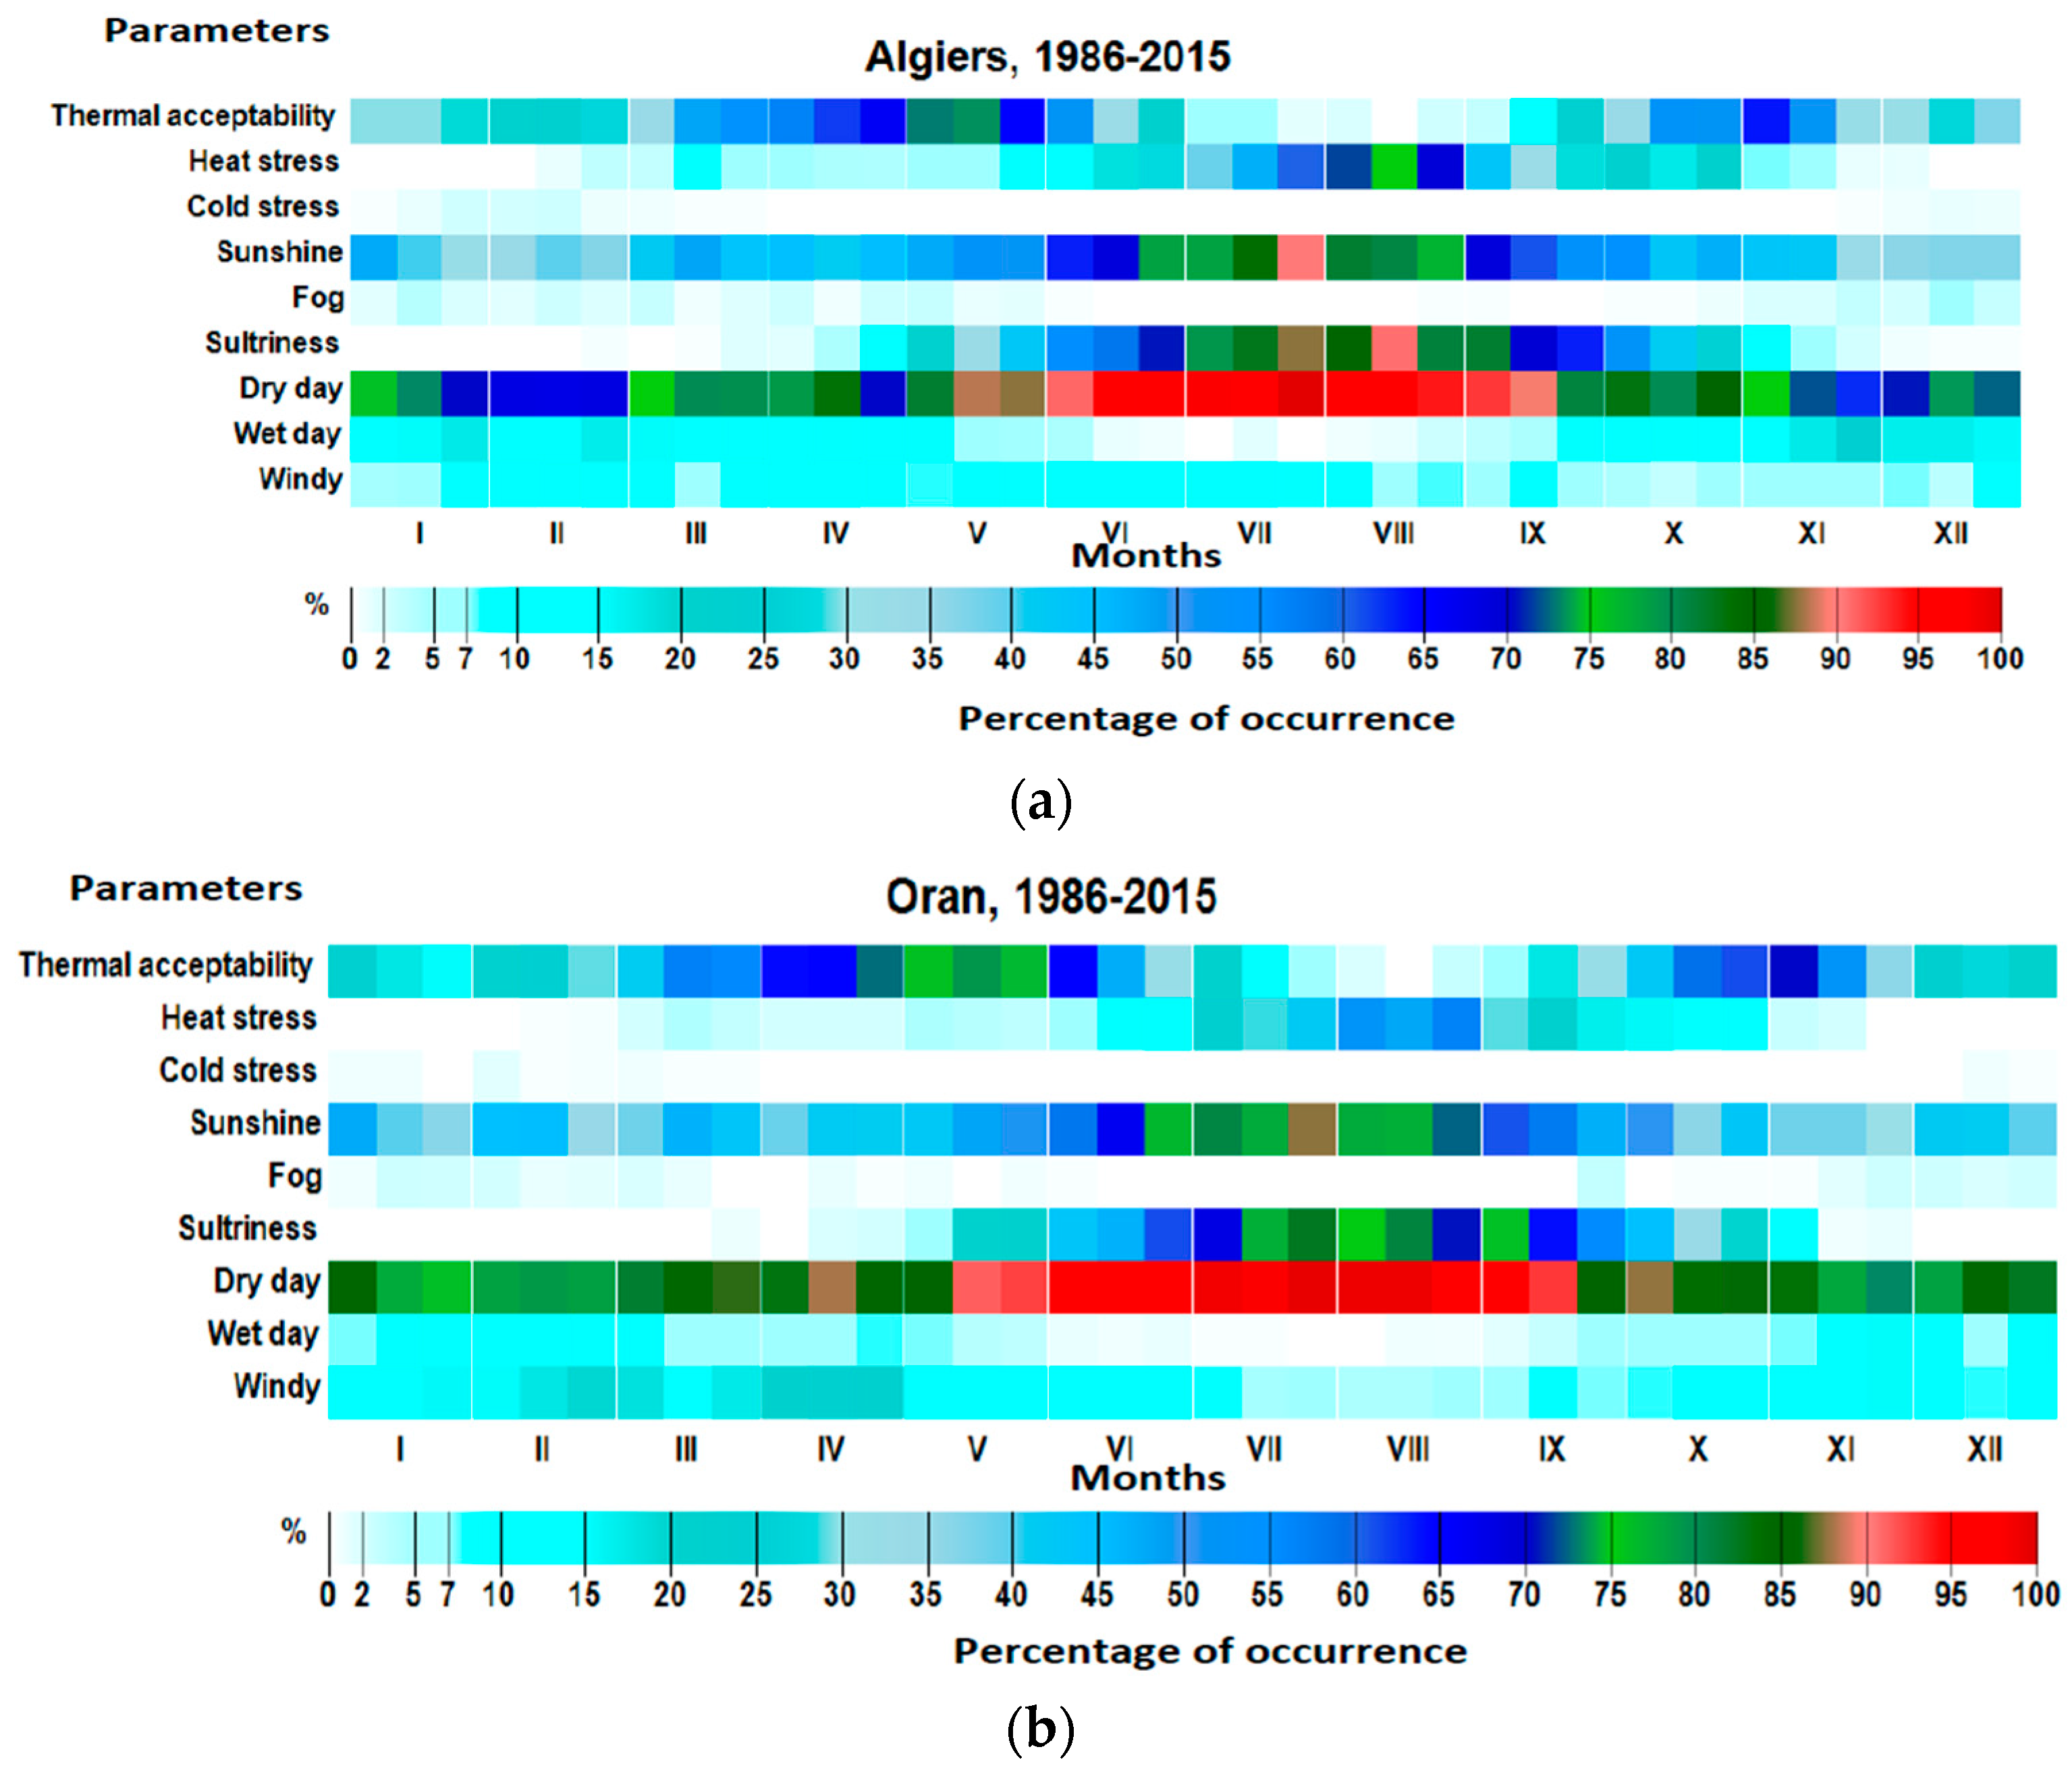
The information derived through CTIS is performed in terms of frequencies of occurrence of the different climatological and bioclimatological parameters. A 10-day temporal resolution of CTIS for the six selected cities is illustrated in
Figure 3a–f.
The PET within the elaborated CTIS diagram is analyzed for three levels of thresholds criteria representing three grades of thermal human comfort: Thermal acceptable conditions grade, reflecting the bioclimate situation for which PET is ranging between 18 °C and 29 °C. The one where PET is exceeding 35 °C materializes heat stress conditions and the case where PET is <4 °C, indicates cold stress class.
In Algiers (
Figure 3a) and Oran (
Figure 3b), due to the mid-latitude weather regime, thermal acceptable conditions (18 °C < PET < 29 °C) referring to favorable conditions for tourism and recreation activities take place notably from spring to up to beginning of summer (March to early days of June), then from October to the mid-November in more than 50% of the days. The maximum score for both cities is observed during the beginning and mid-May (>70%).
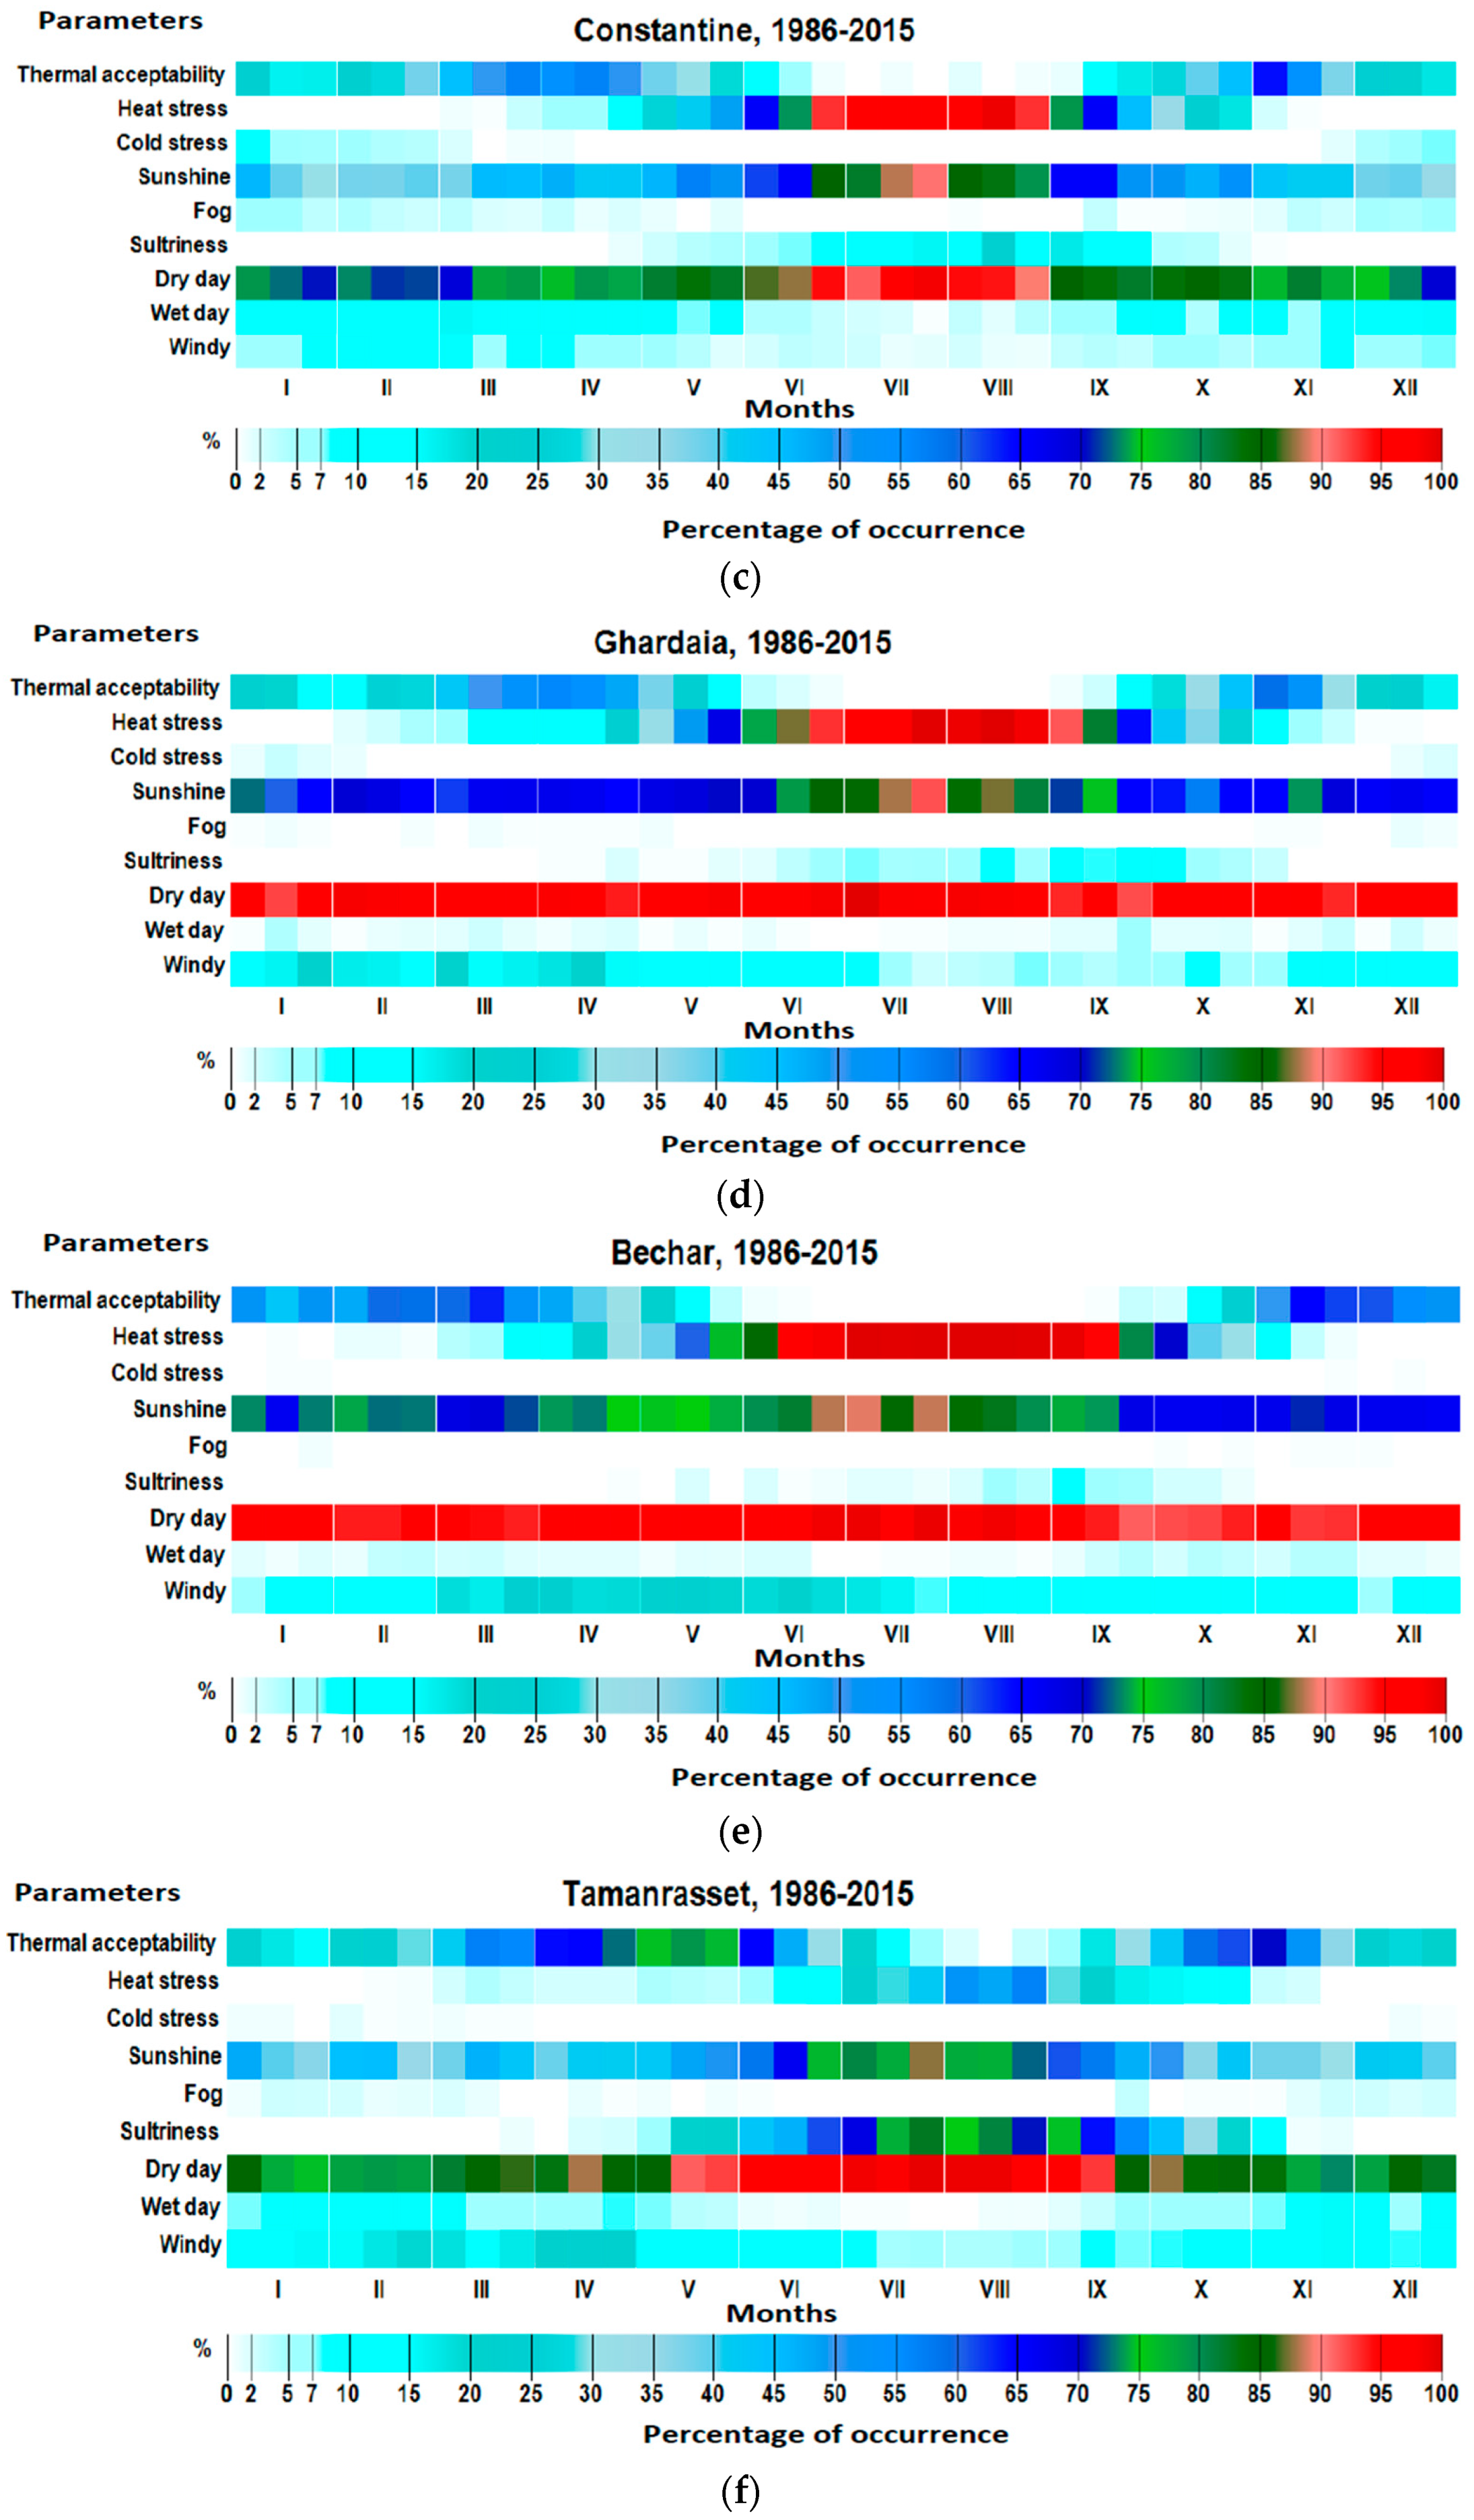
Being an inland city, and because of the continental and elevation effect, the comfortable conditions in Constantine (
Figure 3c) last shorter while they occur only in March and April in spring and from the end of October to mid-November in Autumn. The peak in this city is observed during the first two 10-day of April (54%). Furthermore, the characteristics of the desert climate are more pronounced in Ghardaia (
Figure 3d), Bechar (
Figure 3e) and Tamanrasset (
Figure 3f). The comfort conditions in these cities are mainly perceived from the end of autumn (November) to early spring (March) in more than 50% of days, leading to ideal conditions during this period. For Tamanrasset, the comfortable human thermal class is dominant during the second 10 days of January (79%), while it is observed in mid-November respectively for Bechar (65%) and Ghardaia (59%).
During summer, the Azores-high pressure system dominates the atmospheric circulation of the temperate latitudes, extending to the northern region of Algeria. This system affects strongly the human bioclimate and exacerbates the hot thermal perception conditions (PET > 35 °C) for about 70% of days in Algiers and Oran, reaching more than 90% in July and August for Constantine. The strong heat stress conditions persist about 4 months during the summer (June to September) in Bechar, Ghardaia and Tamanrasset. Because of continental and elevation effects and with approximately 8% of days, Constantine is the only city that experiences cold stress thermal perception (PET < 4 °C) during the last 10 days of December and the first 10 days of January.
The atmospheric circulation over the Mediterranean region during the summer is most commonly characterized by weak winds at the surface and subsidence of air atmosphere from the high troposphere. This circulation brings often then, clear skies as the formation of clouds is inhibited. This phenomenon accentuates the occurrence of sunshine days to reach over 80% in Algiers, Oran as well as Constantine. These conditions lead consequently to an elevation on the rate of dry days during this season (90%) over these three cities. However, for the Saharan cities (Bechar, Ghardaia and Tamanrasset), almost more than 70% of days with nebulosity less than 5 octas are recorded through the whole year with a peak on the early July (90%).
Because of their proximity to the Mediterranean Sea, and engendered by high water vapor pressure caused by excessive air temperatures, the severest degree of sultriness remarkably occurs in summer in Oran and Algiers (close to 90%). Moreover, due to its high altitude and its distance from the Mediterranean Sea, Constantine exhibits, for the same season, less than 23% of days in terms of sultriness. This parameter is however rarely recorded in Bechar and Ghardaia (about 8% during the early September) and quasi-non-existent in Tamanrasset.
Naturally, advection and frontal fog (considered here when relative humidity is exceeding 93%) take place predominantly during winter months in the northern cities respectively with a maximum during the second 10 days of December and January (respectively 5% of days for Algiers and 3% for Oran). Exceptionally, during the end of September, Oran shows 3% of days of fog occurrence. This phenomenon appears notably in this season due to the presence of two major wetlands surrounding Oran city: The “Sebkha d’Oran” in the south-west—which is a saline endorheic system of an area equivalent to 568.7 km
2—and the “Saline d’Arzew” with an area of 57.8 km
2 [
38] located at the east. Early on summer mornings, the conditions in both wetlands favor dew when air temperature drops below the dew point temperature at night and cold air collects in the lowest areas, often wetlands. The wetlands themselves retain the heat of the day and when the cold moist air and the warm ground meet, fog forms [
39].
Rainy days occurrence classified as wet (with a total amount >5 mm per day) that might negatively affect tourism activity or leisure, are evidently observed for the three northern cities (Algiers, Oran and Constantine), during winter at less than 20% of days for each 10 days’ time from November to March. Indeed, a maximum of 15% of wet days is observed during the end of November in Oran and in January in Algiers. On the other hand, in Bechar and Ghardaia, the wet days take place during winter without exceeding 10 days in each place—4% for Bechar in November and 2% for Ghardaia.
Influenced sporadically by the extreme offshoots of the African monsoon, bringing some cloudiness and occasional downpours during summer [
7], hence, the wet days in Tamanrasset are predominately observed for 3% of days by the end of August.
Stormy days hereinafter referred to days where the wind velocity is greater than 8 m/s, considered affecting negatively tourism and recreation activities outside. The stormy days prevail mostly during spring in Bechar and Tamanrasset with respectively 25% of days during the last March and 23% on mid and end April. Ghardaia exhibits a maximum rate of stormy days from December to April reaching 18% of days per month. For Algiers, the windy days occur mostly on June (11%) but at the 10-day timescale, their preponderance is recorded at the end of January. The largest appearance of windy days is identified for Oran in mid-April with a maximum of 23% of days and in February by the end of this month in Constantine with 11% of days.
Dust storms occur when strong winds blow sand and dust from a dry surface. They are related to the occurrence of strong winds along the southern Mediterranean coast zone, which in turn depend on synoptic-scale weather systems at the surface and at upper levels [
40]. During the warm season, deep moist convection regularly forms over the peaks of the Atlas Mountains in Morocco and Algeria. In situations of a favorable wind shear, evaporation of precipitation on the hot and dry southern side creates extended cold-air pools that propagate into the northern Sahara in the form of density currents [
41,
42].
Dust storm phenomenon acts then negatively by reducing the visibility, polluting the atmosphere, particularly when the wind speed is getting stronger. The impact of this phenomenon on tourism activities in the Saharan cities is highlighted through the calculation of its monthly frequency occurrence. The lowest monthly mean number of days with sand/dust winds during the period of the study in Bechar, Ghardaia and Tamanrasset stations is recorded in December, with 1.4 days for Bechar and 0.3 days for Tamanrasset. While it is observed in Ghardaia in November and December, respectively with 2.4 and 2.2 days.
In the Algerian coastal area, “May”, offers the most favorable climate and bioclimate conditions for tourism. In this month, 70% of days in Algiers (77% for Oran) show acceptable thermal perception, 51% of days in Algiers (47% for Oran) of cloudiness <5 octas and 86% of days in Algiers (90% for Oran) are without rain. The unfavorable parameters for tourism activities in this month are relatively weak: the occurrence of days with relative humidity higher than 93% is less than 2% in Algiers (0.4% for Oran), that of storms (wind velocity >8 m/s) is 8% for Algiers (13% for Oran). The wet days during this month (daily total amount of precipitation >5 mm) appears in 6% of days for both Algiers and Oran. The sultriness during May is manifesting in Algiers for 33% of days and in Oran for 16%.
However, the maximum of manifestation of comfortable conditions are recorded in Constantine in April with 54% of days, followed by November with 52%. When referring to the heat stress thermal perception occurrence (PET > 35 °C) in this city, April exhibits 9% against less than 1% for November. The rates of all remaining elements are roughly identical: in April, the number of days with nebulosity less than 5 octas constitutes 44% of the days (42% for November), the daily amount rainfall less than 1 mm and more than 5 mm is respectively observed for 77% and 11% of days (against 79% and 9% in November). For both months, fog conditions are recorded in 2% of days, while those of sultriness remain negligible.
Because of their climate properties, adding to sand/dust winds, the most pertinent bioclimatic parameters considered for the elaboration of the CTIS for the Saharan cities are PET, wind velocity and wet days, respectively.
Bechar with 56% of days having PET between 18 °C and 29 °C, neither heat nor cold stress conditions occur, less than 9% of stormy days, only 1% of wet days and a lowest frequency of sand/dust phenomenon (1.4 days), December is the most favorable month for tourism. However, the highest rate of thermal acceptable conditions class is observed during the mid and end of November for more than 60% of days where only 9% of the days in this month are qualified stormy.
The thermally acceptable bioclimatic conditions in Ghardaia are observed in November and March for 50% of days. However, with 8% of the days with PET > 35 °C (hot and very hot days) and the lowest frequency of stormy days (9%) and 2.4 days with sand/dust winds, November could be the most appropriate month for visiting Ghardaia.
Thermal acceptability class in Tamanrasset is observed in about 70% of days during both December and January, where hot thermal perception conditions and wet days frequencies throughout these two months are rare (<1%). Wind speed greater than 8 m/s occurs on only 6% of days in December and 8% in January, when dust wind phenomenon occurrence is negligible.
4.3. Decadal (10 Years) Occurrence Evolution of Annual Cold (PET < 4 °C) and Heat (PET > 35 °C) Stress, Thermal Acceptability (18 °C < PET > 29 °C) and Sunny Days (Nebulosity < 5 octas) during the Period 1986–2015
To analyze the evolution of the annual frequency of days for different human thermal comfort thresholds based on PET, as well as sunny days used in the elaboration of the CTIS, a non-parametric Mann–Kendall test and Sen’s slope estimates [
43] are employed. This approach aims to determine the statistical significance and magnitude of the calculated trend in number days with PET < 4 °C, PET > 35 °C, 18 °C < PET < 29 °C and nebulosity < 5 octas for each city and during the period of the study. The results of Mann–Kendall’s test on annual occurrence evolution of these parameters and for the six stations are summarized in
Table 4. The number of days of PET exceeding 35 °C threshold has significantly increased between 1986 and 2015. The number of hot days has significantly raised (at α = 0.05 significance level) in Algiers with a rate of +9 days/decade (10 years) and Oran with +12 days/decade. A similar trend is also observed for Constantine and Tamanrasset both with +7 days/decade and for Bechar and Ghardaia respectively with +14 days/decade and +5 days/decade.
The occurrence of days with acceptable human thermal comfort has significantly decreased in Oran with −14 days/decade and in Algiers with −5 days/decade. It was rather weaker in Ghardaia with only −3 days/decade. However, no significant trend of this class is observed for the rest of stations. The number of days of very cold thermal perception does not show any statistically significant trend (at α = 0.05 significance level) for the whole stations, while no day with PET < 4 °C is observed in Tamanrasset during the period 1986–2015.
The decadal trend of the number of sunny days in Ghardaia is significant and equivalent to +10 days/decade. Whereas, it was about +9 days/decade and statistically significant (at α = 0.05 significance level) for Constantine and +3 days/decade for Algiers. However, the frequency of sunshine days in Tamanrasset is significantly decreasing with an average of −10 days/decade.
5. Discussion
The PET bioclimate diagram elaborated for Ghardaia illustrates the severity of the climate of this city particularly during the summer (June and July). Every day during this season exhibits a strong to extreme heat stress bioclimate. A study completed by Sahabi and Matzarakis [
7], found similar results in the analysis of PET of Bechar and Tamanrasset characterizing by a desert and hot arid climate. A comfortable to moderate climate conditions in this city are rather observed in November, March and April with 50% of days.
Using the 10-day temporal resolution, which corresponds globally to the average duration of stay for tourism purposes, provides a more detailed and accurate information regarding the probability of occurrence of comfort conditions, over the selected station. On the contrary of that, the presentation at a monthly temporal resolution of the human bioclimate thermal conditions using the PET gives rather a global and average picture. Therefore, the frequency distribution at monthly timescale of one or more thermal perception class which is very important for tourists, like that relative to extreme heat stress for Algiers could be less informative.
The climate severity is mostly responsible in the large difference of the occurrence of the strong heat stress observed between the cities in the northern zone and those in the Saharan region.
Moreover, PET as an integrated index could permit tourists to predict their perception of weather conditions. Therefore, the thermal adaptation and comfort level of tourists from different areas is crucial to adequately describe their perception. Consequently, local residents react differently than people from other regions and people from cold regions would have different thermal perception once visiting hot regions like Bechar or Ghardaia.
The yearly occurrence of hot days corresponding to PET > 35 °C and causing strong heat stress for the selected stations representing different types of climate in Algeria shows a significant upward trend since 1986. The maximum of growing decadal (10 years) rate is observed in Bechar (+14 days/decade), which should exacerbate the severe weather conditions in this city. Oran seems to be experiencing a substantial reduction in the frequency of days with thermal acceptable human comfort (−14 days/decade); in the meanwhile, a significant augmentation of the days with heat stress is observed (+12 days/decade). This should inform the tourism industry about the direction of the future weather and human bioclimate conditions in these cities.
The CTIS diagram reveals that the most favorable thermal bioclimatic conditions occur particularly during spring and persist approximately five 5 months in Algiers (
Figure 3a) and Oran (
Figure 3b) and only 3 months in Constantine (
Figure 3c). However, the most appropriate period for visiting the Saharan cities is winter, particularly in November and December.
The elaborated CTIS presented at a 10-day timescale could help tourists to choose readily the appropriate time of the year, the particular destination and the type of tourism activity according to the occurrence of the climate features. For instance, and for particular recreational and sports activities along the coast like sailing and boating, the CTIS shows that the most frequent windy days in Oran, as well as Algiers, occur in mid-April. For outdoor tourism and to avoid climate-sensitive exposures, aged and vulnerable visitors are advised to plan that during the first 10 days of November or the last 10 days of April in Constantine and preferably in the beginning of November for Ghardaia. The nature of the activity to propose for particular customers can also be provided on the basis of the elaborated CTIS at 10-day time resolution. People suffering from sultry and suffocating weather has to avoid the first 10 days of October for visiting Algiers when the average occurrence of sultry days in this city is observed for an average of 6 days. However, the least occurrence of sultry days is most likely observed in the last 10 days of this month with an average of 3 days, while occurring during 12 days in the whole of October.
The general features of weather which could influence the possibility of recreation outdoors given at 10-day time resolution are therefore much more advantageous for tourists as well as practitioners.
As Algeria is enjoying different types of climate, the CTIS elaborated at hourly time resolution could allow much more stakeholders to obtain detailed information in order to program activities (outdoor or indoor) with the highest level of comfort, safety and enjoyment.
The CTIS results obtained are comparable regionally. In this context, Matzarakis [
13] elaborated the CTIS for Mallorca (Spain) for the period 1961–1990. Enjoying similar Mediterranean climate properties to the Algerian Coastal cities, Mallorca city exhibits approximately identical CTIS evolution characteristics. The values of minimum and maximum obtained frequency rates of aesthetic and thermal parameters are approximately equivalent and relatively identified at the same periods.
Regionally and in the context of climate change impacts on tourism activities on the Mediterranean region, Viner and Agnew [
44] evoke the influence of climate change on the tourist destination over Western Europe. They concluded that Mediterranean coast of France would undoubtedly be rather less affected than Spain or Greece, already hotter. The tourism destination in this region would profit from a comparative advantage compared to other Mediterranean regions.
The evolution of tourism activity in the Mediterranean region was also studied by Amengual et al. [
45] using the second-generation Climate Index for Tourism (CIT). The authors show that the optimal climate asset by 2075–2094 is projected to deteriorate in summer across the Mediterranean. Whereas, it is only slightly improving in northwestern Europe. Similar results were also obtained in the assessment of the potential impacts of climate change on tourism demand in the case study regions of Sardinia (Italy) and Cap Bon (Tunisia) [
46]. According to authors’ conclusions, climatic conditions for beach tourism are expected to improve in shoulder seasons while increased heat stress may cause tourism demand to decline in summer peak season.
The investigations of the climate future evolution of the coastal Algerian cities are then of vital interest in order to determine adequate measures to be included in the future strategy of tourism industry.
6. Conclusions
In the literature, few investigations examining the relationship between climate and tourism in Algeria exist. Specifically, the main objective of this study is to assess the climatic suitability of a potential tourist destination in Algeria and the results are intended to serve as a decision aid particularly for those interested on tourism and leisure activities.
In this context, the study investigates the evolution of the climate and human bioclimate parameters during last decades (1986–2015) for tourism and recreation purposes. As a preliminary approach, six important economic and favored tourist’s destinations cities in Algeria were selected.
To emphasize the importance and the relevance of these parameters, the results were provided in a form of CTIS as the information diagram could be readily used in a simple and friendly way. The CTIS is given at a 10-day timescale resolution which provides not only a rich and detailed picture of the occurrence of the parameters that could affect positively or negatively tourist’s activities but also because it partly meets their expectations since it is corresponding to their average duration of stay (about 10 days).
Moreover, the high temporal resolution (10-day) of climate and aesthetic parameters comprised in CTIS, offers a detailed evolution of the different grades of physiological stress within the same month. Average conditions given at a monthly timescale may be of limited value to tourists who are more likely to be interested in the probability of experiencing extreme conditions such as heat stress or very cold thermal perception.
The authors in this study reveal that the most favorable thermal bioclimate conditions last longer (5 months) over the coastal cities like Algiers and Oran than in the inland (3 months) as Constantine. However, when combining thermal human bioclimate conditions to aesthetic and physical facets, spring season seems to be the best period for tourism and outdoor activities in the north of Algeria, especially the month of May for Oran and Algiers and April for Constantine.
To determine the suitable period for tourism and recreation in the Saharan cities, the study introduced further to the climate and bioclimate parameters elaborated by CTIS, the occurrence of sand and dust phenomena in Bechar, Ghardaia and Tamanrasset. The combination of all these climate elements reveals that November and December seem to be the most convenient months for tourism in the Saharan region.
The CTIS results should help to evaluate climate with respect to the activities planned. In this context, practitioners in the tourism industry should no longer disregard the climate factors or consider climate as a given. Because in the Algerian coastal regions, beach tourist destinations and particularly in summer depend mainly on favorable climatic conditions, like sunshine, no wind and no precipitation. However, other climate elements such as wind velocity may also be important for particular recreational activities (like water sports), in these regions. For this reason, tourism operators should diversify their products, through the provision of alternative types of tourism according to climate conditions.
Still, the perception of climatic conditions determined by thermal, aesthetic and physical factors by an individual person depends on its adaptation capacity and the weather conditions of the place where he lives. Furthermore, since weather and climate are crucially important factors in tourists’ decision-making and affect considerably the successful operation of tourism businesses, the obtained results extended to other popular tourist destinations in Algeria would be a major factor in the promotion of tourism business, leisure and hospitality industry.
In this study, authors explore the CTIS at 12.00 UTC. However, CTIS at hourly timescale resolution should help much more practitioners of tourism to program and adapt recreation activities (outdoor/indoor) with the highest level of thermal comfort. Such investigations at this timescale will undoubtedly offer a possibility to adapt the schedules in the months where the aptitude is most unfavorable.
In the context of climate change, Algeria as a Mediterranean region is stated as vulnerable to climate change impacts, which has been qualified as the “hot spot for climate change”. The study shows an increase in the frequency of days with a strong heat stress, at the same time, the total number of days favorable for tourism has declined in the selected cities. These conditions could undoubtedly affect tourist activity. To remedy this, it is necessary to explore alternative tourism options such as cultural tourism, nature tourism/ecotourism or adventure activities that are less vulnerable to climatic variability. Therefore, measures to both assess and monitor the impact of climate change on tourism development in Algeria should be a priority.
Yet recently, the Algerian government is devoting special attention to the development of the tourism sector with the purpose of increasing national productivity and income. Consequently, more investigations in the subject should give professional dedicated to tourism intermediation, a multitude of options for the choice of the adequate type of tourism and recreational activities to offer for the appropriate period to their customers.


