1. Introduction
Drinking water is a precious raw material [
3]. It is also an economic and strategic stake in the world [
4], that is increasingly reaching crisis status as we are consuming more fresh water than the planet procduces. To meet our needs, we are emptying the many years-old ground water reservoirs, we divert the course of major rivers [
5] and contaminate sources of drinkable water. If a man can be days without electricity and without food, it is on the other hand impossible to be more than a day without drinking [
2,
6].
In view of the amounts spent on obtaining, treating and transporting water, the economic stakes [
7], and the quoted social and cultural facts, it is important to minimize the volume of water lost to leaks. This suggests the usage of an algorithm, as an indispensable tool for the optimal management of a potable water distribution system.
After the presentation of the structure of the network in the
Section 2, we present in
Section 3 the network management parameters.
Section 4 is dedicated to the optimization algorithm and
Section 5 describes the application on the network of Bonaberi in Douala, Cameroon.
2. Structure of the Network
2.1. Presentation of the site
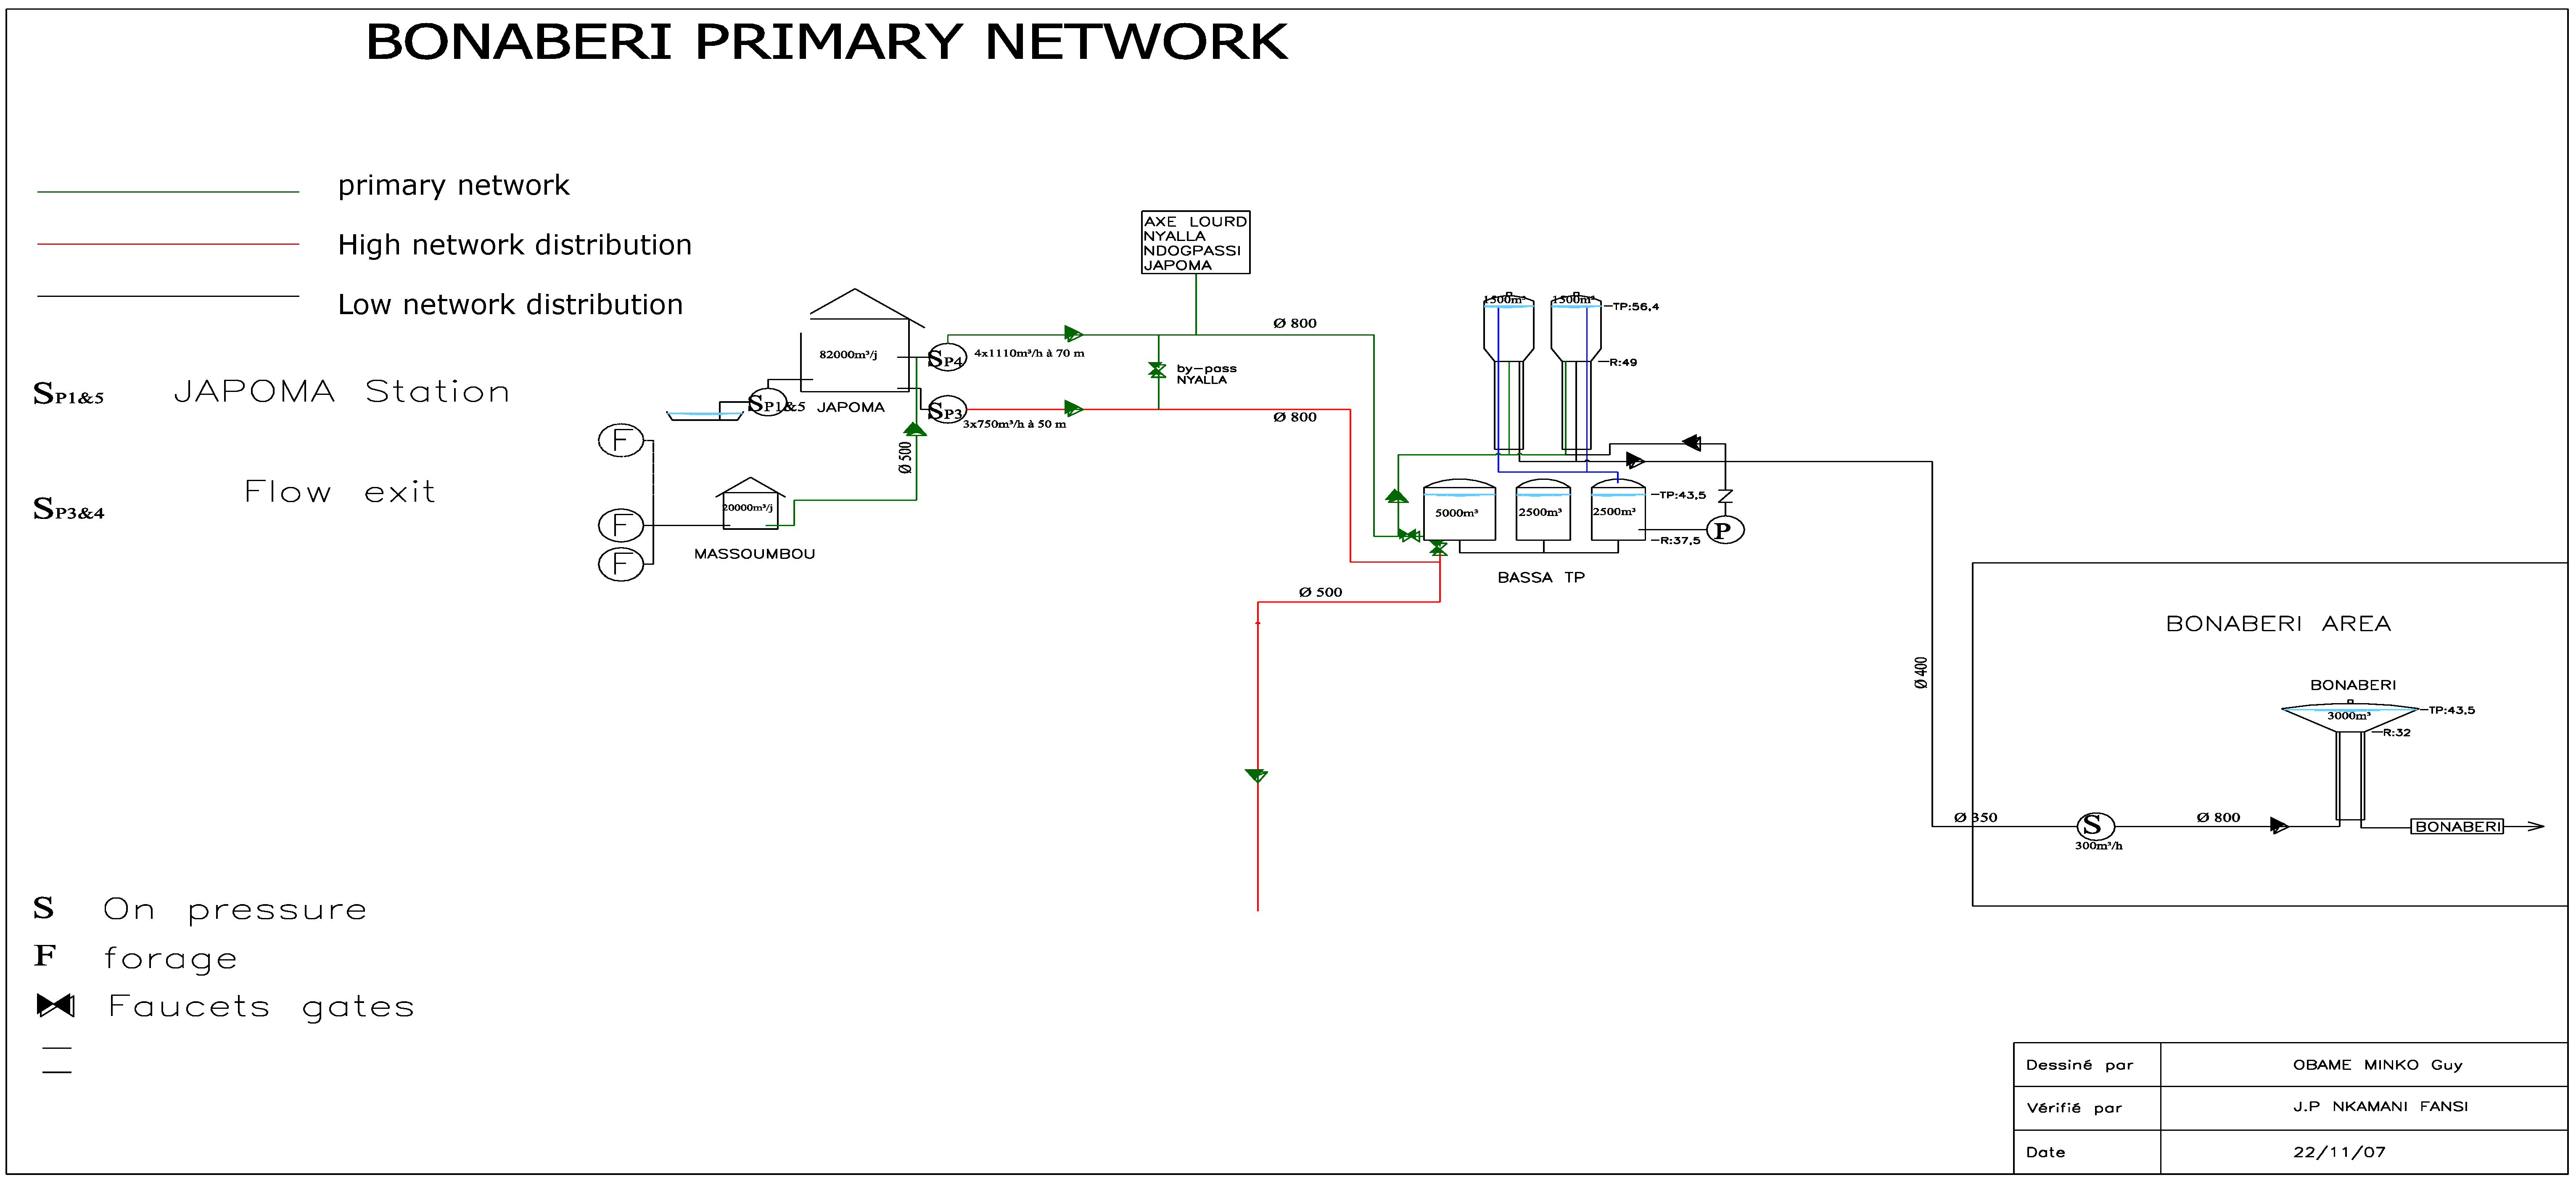
The water of the city of Douala comes from two 800 mm diameter pipes which carry the fluid from the Japoma treatment station. One of the pipes supplies the lower part of the city (low network), while the other one supplies the high part of the city (the high network).
Bonaberi is a low region of Douala. The water network which supplies it comes from the low network (
Figure 1 and
Figure 2) via a pipe 400 mm in diameter. At the entry of the bridge the pipe diameter is 350 mm until Bonassama. At the exit of the on pressure side of Bonassama the diameter of the pipe is 800 mm up to the castle (
Figure 1).
2.2. Elements of the network
The different parts of the Bonaberi network are similar to those of classic urban networks [
8]. We find cast iron or PVC pipe constituted of (
Figure 1 and
Figure 2):
- ◾
Faucets and gates
- ◾
Recorders of pressure and flows
- ◾
Volumetric meters
- ◾
Castles and water reservoirs
- ◾
Fire hydrants
- ◾
On pressure
- ◾
Manometers
Figure 1.
Overview diagram of the Bonabri-primary network. Extracted from the CDE archives.
Figure 1.
Overview diagram of the Bonabri-primary network. Extracted from the CDE archives.
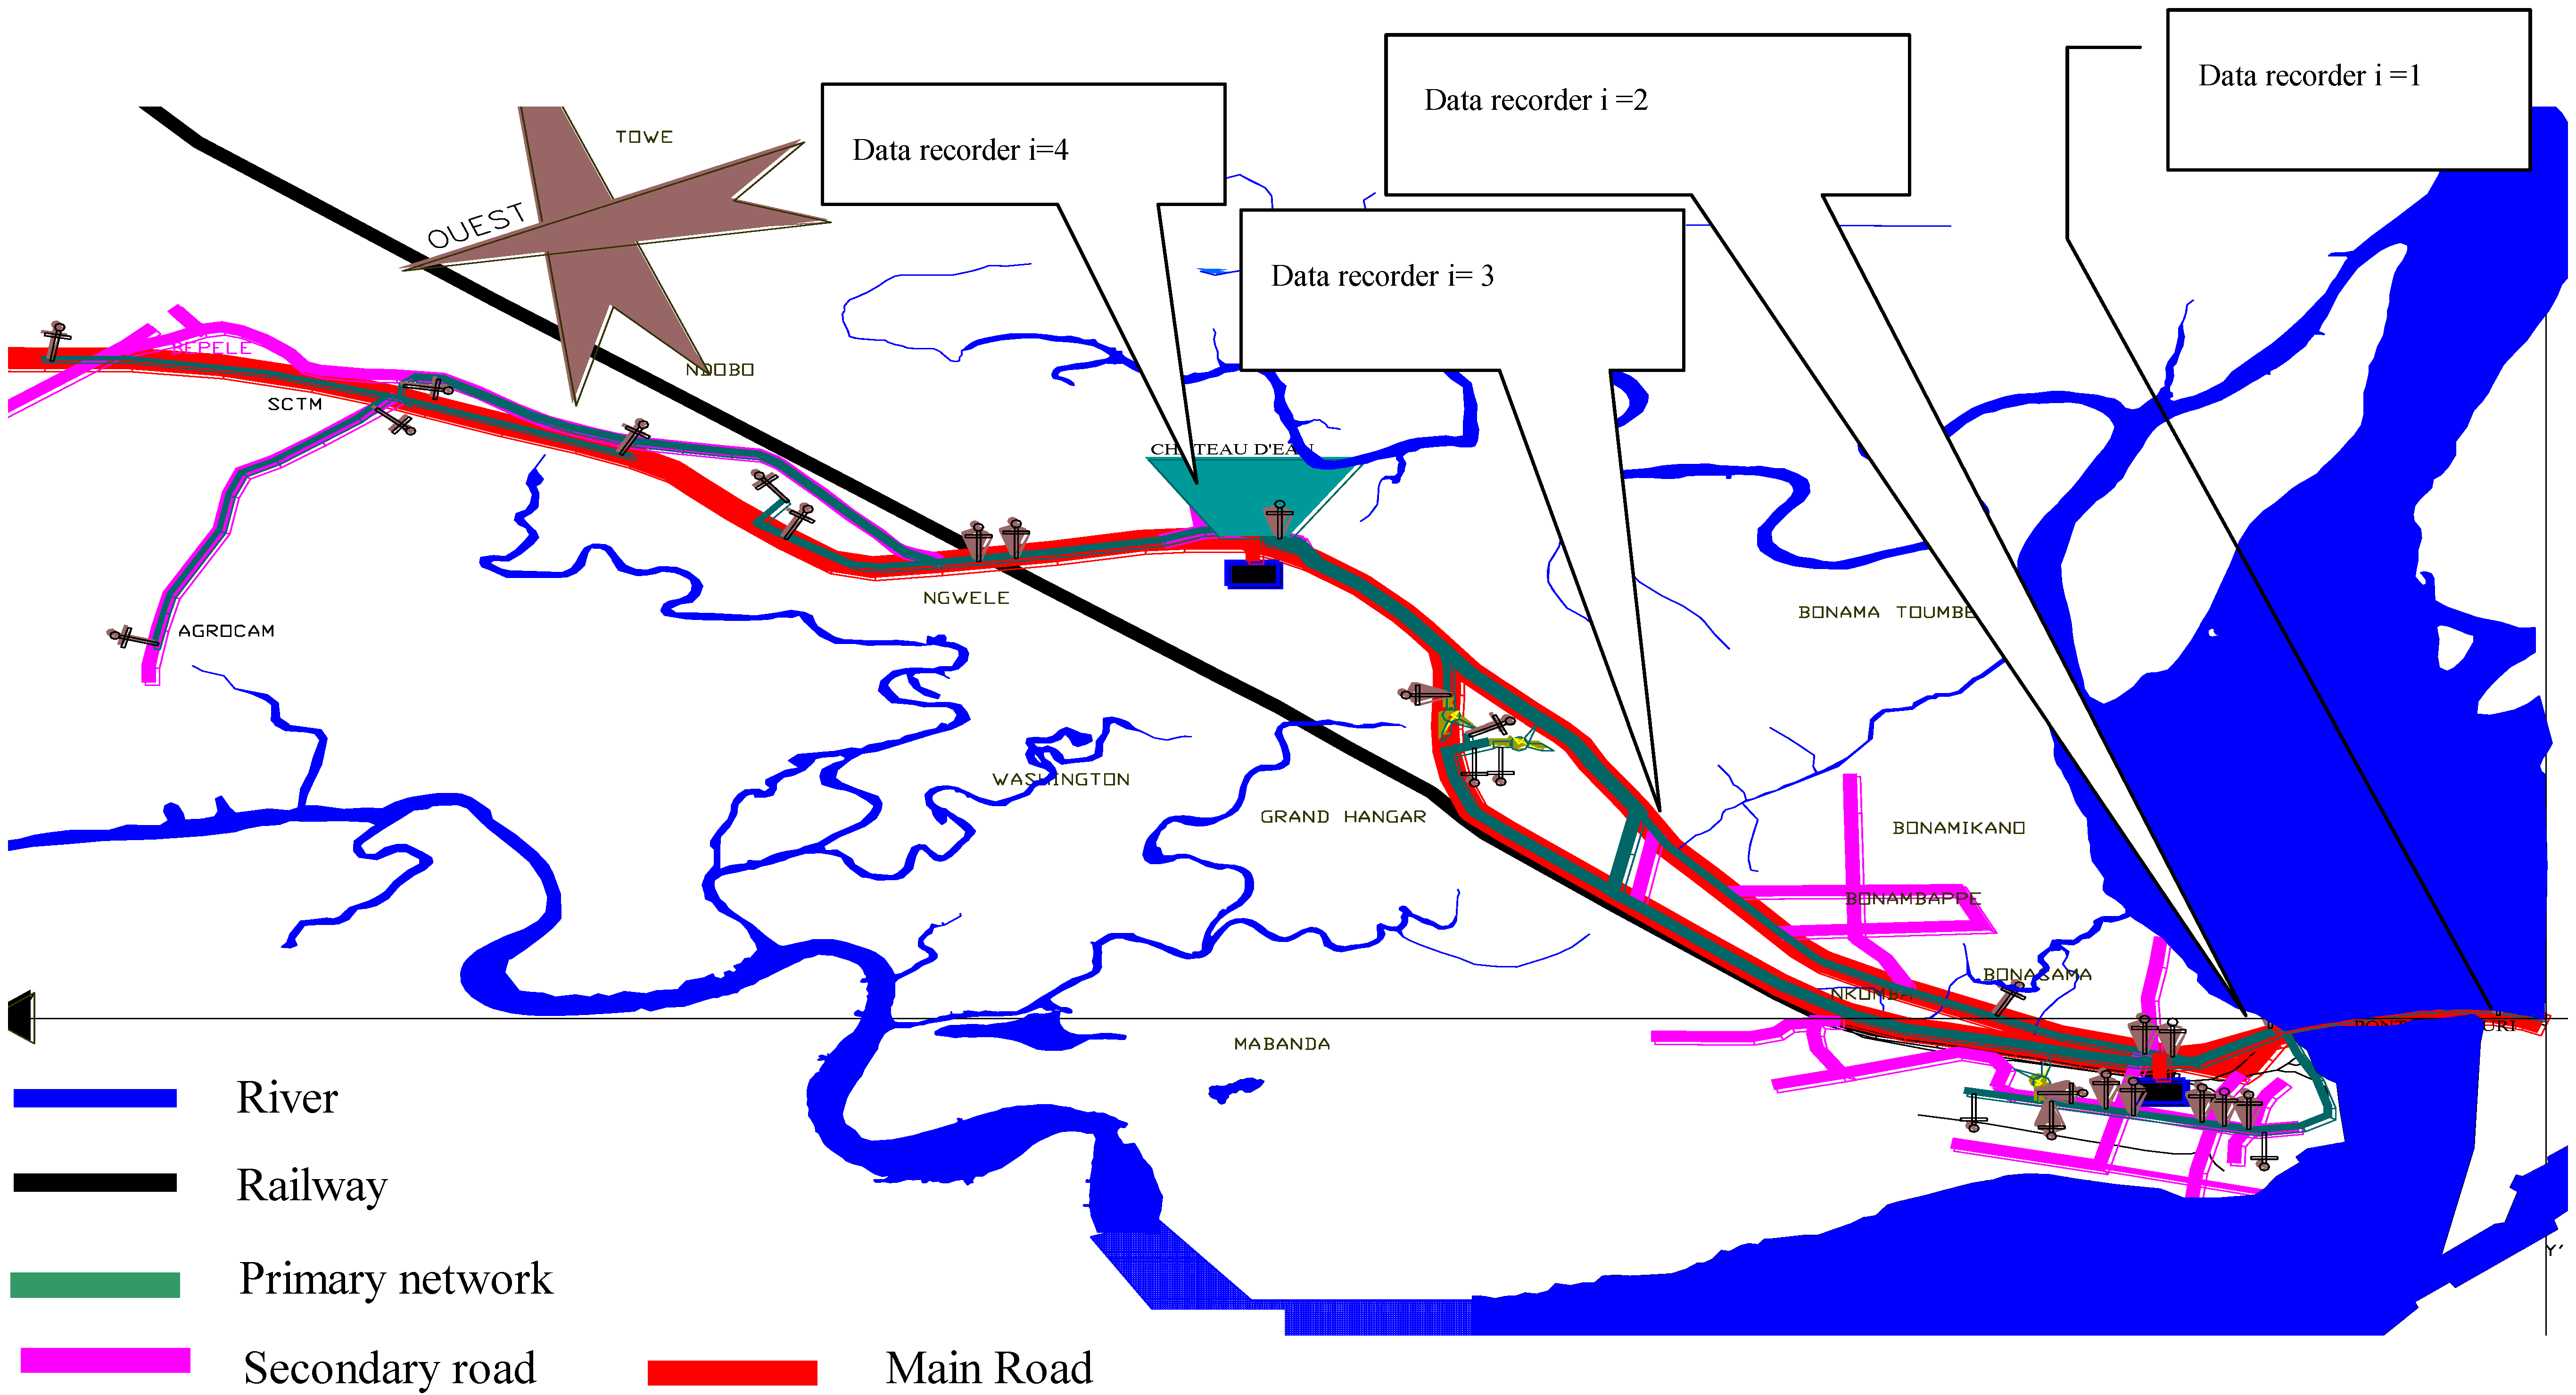
Figure 2.
Monitors in the Bonaberi area.
Figure 2.
Monitors in the Bonaberi area.
2.3. Problems
The drinkable water distribution system in sub-Sahelian Africa is dilapidated [
3,
6,
7]. The main problems are generally:
- ◾
difficulty of real-time detection of the leaks
- ◾
impossibility to minimize the volumes of water lost during the leaks
- ◾
impossibility to predetermine the degradation of the network
- ◾
absence of the appropriate sizing of the network
- ◾
degradation of the environment due to the leaks.
Hence the necessity to set up an algorithm which minimizes the volume of lost water, optimizing the access to the drinking water and widely contributing to the environmental protection.
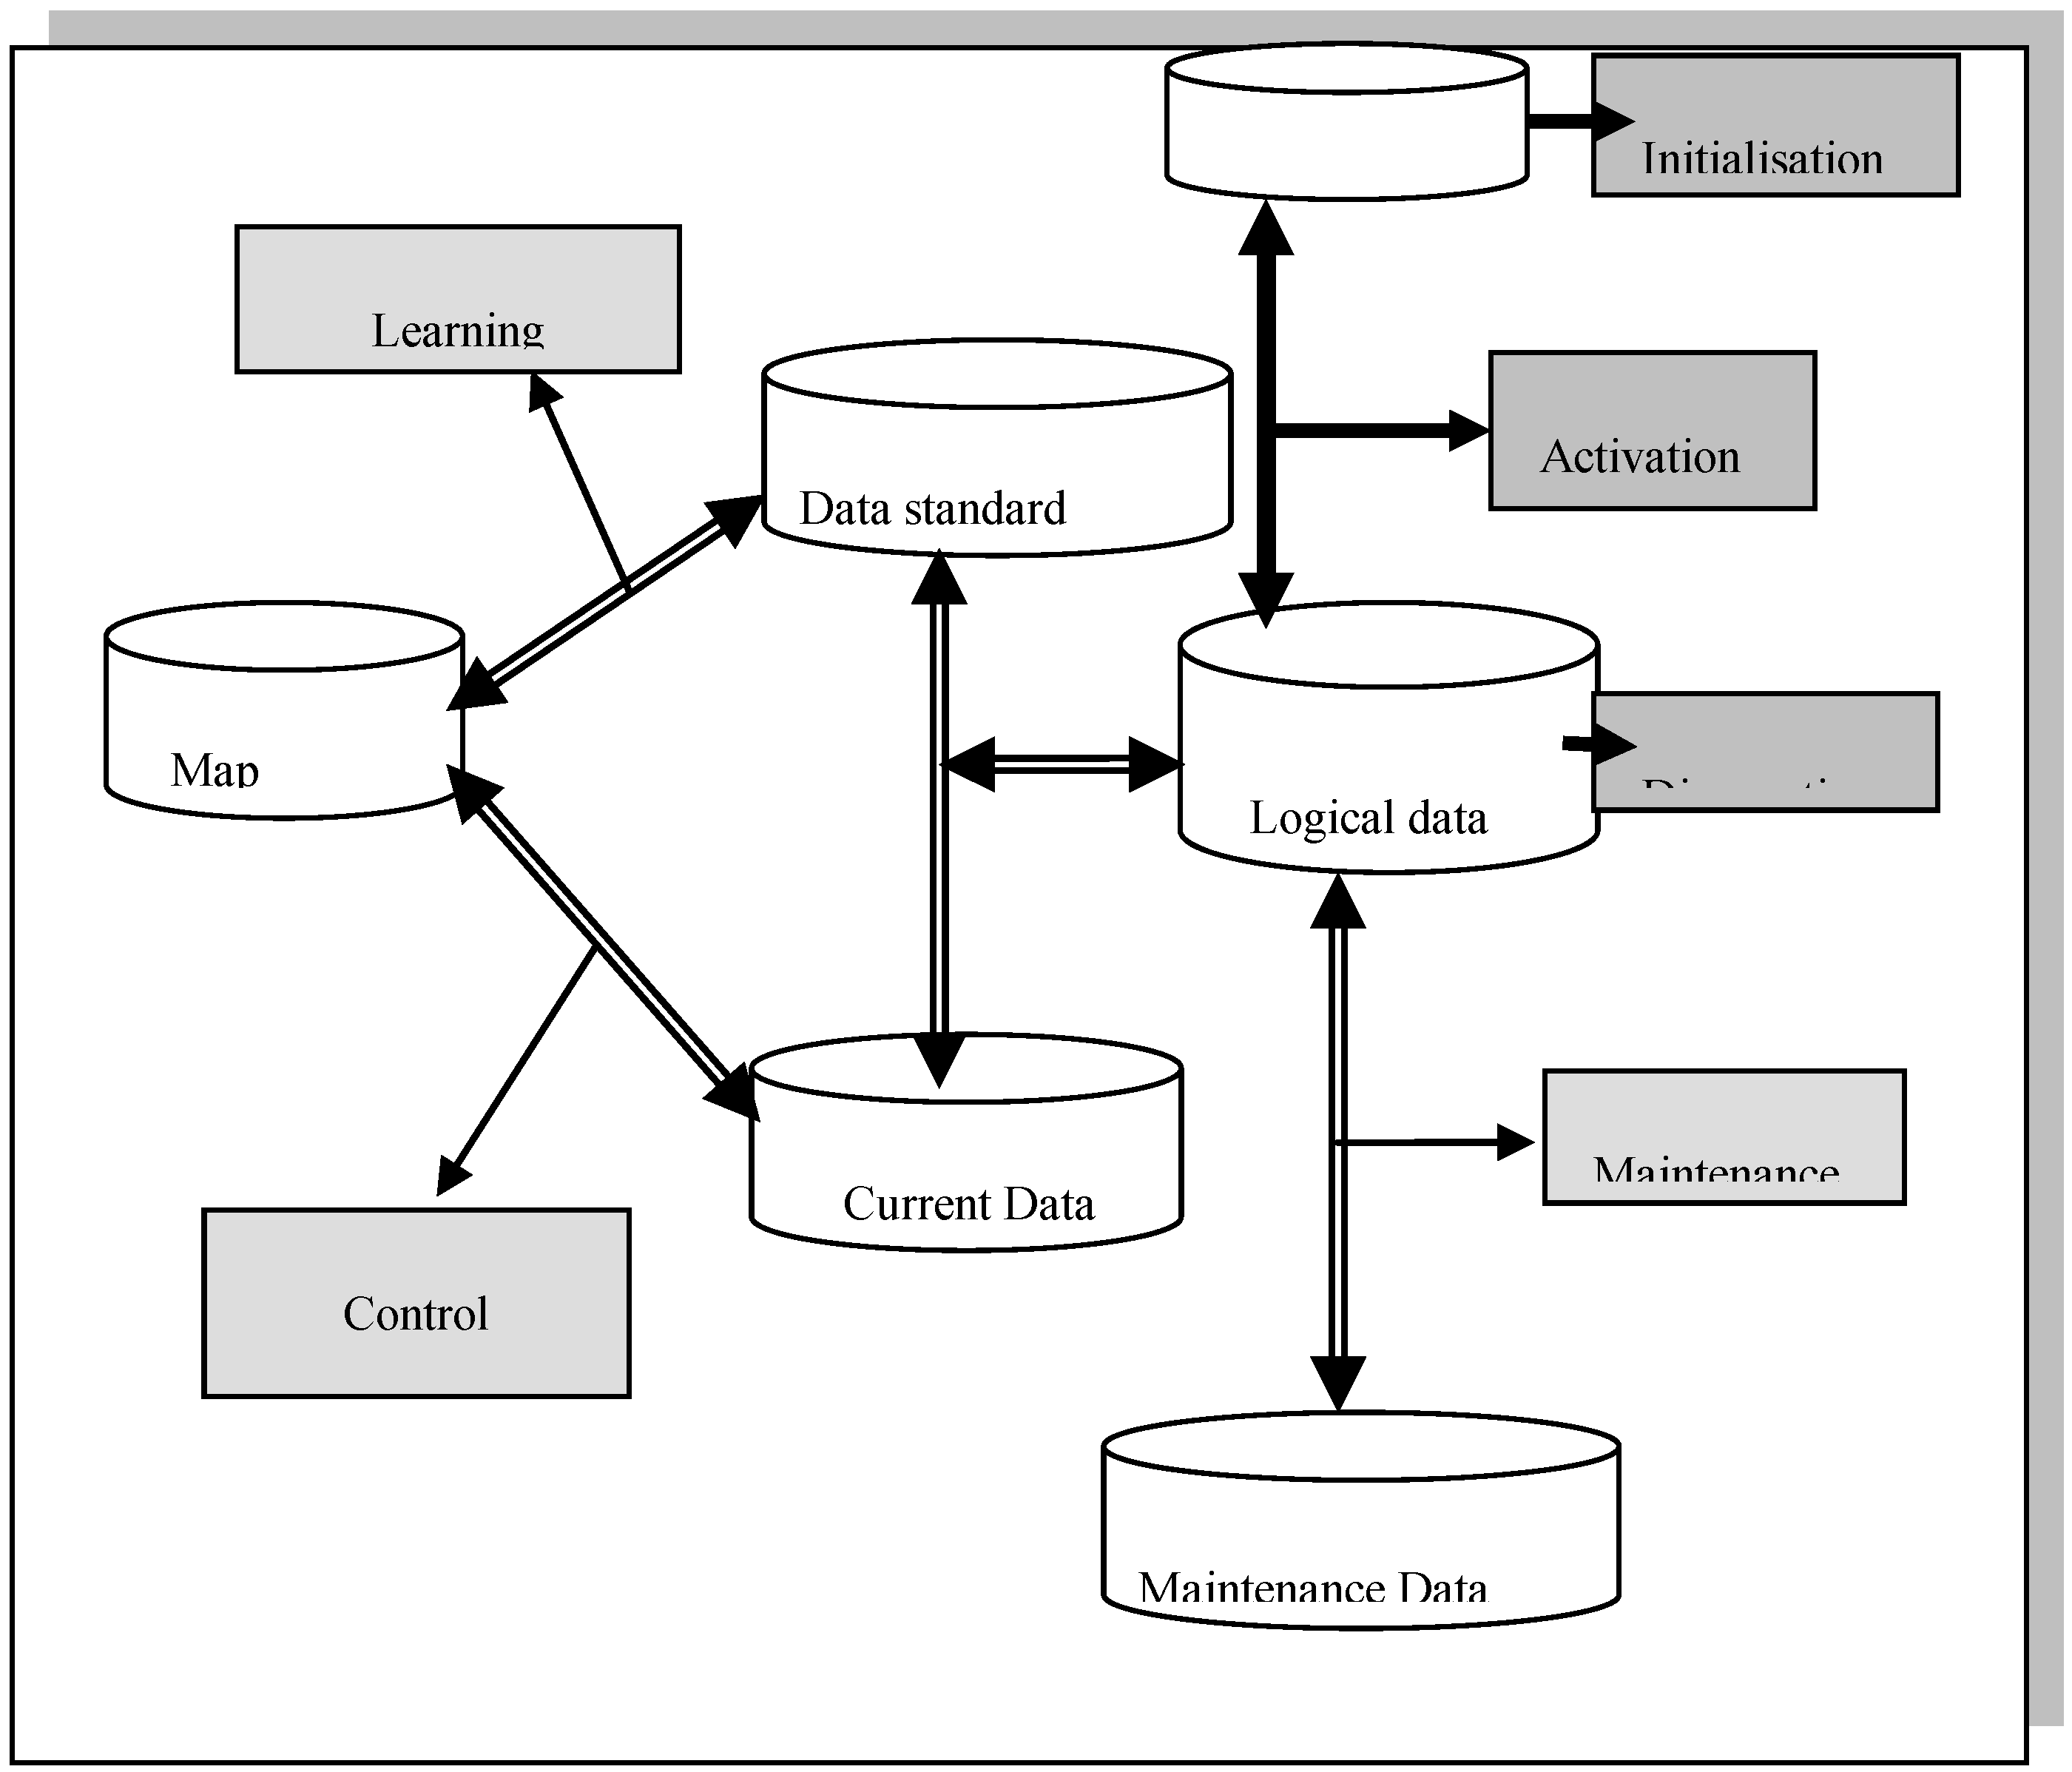
3. Network Data Management
The learning phase of the drinking water network (
Figure 3) was realized during a suitable period, and allows knowing the behaviour of the network and the range of its functional data (pressure, geographical flow, coordinates,
etc.) [
9,
10].
Figure 3.
Model data description.
Figure 3.
Model data description.
This knowledge leads to the creation of a standard (reference) database. During the normal operation of the water distribution system, the network parameters are brought up and compared automatically with this standard database by means of an appropriate algorithm. The result of comparison is registered in a logical database Eb(i,j). When Eb(i,j) = 1 the database of activation, maintenance and control points on the map contribute to diagnose any dysfunction of the network. At the same time, an efficient maintenance plan is generated, closing motorized gates to limit any losses during a leak.
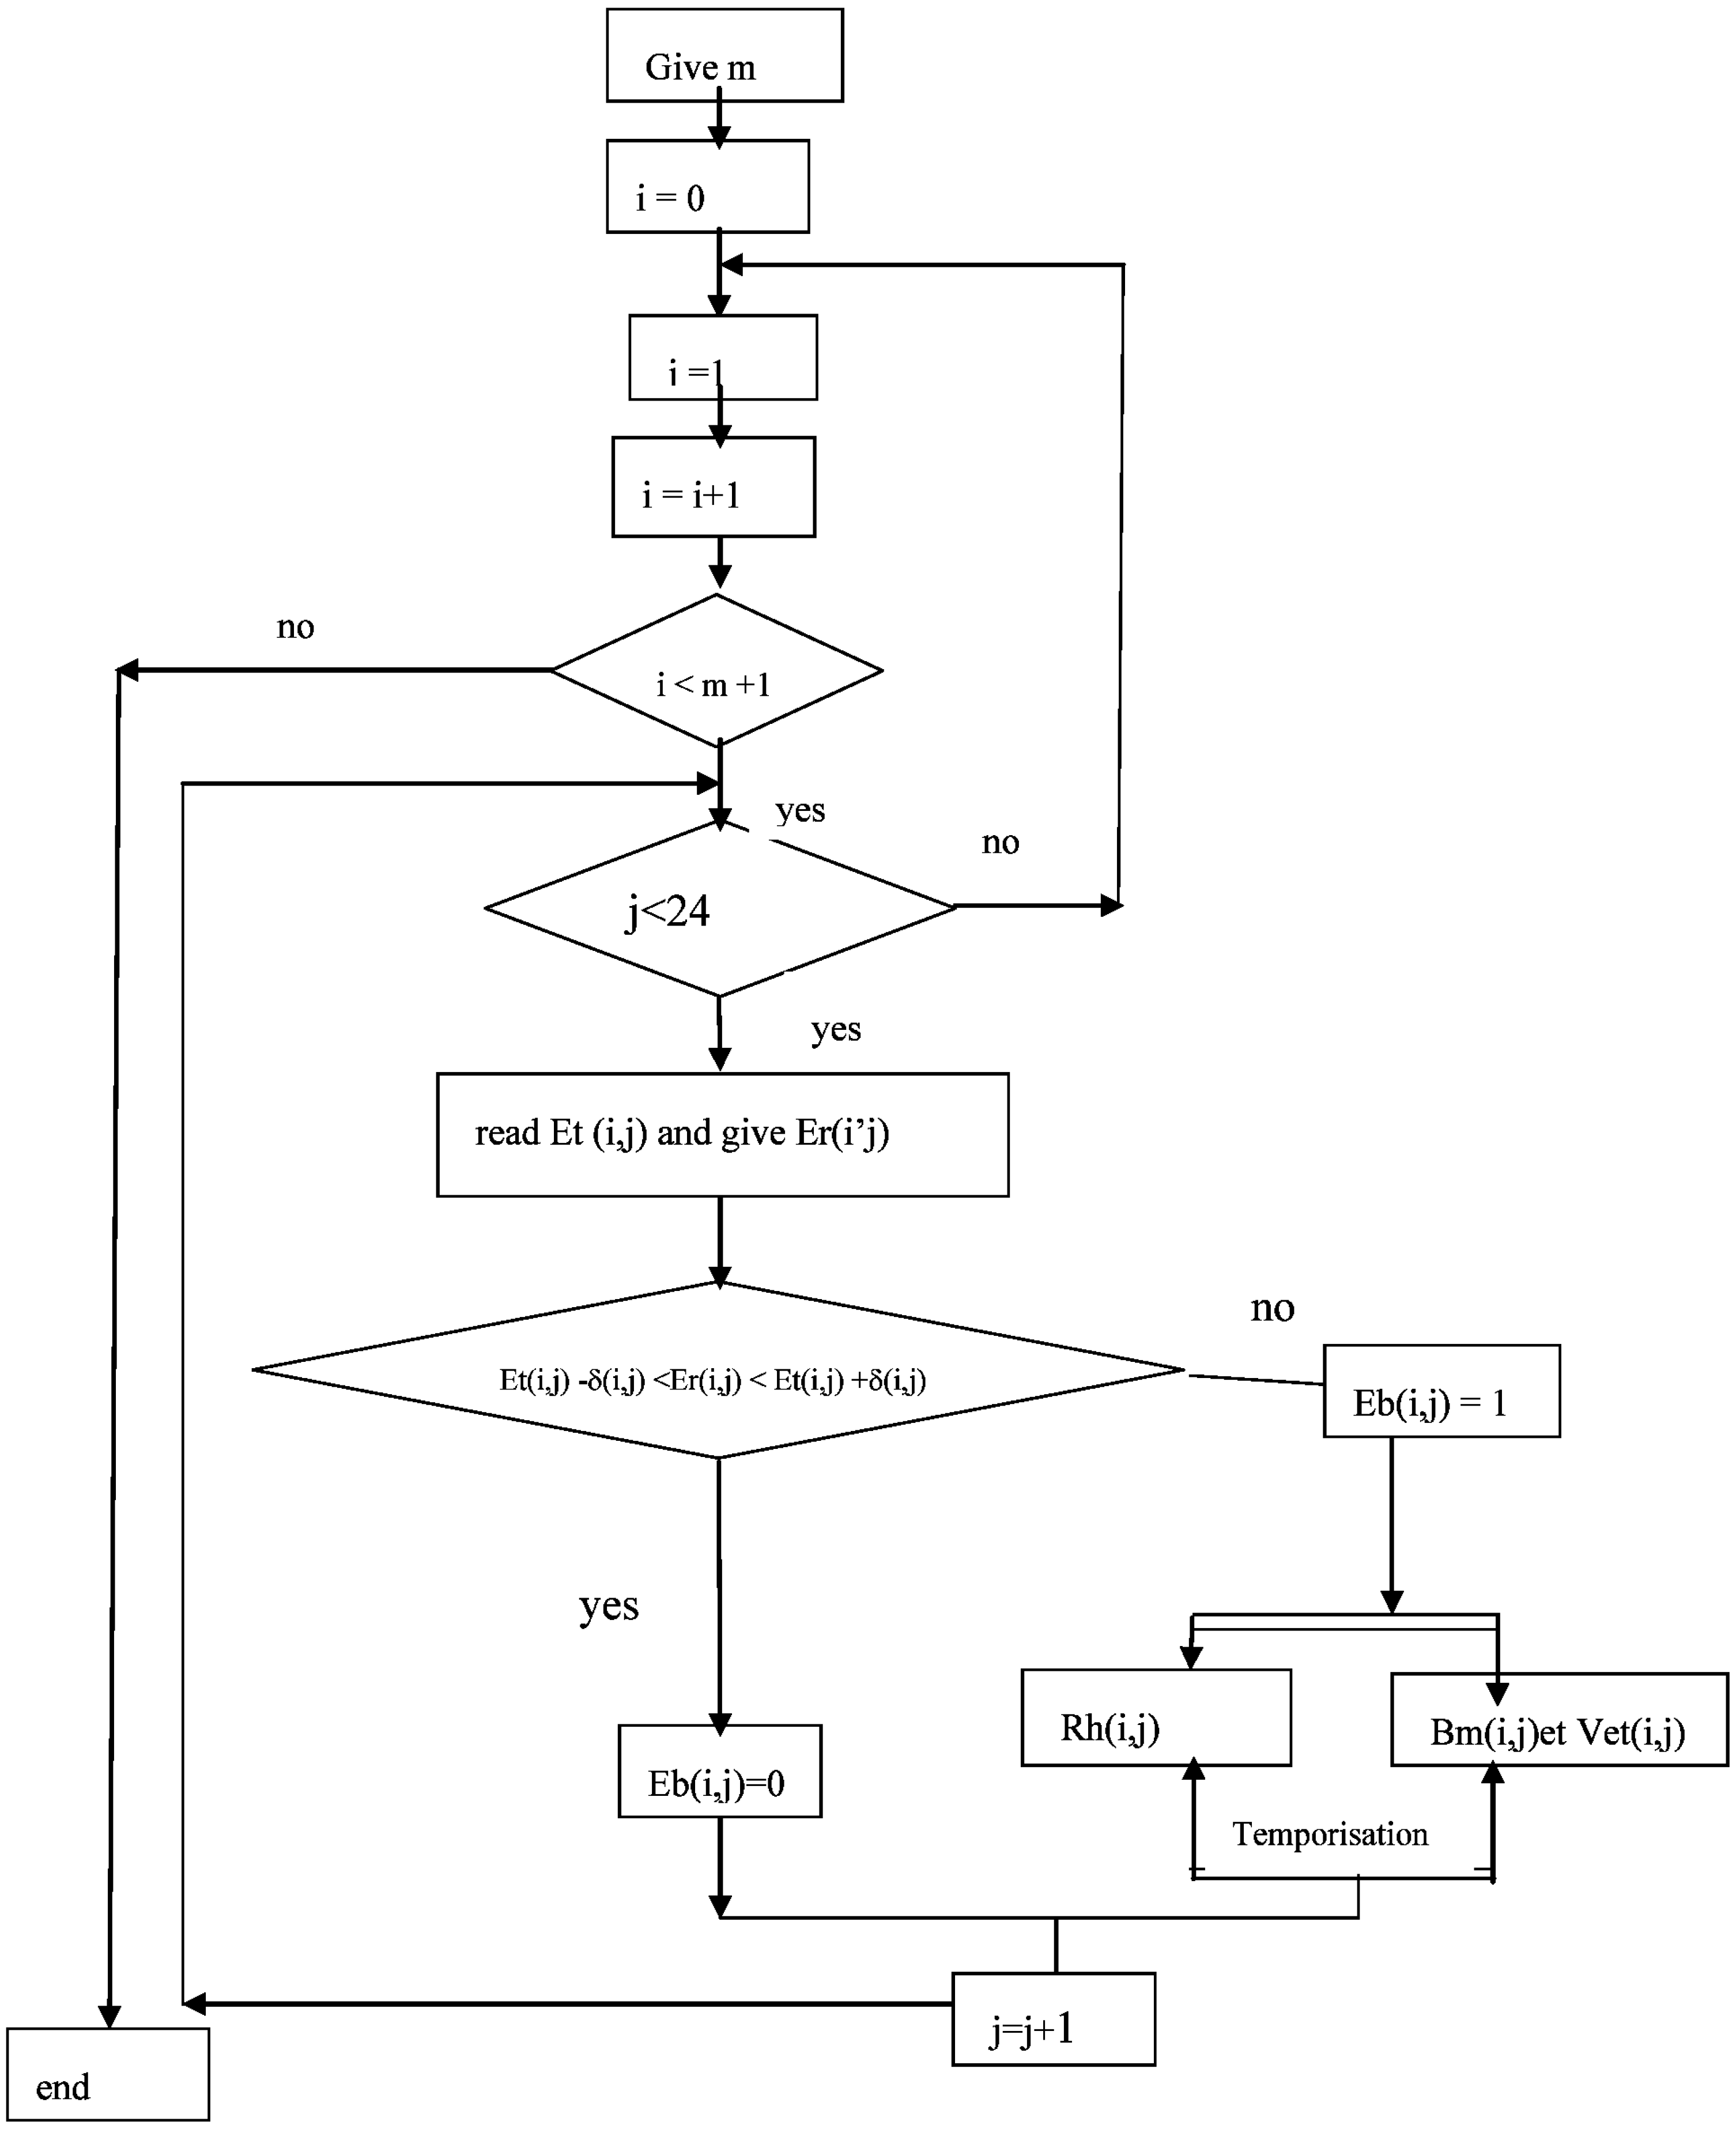
4. Algorithm
The proposed algorithm is summarized in the scheme shown in
Figure 4.
Figure 4.
Algorithm of optimal leaks management.
Figure 4.
Algorithm of optimal leaks management.
where:
Et (i,j) matrix standard of line i and of column j (the hour of a day), varies from 1 to 24 and i corresponds to the sensors on the network;
ΔEt(i,j) or δ(i,j) defines the tolerance of variation of every element of Et(I,j);
Er(i,j) matrix of the data real-time statement. Lines i and column j. The parameter j varies from 1 to 24 and i corresponds to sensors of the network;
Eb(i.j) matrix defines from Et(i,j) and Er(i,j). It contains Boolean values;
Bm(i,j) is the base of datum of the maintenance;
Rh(i,j) is the base of geographical reference of the control point i at the precise hour j. For i constant, R (i j) keep the same value. m = number of sensor settled on the network;
Vect(i,j) Is the matrix for activation of the motorized gates.
At the beginning of the program, the user must declare the number of control points in the network. This number is indicated by m. The function of the real data of Eb(i,j) are introduced for the progress of the algorithm. The state of the Boolean data Eb(i,j) informs about the state of functioning of the network and indicates the action to be undertaken.
5. Experimental Section
5.1. Yield of the network
The yield on the network is obtained by calculating the ratio between the volume of water consumed and the volume produced in a month. The sum of the daily volumes read on the meter placed in the entrance of the zone allows us to obtain the monthly volume. These volumes are directly obtained in the service of operation of the network. The invoicing of the monthly volumes consumed by subscribers is assured by the sales department of the national drinking water distribution company. The sum of the volumes charged by zone gives the monthly charged volume monthly volume: Monthly yield = Charged volume per month/ volume produced per month =
Ri
Table 1.
Volume of water distributed in Bonaberi.
Table 1.
Volume of water distributed in Bonaberi.
| Month | Volume produced (m3) | Charged volume (m3) | Yield |
|---|
| June | 176,100 | 115,281 | 0.65 |
| July | 199,400 | 115,381 | 0.58 |
| August | 192,600 | 116,500 | 0.60 |
After three months of survey on the network of Bonaberi before the application of this technique, we noticed that the average return was 61%. This represents a loss of about 40% a month for a zone in lack of water. These losses are enormous and explain the preoccupation of the agents for developing a method for limiting the leaks.
5.2. Network system management
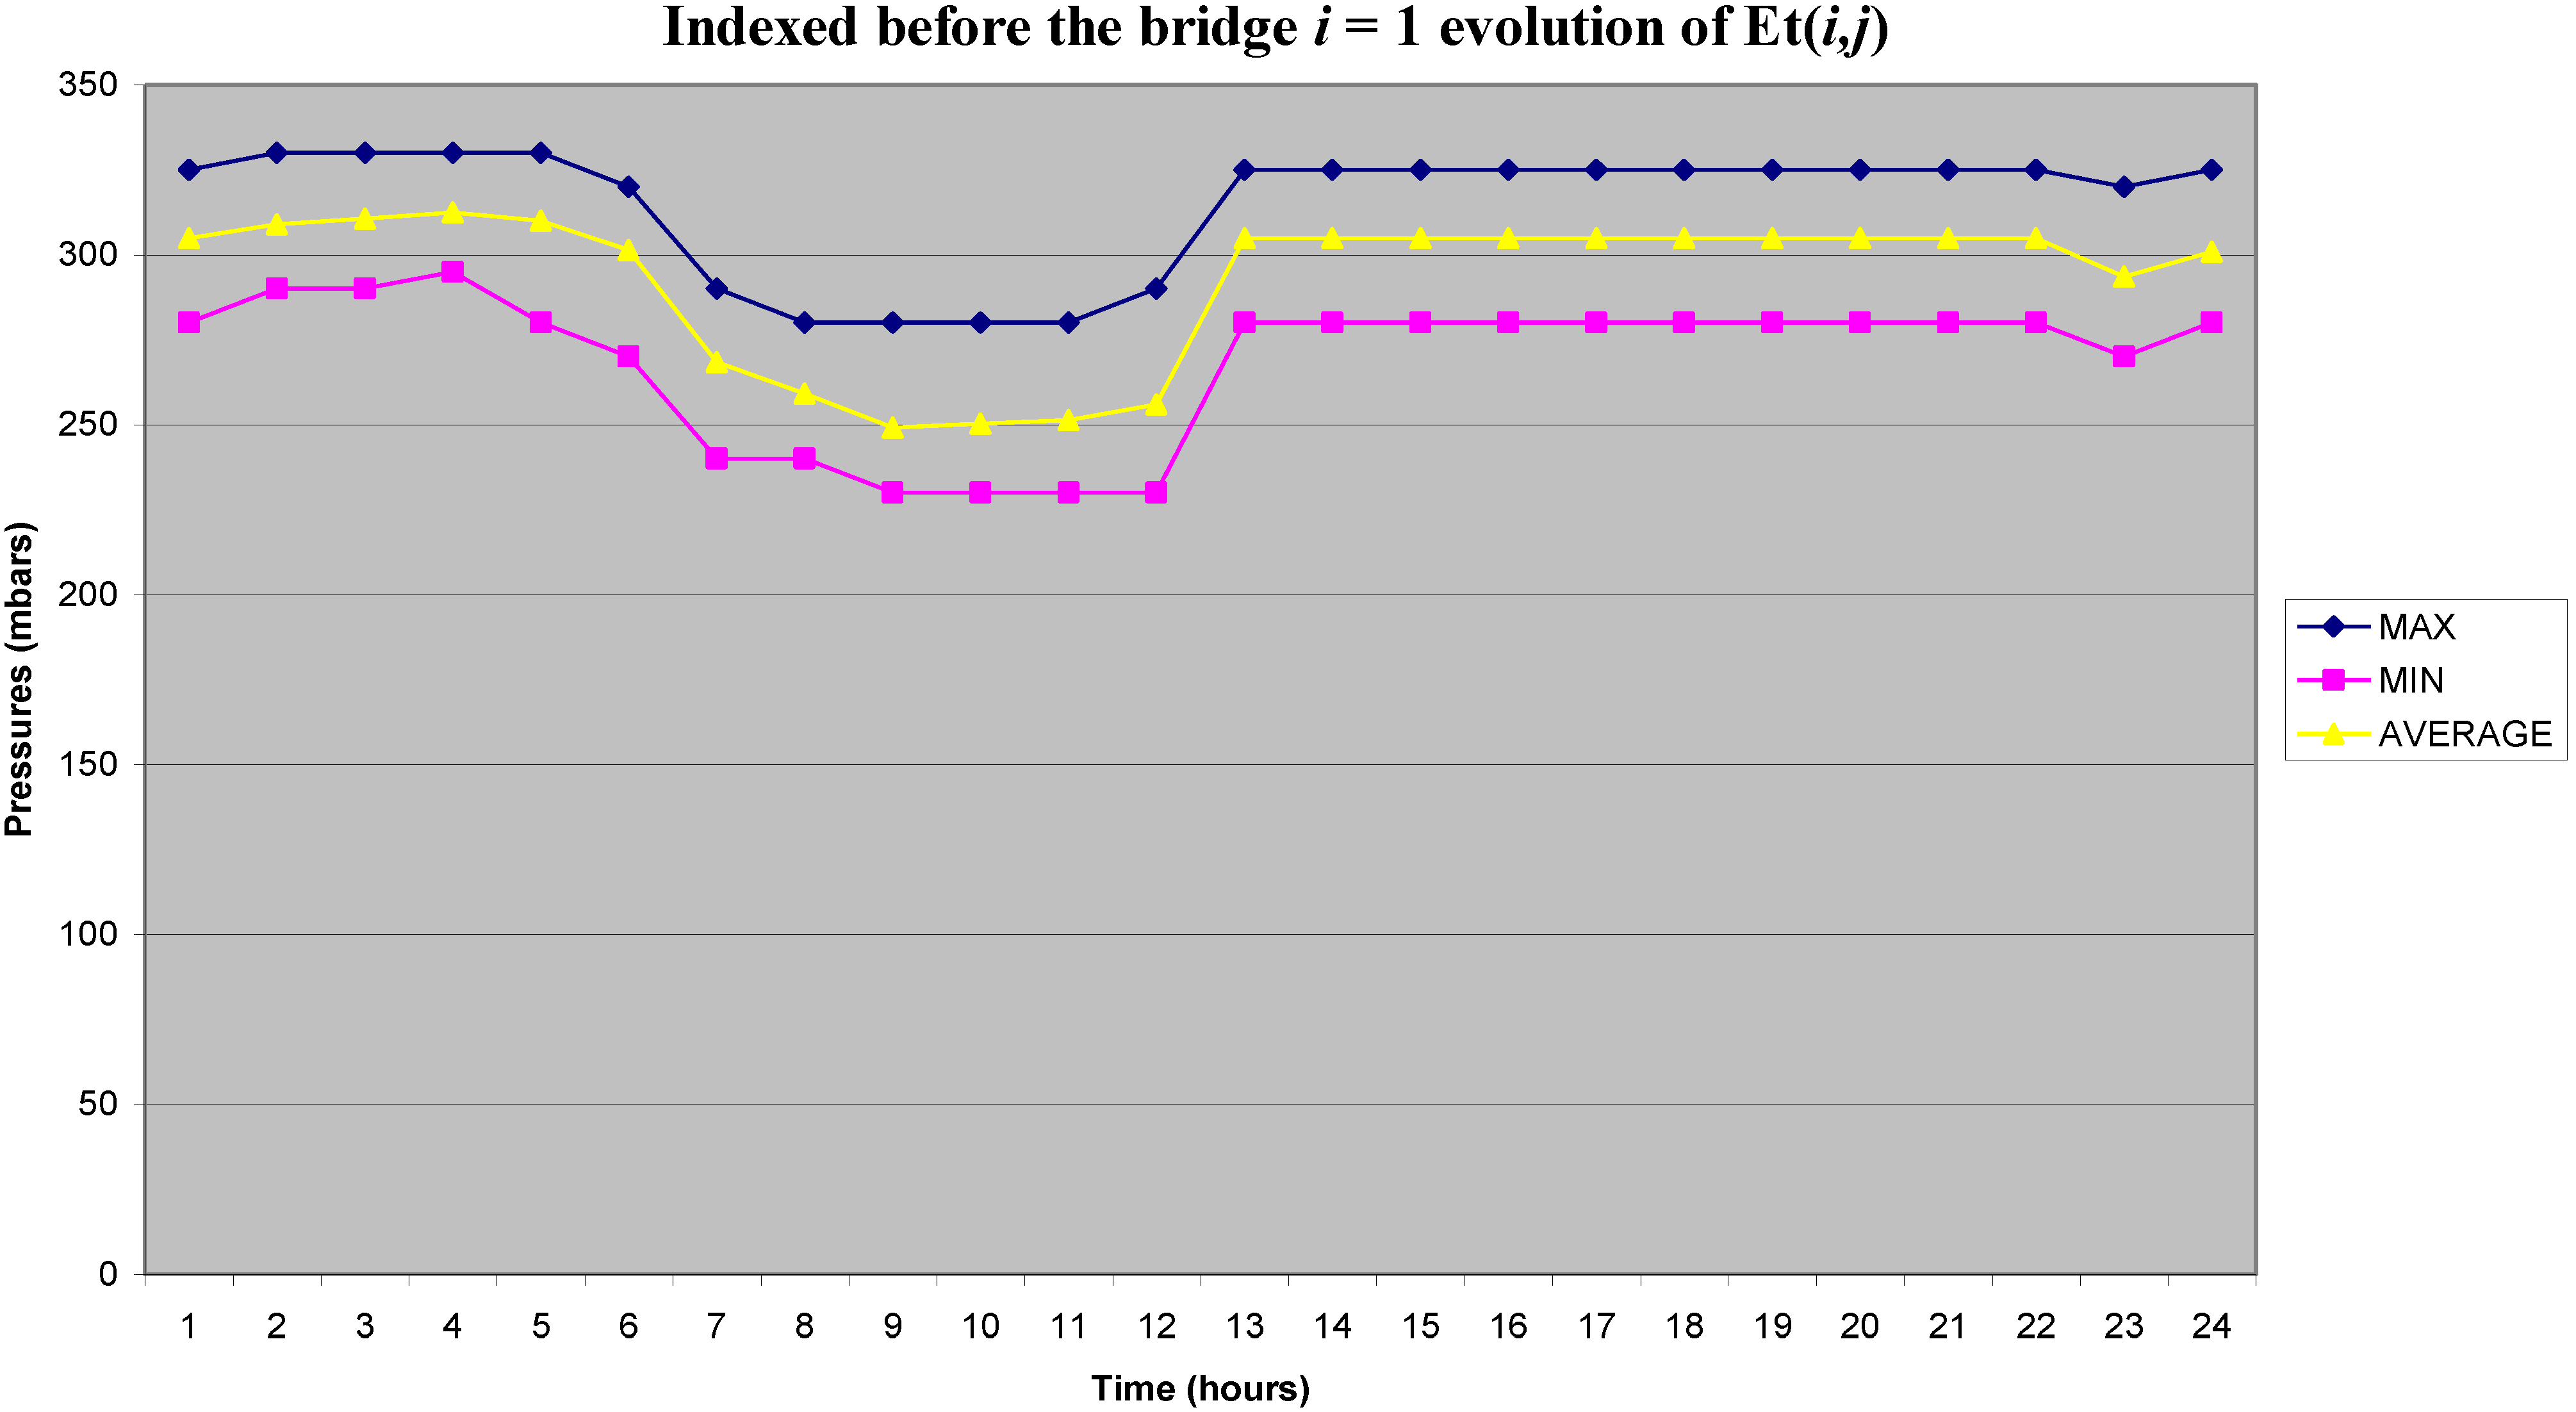
The maintenance of the distribution network is essentially curative, the idea being to reduce the losses by an automatic detection or a semi-automatic detection of the leaks. It implies the practice of conditional or systematic maintenance. For this fact, four sensors are placed on the network. For the first time, we checked the primary channelling. The data collected during three years allowed us to elaborate the control matrix Et(
i,j). Similar searches suggest that the optimal time of elaboration of Et(
i,j) should be 9 years, so, Et(
i,j) has to be improved. Et(
1,j) is represented on the corresponding curve in
Figure 5 by three values (maximal, average and minimal).
Figure 5.
Curve of the pressures before the bridge.
Figure 5.
Curve of the pressures before the bridge.
The databases Bm(
i,j) and Rh(
i,j) are created according to the profile of the maintenance technicians, the tools indispensable for the maintenance and according to the characteristics of every water conduit (diameter, materials, nature of the ground, the volume of the pipe, breakdown history), the real-time or recorded location, matrices Er(
i,j) are entered into in the algorithm and it is allowed to activate every hour. In case of noticed disfunction, the algorithm isolates the breakdown with motorized gates and generates an action plan of maintenance or it defines the:
- ◾
place of the incident
- ◾
chaining of the maintenance actions in the form of a Gantt schedule
- ◾
profiles of the recommended technicians
- ◾
materials and the equipment indispensable for the maintenance
- ◾
location of the motorized gates to be activated at the end of repair.
5.3. Data description
5.3.1. Control points and their coordinates
Monitors (or sensors) placed on the network give the pressures every hour at the considered points. The monitored points are:
- ◾
Indexed BONASSAMA gendarmerie i = 3. Defines Rh(3,j)
- ◾
Indexed Château i = 4. Defines Rh(4,j)
- ◾
Indexed After the bridge i = 2. Defines Rh(2,j)
- ◾
Indexed before the bridge i = 1. Defines Rh(1,j).
These four points are fixed on the network (
Figure 2) and describe completely the vector Rh(
i j). A GPS allows localizing them on the ground. The knowledge of the number of control points defines the parameter m of the algorithm which in our application is m = 4.
As soon as Eb(i,j) takes the value 1, the coordinates Rh(i,j) displays the same time as that of the Bm(i,j), and Vect(i,j) is activated. A temporization allows it o wait the end of three actions before continuing on the next control point.
5.3.2. Progress of the algorithm
From the monitors, we have the pressure standards for four control points: an example is given below for the point
i = 1 placed before the bridge. The pressures are in millibars
Et(1,j) = (304, 308, 310, 312, 309, 302, 268, 259, 249, 250, 251,255,304, 304,304,304,304,304,304,304,304,304,293,300)
ΔEt(1,j) = (45,40,40,35,50,60,50,40,50,50,50,60,45,45,45,45,45,45,45,45,45,45,50, 45)
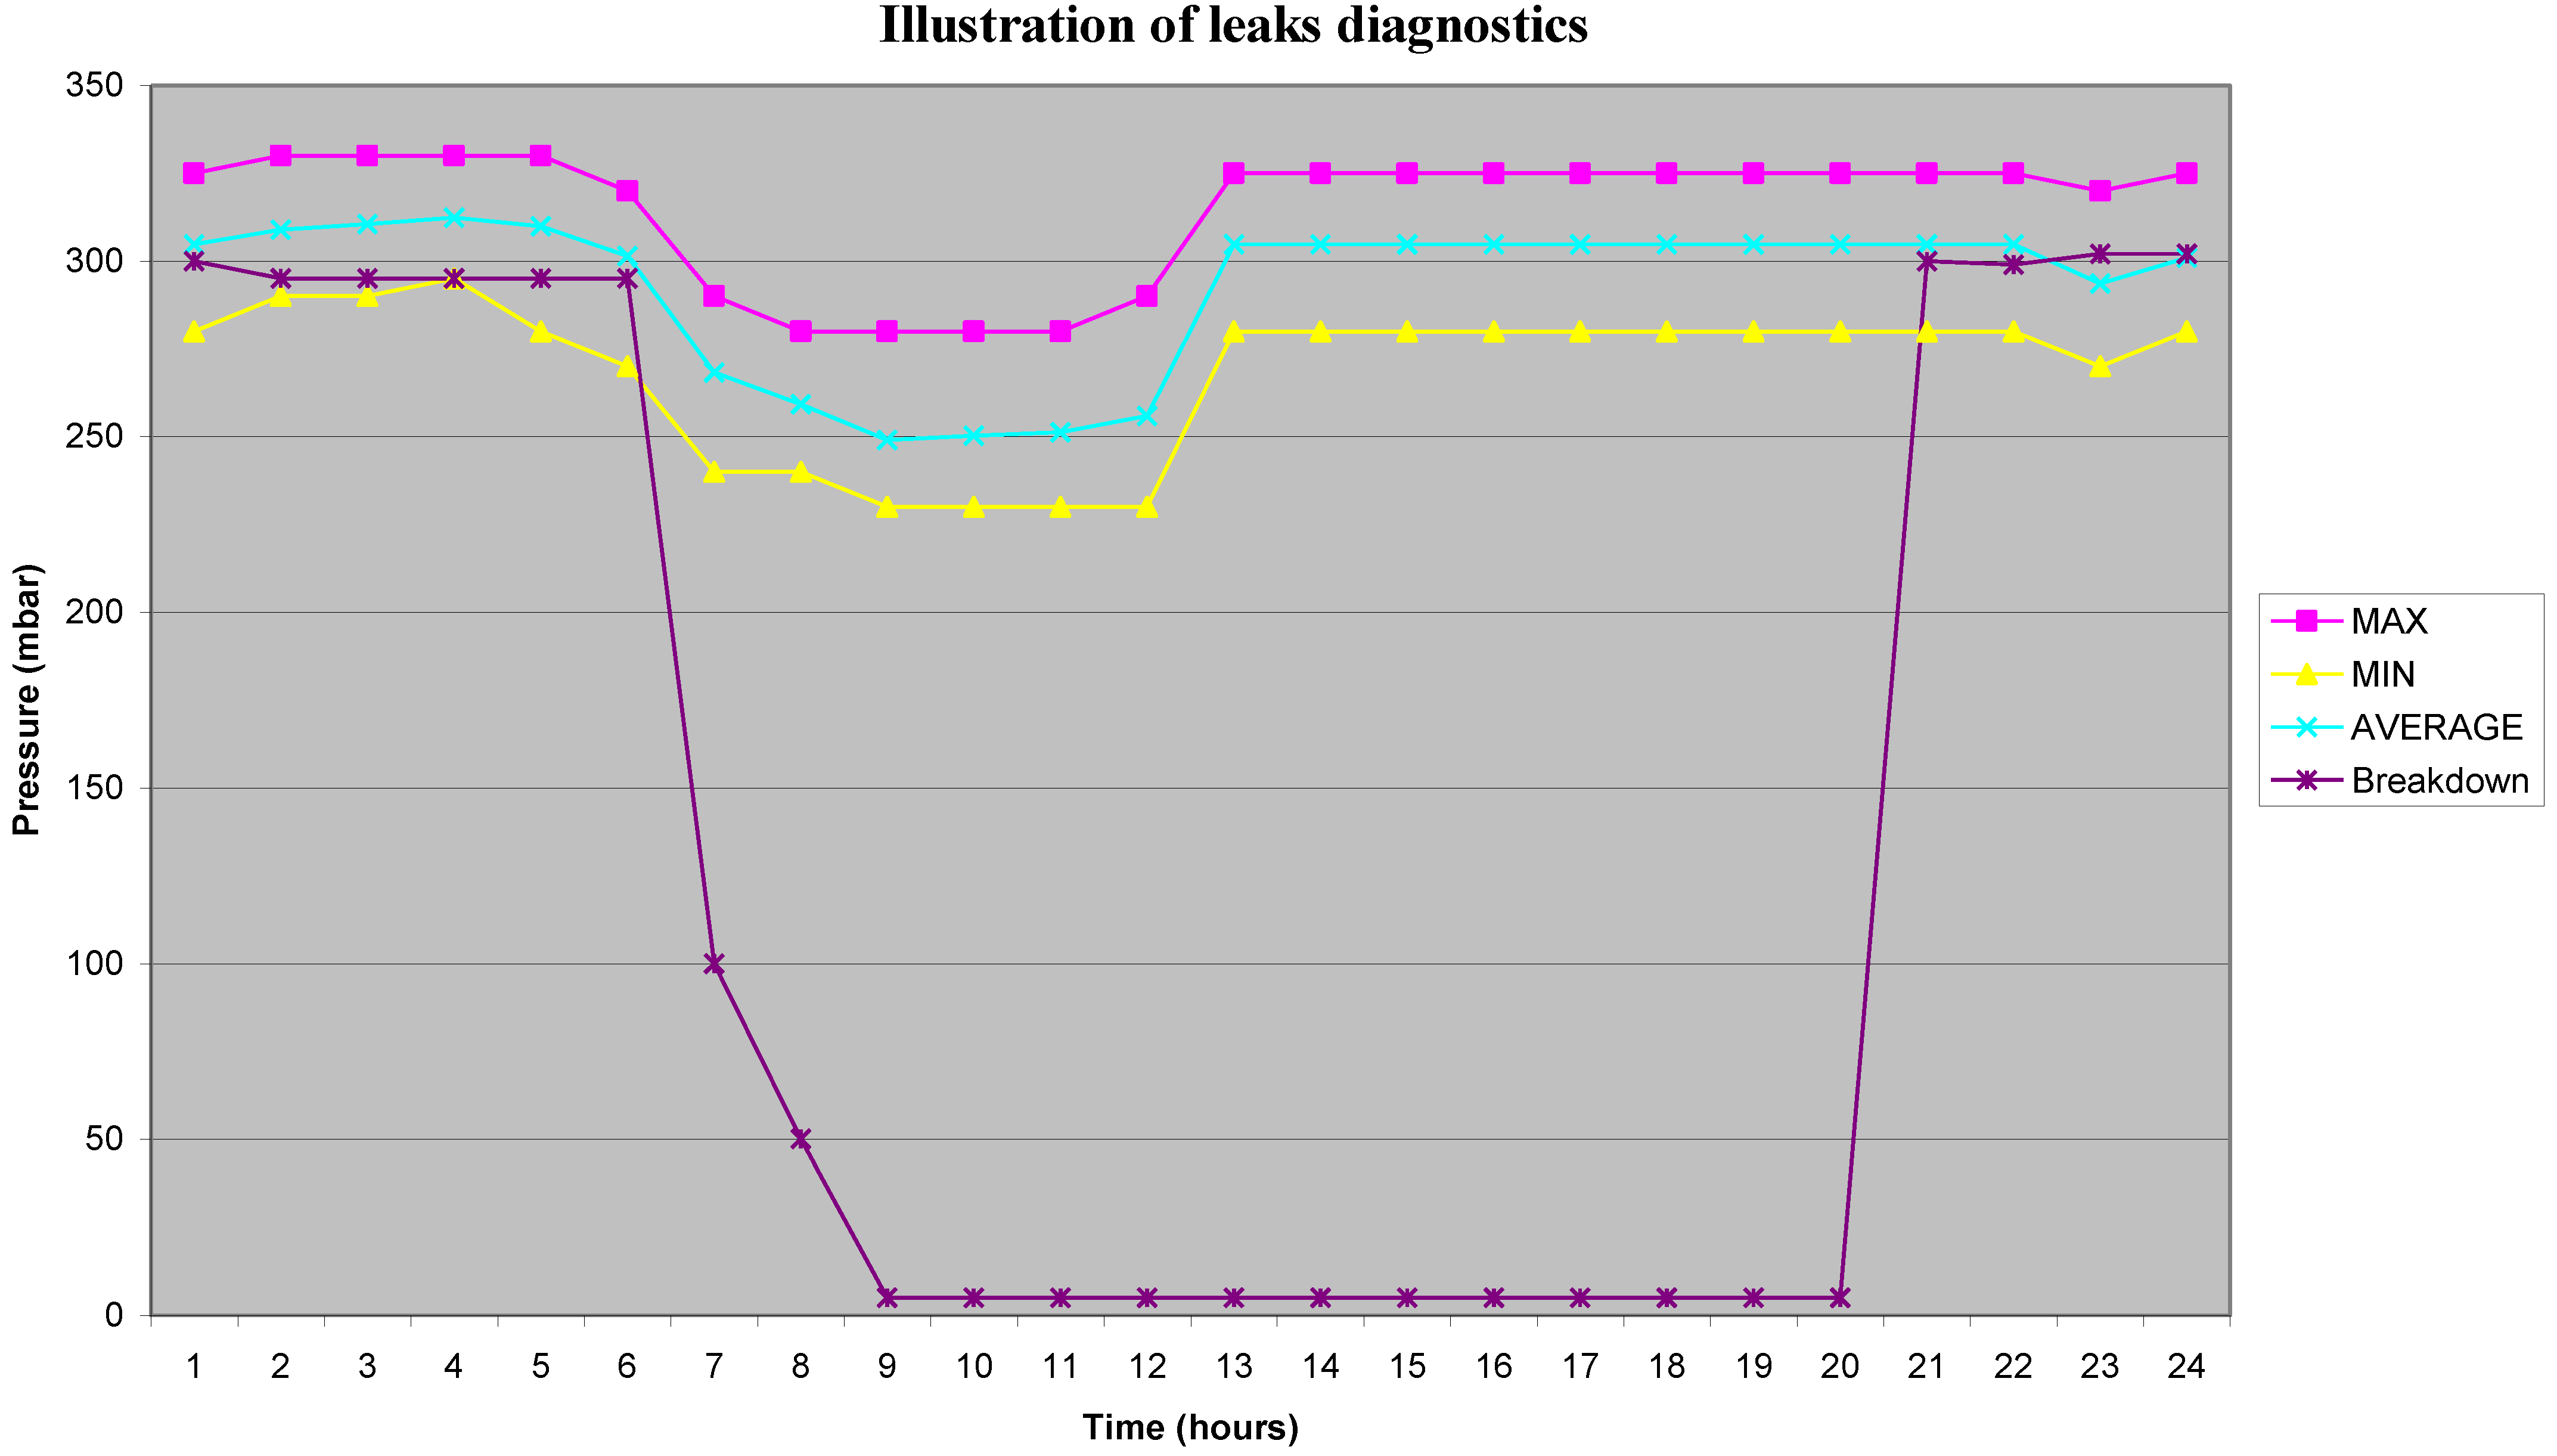
On the
Figure 6 we show the BREAKAGE curve representing the values of Er(1,j). Et(
i,j) is represented by a maximal value (MAX), a minimal value (MIN) and the average value (AVERAGE) from 1 to 6 a.m and from 9 p.m. till 12 p.m., the curve Brakedown is between the MAX and MIN value of the parameter Et(
i,j). Consequently, the matrix Eb(
i,j) takes the value 0 and thus indicates a state normal of functioning.
From 6 a.m. until 9 p.m. the CASSE curve moves gradually within the range defined by the MAX and MIN curves. There is a fault. Eb(1,j) takes the value 1 for j varying from 7 to 20. From 7 (o'clock), the algorithm generates a maintenance plan according to the
Section 5.2. The curve does not allow us to identify either the beginning of corrective actions nor the end. The network is restored at 9 p.m.
6. Conclusions
In this work, it emerges that the optimization of the volume of water lost in the distribution network is obtained by an algorithm which detects and isolates the real-time leaks. It contributes widely to the increase of access to the drinking water. For a real-time treatment, the cost of the operation is very high and we reach a material redundancy. Besides the collection and the data processing, we use remote control motorized gates sensors and employ specialized technicians for the maintenance. The advantage of this method is to allow an optimal reduction of the volume of water lost during the break-downs. All this is very expensive.
A recorded treatment allows an investment reduced to the work of conception and to the collection and processing of data. No supplementary component is added to the network except some recorders judged useful and placed in the points of collection of the drainage parameter. For the special case of Bonaberi in Douala, Cameroun, where losses are situated about 40% of the production, such an application is free of charge. It is the one which is at present adopted and has allowed to reduce the losses to (or by) 10%.
Figure 6.
Algorithmic treatment of a leak. From 6 a.m. to 9 p.m. The BREAKDOWN curve is the evolution of Er(i,j) data during the leaks, compared to Et(i,j) data.
Figure 6.
Algorithmic treatment of a leak. From 6 a.m. to 9 p.m. The BREAKDOWN curve is the evolution of Er(i,j) data during the leaks, compared to Et(i,j) data.
In every case, the network learning, the low collections of data, GIS (geographical information of the system) and cartography is imperative for an algorithm to optimize the management of water leaks. In view of the importance of the water for men, animals and the plants it is important to encourage this set-up in the urban networks where pipes, typically buried for over half a century, lose their waterproofnesses and present numerous leaks.


