Accuracy Evaluation of Two High-Resolution Satellite-Based Rainfall Products: TRMM 3B42V7 and CMORPH in Shanghai
by
 ,
,
Qin Jiang
1 ,
,
Weiyue Li
2,*,
Jiahong Wen
1,*,
Can Qiu
1,3,
Weiwei Sun
4,
Qilin Fang
5,
Ming Xu
6 and
Jianguo Tan
7 1
Department of Geography, Shanghai Normal University, Shanghai 200234, China
2
Institute of Urban Studies, Shanghai Normal University, Shanghai 200234, China
3
Shandong Meteorological Bureau, Jinan 250031, China
4
Department of Geography and Spatial Information Techniques, Ningbo University, Ningbo 315211, China
5
Shandong Academy of Building Research, Jinan 250031, China
6
Shanghai Typhoon Institute/China Meteorological Administration, Shanghai 200030, China
7
Shanghai Institute of Meteorological Science, Shanghai 200030, China
*
Authors to whom correspondence should be addressed.
Water 2018, 10(1), 40; https://doi.org/10.3390/w10010040
Submission received: 16 November 2017
/
Revised: 2 January 2018
/
Accepted: 2 January 2018
/
Published: 5 January 2018
Abstract
:Satellite-based rainfall products have extensive applications in global change studies, but they are known to contain deviations that require comprehensive verification at different scales. In this paper, we evaluated the accuracies of two high-resolution satellite-based rainfall products: the Tropical Rainfall Measurement Mission (TRMM) rainfall product 3B42V7 and the Climate Prediction Center morphing (CMORPH) technique from January 2010 to December 2011 in Shanghai, by using categorical metrics (Probability of Detection, False Alarm Ratio, and Critical Success Index) and statistical indicators (Mean Absolute Error, Root Mean Square Error, Relative Bias, and Correlation Coefficient). Our findings show that, firstly, CMORPH data has a higher accuracy than 3B42V7 at the daily scale, but it underestimates the occurrence frequency of daily rainfall for some intensity ranges. Most errors of the two products are distributed between −10 and 10 mm/day. Second, at the monthly scale, the total accuracy of 3B42V7 is higher than CMORPH in terms of the value of the Correlation Coefficient (CC) and Relative Bias (RB). Finally, CMORPH brings about daily rainfall detection results from categorical metrics computation better than 3B42V7. Generally, the two satellite-based rainfall products show a high correlation with rain gauge data in Shanghai, particularly in spring and winter. Unfortunately, in summer, both of them do not perform well in detecting the short-duration heavy rainfall events. Overall, the relatively poor data accuracy has limited their further applications in Shanghai and similar urban areas.
1. Introduction
Spatio-temporal patterns of global and regional precipitation are the highlighted focus of climate change in the globally warming world [1,2,3,4]. IPCC (Intergovernmental Panel on Climate Change) reports show that the precipitation or extreme precipitation frequency has been increasing with global climate warming that results from elevated atmospheric CO2 concentrations [5]. Human activities and the underlying surface change greatly affect urban atmospheric boundary layers and the local climatic environments and result in more rainfall occurrences and even rainfall extremes [6,7]. Rainfall diverges greatly across different regions [8]. Different rainfall trends have been observed from many discrete ground meteorological stations [7]. However, those studies are limited in terms of both their sparse spatial scope and data accuracy [9,10].
In recent years, satellite-based precipitation estimation has witnessed significant developments. High quality satellite-based rainfall techniques have been developed, e.g., the Tropical Rainfall Measurement Mission (TRMM) Multi-Satellite Precipitation Analysis (TMPA) [11], the Climate Prediction Center morphing (CMORPH) technique [12], the Precipitation Estimation from Remotely Sensed Information using Artificial Neural Networks (PRESIANN) [13], and Fengyun meteorological satellite data [14]. Some studies have validated the accuracies of these products in different regions all over the world [15,16,17]. These products provide an important input for some hydrological models and natural hazard researches [18,19,20], and are used for simulating the rainfall spatio-temporal distribution at global and regional scales [21,22]. Previous research indicates that the spatial and temporal accuracies of both the 3B42V7 and CMORPH products are obviously higher in China [23,24], and the three-hourly 0.25° TRMM 3B42V7 and CMORPH data have a higher correlation with rain gauge data and can simulate precipitation spatio-temporal processes in urban areas [9]. Zhang et al. used the TRMM 3B42V6 products to simulate the rainfall spatio-temporal distribution in the Beijing metropolitan region and found that there were fewer rain days and a higher rainfall intensity in urban areas than in other surrounding regions under the impact of urbanization [25]. Chen et al. found that short-duration heavy rain may have a downward trend over the metropolitan regions of the Pearl River Delta based on CMORPH data [26]. Additionally, Meng et al. used the downscaled TRMM rainfall time series to analyze the response from land surface temperature in a heavy rainfall event in Beijing [27]. The above studies show that the two high satellite-based products are widely used for precipitation studies in megacities or cluster cities, but almost no careful validations have been conducted for these two rainfall products in urban areas. In addition, complicated urban environments and underlying surfaces affect rainfall processes [28]. Some studies have proved that the underlying surface greatly affects urban atmospheric boundary layers and the local climatic environments, resulting in some rainfall occurrences or rainfall extremes [29].
Because of rapid urbanization in the last two decades, Shanghai has become one of the most crowded megacities in the world. It cannot be ignored that long-term observation shows that rainfall in Shanghai has a distinct characteristic of localization and urban-rural divergence caused by the urbanization process [30]. Due to this differentiation, local scale rainfall events may sometimes be difficult to sample by using sparse rain gauge data [30]. Only two ground calibration meteorological stations of the Global Precipitation Climate Center (GPCC) are located in the west and north of Shanghai, i.e., Shanghai Hongqiao (CHM00058367) and Shanghai (CHM00058362) [31]. The limited number of calibration meteorological stations may bring about some spatial errors in the satellite-based rainfall products in Shanghai or similar megacities. Therefore, it is of great necessity to make a more systematic evaluation of satellite-based rainfall products in the megacity of Shanghai.
In this paper, TRMM 3B42V7 and CMORPH products have been used for accuracy evaluation from two aspects (detection capability and error statistics). The major objective of this study is to understand the quality and usability of the satellite-based rainfall products in Shanghai or similar large-scale urban areas. The rest of this paper is organized as follows. Section 2 describes the study area, and introduces two satellite-based rainfall data and rain gauge data sets. Meanwhile, the evaluation methods and statistic metrics are also presented in Section 2. Section 3 shows the results of accuracies at the daily and monthly scale. Section 4 presents the discussions on errors distribution and extreme rainfall detection. Section 5 summarizes our paper.
2. Materials and Methods
2.1. Study Area
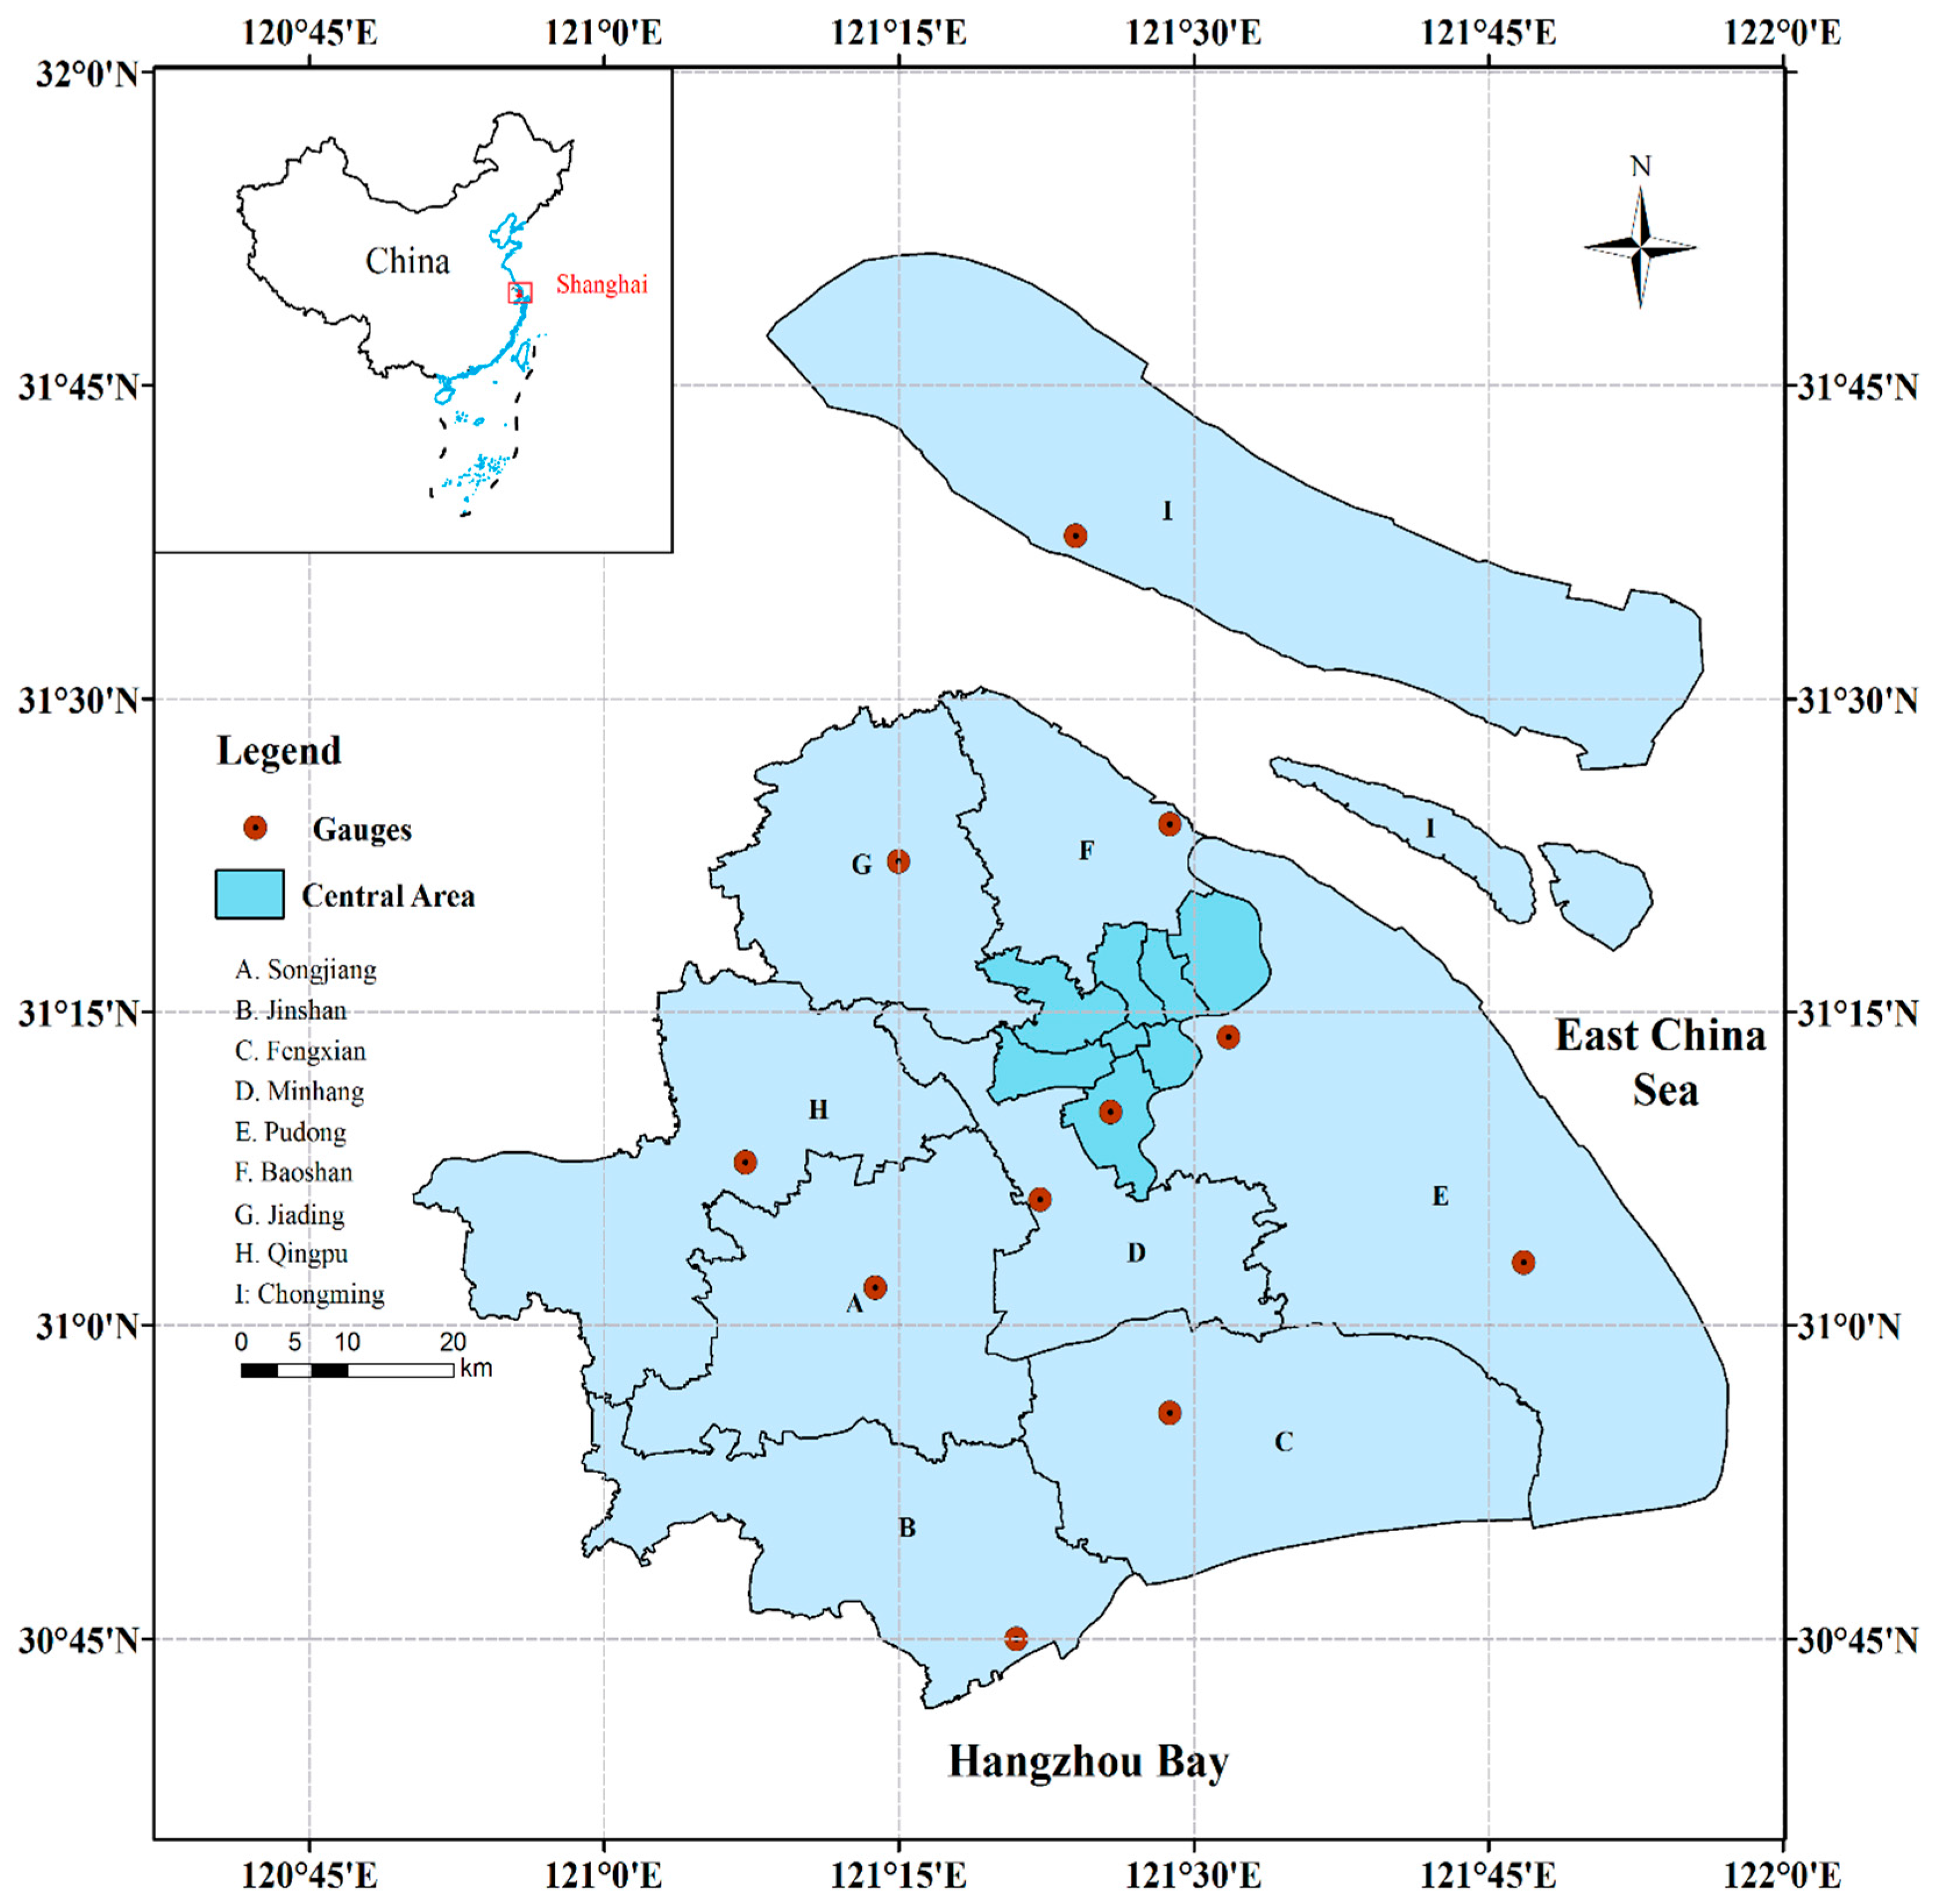
Shanghai is located in the Yangtze River estuary, within a latitude of 30°40′ N–31°53′ N and longitude of 120°52′ E–122°12′ E. The south of Shanghai megacity is Hangzhou Bay, and the east is East Sea (Figure 1). Shanghai has a population of 24.15 million, covered an area of 6340.50 km2 in 2015, and belongs to the northern subtropical monsoon climate. The average annual rainfall is about 1200 mm with obviously seasonal variations, with about 60% of annual rainfall amounting from 1 May to 30 September.
2.2. Dataset
2.2.1. Satellite-Based Rainfall Products
● TRMM product
The Tropical Rainfall Measurement Mission (TRMM), launched on 27 November 1997, was jointly developed by the National Aeronautics and Space Administration (NASA) and the National Space Development Agency (NSDA). The Visible and Infrared Radiometer System (VIRS), the TRMM Microwave Imagery (TMI), and the Precipitation Radar (PR) are primary rainfall measurement equipment in the TRMM satellite [32]. The Multi-Satellite Precipitation Analysis (TMPA) algorithm was proposed by Huffman et al. [11] and it was combined with several other high-quality rainfall estimation algorithms, e.g., merged Active/Passive Microwave and Infrared-based rainfall estimates, as well as other multi-source data fusion of rainfall products [33]. The TMPA rainfall products are available both in 3B42RT (three-hourly) and 3B42 (three-hourly and daily), as well as the monthly rainfall dataset (3B43), covering the range of latitude 50° S–50° N and longitude 180° W–180° E. Compared to 3B42RT, 3B42V7 was corrected by the monthly rainfall data deviation from the Global Precipitation Climate Center (GPCC) calibration meteorological stations and the product has several computation improvements and a better data accuracy [34]. The most recent TRMM 3B42 Version 7 is a gauge-adjusted post-real-time rainfall product covering the 1998-present period from various satellite systems [11]. The 3B42V7 data is available from Universal Time Coordinated (UTC) 1 January 1998 to the present. We selected TRMM 3B42V7 rainfall products with a Hierarchical Data File (HDF) format from 2010 to 2011.
● CMORPH product
The CMORPH satellite rainfall product provides global rainfall data generated by the Climate Prediction Center (CPC) under the National Centers for Environmental Prediction (NCEP), and the data is available from UTC 3 December 2002 to present. The CMORPH retrieval algorithm was presented by Joyce et al. [12]. It uses motion vectors derived from IR imagery to propagate the relatively high-quality precipitation estimates (QPE) derived from passive microwave data. The spatial distribution of CMORPH rainfall data covers the range of latitude 60° S–60° N and longitude 180° W–180° E.
The spatio-temporal resolution of CMORPH is three-hourly, 0.25°, and the same is true for that of 3B42V7. The format of data is ‘*.comb’ from a standard UNIX file, including merged microwave rainfall and ‘CMORPH’ rainfall estimates.
2.2.2. Rain Gauge Data
Figure 1 shows 11 rain gauges from the Shanghai Meteorological Bureau (SMB) and the rain gauges are distributed in different districts of Shanghai. The detailed information of rain gauges and satellite-based rainfall products is showed in Table 1, including ID, gauge number, name, and row/column number. ID indicates the satellite grid with the row and column number and corresponds to the location of rain gauges. If two or more rain gauges are located in the same satellite grid (e.g., Gauge 58361 and 58367 have the same ID a; Gauge 58461 and 58462 have the same ID h), the average rainfall data from these rain gauges is used for evaluation. The time benchmark of rain gauge data is GMT+8.
Given the comparison of satellite-based products and rain gauge data, the following assumptions are made: (1) the rain gauge data is regarded as ‘ground truth’ to estimate the gridded satellite-based rainfall products [35]; (2) All uncertainty of satellite-based products is due to either random errors or systematic errors [36]. The satellite-based products are considered, including systematic and random errors.
2.3. Evaluation Methods
Evaluation methods are selected from two aspects: detection capability analysis and error statistics. Detection capability includes three categorical metrics: Probability of Detection (POD) [37], False Alarm Ratio (FAR) [38], and Critical Success Index (CSI) [35], which reflect the capability of satellite-based rainfall products to estimate the possibility of rainfall events. The value of these metrics ranges from 0 to 1. The POD and CSI are positively correlated with the detection capability, whereas FAR is negatively correlated with it. On the basis of determining the threshold of daily rainfall events, these metrics are calculated based on the equations described in Table 2, where H is the number of rainfall events detected by rain gauges and satellites, M is the number just detected by rain gauges, and F is the number detected by satellites [13].
Another aspect is error statistics including four indicators, i.e., Mean Absolute Error (MAE) [39], Root Mean Square Error (RMSE) [40], Relative Bias (RB) [41], and Correlation Coefficient (CC) [42]. The equations of these indicators are described in Table 3, reflecting the quantitative consistency of satellite-based rainfall products with rain gauge data. MAE represents the averaged magnitude of the absolute error; RMSE indicates the averaged error magnitude; RB is used to measure the probability of overestimation (RB < 0) or underestimation (RB > 0) from satellite-based products; and CC reflects the synchronicity of precipitation variation between satellite precipitation products and meteorological stations. Compared with rain gauge data, the higher accuracy of satellite-based products has a higher CC, lower MAE, and RMSE [34].
3. Results
3.1. Detection Capability Analysis on Rainfall Events
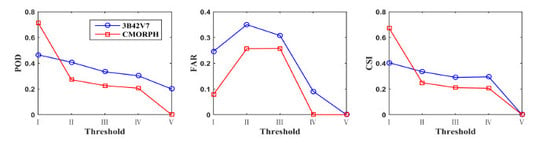
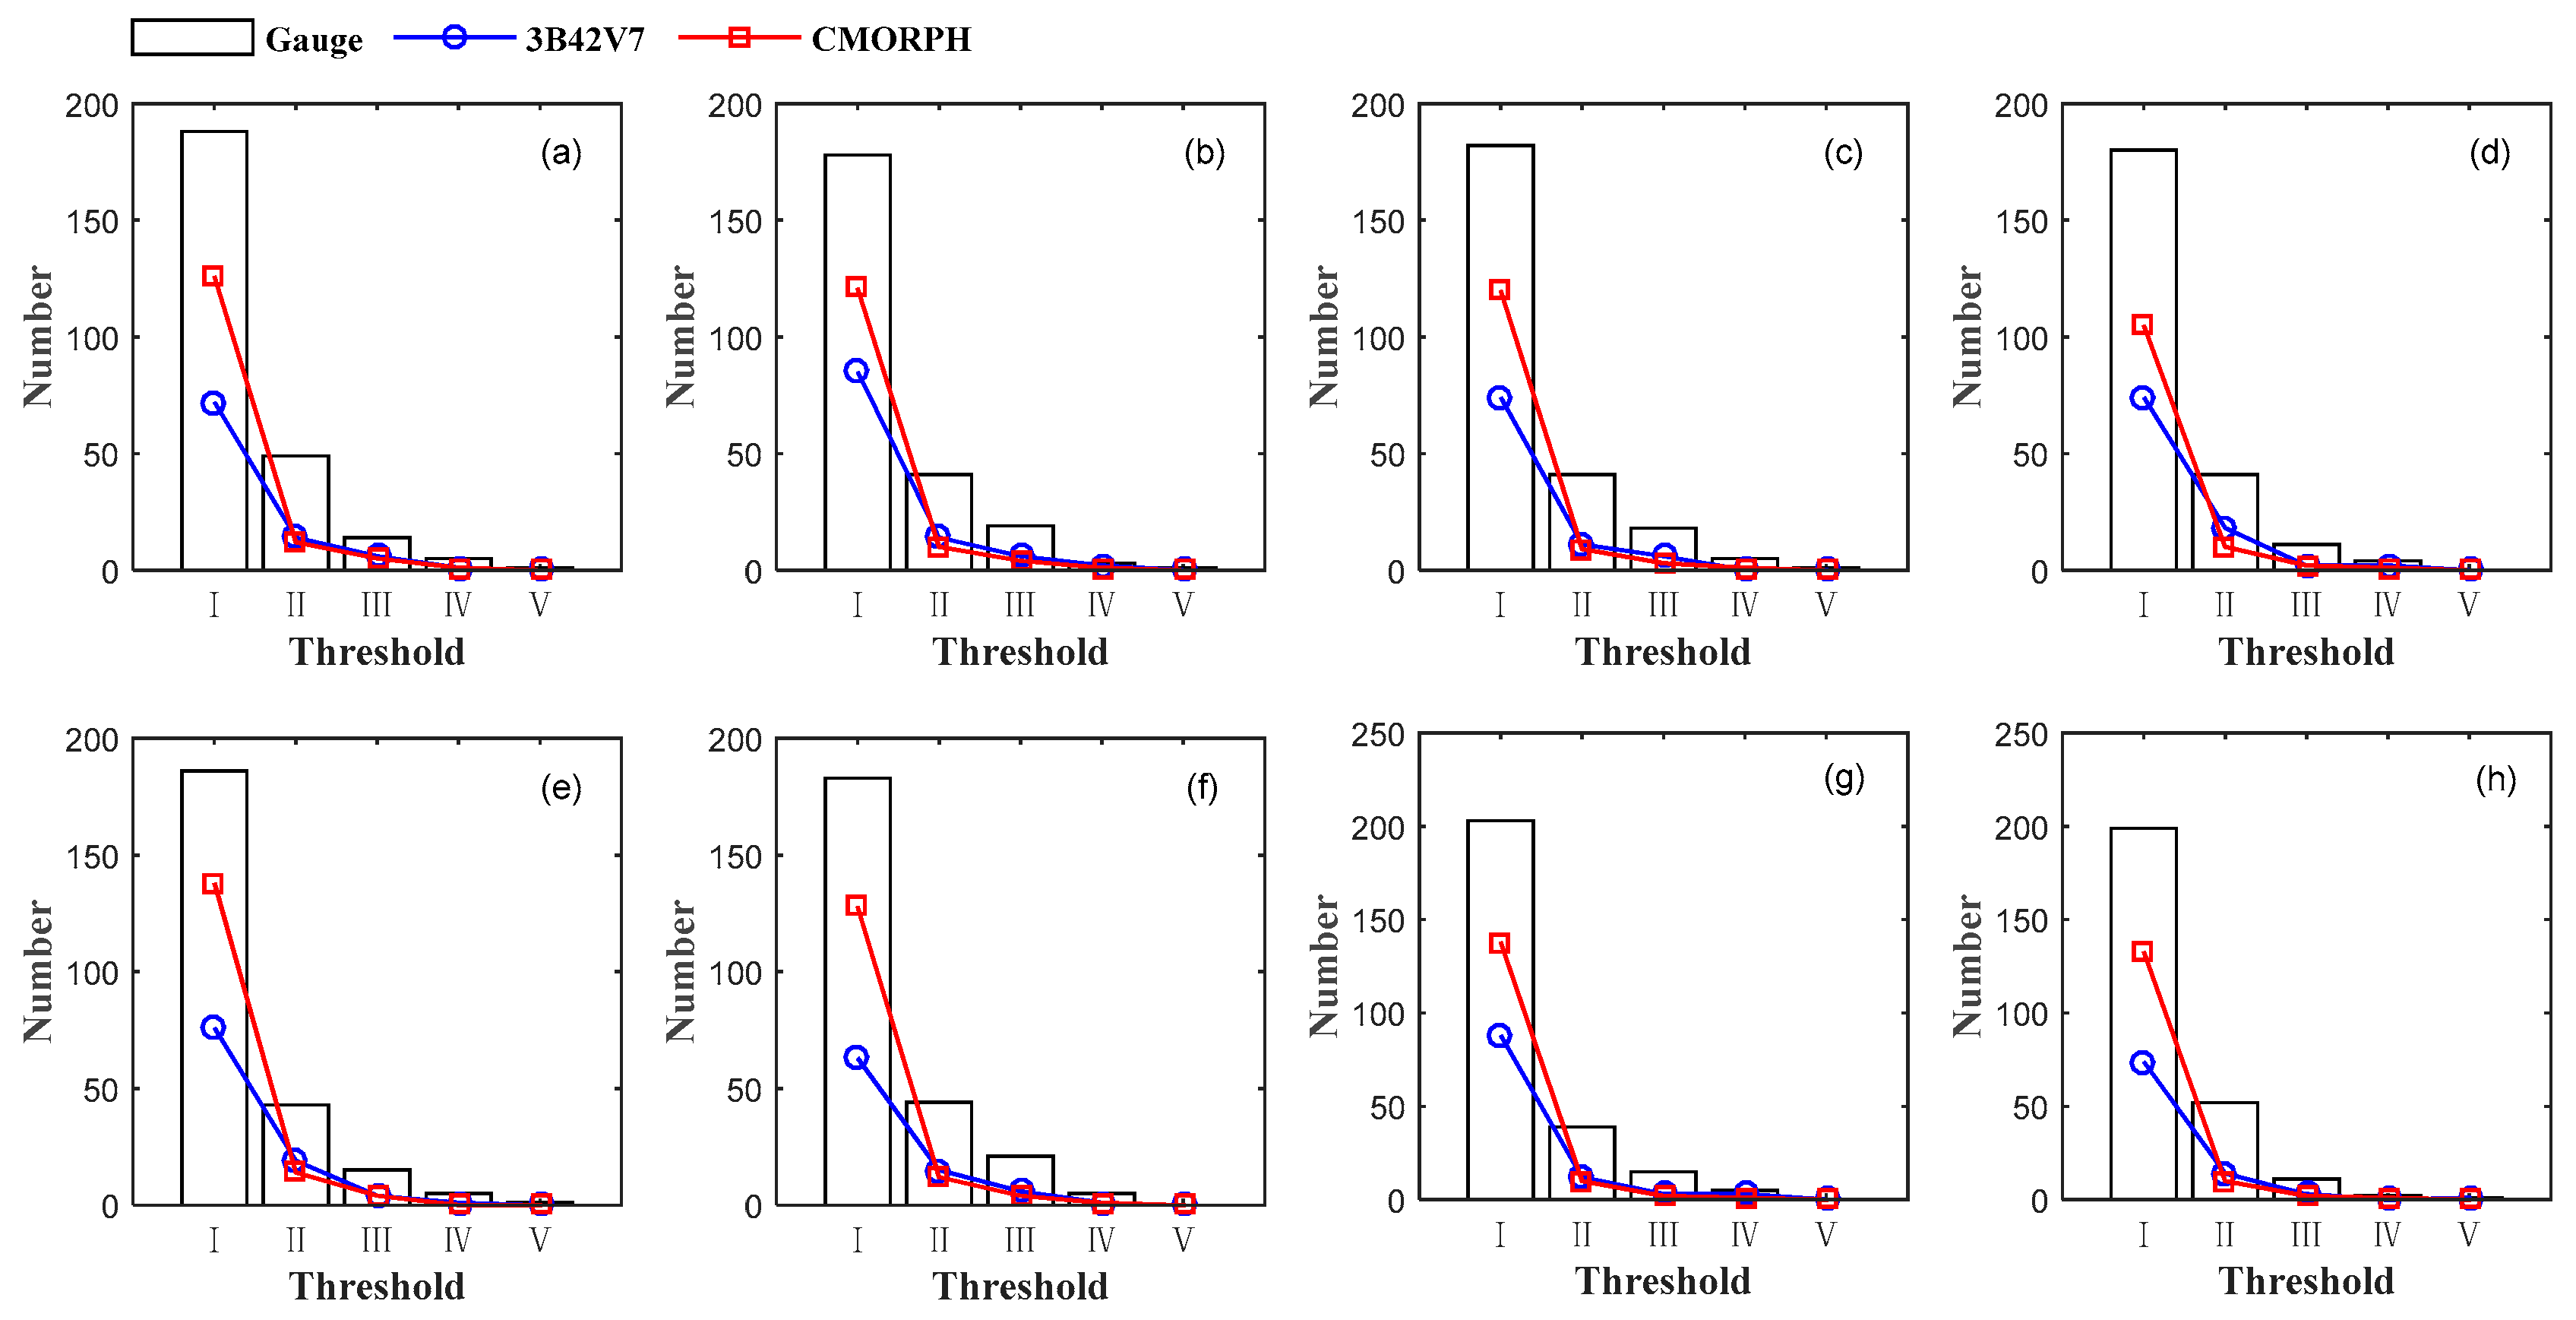
Based on the equations in Table 2 (see Section 2.3), three metrics of satellite detection capability were computed. In general, when we chose 0.1 mm/day as the threshold of the daily rainfall event, CMORPH had a better detection capability than 3B42V7, with an average POD of 0.68 (0.65), FAR of 0.25 (0.35), and CSI of 0.56 (0.48). We categorized the rainfalls into five classes according to different rainfall thresholds: I. Light rain (0.1–9.9 mm/day), II. Moderate rain (10–24.9 mm/day), III. Heavy rain (25–49.9 mm/day), IV. Torrential rain (50–99.9 mm/day), and V. Extra heavy rain (≥100 mm/day) [43]. These rainfall thresholds are also used to calculate categorical metrics, and when the rain gauge detects light rain and the satellite also detects light rain, it is considered a successful detection (H). With the increasing daily rainfall thresholds, POD and CSI of both 3B42V7 and CMORPH show a downward trend. The FAR in Figure 2 has a tendency to increase at first and then decrease at class III. Satellite-based products significantly underestimate heavy rain. Additionally, the higher ratio of rainfall false alarmed is distributed in class II. Figure 3 compares the total detection numbers of satellite-based rainfall and gauge rainfall under different rainfall thresholds. Satellites have lower detection numbers than rain gauges. CMORPH has a higher rainfall detection capability than 3B42V7, especially in light rain events.
3.2. Error Statistics Analysis
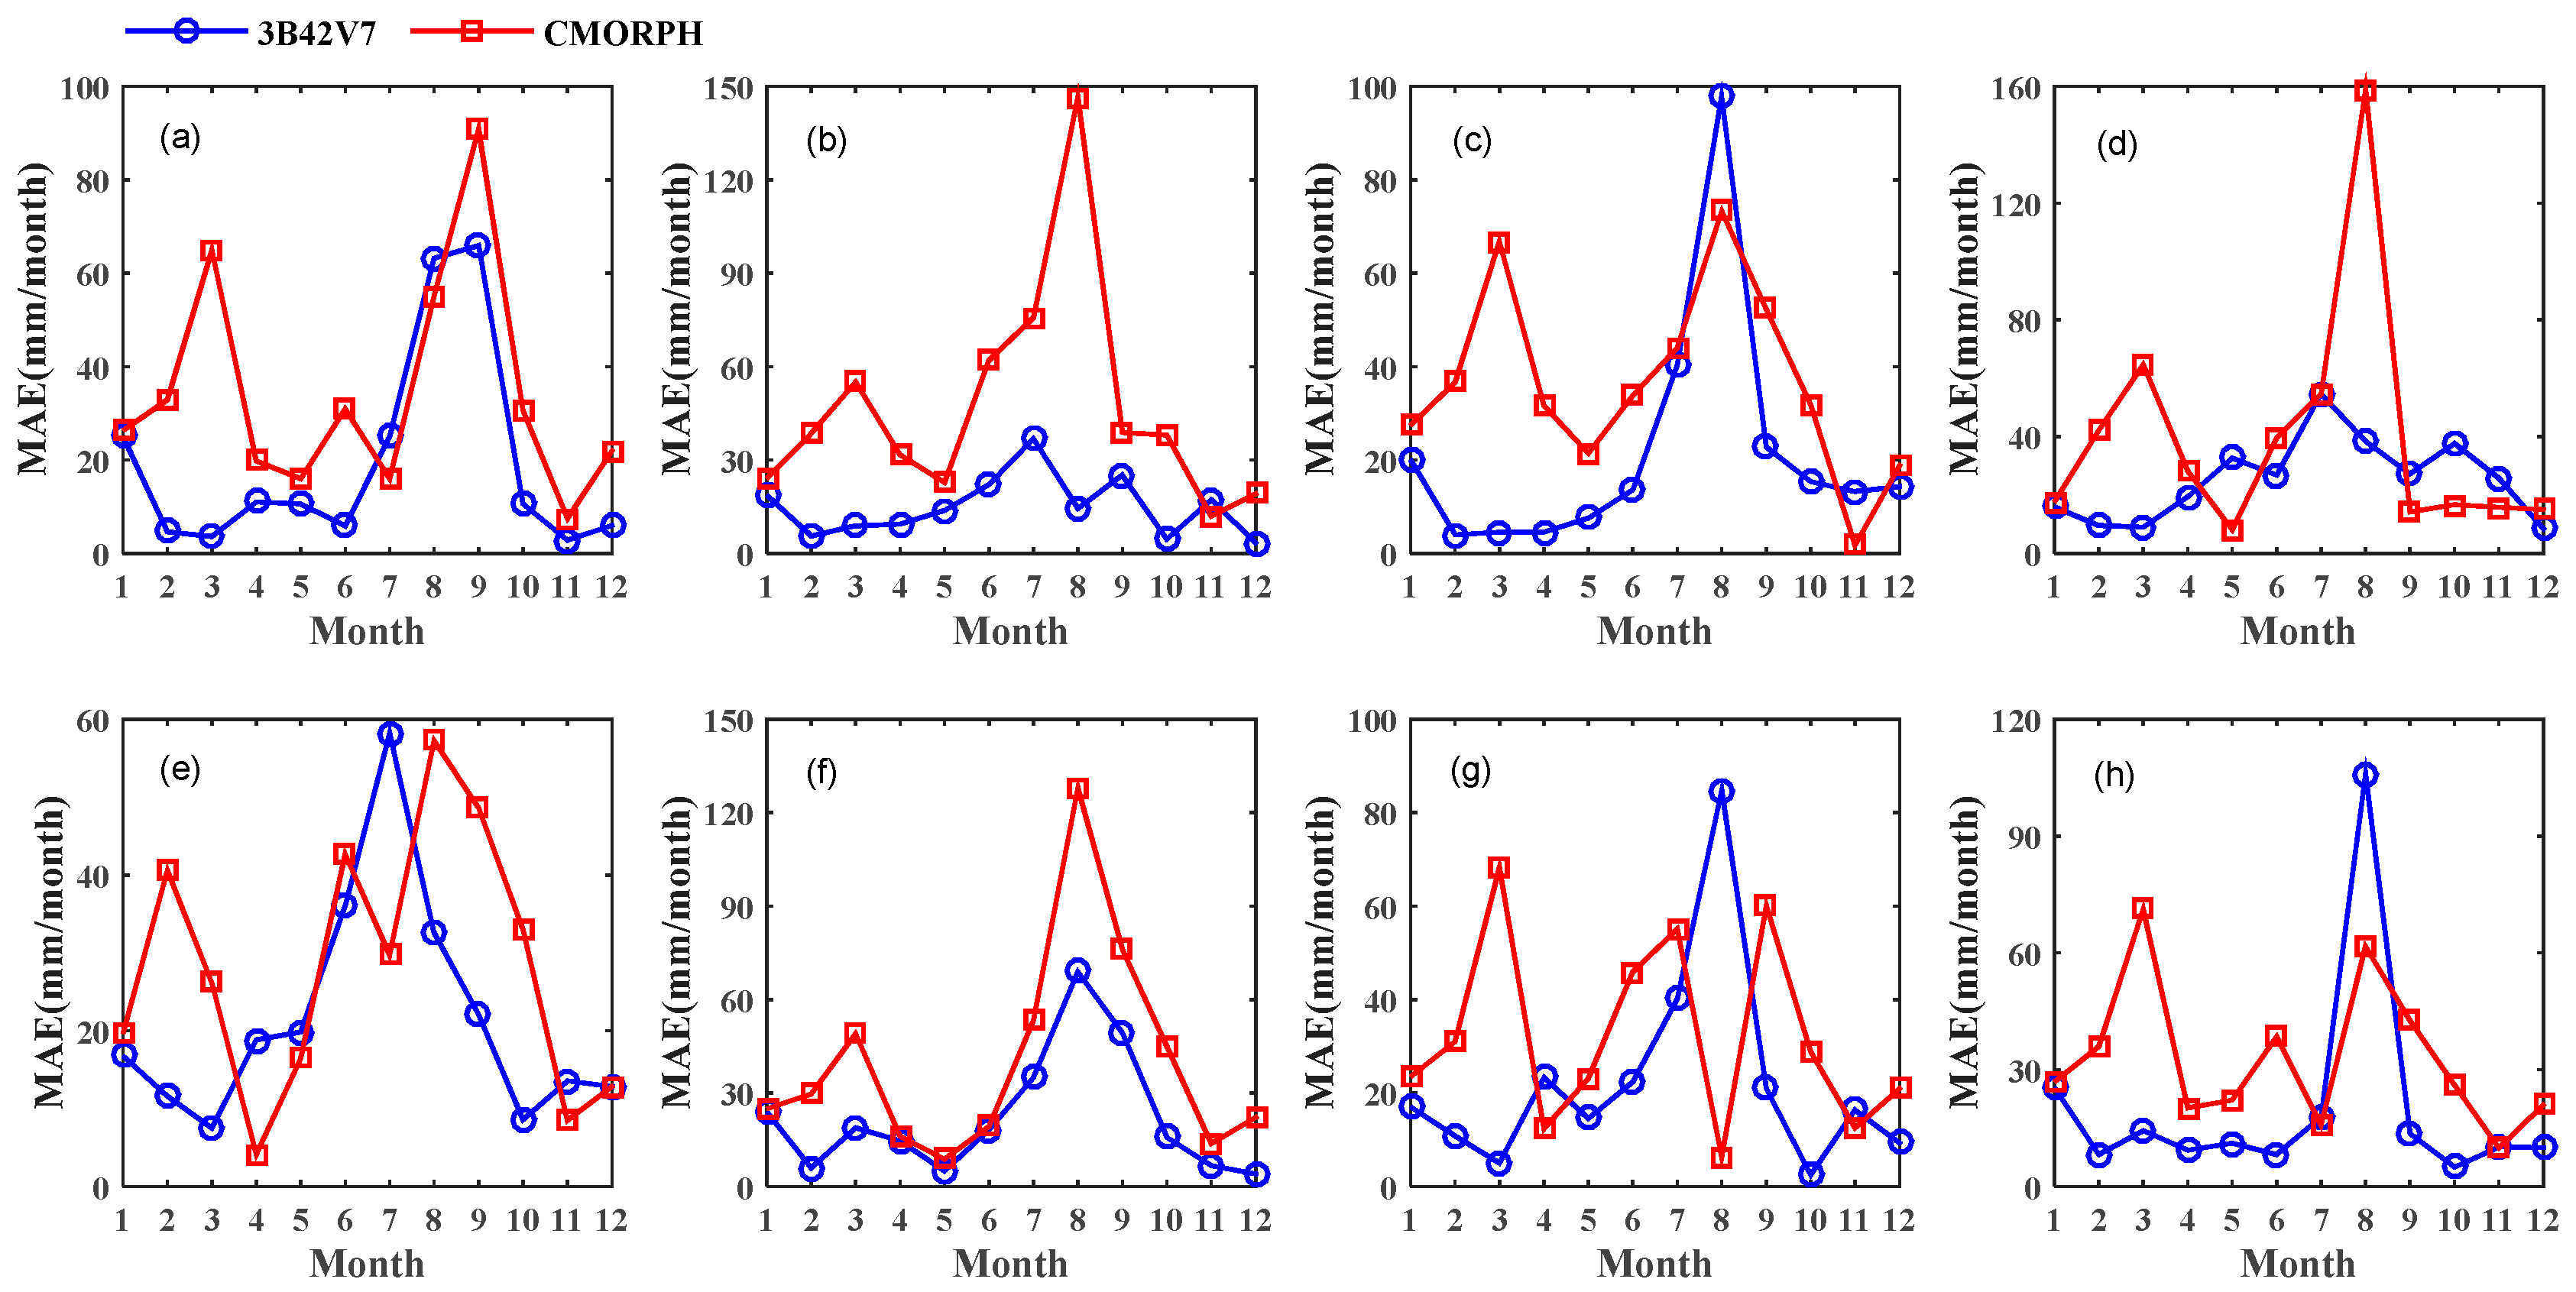
Another aspect of satellite-based precipitation estimation is error statistics. We calculated four indicators of error statistics in daily and monthly scales. The four indicators (MAE, RMSE, RB, and CC) of error statistics show that the accuracies of CMORPH are higher than those of 3B42V7 at the daily scale. However, the accuracies diverge greatly among different seasons. Figure 4 shows that the MAEs of two satellite-based daily rainfall events vary from Sunday to Saturday. Compared with rain gauge data, the MAEs of satellite daily rainfall are less than 5 mm/day. In ID a, c, e, g, and h, the MAEs are less than 4 mm/day. The MAEs from 3B42V7 are almost larger than those of CMORPH. At the monthly rainfall scale of Figure 5, the two satellite-based rainfall products have higher MAEs in the rainy seasons (from 1 June to 30 September). The accuracies in most rain gauges show that CMORPH has larger MAEs than 3B42V7 in non-rainy seasons.
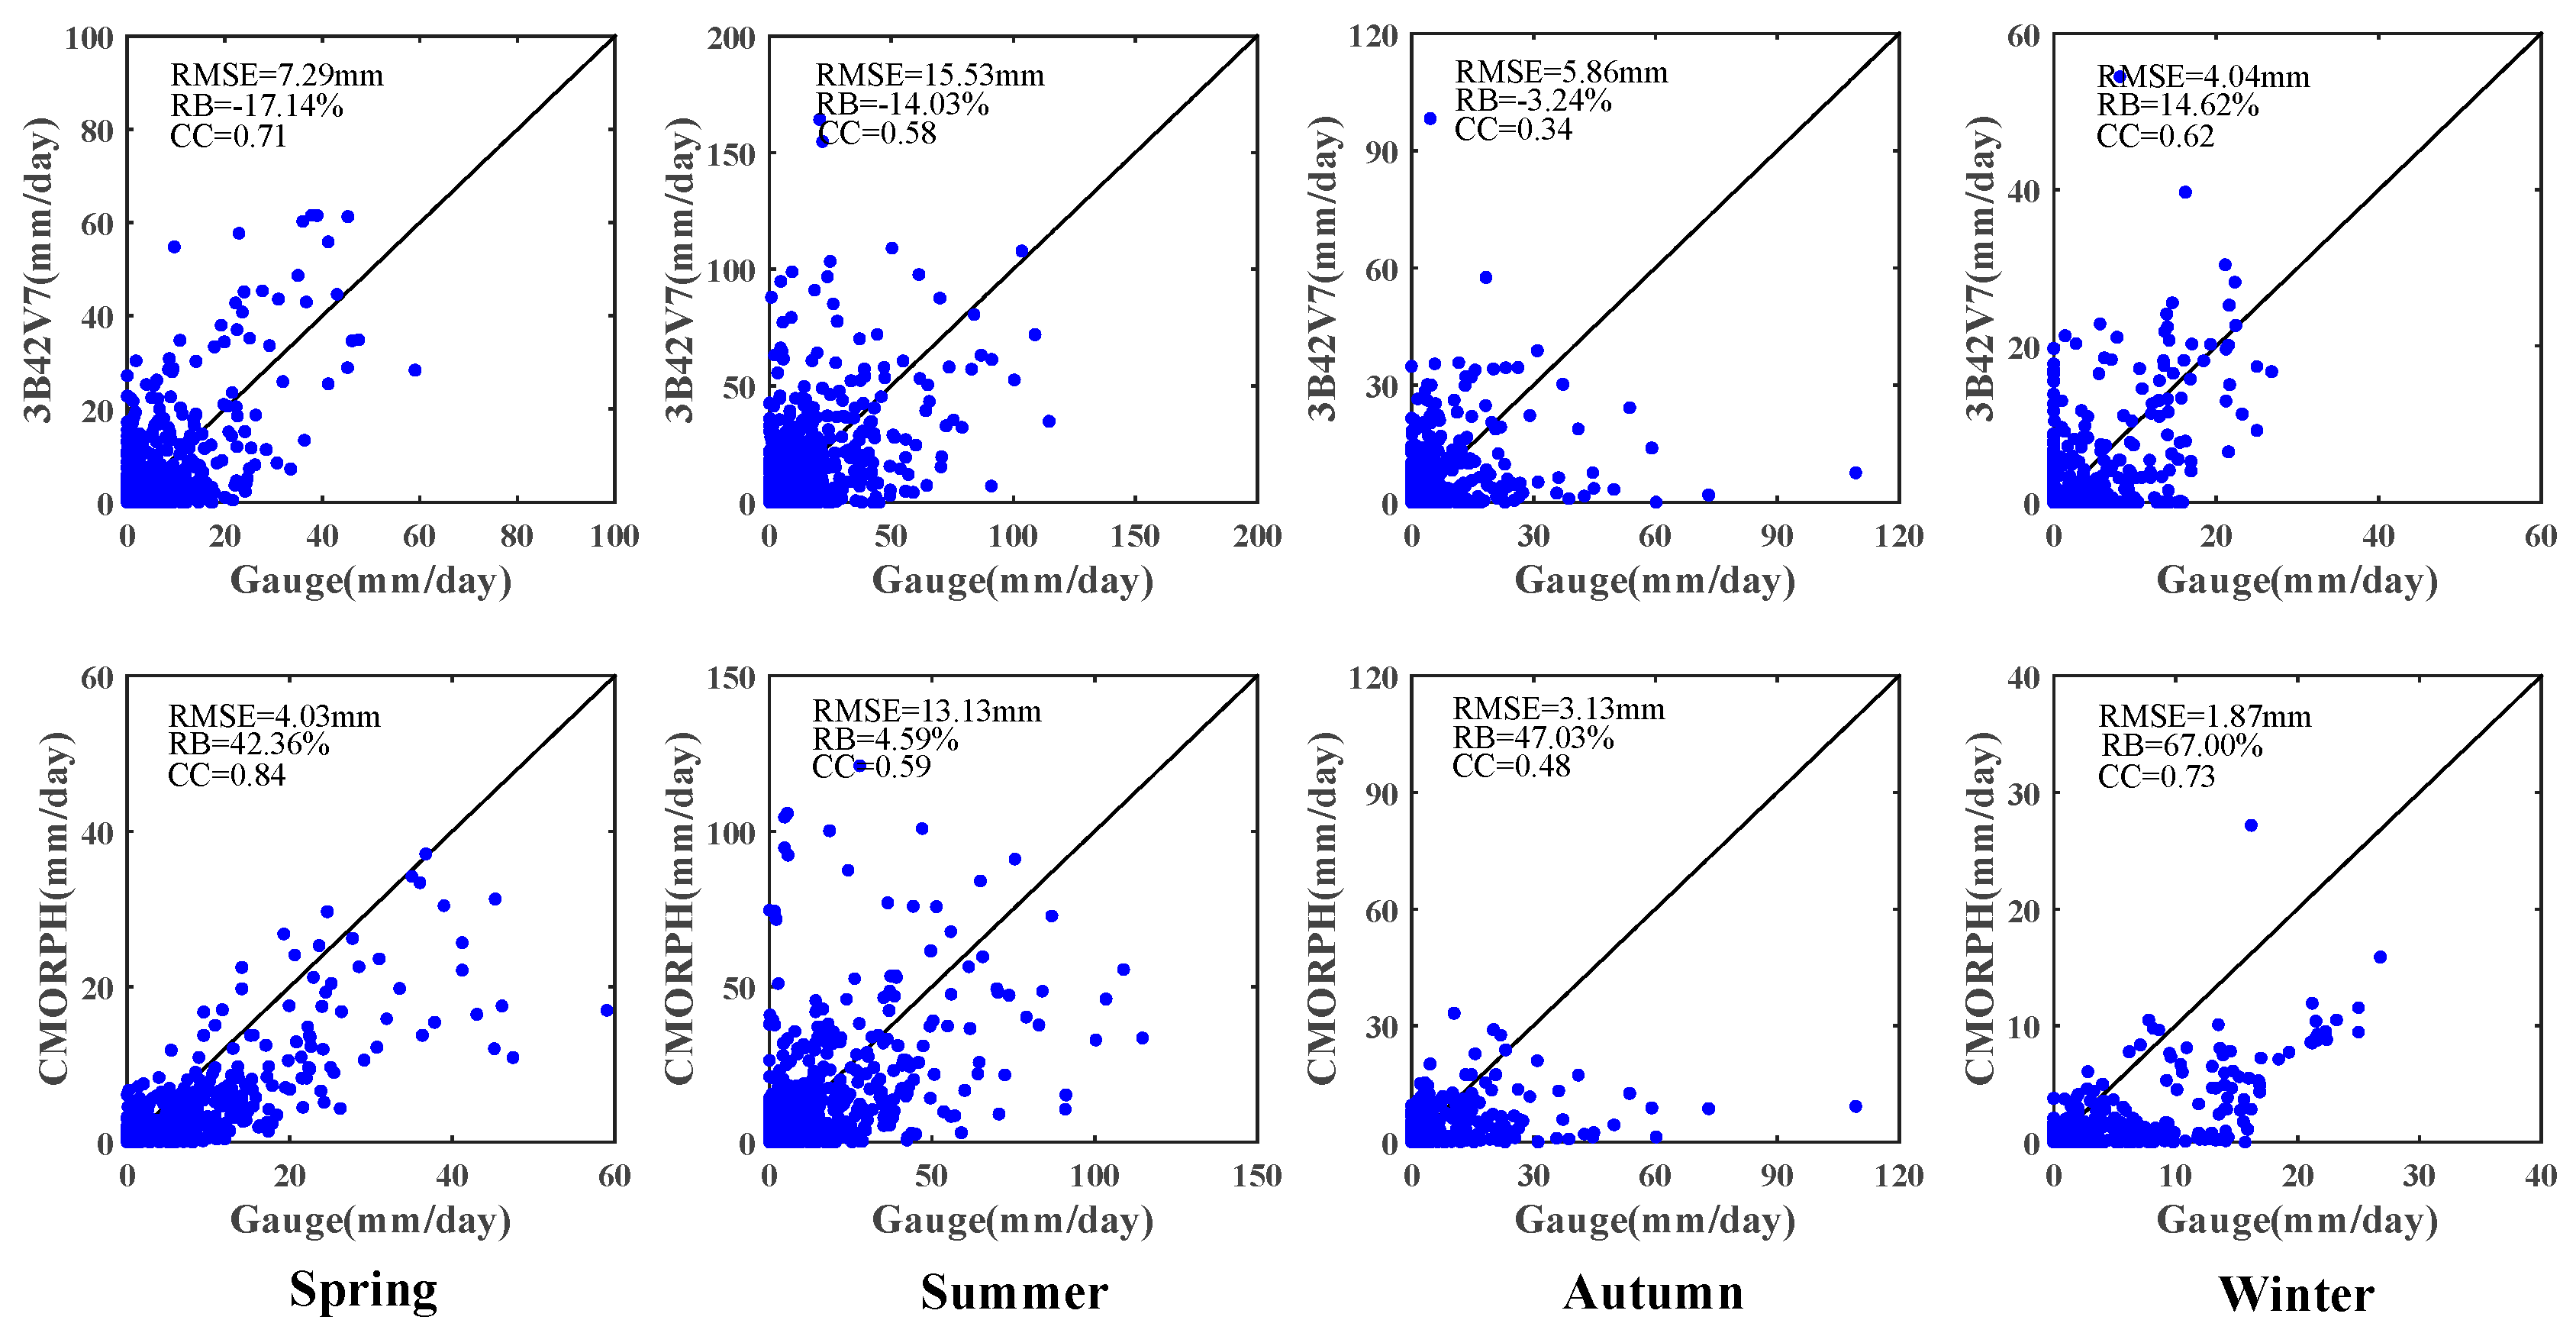
Further cross validations indicate that CMORPH exhibits a smaller MAE (averaged: 2.26 mm) and RMSE (averaged: 7.40 mm) than 3B42V7. Indicated by RB values, 3B42V7 has the most positive bias, whereas CMORPH shows a negative deviation. At last, CC of 3B42V7 (CMORPH) ranges from 0.52 (0.57) to 0.69 (0.66) at the daily scale (see Figure 6). The scatter plots explain that the rainfall data of CMORPH is more obviously underestimated than that of TRMM. Sometimes, rainfall data from 3B42V7 is overestimated. Figure 7 illustrates the distribution of daily rainfall between rain gauge data and 3B42V7 (CMORPH) in different seasons. CMORPH has a smaller RMSE (Spring: 4.03 mm; Summer: 13.13 mm; Autumn: 3.13 mm; Winter: 1.87 mm) than 3B42V7 (Spring: 7.29 mm; Summer: 15.53 mm; Autumn: 5.86 mm; Winter: 4.04 mm) in all seasons, and the largest RMSEs occur in Summer and the least in Winter. The RB result shows that CMORPH underestimates the daily rainfall by 42.36%, 4.59%, 47.03%, and 67.00% in the different seasons, respectively. Thus, 3B42V7 data only explains an underestimated trend in the winter (RB = 14.62%) and overestimates the rainfall in other seasons. As for CC, CMORPH has a stronger correlation with rain gauge observations, especially in spring (CC = 0.84).
At the monthly scale, 3B42V7 and CMORPH products have a higher correlation with rain gauge data (see Figure 8 and Figure 9). Similarly, the monthly 3B42V7 data overestimates rainfall at some rain gauges and has a larger deviation in ID d (RB = −26.34%). In contrast, the monthly CMORPH data underestimates rainfall in all of the selected rain gauges, especially in ID a (RB = 33.33%). Generally, in terms of CC and RB, 3B42V7 has higher accuracies than CMORPH. The CC value of 3B42V7 (CMORPH) ranges from 0.90 (0.76) to 0.98 (0.94), and the average CC is 0.94 (0.85).
4. Discussion
In recent years, some studies showed that one important aspect of the observed intensification of rainfall or extreme rainfall events concerns urban areas [8,30]. However, the complexity of driving mechanisms in urban areas makes it challenging for satellite-based rainfall products to be reliably simulated. Some studies have emphasized the evaluation of satellite-based rainfall products. In the Beijing-Tianjing-Hebei region, Zhang et al. [44] showed that TRMM satellite data provides a good judgment on rainstorm events and rainfall error control, but the errors vary in different rain levels. However, in this study, the error distribution characteristics of satellite-based rainfall products are not discussed further. Han et al. [9] also evaluated the accuracy of TRMM data in urban areas in different climatic regions (Houston, Atlanta, Las Vegas in the United States and one in Korea, Cheongju), as a function of climatic variables, and for different storm types. The results show that the relative magnitude of TRMM rain accumulation compared to rain gauge accumulation is smaller for higher rainfall intensity events. Tan and Zheng [45] evaluated the detection capability of two TRMM products (3B42 and 3B42RT) in Singapore, and found that satellite products do not capture any extreme rainfall events (>50 mm/day) during the northeast monsoon period. In Shanghai, the amount of extreme rainfall accounted for 66.97% of the average annual rainfall from 2010 to 2011. It is necessary to evaluate the accuracy of extreme rainfall. Based on the results mentioned, error distribution characteristics and extreme rainfall detection should be explored further.
4.1. The Error Distribution Characteristics of 3B42V7 and CMORPH
The satellite-based rainfall products include some errors caused by a variety of factors, and they can be divided into two major categories: one is sampling errors and the other is retrieval errors [33]. The sampling errors come from the grid data processing, for instance, the continuous spatial-temporal data is often made by integrating the sparse data [33]. The sampling errors may be accumulated and propagated from the three-hourly scale to the daily or monthly scale. More detailed characteristics of sampling errors can be referred to in the literatures by Demaria et al. [46] and Steiner et al. [47]. Retrieval errors are generated when deriving high quality precipitation estimates from multiple satellite rainfall observations. It correlates closely with satellite sensors, retrieval algorithms, rainfall types, and cloud physical characteristics [48]. Retrieval error can be further decomposed into random errors and systematic deviations [16]. Systematic deviations are caused by retrieval algorithms, which are characterized by underestimation or overestimation of satellite rainfall products.
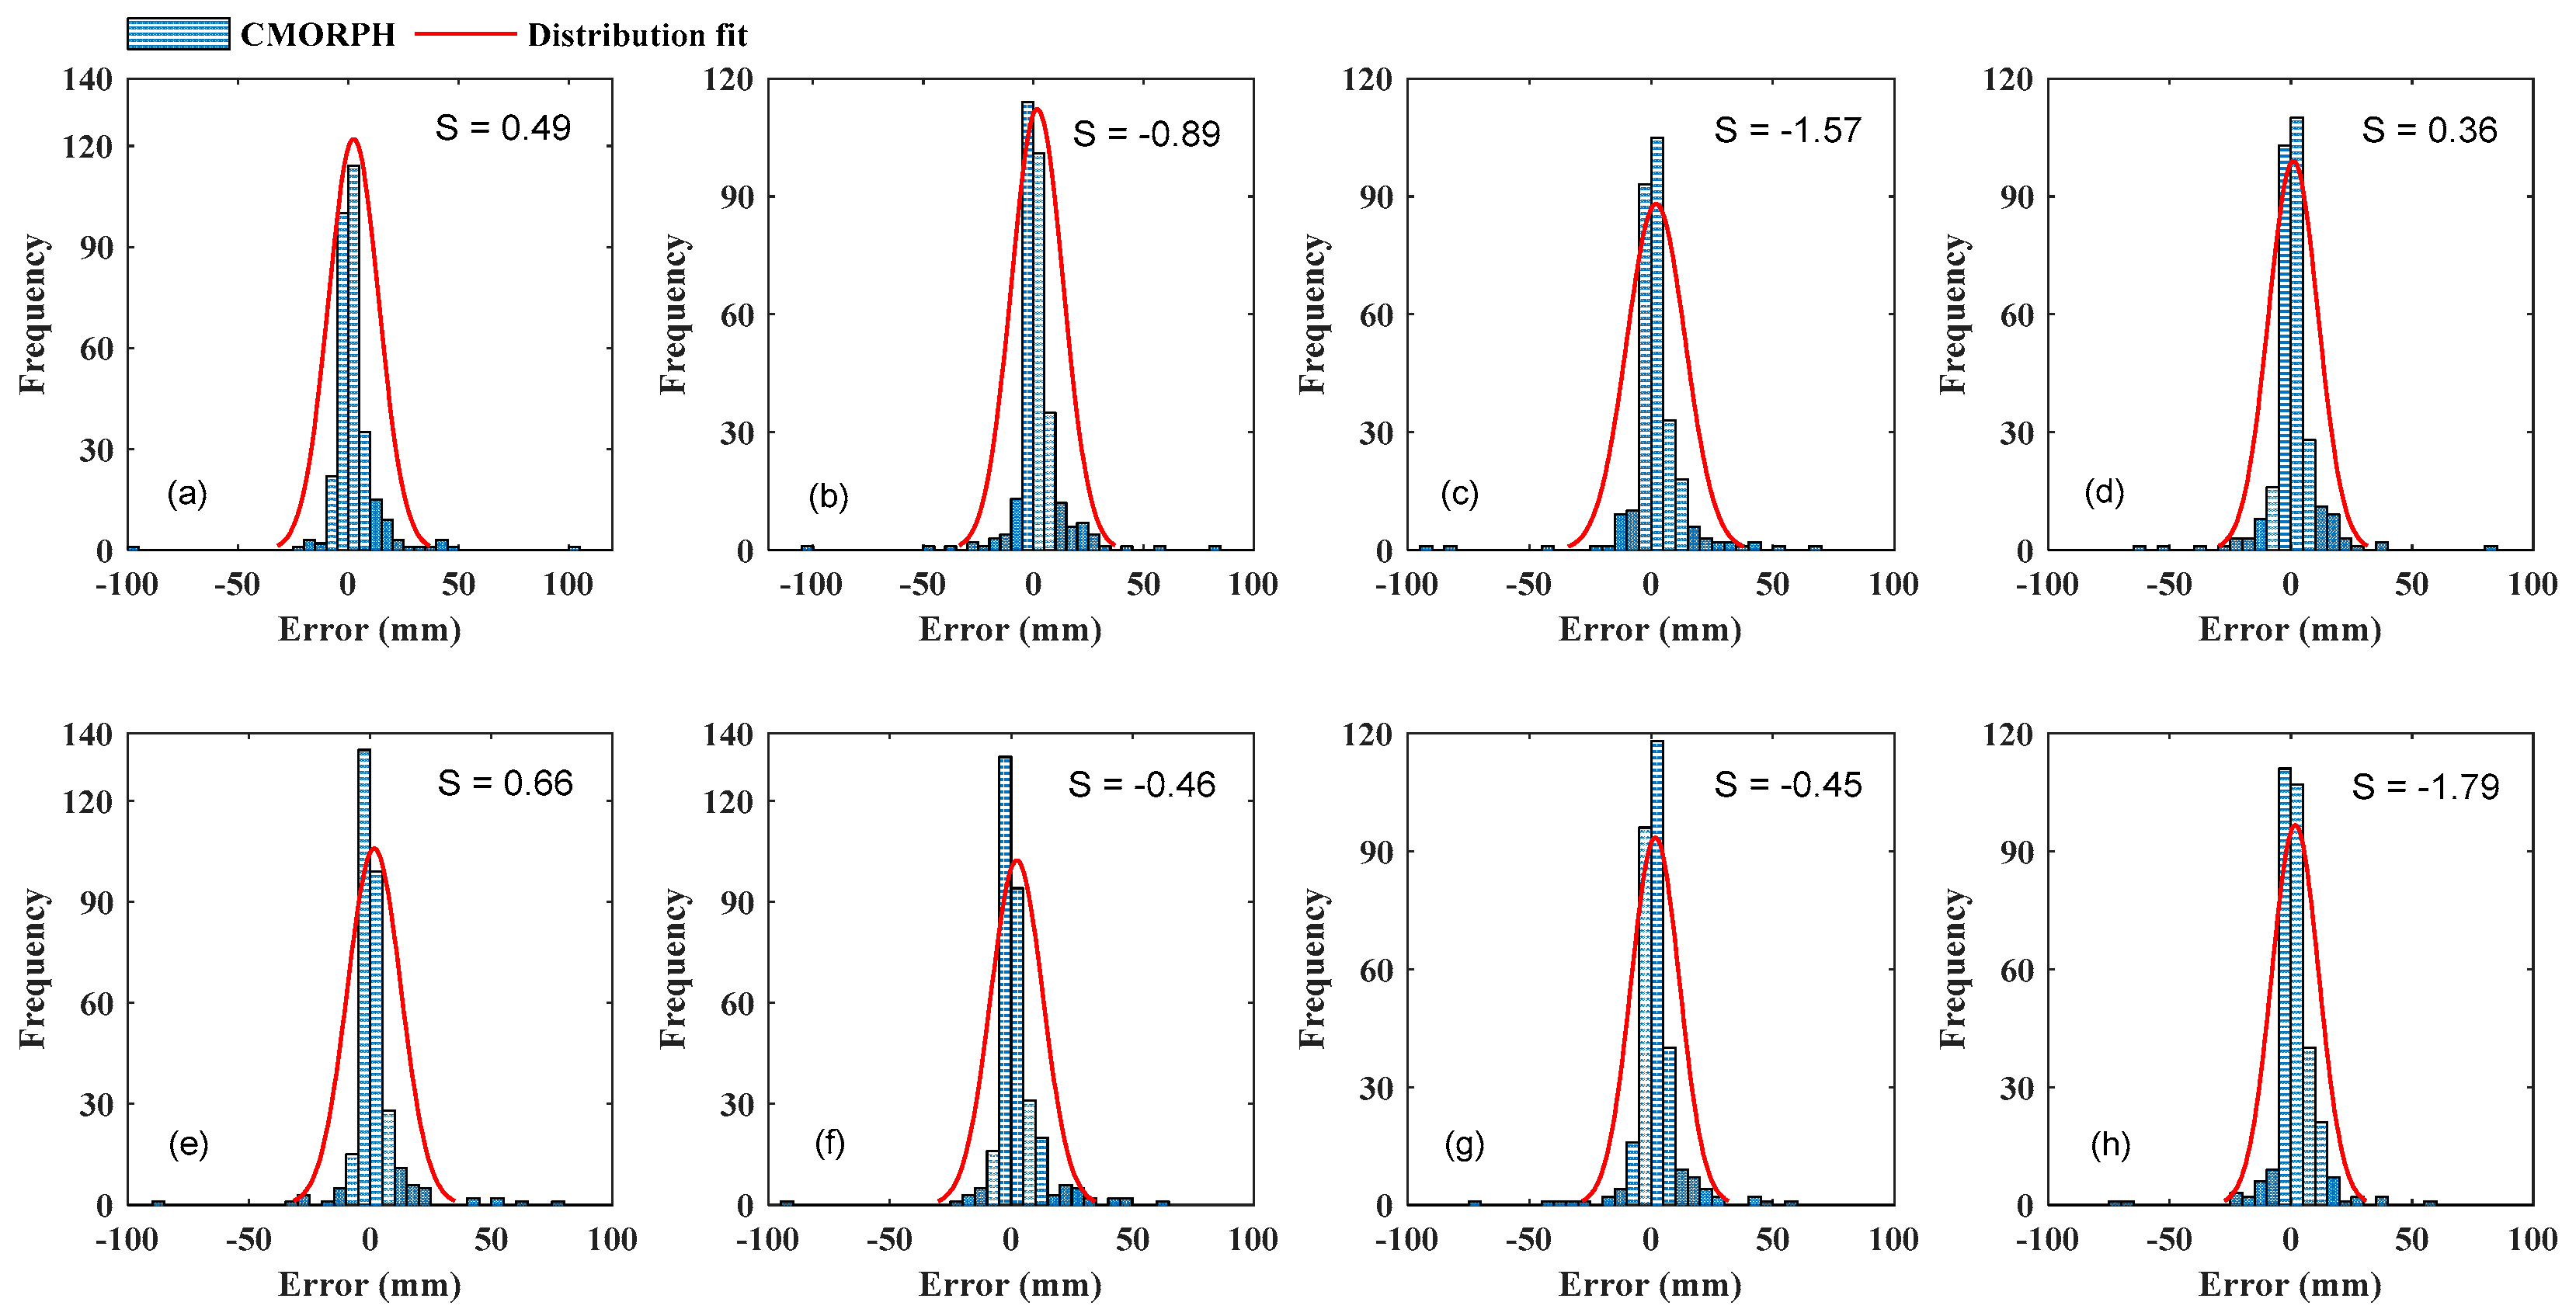
Therefore, it is important to analyze the error distribution characteristics of 3B42V7 and CMORPH. The statistical principle we adopted is the absolute error of daily rainfall between satellite data and rain gauge data (more than 0.1 mm/day). If the error is greater than 0, satellite data is underestimated; otherwise, the satellite data is overestimated. Figure 10 and Figure 11 illustrate the histograms of the frequency of daily rainfall errors from 3B42V7 and CMORPH, with an interval of 5 mm. The fitted curve shows the distribution of general errors. Skewness coefficient (S) is used to characterize the reciprocity of the data around the means of the sample [49]; if S is positive (negative), the peak of the distribution curve is on the left (right) side of the mean value, and the right (left) tail is thicker. The qualitative indicator illustrates that the histogram is more likely to be right (left) offset, and so the satellite data error is biased in terms of underestimating (overestimating) the measured rainfall.
The two figures show that the most errors of 3B42V7 and CMORPH are between −10 and 10 mm/day. According to the fitted distribution curve, CMORPH error is more concentrated in the range of −5 to 5 mm/day, and 3B42V7 error is relatively discrete. The results of the two satellites are different in terms of the S values. In ID a (S = −2.53) and h (S = −4.46), the lowest values of 3B42V7 approach −150, and that indicates that 3B42V7 has more overestimated results than the rain gauge data.
4.2. Extreme Rainfall Evaluation of 3B42V7 and CMORPH
From the above analysis in Section 3.1 and Section 3.2, we found that the accuracies of satellite-based rainfall products decrease with increasing rainfall amounts. Particularly, in heavy or extreme rainfall events, satellite-based rainfall products have lower accuracies. In other words, satellite-based products are not suitable for a heavy rainfall evaluation.
For example, on the 4 July 2010, the daily rainfall of six rain gauges exceeded more than 50 mm/day, and the total extreme rainfall was 383.50 mm. But the number of satellites showed that only one gridded data set of 3B42V7 and four gridded data sets of CMORPH were detected, and the total extreme rainfall was 50.40 mm and 310.46 mm, respectively. An extreme rainfall event is defined as the daily rainfall over 50 mm in Shanghai [50]. We selected 21 extreme rainfall events from rain gauge data and obtained the corresponding gridded data of the two satellite-based products from January 2010 to December 2011. It indicates that the daily rainfall of 3B42V7 (CMORPH) has 14 (eight) results that exceed 50 mm. 3B42V7 has a higher detection capability of extreme rainfall than CMORPH, but the detection numbers from them both do not exceed half of the extreme rainfall events from rain gauge data. Table 4 lists detailed information of the extreme rainfall events.
5. Conclusions
In this study, we used two evaluation methods and explored the accuracies of two satellite-based rainfall products: TRMM 3B42V7 and CMORPH, from January 2010 to December 2011 in Shanghai. The conclusions are summarized as follows.
During the study period, when we chose 0.1 mm/day as the threshold of the daily rainfall event, the results of POD, FAR, and CSI showed that CMORPH has a better detection capability than 3B42V7 in the daily rainfall detection, with a higher POD (0.68) and CSI (0.56) and a lower FAR (0.25). The capability of detecting rainfall from two satellites decreases as the rainfall amounts increase, and both satellite-based rainfall products have a lower detection capability for heavy rainfall events.
At the daily scale, CMORPH has lower MAE and RMSE values than those of 3B42V7. Some RBs of 3B42V7 overestimate the rain gauge rainfall, whereas the CMORPH underestimates the rainfall. In summer, both 3B42V7 and CMORPH have the highest RMSE of 15.53 mm/day and 13.13 mm/day, respectively. At the monthly scale, 3B42V7 shows a better performance than CMORPH, in terms of the value of CC and RB, and the two satellites have higher correlations with rain gauge data and higher MAEs in rainy seasons (from 1 June to 30 September). In non-rainy months, CMORPH has higher MAEs than 3B42V7. 3B42V7 and CMORPH satellite rainfall products show more uncertainty at the daily scale than at the monthly scale. The errors of 3B42V7 and CMORPH are concentrated in the range from −10 to 10 mm/day. Both 3B42V7 and CMORPH have a worse detection capability for extreme rainfall events.
To summarize, 3B42V7 and CMORPH satellite-based products with a daily resolution have a poor performance in Shanghai, especially for a heavy rainfall evaluation. The accuracy of 3B42V7 and CMORPH at the monthly scale is higher, and the accuracy of 3B42V7 is higher than that of CMORPH. The monthly rainfall data from satellite-based rainfall products can be parameters that are input to the hydrological model and data assimilation [51,52,53,54]. In the future, we will integrate the two evaluation methods and deeply analyze the calculation of different error statistics to elucidate insights into rainfall detection. Moreover, we will integrate the multi-source satellite-based rainfall products to improve the spatio-temporal resolution using data assimilation and statistical downscaling approaches.
Acknowledgments
This work is supported by the National Key Research and Development Program of China (No. 2016YFC0502706), by the National Natural Science Foundation of China (Grant No. 41501458, 41671342, 5161101688), and by the China Postdoctoral Science Foundation Funded Project (Grant No. 2016M592860, 2015M570668, 2016T90732), and is also sponsored by the Shanghai Gaofeng & Gaoyuan Project for University Academic Program Development.
Author Contributions
All authors contributed to the design and development of the work. Qin Jiang carried out the data analysis and wrote the paper. Weiyue Li and Jiahong Wen are supervisors of Qin Jiang, and conceived and designed the experiments. Can Qiu, Weiwei Sun, and Qilin Fang participated in the discussion of the paper. Ming Xu and Jianguo Tan provided important suggestions on the research ideas.
Conflicts of Interest
The authors declare no conflict of interest.
References
- Romps, D.M. Response of Tropical Precipitation to Global Warming. J. Atmos. Sci. 2010, 68, 123–138. [Google Scholar] [CrossRef]
- James, R.; Washington, R. Changes in African temperature and precipitation associated with degrees of global warming. Clim. Chang. 2013, 117, 859–872. [Google Scholar] [CrossRef]
- Karmalkar, A.V.; Bradley, R.S. Consequences of Global Warming of 1.5 °C and 2 °C for Regional Temperature and Precipitation Changes in the Contiguous United States. PLoS ONE 2017, 12, e0168697. [Google Scholar] [CrossRef] [PubMed]
- Huang, P. Regional response of annual-mean tropical rainfall to global warming. Atmos. Sci. Lett. 2014, 15, 103–109. [Google Scholar] [CrossRef]
- Intergovernmental Panel on Climate Change. Climate Change 2013: The Physical Science Basis. Contribution of Working Group I to the Fifth Assessment Report of the Intergovernmental Panel on Climate Change; Cambridge University Press: New York, NY, USA, 2013. [Google Scholar]
- Zhai, P.M.; Zhang, X.B.; Wan, H.; Pan, X. Trends in Total Precipitation and Frequency of Daily Precipitation Extremes over China. J. Clim. 2005, 18, 1096–1108. [Google Scholar] [CrossRef]
- Shrestha, A.B.; Bajracharya, S.R.; Sharma, A.R.; Duo, C.; Kulkarni, A. Observed trends and changes in daily temperature and precipitation extremes over the Koshi river basin 1975–2010. Int. J. Climatol. 2017, 37, 1066–1083. [Google Scholar] [CrossRef]
- Jones, M.R.; Blenkinsop, S.; Fowler, H.J.; Kilsby, C.G. Objective classification of extreme rainfall regions for the UK and updated estimates of trends in regional extreme rainfall. Int. J. Climatol. 2014, 34, 751–765. [Google Scholar] [CrossRef]
- Han, W.S.; Burian, S.J.; Shepherd, J.M. Assessment of satellite-based rainfall estimates in urban areas in different geographic and climatic regions. Nat. Hazards 2011, 56, 733–747. [Google Scholar] [CrossRef]
- Rajeevan, M.; Bhate, J.; Jaswal, A.K. Analysis of variability and trends of extreme rainfall events over India using 104 years of gridded daily rainfall data. Geophys. Res. Lett. 2008, 35, 60–74. [Google Scholar]
- Huffman, G.A.; Adler, R.; Bolvin, D.T.; Gu, G.; Nelkin, E.; Bowman, K.; Hong, Y.; Stocker, T.; Wolff, D. The TRMM multi-satellite precipitation analysis (TMPA): Quasi-global, multiyear, combined-sensor precipitation estimates at fine scale. J. Hydrometeorol. 2007, 8, 38–55. [Google Scholar] [CrossRef]
- Joyce, R.J.; Janowiak, J.E.; Arkin, P.A.; Xie, P.P. CMORPH: A Method That Produces Global Precipitation Estimates From Passive Microwave and Infrared Data at High Spatial and Temporal Resolution. J. Hydrometeorol. 2004, 5, 287–296. [Google Scholar] [CrossRef]
- Sorooshian, S.; Hsu, K.-L.; Gao, X.G.; Gupta, H.V.; Imam, B.; Braithwaite, D. Evaluation of PERSIANN System Satellite–Based Estimates of Tropical Rainfall. Bull. Am. Meteorol. Soc. 2000, 81, 2035–2046. [Google Scholar] [CrossRef]
- Tang, B.H.; Bi, Y.Y.; Li, Z.L.; Xia, J. Generalized Split-Window Algorithm for Estimate of Land Surface Temperature from Chinese Geostationary FengYun Meteorological Satellite (FY-2C) Data. Sensors 2008, 8, 933–951. [Google Scholar] [CrossRef] [PubMed]
- Liu, J.Z.; Duan, Z.; Jiang, J.C.; Zhu, A.X. Evaluation of three satellite precipitation products TRMM 3B42, CMORPH, and PERSIANN over a subtropical watershed in China. Adv. Meteorol. 2015, 2015, 2731–2738. [Google Scholar] [CrossRef]
- Tang, L.; Tian, Y.D.; Yan, F.; Habib, E. An improved procedure for the validation of satellite-based precipitation estimates. Atmos. Res. 2015, 163, 61–73. [Google Scholar] [CrossRef]
- Vernimmen, R.R.E.; Hooijer, A.; Mamenun; Aldrian, E.; van Dijk, A.I.J.M. Evaluation and bias correction of satellite rainfall data for drought monitoring in Indonesia. Hydrol. Earth Syst. Sci. 2012, 8, 5969–5997. [Google Scholar] [CrossRef]
- Hong, Y.; Adler, R.F.; Negri, A.; Huffman, G.J. Flood and landslide applications of near real-time satellite rainfall products. Nat. Hazards 2007, 43, 285–294. [Google Scholar] [CrossRef]
- Hong, Y.; Adler, R.F. Predicting global landslide spatiotemporal distribution: Integrating landslide susceptibility zoning techniques and real-time satellite rainfall estimates. Int. J. Sediment Res. 2008, 23, 249–257. [Google Scholar] [CrossRef]
- Li, W.Y.; Liu, C.; Hong, Y.; Saharia, M.; Sun, W.W.; Yao, D.J.; Chen, W. Rainstorm-induced shallow landslides process and evaluation—A case study from three hot spots, China. Geomat. Nat. Hazards Risk 2016, 7, 1–11. [Google Scholar] [CrossRef]
- Jiang, S.H.; Ren, L.L.; Hong, Y.; Yang, X.L.; Ma, M.W.; Zhang, Y.; Yuan, F. Improvement of Multi-Satellite Real-Time Precipitation Products for Ensemble Streamflow Simulation in a Middle Latitude Basin in South China. Water Resour. Manag. 2014, 28, 2259–2278. [Google Scholar] [CrossRef]
- Lee, H.; Zhang, Y.; Seo, D.J.; Xie, P.P. Utilizing satellite precipitation estimates for streamflow forecasting via adjustment of mean field bias in precipitation data and assimilation of streamflow observations. J. Hydrol. 2015, 529, 779–794. [Google Scholar] [CrossRef]
- Zhu, Q.; Xuan, W.; Liu, L.; Xu, Y.-P. Evaluation and hydrological application of precipitation estimates derived from PERSIANN-CDR, TRMM 3B42V7, and NCEP-CFSR over humid regions in China. Hydrol. Process. 2016, 30, 3061–3083. [Google Scholar] [CrossRef]
- Jiang, S.H.; Liu, S.Y.; Ren, L.L.; Yong, B.; Zhang, L.Q.; Wang, M.H.; Lu, Y.J.; He, Y.Q. Hydrologic Evaluation of Six High Resolution Satellite Precipitation Products in Capturing Extreme Precipitation and Streamflow over a Medium-Sized Basin in China. Water 2018, 10, 25. [Google Scholar] [CrossRef]
- Zhang, Y.; Smith, J.A.; Luo, L.F.; Wang, Z.F.; Baeck, M.L. Urbanization and Rainfall Variability in the Beijing Metropolitan Region. J. Hydrometeorol. 2014, 15, 2219–2235. [Google Scholar] [CrossRef]
- Chen, S.; Li, W.-B.; Du, Y.-D.; Mao, C.-Y.; Zhang, L. Urbanization effect on precipitation over the Pearl River Delta based on CMORPH data. Adv. Clim. Chang. Res. 2015, 6, 16–22. [Google Scholar] [CrossRef]
- Meng, D.; Gong, H.L.; Li, X.J.; Yang, S.Y. Spatiotemporal distribution of the rainstorm and the relationship between urban heat island and urban rain island in Beijing on July 21, 2012. Remote Sens. Land Resour. 2017, 29, 178–185. [Google Scholar]
- Seino, N.; Aoyagi, T.; Tsuguti, H. Numerical simulation of urban impact on precipitation in Tokyo: How does urban temperature rise affect precipitation? Urban Clim. 2016, in press. [Google Scholar] [CrossRef]
- Wang, D.G.; Jiang, P.; Wang, G.L.; Wang, D.S. Urban extent enhances extreme precipitation over the Pearl River Delta, China. Atmos. Sci. Lett. 2015, 16, 310–317. [Google Scholar] [CrossRef]
- Liang, P.; Ding, Y.H. The long-term variation of extreme heavy precipitation and its link to urbanization effects in Shanghai during 1916–2014. Adv. Atmos. Sci. 2017, 34, 321–334. [Google Scholar] [CrossRef]
- Li, D.; Christakos, G.; Ding, X.X.; Wu, J.P. Adequacy of TRMM satellite rainfall data in driving the SWAT modelling of Tiaoxi catchment (Taihu lake basin, China). J. Hydrol. 2018, 556, 1139–1152. [Google Scholar] [CrossRef]
- Christian, K.; William, B.; Toshiaki, K.; James, S.; Joanne, S. The Tropical Rainfall Measuring Mission (TRMM) Sensor Package. J. Atmos. Ocean. Technol. 1998, 15, 809–817. [Google Scholar]
- Hong, Y.; Kummerow, C.D.; Olson, W.S. Separation of Convective and Stratiform Precipitation Using Microwave Brightness Temperature. J. Appl. Meteorol. 1999, 38, 1195–1213. [Google Scholar] [CrossRef]
- Huang, Y.; Chen, S.; Cao, Q.; Hong, Y.; Wu, B.W.; Huang, M.Y.; Qiao, L.; Zhang, Z.X.; Li, Z.; Li, W.Y.; et al. Evaluation of Version-7 TRMM Multi-Satellite Precipitation Analysis Product during the Beijing Extreme Heavy Rainfall Event of 21 July 2012. Water 2013, 6, 32–44. [Google Scholar] [CrossRef]
- Kim, K.Y.; Park, J.M.; Baik, J.J.; Choi, M.H. Evaluation of topographical and seasonal feature using GPM IMERG and TRMM 3B42 over Far-East Asia. Atmos. Res. 2017, 187, 95–105. [Google Scholar] [CrossRef]
- Shen, Y.; Xiong, A.Y.; Wang, Y.; Xie, P.P. Performance of high-resolution satellite precipitation products over China. J. Geophys. Res. 2010, 115, D02114. [Google Scholar] [CrossRef]
- Duan, Z.; Liu, J.Z.; Tuo, Y.; Chiogna, G.; Disse, M. Evaluation of eight high spatial resolution gridded precipitation products in Adige Basin (Italy) at multiple temporal and spatial scales. Sci. Total Environ. 2016, 573, 1536–1553. [Google Scholar] [CrossRef] [PubMed]
- Dinku, T.; Ceccato, P.; Grover-Kopec, E.; Lemma, M.; Connor, S.J.; Ropelewski, C.F. Validation of satellite rainfall products over East Africa’s complex topography. Int. J. Remote Sens. 2007, 28, 1503–1526. [Google Scholar] [CrossRef]
- Tan, M.L.; Santo, H. Comparison of GPM IMERG, TMPA 3B42 and PERSIANN-CDR satellite precipitation products over Malaysia. Atmos. Res. 2018, 202, 63–76. [Google Scholar] [CrossRef]
- Wu, C.L.; Chau, K.W.; Fan, C. Prediction of rainfall time series using modular artificial neural networks coupled with data-preprocessing techniques. J. Hydrol. 2010, 389, 146–167. [Google Scholar] [CrossRef]
- Sapiano, M.R.P.; Arkin, P.A. An intercomparison and validation of high-resolution satellite precipitation estimates with 3-hourly gauge data. J. Hydrometeorol. 2009, 10, 149–166. [Google Scholar] [CrossRef]
- Prakash, S.; Mitra, A.K.; AghaKouchak, A.; Pai, D.S. Error characterization of TRMM Multisatellite Precipitation Analysis (TMPA-3B42) products over India for different seasons. J. Hydrol. 2015, 529, 1302–1312. [Google Scholar] [CrossRef]
- Xu, R.; Tian, F.Q.; Yang, L.; Hu, H.C.; Lu, H.; Hou, A.Z. Ground validation of GPM IMERG and TRMM 3B42V7 rainfall products over southern Tibetan Plateau based on a high-density rain gauge network. J. Geophys. Res. Atmos. 2017, 122, 910–924. [Google Scholar] [CrossRef]
- Zhang, A.; Li, S.C.; Zhao, X.Y. Rainstorm risk assessment of Beijing-Tianjing-Hebei region based on TRMM data. J. Nat. Disasters 2017, 26, 160–168. [Google Scholar]
- Tan, M.; Duan, Z. Assessment of GPM and TRMM Precipitation Products over Singapore. Remote Sens. 2017, 9, 720. [Google Scholar] [CrossRef]
- Demaria, E.M.C.; Nijssen, B.; Valdés, J.B.; Rodriguez, D.A.; Su, F. Satellite precipitation in southeastern South America: How do sampling errors impact high flow simulations? Int. J. River Basin Manag. 2014, 12, 1–13. [Google Scholar] [CrossRef]
- Steiner, M.; Bell, T.L.; Zhang, Y.; Wood, E.F. Comparison of two methods for estimating the sampling-related uncertainty of satellite rainfall averages based on a large radar dataset. J. Clim. 2003, 16, 3759–3778. [Google Scholar] [CrossRef]
- Furuzawa, F.A.; Nakamura, K. Differences of Rainfall Estimates over Land by Tropical Rainfall Measuring Mission (TRMM) Precipitation Radar (PR) and TRMM Microwave Imager (TMI)-Dependence on Storm Height. J. Appl. Meteorol. 2005, 44, 367–383. [Google Scholar] [CrossRef]
- Huang, Y. Temporal changes in the patterns of extreme air temperature and precipitation in the various regions of China in recent 50 years. Acta Meteorol. Sin. 2011, 69, 125–136. [Google Scholar]
- Chen, Y.; Zhai, P.M. Persistent extreme precipitation events in China during 1951–2010. Clim. Res. 2013, 57, 143–155. [Google Scholar] [CrossRef]
- Gholami, V.; Chau, K.W.; Fadaee, F.; Torkaman, J.; Ghaffari, A. Modeling of groundwater level fluctuations using dendrochronology in alluvial aquifers. J. Hydrol. 2015, 529, 1060–1069. [Google Scholar] [CrossRef]
- Chen, X.Y.; Chau, K.W.; Busari, A.O. A comparative study of population-based optimization algorithms for downstream river flow forecasting by a hybrid neural network model. Eng. Appl. Artif. Intell. 2015, 46, 258–268. [Google Scholar] [CrossRef]
- Taormina, R.; Chau, K.W.; Sivakumar, B. Neural network river forecasting through baseflow separation and binary-coded swarm optimization. J. Hydrol. 2015, 529, 1788–1797. [Google Scholar] [CrossRef]
- Wang, W.C.; Chau, K.W.; Xu, D.M.; Qiu, L.; Liu, C.C. The Annual Maximum Flood Peak Discharge Forecasting Using Hermite Projection Pursuit Regression with SSO and LS Method. Water Resour. Manag. 2017, 31, 461–477. [Google Scholar] [CrossRef]
Figure 1.
The locations of the rain gauges in Shanghai.

Figure 2.
The overall detection capacity of 3B42V7 and CMORPH in different rainfall thresholds.
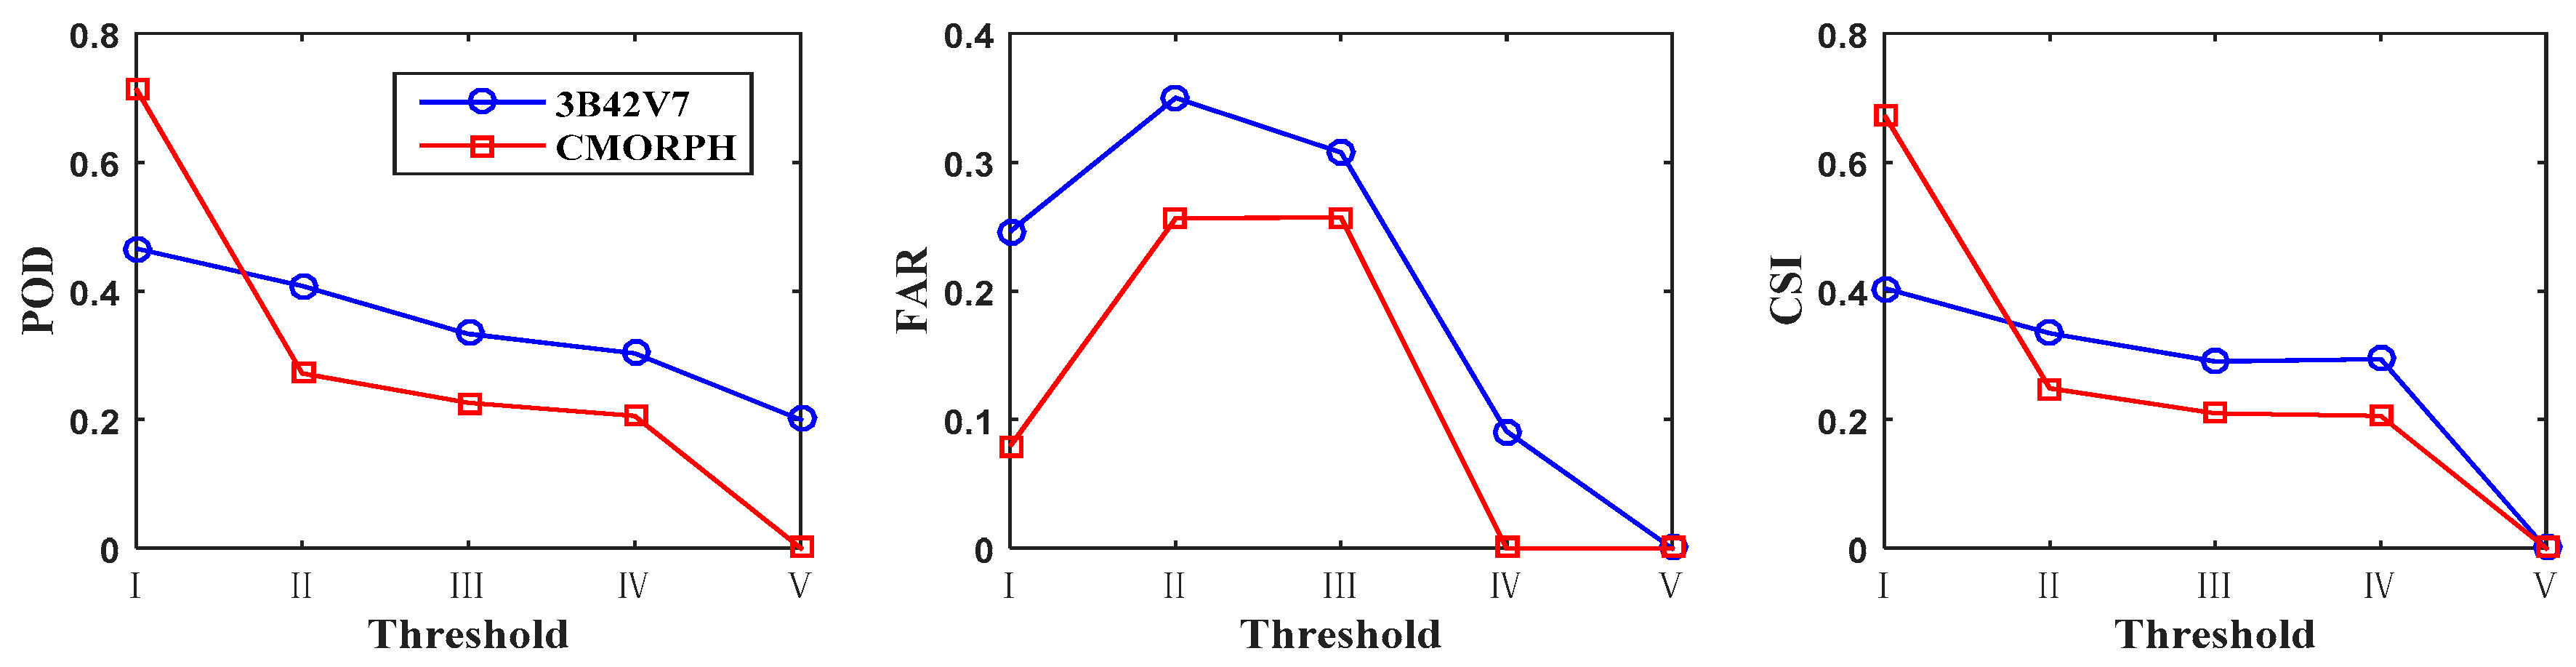
Figure 3.
The detection results of different rainfall thresholds ((a–h) indicate that the gauge ID in Table 1).
Figure 3.
The detection results of different rainfall thresholds ((a–h) indicate that the gauge ID in Table 1).

Figure 4.
The variations of MAEs from 3B42V7 and CMORPH at the daily scale from Sunday to Saturday ((a–h) indicate that the gauge ID in Table 1).
Figure 4.
The variations of MAEs from 3B42V7 and CMORPH at the daily scale from Sunday to Saturday ((a–h) indicate that the gauge ID in Table 1).
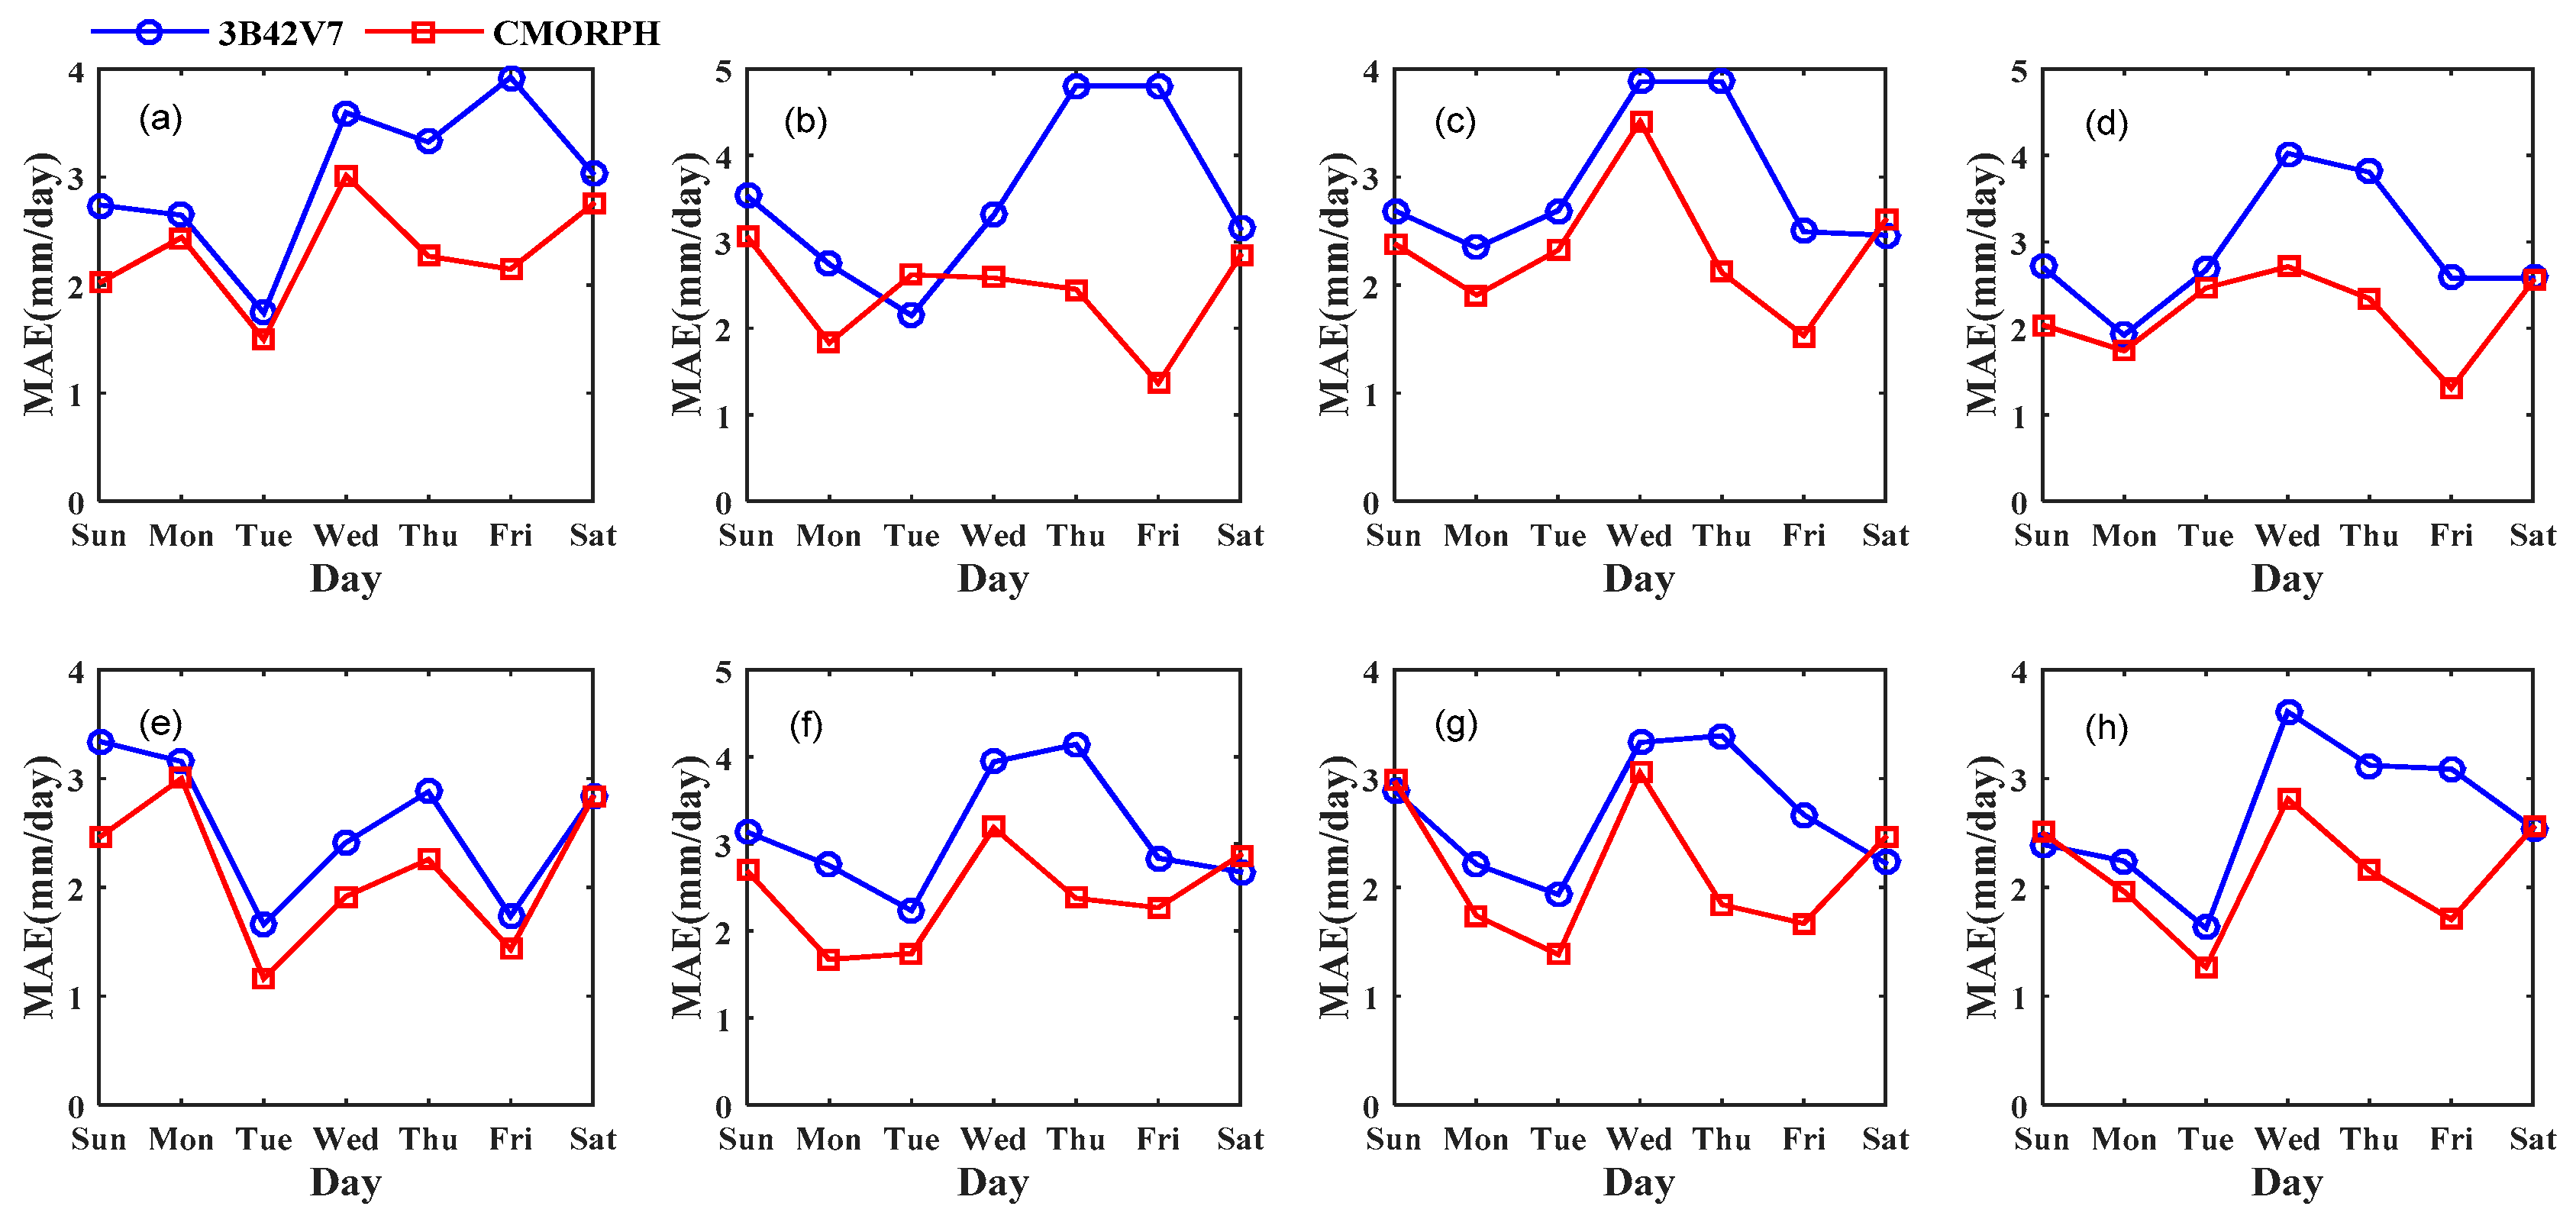
Figure 5.
The variations of MAEs from 3B42V7 and CMORPH at the monthly scale ((a–h) indicate that the gauge ID in Table 1).
Figure 5.
The variations of MAEs from 3B42V7 and CMORPH at the monthly scale ((a–h) indicate that the gauge ID in Table 1).

Figure 6.
The correlations of different indicators between 3B42V7 and CMORPH at the daily scale.
Figure 7.
Scatter plots of daily rainfall from rain gauge data and 3B42V7 (CMORPH) data in four seasons (Spring: 1 March to 31 May; Summer: 1 June to 31 August; Autumn: 1 September to 30 November; Winter: 1 December to 27 February in second year).
Figure 7.
Scatter plots of daily rainfall from rain gauge data and 3B42V7 (CMORPH) data in four seasons (Spring: 1 March to 31 May; Summer: 1 June to 31 August; Autumn: 1 September to 30 November; Winter: 1 December to 27 February in second year).

Figure 8.
Scatter plots of monthly rainfall from rain gauge data and 3B42V7 ((a–h) indicate that the gauge ID in Table 1).
Figure 8.
Scatter plots of monthly rainfall from rain gauge data and 3B42V7 ((a–h) indicate that the gauge ID in Table 1).
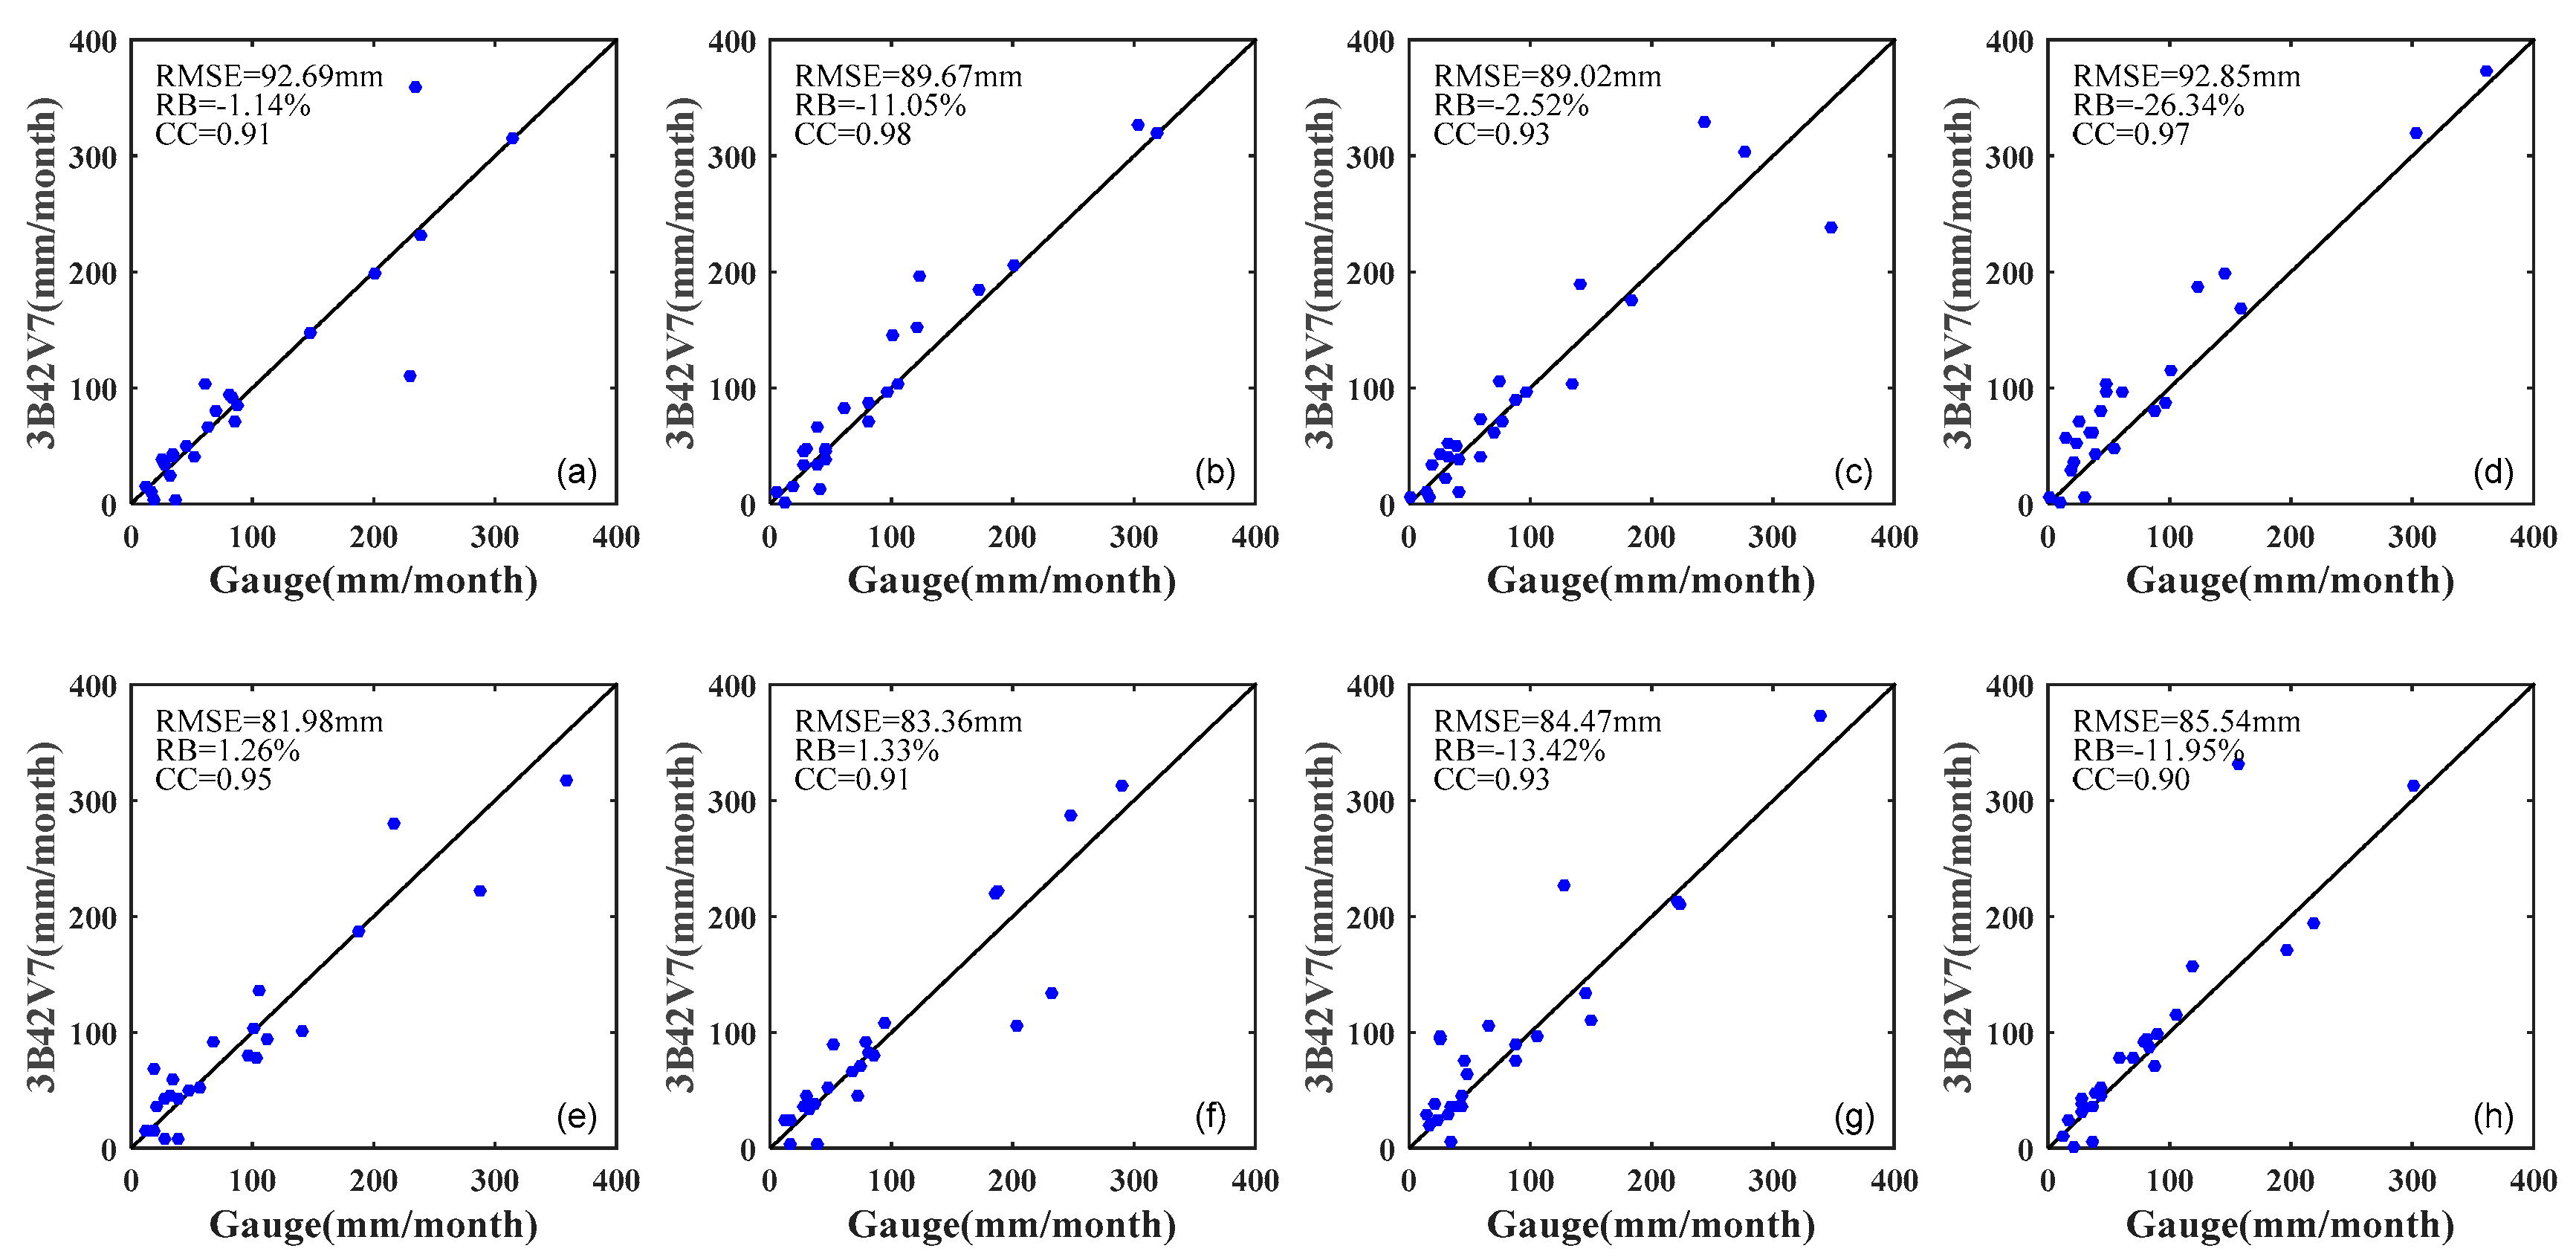
Figure 9.
Scatter plots of monthly rainfall from rain gauge data and the CMORPH data ((a–h) indicate that the gauge ID in Table 1).
Figure 9.
Scatter plots of monthly rainfall from rain gauge data and the CMORPH data ((a–h) indicate that the gauge ID in Table 1).
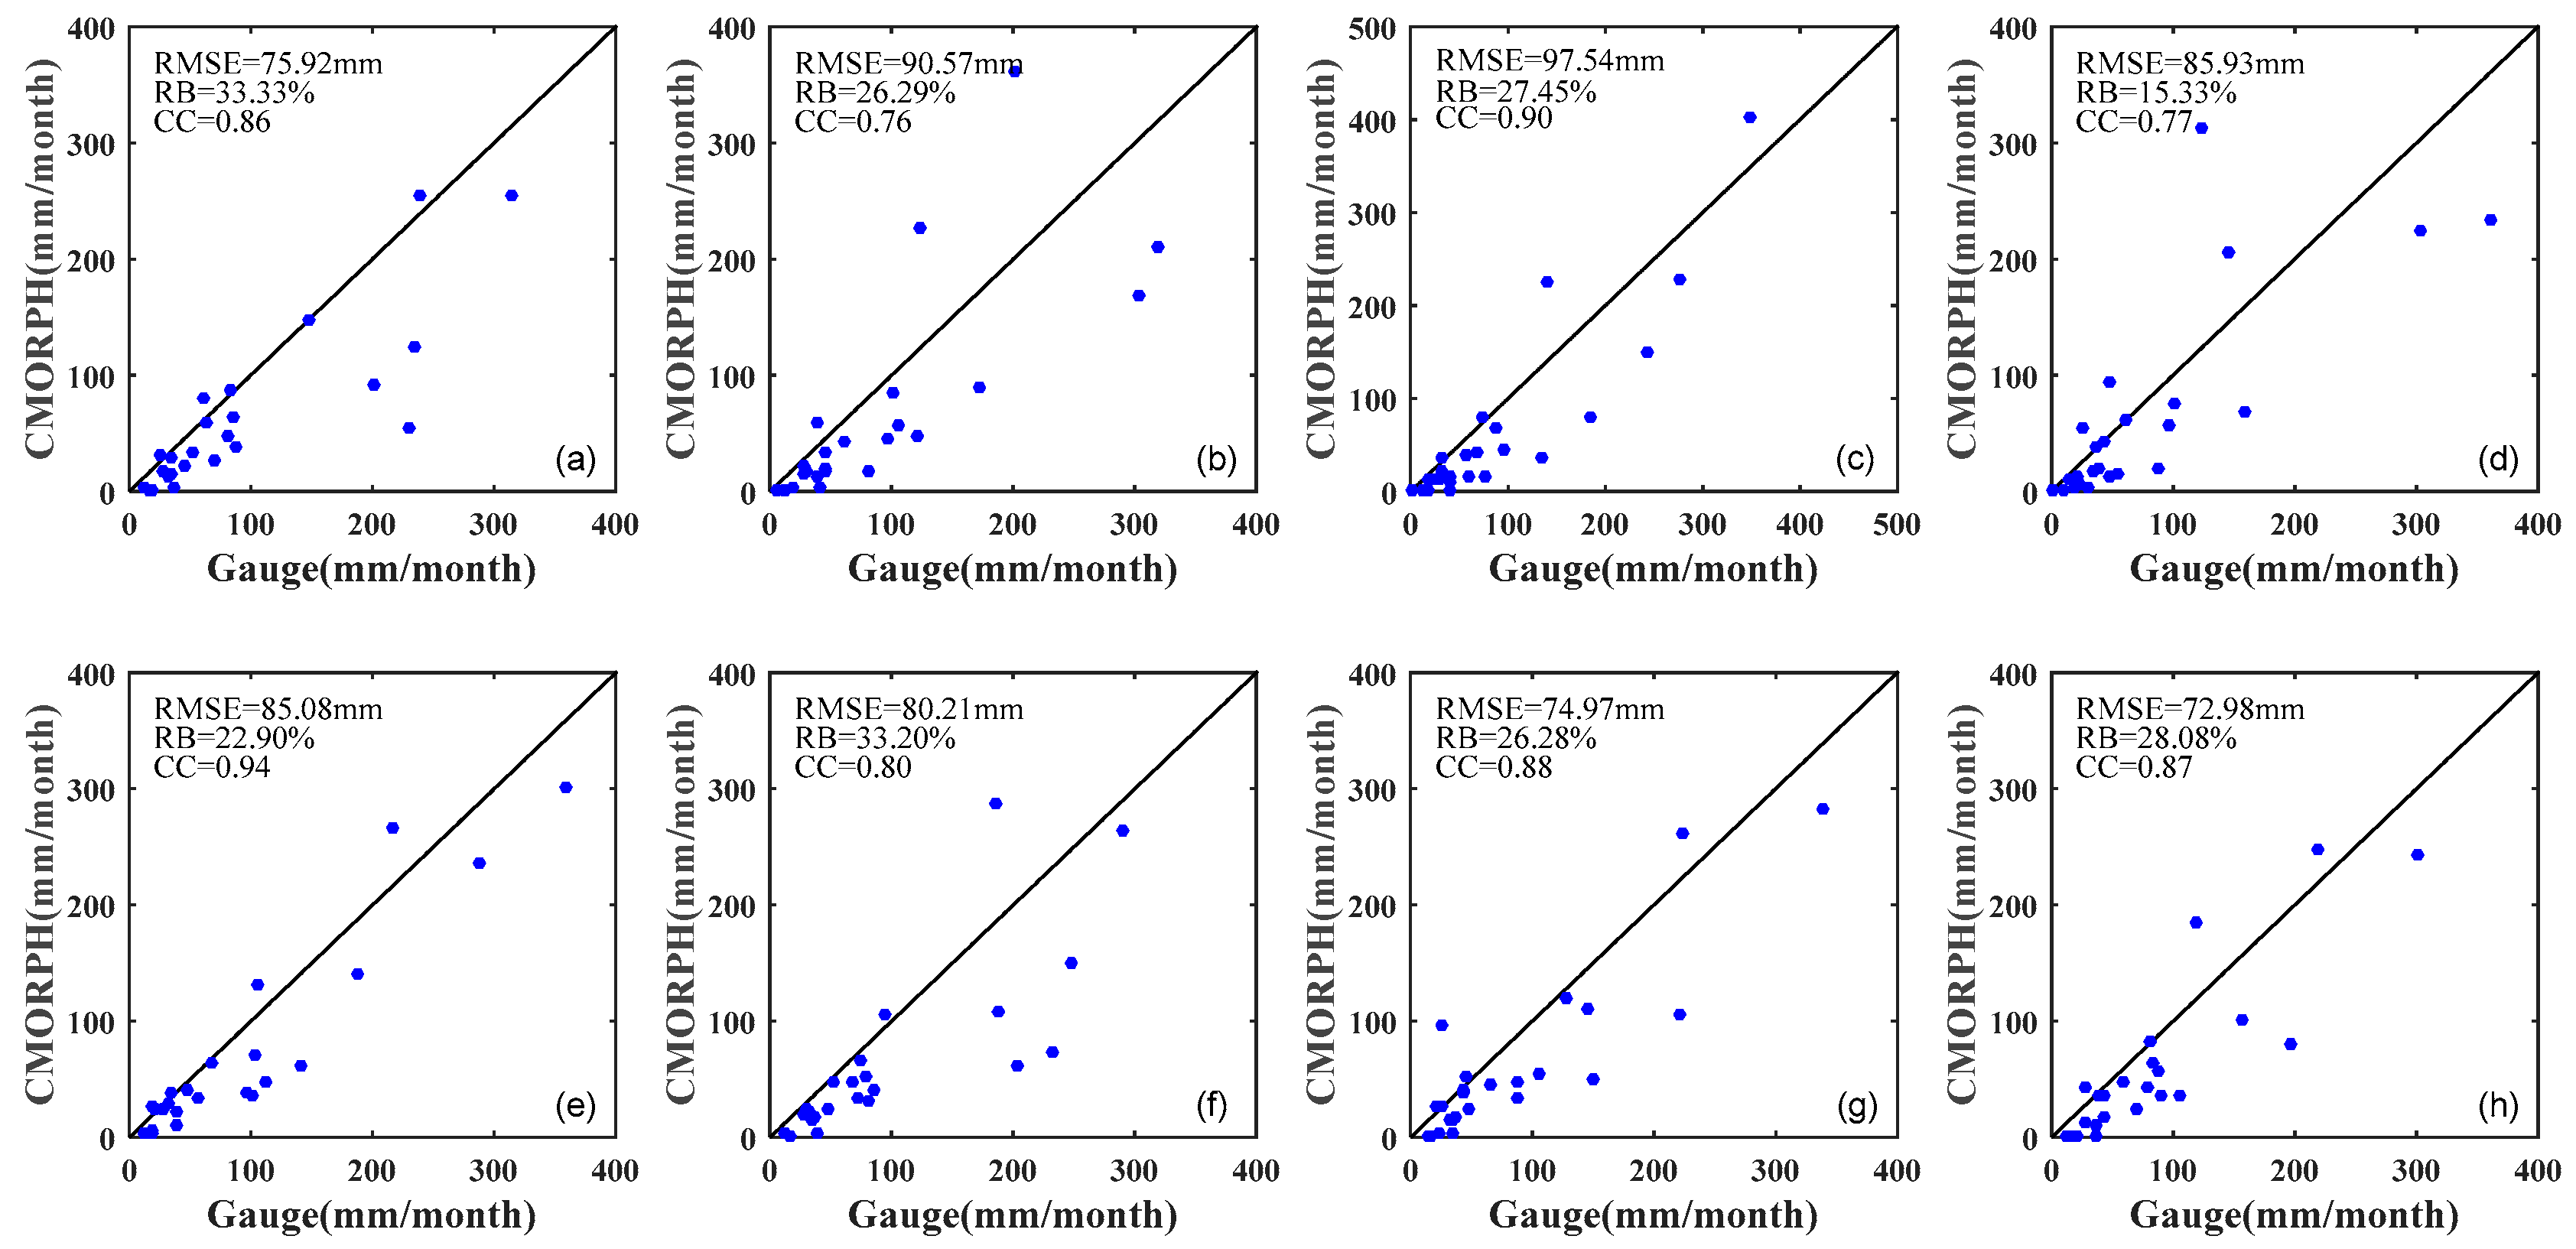
Figure 10.
The histogram of daily rainfall error distribution for 3B42V7.
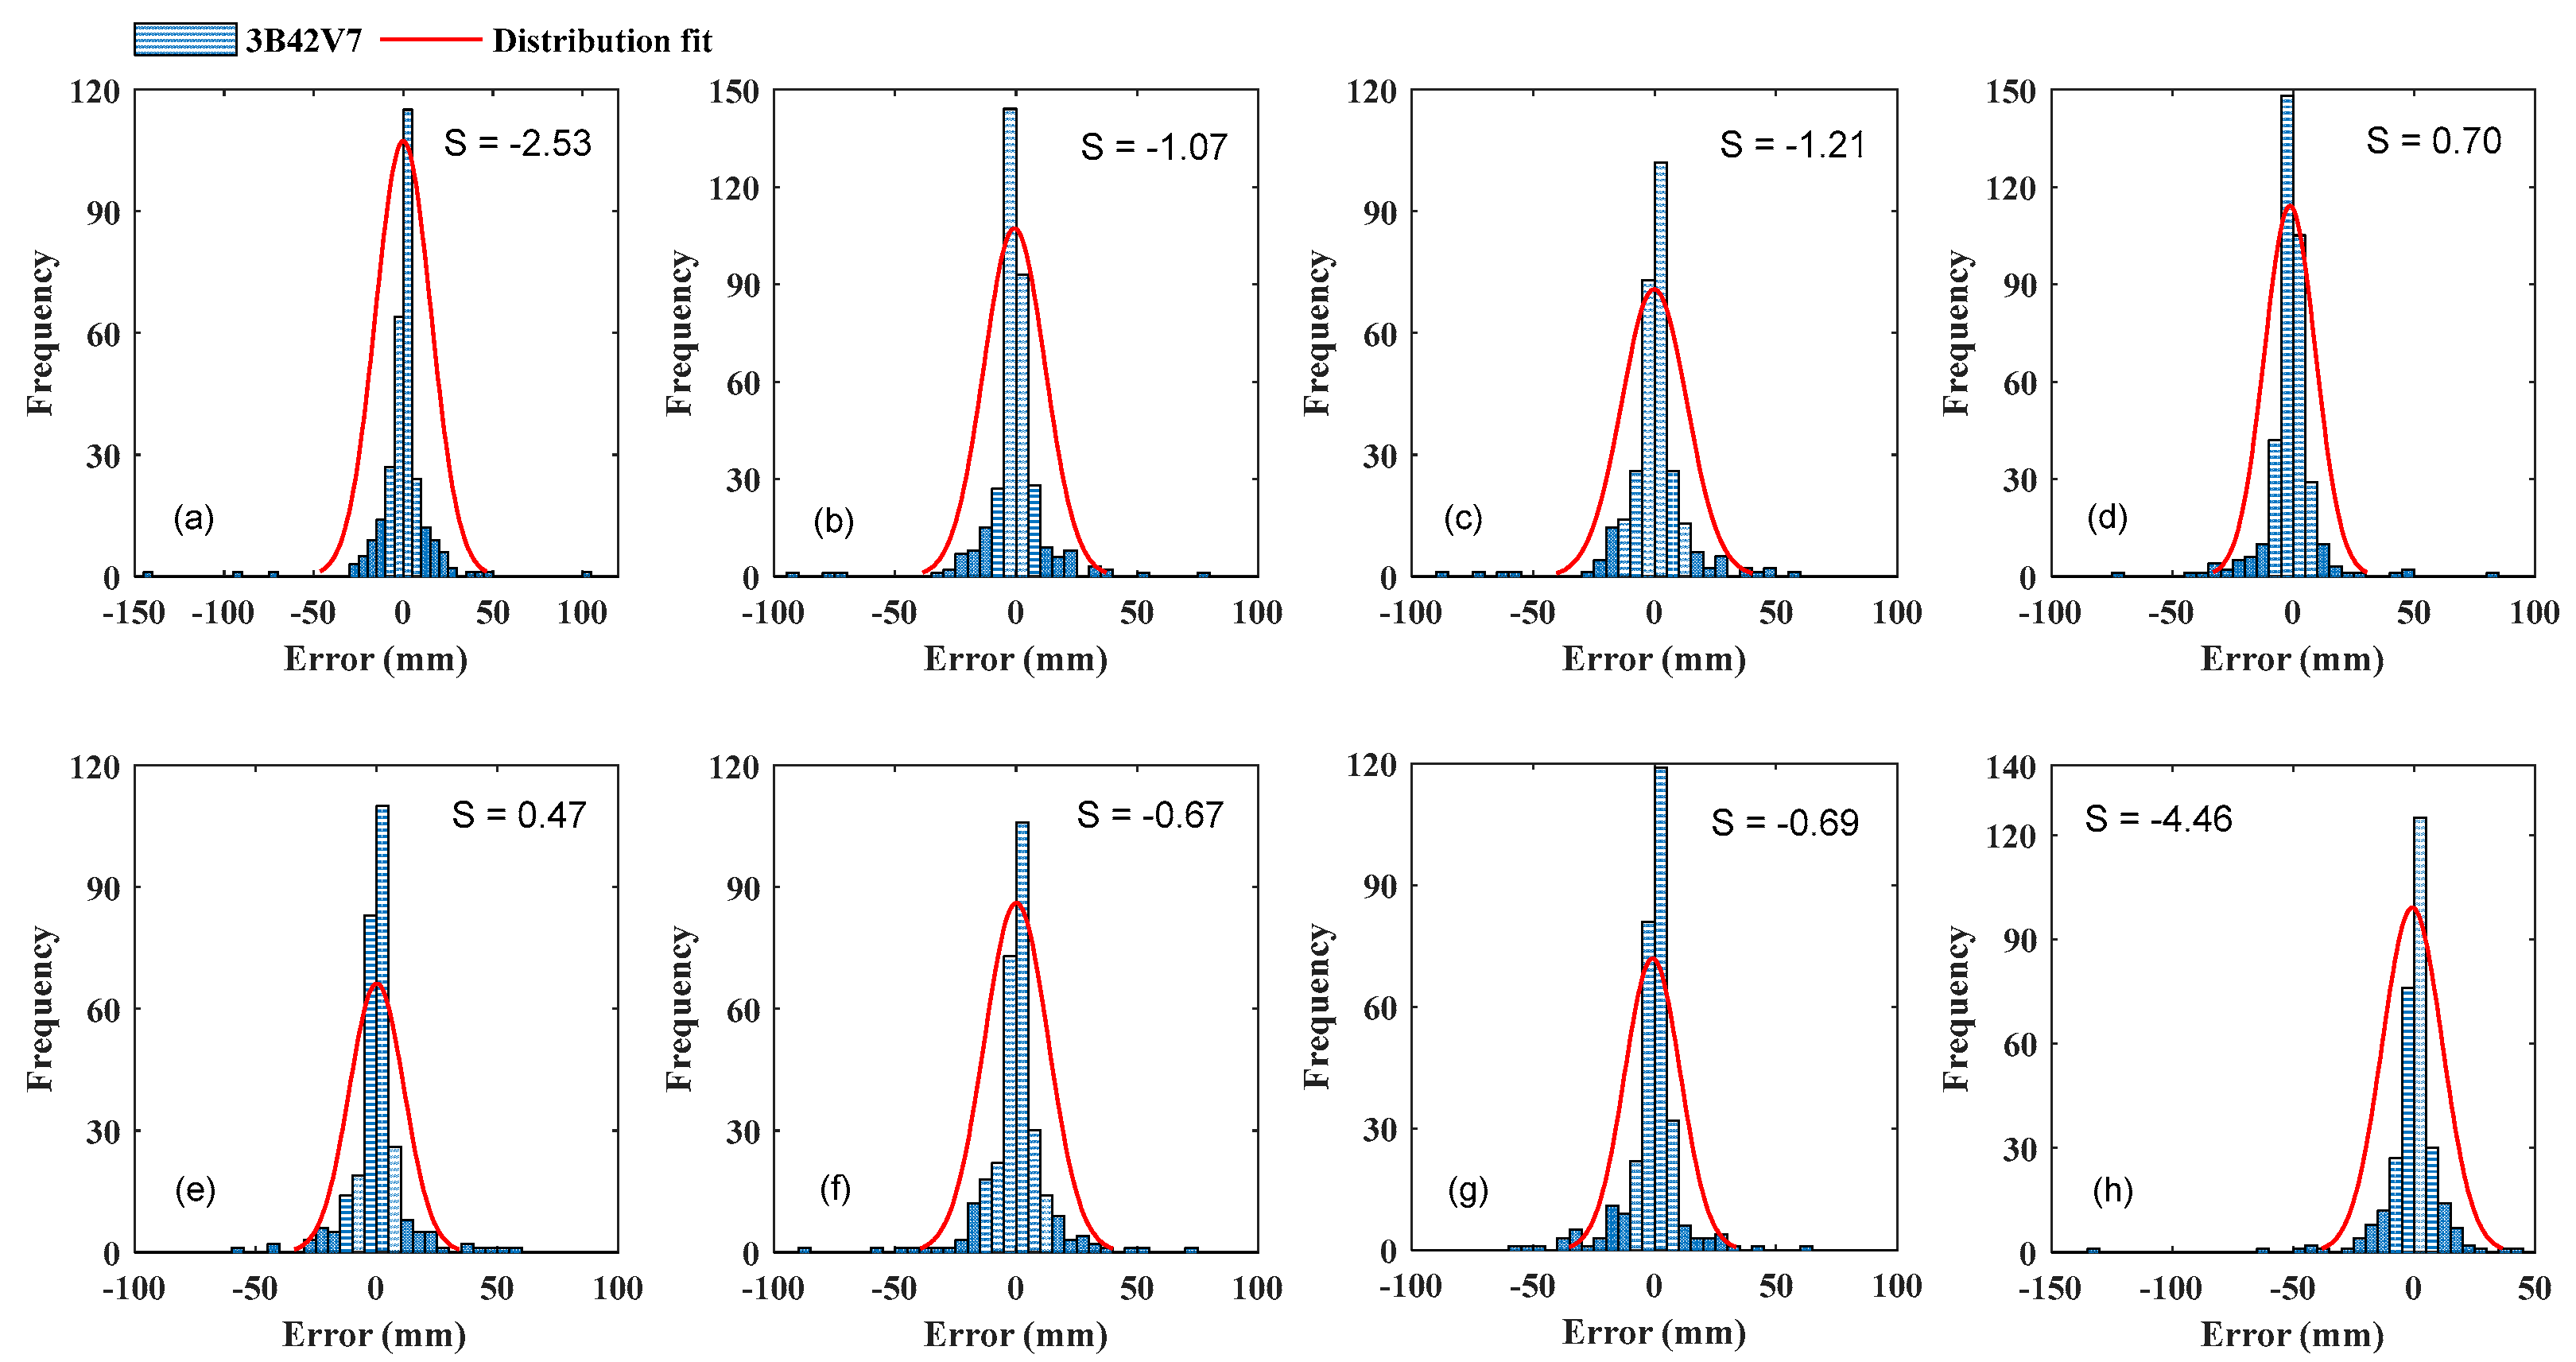
Figure 11.
The histogram of daily rainfall error distribution for CMORPH.

Table 1.
Detailed information of rain gauges and satellite-based rainfall products.
| ID | Gauge Number | Name | Row Number | Column Number | ||
|---|---|---|---|---|---|---|
| 3B42V7 | CMORPH | 3B42V7 | CMORPH | |||
| a | 58361 | Minhang | 76 | 116 | 1206 | 486 |
| 58367 | Xujiahui | |||||
| b | 58362 | Baoshan | 75 | 115 | 1206 | 486 |
| c | 58365 | Jiading | 75 | 115 | 1205 | 485 |
| d | 58366 | Chongming | 74 | 114 | 1206 | 486 |
| e | 58369 | Nanhui | 76 | 116 | 1208 | 488 |
| f | 58370 | Pudong | 76 | 116 | 1207 | 487 |
| g | 58460 | Jinshan | 77 | 117 | 1206 | 486 |
| 58463 | Fengxian | |||||
| h | 58461 | Qingpu | 76 | 116 | 1205 | 485 |
| 58462 | Songjiang | |||||
Table 2.
Categorical metrics of detection capability.
| Categorical Statistics | Calculation Formula | Optimal Value [0,1] |
|---|---|---|
| POD | 1 | |
| FAR | 0 | |
| CSI | 1 |
Table 3.
Evaluation indicators of error statistics.
| Statistical Indicators | Equation | Indicator Meaning | Unit |
|---|---|---|---|
| MAE | Mean absolute Error | mm | |
| RMSE | Data accuracy | mm | |
| RB | Degree of Deviation | % | |
| CC | Degree of Relevance | Unitless |
Notes: n is number of sample. Gi is rainfall from rain gauges (mm). Si is estimated rainfall from satellites (mm). and are mean values of gauge rainfall and satellite-based rainfall, respectively.
Table 4.
The detection results of extreme rainfall events of the rain gauge, the 3B42V7, and CMORPH from 2010 to 2011.
Table 4.
The detection results of extreme rainfall events of the rain gauge, the 3B42V7, and CMORPH from 2010 to 2011.
| Date | Rain Gauge | 3B42V7 | CMORPH | ||||
|---|---|---|---|---|---|---|---|
| Numbers | Total Extreme Rainfall (mm) | Grids | Total Extreme Rainfall (mm) | Grids | Total Extreme Rainfall (mm) | ||
| 2010 | 3 March | 1 | 59.00 | / | / | / | / |
| 29 June | 1 | 61.70 | 1 | 53.08 | / | / | |
| 4 July | 6 | 383.50 | 1 | 50.40 | 4 | 310.46 | |
| 5 July | 3 | 206.05 | 2 | 121.87 | / | / | |
| 12 July | 1 | 53.60 | / | / | / | / | |
| 17 August | 1 | 55.80 | / | / | 1 | 67.72 | |
| 18 August | 1 | 86.80 | 1 | 63.11 | 1 | 72.77 | |
| 26 August | 1 | 64.50 | / | / | / | / | |
| 27 August | 1 | 64.10 | / | / | / | / | |
| 30 August | 1 | 70.60 | / | / | / | / | |
| 1 September | 3 | 242.60 | / | / | / | / | |
| 13 September | 1 | 53.65 | / | / | / | / | |
| 23 October | 1 | 59.10 | / | / | / | / | |
| 2011 | 10 June | 1 | 69.90 | 1 | 87.60 | / | / |
| 17 June | 2 | 112.80 | / | / | / | / | |
| 18 June | 8 | 747.05 | 6 | 427.98 | 1 | 55.53 | |
| 14 July | 1 | 59.00 | / | / | / | / | |
| 12 August | 2 | 111.60 | 2 | 206.77 | 1 | 56.43 | |
| 13 August | 1 | 91.00 | / | / | / | / | |
| 17 August | 1 | 72.40 | / | / | / | / | |
| 25 August | 1 | 50.70 | / | / | / | / | |
| Total | 39 | 2775.45 | 14 | 1010.81 | 8 | 562.91 | |
© 2018 by the authors. Licensee MDPI, Basel, Switzerland. This article is an open access article distributed under the terms and conditions of the Creative Commons Attribution (CC BY) license (http://creativecommons.org/licenses/by/4.0/).
Share and Cite
MDPI and ACS Style
Jiang, Q.; Li, W.; Wen, J.; Qiu, C.; Sun, W.; Fang, Q.; Xu, M.; Tan, J. Accuracy Evaluation of Two High-Resolution Satellite-Based Rainfall Products: TRMM 3B42V7 and CMORPH in Shanghai. Water 2018, 10, 40. https://doi.org/10.3390/w10010040
AMA Style
Jiang Q, Li W, Wen J, Qiu C, Sun W, Fang Q, Xu M, Tan J. Accuracy Evaluation of Two High-Resolution Satellite-Based Rainfall Products: TRMM 3B42V7 and CMORPH in Shanghai. Water. 2018; 10(1):40. https://doi.org/10.3390/w10010040
Chicago/Turabian StyleJiang, Qin, Weiyue Li, Jiahong Wen, Can Qiu, Weiwei Sun, Qilin Fang, Ming Xu, and Jianguo Tan. 2018. "Accuracy Evaluation of Two High-Resolution Satellite-Based Rainfall Products: TRMM 3B42V7 and CMORPH in Shanghai" Water 10, no. 1: 40. https://doi.org/10.3390/w10010040
Note that from the first issue of 2016, this journal uses article numbers instead of page numbers. See further details here.