Article

Evaluation of Groundwater Quality in the Vicinity of Khurrianwala Industrial Zone, Pakistan

1
College of Environment, Hohai University, Nanjing 210098, China
2
Pakistan Council of Research in Water Resources, M/o Science and Technology, Islamabad 44000, Pakistan
3
School of Environment, Jiangsu University, Zhenjiang 212013, China
4
College of Earth Science and Engineering, Hohai University, Nanjing 211100, China
5
School of Agricultural Equipment Engineering, Jiangsu University, Zhenjiang 212013, China
*
Author to whom correspondence should be addressed.
Water 2018, 10(10), 1321; https://doi.org/10.3390/w10101321
Submission received: 31 May 2018 / Revised: 12 September 2018 / Accepted: 14 September 2018 / Published: 24 September 2018
(This article belongs to the Special Issue Groundwater Resources Assessment: Quantity and Quality)

Abstract

:
The industrial augmentation and unguided anthropogenic activities contaminate water sources in most parts of the world especially in developing countries like Pakistan. High concentration of pollutants in groundwater affects human, soil, and crop health badly. The present study was conducted to investigate groundwater quality for drinking and irrigation purposes in an industrial zone of Pakistan. A GIS tool was used to investigate the spatial distribution of different physico-chemical parameters. In this study, the average results exceeding World Health Organization (WHO) and National Environmental Quality Standards (NEQS) were found for pH 7.84, total dissolved solids (TDS) 1492 mg/L, phosphate 0.51 mg/L, dissolved oxygen (DO) 9.92% saturation, F-coli 6.48 colonies/100 mL, Na+ 366 mg/L, HCO3 771 mg/L, sulfate 251 mg/L, chlorides 427 mg/L, total hardness (as CaCO3) 292 mg/L, electrical conductivity (EC) 2408 μS/cm, iron (Fe) 0.48 mg/L, chrome (Cr) 0.50 mg/L, arsenic (As) 0.04 mg/L, total phosphorus (TP) 0.17 mg/L, sodium adsorption ratio (SAR) 9.76 (in meq/L), residual sodium carbonate (RSC) 9.28 meq/L, % ion balance 14.4 (in meq/L), percentage sodium ion (% Na+) concentration 58.9 meq/L, and water quality index (WQI) 69.0. The trend of cations and anions were (in meq/L) Na > Mg > Ca > K and HCO3 > Cl > CO3 > SO4 respectively. Although the results of the present study showed poor conditions of the groundwater for drinking as WQI but and irrigation purposes as SAR, it needs to improve some more conditions for the provision of safe drinking water and irrigation water quality.

1. Introduction

Water is an essential substance which plays a significant role in the daily life of living organisms. It also influences climatic changes and land shaping [1]. Groundwater is one of the primary water sources which is a key driver of the domestic, industrial, and agricultural sectors. Over the past few decades, water demand has been increasing continuously due to increasing water and energy balance by all these sectors and continuous increases in population, leading to water shortage and quality degradation. Thirteen percent of the world population do not have access to safe drinking water [2]. By the year 2030, half of the world’s population would suffer from a major water deficit [3]. On the other, augmented industrialization causes an increase in environmental degradation. The discharge of untreated toxic wastewater effluents from the industries deteriorates the groundwater quality, which affects human health, soil and crop yield. According to the World Health Organization, 80.0% of the population is facing health diseases due to the unavailability of safe drinking water [4].
Water scarcity and environmental degradation are major problems in developing countries like Pakistan. The industrial sector is the second largest economic sector which plays a vital role in economic GDP with 13.5% [5]. Various studies have been conducted on groundwater quality in different industrial areas of Pakistan. A study was conducted in Charsada, Pakistan, comprising cottage industries and agrochemical products; results found that high contamination in groundwater resources was due to the improper disposal of solid waste, sewage, and overuse of agro-chemical products [6]. The worst groundwater quality was reported in Faisalabad and its vicinity, where a high level of total dissolved solids, electrical conductivity, and total hardness exceed the WHO standards [7]. Another study was carried out to investigate groundwater, irrigation water and soil quality along the Dijkot wastewater drain containing the effluents emitted from the paper mill, sugar mill, and small textile units. Investigations showed the poor groundwater quality with high contamination exceeding the National Environmental Quality Standards (NEQS) and World Health Organization (WHO) standards [8]. A physico-chemical study of textile effluents and groundwater samples was conducted in the textile area near Faisalabad. The results showed that the effluents emitted from the textile industries have a significant impact on groundwater quality [9].
Textile is the major industry of this area. It consists of 200 different small- and large-scale textile units. Textile production and processes like spinning, sizing and de-sizing, scouring, bleaching, dyeing, printing, and finishing are involved in these units. Various toxic chemicals, commonly dyestuff, auxiliaries’ chemicals like that anti-forming agent, complex compounds, dispersing agents, stabilizers and many more are used in massive amounts in a different process and produce significant volumes of toxic wastewater. Such processes contain substantial amounts of sodium (Na+), chloride (Cl), total dissolved solids (TDS), sulfate (SO42−), sulfides (S2−), high biological oxygen demand (BOD), and chemical oxygen demand (COD), heavy metals, and various poisonous dyeing ingredients [10]. A high amount of pH, TDS, BOD, COD, sulfate, and chloride contents were found: 9.14 mg/L, 1869 mg/L, 835 mg/L, 1092 mg/L, 557 mg/L, and 432 mg/L, respectively, in various dying wastewater samples [11]. These effluents are directly disposed to Madhuana wastewater drain (passes through the center of the city and ends in River Ravi) without any treatment, resulting in the bad groundwater quality, soil salinity and reduced crop yield [8]. The length of this channel is 62.0 km, and the discharge rate in the river is 4.05 m3/s [12]. A comprehensive study on wastewater drains (including Madhuana drain) conducted in this area showed high amounts of BOD, COD, and heavy metals coming from textile industries and polluting groundwater resources [13].
Under such conditions, the unlined Madhuana drain contains untreated industrial effluents, which are passing through the agricultural and residential area, polluting the groundwater resources. In this concern, the present study was conducted to investigate the present groundwater quality which is becoming deprived with the passage of time. Various hydro-chemical analysis was done to investigate the groundwater quality. Arc GIS tool was used to draw the spatial distribution and to check the geoinfluence of groundwater quality from one point to another point in the Khurrianwala industrial zone, Pakistan.

2. Materials and Methods

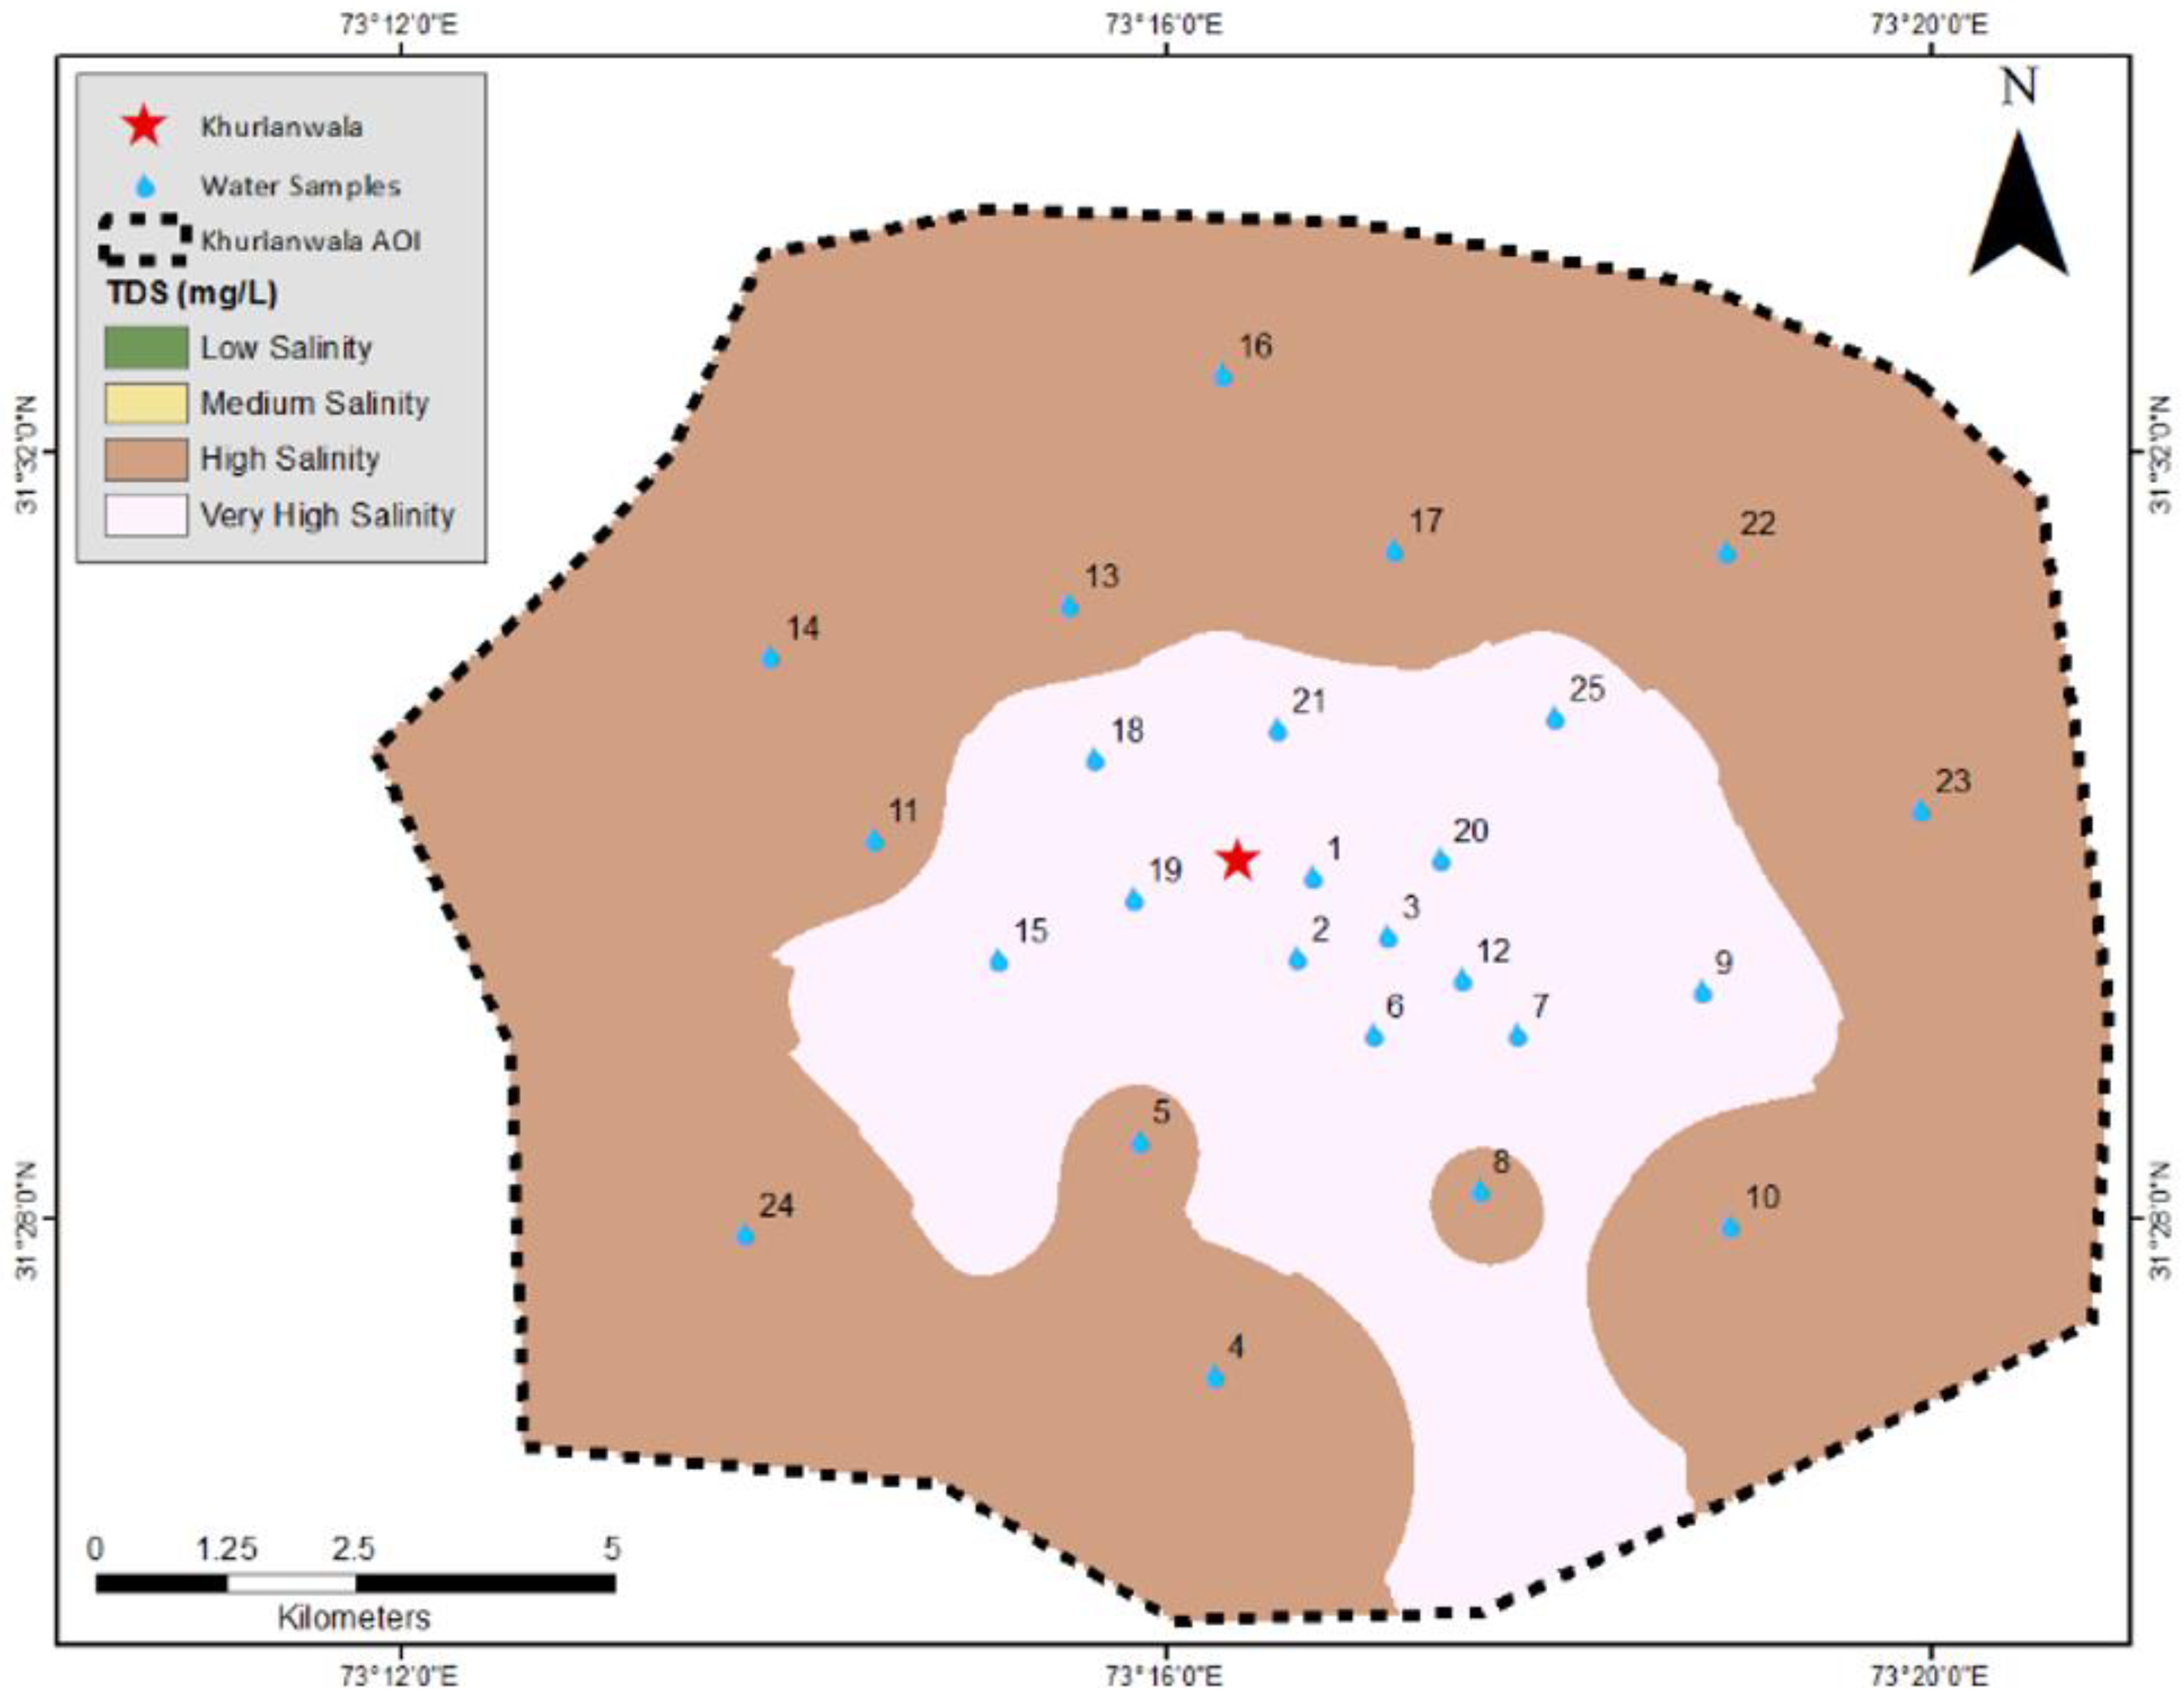
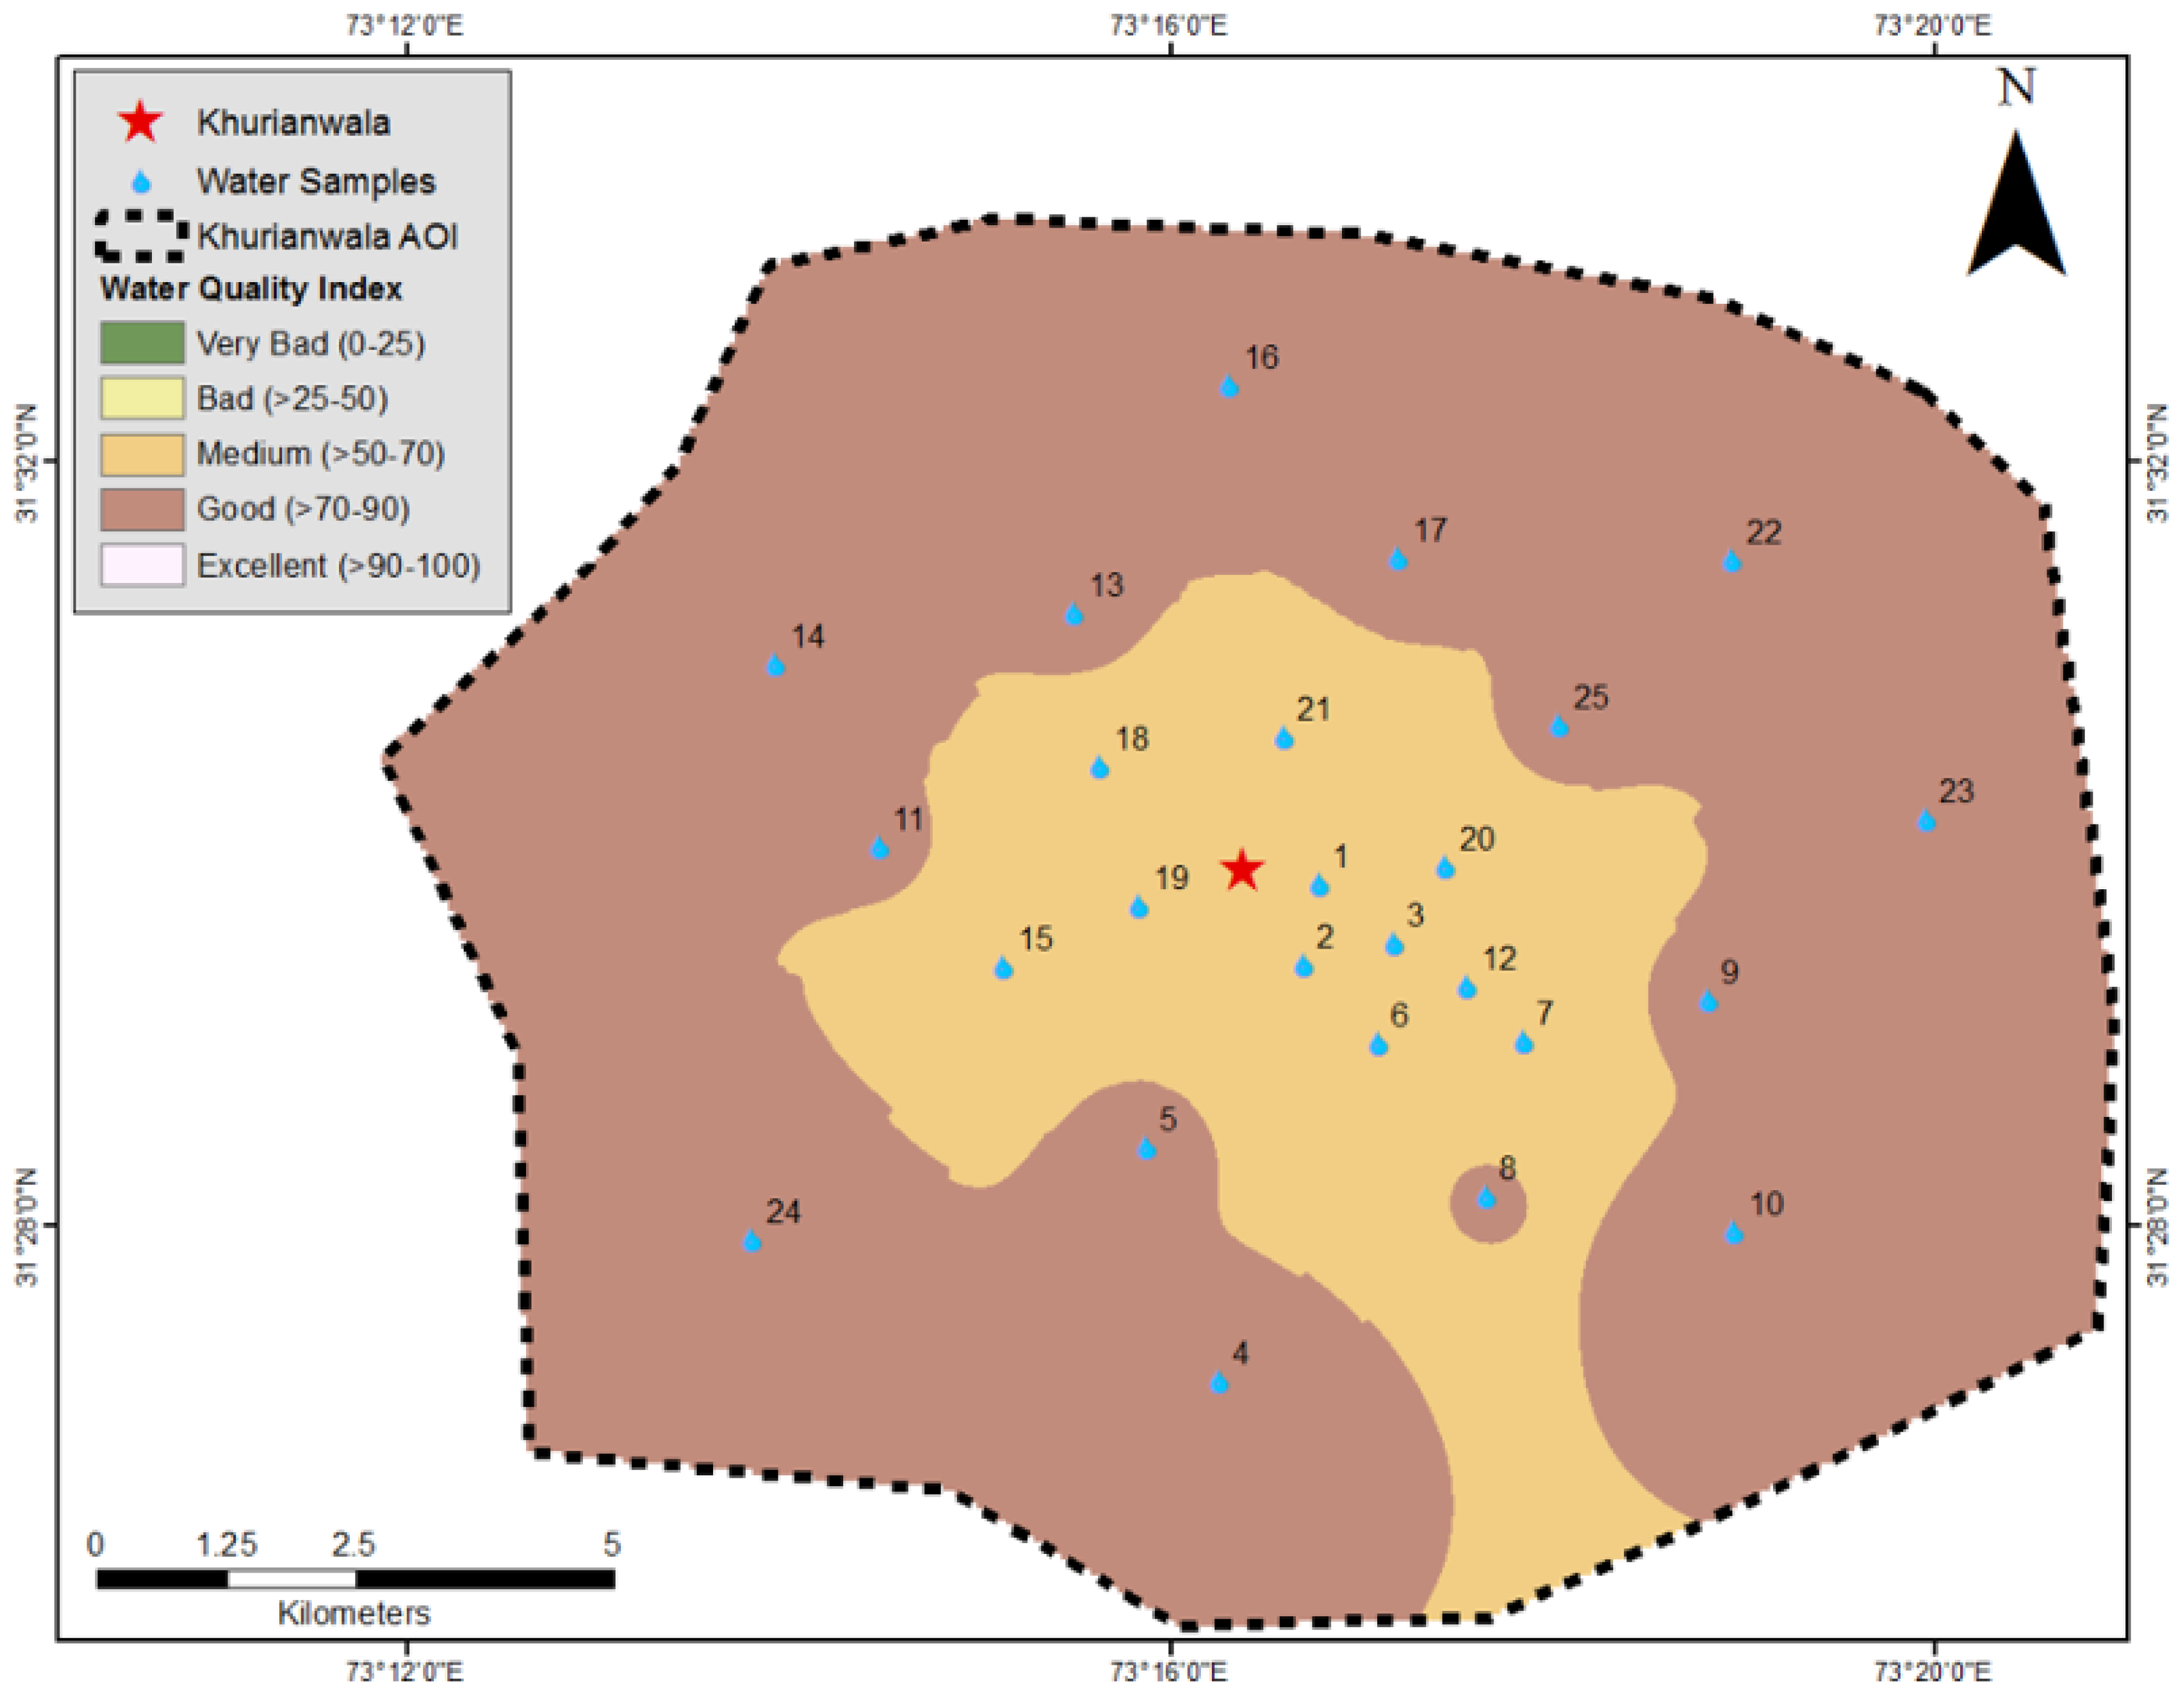
2.1. Description of Study Area

The present study was conducted from April to August 2016, (Figure 1) in the region of Khurrianwala (31.5006° N, 73.2667° E). It is situated in the center of the lower Rachna doab (in between the Chenab and Ravi rivers) with a slight slope 0.20 m/km to 0.30 m/km from northeast (NE) to southwest (SW). The elevation of the study area is 178 m from mean sea level. The topography of the area is marked by valleys, local depressions, and relatively high grounds. The semi-arid climate was found to have high seasonal temperature variations. Summer season spans from April to September, with a temperature ranging from (12.0 °C to 50.0 °C) with an average temperature of 31.2 °C. The winter season spans from October to March, with a temperature ranging from −2.00 °C to 17.7 °C, with an average temperature of 4.48 °C. Rainfall occurs in monsoon season (July and August). The average annual rainfall is 335 mm recorded based on 32 years’ observation. The study area contains alluvial plain deposited on semi-consolidated tertiary rocks, or on a basement of metamorphic and igneous rocks of the Precambrian age and the unconsolidated sediments have a depth of 274 m [14]. It contains confined aquifer with the water table depth of 22.0 m, whereas the specific yield of such aquifers are between 0.50 and 5.00, having shale-type formation [14]. Motor pumps and hand pumps are drilled at a depth of 28.0–30.0 m for the groundwater discharge, whereas the tubewell (dug well) used for crops irrigation is at a depth of 35.0–38.0 m. These wells are productive wells and their recharge mostly takes place from ponds, seepage of water courses, unlined canals, irrigation practices and sewerage system, water supply system. Direct rainfall recharge is small in amount. The area was found to have a clay loam-type soil infiltration rate of 4.17 mm/4 h, whereas the bulk density of soil is 1.52 g/cm3 and porosity (n) is 1.23. Major crops of this area are cotton, wheat, rice, sugarcane, and maize [15].

2.2. Sampling

Twenty-five different groundwater samples were collected from different locations of the study area. Fifteen samples of groundwater, including hand pump and motor pump source, were collected randomly from residential area, industrial sector, and food points, whereas, the remaining ten samples of tubewell source were collected from the crop fields. For the collection of groundwater samples, the American Public Health Association (APHA) [16] standard protocol was adopted: run the tap for five minutes and then collect the groundwater sample from tubewell, motor pumps, and hand pumps. During the collection of samples, water temperature was recorded by a standard thermometer after running the tap, which was found to be in the range of 21.0–25.0 °C on sampling time. The samples were stored in airtight bottles and stored at 4.00 °C temperature [17].

2.3. Experimental Methodology

Samples were investigated for quality inspection of physico-chemical parameters. These parameters have significant influence in the groundwater quality. pH, TDS, dissolved oxygen (DO), and electrical conductivity (EC) calculated by water quality checker (model no. TOA-WQA-20A). Turbidity, phosphate, nitrate, sulfate, fluoride, and total phosphorus (TP) calculated by using UV/VIS spectrophotometer. Flame photometer used for analyzing sodium and potassium. Ca, Mg, HCO3, CO3, TH and chloride content were calculated by using the titration process (EDTA trimetric). Sodium adsorption ratio (SAR), residual sodium carbonate (RSC), % ion balance, % Na ion and water quality index (WQI) were calculated by using the equations listed below. Heavy metals (Fe, Cr, As, and Zn) were determined by using atomic absorption spectrometer. The protocol for all parameters followed the same as prescribed in the American Public Health Association (APHA) manual [16]. A general survey was conducted and a questionnaire about the groundwater and irrigation water quality was carried out among the people. Furthermore, information about health diseases was also gathered from the residential area and rural health center (RHC) Khurrianwala.
Water quality index is a parameter which collects the physical, chemical, and biological data and summarized the results into one score ranging from 0 to 100. In this study, the U.S. National Sanitation Foundation Water Quality Index (NSFWQI) was adopted [18,19]. WQI is categorized into five different levels, i.e., excellent (100–91), good (90–71), fair (70–51), poor (50–26), and very poor (25–0). Water quality index (WQI) can be expressed in mathematical form by using (Equation (5)).
WQI = i = 1 n Q i   W i
where:
  • WQI = water quality index;
  • Qi = subindex for the ith water quality parameter;
  • Wi = weight associated with the ith water quality parameter;
    n = number of water quality parameter.
Sulfate ion concentration was calculated by using UV/VIS spectrometer, whereas the atomic adsorption spectrometer was used for heavy metals (Fe, Cr, As, and Zn). Values of SAR, RSC, and % error ion balance were calculated (meq/L) by using the formulas described below. The SAR and RSC are the irrigation water quality parameters and their standards are categorized into three different levels shown in Table 1 according to the food and agricultural organization (FAO) papers [20]. Percentage error in ion balance should not be more than 10% for irrigation water purposes [21].
The % error in ion balance, % sodium ion SAR and RSC were calculated by using the following equations,
%   Sodium   ion = Na Na + Ca + Mg + K × 100
%   error   ( Ion   Balance ) = ( cations ) ( anions ) ( cations ) + ( anions ) × 100
SAR = Na Ca + Mg 2
RSC = ( HCO 3 + CO 3 ) ( Ca + Mg )

2.4. GIS and Spatial Analysis

Geographic information system (GIS) is a key tool which is used for analyzing the spatial variability of groundwater samples in the study area. For this purpose, Arc GIS 10 software (ESRI, Redlands, CA, USA) was used. A global positioning system (GPS) was used to locate the sampling point of the study area. These points are drawn on GIS by using world geodetic system (WGS-84). The topographical covering sheet of the study area was scanned and georeferenced by using Universal Travers Mercator (UTM) projection system. Inverse distance weight (IDW) was used to interpolate the sampling points [22].

2.5. Statistical Analysis

Partial correlation analysis was performed using SPSS software (SPSS Inc., Chicago, IL, USA). The results of correlation expressed with a number between 0.00 and 1.00.

3. Results and Discussion

3.1. Drinking Water Quality Analysis

The pH varies from 7.10 to 8.40 (Table 2) with an average value of 7.84 ± 0.31. The distribution of water samples with regards to the obtained pH values are shown in (Figure 2). The normal range of pH for drinking water is 6.50 to 8.00, whereas the value less than 6.50 is corrosive and value 8.00 and above showed the carbonated water [23,24]. Ninety-two percent of samples have a pH value above 7.50, whereas 36.0% of samples exceed the permissible limits of WHO and NEQS. A pH value less than 6.50 causes corrosiveness in the material when water flows through it, whereas value 8.00 and above is carbonated groundwater [23]. However, higher pH of drinking water has no direct effect on the human body, but it alters the various other water quality parameters which have an indirect impact on human health as well as on the environment [25]. Moreover, the correlation between pH and water quality was obtained 0.99.
Turbidity ranged from 0.50 to 4.10 with an average value of 2.19 NTU, which is under the permissible limits of WHO and NEQS standards [26].
The amount of TDS in studied groundwater samples was significantly high. The values varied from 987 to 2114 mg/L (Table 2). The distribution of measured TDS values in the study area is shown in Figure 3. These values exceed the permissible limits of WHO and NEQS guidelines [23]. Only a few groundwater samples were found in an allowable NEQS range (1000 mg/L) [27]. Moreover, TDS level is also a parameter pointing to salinity level of the water, e.g., TDS < 200 is low salinity; TDS 200–500 average salinity; TDS 500–1500 high salinity and TDS > 1500 very high salinity [28]. The measured values of total dissolved solids indicate a reduced quality of groundwater and pose a significant health concern.
Nitrate (NO3) and phosphate (PO43−) concentration were found in samples ranging from 21.0 to 69.0 mg/L and 0.17 to 1.02 mg/L, respectively (Table 2). Five samples were found to be exceeding the WHO and NEQS limits (50.0 mg/L) [23] for nitrates, whereas the phosphate has no permissible limit. Phosphate and nitrates play their vital role in water pollution [29]. Higher nitrate concentration leads to the blood disorder called “Methemoglobinemia” which is generally named as “Blue baby syndrome” [30,31], whereas the low concentration may cause inadequate working of muscles, tissues, and bones [32].
The dissolved oxygen (DO) value was ranging from 7.00 to 13.0 mg/L (Table 2) with an average value of 9.92 ± 1.62. Dissolved oxygen is a parameter to be used extensively to calculate the saturation of oxygen in the water. The higher the concentration up to 13.0–14.0 mg/L of (DO), the better the water quality of the samples.
Water quality index (WQI) was found ranging from 63.4 to 76.0 (Table 3) with an average value of 69.9. The distribution of WQI samples regarding obtained values is shown in Figure 4. Water quality index showed medium conditions (50–70%) for 50% of the samples which are closer to the industrial locality. Remaining samples fall in good condition (70–90%) but in lower ranges of water quality index, which is 70–75%. Such results showed that polluted groundwater quality is becoming poorer with the passage of time due to the direct discharge of untreated effluents. Under such conditions, the groundwater can be used for drinking purposes after treatment processes in the industrial vicinity. Sand media filtration and chlorination process might be adopted at domestic scale, whereas reverse osmosis can be used at commercial scale plants. Moreover, the partial correlation of WQI with temperature, pH, DO, TDS, BOD, nitrates, F-coli, phosphate and turbidity were found to be 0.99, 0.99, 0.99, 0.96, 0.94, 0.93, 0.88, 0.86, and 0.85, respectively. Such correlation results showed the direct relationship between WQI and parameters [18]. These parameters contain a particular unit weight value which is used to calculate (WQI) and play a significant role in the groundwater quality [33].

3.2. Bacterial Activity

Groundwater samples are subjected to analyze the F-coli for detection of bacterial activity. The groundwater samples result for F-coli were ranging from 2.00 to 12.0 colonies/100 mL (Table 2) with an average value of 6.48 ± 2.00, which is dangerous to the health problems of human beings. The presence of F-coli in water samples is an indicator of bacterial activity and pathogens in the groundwater [34]. F-coli has direct effects on pH balance and oxygen level in water resources. It also produces the bad odor in water. According to the NEQS and WHO guidelines (0.00 colonies/100 mL), no sample was found in a permissible range. Such conditions lead to serious health issues, likewise gastrointestinal, flue, and hepatitis. It may also effect the eyesight of the human body. Chlorination and usage of boiled water can reduce the bacterial activity. Moreover, biofilters are being used for the removal of bacterial activity [35].

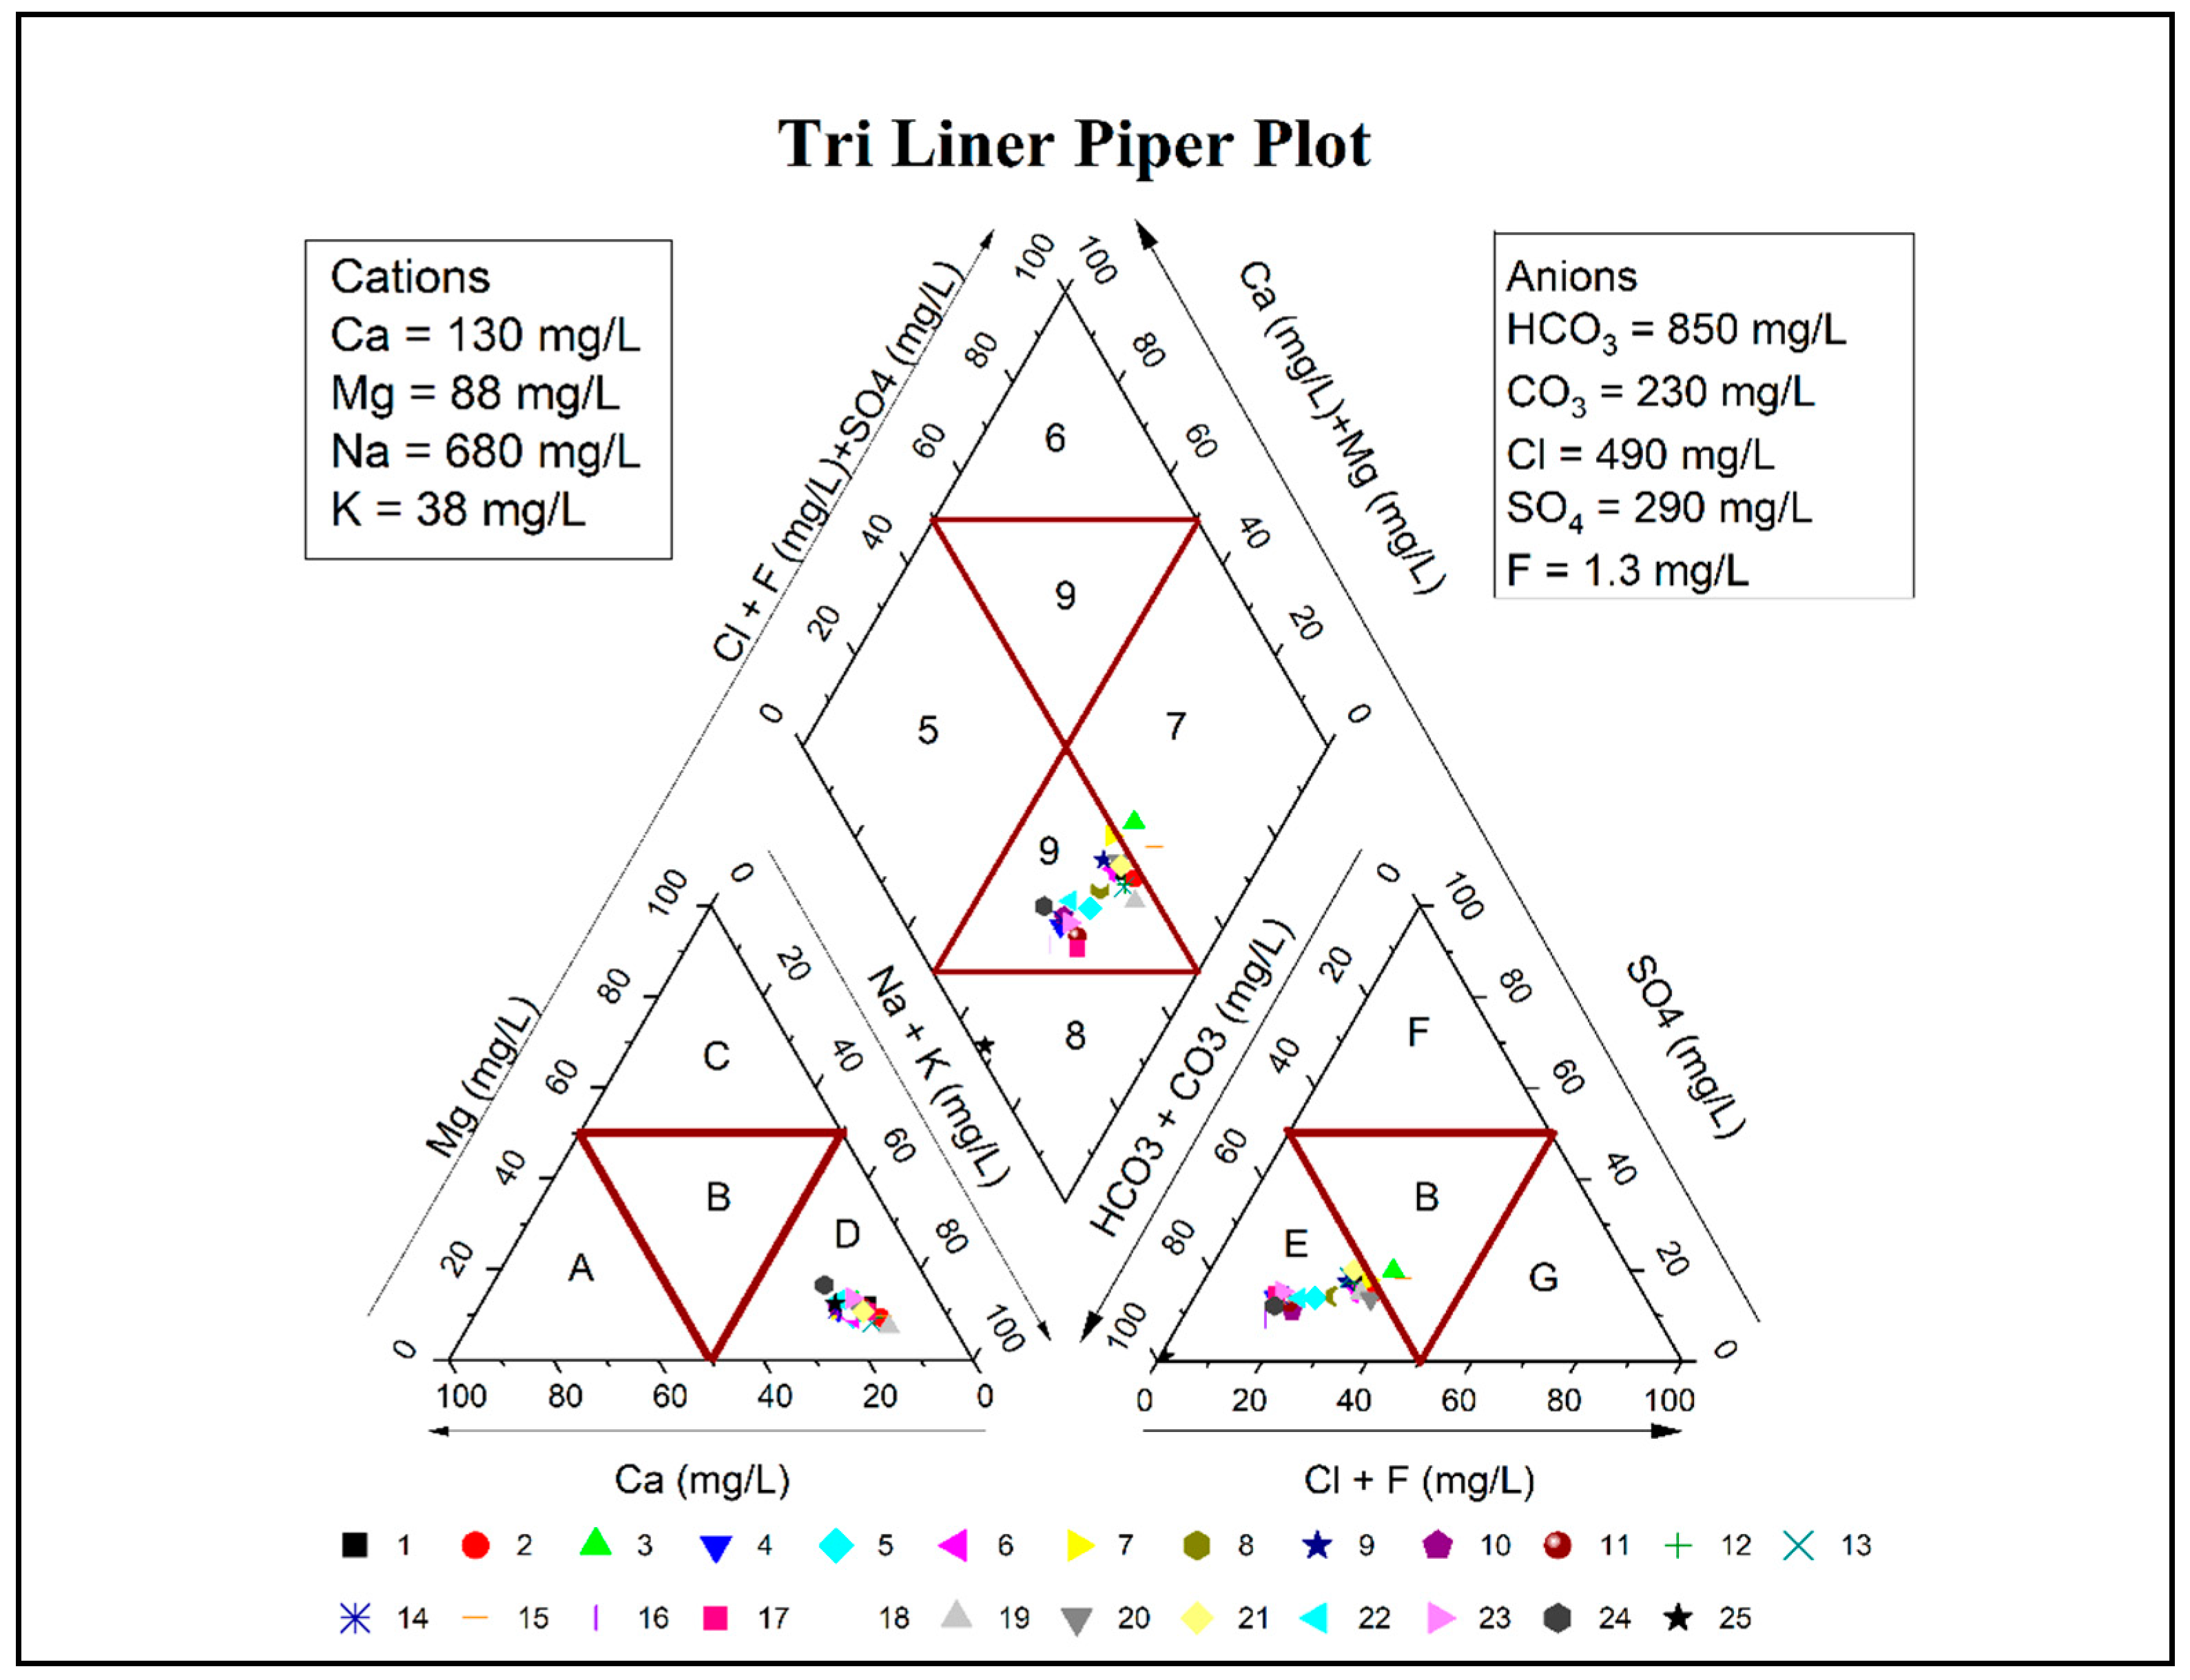
3.3. Cations and Anions

Cations and anions were calculated in groundwater samples. The cations sodium (Na), calcium (Ca), magnesium (Mg), and potassium (K) were ranging from 121 to 681 mg/L, 69.0 to 154 mg/L, 42.0 to 98.0 mg/L, and 32.0 to 118 mg/L, respectively, whereas the anions bicarbonates (HCO3), carbonates (CO3), sulfate (SO4), chlorides (Cl), and fluorides (F) were found in the range of 597 to 982 mg/L, 102 to 311 mg/L, 120 to 354 mg/L, 190 to 732 mg/L, and 0.30 to 1.60 mg/L, respectively. Sodium sulfate, monosodium, and disodium phosphate extensively used in different dyeing and bleaching processes in the textile industry, and ions in the form of effluents are washed out. The higher value of (Na) and (Ca) may be due to the saturation of sewage wastewater or surface water effluents to the groundwater resources in the form of dissolved salts [36]. Sodium (Na) and chloride (Cl) have a vital role in the human body. They affect the physiological and metabolism process. Higher concentration of both ions may cause high blood pressure [37]. Potassium (K) is an impotent mineral for living organisms. It is necessary for plants, humans and animals as well. The amount of (K) in the human body is 110 to 140 g [38]. Potassium deficiency in the human body may affect the heartbeat disorder and muscles weakness, whereas a high amount may affect homeostatic mechanism [32]. Excessive fluoride (F) contents leads to dental problems. The bicarbonate and carbonate produce the acidity in the human body; however, they have no permissible limit according to the WHO and NEQS guidelines, but the amount should not be more than 500 mg/L [32].
The cations and anions were present in the water and correlation among them are shown in Table 4. According to the correlation results, the cations and anions may be found in the form of Mg-Ca(HCO3), MgSO4, NaCl, and CaSO4, which leads to hard and saline water. Correlation results showed the strong bonding between cations and anions. The strong interaction found between magnesium (Mg) and bicarbonate (HCO3) is 98.9% whereas, the weak bonding was found between potassium (K) and chloride (Cl), 73.38%.
Water hardness regarding total hardness (TH) was found in the range of 150 to 438 mg/L as CaCO3 (Table 3) with an average value of 292 mg/L. The water sample distribution regarding the obtained values of (TH) is shown in Figure 5. Distribution of the GIS mapping is according to the soft water (0–75), medium–hard water (75–150), hard water (150–300) and very hard water (>300). According to [23], the total hardness exceeds the limits from the 200 mg/L; it produces scaling. The water hardness is commonly due to the presence of cations and anions. Most effective cations are calcium and magnesium, whereas anions are carbonate, bicarbonate, sulfate, and chlorides. Water hardness is evident of their role in heart disease [39]. The excessive use of hard water in industrial machinery produced hard scaling and corrosion, ultimately resulting in the system being choked. Furthermore, in domestic usage, it affects the quality of washing products, i.e., soap and detergent have bad washing quality [24,40].

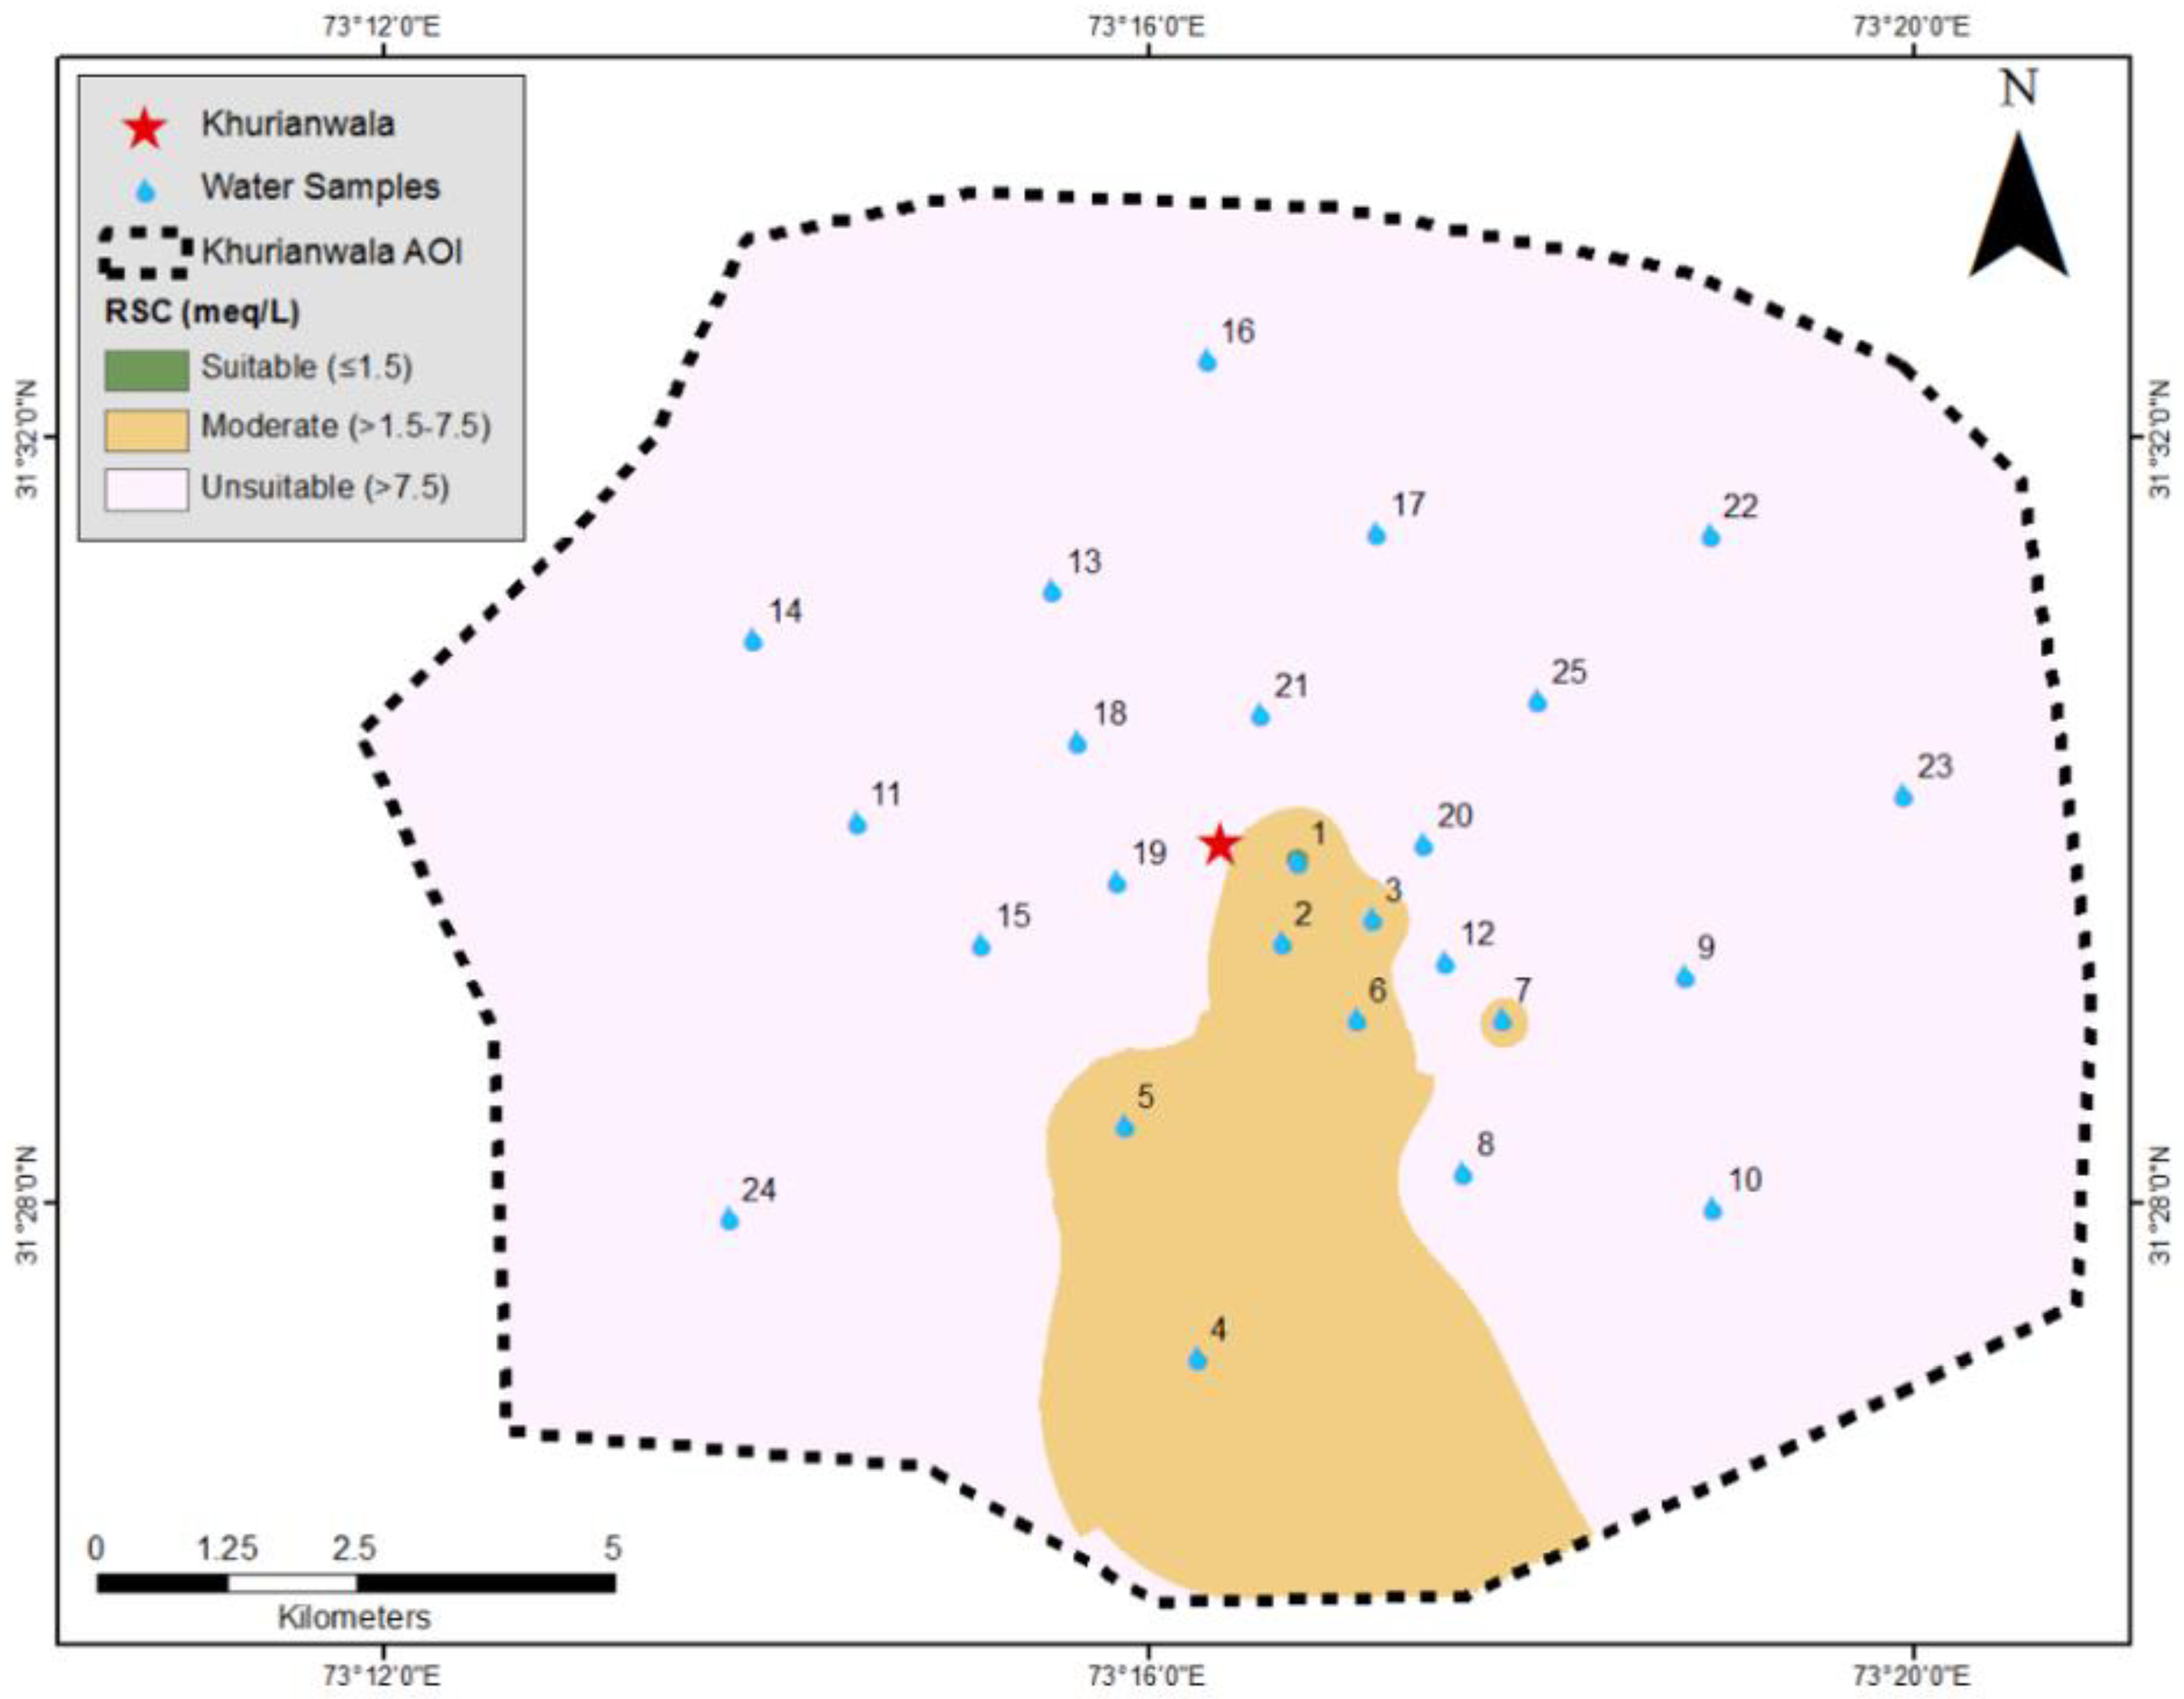
3.4. Irrigation Water Quality Analysis

A triliner piper plot commonly termed as tannery plot was drawn to investigate the hydro-chemical properties of cations and anions shown in Figure 6, which shows the strong relationship between the cations and anions [41]. The results showed that the most dominant cation is (Na + K) and the anion is (HCO3). According to the piper plot diagram, the mixed type of water is found in the study area. Whereas, on the basis of dominant cations and anion, trend of water type was NaHCO3 > Ca-Mg(HCO3)2 [42]. Piper plot was distributed in different categories to understand the hydro-chemical facies [33,43], which are presented in Table 5.
The Agricultural Department of US Salinity Laboratory conducts different analyses and approved specific techniques for the suitability of irrigation water [44]. Analysis of electrical conductivity (EC), sodium percentage (% Na), sodium adsorption ratio (SAR), residual sodium carbonate (RSC), and % error of ion balance was performed regarding irrigation water quality. The values of SAR, RSC, sodium percentage (% Na) and percentage of ion balance were calculated using Table 6.
The results of EC and sodium percentage were found in the range of 1591 to 3409 μS/cm and 35.0 to 75.6% respectively, presented in (Table 3). The distribution of water sample regarding EC values is shown in Figure 7. Wilcox [44] had classified the irrigation standard (Table 7) using electrical conductivity (EC) and sodium percentage as the high EC value; it shows the higher accumulation of salts in water samples [40,45]. The higher values of electrical conductivity (EC) were found due to the contamination of textile sewage effluents; these results are identical to the findings of [36,46]. Sodium percentage (Na %) determines the sodium ratio to total cations as mentioned in Equation (2). The results of Na % indicated that nine water samples for irrigation purposes are suitable and the remaining are doubtful. Sodium plays a dynamic role in the soil and reduces the aeration process [47]. Combination of (Na) with carbonate (CO32−) and chloride (Cl) forms alkaline soils and saline soils, respectively, and neither of these are suitable for plant growth [48]. Results are identical to the findings of Sadashivaiah [43].
The % error in ion balance was calculated using Equation (3), the values are ranging from 3.70 to 24.8% (Table 3) with an average value of 14.4 ± 3.70%. The % error in ion balance should be less than 10% for safe irrigation water, the higher values (>10%) pose that the higher contribution of ions and it causes salinity in soil; only three samples were found within the permissible range [21].
Eaton has recommended the irrigation standards by SAR and RSC [49]. SAR and RSC were measured using Equations (4) and (5), values of SAR and RSC ranging from 3.67 to 16.6 and 6.15 to 15.5 meq/L, respectively, as shown in (Table 3). The SAR and RSC distribution of water sample values are shown in Figure 8 and Figure 9 respectively; results represent that industrial activities have a significant impact on each point corresponding to the distance. According to FAO guidelines (Table 1), ten samples of SAR and three samples of RSC were within allowable limits. The salinity and toxicity were measured for groundwater suitability for irrigation purposes [24,50]; in this concern, SAR was regarded as a major irrigation water quality parameter [51]. SAR measures the relative proportion between sodium ion to calcium and magnesium ion and have a direct relationship with sodium adsorption by soil. In the soil system, calcium and magnesium do not pose equally but form an equilibrium with each other. When water is more saline, magnesium starts damaging the soil structure and high sodium absorption, causing the formation of alkaline soil, which reduces the soil permeability [33,52].
The correlation values between the irrigation water quality parameters are shown in Table 8. The high correlation found between (Na+) and (EC) 0.99 indicates significant concentration of salts in groundwater resources. The high correlation value between the sodium ion (Na+) and sodium adsorption ratio (SAR) 0.98 is evident of their direct relationship [53]. Results concluded that the salinity was found in groundwater across the industrial vicinity and not suitable for irrigation without prior treatment.

3.5. Heavy Metal Analysis

The analysis was performed for heavy metals and values were ranging for iron (Fe) 0.56 to 5.02 mg/L, chromium (Cr) 0.12 to 0.94 mg/L, arsenic (As) 0.00 to 0.10 ppb, and zinc (Zn) 0.01 to 0.10 mg/L (Table 3) with average values of 2.18 ± 1.17 mg/L, 0.50 ± 0.24 mg/L, 0.04 ± 0.03 ppb, and 0.05 ± 0.03 mg/L, respectively [22,54]. The water sample distribution in regard of obtained values of Fe, Cr, As, and Zn are shown in Figure 10. According to the NEQS and WHO guidelines [23,27], the results were high for iron and chromium. The arsenic was within permissible limits according to the NEQS guideline (0.05 ppb) for most of the samples but exceeds the WHO standards (0.01 ppb) [23,27]. The values of zinc were found in the acceptable range. Textile industries are using various heavy metals with different proportions in dying and printing media, which are released in the form of effluents after digestion in extensive amounts [55]. Fe is extensively used as a dye-modifying agent in textile units, and lead chromate Pb(CrO4) is used as a yellow pigment in the fibers’ dying process [56]. The high concentration of Fe, Cr, and As causes serious health issues and environmental risks [57]. Zinc has few adverse effects and was found within allowable limits according to NEQS (5.00 mg/L) and WHO (3.00 mg/L) guidelines.

3.6. General Survey

A general survey was conducted and the questionnaire was carried out randomly among people of the study area about the groundwater quality and irrigation water. The people are not generally satisfied with the drinking water quality of the area. They found sourness in the taste of groundwater. When the information was gathered from the rural community of the area for irrigation of groundwater, it was found that soil is not absorbing groundwater and they found hardness in the soil. The crop yield is also not very high. Health issues are very common the study area. according to the rural health center (RHC) information, blood pressure and seasonal flu were commonly found among the people. Furthermore, gastrointestinal, heart diseases, common water diseases like diarrhea, hepatitis, malaria were also found among the community. Such conditions described the serious health and environmental issues in the study area.

4. Conclusions

Water quality index showed that currently groundwater can be used for drinking purposes after treatment process, but the situation has become worse with the passage of time. High sodium ion and bicarbonate ion concentration are affecting the groundwater quality and causing environmental risks. Bacterial activity was found in samples which is the cause of severe diseases like Cholera, Typhoid, Hepatitis A & E, and Diarrhea. However, groundwater can be used for irrigation purposes as the SAR values indicate that the water quality is moderately fit for irrigation but over time, was prolonging water quality as it becomes depraved due to the emission of untreated effluents. The mixed type of water was found in the study area, whereas the trend of groundwater was NaHCO3 > Ca-Mg(HCO3)2. Heavy metals concentration also found in water samples as trace elements. Iron (Fe), chromium (Cr), and arsenic (As) lead the issues of health in the human body and soil as well. The GIS interpolation using inverse distance weight (IDW) was measured such that each point has a local influence that diminishes with the distance. Thus, in the results, the points near the industrial area give high weight, and the points far away provide low weight, which showed a substandard situation adjoining the textile units. Results are also evident that the textile units are discharging their effluents in substantial quantity directly into the Madhuana drain and depleting the groundwater resources throughout the area. Such alarming situations have direct and indirect influence on the environment and engender health issues.

5. Recommendations

Groundwater can be used for drinking purposes after the treatment process. Use of boiled water kills the bacterial activity and reduced pathogens. Installation of small-scale filtration plants and chlorination process can be done in houses. Reverse osmosis (R/O) plants can be used at a commercial level in the industrial vicinity for the measure of safe drinking water. For irrigation purposes, groundwater might be used with the mixing of canal water to reduce the hardness of groundwater. Gypsum may be used as a softener for irrigation. It is recommended that the environmental protection agencies should make policies for better drinking water quality and take serious action against the industries which are discharging their wastewater effluents without proper treatment. Furthermore, studies are required to be conducted for the characterizing of effluents emitted by the industries and for their reclamation.

Author Contributions

M.A. contributed in this article by conducting this research in the study area, writing the manuscript and performing the analysis. C.J.S. and C.L. supervised this research and advised throughout the experiment. A.M.A. helped in GIS modeling analysis. M.I. and W.Y. contributed their role in revision and technical handling of the draft. W.S.A. and N.A.B. helped in geological studies of the area and revision of the article. All authors contributed equally.

Funding

This research paper was funded by grant numbers [20165051212], [2018B14814] and [20155005412] under National Science and Technology Projects.

Acknowledgments

This research was sponsored by the Ministry of Science and Technology, China. Authors are also thankful of Haroon Rashid, Lecturer University of Agriculture Faisalabad and Farhat, Research officer WASA-laboratories Faisalabad for their kind support and assistance.

Conflicts of Interest

The authors declare no conflict of interest.

Abbreviations

APHAAmerican public health association
AsArsenic
B.P.Blood pressure
BODBiological oxygen demand
CaCalcium
ClChloride
CO3Carbonate
CODChemical oxygen demand
CrChromium
DODissolved oxygen
EDTAEthylenediaminetetraacetic acid
ECElectrical conductivity
FFluoride
F. coliFacial coliform
FAOFood and agriculture organization
FeIron
GDPGross domestic product
GISGeographic information system
GPSGlobal positioning system
HCO3Bi-carbonate
IDWInverse distance weighted
KPotassium
MgMagnesium
nNumber of water quality parameter
NaSodium
NEQSNational environmental quality standards
US-NSFWQIUnited States—National Sanitation Foundation Water Quality Index
NO3Nitrate
°CDegree Celsius
PO4Phosphate
QiSub index for ith water quality parameter
RHCRural health center
R/OReverse osmosis
RSCResidual sodium carbonate
SARSodium adsorption ratio
SO4Sulfate
TDSTotal dissolved solids
THTotal hardness
TPTotal phosphorus
UTMUniversal transverse mercator
UV/VisUltraviolet–visible
WGS-84World geodetic system—1984
WHOWorld Health Organization
WiWeight associated with ith water quality parameter
WQIWater quality index
ZnZinc

References

  1. Gorde, S.P.; Jadhav, M.V. Assessment of Water Quality Parameters: A Review. Int. J. Eng. Res. Appl. 2013, 3, 2029–2035. [Google Scholar]
  2. WHO; UNICEF. Progress on Sanitation and Drinking-Water; WHO: Geneva, Switzerland, 2010; p. 60. [Google Scholar]
  3. WWAP; UNESCO. The United Nations World Water Development Report 3: Water in a Changing World; UNESCO: Paris, France; Earthscan: London, UK, 2009. [Google Scholar]
  4. Kavitha, R.E. Ground water quality characteristics at Erode district, Tamilnadu India. Int. J. Environ. Sci. 2010, 1, 145–150. [Google Scholar]
  5. Pakistan Economic Survey; Ministry of Finance, GoP, Pakistan: Islamabad, Pakistan, 2015; p. 467.
  6. Khan, S.; Shahnaz, M.; Jehan, N.; Rehman, S.; Shah, M.T.; Din, I. Drinking water quality and human health risk in Charsadda district, Pakistan. J. Clean. Prod. 2013, 60, 93–101. [Google Scholar] [CrossRef]
  7. Tahir, M.A.; Akram, M.; Hassan, F.; Farooque, M. Technical Assesment of Water Supply Scheme, Northenran and Central Punjab; 149-2011; PCRWR-Ministry of Sicence and Technology: Islamabad, Pakistan, 2011.
  8. Aleem, M.; Shun, C.J.; Rashid, H.R.; Aslam, A.M.; Javed, M.F.J.; Sarwar, M.W. Impact assessment of Dijkot branch drain effluent on groundwater quality using GIS technique. J. Glob. Innov. Agric. Soc. Sci. 2017, 5, 20–27. [Google Scholar] [CrossRef]
  9. Taj, L.; Hussain, S.; Ali, S.; Farid, M.; Haq, M.; Habib, U.; Sajid, S.; Sharif, N. Physico-chemical analysis of ground water contamination caused by industrial waste water in Faisalabad, Pakistan. IJPAES 2013, 3, 140–146. [Google Scholar]
  10. Babu, B.R.; Parande, A.K.; Raghu, S.; Kumar, T.P. Cotton Textile Processing: Waste Generation and Effluent Treatment. J. Cotton Sci. 2007, 11, 141–153. [Google Scholar]
  11. Aleem, M.; Nasir, A.; Rashid, H. Characterization and removal of dyeing effluents by adsorption and coagulation methods. J. Agric. Res. 2016, 54, 97–106. [Google Scholar]
  12. Kahlown, M.A.; Ashraf, M.; Hussain, M.; Salam, H.A.; Bhatti, A.Z. Pakistan Council of Research in Water Resources Khyaban-e-Johar, H-8/1; PCRWR: Islamabad, Pakistan, 2006.
  13. Noreen, M.; Shahid, M.; Iqbal, M.; Nisar, J. Measurement of cytotoxicity and heavy metal load in drains water receiving textile effluents and drinking water in vicinity of drains. Measurement 2017, 109, 88–99. [Google Scholar] [CrossRef]
  14. Sasayama, K. Report of the 2004 Baseline Survey on Millennium Development Goals in AUICK Associate Cities; International Cooperation NGO: Kobe, Japan, 2005. [Google Scholar]
  15. Mehdi, S.; Ranjha, A.; Akhtar, S.; Tanvir, M.; Hassan, G. Morphological, chemical and mineralogical Characteristics of a Chronosequence of soils on alluvial deposits in Pakistan. Int. J. Agric. Biol. 2000, 2, 364–368. [Google Scholar]
  16. APHA; AWWA; WEF. Standard Methods for the Examination of Water and Wastewater; APHA-AWWA-WEF: Washington, DC, USA, 2005. [Google Scholar]
  17. Nosheen, S.; Nawaz, H.; Rehman, K. Physico-Chemical Characterization of Effluents of Local Textile Industries of Faisalabad–Pakistan. Int. J. Agric. Biol. 2000, 2, 232–233. [Google Scholar]
  18. Tyagi, S.; Sharma, B.; Singh, P.; Dobhal, R. Water quality assessment in terms of water quality index. Am. J. Water Resour. 2013, 1, 34–38. [Google Scholar]
  19. Brown, R.M.; Mcclelland, N.I.; Deininger, R.A.; Tozer, R.G. A water quality index: Do we dare? Water Sew. Work. 1970, 117, 339–343. [Google Scholar]
  20. Ayers, R.S.; Westcot, D.W. Water Quality for Agriculture; Food and Agriculture Organization of the United Nations: Rome, Italy, 1994. [Google Scholar]
  21. Dhv, D.C.; Bv, B.D.H.; Halcrow, T.; CES, ORG & JPS. Hydrology Project Training Module, 28 Major Ions in Water; CES, ORG & JPS: New Delhi, India, 2002. [Google Scholar]
  22. Mosaferi, M.; Pourakbar, M.; Shakerkhatibi, M.; Fatehifar, E.; Belvasi, M. Quality modeling of drinking groundwater using GIS in rural communities, northwest of Iran. J. Environ. Health Sci. 2014, 12, 99. [Google Scholar] [CrossRef] [PubMed] [Green Version]
  23. WHO. Guidelines for Drinking-Water Quality, 4th ed.; WHO Library Cataloguing-in-Publication Data: Geneva, Switzerland, 2011. [Google Scholar]
  24. Hasan, M.; Shang, Y.; Akhter, G.; Jin, W. Evaluation of Groundwater Suitability for Drinking and Irrigation Purposes in Toba Tek Singh District, Pakistan. Irrig. Drain. Syst. Eng. 2017, 6, 185. [Google Scholar]
  25. Ho, K.; Chow, Y.; Yau, J. Chemical and microbiological qualities of The East River (Dongjiang) water, with particular reference to drinking water supply in Hong Kong. Chemosphere 2003, 52, 1441–1450. [Google Scholar] [CrossRef]
  26. Shankar, B.S.; Balasubramanya, N.; Reddy, M.T.M. Impact of industrialization on groundwater quality–a case study of Peenya industrial area, Bangalore, India. Environ. Monit. Assess. 2008, 142, 263–268. [Google Scholar] [CrossRef] [PubMed]
  27. NEQS. National Standards for Drinking Water Quality (NSDWQ); NEQS: Islamabad, Pakistan, 2008.
  28. MWD; USBR. Salinity Management Study–Final Report; Southern California Salinity Coalition: Fountain Valley, CA, USA, 1999. [Google Scholar]
  29. Basappa, R.M. Status of Ground Water Quality in Bangalore and Its Environment; Department of Mines and Geology: Bangalore, India, 2003.
  30. Gupta, S.K.; Gupta, R.; Gupta, A.; Seth, A.; Bassin, J.; Gupta, A. Recurrent acute respiratory tract infections in areas with high nitrate concentrations in drinking water. Environ. Health Perspect. 2000, 108, 363. [Google Scholar] [CrossRef] [PubMed]
  31. Weyer, P.J.; Cerhan, J.R.; Kross, B.C.; Hallberg, G.R.; Kantamneni, J.; Breuer, G.; Jones, M.P.; Zheng, W.; Lynch, C.F. Municipal drinking water nitrate level and cancer risk in older women: The Iowa Women’s Health Study. Epidemiology 2001, 12, 327–338. [Google Scholar] [CrossRef] [PubMed]
  32. Mohsin, M.; Safdar, S.; Asghar, F.; Jamal, F. Assessment of drinking water quality and its impact on residents health in Bahawalpur city. Int. J. Humanit. Soc. Sci. 2013, 3, 114–128. [Google Scholar]
  33. Dhanasekarapandian, M.; Chandran, S.; Devi, D.S.; Kumar, V. Spatial and temporal variation of groundwater quality and its suitability for irrigation and drinking purpose using GIS and WQI in an urban fringe. J. Afr. Earth Sci. 2016, 124, 270–288. [Google Scholar] [CrossRef]
  34. Odonkor, S.T.; Ampofo, J.K. Escherichia coli as an indicator of bacteriological quality of water: An overview. Microbiol. Res. 2013, 4, e2. [Google Scholar] [CrossRef]
  35. Mwabi, J.K.; Mamba, B.B.; Momba, M.N. Removal of Escherichia coli and faecal coliforms from surface water and groundwater by household water treatment devices/systems: A sustainable solution for improving water quality in rural communities of the Southern African development community region. Int. J. Environ. Res. Public Health 2012, 9, 139–170. [Google Scholar] [CrossRef] [PubMed]
  36. Abbas, S.; Mashiatullah, A.; Javed, A.; Khan, M.; Saleem, S. Physicochemical and chemical quality of Mailsi City groundwater. Nucleus 2014, 51, 199–205. [Google Scholar]
  37. Hassan, A.; Nawaz, M. Microbiological and physicochemical assessments of groundwater quality at Punjab, Pakistan. Afr. J. Microbiol. Res. 2014, 8, 2672–2681. [Google Scholar]
  38. Khalid, S.; Murtaza, B.; Shaheen, I.; Ahmad, I.; Ullah, M.I.; Abbas, T.; Rehman, F.; Ashraf, M.R.; Khalid, S.; Abbas, S. Assessment and public perception of drinking water quality and safety in district Vehari, Punjab, Pakistan. J. Clean. Prod. 2018, 181, 224–234. [Google Scholar] [CrossRef]
  39. Schroeder, H.A. Relations between hardness of water and death rates from certain chronic and degenerative diseases in the United States. J. Chronic Dis. 1960, 12, 586–591. [Google Scholar] [CrossRef]
  40. Muthukumaravel, S.; Padmanabhan, V.; Boopathidoss, P.S.; Sadanandane, C.; Srinivasan, R.; Gunasekaran, K.; Sabesan, S.; Balaraman, K. Invasion of toxic marine cyanobacteria in to the tsunami affected coastal villages of southern India. J. Commun. Dis. 2010, 42, 135–138. [Google Scholar] [PubMed]
  41. Hussain, M.; Ahmed, S.M.; Abderrahman, W. Cluster analysis and quality assessment of logged water at an irrigation project, eastern Saudi Arabia. J. Environ. Manag. 2008, 86, 297–307. [Google Scholar] [CrossRef] [PubMed]
  42. Prabha, S.; Kumar, M.; Kumar, A.; Das, P.; Ramanathan, A.L. Impact assessment of textile effluent on groundwater quality in the vicinity of Tirupur industrial area, southern India. Environ. Earth Sci. 2013, 70, 3015–3022. [Google Scholar] [CrossRef]
  43. Sadashivaiah, C.; Ramakrishnaiah, C.; Ranganna, G. Hydrochemical analysis and evaluation of groundwater quality in Tumkur Taluk, Karnataka State, India. Int. J. Environ. Res. Public Health 2008, 5, 158–164. [Google Scholar] [CrossRef] [PubMed]
  44. Wilcox, L. Classification and Use of Irrigation Waters; FAO: Rome, Italy, 1955. [Google Scholar]
  45. Laluraj, C.; Gopinath, G. Assessment on seasonal variation of groundwater quality of phreatic aquifers—A river basin system. Environ. Monit. Assess. 2006, 117, 45–57. [Google Scholar] [CrossRef] [PubMed]
  46. Rasool, A.; Farooqi, A.; Xiao, T.; Masood, S.; Kamran, M.A. Elevated levels of arsenic and trace metals in drinking water of Tehsil Mailsi, Punjab, Pakistan. J. Geochem. Explor. 2016, 169, 89–99. [Google Scholar] [CrossRef]
  47. Vasanthavigar, M.; Srinivasamoorthy, K.; Vijayaragavan, K.; Ganthi, R.R.; Chidambaram, S.; Anandhan, P.; Manivannan, R.; Vasudevan, S. Application of water quality index for groundwater quality assessment: Thirumanimuttar sub-basin, Tamilnadu, India. Environ. Monit. Assess. 2010, 171, 595–609. [Google Scholar] [CrossRef] [PubMed]
  48. Manikandan, S.; Chidambaram, S.; Prasanna, M.V.; Thivya, C.; Karmegam, U. Hydrochemical characteristics and groundwater quality assessment in Krishnagiri District, Tamilnadu, India. Int. J. Earth Sci. Eng. 2011, 4, 623–632. [Google Scholar]
  49. Eaton, F.M. Significance of carbonates in irrigation waters. Soil Sci. 1950, 69, 123–134. [Google Scholar] [CrossRef]
  50. Rao, N.S.; Rao, V.G.; Gupta, C. Groundwater pollution due to discharge of industrial effluents in Venkatapuram area, Visakhapatnam, Andhra Pradesh, India. Environ. Geol. 1998, 33, 289–294. [Google Scholar]
  51. Offiong, O.; Edet, A. Water quality assessment in Akpabuyo, cross river basin, south-eastern Nigeria. Environ. Geol. 1998, 34, 167–174. [Google Scholar] [CrossRef]
  52. Sivasankar, V.; Omine, K.; Msagati, T.; Chandramohan, A. Evaluation of groundwater quality in Madurai City, South India for drinking, irrigation and construction purposes. Arab. J. Geosci. 2014, 7, 3093–3107. [Google Scholar] [CrossRef]
  53. Devendra, D.; Shriram, D.; Atul, K. Analysis of Ground Water Quality Parameters: A Review. Res. J. Eng. Sci. 2014, 3, 26–31. [Google Scholar]
  54. Mosaferi, M.; Yunesian, M.; Dastgiri, S.; Mesdaghinia, A.; Esmailnasab, N. Prevalence of skin lesions and exposure to arsenic in drinking water in Iran. Sci. Total Environ. 2008, 390, 69–76. [Google Scholar] [CrossRef] [PubMed]
  55. Doğan, M.; Soylak, M.; Elçi, L.; von Bohlen, A. Application of total reflection X-ray fluorescence spectrometry in the textile industry. Microchim. Acta 2002, 138, 77–82. [Google Scholar] [CrossRef]
  56. Sungur, Ş.; Gülmez, F. Determination of metal contents of various fibers used in textile industry by MP-AES. J. Spectrosc. 2015, 2015, 640271. [Google Scholar] [CrossRef]
  57. Nickson, R.T.; McArthur, J.M.; Shrestha, B.; Kyaw-Myint, T.O.; Lowry, D. Arsenic and other drinking water quality issues, Muzaffargarh District, Pakistan. Appl. Geochem. 2005, 20, 55–68. [Google Scholar] [CrossRef]
Figure 1. Study area.
Water 10 01321 g001
Figure 2. Mapping according to the distribution of pH values based on drinking water quality standard.
Water 10 01321 g002
Figure 3. Mapping according to the distribution of total dissolved solids (TDS) values based on drinking water quality standard.
Water 10 01321 g003
Figure 4. Mapping according to the distribution of water quality index (WQI) values based on drinking water quality standard.
Water 10 01321 g004
Figure 5. Mapping according to the distribution of total hardness (TH) values based on drinking water quality standard.
Water 10 01321 g005
Figure 6. Piper plot for cations and anions.
Water 10 01321 g006
Figure 7. Mapping according to the distribution of electrical conductivity (EC) values based on drinking water quality standards and irrigation water quality standards.
Water 10 01321 g007
Figure 8. Mapping according to the distribution of SAR values based on irrigation water quality standards.
Water 10 01321 g008
Figure 9. Mapping according to the distribution of RSC values based on irrigation water quality standards.
Water 10 01321 g009
Figure 10. Mapping according to the distribution of heavy metals values based on drinking water quality standard.
Water 10 01321 g010
Table 1. Sodium adsorption ratio (SAR) and residual sodium carbonate (RSC) values for irrigation water quality standards [20].
SARRSCRemarks (Irrigation Water Quality)
Range (meq/L)Range (meq/L)
<3.00<1.50Suitable
3.00–9.001.50–7.50Moderate
>9.00>7.50Not suitable
Table 2. Physico-chemical parameter analysis of groundwater for water quality and irrigation purposes.
SamplesLatitudeLongitudepHTurbidityTDS(PO4)(NO3)DOF-ColiNaCaMgKHCO3CO3SO4
UnitsNE--NTUmg/Lmg/Lmg/L%col/100 mLmg/Lmg/Lmg/Lmg/Lmg/Lmg/Lmg/L
131.4964973.279598.104.1018451.0269.009.011.054511198.044.0982243350
231.4894973.278237.903.8015481.0053.008.009.061310778.032.0870250323
331.4914173.286138.404.0016430.6758.009.012.045911088.038.0892219340
431.4531873.270897.501.1012370.1823.012.004.021987.047.077.0652120189
531.4735473.264507.702.4014000.3436.011.006.033298.053.065.0760189231
631.4827273.284787.903.7021140.8947.010.009.049813972.049.0834220298
731.4827873.297468.302.9018210.6742.008.007.047115486.054.0897204340
831.4693373.294147.802.7014040.5632.011.006.038710272.068.0724250232
931.4865073.313527.602.0016120.5035.010.004.029998.055.054.0760198248
1031.4662273.315887.400.5012310.1228.012.003.018078.446.089.0688102140
1131.4998273.241267.903.4014020.3436.009.007.030376.059.065.0698187201
1231.4876273.292508.103.3016890.7643.007.008.068113288.038.0850229288
1331.5201873.258238.002.1013120.4538.011.004.043298.054.069.0696210265
1431.5157973.232207.600.9010020.2330.011.003.014877.042.0112598182178
1531.4893073.252068.201.1019120.7651.009.007.038969.054.045.0689170306
1631.5401773.271717.201.1010980.3022.010.002.020289.048.098.0602142120
1731.5250573.286547.901.9012080.3631.010.008.032178.056.072.0780200268
1831.5068773.260468.102.8017010.7139.009.010.040211266.040.0960311298
1931.4946573.263878.102.9016500.5947.009.010.060198.059.037.0921308320
2031.4980573.290638.003.1019210.8238.007.008.051212487.047.0898248289
2131.5093673.276477.902.1014990.4355.008.011.045510673.047.0912198354
2231.5248873.315607.701.0012580.2121.012.002.017478.056.0110721210164
2331.5023073.332557.700.609870.3226.012.003.019071.060.0118597186178
2431.4654873.230067.900.4513080.1724.013.003.012169.057.098.0606198156
2531.5104873.300607.100.9015210.3834.011.005.024094.059.078.0712210198
NEQS--------6.50–8.005.001000----50.0n/a0.00------------------------250
WHO--------6.50–8.005.00500----50.0----0.0020.0------------n/a----250
NEQS: National Environmental Quality Standards; DO: Dissolved Oxygen.
Table 3. Physico-chemical parameter analysis of groundwater for water quality and irrigation purposes.
SamplesLatitudeLongitudeClFTHECFeCrAsZnTPSARRSC%Age Ion Bal.% Na WQI
UnitsNEmg/Lmg/Lmg/LuS/cmmg/Lmg/Lppbmg/Lmg/Lmeq/Lmeq/Lmeq/Lmeq/L
131.4964973.279596161.6037829765.020.800.070.080.3312.810.511.868.365.3
231.4894973.278237321.5043824973.120.920.080.080.3315.510.711.973.963.6
331.4914173.286135981.6039226504.830.650.100.060.2211.19.0915.266.063.4
431.4531873.270892050.4015019950.880.230.000.010.066.66.4210.550.974.6
531.4735473.264503870.7018922582.100.430.030.080.119.59.4415.160.672.4
631.4827273.284785900.8032034103.420.520.050.010.2912.08.0610.065.767.0
731.4827873.297465980.9038829372.660.870.080.070.2210.66.6410.661.665.6
831.4693373.294144321.1030022651.220.250.040.080.1810.19.1011.361.570.6
931.4865073.313523940.5028926001.210.420.040.030.168.49.5819.459.172.3
1031.4662273.315882590.3018719850.560.120.000.010.045.66.9316.445.774.7
1131.4998273.241262940.8029822612.500.190.020.010.118.98.9612.360.270.6
1231.4876273.292504891.3030427243.220.740.060.060.2515.87.633.7072.564.8
1331.5201873.258233940.6029821162.260.430.030.050.1512.39.017.8166.271.2
1431.5157973.232201980.3022016161.000.240.010.030.074.78.5220.339.174.9
1531.4893073.252066361.4040030842.980.430.040.090.2512.09.0122.669.866.9
1631.5401773.271712100.5016517711.400.760.000.080.106.046.157.6546.276.1
1731.5250573.286542780.6027819482.420.260.000.070.129.5410.914.860.972.1
1831.5068773.260465980.8032027443.230.440.030.100.2310.515.024.864.868.2
1931.4946573.263876661.3028826611.800.860.090.090.1916.715.515.875.667.7
2031.4980573.290637121.2039230982.420.580.100.090.2712.19.5414.166.563.6
2131.5093673.276474861.6033224182.060.940.060.070.1411.710.213.766.867.8
2231.5248873.315602400.5025020290.660.320.010.040.075.210.220.941.675.3
2331.5023073.332551900.3020015921.020.320.010.020.105.657.4411.643.373.6
2431.4654873.230062100.3024221100.980.280.000.010.063.678.3323.335.173.6
2531.5104873.300602540.6028824531.500.420.040.040.126.739.0615.250.972.4
NEQS--------2501.50<300--------0.100.055.00----Table 1Table 1<10.0Table 7NSFWQI
WHO--------2501.50<300----0.300.050.013.00----
Table 7 described (Na %) guidelines for quality analysis. NSFWQI, National Sanitation Foundation Water Quality Index.
Table 4. Correlation results of cations with anions.
NaCaMgK
HCO30.950.980.980.87
CO30.950.970.970.86
Cl0.980.950.950.73
SO40.970.970.980.81
Table 5. Hydro-chemical facies on the basis of piper plot.
TriangleDiamond
Water ClassRemarksWater ClassRemarks
ACalcium type5Mg(HCO3)2 type
BNo Dominant type6CaCl2 type
CMagnesium type7NaCl type
DNa + K type8NaHCO3 type
EBicarbonate type9Mixed Type
FSulphate type1 = 5 + 9 + 6Alkaline earths exceed alkalies
GChloride type2 = 7 + 9 + 8Alkalies exceed alkaline earths
3 = 5 + 9 + 8Weak acids exceed strong acids
4 = 7 + 9 + 6Strong acids exceed weak acids
Table 6. Cations and anions for the calculation of piper plot and % error of ion balance.
SamplesLatitudeLongitudeCationsAnions
NaCaMgKHCO3CO3SO4ClF
NEmeq/Lmeq/Lmeq/Lmeq/Lmeq/Lmeq/Lmeq/Lmeq/Lmeq/L
131.496573.279623.705.558.171.1316.108.107.2917.350.084
231.489573.278226.655.356.500.8214.268.336.7320.620.079
331.491473.286119.965.507.330.9714.627.307.0816.850.084
431.453273.27099.524.353.921.9710.694.003.945.770.042
531.473573.264514.434.904.421.6712.466.304.8110.900.063
631.482773.284821.656.956.001.2613.677.336.2116.620.042
731.482873.297520.487.707.171.3814.706.807.0816.850.047
831.469373.294116.835.106.001.7411.878.334.8312.170.058
931.486573.313513.004.904.581.3812.466.605.1711.100.026
1031.466273.31597.833.923.832.2811.283.402.927.300.016
1131.499873.241313.173.804.921.6711.446.234.198.280.042
1231.487673.292529.616.607.330.9713.937.636.0013.770.068
1331.520273.258218.784.904.501.7711.417.005.5211.100.032
1431.515873.23226.433.853.502.879.806.073.715.580.037
1531.489373.252116.913.454.501.1511.305.676.3817.920.074
1631.540273.27178.784.454.002.519.874.732.505.920.032
1731.525173.286513.963.904.671.8512.796.675.587.830.058
1831.506973.260517.485.605.501.0315.7410.376.2116.850.089
1931.494673.263926.134.904.920.9515.1010.276.6718.760.079
2031.498173.290622.266.207.251.2114.728.276.0220.060.079
2131.509473.276519.785.306.081.2114.956.607.3813.690.084
2231.524973.31567.573.904.672.8211.827.003.426.760.026
2331.502373.33268.263.555.003.039.796.203.715.350.016
2431.465573.23015.263.454.752.519.936.603.255.920.016
2531.510573.300610.434.704.922.0011.677.004.137.150.032
Table 7. Analysis of (EC) and (Na %) on the basis of water class [44].
ECNa %
RangeWater ClassNo. of SamplesRangeWater ClassNo. of Samples
<250Low saline--<20Excellent--
250–750Medium saline--20–40Good2
750–2250High saline1540–60Permissible7
2250–5000Very high saline1060–80Doubtful17
80>Unsuitable--
Table 8. Correlation between irrigation water quality parameters.
NaECRSC
EC0.99
RSC0.970.96
SAR0.980.960.95

