Expanded Application of the Passive Flux Meter: In-Situ Measurements of 1,4-Dioxane, Sulfate, Cr(VI) and RDX
by

Alexander A. Haluska
1, 
Meghan S. Thiemann
1,
Patrick J. Evans
2,
Jaehyun Cho
1 and
Michael D. Annable
1,* 1
Department of Environmental Engineering Sciences, University of Florida, 217 A.P. Black Hall, P.O. Box 116450, Gainesville, FL 32611, USA
2
CDM Smith, 14432 S.E. Eastgate Way, Suite 100, Bellevue, WA 98007, USA
*
Author to whom correspondence should be addressed.
Water 2018, 10(10), 1335; https://doi.org/10.3390/w10101335
Submission received: 6 August 2018
/
Revised: 8 September 2018
/
Accepted: 17 September 2018
/
Published: 26 September 2018
(This article belongs to the Special Issue Groundwater Contamination and Remediation)
Abstract
:Passive flux meters (PFMs) have become invaluable tools for site characterization and evaluation of remediation performance at groundwater contaminated sites. To date, PFMs technology has been demonstrated in the field to measure midrange hydrophobic contaminants (e.g., chlorinated ethenes, fuel hydrocarbons, perchlorate) and inorganic ions (e.g., uranium and nitrate). However, flux measurements of low partitioning contaminants (e.g., 1,4-dioxane, hexahydro-1,3,5-trinitro-s-triazine (RDX)) and reactive ions-species (e.g., sulfate (SO42−), Chromium(VI) (Cr(VI)) are still challenging because of their low retardation during transport and quick transformation under highly reducing conditions, respectively. This study is the first application of PFMs for in-situ mass flux measurements of 1,4-dioxane, RDX, Cr(VI) and SO42− reduction rates. Laboratory experiments were performed to model kinetic uptake rates and extraction efficiency for sorbent selections. Silver impregnated granular activated carbon (GAC) was selected for the capture of 1,4-dioxane and RDX, whereas Purolite 300A (Bala Cynwyd, PA, USA) was selected for Cr(VI) and SO42−. PFM field demonstrations measured 1,4-dioxane fluxes ranging from 13.3 to 55.9 mg/m2/day, an RDX flux of 4.9 mg/m2/day, Cr(VI) fluxes ranging from 2.3 to 2.8 mg/m2/day and SO42− consumption rates ranging from 20 to 100 mg/L/day. This data suggests other low-partitioning contaminates and reactive ion-species could be monitored using the PFM.
1. Introduction
The freely dissolved concentrations of contaminants and metals in sediment pore water are critical measurements for assessing their fate and transport in groundwater systems. However, accurate measurement of metals and organic contaminants using traditional groundwater sampling methods (e.g., low flow point sampling) is challenging due to the differences in solubilities and solid phase partitioning behaviors. Concentrations of compounds in groundwater withdrawn from wells are controlled partly by the transfer of mass to flowing water from other phases: (1) Mass absorbed to aquifer solids; and/or (2) mass trapped in immobile pockets. Transfers of masses can result in underestimating extracted groundwater concentrations because this traditional method cannot account for vertical or horizontal spatial variability in the distribution, nor can it account for how concentrations may change over time due to seasonal variability (e.g., increased rainfall, tidal changes, etc.) [1]. However, passive sampling approaches have emerged as a promising method since they allow both temporally and spatially averaged concentrations.
Diffusion-based samplers inhibit advective transport processes through porous casing material and are usually deployed for a limited exposure time due to variations in environmental conditions (e.g., water level, groundwater flow rates) [2]. Examples of diffusion-based samplers currently used include ceramic dosimeters, bag samplers, dialysis membrane samplers, polyethene samplers, peepers and polymer-based samplers [3,4,5,6,7,8,9]. However, such samplers have difficulty reaching equilibrium between the pore water and sorbent material due to mass transfer limitations through the depletion layer and the absence of active mixing [10,11,12]. Permeation-based passive samplers rely on groundwater flow to control advective transport processes as it passes through the sampler, while Passive Flux Meters (PFMs) have proven to be the only sampler that is able to effectively measure mass fluxes near source groundwater [2]. Additionally, PFMs and integral pump tests were reported to produce similar estimates of mass flux, demonstrating the accuracy of the device [13,14].
The standard PFM is a self-contained permeable sorbent-filled cartridge installed in wells and boreholes that provides simultaneous in-situ time-average measurement of mass flux (Jc) and water flux (qo) with depth under ambient hydraulic gradients in saturated porous media [15,16]. The sorbent material (e.g., granular activated carbon (GAC), anionic exchange resin, etc.) is impregnated with water-soluble tracers that elute at proportional groundwater flow rates. The sorbent material also serves to intercept and retain any aqueous phase compounds present in groundwater flowing through a well [17,18]. This design has been adapted and modified for measurements of Jc and qo at fractured-rock sites, the hyporheic zone, streams, rivers and lakes [19,20,21,22]. To date, PFMs have been shown to measure chlorinated ethenes (e.g., Perchloroethene (PCE), Trichloroethene (TCE), cis-dichloroethene (cis-DCE), vinyl chloride (VC)), brominated ethenes (e.g., tetrabromoethane (TBA), tribromoethene (TBE)], methyl tert-butyl ether (MTBE)), perchlorate, arsenic, chromate, chromium(VI) (Cr(VI)), uranium, phosphate and nitrogen [16,23,24,25,26,27,28,29,30]. However, this technology has not yet been proven to measure low partitioning compounds (e.g., Hexahydro-1,3,5-trinitro-1,3,5-triazine (RDX), 1,4-dioxane) and reactive ion species in field sites with highly reducing conditions (e.g., sulfate (SO42−), Cr(VI)).
1,4-dioxane is a ubiquitous contaminant commonly found at current and former military installations and industrial sites. 1,4-dioxane is used as a stabilizer in chlorinated solvents and has a relatively high solubility in water (Cs = 4.31 × 10⁵ mg/L) and low retardation value [31,32,33]. Thus, the release of 1,4-dioxane behaves similarly to the release of a non-reactive tracer from the DNAPL (Dense Non-Aqueous Phase Liquid) source zone, resulting in transport of 1,4-dioxane ahead of chlorinated ethenes. This can produce an extensive 1,4-dioxane plume disconnected from the source zone. Additionally, the low retardation values signify the challenge of capturing it using sorbents typically used in PFMs. The partitioning between the GAC typically used in PFMs and 1,4-dioxane is estimated to have a retardation value (R) of about 10–20, which is based on a reported log Kow of −0.27 [34]. A field study was conducted at McClellan Air Force Base comparing rigid polypropylene (RPP) diffusion-based passive sampler concentrations of 1,4-dioxane to low-flow purge grab sample concentrations [35]. RPP passive samplers detected 1,4-dioxane but appeared to underpredict aqueous phase concentrations in comparison to the low flow method [35]. To the best of the authors’ knowledge, permeation-based passive samplers for either RDX or 1,4-dioxane have not been reported in the literature.
RDX is a high energy explosive found at numerous military installations and artillery ranges [36]. The US EPA (United States Environmental Protection Agency) has classified RDX as a possible contaminant. RDX has a moderate solubility (CS = 37.5 mg/L at pH 6.2 °C and 20 °C) and a low affinity for carbon (Koc = 6.26 to 42 L/kg), suggesting that it is fairly mobile and difficult to capture from the aqueous phase [37,38]. However, several methods have been developed to detect RDX in groundwater systems. Jar aquifer tests, assessing RDX uptake into a polyethene diffusion-based passive sampler using different soils (e.g., sandy loam soil, silty loam soil and sand), have shown that organic carbon content impacts the uptake behavior but may not accurately reflect the amount of RDX present in the soil [39]. Polar organic chemical integrative samplers (POCIS), diffusion-based samplers, have recently been developed and deployed at underwater munitions sites and have detected concentrations of RDX ranging from 4.3 to 11.0 μg/L [40]. GAC has also shown to be a useful material for the removal of RDX from aqueous phase solutions [41,42,43].
The biological formation of iron-sulfide minerals has been shown to dramatically enhance rates of reductive dechlorination of chlorinated ethenes [44,45,46,47,48,49,50,51]. Factors that are important in the promotion of these biogeochemical transformations include SO42− concentration, hydraulic residence time, electron donor availability and the presence of iron oxides [52,53]. The optimal combination of these factors promotes a high volumetric SO42− consumption rate and a high rate of reactive iron sulfide generation [53]. However, few monitoring tools exist to quantify these in-situ transformation rates. Currently, biogeochemical reaction rates are monitored by measuring the groundwater concentration in microcosms, soil core analysis, or calorimetrically [33,54,55]. While groundwater concentrations can provide an approximation of the rate, it often underestimates the rate [56]. Microcosms are often used to estimate biodegrading rates but are not representative of the environment since they are often manipulated in the lab [33,57,58]. No device currently exists to directly and spatially determine in-situ biogeochemical transformation rates.
Chromium, a widespread toxic metal contaminant, has been used for industrial processes since 1816 [59]. Cr(VI) is relatively soluble, fairly toxic and highly unstable in reducing environments more so than trivalent chromium [Cr(III)] [60]. Beside monitoring aqueous phase concentrations, several passive samplers have been developed to monitor Cr(VI). These include passive capillary samplers, suction cup/zero tension lysimeters and NALGENE® polyethylene diffusion-based passive samplers [61,62]. The complex chemistry of Cr(VI) in groundwater makes interpretation of field-based transport data difficult to understand, implying diffusion-based samplers may have high uncertainties associated with them [63]. Lysimeters and capillary passive samplers are more qualitative than quantitative, as they sample an undefined volume, do not provide flux data and macroporous flow can cause mass transfer issues with the devices [62,64]. Depending on the environmental conditions, the NALGENE® passive sampler may only provide semi-quantitative results, as the equilibrium between the sampler and aqueous phase may never be reached [10]. Box-aquifer tests were previously conducted, and average measurement errors for Cr(VI) mass flux of 12% were measured, suggesting that this permeation-based passive sampler can overcome the limitation of the diffusion-based samplers, as previously described [24]. However, an in-situ PFM field measurement of Cr(VI) has not yet been reported in the literature.
PFMs have been used extensively for the last decade for high-resolution monitoring of both water and contaminant fluxes for long-term monitoring assessment and contaminant source remediation efforts. This high-resolution flux data can be used at field sites to target remedial actions where contaminant fluxes are greatest, potentially resulting in significant cost savings. Expanded application of the PFM technology allows remediation practitioners better tools to characterize sites and to make more informed decisions on the implementation of in-situ remedial strategies.
The PFM technology was expanded and demonstrated in both laboratory studies and in field trials to measure fluxes of RDX, Cr(VI), 1,4-dioxane and in-situ biogeochemistry transformation rates of SO42−. Anionic exchange resin and GAC have been demonstrated to be effective at removing Cr(VI) and RDX, respectively, from water [24,41]. Modified PFMs of alternating layers of different sorbents were deployed at a DOD (Department of Defense) contaminated radionuclide site for post-remedial flux monitoring of Cr(VI) and RDX. The standard and modified versions of the PFM were assessed in laboratory batch and aquifer tests for capture of 1,4-dioxane. The standard version performed well in laboratory studies and was deployed at a chloroethene contaminated site undergoing remediation (confidential sites) to measure 1,4-dioxane mass fluxes. The first application, to the best of our knowledge, of a PFM using anionic exchange resin for measuring both SO42− reduction rates and water fluxes is presented here. Laboratory batch equilibrium studies and column studies were used to assess the sorbent materials ability to uptake SO42−. The PFM was then deployed at Altus Air Force Base (AFB) to monitor biowalls remediation performance for removal of chlorinated solvents by assessing volumetric SO42− consumption rates.
2. Material and Methods
2.1. Passive Flux Meter Technology
The experimental basis, theoretical basis and field performance data validating the PFM have been previously described [14,15,16,17]. Briefly, the PFM is a self-contained, permeable sorbent filled cartridge installed in wells and boreholes that provide simultaneous Jc and qo under ambient hydraulic gradients. The activated carbon serves to intercept and retain dissolved hydrophobic organic contaminants present in groundwater flow through the well. The sorbent material is also impregnated with known amounts of four water-soluble tracers. These tracers are leached from the sorbent at rates proportional to the fluid flux.
After a specified period of exposure to groundwater flow, the PFM is removed from the well screen. Next, the sorbent is extracted to quantify the mass of all organic contaminants intercepted by the PFM and the remaining masses of all resident tracers. The contaminant masses are used to calculate time-averaged contaminant mass fluxes (Cf) or Jc, while residual resident tracer masses are used to calculate time-averaged water flux. Depth variations of fluxes can be measured by vertically segmenting the exposed sorbent at specified depth intervals. Retardation factors for soluble tracer impregnated onto GAC have been described elsewhere [16].
The qo (L3/L2/T) and Jc (M/L2/T) are given by Equations (1) and (2) [15,16,17]:
where r is the radius of the PFM cylinder, θ is the water content in the PFM, R is the retardation factor of the resident water-soluble tracers on the sorbent, MR is the relative mass of resident tracer remaining on the PFM sorbent at a particular well depth, t is the sampling time, mc is the mass of the contaminate sorbed onto the tracer, and b is the length of the sorbent matrix segment.
The PFM flux data can then be used to estimate Cf (M/L3) over the well screen interval (e.g., PFM sorbent section) given by Equation (3) [65]:
where Cf is independent of groundwater fluxes, meaning it is not subject to effects of flow convergence towards or divergence around the PFM. Cf represents a time-averaged contaminant concentration estimate over the deployment period, whereas traditional groundwater sampling techniques yield an instantaneous contaminant concentration that is estimated only at the time the groundwater samples were collected [13,65].
2.2. Sorbent Materials
Numerous sorbents have been created and utilized for the removal of both organic and inorganic compounds from wastewater and groundwater. Silver impregnated coconut-based 12 × 40 mesh GAC (Royal Oak Enterprises, Dunnellon, FL, USA), Amberlite XAD16 (Sigma Aldrich, St. Louis, MO, USA), Amberlite XAD4 (Sigma Aldrich, St. Louis, MO, USA) and Superlite DAX8 (Sigma Aldrich, St. Louis, MO, USA) were investigated as possible sorbent materials for the capture of 1,4-dioxane. Coconut-based GAC was considered because GACs from pecan and walnut shells have shown higher levels of adsorption than other GACs [66,67]. In previous laboratories studies, Amberlite XAD16, Amberlite XAD4 and Superlite DAX8 were proven to be effective at removing aromatic carbon from water and wastewater effluent [66,68,69]. Batch-equilibrium studies were conducted on each sorbent material to determine the adsorption capacity. Those showing promise for the capture of 1,4-dioxane were subjected to column studies and box aquifer tests for further analysis.
GAC has been shown to effectively absorb RDX in column studies, pump and treat systems, and fluidized bed reactors despite its relatively high solubility and low affinity for organic carbon [40,70,71]. However, GAC has a finite adsorption capacity. GAC was only examined for extraction efficiency, since previous literature studies have already proven its effectiveness at adsorption/desorption of RDX.
Both GAC (Royal Oak Enterprises, Dunnellon, FL, USA) and Purolite A300 (BroTech, Philadelphia, PA, USA) were used as sorbent materials in the PFM to remove Cr(VI) from aqueous phase solutions. Cr(VI) occurs in the environment as either chromate (CrO42−) or dichromate (Cr2O72−), which are relatively mobile in soils [72]. GAC has been shown to effectively absorb Cr(VI) in batch-equilibrium studies and ex-situ filtration systems [73,74,75,76,77,78,79]. Purolite A300 has never been tested, to the best of our knowledge, to remove Cr(VI) from aqueous solutions. However, Purolite A300 has been used to effectively remove nitrate (NO3−) from aqueous phase solutions, which has a weaker charge than Cr(VI) species [80,81]. Thus, it is likely that Cr(VI) species may be even more strongly sorbed to Purolite A300. Screening extraction experiments (data not shown) showed recovery of Cr(VI) was possible from both GAC and Purolite A300, which has been described in Extraction and Analytical Procedures section of this paper.
Purolite A300 (BroTech, Philadelphia, PA, USA) and 500A (BroTech, Philadelphia, PA, USA) were assessed for the removal of SO42− from aqueous phase solutions. Purolite A300 was shown in both batch studies and column studies to effectively remove SO42− from aqueous phase solutions, suggesting that it is a good candidate for sorbent selections [82]. Fix-bed experiments assessing the ability of Purolite A500 to remove SO42− from wastewater effluent showed that it had a loading capacity of 25 to 30 mg SO42−/L, making this an excellent candidate for possible use as a sorbent material in the PFM [83]. Both Purolite A300 and A500 underwent batch equilibrium studies to determine adsorption capacity and column loading tests to estimate retardation factors and dynamic sorption capacities. Note, Table S1 in the supplemental section summarizes the resins tested.
2.3. Extraction and Analytical Procedures
The deployment and retrieval of the PFMs and analyses of the silver-impregnated granular activated carbon (SI-GAC) has been previously described [15]. As part of the analysis, a pre-weighed amount of PFM-deployed GAC sample was placed in 10 mL of extraction solution and rotated for 24 h on a Glass-Col Rotator (Glas-Col, Terre Haute, IN, USA). 1,4-dioxane, chlorinated ethenes, ethene and five “resident” tracers [methanol; ethanol; isopropyl alcohol; tert-butyl alcohol; and 2,4-dimethyl-3-pentanol] were extracted with dichloromethane and then analyzed using a gas chromatograph (GC) equipped with a flame ionization detector and an autosampler (Perkin-Elmer, Waltham, MA, USA). Cr(VI) was extracted from sorbent material using 1 M sodium chloride (NaCl) solution and analyzed by UF/IFAS Analytical Service Laboratory (Gainesville, FL) using HPLC/ICP-MS. This extraction technique was found to give Cr(VI) recoveries of 87 ± 5% (data not shown). Cr(VI) and RDX were extracted from sorbent material using acetonitrile and analyzed by a U.S. Department of Energy Laboratory using a high-performance liquid chromatography—ultraviolet detector. This extraction technique was found to give RDX recoveries of 14 ± 2% (data not shown). SO42− was extracted from sorbent material using 1M NaCl solution and was analyzed using ion chromatograph [28].
2.4. Batch Adsorption Isotherms and Recovery
Batch adsorption isotherms were developed for SO42− and 1,4-dioxane using a method described elsewhere [15,24,28,30]. 2 g of Purolite A500 and Purolite A300 were added to 30 mL SO42− solutions ranging from 0 to 8200 mg/L. 0.1 to 10 g of GAC and 0.1 to 5 g of nonionic exchange resin (e.g., Purolite XAD16, Puroloite XAD4, Superlite DAX8) were added to a 1,4-dioxane solution of 1030 mg/L. The mixtures were rotated for a minimum of 24 h and then filtered through a 0.45-μm glass filter. Sorbed contaminants were recovered from the drained resin using extraction solvents and rotated for an additional 24 h. Filtered and sorbent recovery solutions were analyzed using the methods as described in the Extraction and Analytical Procedures section. Note, batch studies were not performed on Cr(VI) and RDX since previously mentioned literature studies showed GAC was a good sorbent for the capture of these materials.
2.5. Column Studies
Column studies were only conducted for SO42− and 1,4-dioxane using Purolite A300 and GAC, respectively [15,24,28,30]. Small glass columns (2.5 cm inner diameter and 5 cm long, Kontes Co., Vineland, NJ, USA) were wet-packed with GAC and Purolite A300. GAC packed columns were then flushed with a contaminant solution consisting of 65 mg/L 1,4-dioxane, 68 mg/L methylene chloride (CH2Cl2), 57 mg/L cis-DCE and 36 mg/L methanol (CH3OH) at a steady solution flow of 1.7 mL/min. CH2Cl2, CH3OH and cis-DCE served as controls for performance assessment and to see how multiple contaminants may impact breakthrough times since 1,4-dioxane is rarely the only contaminant found at chlorinated compound contaminated sites [67]. The Purolite A300 packed column was flushed with 3000 mg/L SO42− solution at a steady solution flow of 0.5 mL/min. Effluent samples were analyzed for contaminants and tracers—as described in the Extraction and Analytical Procedures.
2.6. Bench-Scale Aquifer Testing of 1,4-Dioxane PFM
Bench-scale aquifer model experiments were conducted as previously described [28]. A rectangular stainless-steel box (38 cm × 30.7 cm × 12 cm) was packed with commercial grade sand (Sunniland Corporation, Longwood, FL, USA). One-cylinder PVC well screen (16 cm long, 3.2 cm inner diameter, 4.2 cm outer diameter) was placed upright at the center of the chamber [28]. Teflon tape was placed over the top part of the well screen to minimize loss of 1,4-dioxane and to create a screen well of 10 cm. The water table was set to a height of 10 cm [28]. Coarse gravel was packed at the injection and extraction ends to facilitate uniform flow through the model [28]. A 1-inch layer of bentonite clay was used to cover the sand to minimize contaminant loss from volatilization. A 4-L aspirator bottle (Kimax Co. Vineland, NJ, USA) was used to contain a 1,4-dioxane solution and maintain a constant head [28]. The flushing experiments were conducted with an injection solution of 1.8 mg/L 1,4-dioxane.
The standard PFM was constructed using sewn fabric socks (10 cm long and 3.2 cm inner diameter) filled with GAC. Before packing, the GAC was pre-equilibrated with an aqueous solution of alcohol tracers consisting of methanol, ethanol, isopropyl alcohol (IPA), tert-butyl alcohol (TBA) and 2,4-dimethyl-3-pentanol (2,4-DMP) [15,16,28]. A GAC-filled fabric sock was placed in the PVC packing tube [28]. Mechanical vibration was then used to compact the resin into place. During packing the GAC was subsampled to measure the initial concentrations of resident tracers [28]. The PFM was then slipped into the model aquifer well screen [28]. Upon termination of the experiment the model standard PFM was retrieved, homogenized and then subsampled for 1,4-dioxane and tracer loss analysis, as has been previously described [28]. Six PFMs were constructed and deployed in the model aquifer under flow rates ranging from 2.2 to 18 mL/min.
2.7. Field Studies
2.7.1. RDX and Cr(VI) Measurements
A U.S. Department of Energy nuclear weapons facility (confidential site) has been a storage site for both conventional and nuclear weapons for the last 65 years. Pre-1980’s, industrial waste disposal activates included on-site disposal of high explosive industrial wastewater into unlined ditches. Contaminated groundwater leached into the aquifer below. The aquifer has been contaminated with RDX, octahydro-1,3,5,7-tetranitro-1,3,5,7-tetrazocine (HMX), 2,4,6-trinitrotoluene (TNT), 2,4-dinitrotoluene (2,4-DNT), 1,2-dichloroethane (1,2-DCA), TCE, PCE and Cr(VI). The groundwater is approximately 90 m below the surface, 30 m above an uncontaminated drinking water source and the saturated thickness of the contaminated aquifer is less than 4.5 m. The stated objective of the deployment at this site was to demonstrate the PFM technology and identify where fluxes of contaminants were greatest so future remediation efforts could be targeted to prevent migration of both RDX and Cr(VI) off-site. Of these, considerable attention was focused on the high explosive RDX and Cr(VI) because they were the most widespread and prevalent at the site.
Eight PFMs were installed in wells within, upgradient and downgradient of the treatment zone in both in-situ performance monitoring (ISPM) and in-situ bioremediation (ISB) wells. Each deployed PFM was constructed with alternating segments of GAC and Purolite A300. PFMs 1-5 were installed within the treatment zone, PFM 6 was installed upgradient of the treatment zone and both PFM 7 and 8 were installed downgradient of the treatment zone.
2.7.2. 1,4-Dioxane Measurements
PFMs were deployed at a chlorinated solvent contaminated site being remediated by a U.S. based environmental remediation firm (confidential) that will be referred to as Site 1. Site 1 is a former chemical plant that had been in operation since 1923 but was subsequently decommissioned. Contamination was determined to be from areas where drums, sludge, boiler ash and other wastes were landfilled or buried. At Site 1, PFMs were deployed in February 2013 in 13 wells containing benzene, chloroform flux and carbon tetrachloride.
2.7.3. Sulfate Measurements
PFMs were deployed at biowalls OU-1 and SS017 in Altus Air Force Base, Oklahoma in order to determine volumetric SO42- consumption rates as part of a performance remediation study. Detailed site maps are presented elsewhere [53]. The volumetric SO42− consumption rate was calculated from SO42− flux data using the following equation:
where . is the volumetric SO42− consumption rate, is the SO42− flux in a well upgradient of the biowall, is the SO42− flux in the biowall and is the width of the biowall parallel to groundwater flow.
SS17 site is located in the southwest portion of Altus AFB and contains a VOC plume comprised mostly of TCE and reductive dechlorination products. Groundwater is characterized by high SO42− concentrations ranging from 1000 to 2000 mg/L. The biowall was installed in 2005 and materials used for construction included 42% mulch, 32% sand, 15% gravel and 11% cotton gin waste. The section of the biowall where the PFMs were deployed were spiked with magnetite at the time of construction to increase the iron content from 1600 mg/kg to 120,000 mg/kg to promote biogeochemical reduction of chlorinated ethenes present at the site. Emulsified vegetable oil (EVO) injections occurred in 2008 to promote SO42− reduction so that iron-sulfur clusters could be formed. PFMs were deployed upgradient of the biowall (Well BB04U) and in the wall (Well BB04W). PFMs were deployed in November 2011 and May 2012.
The Operable Unit 1 (OU1) site in the vicinity of a landfill, containing a TCE plume that has SO42− concentrations similar to SS17. The biowall was installed in 2002 and constructed with 50% tree mulch, 10% composted cotton gin waste and 40% river sand. The biowall was amended in 2011 with EVO, lactate, ferrous lactate and hematite. PFMs were deployed in upgradient wells (EPAU108, EPAUMP01, EPAU105) and in wall wells (EPA107, EPA106 and EPA104). PFMs were deployed in May 2011 and October 2011.
3. Results
3.1. RDX and Cr(VI)
PFMs were deployed in September 2016 right after cessation of active bio-stimulation occurred. RDX was only detected in PFM 4 (Figure 1) with an average mass flux of 4.9 mg/m2/day, which equates to a Cf of 174 μg/L. Groundwater samples taken just before deployment of PFM 4 were in good agreement since an RDX concentration of 180 μg/L was measured, which is a 3.4% difference from the PFM Cf value. RDX was not detected in any of the other PFMs deployed, suggesting that the PFM 4 is the only hotspot and may be undergoing degradation prior to leaving the site, since it was not detected in any downgradient samples. Cr(VI) was detected in PFMs 4, 6 and 7, but not in PFMs 1, 2, 3, 5 and 8. The absence of Cr(VI) suggests that it was transformed to Cr(III), an insoluble form of chromium. Average Cr(VI) mass fluxes from PFM 4, 6 and 7, based on recovery of Cr(VI) from Purolite A300, were determined to be 2.3, 2.3 and 2.8 mg/m2/day (Figure 1). Average Cr(VI) mass fluxes from PFMs 4 and 7, based on recovery of Cr(VI) from GAC, were determined to be 1.0 and 0.77 mg/m2/day. Note, no Cr(VI) was detected from GAC samples from PFM 6. Groundwater samples, obtained prior to PFM deployment, were only available for PFM 4 and were determined to be 82 μg/L. PFM Cf values based on Purolite A300 and GAC were 83 and 38 μg/L, respectively, which are 1.2% and 74% differences from groundwater sample data. Thus, Purolite A300 appeared to perform better than GAC at the capture of Cr(VI) in aqueous phase environmental samples. Additionally, this data suggests that Cr(VI) fluxes are relatively stable both within and downgradient of the treatment zone. Thus, more target injections in and around these wells may be needed to stimulate the bacteria necessary to reduce Cr(VI) to an insoluble form.
3.2. 1,4-Dioxane
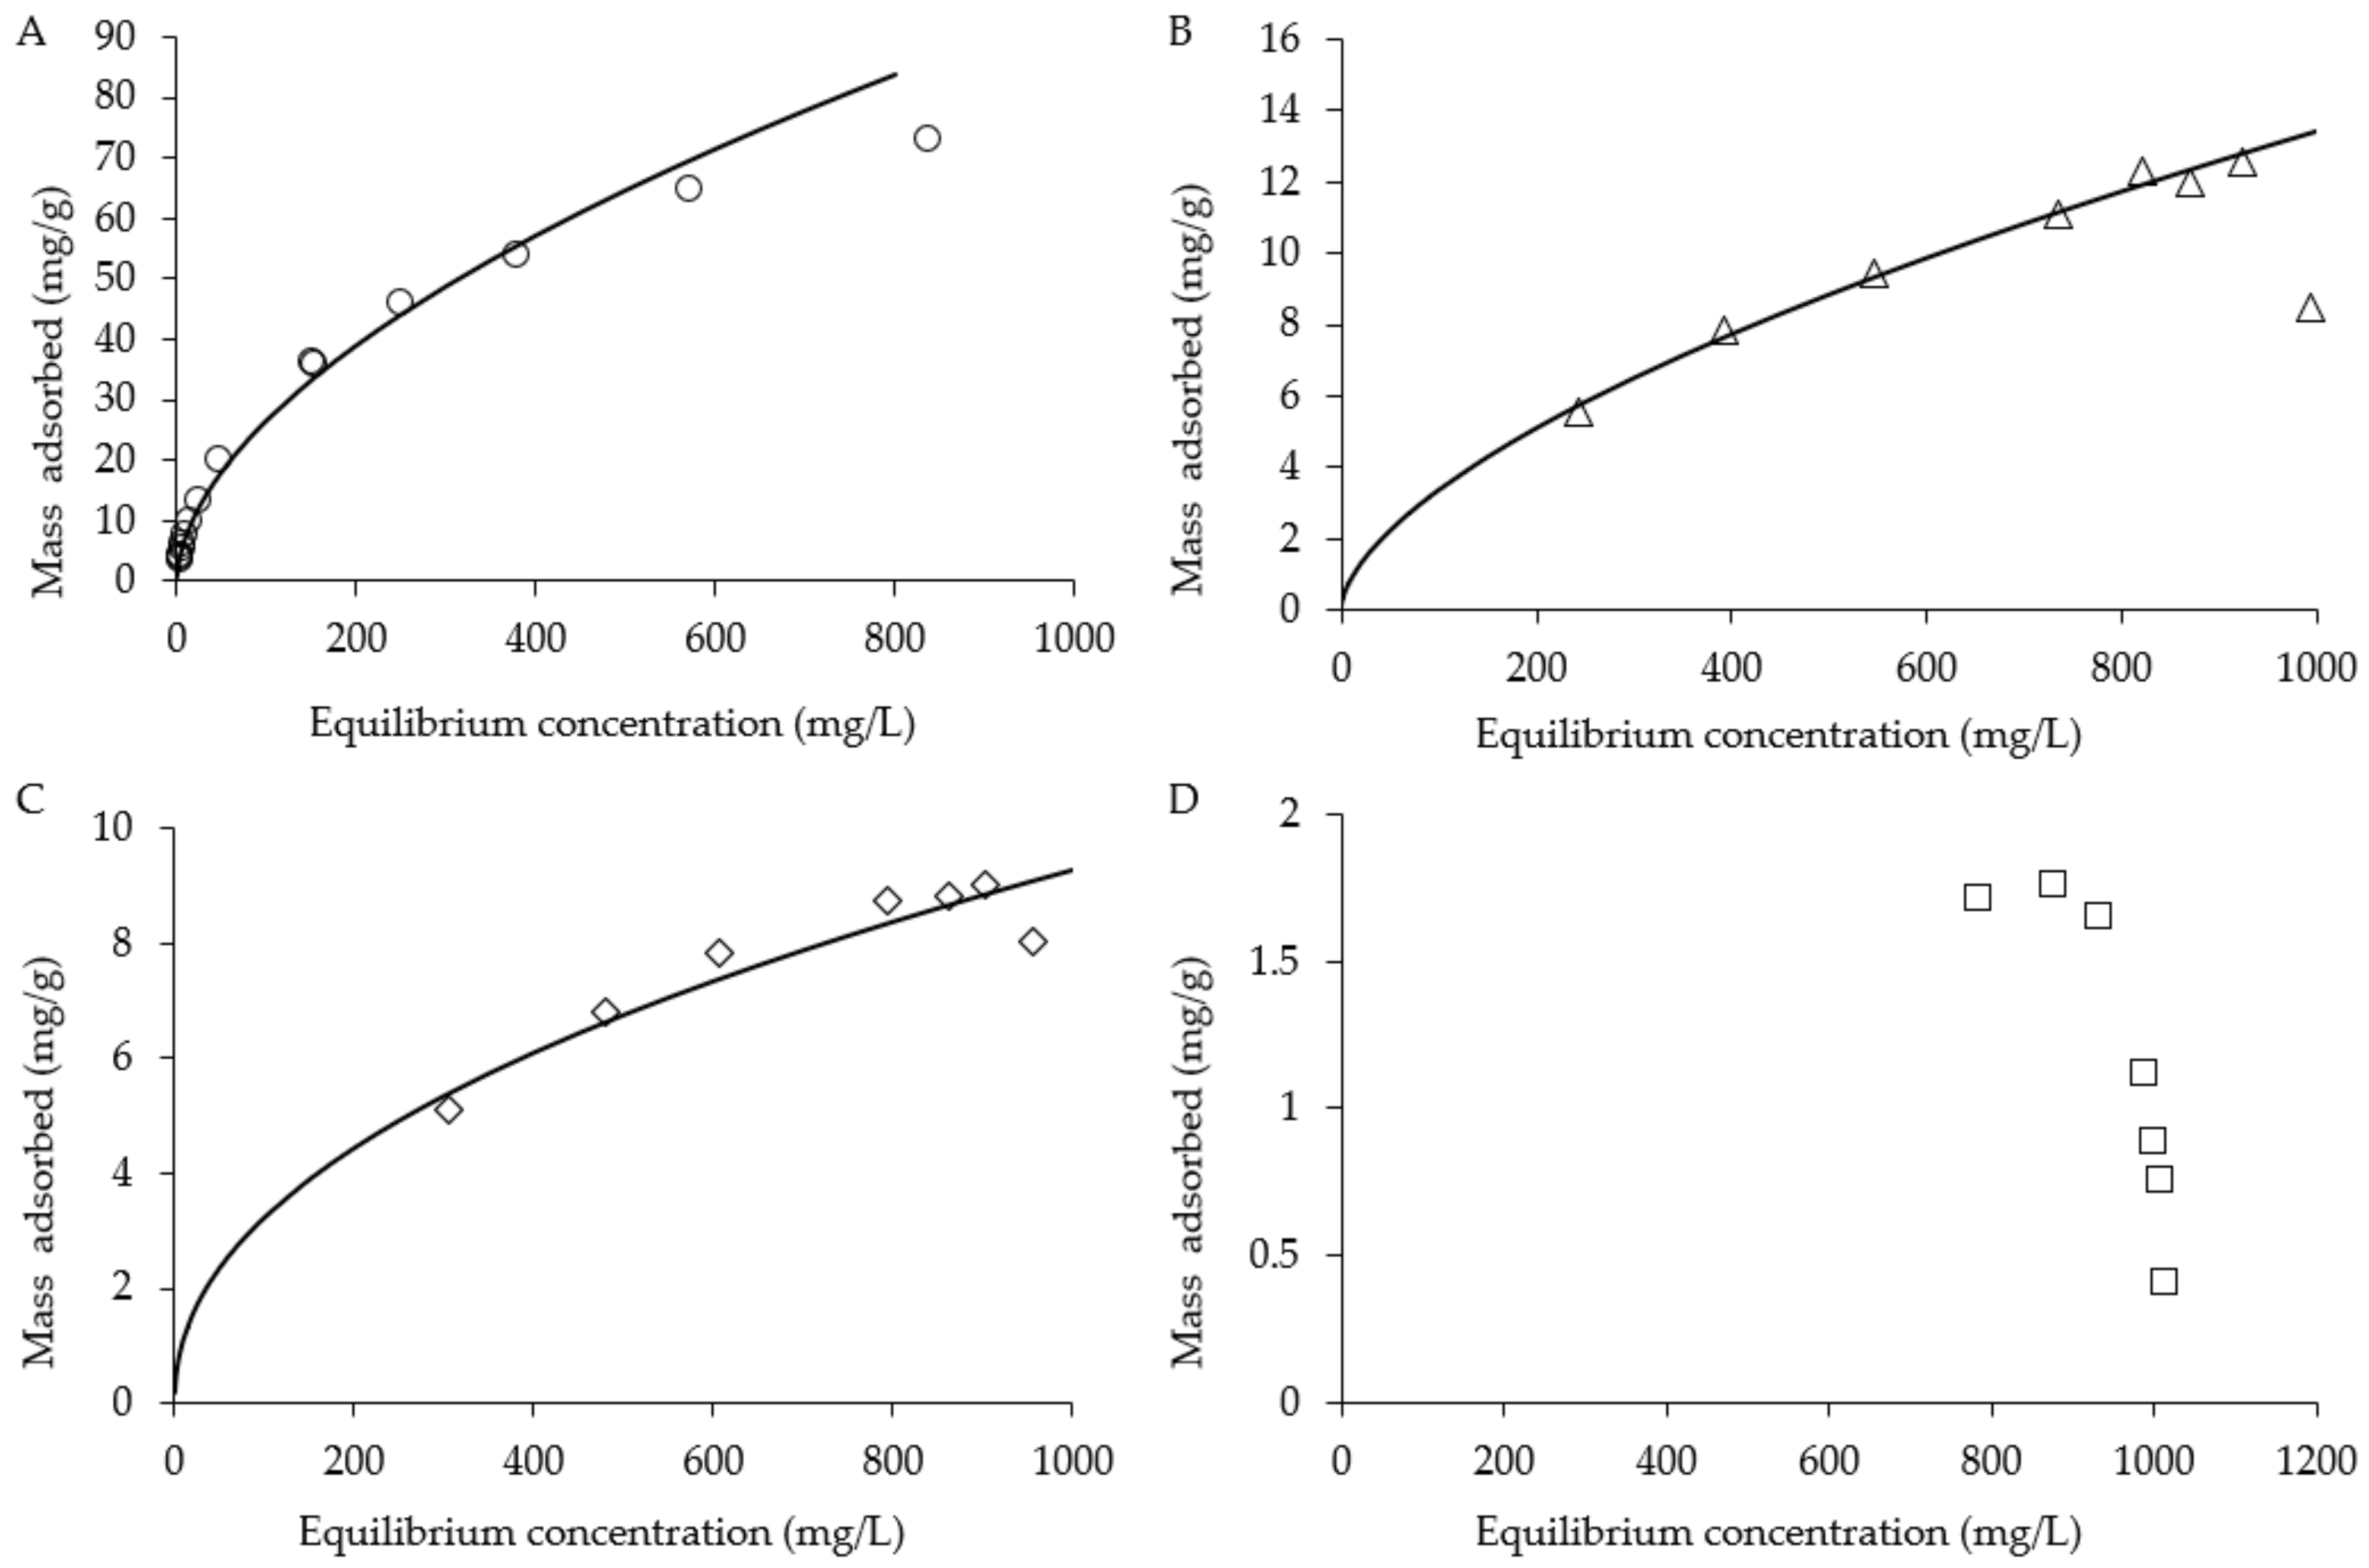
Adsorption capacity and recovery efficiency of GAC, XAD16, XAD2 and DAX8 for 1,4-dioxane were evaluated. Adsorbed 1,4-dioxane mass is shown as a function of the equilibrium aqueous 1,4-dioxane concentration (Figure 2). Adsorption capacity of each sorbent is assessed by fitting data with a Freundlich isotherm model [28,75]:
where Cs (M/L3) is the equilibrium value of SO42− mass adsorbed per unit mass of sorbent, Ce (M/L3) is the equilibrium 1,4-dioxane concentration in the aqueous phase, Kf is the empirical fitting parameters where n > 1. The Freundlich isotherm model fit for GAC was determined to be Kf = 3.15 and n = 2.11, with a Nash-Sutcliffe model efficiency (E) coefficient of 0.99. The Freundlich isotherm model fit for XAD16 was determined to be Kf = 0.50 and n = 2.37 with E = 0.87. The Freundlich isotherm model fit for XAD4 was determined to be Kf = 0.23 and n = 1.7 with E = 0.99. No fit could be determined for DAX8 likely due to a low sorption capacity of the resin for 1,4-dioxane. Further studies using lower concentrations of dioxane are needed to see if an isotherm can be developed for DAX8. The observed sorption capacity for GAC for 1,4-dioxane (73 mg/g at 838 mg/L Ceq) was much higher than the other resins used in these batch tests (8.8 mg/g at 862 mg/L Ceq for XAD16; 12.3 mg/g at 822 mg/L Ceq for XAD4).
The 1,4-dioxane flux measurement using the PFM is based on the cumulative 1,4-dioxane mass retained on the sorbent over the test period. However, other contaminants could potentially interfere with the sorption of 1,4-dioxane to the sorbent material, potentially leading to significant errors in flux estimations [15,24,28,30]. Thus, a multispecies column test was conducted using methanol, 1,4-dioxane, C2H2Cl2, cis-DCE and commonly found contaminants at 1,4-dioxane contaminated sites. The column test was conducted at a steady water flow using GAC as a sorbent material (Figure 3). R values were determined using the following equation [15]:
where mc is the mass retained by the PFM (M), r is the radius of the column (L), b is the thickness of the column (L), ARC is the dimensionless fraction of sorptive matrix containing contaminants, Cf is the flux-averaged concentration of the contaminant of the aqueous phase (M/L3) and θ is the dimensionless volumetric water content of the sorptive matrix. θ for wet-packed GAC was determined to be 0.55. The bulk volume of the wet-pack GAC in the column, equaling πr2bARC, 25.3 cm3. The amount of contaminant per gram of GAC passed through the column at initial breakthrough, 50% breakthrough and 100% breakthrough and R values for each breakthrough are summarized in Table 1. The R values determined from 50% breakthrough for 1,4-dioxane was 57 time higher than that estimated for methanol, two and seven times lower than C2H2Cl2 and cis-DCE, respectively, suggesting GAC is sufficient to retain the 1,4-dioxane over a typical PFM deployment and multiple contaminants in the aqueous phase did not significantly affect the capture of 1,4-dioxane during a typical deployment period. R values determined at initial and 100% breakthroughs showed similar trends. Additionally, the R values calculated on 50% breakthroughs were used to estimate water fluxes from the PFM in the bench-scale aquifer model test discussed below. Note, 50% breakthrough is often the used as a proxy to determine when PFM should be removed when deployed at contaminated sites [15].
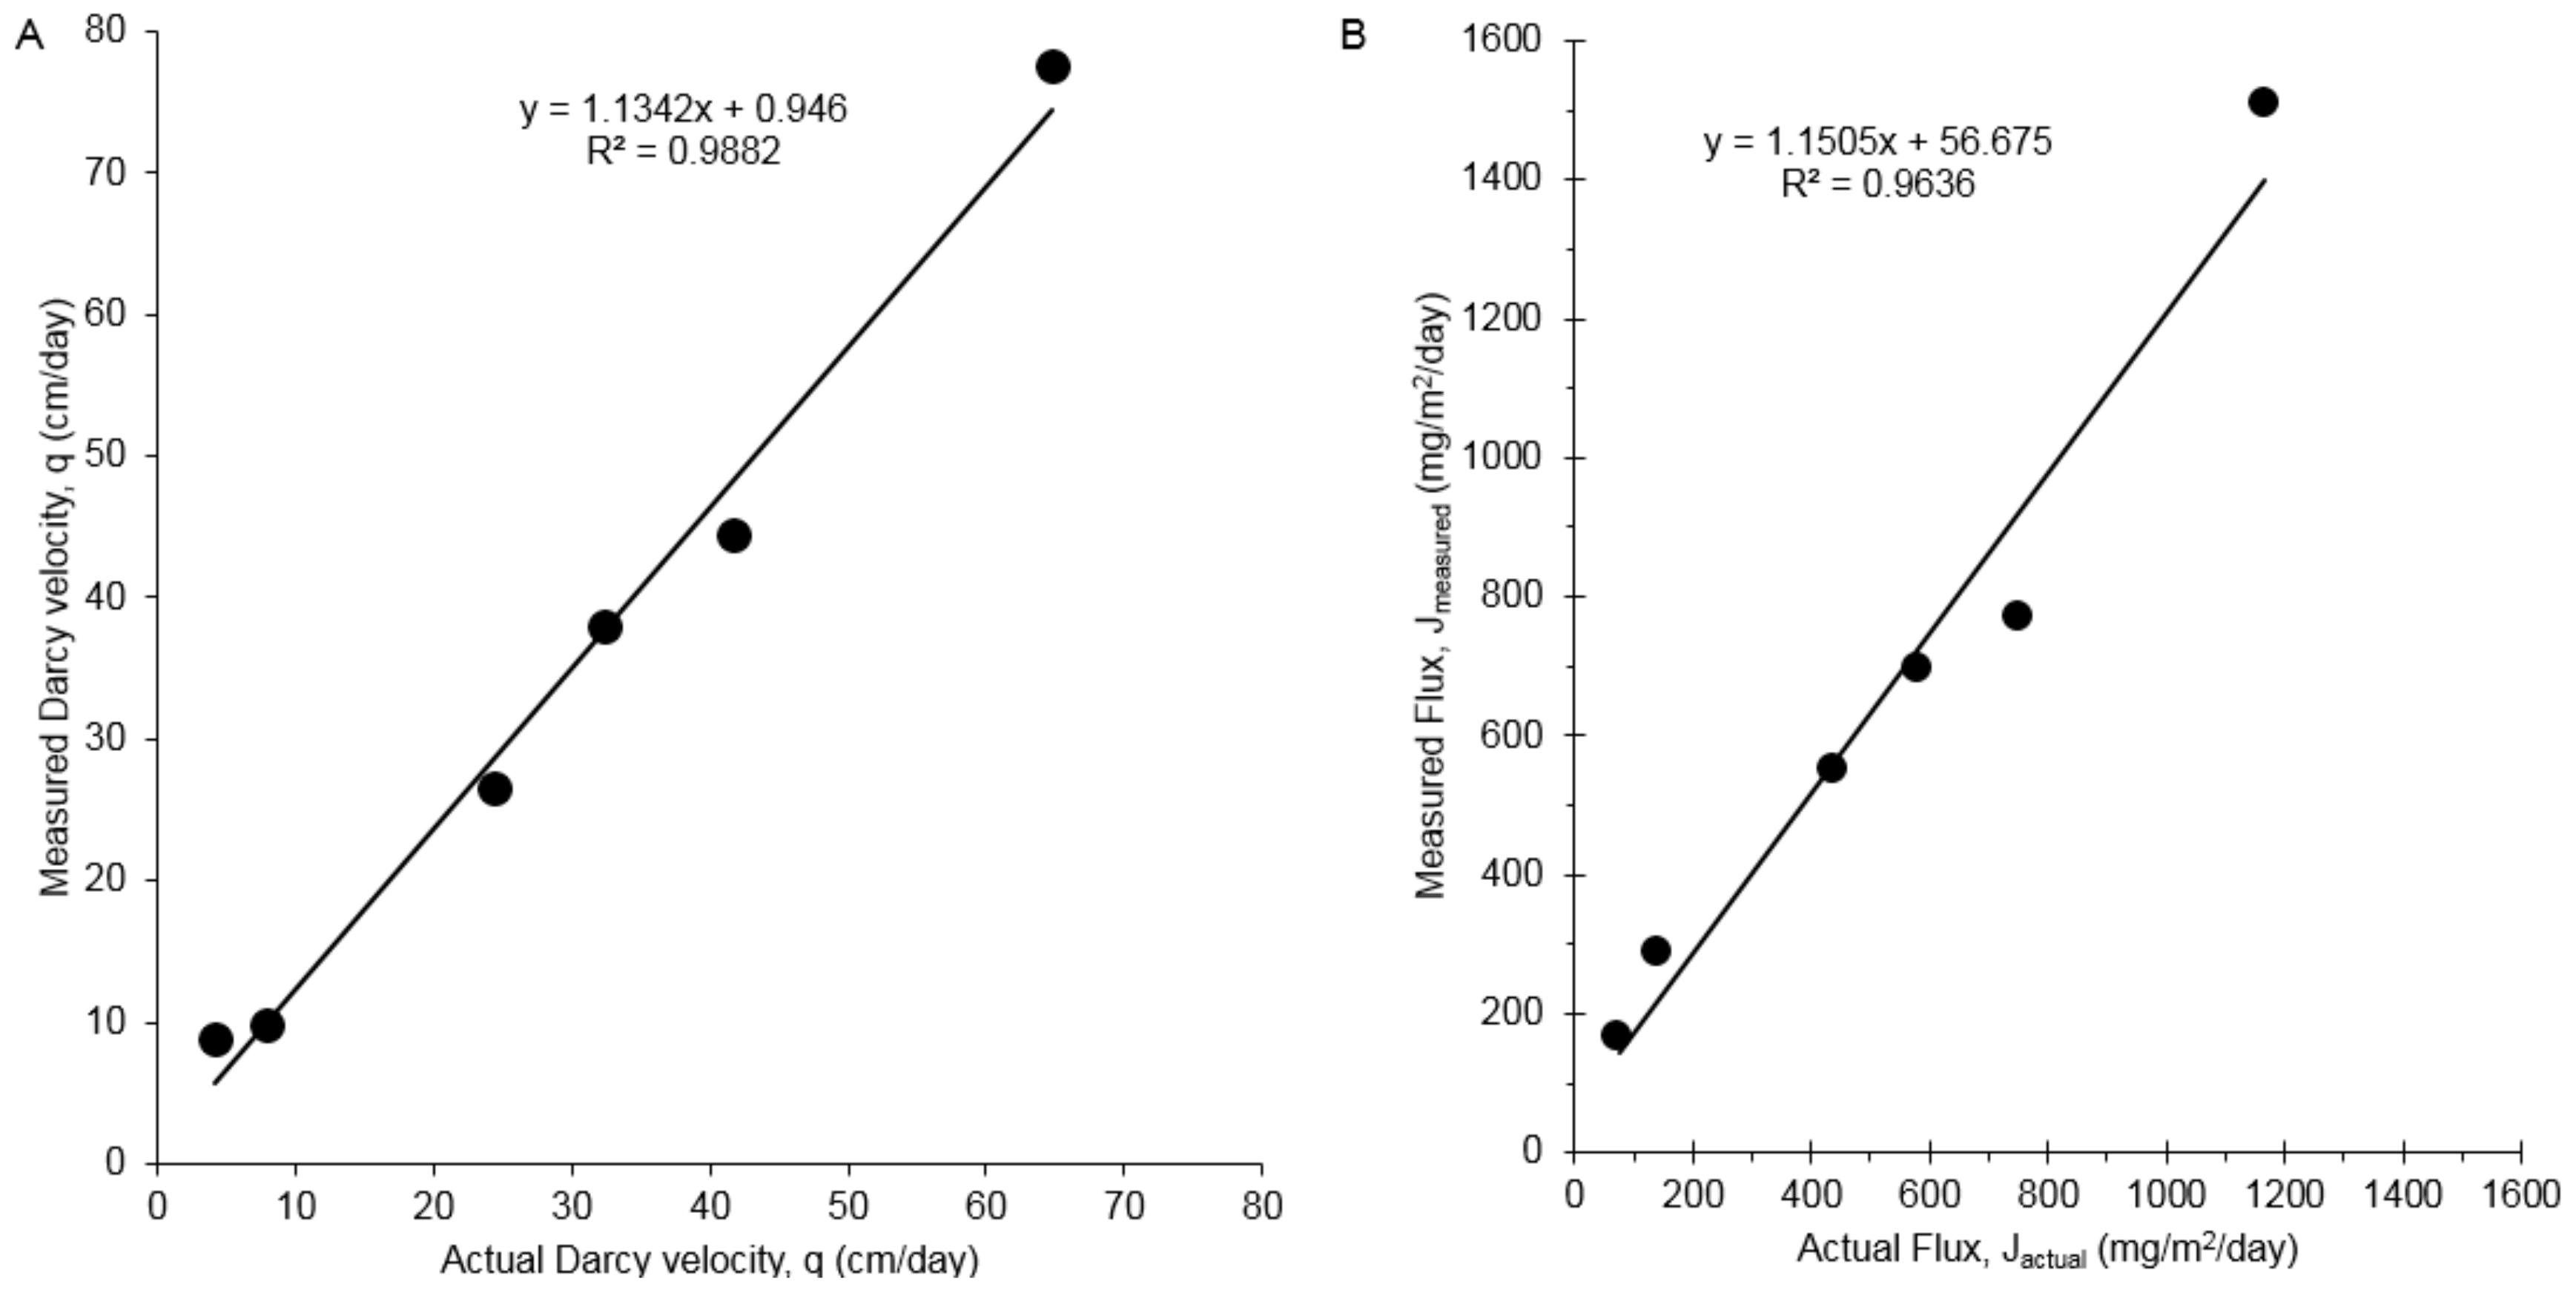
A series of bench-scale aquifer model studies were conducted to evaluate the PFM for measuring simultaneous time-averaged water and 1,4-dioxane fluxes in porous media as previously described [15,28]. Flux-measurements were performed with a PFM deployed in a single screen well during each test. After deployment, PFMs were sampled and data from the resulting samples were averaged and compared with applied water and solute flux as has previously been done [15,28]. Figure 4A provides a comparison of the measured actual versus measured cumulative water flux based on the ethanol tracer. A high correlation (R2 =0.99) between measured and actual fluxes was obtained. Measured water fluxes averaged 6% higher than actual fluxes. Figure 4B compares the measured and true cumulative 1,4-dioxane fluxes. A high correlation (R2 = 0.96) was obtained between measured and true cumulative contaminant fluxes. Measured fluxes averaged 8% greater than actual values.
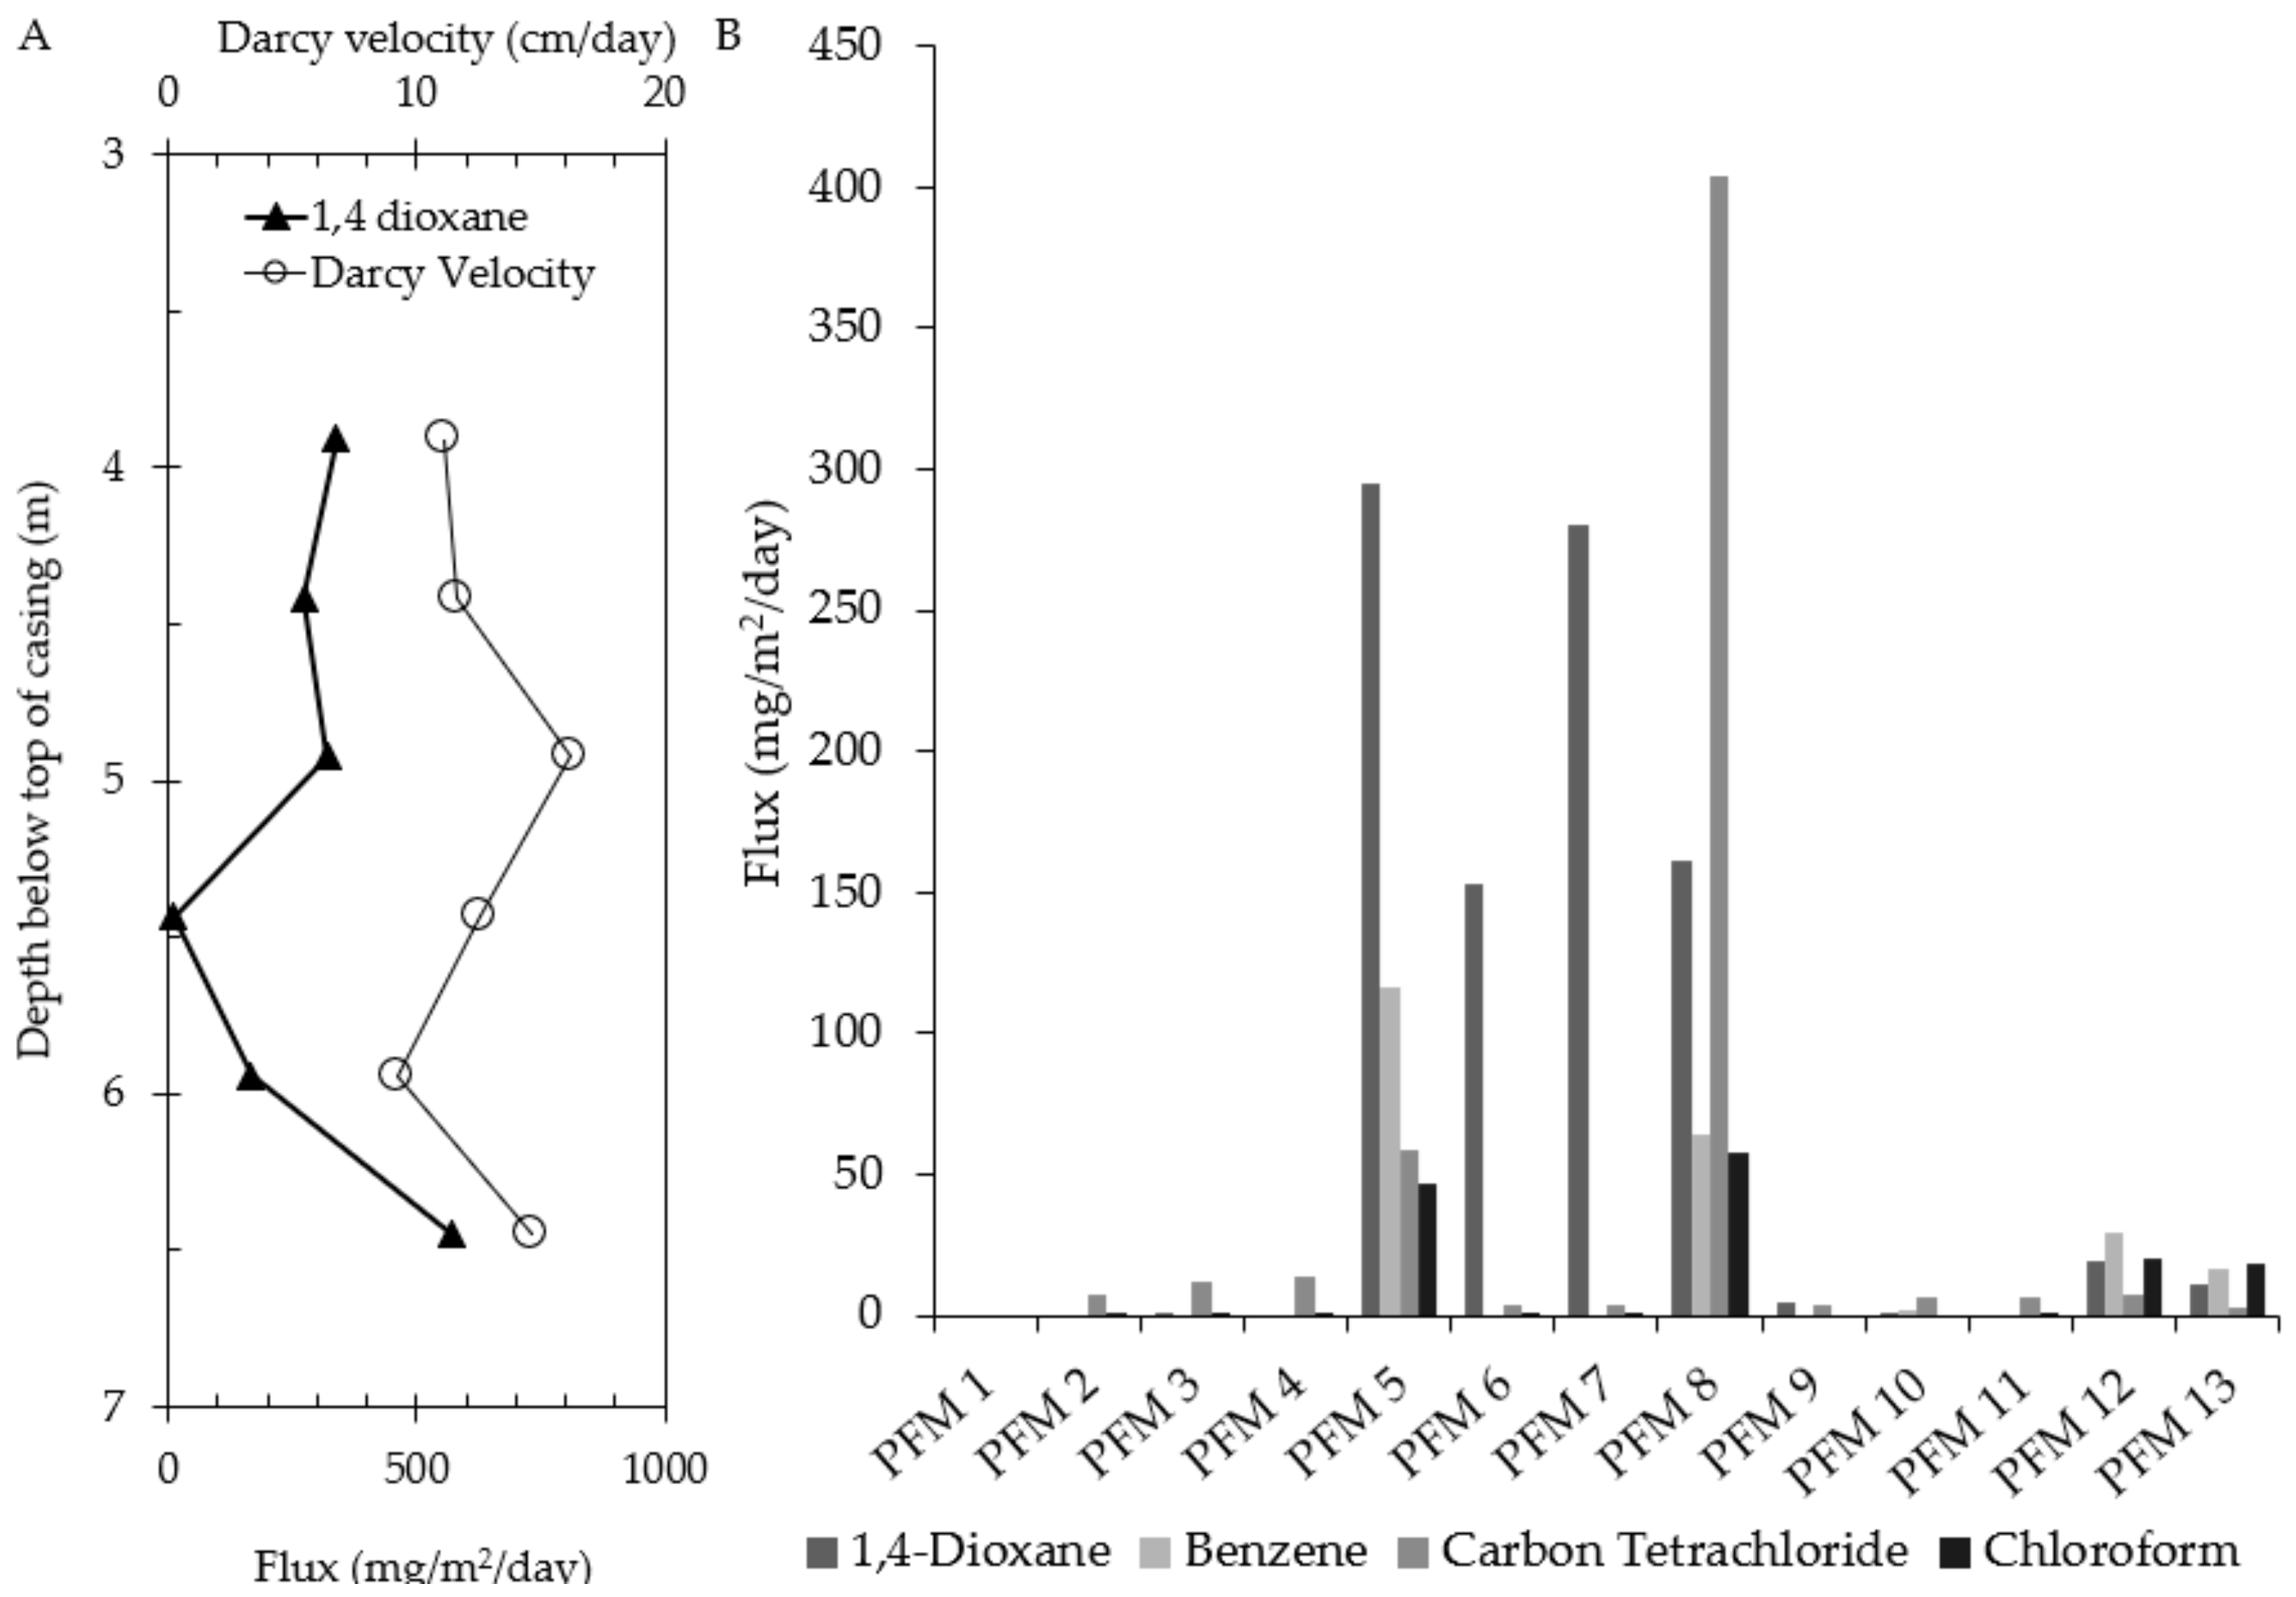
PFMs were deployed at Site 1 in February 2013. 1,4-dioxane was detected in nine of the 13 wells with mass fluxes ranging from 1.2 to 295 mg/m2/day (Figure 5). Figure 5A shows the vertical distribution of 1,4-dioxane mass flux and volumetric water flux. The vertical trends in 1,4-dioxane flux profile tend to agree with the water flux profile, in that as the water flux increases, 1,4-dioxane flux increases. The resulting flux-averaged concentration for PFM 7 was 2195 μg/L. The flux-averaged TCE and cis-DCE concentrations, estimated from the PFM results, were compared with groundwater data obtained in 2013–2014 (Table 2) and estimates ranged from 2 to 133% differences with all Cf values being much greater than traditional groundwater data. Similar comparisons have been made, and Cf estimates are likely to be more representative of in-situ contaminant concentrations than traditional groundwater samples [65]. Chloroform, carbon tetrachloride and benzene were also detected at this site (Figure 5B).
3.3. In-situ Biogenic SO42− Reduction Rates
Equilibrium batch studies were conducted using Puroline A500 and Purolite A300 (Figure 6). Adsorption capacity of each sorbent is assessed by fitting data with a Freundlich isotherm model as was previously described and done for 1,4-dioxane [28,75]. The Freundlich isotherm model fit for the Purolite A500 were Kf = 7.65, n =5.31 and the Nash-Sutcliffe model efficiency coefficient (E) = 0.98. The Freundlich isotherm model fit for the Purolite A500 acid form were Kf = 7.10, n =5.1 and E = 0.97. Based on this data, Purolite A300 was used in column studies.
To assess the performance of Purolite A300 under dynamic conditions, a 1D column test was conducted. The column elution experiment generated concentration data as a function of column pore volumes (PV) of eluted solution (Figure 7). The R values at initial breakthrough, 50% breakthrough, and 100% breakthrough were determined (Table 3). These retardation values were estimated to range from 15 to 37, suggesting Purolite A300 is sufficient to entrap sulfate during the typical deployment of a PFM.
PFMs were constructed and deployed at Altus AFB. They were packed with alternating individual segments of Ag-GAC impregnated with water-soluble tracers and Purolite A300. The reason for the alternating layers was to test the individual capability of Purolite A300 to capture SO42− under field conditions. GAC data was used to estimate groundwater flux. The PFMs were deployed at Altus AFB for about 2–3 weeks between 2011 and 2012 to monitor biowall performance at two chloroethene contaminated sites. The individual PFM profiles were too numerous to display, but Figure 8 shows the vertical distribution of SO42− mass flux and volumetric water flux. Greater water flux results were observed with higher SO42- fluxes. This data suggests that contaminant fluxes varied during sampling, suggesting that seasonal effects (e.g., rainfall) likely caused increases and decreases of SO42− flux at the site. However, this data show that SO42− mass fluxes can be measured in-situ. This data were used to calculate volumetric SO42− reduction rates as a performance measure of the biowall as an ongoing remediation project at Altus Air Force Base.
Figure 9 presents the relationships among VOC removal, sulfide generation and SO42− consumption in the four biowall sections, as previously described. Sulfide concentrations in the SS17 biowall were less than 10 mg/L (Figure 9A). Sulfide concentrations in the OU1 biowall sections prior to amendment varied between 90 (organic-amended section) and 260 mg/L (organic/iron-amended section). Sulfide concentrations in the OU1 unamended biowall section remained elevated, ranging from 140 to 200 mg/L. However, sulfide concentrations decreased in the OU1 amended biowall sections. Sulfide concentrations in the OU1 organic-amended and organic/iron-amended biowall sections decreased to minimum values of 13 and 1.6 mg/L, respectively (data not shown). Percent total molar VOC removal was high in the SS17 biowall section throughout the study, demonstrated no discernible trends and ranged from 93 to 100% (Figure 9B). VOC removal in the OU1 organic/iron-amended biowall section was also high with VOC increasing from 90−93% to 97−98%. VOC removals were initially low in the OU1 organic amended biowall but increased simultaneously with the decrease in sulfide concentrations. VOC removals were low in the OU1 unamended biowall section, which had consistently high sulfide concentrations. This data demonstrates a relationship between high sulfide concentration and an inhibition of VOC removal. This data also indicates that OU1 biowall amendment reduced sulfide concentrations, which facilitated VOC removal.
An unexpected observation is the high sulfide in the OU1 organic/iron-amended biowall section prior to amendment (260 mg/L) and the lack of significant inhibition of biotic reductive dechlorination (total VOC removal was 90 to 93%). A possible explanation is that biogeochemical transformation was occurring at a greater rate in this section relative to the other OU1 biowall sections prior to amendment. Nevertheless, amendment with organic/iron led to improved performance with respect to total VOC destruction, which increased from 97 to 98%.
The use of passive flux meters demonstrated that volumetric SO42− consumption in the biowalls was lower in the OU1 unamended biowall section relative to the other biowall sections (Figure 9C). This lower consumption rate correlated with lower VOC removal (Figure 9D). Electron donor limitation may partially explain the lower VOC removal. However, sulfide generation was still high in the unamended biowall, suggesting that a lack of electron donor was not completely limiting biological activity. While volumetric SO42− consumption was lower in the OU1 unamended biowall section, it was not sufficiently low to preclude the observed generation of high sulfide concentrations. Thus, a combination of high sulfide concentrations and lower volumetric SO42− consumption prevented biogeochemical transformation, complete biotic reductive dechlorination and complete VOC removal in the OU1 unamended biowall section.
4. Discussion
This work, based on the results obtained from Cr(VI) and RDX standard PFMs deployed in the field, confirms the laboratory results for measuring Cr(VI) flux [24]. The field deployment of this PFM was able to sorb both RDX and Cr(VI) onto GAC, suggesting that competitive sorption does not undermine the ability of the PFM to capture and retain low partitioning target contaminants. Because RDX is an explosive and should not be allowed to accumulate to large quantities, caution must be taken during measurement. This work is preliminary for RDX, as more work is needed to understand the sorption mechanism under different pH and geochemical conditions. Additionally, flux-averaged concentrations should be compared with aqueous phase concentrations to validate the measurement of the PFM. This demonstrates that explosive and inorganic compounds can be detected using the standard PFM.
The laboratory experiments and the field demonstrations showed that the PFM can effectively measure both water and 1,4-dioxane contaminant mass fluxes. This data suggests that other low partitioning compounds such as perfluorooctanesulfonic acid or ibuprofen could be better tracked in groundwater systems. Since 1,4-dioxane is predominantly associated with dilute plumes that are often detached from the original source zone, measurement of the flux distribution within the aquifer could become an early detection system of further contamination and would allow for the better identification of source zones in upgradient wells where 1,4-dioxane has been detected. Additionally, being able to detect 1,4-dioxane downgradient will give remediation practitioners sufficient time to design and implement a remediation strategy to either mitigate or contain contaminants upgradient from spreading any further.
The biowalls at Altus AFB SS17 and OU1 provided a unique opportunity to evaluate monitoring tools for biogeochemical transformation. The SS17 biowall was demonstrated to be functioning with a biogeochemical transformation pattern based on a consistently high total molar VOC destruction without accumulation of reductive dechlorination and with a high SO42− consumption rate, as determined by the passive flux meters. These results contrast with the low total molar VOC destruction observed in the unamended OU1 biowall section. Unlike the SS17 biowall, this biowall section had very low volumetric SO42− consumption rates. High dissolved sulfide concentrations also probably inhibited complete biotic reductive dechlorination of TCE to ethene. Thus, high dissolved sulfide concentration was an important indicator of ineffective biotic and biogeochemical transformation processes of VOC destruction. Injection of organics into the organic-amended OU1 biowall section resulted in activation of passivated iron oxides as shown by decreased dissolved sulfide concentrations, even though volumetric SO42− consumption rates were high.
The PFM was demonstrated in the field to measure both water fluxes and biogeochemical transformation rates in porous media. Passive flux meters have the potential to fill the gap in measuring biogeochemical transformation rates of other electron acceptors in groundwater remediation systems. Quantifying biogeochemical transformation rates in groundwater systems is an essential step to further evaluating remediation performance. In the future, biogeochemical transportation rates, as obtained by the PFM, have the possibility of being incorporated into a transport model to understand geochemical cycling in some systems. We anticipate further improvement in, and increased use of, passive flux meter approaches to advance conceptual models of biogeochemical cycling in groundwater systems undergoing active remediation. We demonstrated modifications which extended the PFM application from mass flux measurement to measurement of biogeochemical rates. Further applications will likely focus on the measuring of other biogeochemical transformation rates such as Fe-reduction. Ultimately, this approach will allow for determination of bulk in-situ degradation rates, potentially allowing practitioners to estimate the effectiveness of active remediation and possibly closure of the contaminated site could occur.
Supplementary Materials
The following are available online at https://www.mdpi.com/2073-4441/10/10/1335/s1.
Author Contributions
M.D.A. was responsible for obtaining funding, designing experiments and aided in writing the manuscript. M.S.T. conducted 1,4-dioxane column and batch shake test on 1,4-dioxane. P.J.E. deployed PFMs for sulfate analysis and interpret sulfate-based field data. J.C. was responsible for building PFMs for deployment, conducting sulfate batch studies, conducting 1D sulfate column test and measuring contaminants. A.A.H. was responsible for analyzing/interpreting data and preparing the manuscript for publication.
Funding
This study was funded by the U.S. Air Force Civil Engineering Center (AFCEC), the Department of Defense Strategic Environmental Research and Development Program (SERP) project ER-2304, the Naval Facilities Engineering and Expeditionary Warfare Center (NACFAC EXWC) and the United States Environmental Protection Program. This paper has not been subjected to peer review within these agencies or companies and the conclusions stated here do not necessarily reflect the official views of these agencies or companies, nor does this document constitute an official endorsement by these agencies or companies.
Acknowledgments
Technical support was provided by CDM Smith and EnviroFLUX. The authors thank the anonymous reviewers for their feedback.
Conflicts of Interest
The authors declare no conflict of interest. The founding sponsors had no role in the design of the study; in the collection, analyses, or interpretation of data; in the writing of the manuscript and in the decision to publish the results.
References
- Rao, P.S.C.; Jawitz, J.W.; Enfield, C.G.; Falta, R.W.; Annable, M.D.; Wood, A.L. Technology Integration for Contaminated Site Remediation: Clean-Up Goals and Performance Criteria. In Groundwater Quality: Natural and Enhanced Restoration of Groundwater Pollution; International Association of Hydrological Sciences: Sheffield, UK, 2002; Volume 571–578, Available online: http://hydrologie.org/redbooks/a275/iahs_275_571.pdf (accessed on 16 September 2018).
- Verreydt, G.; Bronders, J.; Van Keer, I.; Diels, L.; Vanderauwera, P. Passive samplers for monitoring vocs in groundwater and the prospects related to mass flux measurements. Ground Water Monit. Remed. 2010, 30, 114–126. [Google Scholar] [CrossRef]
- Martin, H.; Piepenbrink, M.; Grathwohl, P. Ceramic dosimeters for time-integrated contaminant monitoring. J Process Anal. Chem. 2001, 6, 68–73. [Google Scholar]
- Vroblesky, D.A.; Campbell, T.R. Equilibration times, compound selectivity, and stability of diffusion samplers for collection of ground-water VOC concentrations. Adv. Environ. Res. 2001, 5, 1–12. [Google Scholar] [CrossRef]
- Harter, T.; Talozi, S. Evaluation of a simple, inexpensive dialysis sampler for small diameter monitoring wells. Ground Water Monit. Remed. 2004, 24, 97–105. [Google Scholar] [CrossRef]
- Jalalizadeh, M.; Ghosh, U. In situ passive sampling of sediment porewater enhanced by periodic vibration. Environ. Sci. Technol. 2016, 50, 8741–8749. [Google Scholar] [CrossRef] [PubMed]
- Webster, I.T.; Teasdale, P.R.; Grigg, N.J. Theoretical and experimental analysis of peeper equilibration dynamics. Environ. Sci. Technol. 1998, 32, 1727–1733. [Google Scholar] [CrossRef]
- Vrana, B.; Mills, G.A.; Dominiak, E.; Greenwood, R. Calibration of the chemcatcher passive sampler for the monitoring of priority organic pollutants in water. Environ. Pollut. 2006, 142, 333–343. [Google Scholar] [CrossRef] [PubMed]
- De Jonge, H.; Rothenberg, G. New device and method for flux-proportional sampling of mobile solutes in soil and groundwater. Environ. Sci. Technol. 2005, 39, 274–282. [Google Scholar] [CrossRef] [PubMed]
- Jalalizadeh, M.; Ghosh, U. Analysis of measurement errors in passive sampling of porewater PCB concentrations under static and periodically vibrated conditions. Environ. Sci. Technol. 2017, 51, 7018–7027. [Google Scholar] [CrossRef] [PubMed]
- Lohmann, R. Critical review of low-density polyethylene’s partitioning and diffusion coefficients for trace organic contaminants and implications for its use as a passive sampler. Environ. Sci. Technol. 2015, 49, 3985. [Google Scholar] [CrossRef] [PubMed]
- Apell, J.N.; Gschwend, P.M. Validating the use of performance reference compounds in passive samplers to assess porewater concentrations in sediment beds. Environ. Sci. Technol. 2014, 48, 10301–10307. [Google Scholar] [CrossRef] [PubMed]
- Basu, N.B.; Suresh, P.; Rao, C.; Poyer, I.C.; Nandy, S.; Mallavarapu, M.; Naidu, R.; Davis, G.B.; Patterson, B.M.; Annable, M.D.; et al. Integration of traditional and innovative characterization techniques for flux-based assessment of dense non-aqueous phase liquid (DNAPL) sites. J. Contam. Hydrol. 2009, 105, 161–172. [Google Scholar] [CrossRef] [PubMed]
- Brooks, M.C.; Wood, A.L.; Annable, M.D.; Hatfield, K.; Cho, J.; Holbert, C.; Rao, R.S.C.; Enfield, C.G.; Lynch, K.; Smith, R.E. Changes in contaminant mass discharge from dnapl source mass depletion: Evaluation at two field sites. J. Contam. Hydrol. 2008, 102, 140–153. [Google Scholar] [CrossRef] [PubMed]
- Hatfield, K.; Annable, M.; Cho, J.H.; Rao, P.S.C.; Klammler, H. A direct passive method for measuring water and contaminant fluxes in porous media. J. Contam. Hydrol. 2004, 75, 155–181. [Google Scholar] [CrossRef] [PubMed]
- Annable, M.D.; Hatfield, K.; Cho, J.; Klammler, H.; Parker, B.L.; Cherry, J.A.; Rao, P.S.C. Field-scale evaluation of the passive flux meter for simultaneous measurement of groundwater and contaminant fluxes. Environ. Sci. Technol. 2005, 39, 7194–7201. [Google Scholar] [CrossRef] [PubMed]
- Klammler, H.; Hatfield, K.; Annable, M.D. Concepts for measuring horizontal groundwater flow directions using the passive flux meter. Adv. Water Resour. 2007, 30, 984–997. [Google Scholar] [CrossRef]
- Klammler, H.; Hatfield, K.; da Luz, J.A.G.; Annable, M.D.; Newman, M.; Cho, J.; Peacock, A.; Stucker, V.; Ranville, J.; Cabaniss, S.A.; et al. Contaminant discharge and uncertainty estimates from passive flux meter measurements. Water Resour. Res. 2012, 48, 19. [Google Scholar] [CrossRef]
- Padowski, J.C.; Rothfus, E.A.; Jawitz, J.W.; Klammler, H.; Hatfield, K.; Annable, M.D. Effect of passive surface water flux meter design on water and solute mass flux estimates. J. Hydrol. Eng. 2009, 14, 1334–1342. [Google Scholar] [CrossRef]
- Layton, L.; Klammler, H.; Hatfield, K.; Cho, J.; Newman, M.A.; Annable, M.D. Development of a passive sensor for measuring vertical cumulative water and solute mass fluxes in lake sediments and streambeds. Adv. Water Resour. 2017, 105, 1–12. [Google Scholar] [CrossRef]
- Klammler, H.; Hatfield, K.; Newman, M.A.; Cho, J.; Annable, M.D.; Parker, B.L.; Cherry, J.A.; Perminova, I. A new device for characterizing fracture networks and measuring groundwater and contaminant fluxes in fractured rock aquifers. Water Resour. Res. 2016, 52, 5400–5420. [Google Scholar] [CrossRef]
- Kunz, J.V.; Annable, M.D.; Cho, J.; von Tumpling, W.; Hatfield, K.; Rao, S.; Borchardt, D.; Rode, M. Quantifying nutrient fluxes with a new hyporheic passive flux meter (HPFM). Biogeosciences 2017, 14, 631–649. [Google Scholar] [CrossRef]
- Lee, J.; Rao, P.S.C.; Poyer, I.C.; Toole, R.M.; Annable, M.D.; Hatfield, K. Oxyanion flux characterization using passive flux meters: Development and field testing of surfactant-modified granular activated carbon. J. Contam. Hydrol. 2007, 92, 208–229. [Google Scholar] [CrossRef] [PubMed]
- Campbell, T.J.; Hatfield, K.; Klammler, H.; Annable, M.D.; Rao, P.S.C. Magnitude and directional measures of water and Cr(VI) fluxes by passive flux meter. Environ. Sci. Technol. 2006, 40, 6392–6397. [Google Scholar] [CrossRef] [PubMed]
- Verreydt, G.; Annable, M.D.; Kaskassian, S.; Van Keer, I.; Bronders, J.; Diels, L.; Vanderauwera, P. Field demonstration and evaluation of the passive flux meter on a CAH groundwater plume. Environ. Sci. Pollut. Res. 2013, 20, 4621–4634. [Google Scholar] [CrossRef] [PubMed]
- Johnston, C.D.; Davis, G.B.; Bastow, T.P.; Woodbury, R.J.; Rao, P.S.C.; Annable, M.D.; Rhodes, S. Mass discharge assessment at a brominated DNAPL site: Effects of known DNAPL source mass removal. J. Contam. Hydrol. 2014, 164, 100–113. [Google Scholar] [CrossRef] [PubMed]
- Clark, C.J.; Hatfield, K.; Annable, M.D.; Gupta, P.; Chirenje, T. Estimation of arsenic contamination in groundwater by the passive flux meter. Environ. Forensics 2005, 6, 77–82. [Google Scholar] [CrossRef]
- Cho, J.Y.; Annable, M.D.; Jawitz, J.W.; Hatfield, K. Passive flux meter measurement of water and nutrient flux in saturated porous media: Bench-scale laboratory tests. J. Environ. Qual. 2007, 36, 1266–1272. [Google Scholar] [CrossRef] [PubMed]
- Kunz, J.V.; Annable, M.D.; Rao, S.; Rode, M.; Borchardt, D. Hyporheic passive flux meters reveal inverse vertical zonation and high seasonality of nitrogen processing in an anthropogenically modified stream (Holtemme, Germany). Water Resour. Res. 2017, 53, 10155–10172. [Google Scholar] [CrossRef]
- Stucker, V.; Ranville, J.; Newman, M.; Peacock, A.; Cho, J.; Hatfield, K. Evaluation and application of anion exchange resins to measure groundwater uranium flux at a former uranium mill site. Water Res. 2011, 45, 4866–4876. [Google Scholar] [CrossRef] [PubMed]
- Zenker, M.J.; Borden, R.C.; Barlaz, M.A. Occurrence and treatment of 1,4-dioxane in aqueous environments. Environ. Eng. Sci. 2003, 20, 423–432. [Google Scholar] [CrossRef]
- Zhang, S.; Gedalanga, P.B.; Mahendra, S. Advances in bioremediation of 1,4-dioxane-contaminated waters. J. Environ. Manag. 2017, 204, 765–774. [Google Scholar] [CrossRef] [PubMed]
- Alvarez, P.J.J.; Illman, W.A. Bioremediation and Natural Attenuation; John Wiley & Sons, Inc.: Hoboken, NJ, USA, 2006. [Google Scholar]
- Howard, P. Handbook of Environmental Fate and Exposure Data for Organic Chemicals; Lewis Publishers, Inc.: Chelsea, MI, USA, 1990. [Google Scholar]
- ITRC. Protocol for Use of Five Passive Sampler to Sample for a Variety of Contaminants in Groundwater; ITRC: Washington, DC, USA, 2007.
- Paquet, L.; Monteil-Rivera, F.; Hatzinger, P.B.; Fuller, M.E.; Hawari, J. Analysis of the key intermediates of RDX (hexahydro-1,3,5-trinitro-1,3,5-triazine) in groundwater: Occurrence, stability and preservation. J. Environ. Monit. 2011, 13, 2304–2311. [Google Scholar] [CrossRef] [PubMed]
- Lynch, J.C.; Myers, K.F.; Brannon, J.M.; Delfino, J.J. Effects of pH and temperature on the aqueous solubility and dissolution rate of 2,4,6-trinitrotoluene (TNT), hexahydro-1,3,5-trinitro-1,3,5-triazine (RDX), and octahydro-1,3,5,7-tetranitro-1,3,5,7-tetrazocine (HMX). J. Chem. Eng. Data 2001, 46, 1549–1555. [Google Scholar] [CrossRef]
- Pascoe, G.A.; Kroeger, K.; Leisle, D.; Feldpausch, R.J. Munition constituents: Preliminary sediment screening criteria for the protection of marine benthic invertebrates. Chemosphere 2010, 81, 807–816. [Google Scholar] [CrossRef] [PubMed] [Green Version]
- Zhang, B.H.; Smith, P.N.; Anderson, T.A. Evaluating the bioavailability of explosive metabolites, hexahydro-1-nitroso-3,5-dinitro-1,3,5-triazine (MNX) and hexahydro-1,3,5-trinitroso-1,3,5-triazine (TNX), in soils using passive sampling devices. J. Chromatogr. A 2006, 1101, 38–45. [Google Scholar] [CrossRef] [PubMed]
- Rosen, G.; Wild, B.; George, R.D.; Belden, J.B.; Lotufo, G.R. Optimization and field demonstration of a passive sampling technology for monitoring conventional munition constituents in aquatic environments. Mar. Technol. Soc. J. 2016, 50, 23–32. [Google Scholar] [CrossRef]
- Morley, M.C.; Henke, J.L.; Speitel, G.E. Adsorption of rdx and hmx in rapid small-scale column tests: Implications for full-scale adsorbers. J. Environ. Eng.-ASCE 2005, 131, 29–37. [Google Scholar] [CrossRef]
- Heilmann, H.M.; Wiesmann, U.; Stenstrom, M.K. Kinetics of the alkaline hydrolysis of high explosives RDX and HMX in aqueous solution and adsorbed to activated carbon. Environ. Sci. Technol. 1996, 30, 1485–1492. [Google Scholar] [CrossRef]
- Millerick, K.; Drew, S.R.; Finneran, K.T. Electron shuttle-mediated biotransformation of hexahydro-1,3,5-trinitro-1,3,5-triazine adsorbed to granular activated carbon. Environ. Sci. Technol. 2013, 47, 8743–8750. [Google Scholar] [CrossRef] [PubMed]
- Brown, R.A.; Mueller, J.G.; Seech, A.G.; Henderson, J.K.; Wilson, J.T. Interactions between biological and abiotic pathways in the reduction of chlorinated solvents. Remedation 2009, 20, 9–20. [Google Scholar] [CrossRef] [Green Version]
- Butler, E.C.; Hayes, K.F. Kinetics of the transformation of trichloroethylene and tetrachloroethylene by iron sulfide. Environ. Sci. Technol. 1999, 33, 2021–2027. [Google Scholar] [CrossRef]
- Butler, E.C.; Hayes, K.F. Factors influencing rates and products in the transformation of trichloroethylene by iron sulfide and iron metal. Environ. Sci. Technol. 2001, 35, 3884–3891. [Google Scholar] [CrossRef] [PubMed]
- Ferrey, M.L.; Wilkin, R.T.; Ford, R.G.; Wilson, J.T. Nonbiological removal of cis-dichloroethylene and 1,1-dichloroethylene in aquifer sediment containing magnetite. Environ. Sci. Technol. 2004, 38, 1746–1752. [Google Scholar] [CrossRef] [PubMed]
- Jeong, H.Y.; Hayes, K.F. Reductive dechlorination of tetrachloroethylene and trichloroethylene by mackinawite (FeS) in the presence of metals: Reaction rates. Environ. Sci. Technol. 2007, 41, 6390–6396. [Google Scholar] [CrossRef] [PubMed]
- Jeong, H.Y.; Anantharaman, K.; Han, Y.S.; Hayes, K.F. Abiotic reductive dechlorination of cis-dichloroethylene by Fe species formed during iron- or sulfate-reduction. Environ. Sci. Technol. 2011, 45, 5186–5194. [Google Scholar] [CrossRef] [PubMed]
- Lee, W.; Batchelor, B. Abiotic reductive dechlorination of chlorinated ethylenes by iron-bearing soil minerals. 1. Pyrite and magnetite. Environ. Sci. Technol. 2002, 36, 5147–5154. [Google Scholar] [CrossRef] [PubMed]
- Lee, W.; Batchelor, B. Abiotic, reductive dechlorination of chlorinated ethylenes by iron-bearing soil minerals. 2. Green rust. Environ. Sci. Technol. 2002, 36, 5348–5354. [Google Scholar] [CrossRef] [PubMed]
- Evans, P.J.; Nguyen, D.; Chappell, R.W.; Whiting, K.; Gillette, J.; Bodour, A.; Wilson, J.T. Factors controlling in situ biogeochemical transformation of trichloroethene: Column study. Ground Water Monit. Remed. 2014, 34, 65–78. [Google Scholar] [CrossRef]
- Whiting, K.; Evans, P.J.; Lebron, C.; Henry, B.; Wilson, J.T.; Becvar, E. Factors controlling in situ biogeochemical transformation of trichloroethene: Field survey. Ground Water Monit. Remed. 2014, 34, 79–94. [Google Scholar] [CrossRef]
- Kennedy, L.; Everett, J.W.; Gonzales, J. Aqueous and mineral intrinsic bioremediation assessment: Natural attenuation. J. Environ. Eng.-ASCE 2004, 130, 942–950. [Google Scholar] [CrossRef]
- Wilkin, R.T.; Bischoff, K.J. Coulometric determination of total sulfur and reduced inorganic sulfur fractions in environmental samples. Talanta 2006, 70, 766–773. [Google Scholar] [CrossRef] [PubMed]
- Wiedemeier, T.H.; Swanson, M.A.; Moutoux, D.E.; Gordon, E.K.; Wilson, J.T.; Wilson, B.H.; Kampbell, D.H.; Haas, P.E.; Miller, R.N.; Hansen, J.E.; et al. Technical Protocol for Evaluating Natural Attenuation of Chlorinated Solvents in Ground Water; United States Environmental Protection Agency: Washington, DC, USA, 1998.
- Nobre, R.C.M.; Nobre, M.M.M.; Campos, T.M.P.; Ogles, D. In-situ biodegradation potential of 1,2-DCA and VC at sites with different hydrogeological settings. J. Hazard. Mater. 2017, 340, 417–426. [Google Scholar] [CrossRef] [PubMed]
- Madsen, E.L. Epistemology of environmental microbiology. Environ. Sci. Technol. 1998, 32, 429–439. [Google Scholar] [CrossRef]
- Baruthio, F. Toxic effects of chromium and its compounds. Biol. Trace Elem. Res. 1992, 32, 145–153. [Google Scholar] [CrossRef] [PubMed]
- Grevatt, P.C. Toxicological Review of Trivalent Chromium; Agency, USEP: Washington, DC, USA, 1998.
- Driscoll, S.K.; McArdle, M.E.; Plumlee, M.H.; Proctor, D. Evaluation of hexavalent chromium in sediment pore water of the Hackensack river, New Jersey, USA. Environ. Toxicol. Chem. 2010, 29, 617–620. [Google Scholar] [CrossRef] [PubMed]
- Hopp, L.; Peiffer, S.; Durner, W. Spatial variability of arsenic and chromium in the soil water at a former wood preserving site. J. Contam. Hydrol. 2006, 85, 159–178. [Google Scholar] [CrossRef] [PubMed]
- James, B.R. The challenge of remediating chromium-contaminated soil. Environ. Sci. Technol. 1996, 30, A248–A251. [Google Scholar] [CrossRef] [PubMed]
- Barbee, G.C.; Brown, K.W. Comparison between suction and free-drainage soil solution samplers. Soil Sci. 1986, 141, 149–154. [Google Scholar] [CrossRef]
- Basu, N.B.; Rao, P.S.C.; Poyer, I.C.; Annable, M.D.; Hatfield, K. Flux-based assessment at a manufacturing site contaminated with trichloroethylene. J. Contam. Hydrol. 2006, 86, 105–127. [Google Scholar] [CrossRef] [PubMed]
- Johns, M.M.; Marshall, W.E.; Toles, C.A. Agricultural by-products as granular activated carbons for adsorbing dissolved metals and organics. J. Chem. Technol. Biotechnol. 1998, 71, 131–140. [Google Scholar] [CrossRef]
- Otto, M.; Nagaraja, S. Treatment technologies for 1,4-dioxane: Fundamentals and field applications. Remedation 2007, 17, 81–88. [Google Scholar] [CrossRef]
- Navalon, S.; Alvaro, M.; Garcia, H. Analysis of organic compounds in an urban wastewater treatment plant effluent. Environ. Technol. 2011, 32, 295–306. [Google Scholar] [CrossRef] [PubMed]
- Otero, M.; Zabkova, M.; Rodrigues, A.E. Comparative study of the adsorption of phenol and salicylic acid from aqueous solution onto nonionic polymeric resins. Sep. Purif. Technol. 2005, 45, 86–95. [Google Scholar] [CrossRef]
- Maloney, S.W.; Adrian, N.R.; Hickey, R.F.; Heine, R.L. Anaerobic treatment of pinkwater in a fluidized bed reactor containing GAC. J. Hazard. Mater. 2002, 92, 77–88. [Google Scholar] [CrossRef]
- Parette, R.; Cannon, F.S.; Weeks, K. Removing low ppb level perchlorate, RDX, and HMX from groundwater with cetyltrimethylammonium chloride (CTAC) pre-loaded activated carbon. Water Res. 2005, 39, 4683–4692. [Google Scholar] [CrossRef] [PubMed]
- Kim, J.G.; Dixon, J.B. Oxidation and fate of chromium in soils. Soil Sci. Plant Nutr. 2002, 48, 483–490. [Google Scholar] [CrossRef] [Green Version]
- Daoud, W.; Ebadi, T.; Fahimifar, A. Optimization of hexavalent chromium removal from aqueous solution using acid-modified granular activated carbon as adsorbent through response surface methodology. Korean J. Chem. Eng. 2015, 32, 1119–1128. [Google Scholar] [CrossRef]
- Di Natale, F.; Lancia, A.; Molino, A.; Musmarra, D. Removal of chromium ions form aqueous solutions by adsorption on activated carbon and char. J. Hazard. Mater. 2007, 145, 381–390. [Google Scholar] [CrossRef] [PubMed]
- Fetter, C.W. Contaminant Hydrology; Prentice Hall: Upper Saddle River, NJ, USA, 1999. [Google Scholar]
- Han, I.; Schlautman, M.A.; Batchelor, B. Removal of hexavalent chromium from groundwater by granular activated carbon. Water Environ. Res. 2000, 72, 29–39. [Google Scholar] [CrossRef]
- Piazzoli, A.; Antonelli, M. Feasibility assessment of chromium removal from groundwater for drinking purposes by sorption on granular activated carbon and strong base anion exchange. Water Air Soil Pollut. 2018, 229, 17. [Google Scholar] [CrossRef]
- Satapathy, D.; Natarajan, G.S.; Patil, S.J. Adsorption characteristics of chromium(VI) on granular activated carbon. J. Chin. Chem. Soc. 2005, 52, 35–44. [Google Scholar] [CrossRef]
- Singha, S.; Sarkar, U. Analysis of the dynamics of a packed column using semi-empirical models: Case studies with the removal of hexavalent chromium from effluent wastewater. Korean J. Chem. Eng. 2015, 32, 20–29. [Google Scholar] [CrossRef]
- Song, H.O.; Yao, Z.J.; Shuang, C.D.; Li, A.M. Accelerated removal of nitrate from aqueous solution by utilizing polyacrylic anion exchange resin with magnetic separation performance. J. Ind. Eng. Chem. 2014, 20, 2888–2894. [Google Scholar] [CrossRef]
- Song, H.O.; Yao, Z.J.; Wang, M.Q.; Wang, J.N.; Zhu, Z.L.; Li, A.M. Effect of dissolved organic matter on nitrate-nitrogen removal by anion exchange resin and kinetics studies. J. Environ. Sci. 2013, 25, 105–113. [Google Scholar] [CrossRef]
- Primo, O.; Rivero, M.J.; Urtiaga, A.M.; Ortiz, I. Nitrate removal from electro-oxidized landfill leachate by ion exchange. J. Hazard. Mater. 2009, 164, 389–393. [Google Scholar] [CrossRef] [PubMed]
- Guimaraes, D.; Leao, V.A. Fundamental aspects related to batch and fixed-bed sulfate sorption by the macroporous type 1 strong base ion exchange resin Purolite A500. J. Environ. Manag. 2014, 145, 106–112. [Google Scholar] [CrossRef] [PubMed]
Figure 1.
Average mass flux for each well measured at DOD Nuclear Facility.

Figure 2.
Adsorption isotherm of 1,4-dioxane on (A) GAC, (B) XAD4, (C) XAD16 and (D) DAX8.
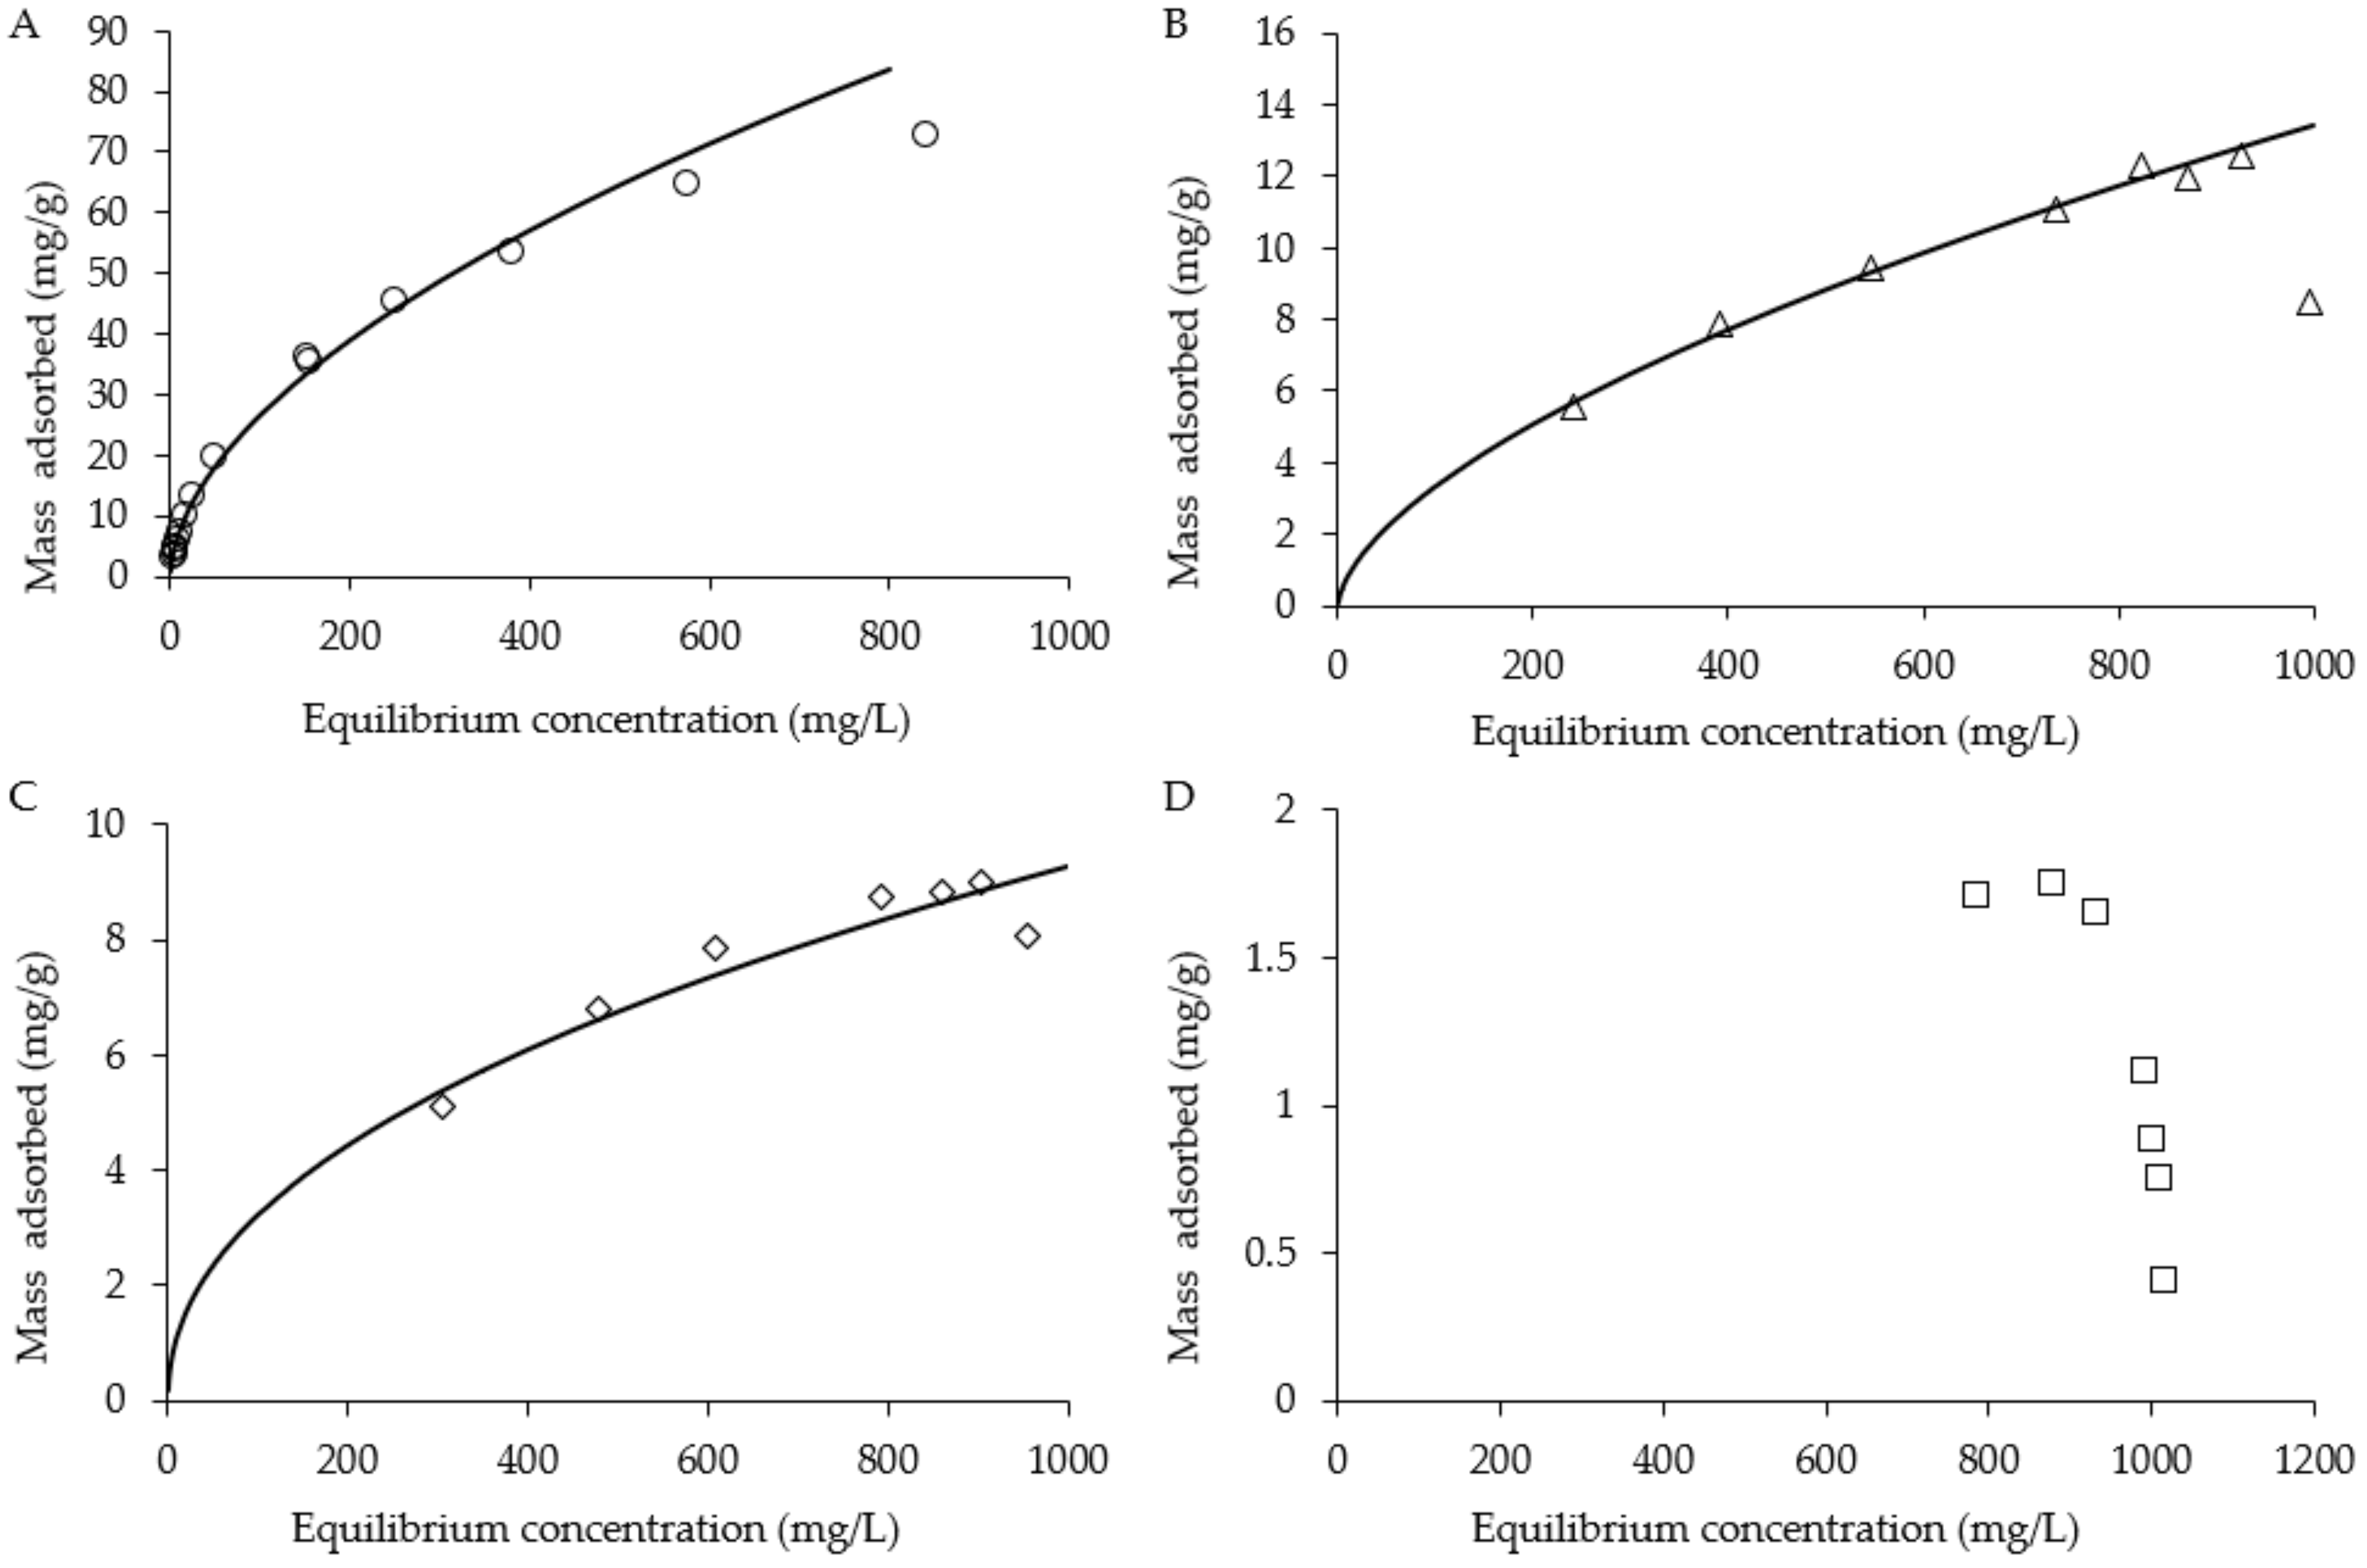
Figure 3.
Breakthrough curves for (A) methanol, (B) 1,4-dioxane, (C) methylene chloride and (D) cis-dichloroethene for the 1-D multispecies column test.
Figure 3.
Breakthrough curves for (A) methanol, (B) 1,4-dioxane, (C) methylene chloride and (D) cis-dichloroethene for the 1-D multispecies column test.
Figure 4.
(A) Actual versus measured Darcy velocity with a standard PFM; (B) Actual vs measured 1,4-dioxane flux in box aquifer tests on the standard PFM.
Figure 4.
(A) Actual versus measured Darcy velocity with a standard PFM; (B) Actual vs measured 1,4-dioxane flux in box aquifer tests on the standard PFM.

Figure 5.
Mass flux measurements at Site 1 (confidential site). (A) Water and 1,4-dioxane flux profiles for PFM-7 and (B) Average mass flux of contaminations for each well at Site 2.
Figure 5.
Mass flux measurements at Site 1 (confidential site). (A) Water and 1,4-dioxane flux profiles for PFM-7 and (B) Average mass flux of contaminations for each well at Site 2.
Figure 6.
Adsorption isotherm of SO4− on Purolite A500 and Purolite A300 resins with a Freundlich model fit.
Figure 6.
Adsorption isotherm of SO4− on Purolite A500 and Purolite A300 resins with a Freundlich model fit.

Figure 7.
Breakthrough curves for SO42- for Purolite A300 from 1D column test.

Figure 8.
Mass flux measurements at Altus Air Force Base Oklahoma for well EPAUMP01.

Figure 9.
Comparison of VOC removal, sulfide production and SO42− consumption. (A) Biowall sulfide concentrations; (B) Percent VOC removal trends; (C) Average volumetric SO42− consumption rate for T2 through T7; and (D) Average percent VOC removal for T2 through T7. Positive error bars represent one standard deviation.


Table 1.
Methanol, 1,4-dioxane, methylene chloride, cis-1,2-dichloroethene properties determined from 1D column test with granular activated carbon (GAC).
Table 1.
Methanol, 1,4-dioxane, methylene chloride, cis-1,2-dichloroethene properties determined from 1D column test with granular activated carbon (GAC).
| Breakthrough | Methanol | 1,4-Dioxane | Methylene Chloride | cis-1,2-Dichloroethene | ||||
|---|---|---|---|---|---|---|---|---|
| Mass Retained by GAC | R Factor | Mass Retained by GAC | R Factor | Mass Retained by GAC | R Factor | Mass Retained by GAC | R Factor | |
| Initial (mg/g) | 0.04 | 1 | 6.4 | 62 | 16.6 | 147 | 71.3 | 713 |
| 50% (mg/g) | 0.12 | 3 | 13.3 | 192 | 28.2 | 455 | 98.1 | 1700 |
| 100% (mg/g) | 0.4 | 5 | 19.8 | 235 | 43.6 | 386 | 122.5 | 1167 |
Table 2.
Comparison of PFM Results (August 2015) with traditional groundwater data (2013–2014).
| Well | PFM Flux-Averaged Concentration (μg/L) | Measured Aqueous Phase Concentration (μg/L) | Percent Difference (%) |
|---|---|---|---|
| PFM 1 | <5 | 2.3 | - |
| PFM 2 | <5 | 330 | - |
| PFM 3 | 18 | 8.6 | 68 |
| PFM 4 | <5 | 1.9 | - |
| PFM 5 | 5932 | 1600 | 115 |
| PFM 6 | 1663 | 1700 | 2 |
| PFM 7 | 2195 | 990 | 76 |
| PFM 8 | 1675 | 480 | 111 |
| PFM 9 | 55 | 46 | 18 |
| PFM 10 | 20 | <1 | - |
| PFM 11 | <5 | 2.3 | - |
| PFM 12 | 1384 | 280 | 133 |
| PFM 13 | 602 | 310 | 64 |
BD = below detection.
Table 3.
Sulfate properties determined from 1D column test with Purolite A300.
| Breakthrough | Sulfate | |
|---|---|---|
| Breakthrough (mg/g) | Retardation Factor | |
| Initial | 50.5 | 27 |
| 50% | 68 | 15 |
| 100% | 70.4 | 37 |
© 2018 by the authors. Licensee MDPI, Basel, Switzerland. This article is an open access article distributed under the terms and conditions of the Creative Commons Attribution (CC BY) license (http://creativecommons.org/licenses/by/4.0/).
Share and Cite
MDPI and ACS Style
Haluska, A.A.; Thiemann, M.S.; Evans, P.J.; Cho, J.; Annable, M.D. Expanded Application of the Passive Flux Meter: In-Situ Measurements of 1,4-Dioxane, Sulfate, Cr(VI) and RDX. Water 2018, 10, 1335. https://doi.org/10.3390/w10101335
AMA Style
Haluska AA, Thiemann MS, Evans PJ, Cho J, Annable MD. Expanded Application of the Passive Flux Meter: In-Situ Measurements of 1,4-Dioxane, Sulfate, Cr(VI) and RDX. Water. 2018; 10(10):1335. https://doi.org/10.3390/w10101335
Chicago/Turabian StyleHaluska, Alexander A., Meghan S. Thiemann, Patrick J. Evans, Jaehyun Cho, and Michael D. Annable. 2018. "Expanded Application of the Passive Flux Meter: In-Situ Measurements of 1,4-Dioxane, Sulfate, Cr(VI) and RDX" Water 10, no. 10: 1335. https://doi.org/10.3390/w10101335
Note that from the first issue of 2016, this journal uses article numbers instead of page numbers. See further details here.