Control of Tropical Landcover and Soil Properties on Landslides’ Aquifer Recharge, Piezometry and Dynamics
by
 , ,
, ,
Pierre Belle
1,*, 
Bertrand Aunay
2,
Patrick Lachassagne
3,
Bernard Ladouche
4 and
Jean-Lambert Join
5 1
Water Resources Department-France, Danone Waters, 74500 Evian-Les-Bains, France
2
BRGM, F-97417 Saint-Denis de La Réunion, France
3
Water Resources and Sustainability Division, Water Institute by Evian, Danone Waters, 74500 Evian-Les-Bains, France
4
BRGM, F-34000 Montpellier, France
5
Laboratoire Géosciences, Université de La Réunion, Institut de Physique du Globe de Paris, UMR 7154, Sorbonne Paris Cité, CNRS, 97744 Saint-Denis, France
*
Author to whom correspondence should be addressed.
Water 2018, 10(10), 1491; https://doi.org/10.3390/w10101491
Submission received: 31 July 2018
/
Revised: 1 October 2018
/
Accepted: 15 October 2018
/
Published: 22 October 2018
(This article belongs to the Special Issue Landslide Hydrology)
Abstract
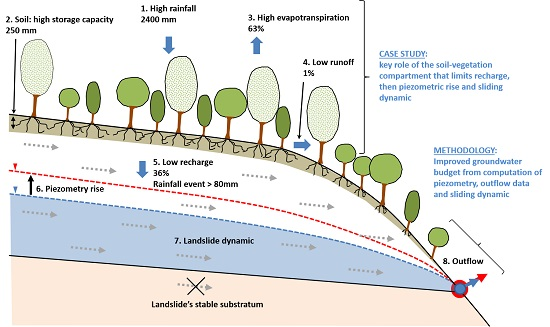
:Among the processes controlling landslide dynamics, piezometry plays a major role. The characterization of a landslide’s aquifer recharge (=inflows) is thus indispensable for predicting displacements. In this research, the recharge of the large Grand Ilet landslide in the humid tropical, Reunion Island was characterized through a multi-disciplinary and robust hydrological approach, notably comprising a precise water budget of the landslide (outflows = inflows). Surface processes play a major role in the landslide recharge regime. Runoff is less than 1% of rainfall (2400 mm/year) due to the soil’s high permeability. A large quantity of water (250 mm) is adsorbed in this shallow layer. This reservoir is submitted to high real evapotranspiration (1500 mm/year) due to the dense tropical broad-leaved vegetation. This explains the low aquifer recharge (860 mm/year), the fact that only major rainfall episodes during the rainy season induce recharge, with a consequent increase in landslide velocity, and finally low outflow from the landslide. Therefore, among other operational recommendations, it is necessary to maintain natural vegetation cover over such landslide surface in order to limit aquifer recharge and thus displacements. This study provides a methodological framework for landslide studies, particularly for modeling their recharge/piezometry, and key parameters of their dynamics.

1. Introduction
Protecting humans and infrastructure against landslide damage is a worldwide problem [1]. Much research has gone into predicting ground-deformation crises to gain improved understanding of the associated risks. The difficulty of studying landslides is mainly twofold: (i) landslides can form in various settings and (ii) many processes control their activity [2,3,4,5,6]. Water plays a preponderant role in the various control processes. More precisely, landslide dynamics appear to be closely linked to hydrogeology [7,8,9,10,11] through hydro-mechanical coupling [3,9,12,13,14]. An increase of groundwater head in a landslide—for instance after a rainfall event and the consecutive recharge episode—accelerates displacement, as an increase in hydrostatic pressure modifies granular stress conditions (translation of Mohr’s circle). Therefore, solid hydrogeological knowledge of a landslide leads to better understanding of its dynamics, improved prediction of its behavior and optimized choices and efficiency of remediation measures for slowing it down [15,16,17]. Today, hydrogeology is thus an integral part of research programs for improving displacement prediction [18,19,20,21,22,23]. Moreover, using effective rainfall Reff (Reff = rainfall minus actual evapotranspiration) improves the correlation between rainfall and displacement velocity, in particular for large landslides [24].
However, aquifers that develop within landslides are complex, because of: (i) the complexity and heterogeneity of the aquifer’s structure and hydrodynamic parameters (e.g., double porosity) (Figure 1); (ii) the spatial and temporal evolution of hydrodynamic parameters related to slope deformation; and (iii) the multiple ways in which landslide aquifers can recharge or discharge [11,15,18,19,22,23,25,26]. Indeed, permeability within a landslide is subjected to temporal and spatial evolution as a function of the evolution of the stress field. Water recharge can occur in connected fracture zones that are kept open due to deformation of the landslide. Such fractures can become permeable even at great depths [13], generate hydraulic head variations in the affected areas [27,28,29], and contribute to the destabilization of the slope. Between these fractures, the permeability of the geological formation can be very low due to the formation of clay materials brought about by the deformation mechanisms [20,25]. Finally, because of the landslide’s steep slopes and these low permeabilities, hydraulic gradients in the landslides are often greater than 10% [30], which is very large for an aquifer. These heterogeneities and gradients make the use of deterministic mathematical modeling tools delicate, particularly when the flow conditions do not respect the Darcy assumption (turbulent flow).
The larger the landslide, the more complex such factors will be and the more difficult it will be to carry out hydrogeological investigations because of the huge amounts of material being mobilized [31]. Multi-disciplinary studies are the most suitable for defining such complex hydrosystems [31,32,33]. In such multi-disciplinary studies [30], all the clues gathered from each individual approach converge to build a robust conceptual model. More indirect methods, such as hydrochemistry, are useful for understanding groundwater circulation in rocks [32,33,34,35,36,37,38]. In parallel, stable water isotopes can be used for locating recharge areas and for estimating groundwater transit and renewal times [39,40]. Moreover, the quantification of water inflows to the landslide and particularly of the recharge (Ar) at its surface, is a key step in studying the hydrogeology of a landslide. Because water inflows influence the groundwater hydraulic head in the landslide’s body (the piezometry) and Ar often occurs over a large surface area, thus involving large volumes of infiltrated water. As a reminder, Ar corresponds to the efficient rainfall (Reff) from which the runoff (S) is subtracted. Using efficient rainfall (Reff) instead of rainfall (R) improves the correlation between the rainfall process and the displacement velocity, in particular for large landslides [41] where runoff (S) is small. The parameter Ar depends upon soil water balance, which in turn depends upon (i) soil–water reservoir changes (the unsaturated zone submitted to the uptakes from the vegetation’s roots), (ii) climate, and (iii) landcover (evapotranspiration). But Ar is generally computed from meteorological parameters measured at the surface, especially potential evapotranspiration (PET) and thus is subject to high uncertainty. Uncertainties about Ar can be much smaller if this function is adjusted from aquifer outflow. However, it is rarely quantifiable at the scale of a landslide, because of invisible or hardly measurable outflows, among other points.
In a tropical humid climate and in particular in the intertropical zone, the large amount of rainfall and high intensity of rainfall episodes are favorable environmental conditions for triggering landslides [23,41,42,43,44]. Despite this, most hydrogeological landslide studies in the tropics focus on small surface (thickness < 20 m) instabilities [42,45,46,47,48], which pose a more direct and frequent threat to the population. These studies characterized the hydrologic responses of unstable surfaces in tropical contexts and identified the link with the mechanisms triggering these slope movements. But little information is available on (i) the recharge processes of these landslides; (ii) the quantification of the recharge and its impact on piezometric variations that trigger the sliding process; and (iii) the methodological approaches adapted to this type of context (large landslide in tropical humid climate). Consequently, additional results are needed to provide a better understanding of the recharge processes of landslide aquifers and their dynamics in a tropical context and assistance for choosing risk mitigation strategies.
The Grand Ilet landslide is located in the Salazie cirque on Reunion Island in the Indian Ocean (Figure 2). About 1000 people live on it, despite its continuous activity, its volume of 370 mm3 and its average displacement velocity of 2 to 55 cm/year, perfectly illustrating the context and problems of very large-size landslips. The major control of groundwater over displacement velocities, as demonstrated for this landslide [23], highlights the need to understand the processes and quantify the recharge of the landslide’s aquifer, for improved definition of the instability mechanisms. Because of the humid tropical climate of the island, average rainfall over the landslide area is high: 2400 mm/year (the mean over the study’s two years of monitoring). The specific morphology and geological structure of the Grand Ilet landslide favors the identification and quantification of most groundwater outflow and runoff, enabling a novel and pertinent approach for drawing up the water balance of very large landslides. In view of this exceptional research subject and our general knowledge of the hydrogeology of volcanic environments [47,48,49,50,51,52,53], our objective was to understand and quantify the recharge of the Grand Ilet landslide in this specific “humid tropical” context with the ambition to better characterize piezometric variations and ultimately sliding processes. Thus, we understood the processes governing the landslide water balance and drew up a water balance based on hydrological data (rainfall, evapotranspiration, runoff, piezometry, outflow of the main springs, etc.). No geotechnical parameters are needed for this approach. Nevertheless, the links between hydrology and sliding mechanisms are presented and discussed, notably with a graphical comparison between landslide displacements and hydrological time series (a more detailed analysis of the relationships between hydrology and landslide dynamics is available in the following reference [23]). The mechanical processes are also discussed, but are not addressed with computations that would for instance require in situ measurement of geotechnical parameters, in accordance (i) with the objectives of the paper which are focused on the understanding of recharge processes, and (ii) with other hydrological approaches applied to study very large landslides [24,41].
The following paper consists of five parts: (i) presentation of the study area of the Grand Ilet landslide; (ii) the methods used for acquiring hydrologic data; (iii) evaluation of inflow and outflow; (iv) quantification and interpretation of the processes and the water balance terms in the area covered by the Grand Ilet landslide; and (v) identification of the consequences for this landslide’s dynamics and more generally for landslides and the study of their dynamics.
2. Materials and Methods
2.1. Description of the Study Site
2.1.1. Localization
The study area is located in Reunion Island in the Indian Ocean, a ‘hot spot’ island whose recent volcanism has generated a particularly steep relief. Even though its diameter is only 60 km at sea level, its highest point, Piton des Neiges, culminates at 3069 m asl (above sea level). Three large erosion coalescent depressions called ‘cirques’ have developed around this summit (Figure 2). The Grand Ilet landslide is located in the easternmost Salazie cirque, at an average elevation of 1100 m asl and with a surface area of about 4 km2.
2.1.2. Rainfall
Reunion Island has a wet tropical climate with marked seasons: a warm rainy period from December to April and a cooler, relatively dry period from May to November. At Grand Ilet, rainfall during the rainy season amounts to 83% of annual precipitation (1970–2009 average). During this period, intense rainfall events are common, in particular when tropical depression systems pass over the island (Figure 3). Indeed, Reunion holds all the world records in rainfall intensity for durations of between 12 h (1144 mm) and 15 days (6083 mm) [54]. Mean annual precipitation over the study area is 3000 mm for the period 1970–2009 [54] (Figure 2).
2.1.3. Activity of the Grand Ilet Landslide
Along its northern and western sides, the Grand Ilet landslide is bounded and overlooked by subvertical cliffs called ‘remparts’ (hereafter termed ‘ramparts’). Their average slope exceeds 60° (Figure 4). To the south and west, its boundaries are the Camp Pierrot ravine and the Fleurs Jaunes river, respectively. The landslide itself is composed of several compartments [55]. Average displacement velocities increase from the head of the landslide towards its foot. They vary from 5 cm/year for the upper part to 52 cm/year for the lower (average annual planimetric velocity calculated over the period 2005–2011). The general movement is oriented to the north-east (Figure 4). The deformation associated with the Grand Ilet landslide generates evident markers. The main manifestations of this deformation are four major escarpments, with a height greater than 20 m and oriented towards the north-east. Closed depressions (dry pools) are located at the foot of these escarpments in counterslope areas. The landslide is very old (several thousand years at least) and humans have been aware of it since this part of the island began to be inhabited in the 18th century. Geodesic monitoring began in 2001 and proved that the landslide’s activity is unceasing. However, the measured velocities show seasonal variability (Figure 3). Accelerations are observed during and after intense rainfall periods in the wet season. These accelerations are controlled by groundwater dynamics [23]. The rapid (<1 day) recharging of the landslide’s aquifer causes sudden piezometric rises and sliding accelerations. Slowing down of the landslide is closely related to piezometric decrease in the landslide aquifer [23]. This close relationship between groundwater and landslide activity justifies the need for quantifying landslide recharge, thus defining the instability mechanisms.
2.1.4. Geological and hydrogeological setting
The Salazie cirque is eroded in the geological formations of the massif of Piton des Neiges, a volcano that has been dormant for the past 12,000 years [56]. The ramparts bordering and at the bottom of the cirque consist of stacked lava flows piled up over several thousand meters (Figure 4 and Figure 5) and indurated low-permeability debris-avalanche breccias, which were created during periods of instability in the flanks of the shield volcano [55,56,57,58,59,60] prior to the cirque’s erosion. The Grand Ilet aquifer is mostly composed of such debris-avalanche breccias, but unconsolidated as a result of landslide movement. The landslide process is thus at the origin of the porosity and the hydraulic conductivity of the landslide’s aquifer, due to this non-consolidation [61]. Two units can be differentiated within the landslide mass, from bottom to top (Figure 4 and Figure 5):
- The Grand Ilet debris-avalanche breccias form the lower and thickest unit of the landslide. The breccias form the aquifer (1 × 10⁻⁵ m/s < K < 1 × 10⁻⁴ m/s) and result from the landslide’s movement. They consist of angular fragments of aphyric basalt or with olivine phenocrysts. The size of such fragments varies from a few centimeters to several meters. They are contained in an unconsolidated sandy matrix. The thickness of this unit varies between 30 and 100 m. The landslide’s slipping surface is materialized by a meter-thick clayed breccia located at the base of this unit [62]. In this clayed breccia, the size of the elements appears greatly reduced: their diameter does not exceed a few centimeters. The matrix shows significant plasticity when it is saturated with water and many shear zones are observed, with striated plans. The breccias are indurated under the landslide’s base.
- The superficial deposits are breccias (K = 5 × 10⁻³ m/s) deriving from the differentiated basalt from the rampart forming the upper unit of the landslide. It consists of decimeter- to meter-sized blocks, again in an unconsolidated sandy matrix. Its thickness varies from a few to several tens of meters and it overlies the lower unit of Grand Ilet breccia.
The substratum of the landslide is made up of old zeolitized lava flows and consolidated breccias, located under the clayey breccia. Numerous sills and dykes intersect these formations.
The unconsolidated Grand Ilet breccia contains an unconfined aquifer. Each ravine cutting into the Grand Ilet breccia allows the emergence of permanent springs at the thalweg’s bottom. The springs are located at the intersection between this topography and the piezometric level in the aquifer (Figure 4 and Figure 5). Logically enough, most of these springs are located near the bottom of the aquifer, near its impervious substratum. As the substratum of the landslide consists in impervious non-destructured lava flows and breccias, due to this low permeability, the substratum of the landslide’s unconfined aquifer is the same as its substratum. Observations on substratum outcrops in the Roche-à-Jacquot and Camp Pierrot ravines and along the Fleurs Jaunes river (Figure 4 and Figure 5), have shown the absence of significant (>0.1 L/min) outseepage, in particular along the discontinuities in zeolitized flows such as dykes or fault zones (these zeolitized flows underlie the indurated debris-avalanche breccias). This indicates negligible flow through the substratum rock, which can, therefore, be considered as impermeable (K = 1 × 10⁻⁸ m/s) compared to the overlying Grand Ilet breccia aquifer. This low-permeability substratum is commonly observed in the hydrogeological context of Reunion Island [50]. The unconsolidated breccia surface has a poorly developed stream network (Figure 5). At the foot of the Roche Ecrite rampart, surface flow is mostly evacuated through the Casabois ravine, but with some losses. Then, at the foot of the Cimendef rampart, in the absence of a runoff network, the water infiltrates into the landslide breccia. In addition, the topographic surface of the breccia in moving areas presents a peculiar morphology, with several endorheic basins due to counterslopes. Such depressions (locally called ‘mares sèches’ = ‘dry pools’) cover a significant surface of 1.2 km2, or about 30% of the total surface of the unconsolidated breccia watershed covering 4 km2.
2.2. Hydrologic Monitoring Network
2.2.1. Precipitation
Rainfall is measured daily with a Météo-France tipping-bucket rain gauge Regional Greenhouse Gas Initiative (RG-GI) (station n° 97421220), located at the centre of the Grand Ilet landslide (Figure 2 and Figure 4). In view of this central position, the small area of the landslide and also the relatively low pluviometric gradient in this area of the island (Figure 2), this location ensures the representativeness of the data collected in the study area.
2.2.2. Potential Evapotranspiration
The Salazie cirque presents a singular context because of its dense vegetation cover developed over unconsolidated breccias. The most common species are Rubus alcaefolius, Psidium cattleianum, Solanum auriculatum, Lantana camara, Hedychium gartnaerianum, H. flavescens, Furcraea foetida and Casuarina equisetifolia [63]. Due to this dense vegetation cover, we used the well-documented Blaney–Criddle formula [64,65,66,67,68,69], which specifically enables the density of plant cover, a key parameter in our case, to be taken into account. The usual equation in the metric system is the following:
where PETBC corresponds to potential evapotranspiration in mm over the period during which p is expressed (here one day), p is the total percentage of daylight hours over the period used (here per day) over the total daylight hours per year, Ta is the average temperature in °C and k is a coefficient depending upon type of vegetation, season and location. This k varies between 0.5 for orange groves and 1.2 for natural dense vegetation in summer [68]. Based on the defined parameters [68], the coefficient used for the dense invasive vegetation growing on breccias was set between 1.2 (rainy season) and 0.98 (dry season). For the less dense vegetation on the ramparts, k was set between 0.6 and 0.49 for the rainy and dry seasons respectively [68]. The average daily temperature was measured in the Salazie cirque, at the meteorological station of Mare-à-Vieille-Place at 870 m asl, located two kilometers east of the study area (Figure 2). The temperature elevation gradient for the specific Salazie area is −0.6 °C/100 m [69]. This gradient and the temperatures measured at Mare-à-Vieille-Place were used for calculating mean temperatures on the Roche-Ecrite and Cimendef ramparts (1700 m asl). The PETBC of the ramparts at 1700 m asl was then calculated using Equation (1).
2.2.3. Monitoring Surface-Water and Groundwater Flows
Five gauging weirs were installed to measure the flow from the main springs (Clain (S6), Bélier (S17), Bielle 2 (S15) and Ravine Blanche (S1), Figure 6) and the surface runoff in the ramparts’ watersheds (station S1). Water heights at the different weirs were recorded at 10-min intervals. The Clain spring (S6) is the main outlet for the Grand Ilet breccia aquifer (Figure 6). Monitoring the flow at the S6 spring allowed the temporal dynamics of this aquifer to be defined. In addition, three observation wells (P1, P2 and P3, Figure 4) intersecting the breccia aquifer monitored the hydraulic head of the aquifer at 30-min intervals (Figure 6). Monitoring of the S17 and S15 springs helped the southern sector of the Grand Ilet landslide to be characterized (Figure 2).
The other springs (S2–S5, S7–S11, S13–S16) (Figure 2) were not continuously monitored, because of unfavorable conditions for setting up permanent stations (unstable ground, private catchwork for drinking water). However, they only account for about one third of the total discharge of the aquifer (Table 1); and the minimum flow of such springs was nonetheless occasionally measured in 2011 by salt-dilution or capacitive gauging. For five inaccessible minor springs (S3, S7, S8, S10 and S13, Table 1) of the 14 recorded in the study area, the flow rates were visually estimated once (helicopter survey). The good correlation between piezometric-level variations and spring-flow rates at the scale of the Grand Ilet landslide (Figure 6), as well as our understanding of the geology of the landslide, indicated the existence of a continuous aquifer within the breccia. This hydraulic continuity helped in reconstituting the flow rates of non-continuously gauged springs on the basis of occasional flow measurements. To this end, we used the S6 spring hydrograph for estimating the hydrographs of those springs not continuously monitored during the 2011 and 2012 hydrologic cycles. First, we calculated the ratio Qi/QS6 between the flow from the spring under consideration (Qi) and the flow from the S6 spring (QS6) on the date of the occasional measurement (Table 1). This ratio was then applied to the entire S6 spring hydrograph for reconstituting that of the Qi spring (Figure 7). The hydrographs of the S17 and S15 springs, whose flow rates were continuously monitored, were then compared with the hydrographs reconstituted with this method (Figure 6), in order to quantify the uncertainty. For the hydrologic cycle 2012, the annual measured flow of S17 spring (131,096 m3/year) is 33% higher than the annual estimated flow (72,075 m3/year). The annual measured flow of S15 spring (257,143 m3/year) is 45% higher than the estimated flow (171,177 m3/year). The errors between measured and calculated water outflow from the springs can be linked to hydrogeological behaviors of the various subparts of the aquifer that feed the different springs. The hydrodynamic parameters and the thickness of the aquifer zones supplying the springs are not strictly the same [61]. However, groundwater flow to deeper aquifers cannot be invoked because of the very low permeability of the breccia aquifer substratum, proved by the absence of springs and outseepage.
2.3. Theory and Calculation: Evaluating the Water Balance Components
The following sections describe the methodology developed and implemented to understand physical processes and to compute the various components of the landslide water balance. Numerical hydrological models are widely used for the simulation of the rainfall–runoff process [70,71,72]. However, they often require numerous calibration parameters. Our model was designed to conform to realistic physical processes and was distributed in two main parts: surface (runoff) and subsurface processes (role of the soil as a reservoir, evapotranspiration, recharge of the landslide aquifer, outflows from the landslide, etc.). Even if the available dataset on this case study is comprehensive, it was chosen to favor robust methods. For instance, the reservoir modeling described below to simulate the soil’s water budget uses a global approach rather than a discretized one [73]. This strategy is justified by the intention to avoid multiplying the number of parameters/unknowns to be calibrated, for instance with discretized models, as the number of data-points/equations is limited to those available. For instance, there is only outflow from the aquifer at a limited number of springs and piezometers cannot be multiplied. Additionally, having a precise description of the parameters and flows in the unsaturated zone, several tens of meters in thickness, was unnecessary, as in this case calibrating a discretized model might have been difficult and risky, as the problem is underconstrained.
Perspectives for further research, for instance with more complex modeling tools or approaches, will be approached in the Discussion section. However, perspectives for the transposition of this research to applied studies will also be discussed. In fact, in ‘real life’, but also in the field of research, cost- and time-effective methods can be beneficial.
2.3.1 Architecture of the Water Balance
The theoretical outline of a conceptual model for calculating the water balance of the landslide’s aquifer is shown on Figure 8. The monitoring system allows quantification of rainfall (R), surface runoff (S), potential evapotranspiration (PETBC) (Table 2) and outflow from the aquifer, the total outflow from the aquifer being equal to its recharge (Ar). The various flow components of this conceptual model were calculated at daily intervals.
Hydrologic cycles were based on the calendar year (1 January to 31 December) because the first heavy rains after the dry season occurred in January 2011 and 2012. In addition, this choice allowed good initialization of the reservoirs for water balance calculations (initialization at the end of severe low-water level).
The rainfall measured at the Grand Ilet rain gauge was used as input function (RG-GI, Figure 4). For surface runoff, the choice of the dataset was based on the characteristics of the watershed under consideration (Figure 8). For the rampart watershed, the runoff (S) per surface unit was calculated with the flow from the Ravine Blanche station (S1, Figure 4). When dealing with the landslide’s watershed, the runoff per surface unit was calculated from the fast flows observed at the Clain station (S6, Figure 4). S appears to be significant only on the rampart watersheds. A soil reservoir, with a finite volume, was used for reproducing the phenomenon of temporary storage in superficial soil horizons (Figure 8). This reservoir physically represents the total quantity of water in a soil available for evapotranspiration. Only its excess water allows efficient infiltration toward the aquifer. In our study, this reservoir also integrated the temporary storage in vegetation above the soil’s surface (evaporation from intercepted water). It may form a not insignificant part of the total water quantity, particularly as the vegetation is broad-leaved [74]. The value of H in the soil reservoir is thus dependent on the type of substratum of the watershed under consideration (HBr for breccia and HRamp for rampart) and the type of plant cover. HRamp was adjusted at 50 mm for the thin soils that have developed on the ramparts [75,76]. The value of HBr for the breccia was optimized for adjusting the calculated water-balance results of the observations. In fact, the whole of the aquifer recharge Ar must be equal to the outflow from the aquifer.
The real evapotranspiration ET is calculated from the computed water height H in the superficial reservoir with a capacity HBr for breccia and HRamp for rampart and the potential evapotranspiration PETBC, following Equation (2):
On the basis of the hydrologic and hydrogeological data presented above, the Grand Ilet hydrosystem was divided into two distinct watersheds (Figure 8):
- Rampart watershed: The Cimendef rampart.
Two types of watersheds (exorheic basin/endorheic basin) were identified on the breccia surface for quantifying the recharge associated with infiltration in the endorheic depressions. Such depressions, called ‘dry pools’, were earlier considered as privileged recharge sites for the breccia aquifer [55,77]. For the non-endorheic breccia watersheds, whose surfaces are about 2.9 km², the daily water-balance equation (Equation (3)) is:
with ArBr the infiltration through breccia for the non-endorheic watersheds, R the rainfall, ETBr the calculated evapotranspiration for breccia vegetation and SBr the runoff over breccia. HBr is the maximum capacity of the soil reservoir of breccia.
For the endorheic breccia watersheds, whose surfaces are estimated at 1.15 km2, the water-balance equation is (Equation (4)):
with ArEnd the infiltration through breccia for the endorheic watersheds.
For the watersheds of ramparts, whose surfaces are estimated at 0.52 km2, the water-balance equation is (Equation (5)):
The total recharge of the landslide aquifer is expressed as follows (Equation (6)):
with ArLandslide the recharge of the landslide’s aquifer.
As HRamp was adjusted at 50 mm and all the other parameters (such as runoff) are measured, the only calibration parameter for the water balance is the maximum height HBr of the superficial breccia soil reservoir. Two indicators help in evaluating the calibration quality:
- Comparison of computed annual recharge with the calculated outflow;
- Comparison of the piezometric aquifer response to each computed recharge episode.
2.3.2. Estimating the Runoff Coefficient and Aquifer Response to Recharge
To evaluate the runoff coefficient (Rc = S/R; where S = surface runoff, R = rainfall during a rainfall event), the flood hydrographs of the Clain (S6) station were broken down according to the approach proposed by Hewlett and Hibbert [78]. Ravine Blanche (S1) station data were used for determining the runoff coefficient of the ramparts.
The aquifer response to recharge was evaluated by the amplitude of the piezometric variations piezometric rise (dP) of the breccia aquifer when such a variation was measured [79].
These methods are described in detail in the Supplementary Materials.
2.3.3 Calculating Recharge Volumes from Piezometric Variations
The recharge volumes were also evaluated from the amplitudes of dP variations in observation well P2. This well was used because its behavior is similar to that of the S6 spring. It reflects the average dynamics of the unconfined landslide’s breccia aquifer (Figure 5). This calculation was carried out over the time scale of each rainfall episode. A rainfall episode is defined here as rainfall of a duration of one to several consecutive days associated with the same meteorological event. We identified six rainfall events during the 2011–2012 period (Table 3).
To this end, the amplitude of the piezometric rise (dP) induced by the considered recharge episode was multiplied by the aquifer surface and its porosity. Several porosity values were tested (from 5% to 15%). The volumes thus obtained for each recharge episode were then compared to those calculated by the water-balance model. The porosity values obtained for the breccia aquifer were compared with our knowledge of the aquifer’s geology (degree of consolidation, presence of clayey material, grain size) and from porosity values described in the literature [80].
3. Results
3.1. Estimating Outflow from the Grand Ilet Landslide
The continuous monitoring of flow from springs S6 (hydrologic cycles 2011 and 2012), S17 and S15 (hydrologic cycle 2012) allowed their outflow to be quantified with a precision of ±10% (equal to the flow-measurement precision). In 2011, the monitoring of springs S17 and S15 was not operational for the entire period. Outflow was only measured with an accuracy of ±10% between 1 August 2012 and 31 December 2012. The inaccessible springs (S3, S7, S8, S10, S13), whose flow was visually estimated, represent 15% of the total outflow. The remaining 48% of the 2011 annual flow part correspond to springs whose flow was occasionally measured (PM springs in Table 1, 2011 column). In 2012, the flows from springs S6, S15 and S17 were measured with a precision of ±10%, permitting control of 43% of outflow from the Grand Ilet landslide. The inaccessible springs with visually estimated flow rates represented about 15% of the flow from the Grand Ilet landslide. The remaining 41% of the 2012 annual flow part were springs whose flow was occasionally measured (PM springs in Table 1, 2012 column).
3.2. Hydrodynamic Response of the Aquifer
Even though some differences in hydrodynamic response were observed in the flow from springs at the scale of the landslide, their dynamics are homogeneous and very comparable to those measured in the breccia aquifer (observation wells P1, P2 and P3). Furthermore, the observed piezometric fluctuations in the breccia aquifer showed that only significant rainfall events (more than about 80 mm/event from our dataset) generate a piezometric response in the aquifer as identified on the piezometers (Figure 9) or at the springs. Rainfall outside the cyclone season does not generate recharge that is detectable in the piezometric records. In all, only six rainfall episodes (Table 3) generated detectable recharge between January 2011 and December 2012 (two events during the rainy season of 2011 and four during the rainy season of 2012). It is worth noting that only these six rainfall episodes generated increases in the landslide’s sliding velocity (Figure 3).
3.3. Breakdown of the Hydrograph and Runoff Coefficient
The Clain (S6) station is representative of the breccia watershed. Note that its topographic watershed area—0.0064 km2—is very small when compared to its groundwater watershed (1.4 km²). 16 rainfall events generated significant surface runoff at this Clain hydrometric station over the period 2011–2012 (Figure 10a). For 14 of the 16 events, the runoff coefficients correlate positively with the rainfall amount. The runoff coefficients Rc vary between 0.5% for a rainfall event of 10 mm over one day, to 2.6% for a rainfall event of 650 mm over four days (Rc median = 1.8% over the 16 events, Figure 10b). Two rainfall events generated significantly higher runoff coefficients (although still quite low) of 3.1% and 3.4% for events of 30.9 mm/event and 80 mm/event, respectively. This is due to exceptionally high rainfall intensities that were not reflected in the (averaged) daily records.
For the Ravine Blanche (S1) station (rampart watershed), a much larger number of events (75) was observed over the same 2011–2012 period (Figure 10a). Moreover, the calculated runoff coefficients are much higher than on the landslide. They vary between 1.3% and 65.3% (Rc median = 14.6%, Figure 10b). The runoff coefficients calculated for the ramparts agree with the values provided by studies carried out in the Piton de La Fournaise area [75]. Our data are highly relevant for evaluating the runoff proportion. The type of substratum has a significant impact on runoff, with the latter being about 10 times greater over the ramparts than over the breccia.
3.4. Water Budget
Evapotranspiration was computed with the Blanley–Criddle formula (PETBC) with a cultural coefficient representative of dense vegetation cover anda HBr value of about 250 mm for the soil reservoir. This allows calculation of a recharge volume close to that estimated from the spring’s outflows (Table 4).
The sensitivity of the water budget to variations in the H value of the soil reservoir was tested for the breccia (Figure 11). The greater the storage capacity of the soil reservoir (HBr), the greater the volume of required rainfall will be during the first rainy episode(s) of the rainy season before a recharge flux toward the aquifer will be observed. This is due to the fact that the soil reservoir presents a large water deficit at the end of the dry season. The deviation of the model is smallest when the HBr coefficient of the soil reservoir is about 250 mm (Table 4). It allows good reproduction (i) of the occurrence of piezometric variations and (ii) of their amplitude, as well as the landslide’s dynamics (Figure 11).
Furthermore, the piezometric fluctuations observed in the breccia aquifer showed that only significant rainfall events (more than about 80 mm/event from our dataset) generate a piezometric response in the aquifer (Figure 10). Rainfall outside the cyclone season does not generate recharge that is detectable in piezometric records (Figure 10). This is consistent with the fact that the discharge regime (both of the streams and of the aquifer—the piezometric decrease) is not sustained by slow water motion in the unsaturated zone of the landslide’s aquifer during the dry season [61]. This water precipitated during the dry season is, thus, exclusively used by the vegetation (evapotranspiration). In all, only six rainfall episodes (Table 3) generated detectable recharge between January 2011 and December 2012: two events during the rainy season of 2011 and four during the rainy season of 2012. Over the two hydrologic cycles studied (2011–2012), despite the high total rainfall over this period of time (4777 mm), 63% (2990 mm) of the rainfall is taken up by evapotranspiration, 36% (1728 mm) contributes to aquifer recharge and only 1% (51 mm) to runoff (Table 5). This result is robust as it is grounded on a complete water budget of the landslide. However, this distribution changes with the hydrologic cycles. For instance, the percentage of infiltration compared to rainfall (Ar/R) varies between 26% (year 2011, a drier year than average) and 45% (year 2012, a wetter year). As is usual for Ar-R relationships, the Ar/R relationship is non-linear and as a consequence the same coefficient cannot be used from one year to another.
Aquifer recharge is mainly ensured by rainfall on the whole of the landslide’s catchment basin (breccias). In fact, the relative input (infiltration of runoff) from the rampart represents only 19% of the total recharge. The exoreic surfaces (that nevertheless have a runoff = 1% of rainfall) mostly control recharge. Their relative contribution is 57% of total recharge. The endoreic part of the catchment basin (the ‘dry pools’) ensures only 24% of the total recharge. This magnitude is similar to their surface (27%). Thus, even if their morphology suggests a higher recharge rate, these endoreic basins do not recharge more than the exoreic part of the landslide. In fact, the runoff coefficient of the latter is also very low. The endoreic areas only occupy 27% of the landslide’s surface. Focusing only on them, for instance for collecting runoff, is consequently not the ‘solution’ to curb the landslide’s dynamics.
3.5. Validation of the Water Budget from Piezometric Variations
On the scale of the landslide, the recharge volumes calculated from the mean amplitude of the piezometric variations were compared, event by event, to the recharge volume calculated with the water budget model (see detailed presentation of these results in Supplementary Materials). This again showed that the HBr value of 250 mm systematically calculates volumes that are coherent with those estimated from the piezometric variations. Moreover, from these data, effective porosity (= specific yield in unconfined aquifer) of the breccia aquifer is estimated at about 8% in the zone of piezometric variation. This estimation of effective porosity is very realistic for this type of aquifer.
4. Discussion
4.1. Hydrological Processes
Our approach shows that most of the recharge of the landslide aquifer consists of infiltration through its surface, or 80% of total recharge (exorheic and endorheic watersheds), whereas localized recharge from streams only contributes to less than 20%. Recharge through the landslide’s catchment basin is predominantly the case, as runoff is of minor importance. This characteristic is explained by high soil hydraulic conductivity, associated with the active and extensive deformation of the landslide favoring the formation of macroporosity. This macroporosity permits rapid infiltration into the first layers of soil. Paradoxically, however, this high hydraulic conductivity does not influence the soil’s (pedological horizon) storage capacity. This remains particularly high at about 250 mm, which is explained by both the storage capacity in the soil and the interception related to the dense vegetation cover [74], that represents a non-negligible part of the evapotranspiration in a tropical environment [81]. It has already been shown that the soil developed over the breccia formations [59] has high water-storage potential (about 250 mm), compared to other values known for soils on Reunion Island, that in existing studies [76,82,83] stand at lower than 200 mm.
As runoff is quasi nil on the landslide, recharge is the major part of the precipitated rain (about 40%). However, only rainfall episodes with a high cumulated volume are truly efficient in terms of recharge and this occurs in only two configurations: (i) when the soil reservoir is full or rather full before the rainfall episode, and/or (ii) when the cumulated rainfall is very high, to complete soil storage and then generate recharge. In fact, the latter generates little storage (at most 250 mm if the soil reserve is empty before the episode), little evapotranspiration, as the rainfall occurs over a short period of time, and thus much infiltration, proportional to the quantity of precipitated rain. Consequently, such recharge occurs only during the rainy season, as firstly, the storage capacity in the soil (soil reservoir) is high (250 mm) and secondly, evapotranspiration is high because it occurs year-round, due to the tropical climate and because of the dense vegetation cover. These properties mean that all of the dry-season rain and much of the rainy-season rain is evapotranspirated. The evapotranspiration quantified in our case is significantly higher than the usual values estimated for Reunion Island [61,62,63]. The latter are thus ill-suited to the invasive cirque vegetation. However, it is similar to that found in other wet tropical climates [79]. The hydrology of the soils developed over the landslide and more generally over unstructured volcano-detrital rock is, therefore, quite different from the hydrology of most other volcanic environments [79]. Our approach highlights the inherent specifics of this type of landslide in a tropical context. It also emphasizes the importance of considering the effects of vegetation on surface processes [84,85]. This general configuration of the landslide surface appears favorable to: (i) imiting the quantity of rain arriving on the soil because of interception by vegetation; (ii) rapid infiltration in the soil, whose properties allow major storage; (iii) strong evapotranspiration by vegetation from soil-water reserve throughout the hydrologic cycle and (iv) low recharge of the landslide aquifer, few piezometric increases andslow sliding dynamics.
4.2. Landslide Activity
Regarding landslide activity, previous studies [23,55,61] have shown that (i) sliding accelerations are observed only after intense rainfall events and (ii) the amplitude of accelerations varies in accordance with the timing of rainfall events during the wet season (no linear features) [23]. Therefore, the recharge modalities of the landslide highlighted in our study appear perfectly correlated with the activity of the landslide. As presented before, at the beginning of the wet season rainfall events fill the soil reservoir. They do not generate an increase in piezometric level and thus an acceleration of the landslide. On the other hand, the same intense rainfall event, but occurring when the soil reservoir is full, generates rapid and significant accelerations of the landslide. It is obvious that the latter episodes are the most destructive, since the magnitude of the recharge is then directly proportional to the cumulative rainfall. In this case, the soil reservoir does not play the role of ‘buffer tank’ that it can take on during the dry season or at the beginning of the wet season. As regards modeling the dynamics of large landslides, quantification of the recharge function significantly improves the results of the predictive models [23]. The first such tests indicate that most non-linear features of the rainfall/displacement relationship are well reproduced by such models when using the recharge function as an alternative input for rainfall records. This improvement confirms the importance of quantifying recharge when studying landslide dynamics.
This study confirms that landcover very strongly controls the recharge function of this type of aquifer and consequently the sliding dynamics. In the hypothetical case whereby the entire landslide surface is cultivated (lower evapotranspiration and lower H value of the soil reservoir as a consequence of shallower prospection of vegetation roots), recharge will be almost doubled. The landslide will then exhibit a much more dynamic sliding. Thus, it is necessary to maintain dense and ‘natural’ vegetation cover on the catchment basin of the landslide to preserve high evapotranspiration and slow movements.
Ultimately, the regulating function of vegetation is paramount for reducing the displacement velocity of this type of landslide, which is strongly controlled by piezometric variations [23]. In addition, this high evapotranspiration is unfavorable for: (i) the formation of permanent aquifers in the cirques of Reunion Island with less rainfall (Cilaos and Mafate, Figure 2), and (ii) initiating and maintaining large active landslides controlled by groundwater in these areas. This is consistent with the fact that no large-size actively unstable areas were found in the other cirques of Reunion Island, despite similar morphological and geological settings. Moreover, it is clear that such a landslide in a temperate climate would only be recharged very little (as rainfall is much lower there) and thus would have very limited activity compared to that observed in the Salazie cirque on Reunion Island, but would also strongly react to the landcover type.
In terms of geotechnical application, draining the groundwater is surely the most efficient solution for slowing down the landslide. But this would be technically difficult to implement at the scale of such a large landslide/aquifer. Collecting runoff presents little interest because of the low runoff coefficients here. Moreover, as we noted above, collecting runoff in the ‘dry pools’ areas is not the ‘solution‘. Decreasing the cultivated area (currently 30% of the landslide surface) would reduce landslide activity. From the results of the present study, it is possible to simulate such a scenario.
4.3. Implications, Limits and Perspectives
This study shows that establishing the groundwater budget of a landslide is a robust means to compute its recharge and consequently also to establish an efficient model linking rainfall to recharge and thus to landslide dynamics. Nevertheless, comparing the piezometric dynamics from appropriately chosen piezometers (i.e. piezometers that accurately reproduce the average piezometry of the landslide, as shown by the dynamics of the main springs) and rainfall events may also enable computation of an appropriate proxy of the recharge.
The methodology used in this study is probably not always applicable to all case studies. Among others, the exhaustive monitoring of outflows is generally difficult to implement on landslides. This flow monitoring could also be an interesting improvement if it were necessary to reduce the uncertainties of our approaches. The installation of additional gauging weirs would then be required. Because of this complexity and regarding the gap of knowledge about large landslides under tropical conditions, the results obtained certainly provide a useful reference for future hydrogeological approaches in this context.
In terms of perspectives, the use of the water budget model on longer time series, including exceptionally dry or wet years, is an interesting way of improving our results, especially in the current context of climate change. In addition, our results can be used for the development of hydromechanical discretized deterministic models, useful for dimensioning landslide stabilization solutions. Knowledge of the recharge function (input function of the model) will indeed significantly reduce the uncertainties of the model. More generally, other recent research work has confirmed that using efficient rainfall instead of raw rainfall improves the correlation between the rainfall process and displacement velocity [24,41], in particular for large landslides. Consequently, it seems crucial to pursue the characterization of landslides in a tropical environment, not only to better identify their particularities in comparison to the intensely studied examples in temperate environments, but also for improved assessment of their inherent hazards and risks.
5. Conclusions
The recharge of the Grand Ilet landslide aquifer was characterized through a multi-disciplinary approach, comprising notably a precise water budget of the landslide (outflows = inflows). This approach ensures the robustness of the hydrogeological conceptual models of the landslide and their geotechnical consequences.
Exceptionally low runoff coefficients are observed (less than 5% for intense rainfall events), associated with a high rainfall threshold for generating recharge of the landslide aquifer. As a result, only major rainfall episodes during the rainy season induce recharge of the landslide aquifer and consequently landslide velocity increases. The storage of a large quantity of water (up to about 250 mm) in shallow soil layers, coupled with elevated real evapotranspiration of about 1500 mm/year (due to the dense tropical broad-leaved vegetation), explains the relatively low aquifer recharge and so the relatively low outflow from the landslide. This low recharge and its regime are also perfectly consistent with the strongly buffered piezometric and sliding responses of the landslide to rainfall. Direct infiltration through the surface of the landslide dominates (≈ 80%), whereas localized recharge from streams contributes to less than 20%. Surface processes thus play a major role in the recharge regime of this large-size landslide aquifer. Therefore, maintaining natural vegetation cover over much of the landslide surface appears necessary for limiting aquifer recharge and thus displacements. Other operational recommendations to reduce sliding are provided in the paper.
This study provides a methodological framework for future landslide studies, particularly for modeling their recharge, a key parameter of their dynamics. It also provides a reference context for future hydrogeological approaches applied to large-size landslides. Comparison with results obtained from other landslides, notably, but not only, in a tropical environment, will materially contribute to enriching the discussion on recharge of large-size landslides.
Supplementary Materials
The following are available online at https://www.mdpi.com/2073-4441/10/10/1491/s1.
Author Contributions
Writing: P.B., B.A., P.L., B.L., J.-L.J. Data acquisition: P.B., B.A. and the BRGM team. Calculations: P.B., B.A., B.L. Interpretations: P.B., B.A., P.L., B.L., J.-L.J.
Funding
This research received no external funding.
Acknowledgments
This work was funded by Reunion Island’s Regional Council and Department Council, the European Union, the French Government and the Bureau de Recherches Géologiques et Minières (MVTerre 1 and MVTerre 2 projects). The authors wish to thank everyone who contributed to this work, particularly for field data collection and for the installation, operation and optimization of the monitoring networks.
Conflicts of Interest
The authors declare no conflict of interest.
References
- Gutiérrez, F.; Soldati, M.; Audemard, F.; Bălteanu, D. Recent advances in landslide investigation: Issues and perspectives. Geomorphology 2010, 124, 95–101. [Google Scholar] [CrossRef]
- Varnes, D.J. Slope Movement Types and Processes; Transportation Research Board: Washington, DC, USA, 1978; pp. 11–33. [Google Scholar]
- Terzaghi, K. Mechanisms of Landslides; Geological Society of America: Boulder, CO, USA, 1950; pp. 83–123. [Google Scholar]
- Nemčok, A.; Pašek, J.; Rybář, J. Classification of landslides and other mass movements. Rock Mech. 1972, 4, 71–78. [Google Scholar] [CrossRef]
- Cruden, D.M.; Varnes, D.J. Landslides Types and Processes; National Academy of Sciences: Washington, DC, USA, 1996; pp. 36–75. [Google Scholar]
- Popescu, M.E. Landslides Causal Factors and Landslide Remediatial Options. In Proceedings of the 3rd International Conference Landslides, Slope Stability and Safety of Infra-Structures, Singapore, 11–12 July 2002; pp. 61–81. [Google Scholar]
- Iverson, R.M.; Major, J.J. Rainfall, ground-water flow and seasonal movement at Minor Creek landslide, northwestern California: Physical interpretation of empirical relations. Geol. Soc. Am. 1987, 99, 579–594. [Google Scholar] [CrossRef]
- Baum, R.L.; Reid, M.E. Geology, Hydrology and Mechanics of the Alani-Paty Landslide, Manoa Valley, Oahu, Hawaii; USGS: Reston, VA, USA, 1992; p. 87.
- van Asch, T.W.J.; Buma, J.; Van Beek, L.P. A view on some hydrological triggering systems in landslides. Geomorphology 1999, 30, 25–32. [Google Scholar] [CrossRef]
- Coe, J.; Ellis, W.; Godt, J.; Savage, W.; Savage, J.; Michael, J.; Kibler, J.; Powers, P.; Lidke, D.; Debray, S. Seasonal movement of the Slumgullion landslide determined from Global Positioning System surveys and field instrumentation, July 1998–March 2002. Eng. Geol. 2003, 68, 67–101. [Google Scholar] [CrossRef]
- Cappa, F.; Guglielmi, Y.; Soukatchoff, V.M.; Mudry, J.; Bertrand, C.; Charmoille, A. Hydromechanical modeling of a large moving rock slope inferred from slope levelling coupled to spring long-term hydrochemical monitoring: Example of the La Clapière landslide (Southern Alps, France). J. Hydrol. 2004, 291, 67–90. [Google Scholar] [CrossRef]
- Iverson, R.M. Landslide triggering by rain infiltration. Water Resour. Res. 2000, 36, 1897–1910. [Google Scholar] [CrossRef] [Green Version]
- Rutqvist, J.; Stephansson, O. The role of hydromechanical coupling in fractured rock engineering. Hydrogeol. J. 2003, 11, 7–40. [Google Scholar] [CrossRef] [Green Version]
- Bernardie, S.; Desramaut, N.; Malet, J.-P.; Gourlay, M.; Grandjean, G. Prediction of changes in landslide rates induced by rainfall. Landslides 2015, 12, 481–494. [Google Scholar] [CrossRef]
- Malet, J.P.; Van Asch, T.W.G.; Van Beek, R.; Maquaire, O. Forecasting the behaviour of complex landslides with a spatially distributed hydrological model. Nat. Hazards Earth Syst. Sci. 2005, 5, 71–85. [Google Scholar] [CrossRef] [Green Version]
- Matsuura, S.; Asano, S.; Okamoto, T. Relationship between rain and/or meltwater, pore-water pressure and displacement of a reactivated landslide. Eng. Geol. 2008, 101, 49–59. [Google Scholar] [CrossRef]
- Berti, M.; Simoni, A. Observation and analysis of near-surface pore-pressure measurements in clay-shales slopes. Hydrol. Process. 2012, 26, 2187–2205. [Google Scholar] [CrossRef]
- Tacher, L.; Bonnard, C.; Laloui, L.; Parriaux, A. Modelling the behaviour of a large landslide with respect to hydrogeological and geomechanical parameter heterogeneity. Landslides 2005, 2, 3–14. [Google Scholar] [CrossRef]
- François, B.; Tacher, L.; Bonnard, C.; Laloui, L.; Triguero, V. Numerical modelling of the hydrogeological and geomechanical behaviour of a large slope movement: The Triesenberg landslide (Liechtenstein). Can. Geotech. J. 2007, 44, 840–857. [Google Scholar] [CrossRef]
- Schulz, W.; McKenna, J.; Kibler, J.; Biavati, G. Relations between hydrology and velocity of a continuously moving landslide—evidence of pore-pressure feedback regulating landslide motion? Landslides 2009, 6, 181–190. [Google Scholar] [CrossRef]
- Brocca, L.; Ponziani, F.; Moramarco, T.; Melone, F.; Berni, N.; Wagner, W. Improving landslide forecasting using ASCAT-derived soil moisture data: A case study of the Torgiovannetto landslide in central Italy. Remote Sens. 2012, 4, 1232–1244. [Google Scholar] [CrossRef]
- Ponziani, F.; Pandolfo, C.; Stelluti, M.; Berni, N.; Brocca, L.; Moramarco, T. Assessment of rainfall thresholds and soil moisture modeling for operational hydrogeological risk prevention in the Umbria region (central Italy). Landslides 2012, 9, 229–237. [Google Scholar] [CrossRef]
- Belle, P.; Aunay, B.; Bernardie, S.; Grandjean, G.; Ladouche, B.; Mazué, R.; Join, J.-L. The application of an innovative inverse model for understanding and predicting landslide movements (Salazie cirque landslides, Reunion Island). Landslides 2014, 11, 343–355. [Google Scholar] [CrossRef]
- Vallet, A.; Charlier, J.B.; Fabbri, O.; Bertrand, C.; Carry, N.; Mudry, J. Functioning and precipitation-displacement modelling of rainfall-induced deep-seated landslides subject to creep deformation. Landslides 2016, 13, 653–670. [Google Scholar] [CrossRef]
- Corominas, J.; Moya, J.; Ledesma, A.; Lloret, A.; Gili, J. Prediction of ground displacements and velocities from groundwater level changes at the Vallcebre landslide (Eastern Pyrenees, Spain). Landslides 2005, 2, 83–96. [Google Scholar] [CrossRef]
- Padilla, C.; Onda, Y.; Iida, T.; Takahashi, S.; Uchida, T. Characterization of the groundwater response to rainfall on a hillslope with fractured bedrock by creep deformation and its implication for the generation of deep-seated landslides on Mt. Wanitsuka, Kyushu Island. Geomorphology 2014, 204, 444–458. [Google Scholar] [CrossRef]
- Travelletti, J.; Sailhac, P.; Malet, J.-P.; Grandjean, G.; Ponton, J. Hydrological response of weathered clay-shale slopes: Water infiltration monitoring with time-lapse electrical resistivity tomography. Hydrol. Process. 2012, 26, 2106–2119. [Google Scholar] [CrossRef]
- Debieche, T.-H.; Bogaard, T.A.; Marc, V.; Emblanch, C.; Krzeminska, D.M.; Malet, J.-P. Hydrological and hydrochemical processes observed during a large-scale infiltration experiment at the Super-Sauze mudslide (France). Hydrol. Process. 2012, 26, 2157–2170. [Google Scholar] [CrossRef]
- Bièvre, G.; Jongmans, D.; Winiarski, T.; Zumbo, V. Application of geophysical measurements for assessing the role of fissures in water infiltration within a clay landslide (Trièves area, French Alps). Hydrol. Process. 2012, 26, 2128–2142. [Google Scholar] [CrossRef] [Green Version]
- Parriaux, A.; Bonnard, C.; Tacher, L. Glissements de Terrain: Hydrogéologie et Techniques D’assainissement Par Drainage; Office fédéral de l’environnement: Berne, Switzerland, 2010; p. 128. (In French) [Google Scholar]
- van Asch, T.W.J.; Van Beek, L.P.; Bogaard, T. Problems in predicting the mobility of slow-moving landslides. Eng. Geol. 2007, 91, 46–55. [Google Scholar] [CrossRef]
- Tullen, P. Méthodes D’analyse du Fonctionnement Hydrogéologique des Versants Instables; Ecole polytechnique fédérale de Lausanne: Lausanne, Switzerland, 2002. (In French) [Google Scholar]
- Maréchal, J.C.; Lachassagne, P.; Ladouche, B.; Dewandel, B.; Lanini, S.; Strat, P.; Petelet-Giraud, E. Structure and hydrogeochemical functioning of a sparkling natural mineral water system determined using a multidisciplinary approach: A case study from southern France. Hydrogeol. J. 2014, 22, 47–68. [Google Scholar] [CrossRef]
- Guglielmi, Y.; Bertrand, C.; Compagnon, F.; Follacci, J.; Mudry, J. Acquisition of water chemistry in a mobile fissured basement massif: Its role in the hydrogeological knowledge of the La Clapière landslide (Mercantour massif, southern Alps, France). J. Hydrol. 2000, 229, 138–148. [Google Scholar] [CrossRef]
- Binet, S.; Mudry, J.; Scavia, C.; Campus, S.; Bertrand, C.; Guglielmi, Y. In situ characterization of flows in a fractured unstable slope. Geomorphology 2007, 86, 193–203. [Google Scholar] [CrossRef] [Green Version]
- Binet, S.; Jomard, H.; Lebourg, T.; Guglielmi, Y.; Tric, E.; Bertrand, C.; Mudry, J. Experimental analysis of groundwater flow through a landslide slip surface using natural and artificial water chemical tracers. Hydrol. Process. 2007, 21, 3463–3472. [Google Scholar] [CrossRef] [Green Version]
- Charlier, J.-B.; Bertrand, C.; Binet, S.; Mudry, J.; Bouillier, N. Use of continuous measurements of dissolved organic matter fluorescence in groundwater to characterize fast infiltration through an unstable fractured hillslope (Valabres rockfall, French Alps). Hydrogeol. J. 2010, 18, 1963–1969. [Google Scholar] [CrossRef] [Green Version]
- Vallet, A.; Bertrand, C.; Mudry, J.; Bogaard, T.; Fabbri, O.; Baudement, C.; Régent, B. Contribution of time-related environmental tracing combined with tracer tests for characterization of a groundwater conceptual model: A case study at the Séchilienne landslide, western Alps (France). Hydrogeol. J. 2015, 23, 1761–1779. [Google Scholar] [CrossRef]
- Guglielmi, Y.; Vengeon, J.; Bertrand, C.; Mudry, J.; Follacci, J.; Giraud, A. Hydrogeochemistry: An investigation tool to evaluate infiltration into large moving rock masses (case study of La Clapière and Séchilienne alpine landslides). Bull. Eng. Geol. Environ. 2002, 61, 311–324. [Google Scholar] [CrossRef]
- Tullen, P.; Turberg, P.; Parriaux, A. Radiomagnetotelluric mapping, groundwater numerical modelling and 18-Oxygen isotopic data as combined tools to determine the hydrogeological system of a landslide prone area. Eng. Geol. 2006, 87, 195–204. [Google Scholar] [CrossRef]
- Vallet, A.; Bertrand, C.; Mudry, J. Effective rainfall: A significant parameter to improve understanding of deep-seated rainfall triggering landslide – a simple computation temperature based method applied to Séchilienne unstable slope (French Alps). Hydrol. Earth Syst. Sci. Discuss. 2013, 10, 8945–8991. [Google Scholar] [CrossRef]
- Terlien, M.T.J. Hydrological landslide triggering in ash-covered slopes of Manizales (Columbia). Geomorphology 1997, 20, 165–175. [Google Scholar] [CrossRef]
- Larsen, M.C.; Torres-Sánchez, A.J. The frequency and distribution of recent landslides in three montane tropical regions of Puerto Rico. Geomorphology 1998, 24, 309–331. [Google Scholar] [CrossRef] [Green Version]
- Nagarajan, R.; Roy, A.; Vinod Kumar, R.; Mukherjee, A.; Khire, M.V. Landslide hazard susceptibility mapping based on terrain and climatic factors for tropical monsoon regions. Bull. Eng. Geol. Environ. 2000, 58, 275–287. [Google Scholar] [CrossRef]
- Anderson, M.G.; Kemp, M.F. Towards an improved specification of slope hydrology in the analysis of slope instability problems in the tropics. Prog. Phys. Geogr. 1991, 15, 29. [Google Scholar] [CrossRef]
- Anderson, M.G.; Collison, A.J.C.; Hartshorne, J.; Lloyd, D.M.; Park, A. Developments in Slope Hydrology-Stability Modelling for Tropical Slopes; Anderson, M.G., Brooks, S.M., Eds.; Wiley: Chichester, UK, 1996; Volume 2, pp. 799–821. [Google Scholar]
- Collison, A.J.C.; Anderson, M.G. Using a combined slope hydrology/stability model to identify suitable conditions for landslide prevention by vegetation in the humid tropics. Earth Surf. Process. Landf. 1996, 21, 737–747. [Google Scholar] [CrossRef]
- Fernandes, N.F.; Guimarães, R.F.; Gomes, R.A.T.; Vieira, B.C.; Montgomery, D.R.; Greenberg, H. Topographic controls of landslides in Rio de Janeiro: Field evidence and modeling. Catena 2004, 55, 163–181. [Google Scholar] [CrossRef]
- Join, J.-L.; Coudray, J.; Longworth, K. Using principal components analysis and Na/Cl ratios to trace groundwater circulation in a volcanic island: The example of Reunion. J. Hydrol. 1997, 190, 1–18. [Google Scholar] [CrossRef]
- Join, J.-L.; Folio, J.-L.; Robineau, B. Aquifers and groundwater within active shield volcanoes. Evolution of conceptual models in the Piton de la Fournaise volcano. J. Volcanol. Geotherm. Res. 2005, 147, 187–201. [Google Scholar] [CrossRef]
- Charlier, J.-B.; Lachassagne, P.; Ladouche, B.; Cattan, P.; Moussa, R.; Voltz, M. Structure and hydrogeological functioning of an insular tropical humid andesitic volcanic watershed: A multi-disciplinary experimental approach. J. Hydrol. 2011, 398, 155–170. [Google Scholar] [CrossRef]
- Rouquet, S.; Boivin, P.; Lachassagne, P.; Ledoux, E. A 3-D genetic approach for the high resolution geological modelling of the volcanic infill of a paleovalley system. Application to the Volcanic catchment (Chaîne des Puys, France). Bull. Soc. Geol. Fr. 2012, 183, 395–407. [Google Scholar] [CrossRef]
- Lachassagne, P.; Aunay, B.; Frissant, N.; Guilbert, M.; Malard, A. Hydrogeological Conceptual Model of a Complex Basaltic Volcanic islands. The Mayotte, Comores, Case Study; Terra Nova: Santa Fe, NM, USA, 2014. [Google Scholar]
- Météo-France. Atlas Climatique de La Réunion; Météo-France: Saint-Denis, France, 2011; p. 132. [Google Scholar]
- Garnier, C. Etude du glissement de terrain de grande ampleur de Grand Ilet, Cirque de Salazie-Ile de la Réunion; Bureau de Recherches Géologiques et Minières (BRGM): Paris, Franch, 2008; p. 74. (In French) [Google Scholar]
- Deniel, C.; Kieffer, G.; Lecointre, J. New 230Th-238U and 14C age determinations from Piton des Neiges volcano, Reunion—A revised chronology for the differentiated series. J. Volcanol. Geotherm. Res. 1992, 51, 253–267. [Google Scholar] [CrossRef]
- Oehler, J.-F.; Labazuy, P.; Lénat, J.-F. Recurrence of major flank landslides during the last 2-Ma-history of Reunion Island. Bull. Volcanol. 2004, 66, 585–598. [Google Scholar] [CrossRef]
- Oehler, J.-F.; Lénat, J.-F.; Labazuy, P. Growth and collapse of the Reunion Island volcanoes. Bull. Volcanol. 2008, 70, 717–742. [Google Scholar] [CrossRef]
- Arnaud, N. Les Processus de Démantèlement des Volcans, le cas d’un Volcan Bouclier en Milieu Océanique: Le Piton des Neiges. Ph.D. Thesis, Université de la Réunion, Saint-Denis, La Réunion, 2005. (In French). [Google Scholar]
- Famin, V.; Michon, L. Volcano destabilization by magma injections in a detachment. Geology 2010, 28, 219–222. [Google Scholar] [CrossRef]
- Belle, P. Contribution des Processus Hydrologiques et Hydrogéologiques aux Glissements de Terrain de Grande Ampleur: Application au Contexte Tropical de La Réunion. Ph.D. Thesis, Université de La Réunion, Saint-Denis, La Réunion, April 2014. [Google Scholar]
- Pinchinot, H. Etude Géologique des Formations Superficielles et du Proche Substratum à Grand Ilet (Cirque de Salazie, La Réunion). Application à la Cartographie du Risque de Mouvements de Versants. Ph.D. Thesis, Université scientifique et médicale de Grenoble, Grenoble, Franch, October 1984. (In French). [Google Scholar]
- Raunet, M. Le Milieu Physique et Les Sols de l’île de La Réunion. Conséquences Pour la Mise en Valeur Agricole; Centre de Coopération Internationale en Recherche Agronomique Pour le (CIRAD): Paris, Franch, 1991; p. 515. (In French) [Google Scholar]
- Courtois, N.; Lachassagne, P.; Wyns, R.; Blanchin, R.; Bougaïré, F.D.; Somé, S.; Tapsoba, A. large-scale mapping of hard-rock aquifer properties applied to Burkina Faso. Groundwater 2009, 48, 269–283. [Google Scholar] [CrossRef] [PubMed]
- Singh, V.P. Hydrologic Systems: Watershed Modeling; Prentice-Hall: Bergen, NJ, USA, 1989; Volume 2. [Google Scholar]
- Xu, C.-Y.; Singh, V.P. Evaluation and generalization of temperature-based methods for calculating evaporation. Hydrol. Process. 2001, 15, 305–319. [Google Scholar] [CrossRef] [Green Version]
- Tabari, H.; Hosseinzadeh Talaee, P.; Some’e, B.S. Spatial modelling of reference evapotranspiration using adjusted Blaney-Criddle equation in an arid environment. Hydrol. Sci. J. 2013, 58, 408–420. [Google Scholar] [CrossRef] [Green Version]
- Blaney, H.F.; Criddle, W.D. Determining Water Needs from Climatological Data; USDA Soil Conservation Service: Washington, DC, USA, 1950. [Google Scholar]
- Bargeas, A. Evaluation Globale de la Ressource en eau de l’île de la Réunion; Apports de la Simulation par Modèles Hydrologiques; Bureau de Recherches Géologiques et Minières (BRGM): Orléans, France, 1984; p. 384. [Google Scholar]
- Szydłowski, M.; Szpakowski, W.; Zima, P. Numerical simulation of catastrophic flood: The case study of hypothetical failure of the Bielkowo hydro-power plant reservoir. Acta Geophys. 2013, 61, 1229–1245. [Google Scholar] [CrossRef]
- Chen, C.-N.; Tsai, C.-H.; Wu, M.-H.; Tsai, C.-T. Numerical simulation of potential inundation in a coastal zone. J. Flood Risk Manag. 2013, 8, 208–223. [Google Scholar] [CrossRef]
- Feng, Y.; Burian, S.; Pomeroy, C. Potential of green infrastructure to restore predevelopment water budget of a semi-arid urban catchment. J. Hydrol. 2016, 542, 744–755. [Google Scholar] [CrossRef]
- Rouquet, S.; Lachassagne, P.; Ledoux, E. Forest Cover Distributed Hydrological Modelling at the Catchment Scale. In Forest and the Water Cycle: Quantity, Quality, Management; Cambridge Scholars Publishing: Newcastle upon Tyne, UK, 2016; Volume 2.5, pp. 153–180. [Google Scholar]
- Klaassen, W.; Bosveld, F.; de Water, E. Water storage and evaporation as constituents of rainfall interception. J. Hydrol. 1998, 212–213, 36–50. [Google Scholar] [CrossRef]
- Barcelo, A. Analyse des Mécanismes Hydrologiques en Domaine Volcanique Insulaire Tropical à Relief Jeune. Apports de la Connaissance du Bilan Hydrique. Massif de La Fournaise (île de la Réunion). Ph.D. Thesis, Université de la Réunion, Saint-Denis, La Réunion, 1996. (In French). [Google Scholar]
- Bessière, H.; Allier, D. Méthode de Quantification Spatiale des Ressources en eau Souterraine de lîle de La Réunion; Bureau de Recherches Géologiques et Minières (BRGM): Orléans, France, 2011; p. 178. (In French) [Google Scholar]
- Lacoste, V.; Daesslé, M. Etude Hydrogéologique et Géophysique de Grand Ilet, Technical Report. 2003; 44. (In French)
- Hewlett, J.D.; Hibbert, A.R. Factors Affecting the Response of Small Watersheds to Precipitation in Humid Areas; Pergamon Press-Oxford & New York: New York, NY, USA, 1965. [Google Scholar]
- Charlier, J.-B.; Cattan, P.; Moussa, R.; Voltz, M. Hydrological behaviour and modelling of a volcanic tropical cultivated catchment. Hydrol. Process. 2008, 22, 4355–4370. [Google Scholar] [CrossRef]
- Castany, G. Traité pratique des eaux souterraines; Dunod: Paris, France, 1963. [Google Scholar]
- Jackson, J.A. Relationships between rainfall parameters and interception by tropical forest. J. Hydrol. 1975, 24, 215–238. [Google Scholar] [CrossRef]
- Payet, N.; Findeling, A.; Chopart, J.-L.; Feder, F.; Nicolini, E.; Saint Macary, H.; Vauclin, M. Modelling the fate of nitrogen following pig slurry application on a tropical cropped acid soil on the island of Réunion (France). Agric. Ecosyst. Environ. 2009, 134, 218–233. [Google Scholar] [CrossRef]
- Chopart, J.-L.; Mézino, M.; Nativel, R. Fluctuation Saisonnière de l’Evapotranspiration (ET0 Penman-Monteith) Dans le Nord, l’Est et le Sud-est de l’île de la Réunion. Ifluence de l’altitude et Comparaison Avec l’Ouest et le Sud; Centre de Coopération Internationale en Recherche Agronomique Pour le (CIRAD): Paris, France, 2003; p. 21. [Google Scholar]
- Lachassagne, P.; Rouquet, S.; Lafforgue, M. Main Quantitative Hydrological Concepts. In Forest and the Water Cycle: Quantity, Quality, Management; Cambridge Scholars Publishing: Newcastle upon Tyne, UK, 2016; pp. 23–38. [Google Scholar]
- Lachassagne, P. Synthesis-Interactions between Forest and Water Resources: Quantitative Impacts. In Forest and the Water Cycle: Quantity, Quality, Management; Cambridge Scholars Publishing: Newcastle upon Tyne, UK, 2017; pp. 570–585. [Google Scholar]
Figure 1.
Synthetic diagram of a landslide’s hydrological and hydrogeological functioning.

Figure 2.
Morphology and rainfall [54] of Reunion Island and location of the Grand Ilet study area in the Salazie cirque.
Figure 2.
Morphology and rainfall [54] of Reunion Island and location of the Grand Ilet study area in the Salazie cirque.

Figure 3.
Daily rainfall (blue) at the Grand Ilet rain gauge RG-GI (Rain Gauge–Grand Ilet) and the cumulative displacement (red) at the GIEG permanent GNSS (Global Navigation Satellite System) from 2005 to 2011 [23]. See location of the rain gauge and GIEG station in Figure 4.
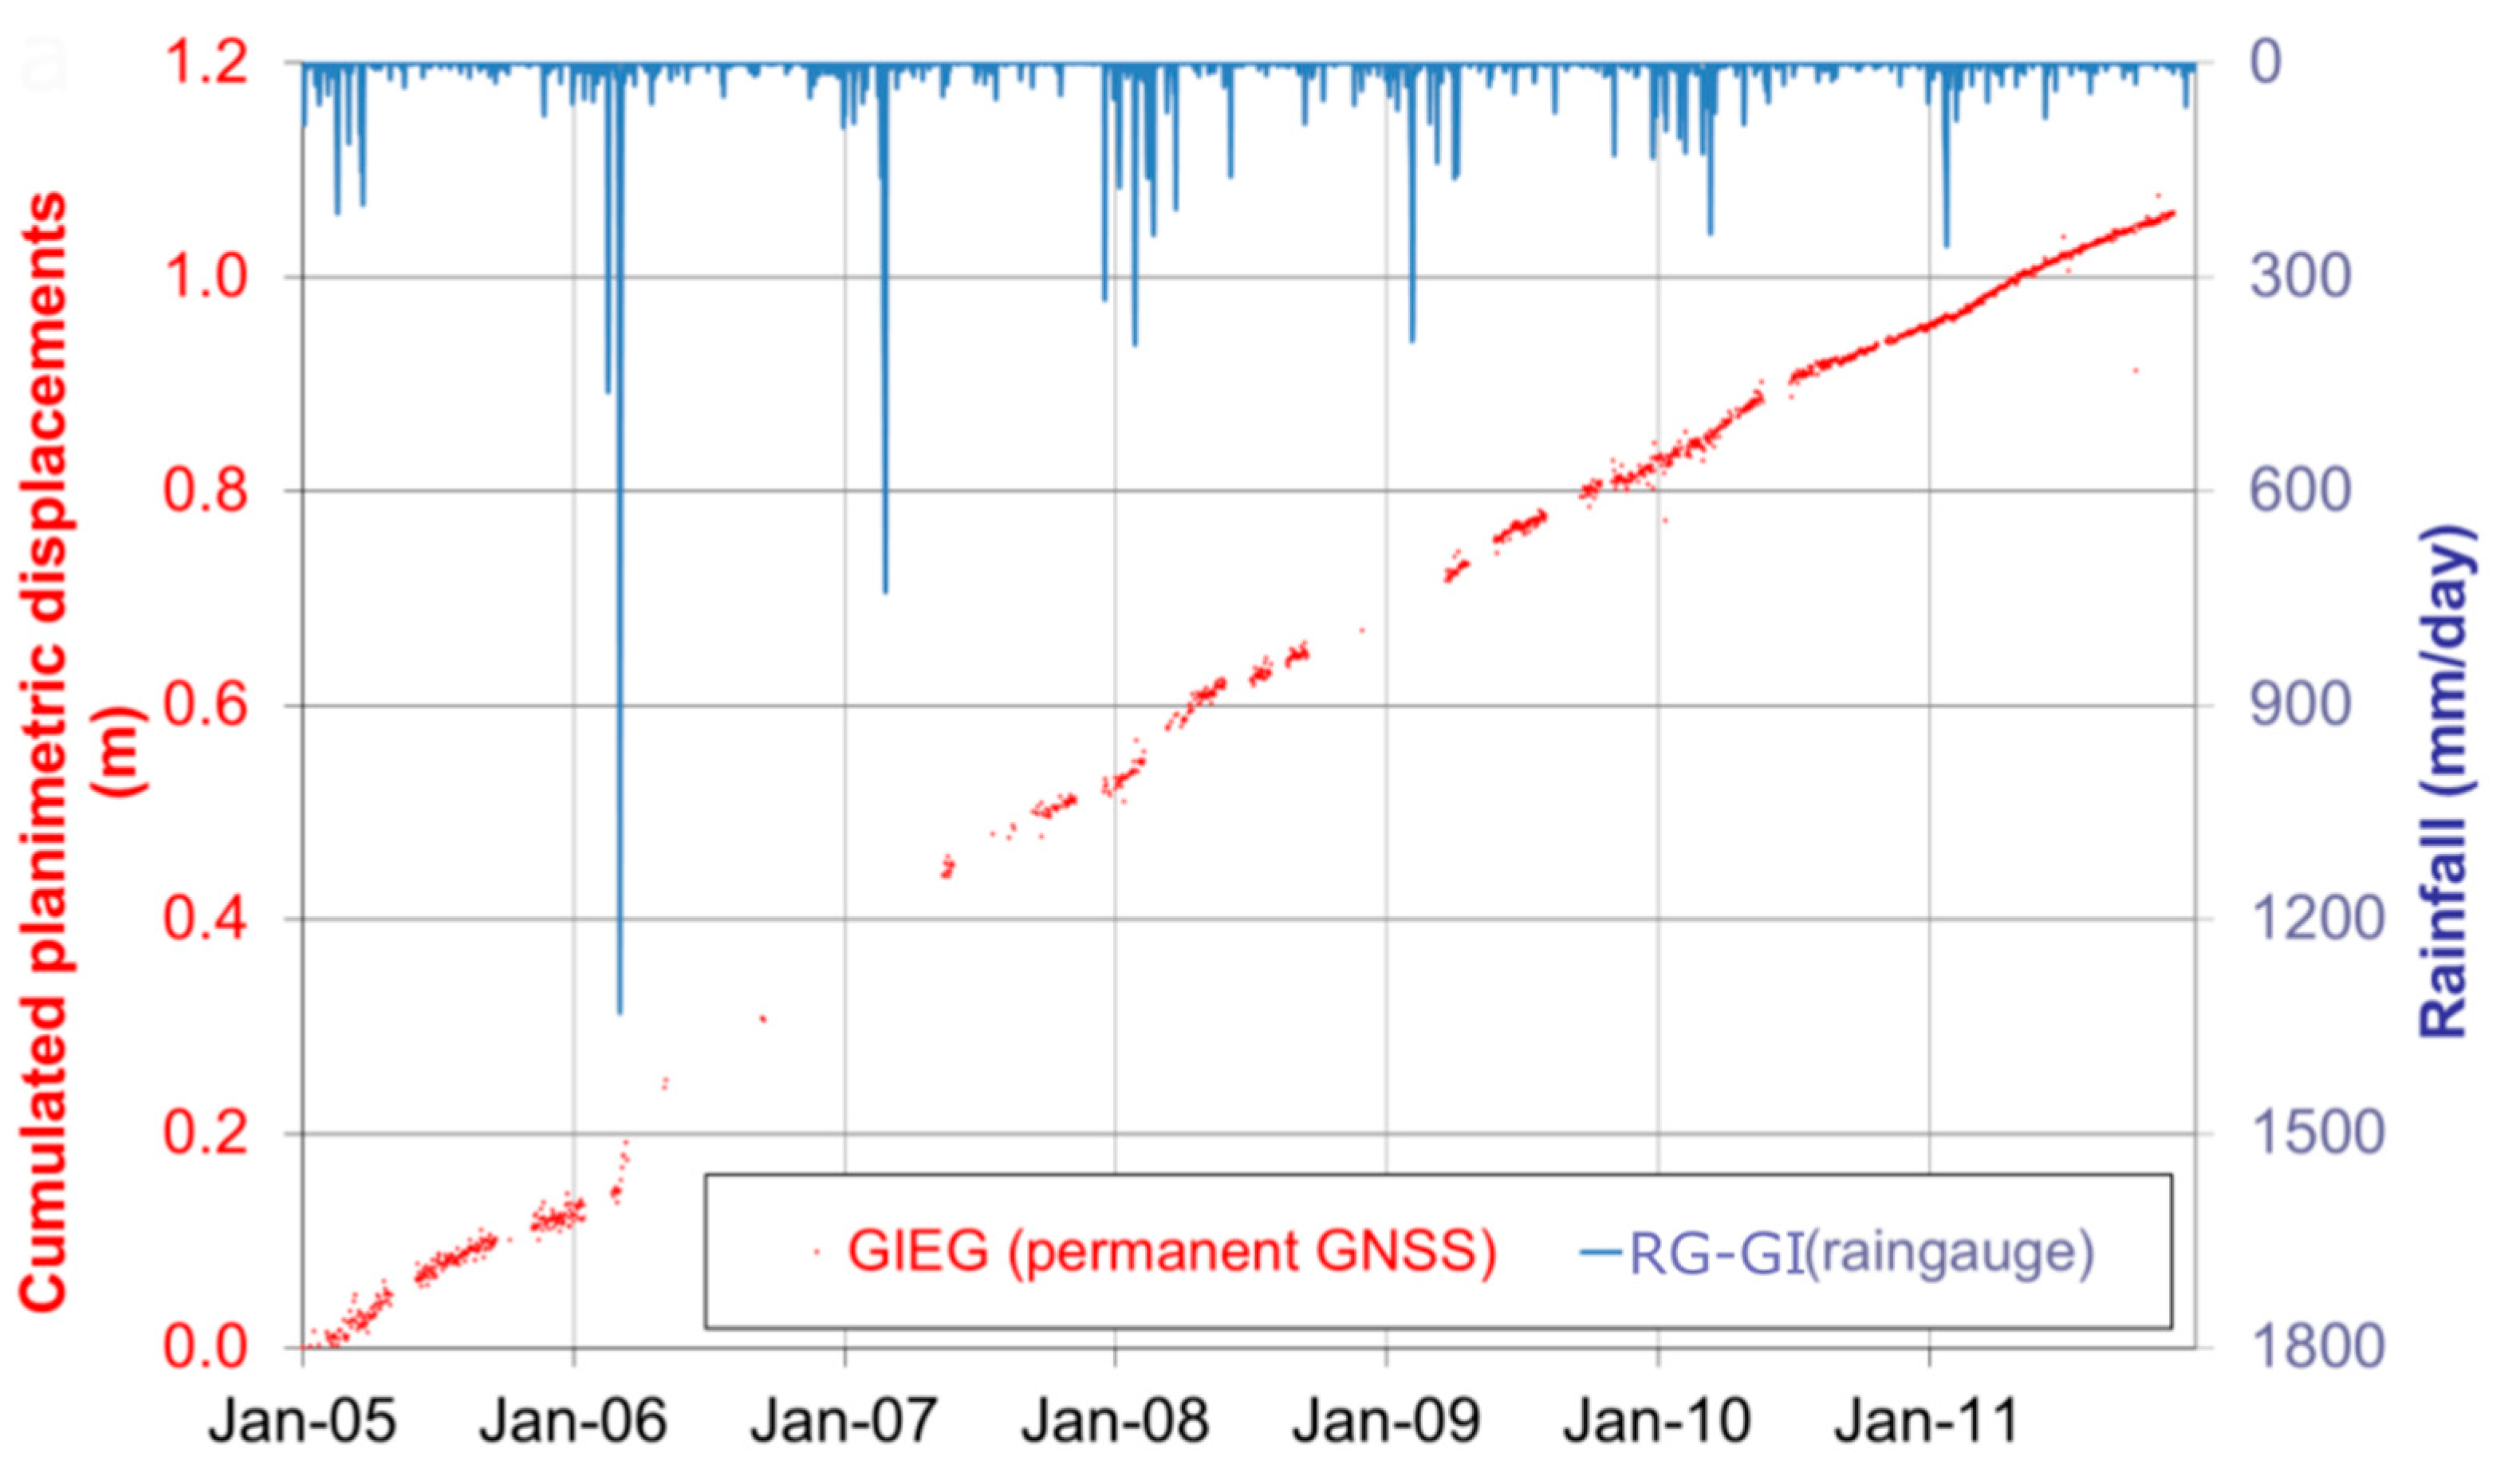
Figure 4.
Geological and hydrogeological map of the Grand Ilet area, including the stations for monitoring groundwater and surface water. Flow rates are based on measurements during the 2011 low-flow period. Correspondence between real spring names and codes (S1, S2, etc.) are described in the Supplementary Materials.
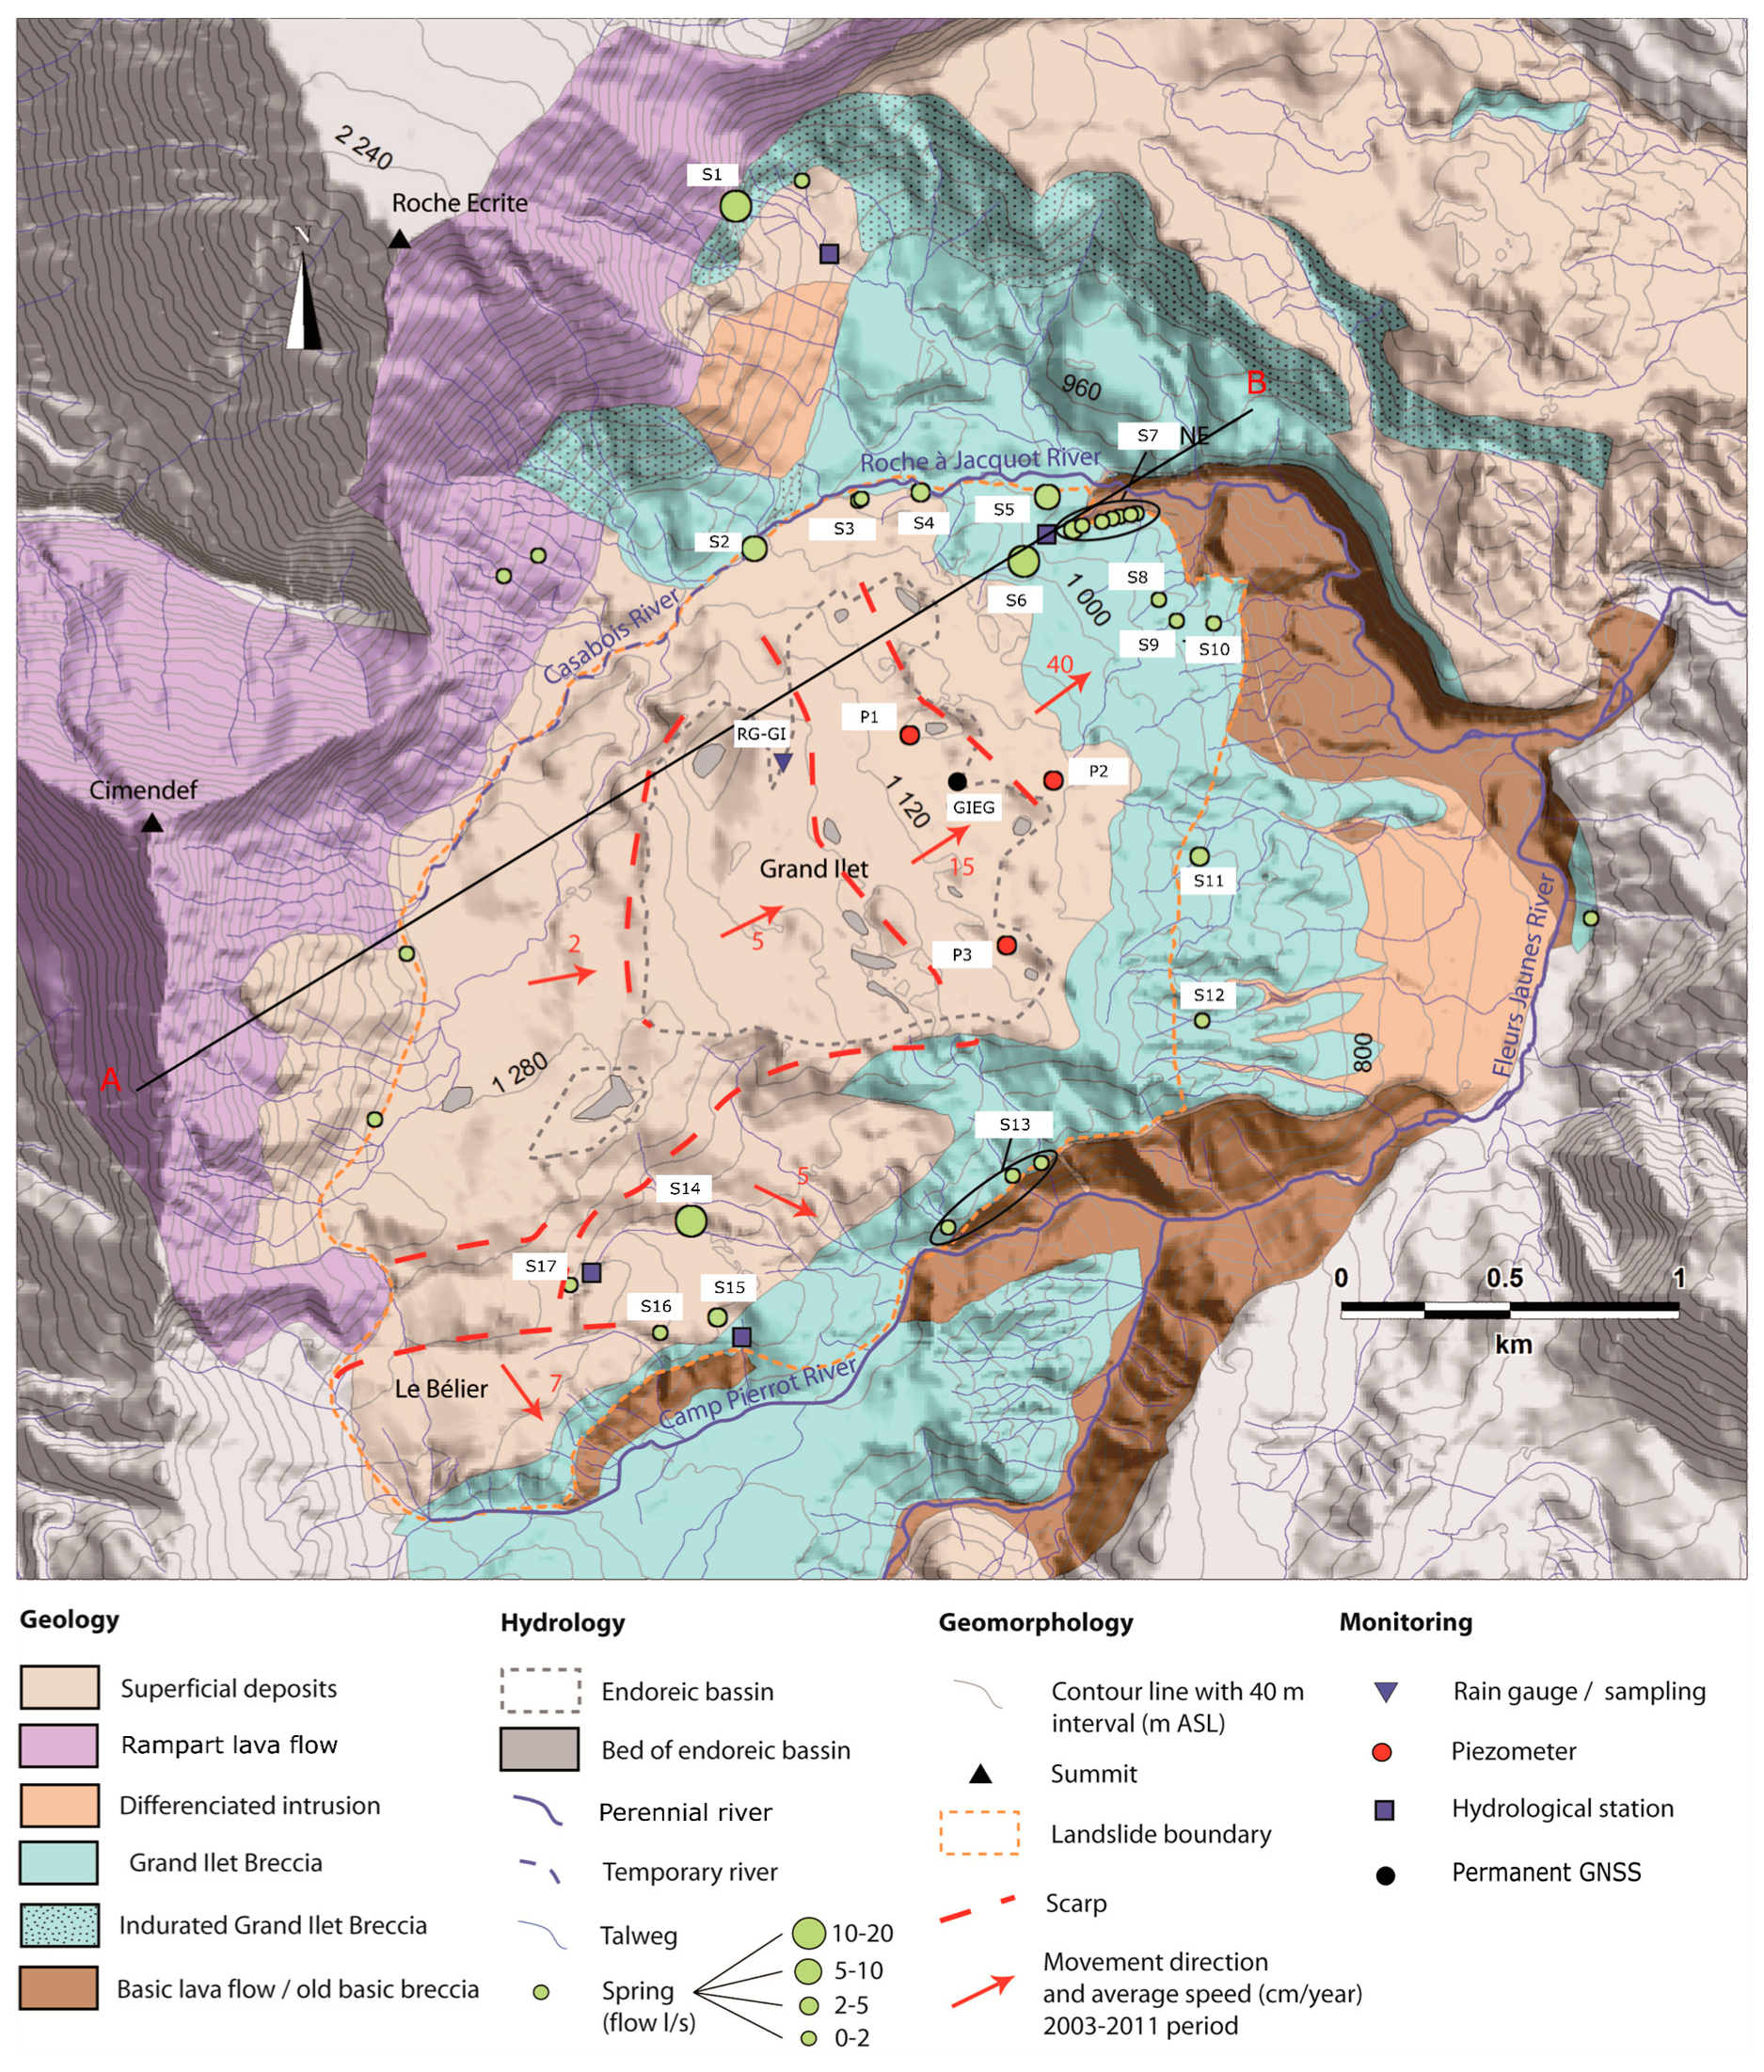
Figure 5.
Schematic geological and hydrogeological section through the Grand Ilet area. Cross-section localized on Figure 4. M0–M4 correspond to the different permeabilities of the breccia aquifer.
Figure 5.
Schematic geological and hydrogeological section through the Grand Ilet area. Cross-section localized on Figure 4. M0–M4 correspond to the different permeabilities of the breccia aquifer.

Figure 6.
Presentation of the piezometric and hydrological chronicles recorded in the Grand Ilet area, with Q S1 the hydrological station at the foot of the rampart and Q S6, Q S15 and Q S17 the breccia springs. The daily mean interannual PETBC data are shown for the ramparts and the breccias.
Figure 6.
Presentation of the piezometric and hydrological chronicles recorded in the Grand Ilet area, with Q S1 the hydrological station at the foot of the rampart and Q S6, Q S15 and Q S17 the breccia springs. The daily mean interannual PETBC data are shown for the ramparts and the breccias.
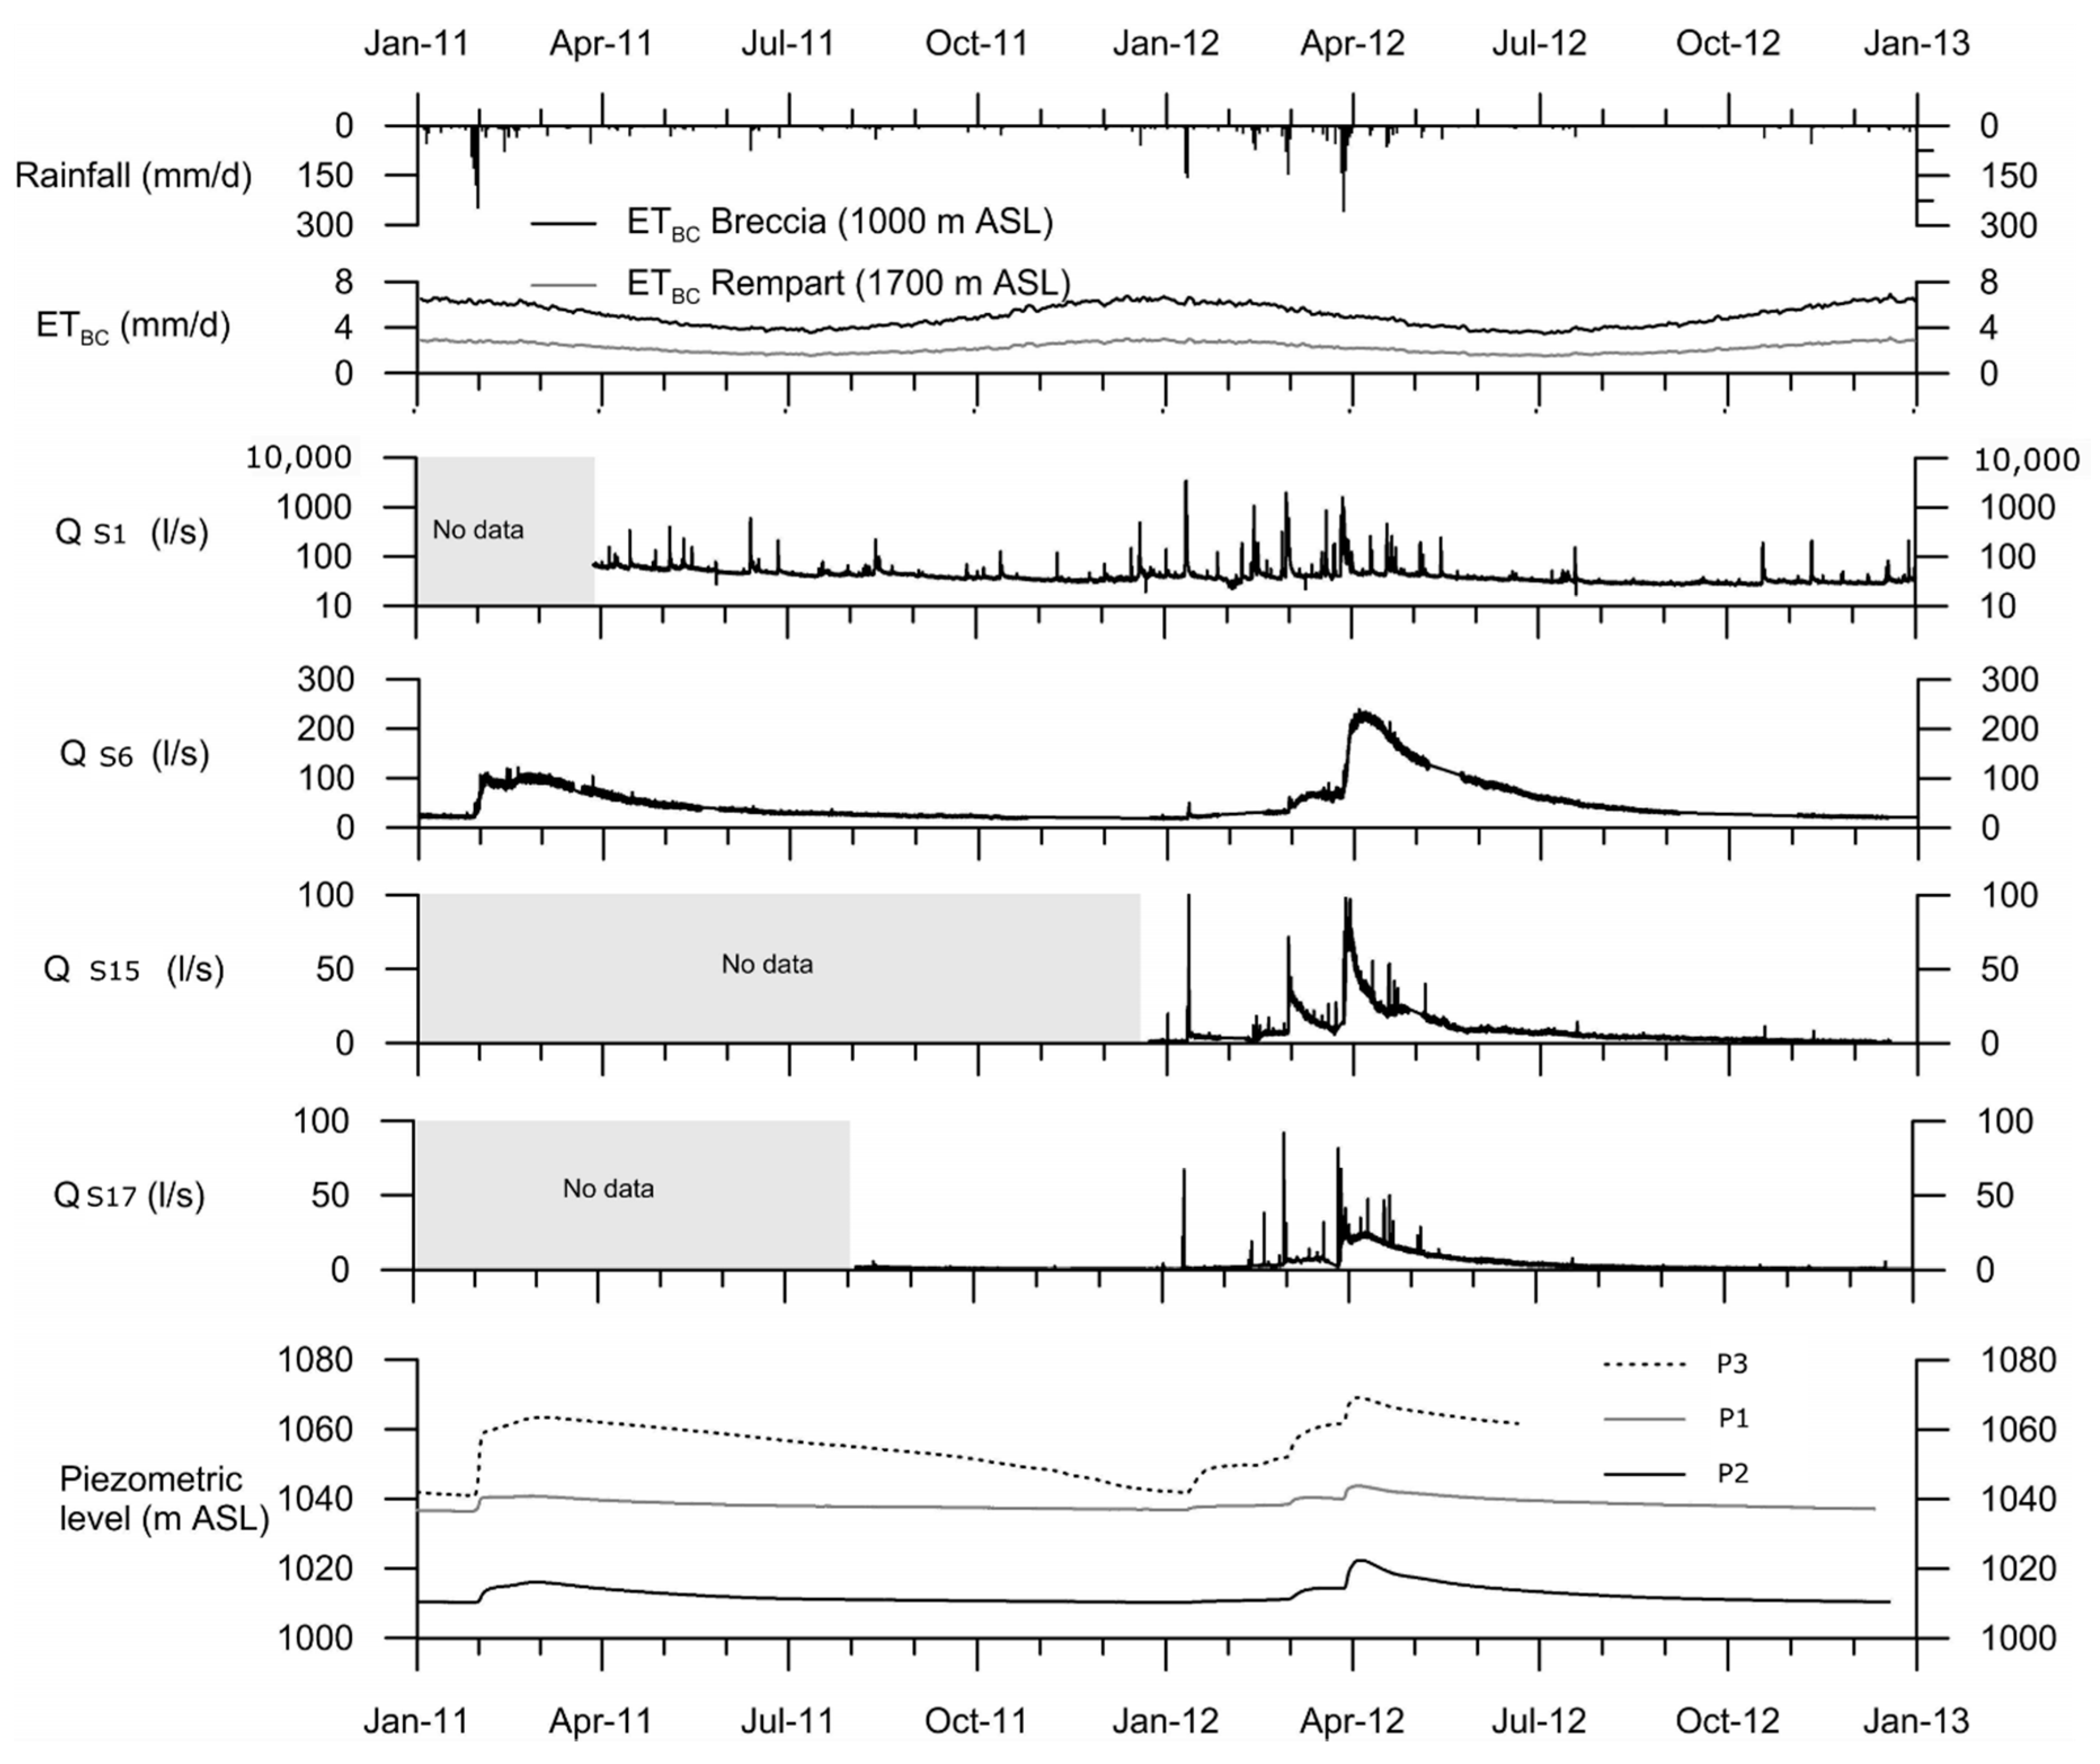
Figure 7.
Comparison of spring-flow measurements (continuous and one-off measurements) with hydrographs reconstituted from recorded flow at the Clain (S6) spring. Springs with flow measurements only from helicopter surveys are not shown.
Figure 7.
Comparison of spring-flow measurements (continuous and one-off measurements) with hydrographs reconstituted from recorded flow at the Clain (S6) spring. Springs with flow measurements only from helicopter surveys are not shown.
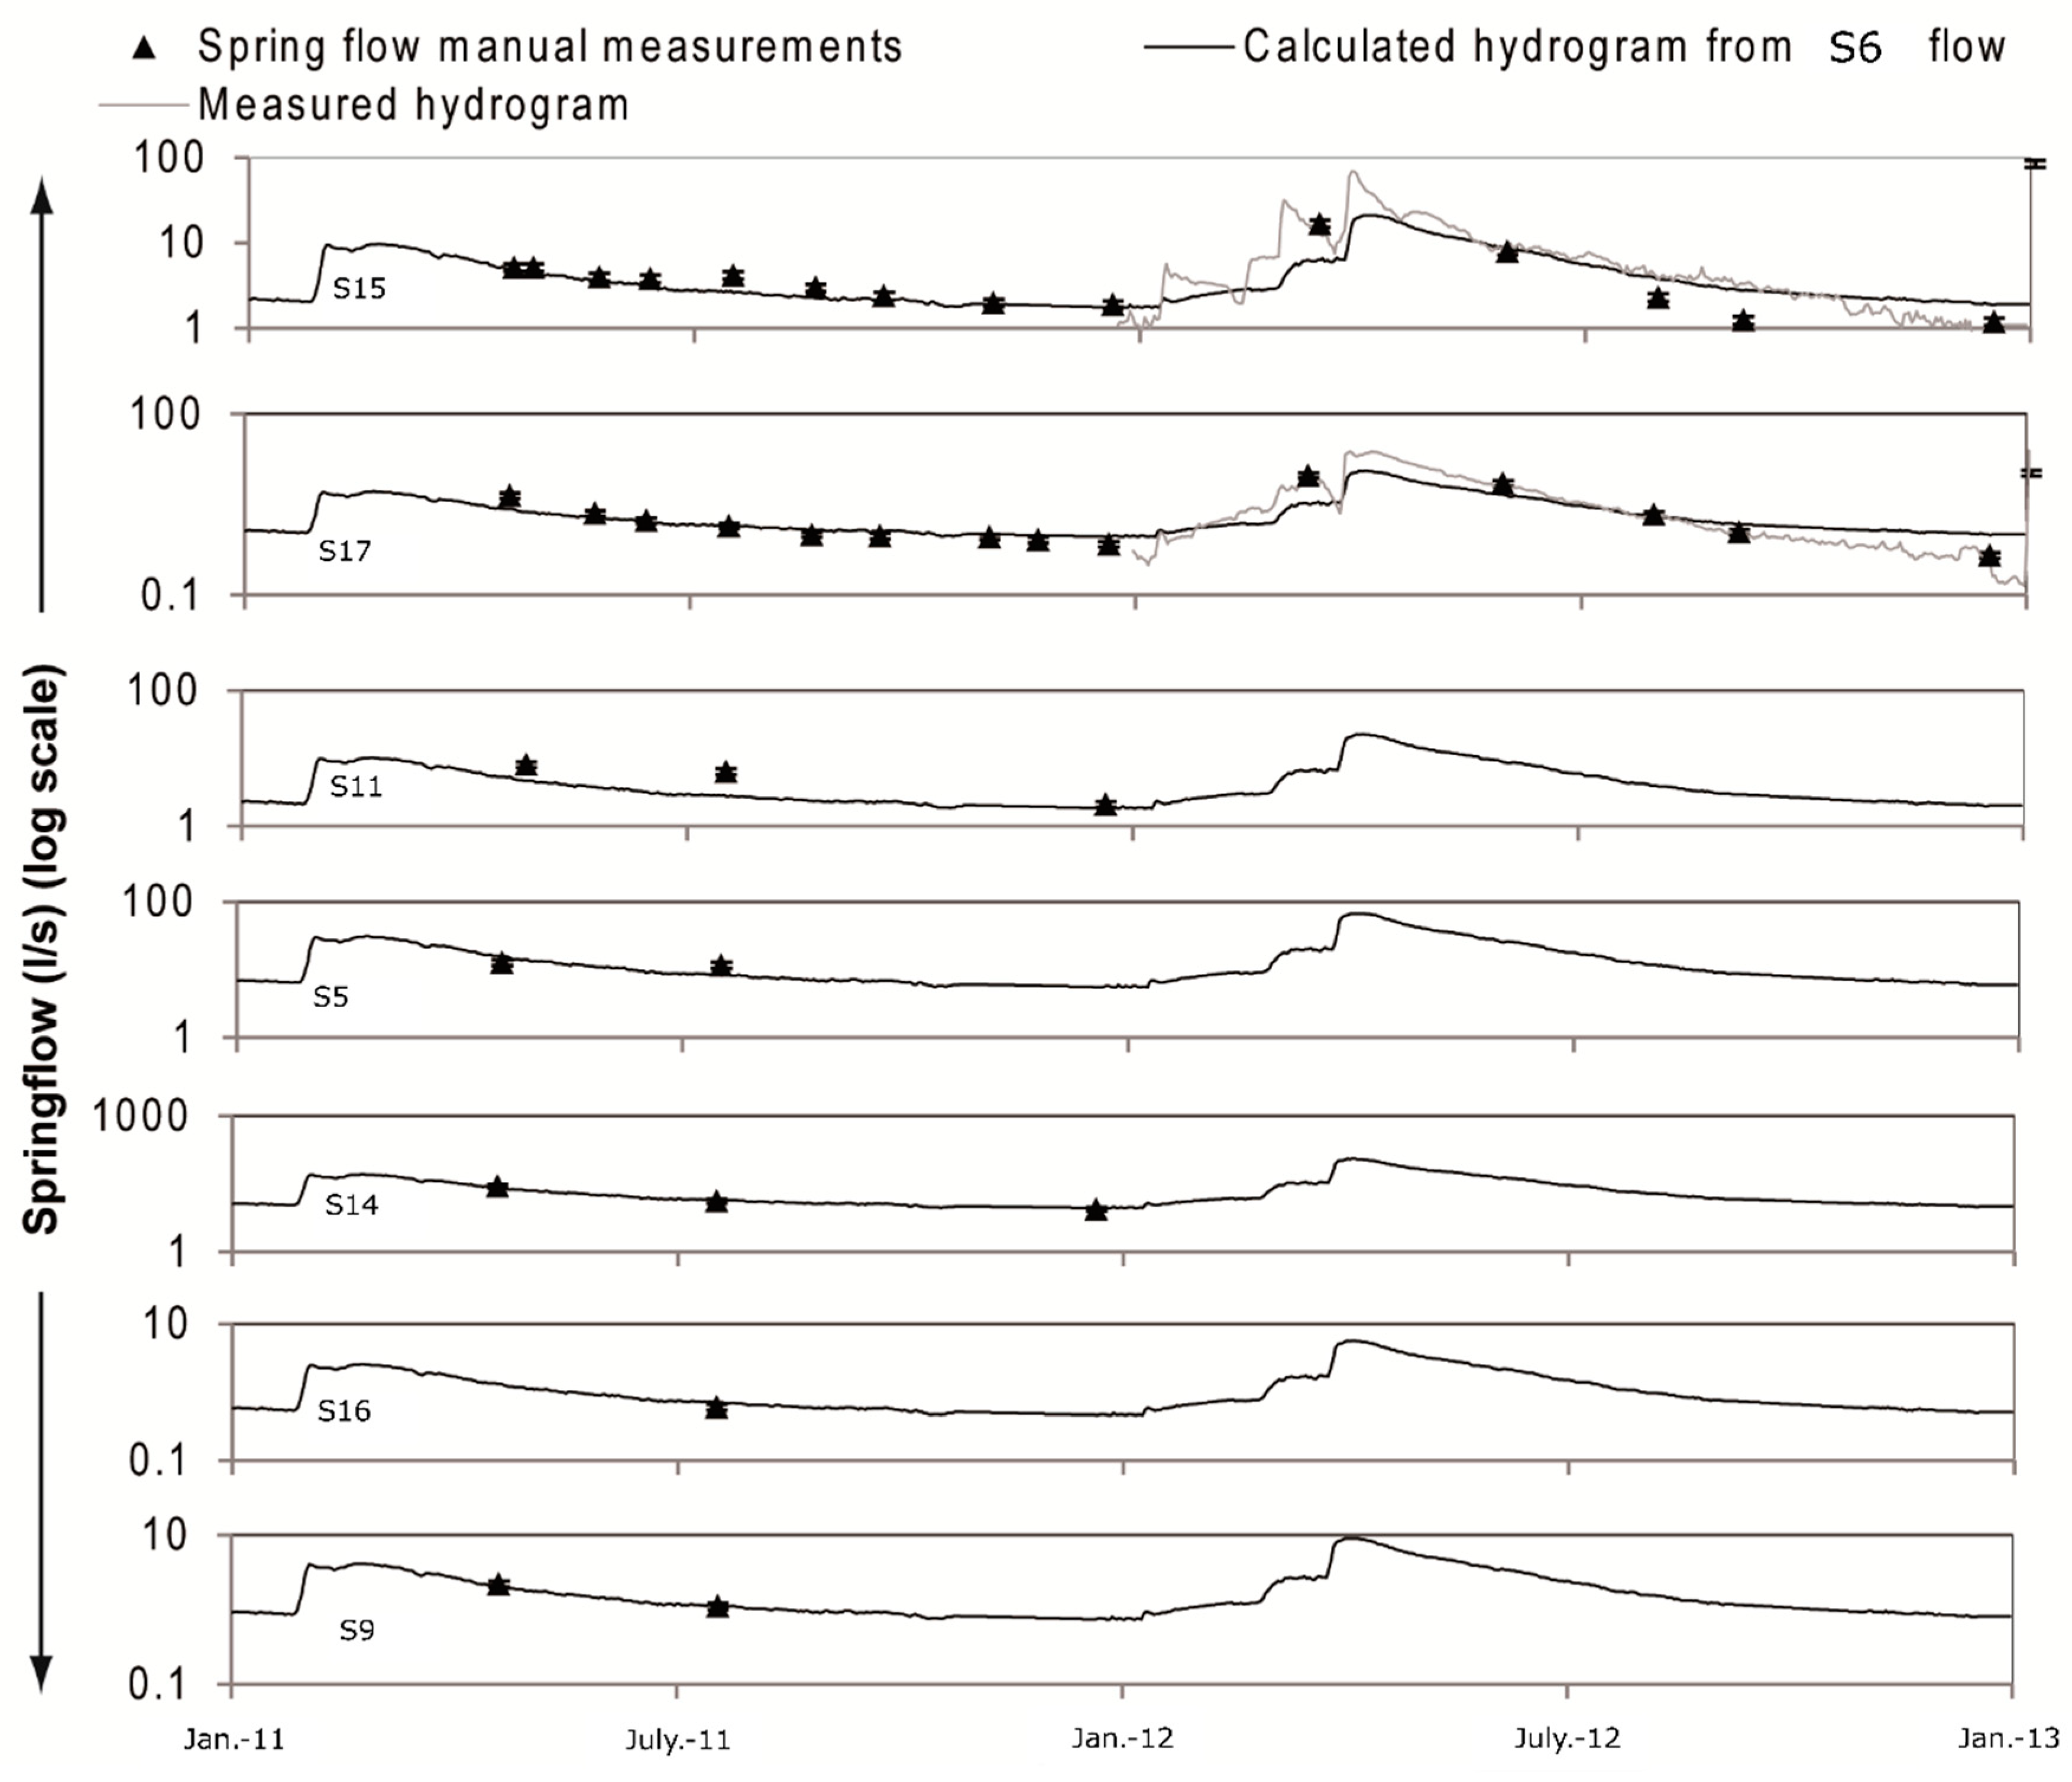
Figure 8.
Schematic diagram of the water balance, with H the height of storable water in the soil reservoir in mm, R the rainfall, S the runoff, Ar the Aquifer recharge, ET the real evapotranspiration.
Figure 8.
Schematic diagram of the water balance, with H the height of storable water in the soil reservoir in mm, R the rainfall, S the runoff, Ar the Aquifer recharge, ET the real evapotranspiration.

Figure 9.
Relationship between the piezometric variations in observation wells P1, P2 and P3 and recorded rainfall at Grand Ilet during the 2011 and 2012 hydrologic cycles. These observations show that, from our dataset, only rainfall events occurring during the rainy season and cumulating about 80 mm or more led to a rise in the water table.

Figure 10.
Rainfall/runoff relationship by event (a) for the breccia watershed at the Clain (S6) station and (b) for the rampart watershed at the Ravine Blanche (S1) station for the 2011 and 2012 hydrologic cycles. Quantified runoff coefficients are ten times greater over the rampart watershed than over the breccia one.

Figure 11.
Comparison of (a) the pluviometry, (f) the cumulated displacement and (e) the observed piezometric rises with recharge through the breccias (b–d), calculated for different values of HBr of the surface reservoir respectively (b) 50 mm, (c) 150 mm and (d) 250 mm. The most realistic recharge histories are obtained by using a high HBr value (HBr = 250 mm). It allows better reproduction of the occurrence and amplitude of piezometric variations as well as of the landslide’s dynamics (GIEG permanent GNSS).


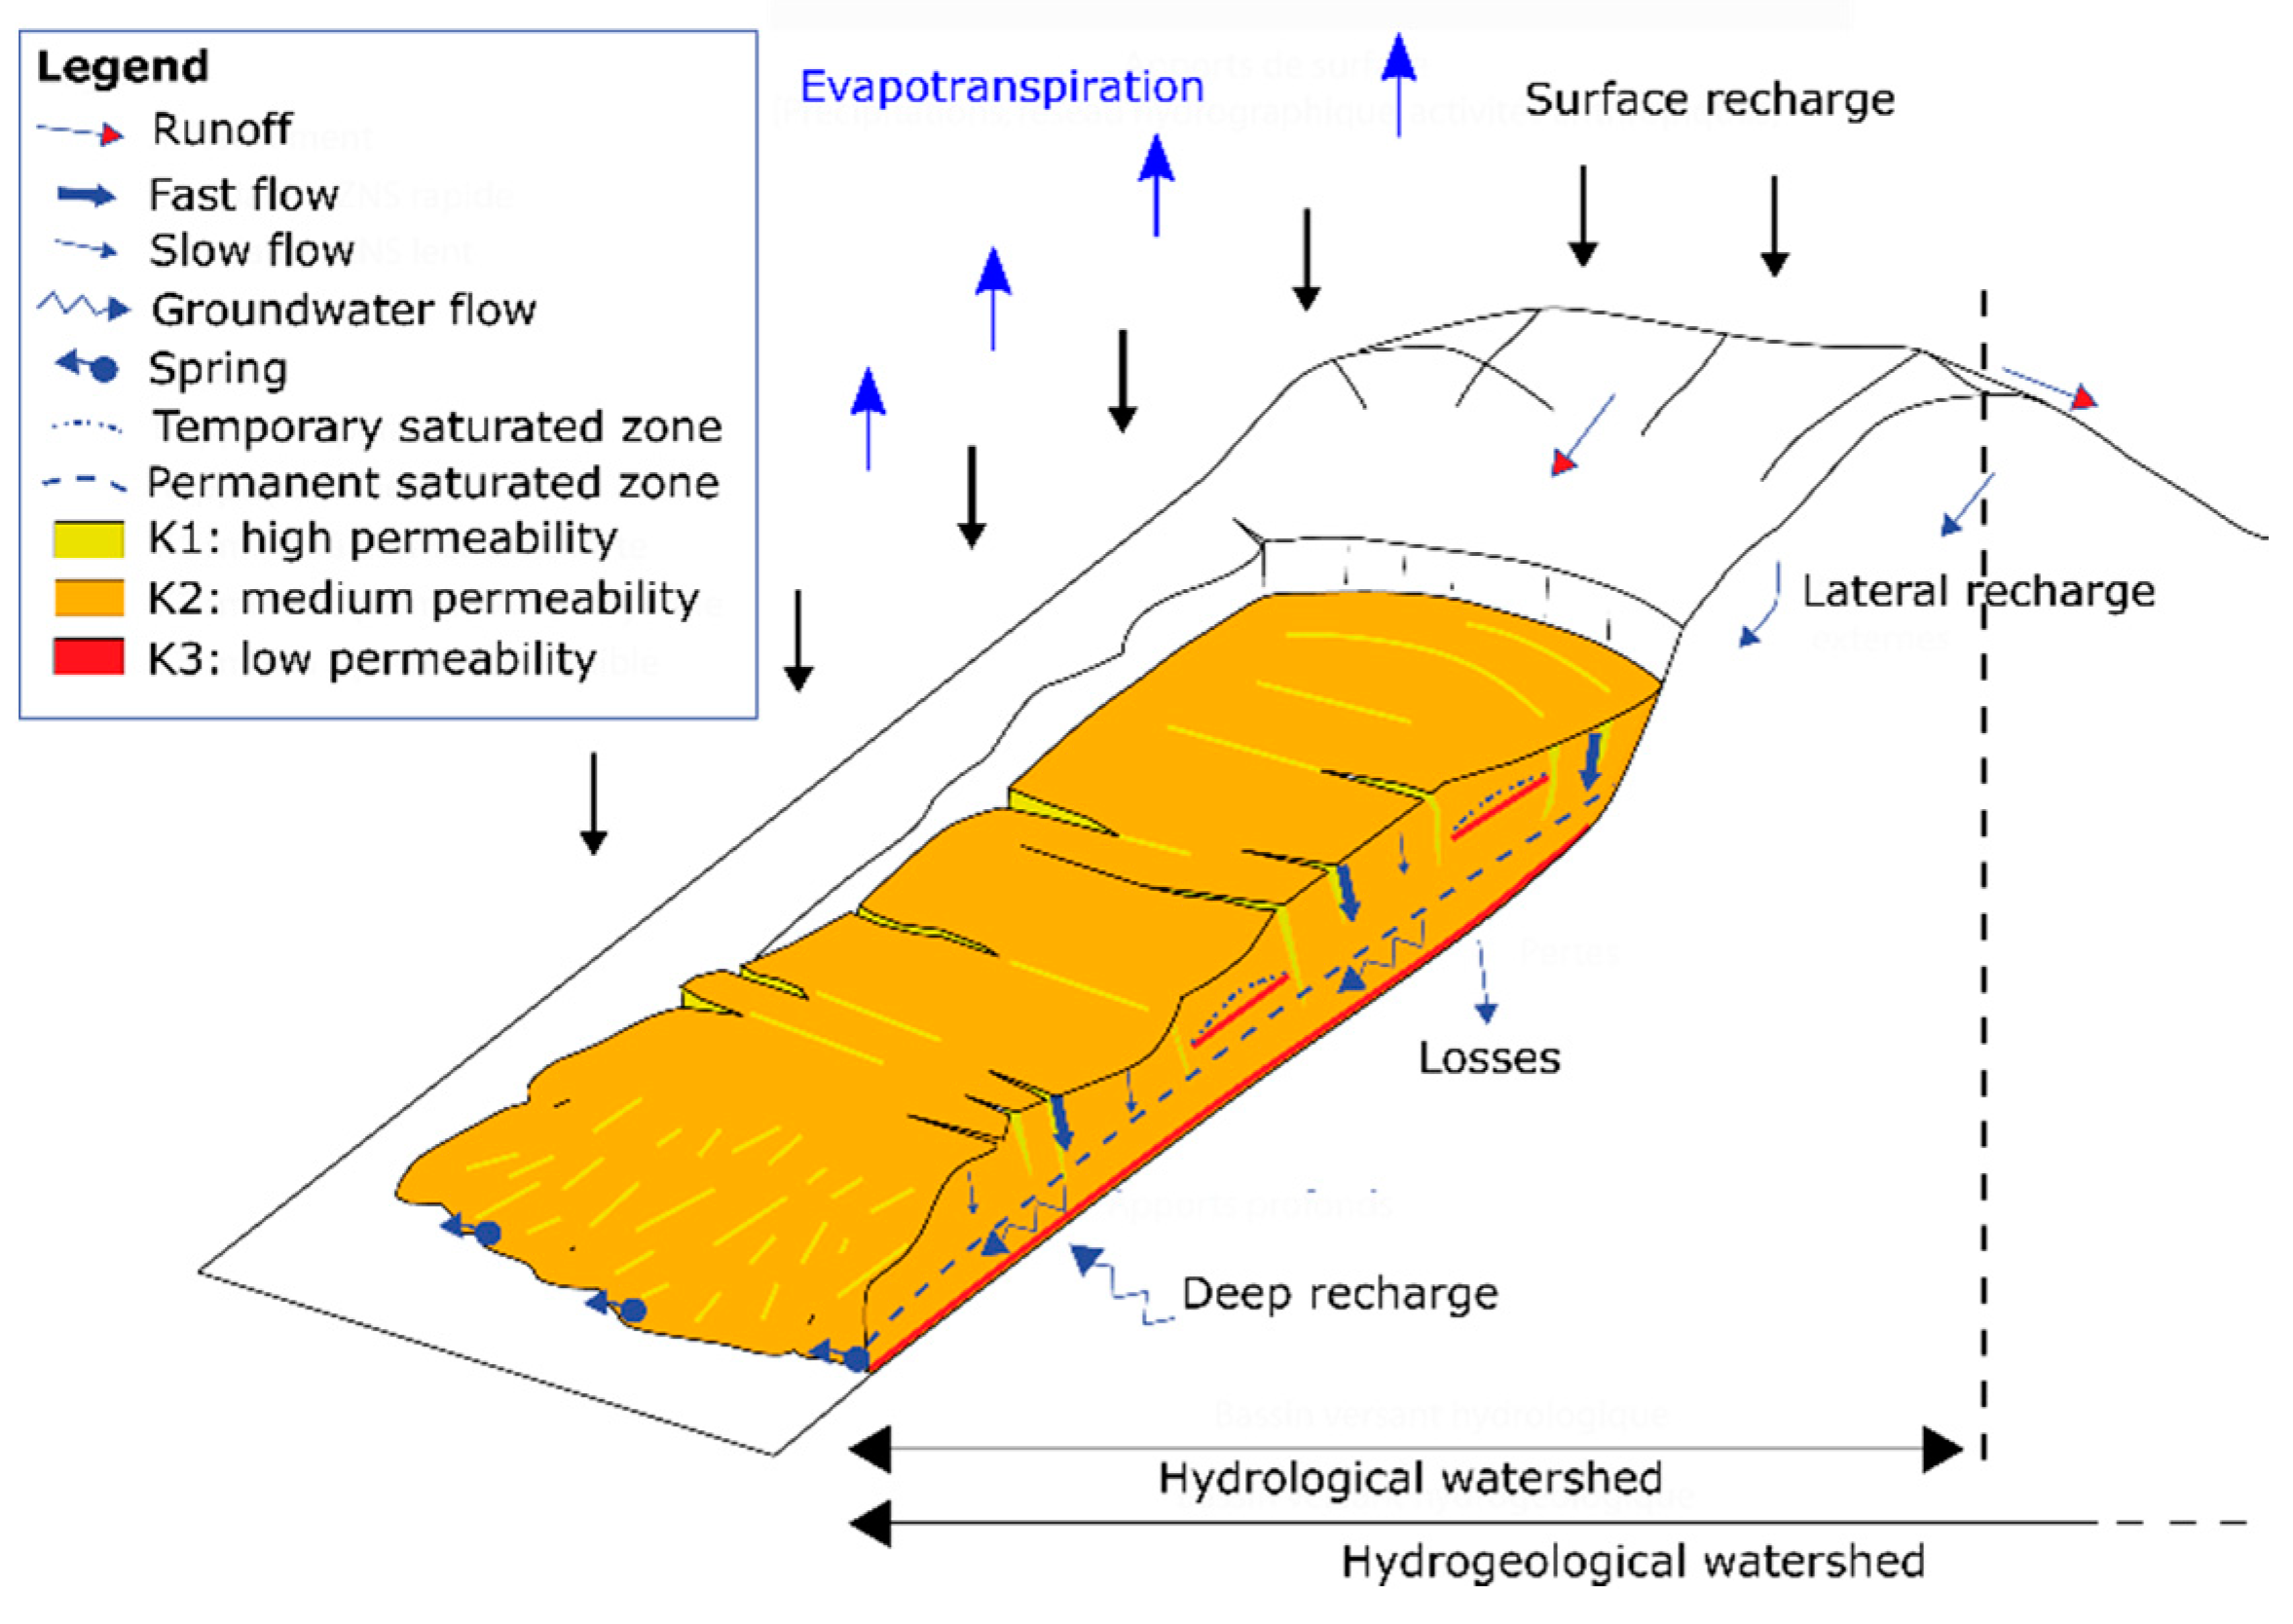
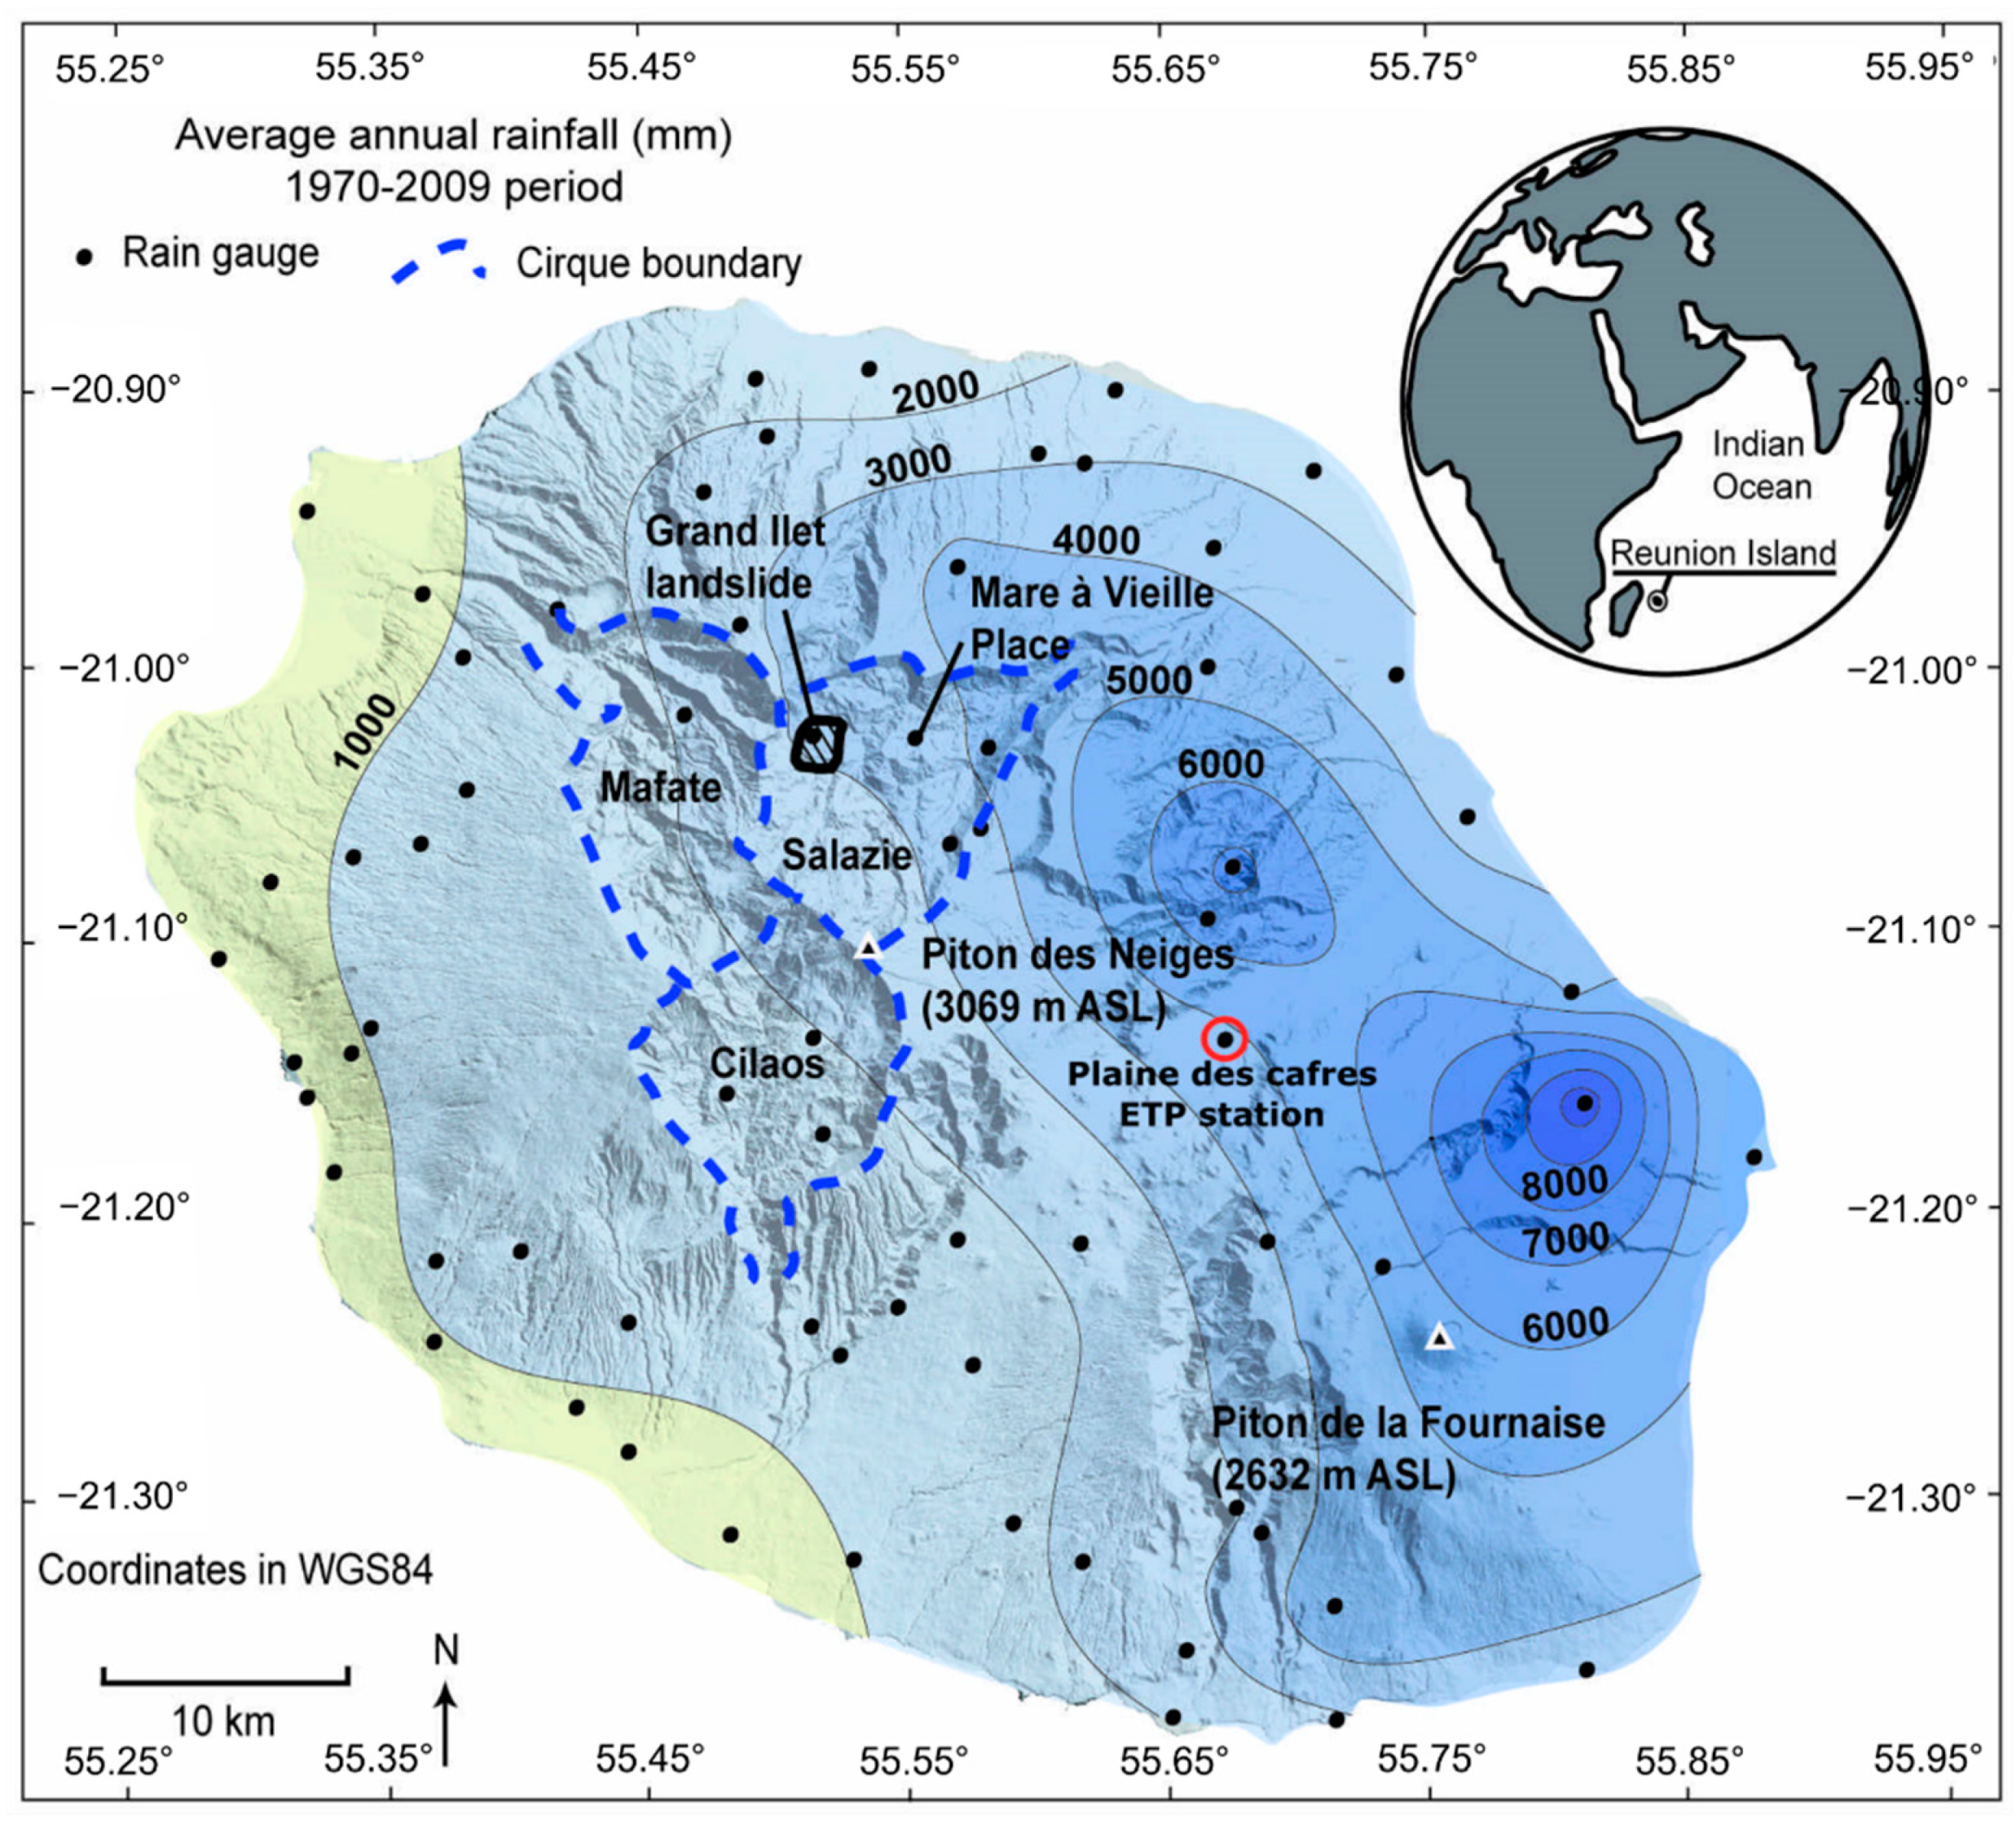
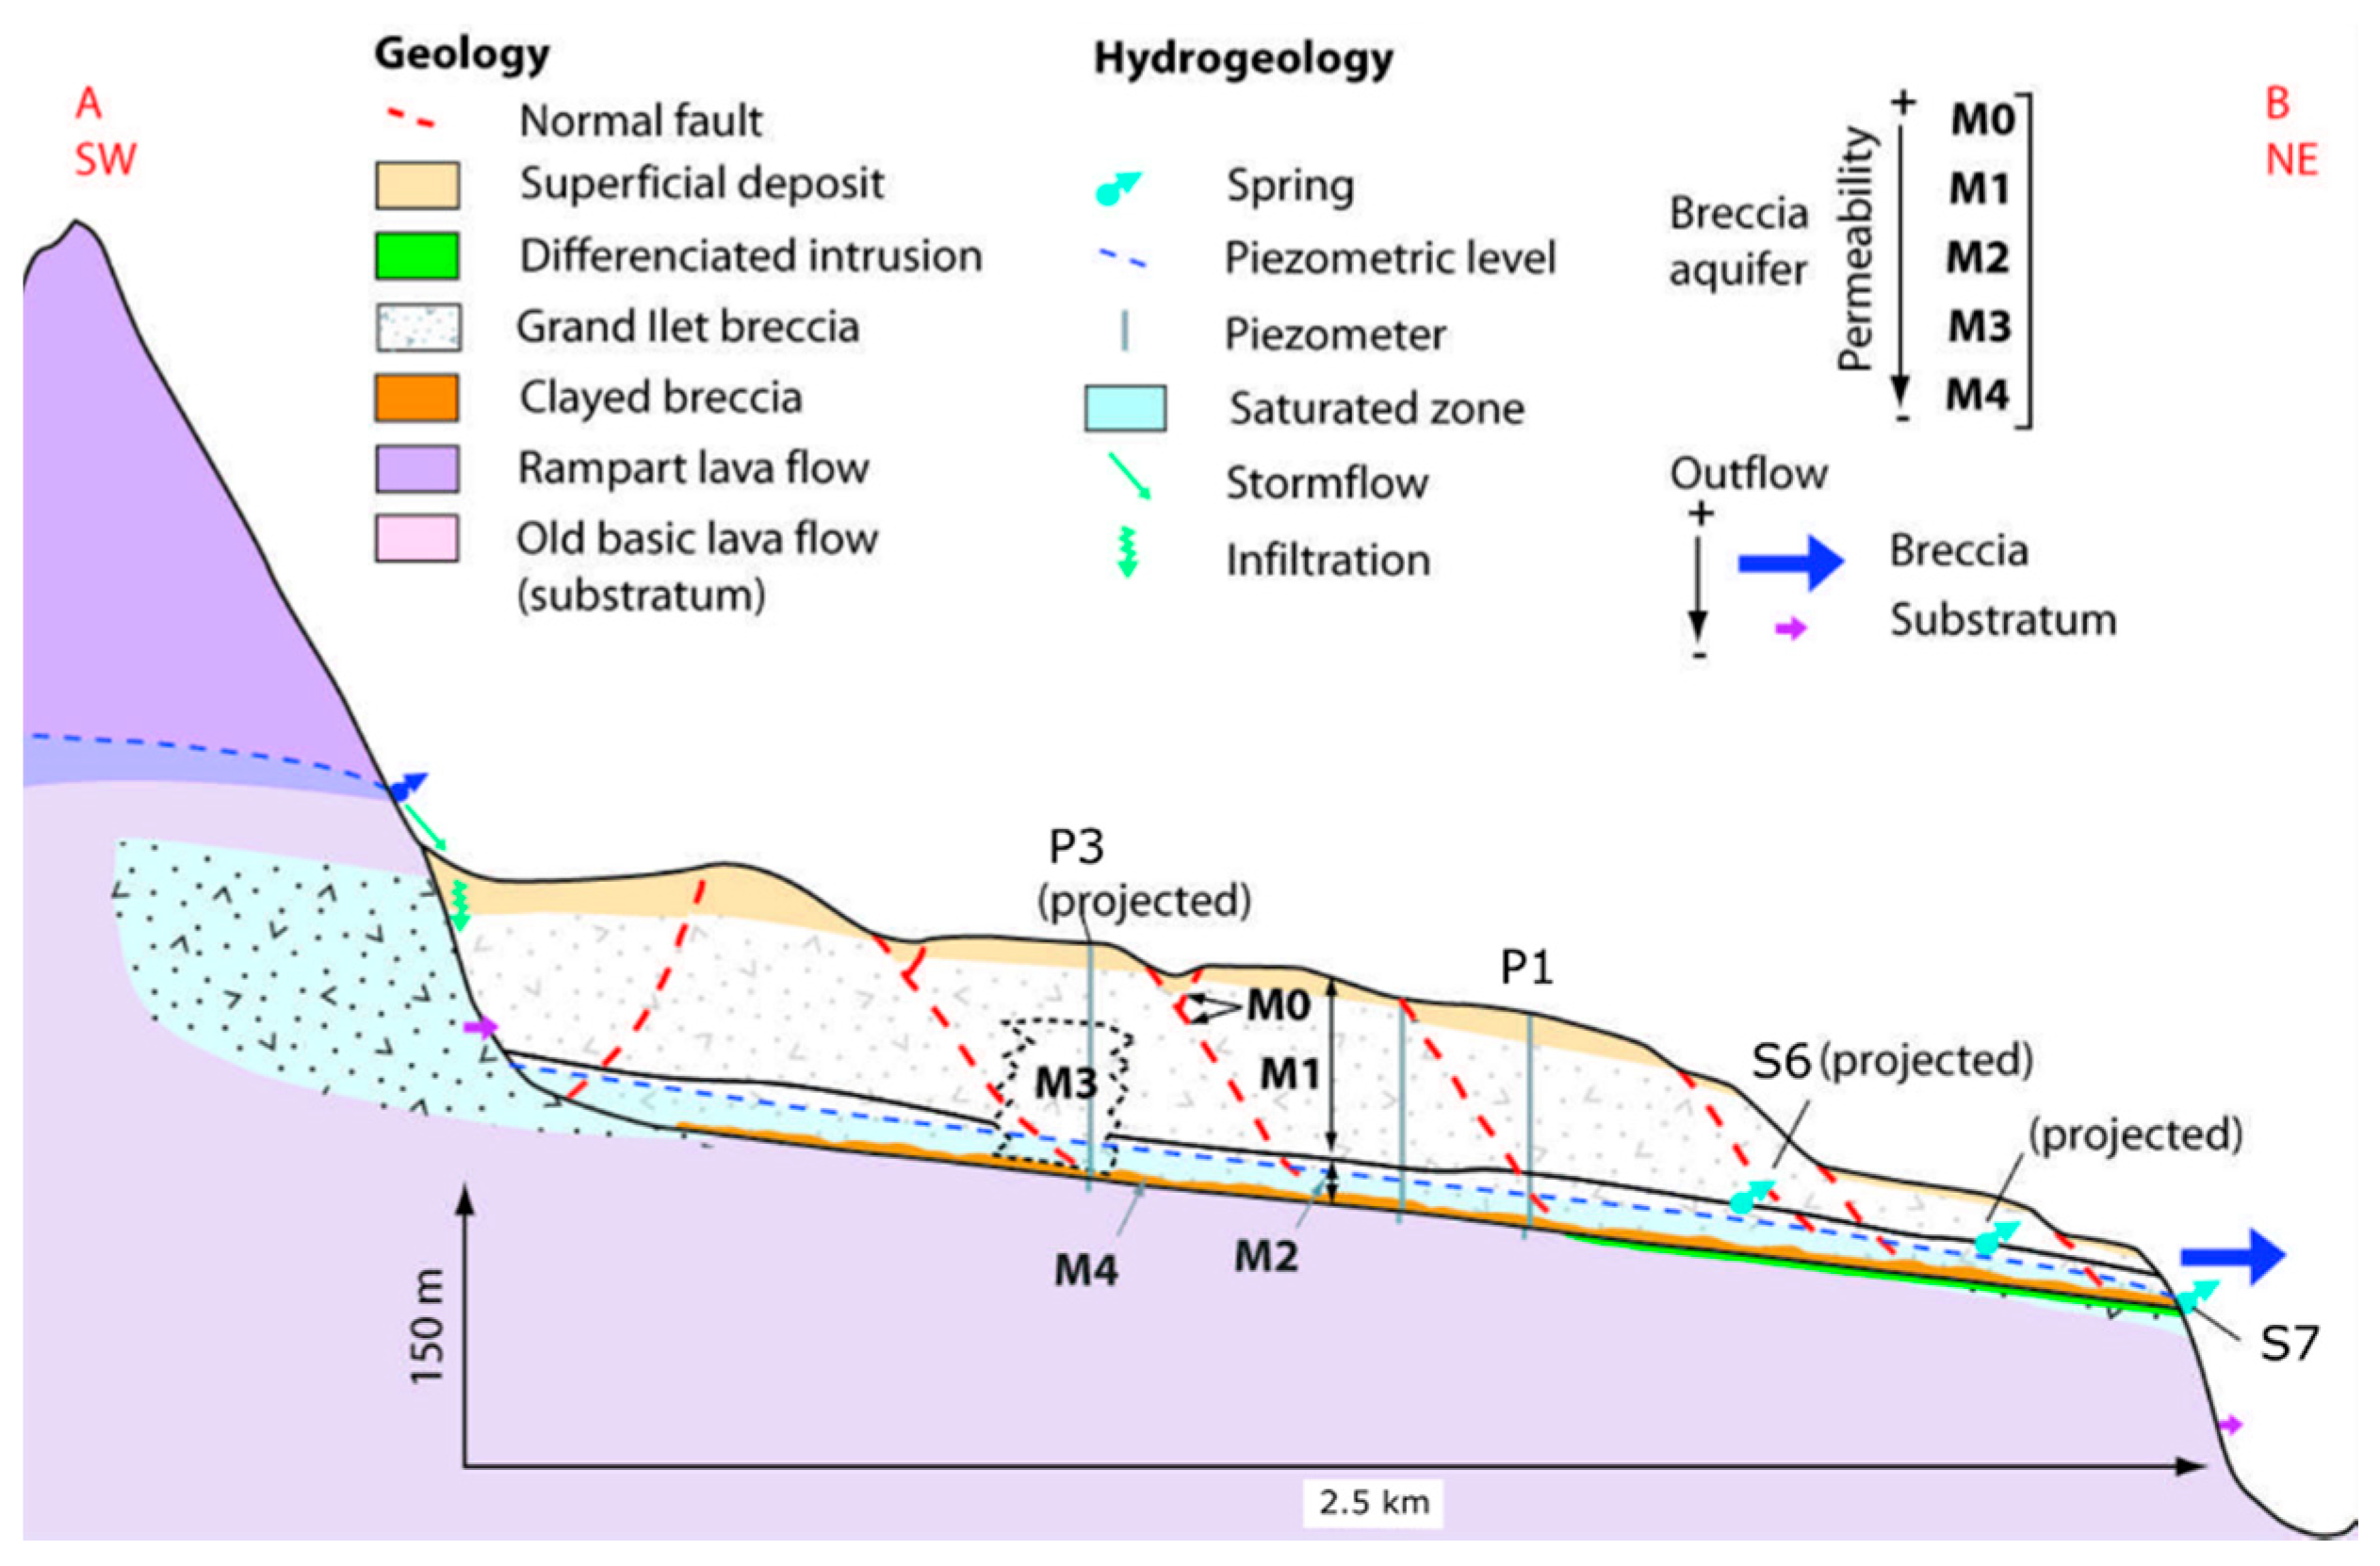
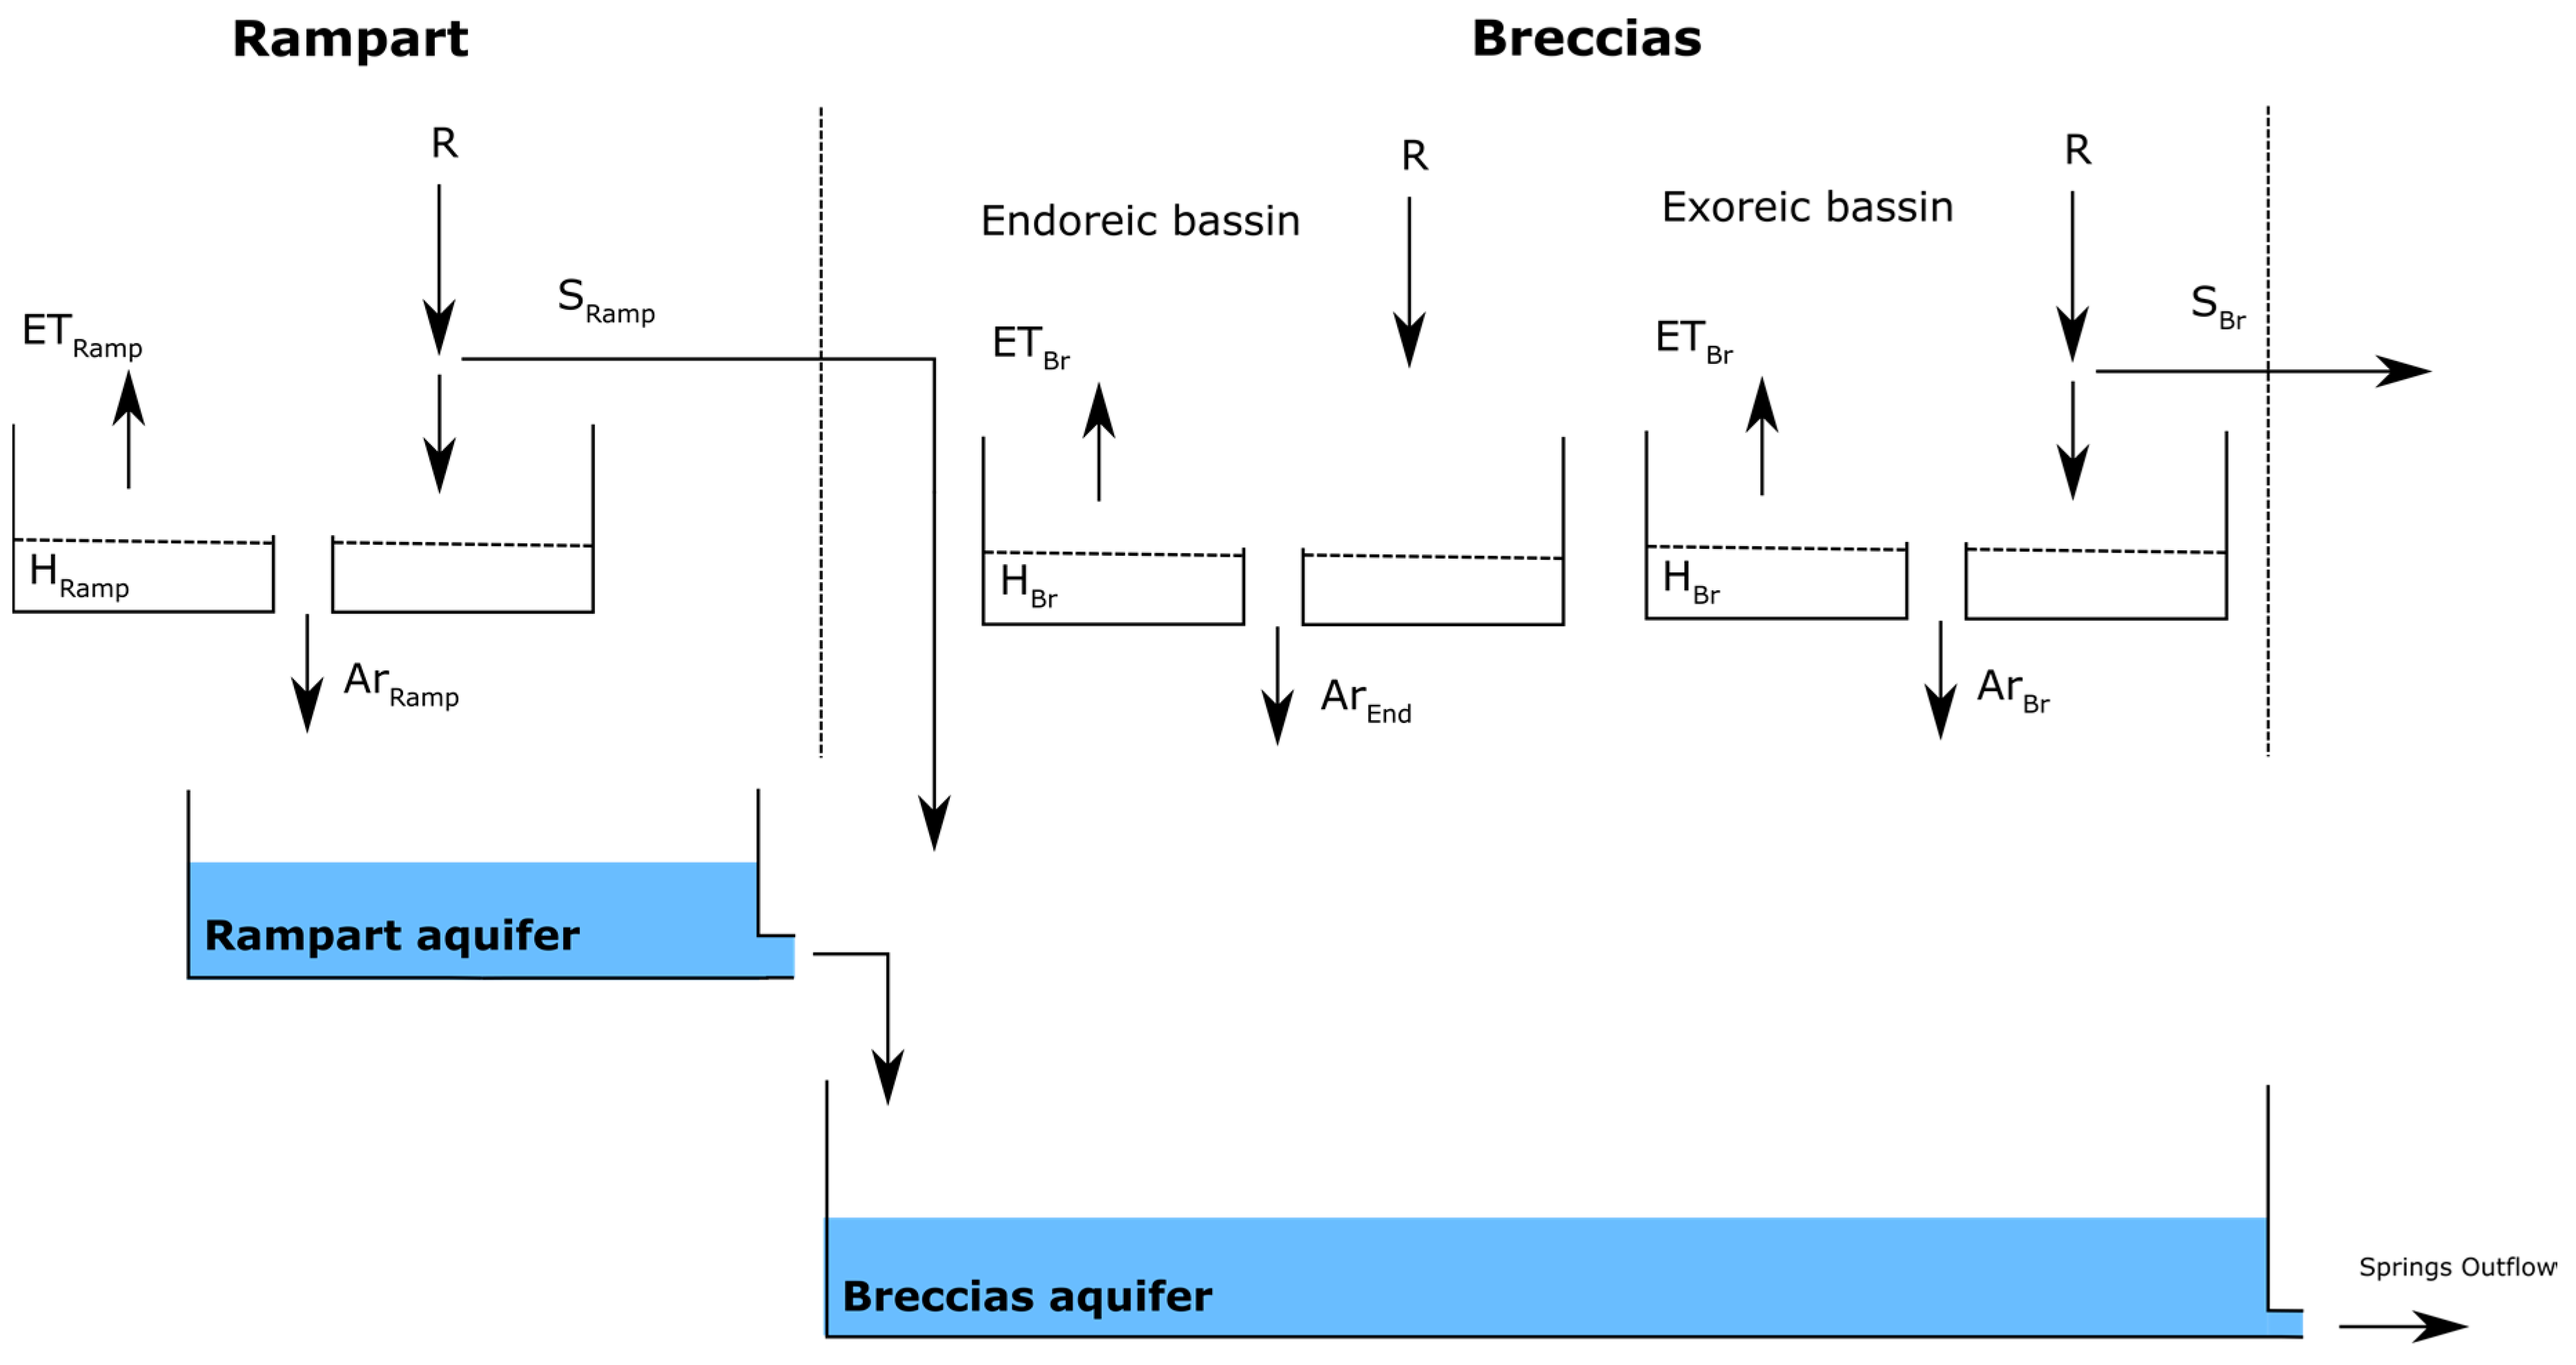
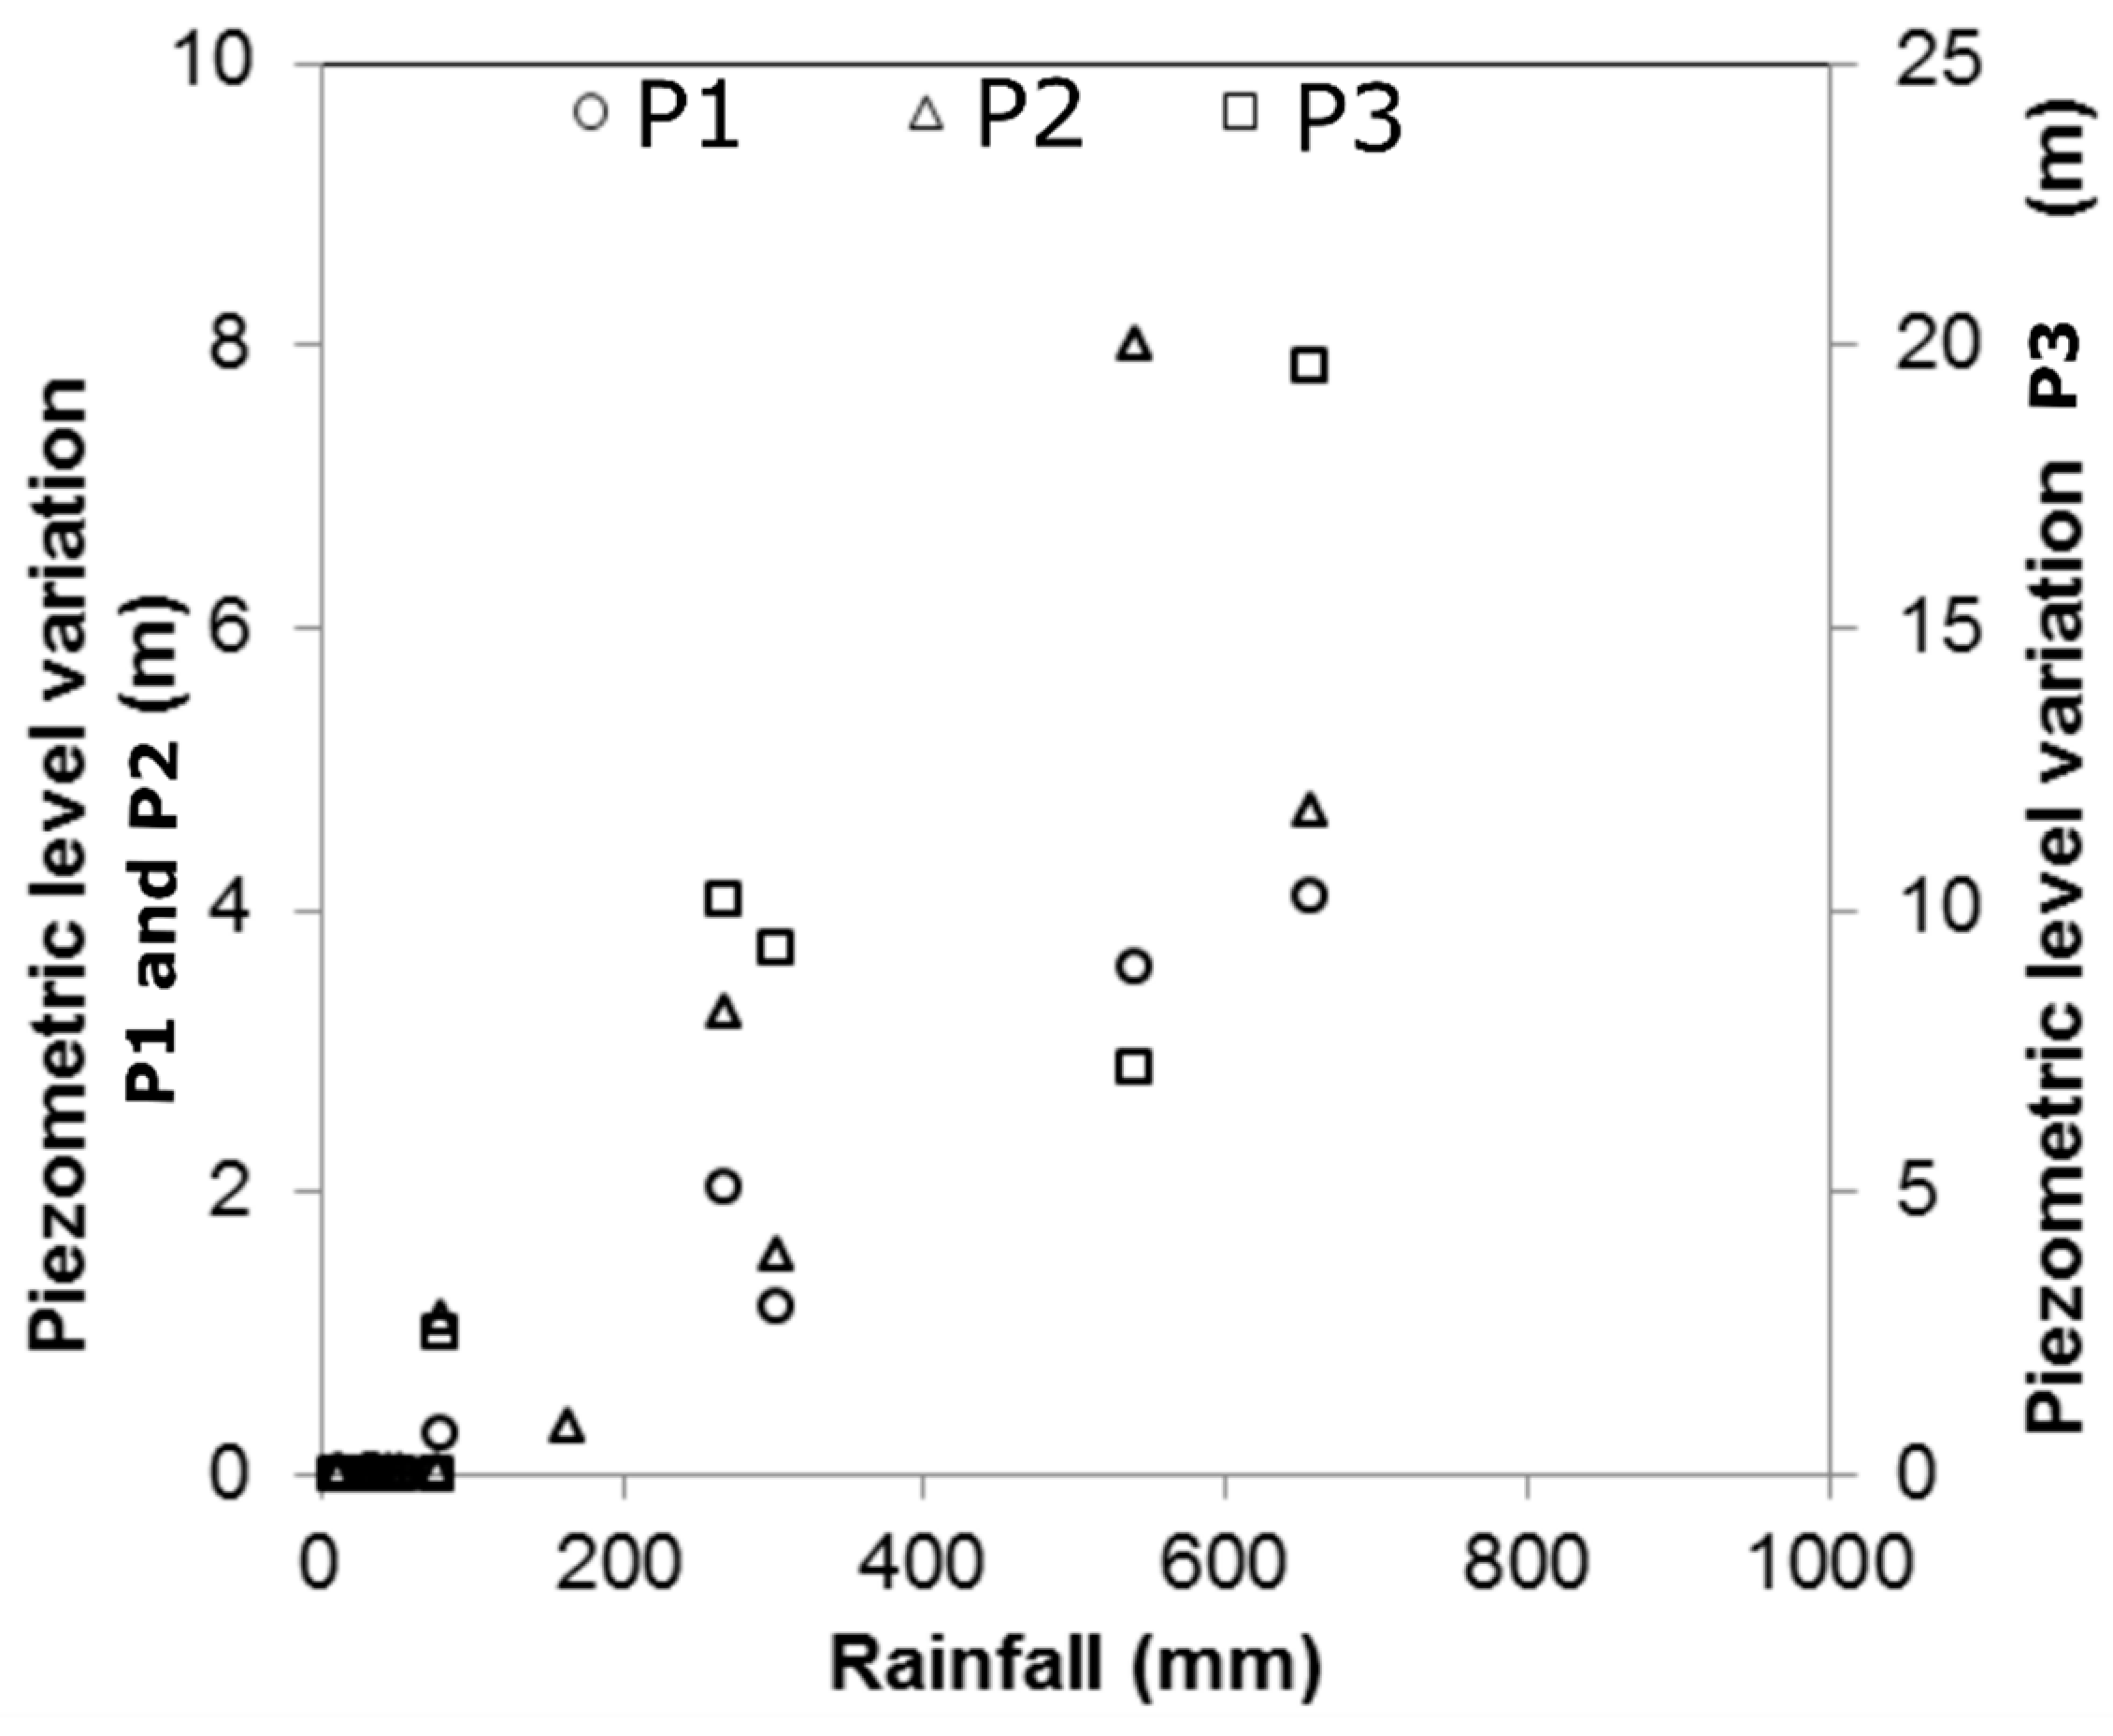
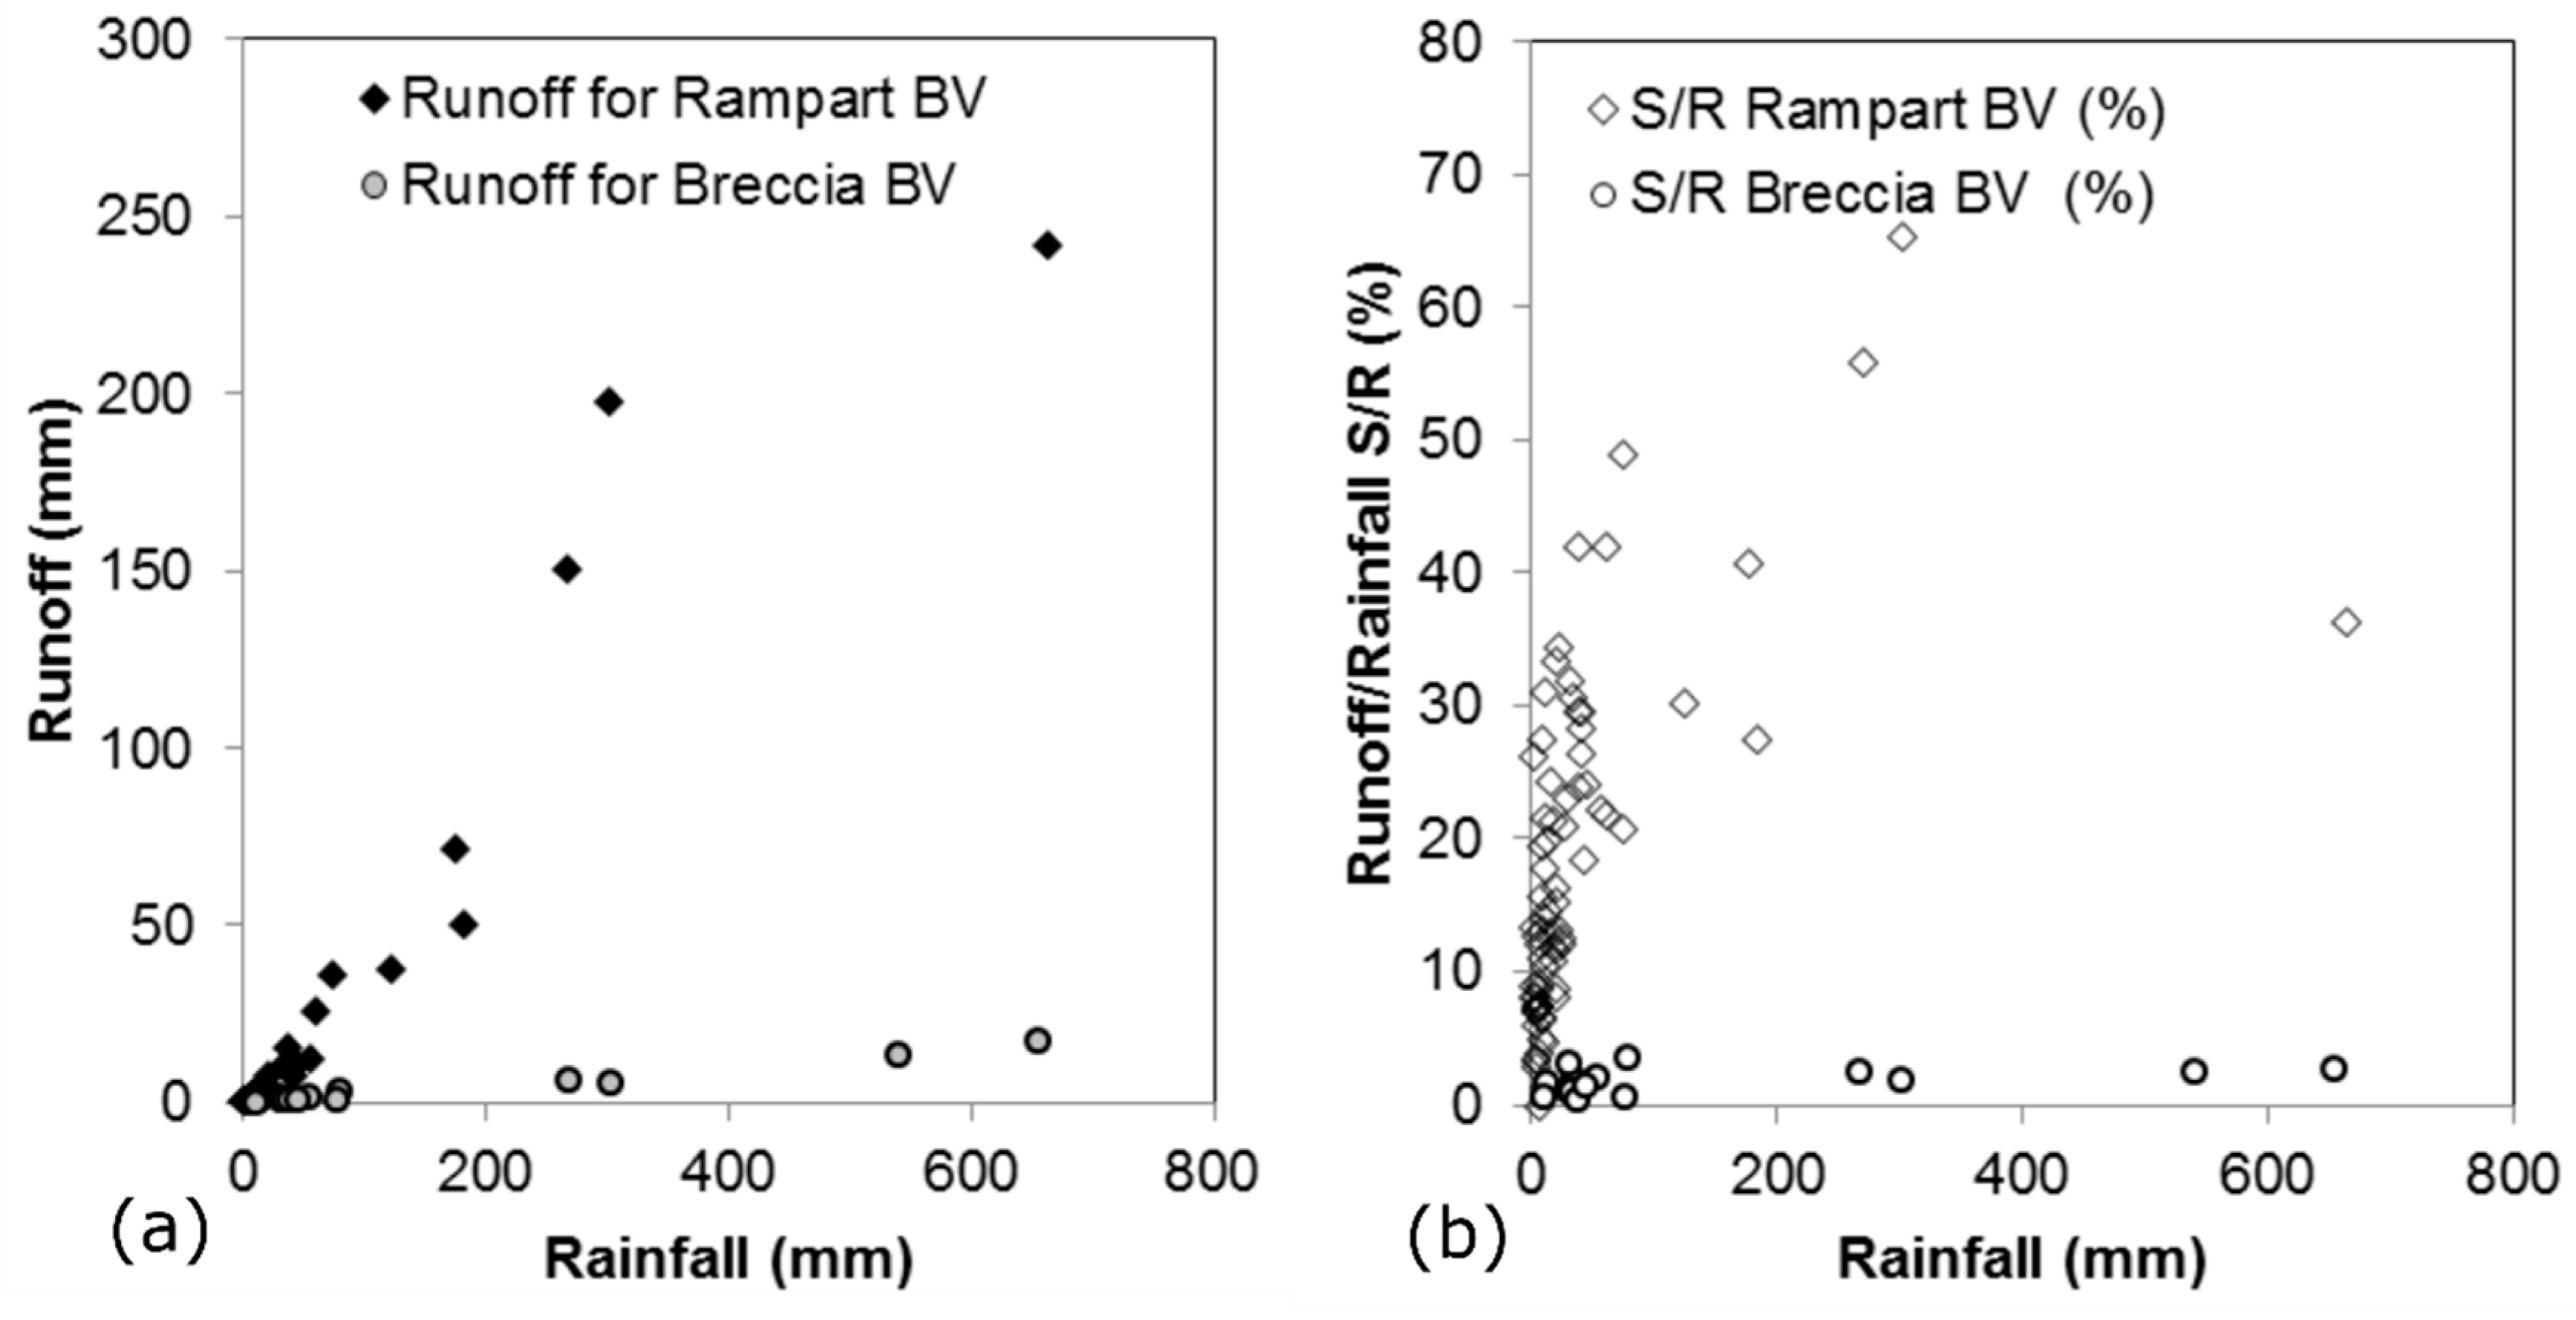
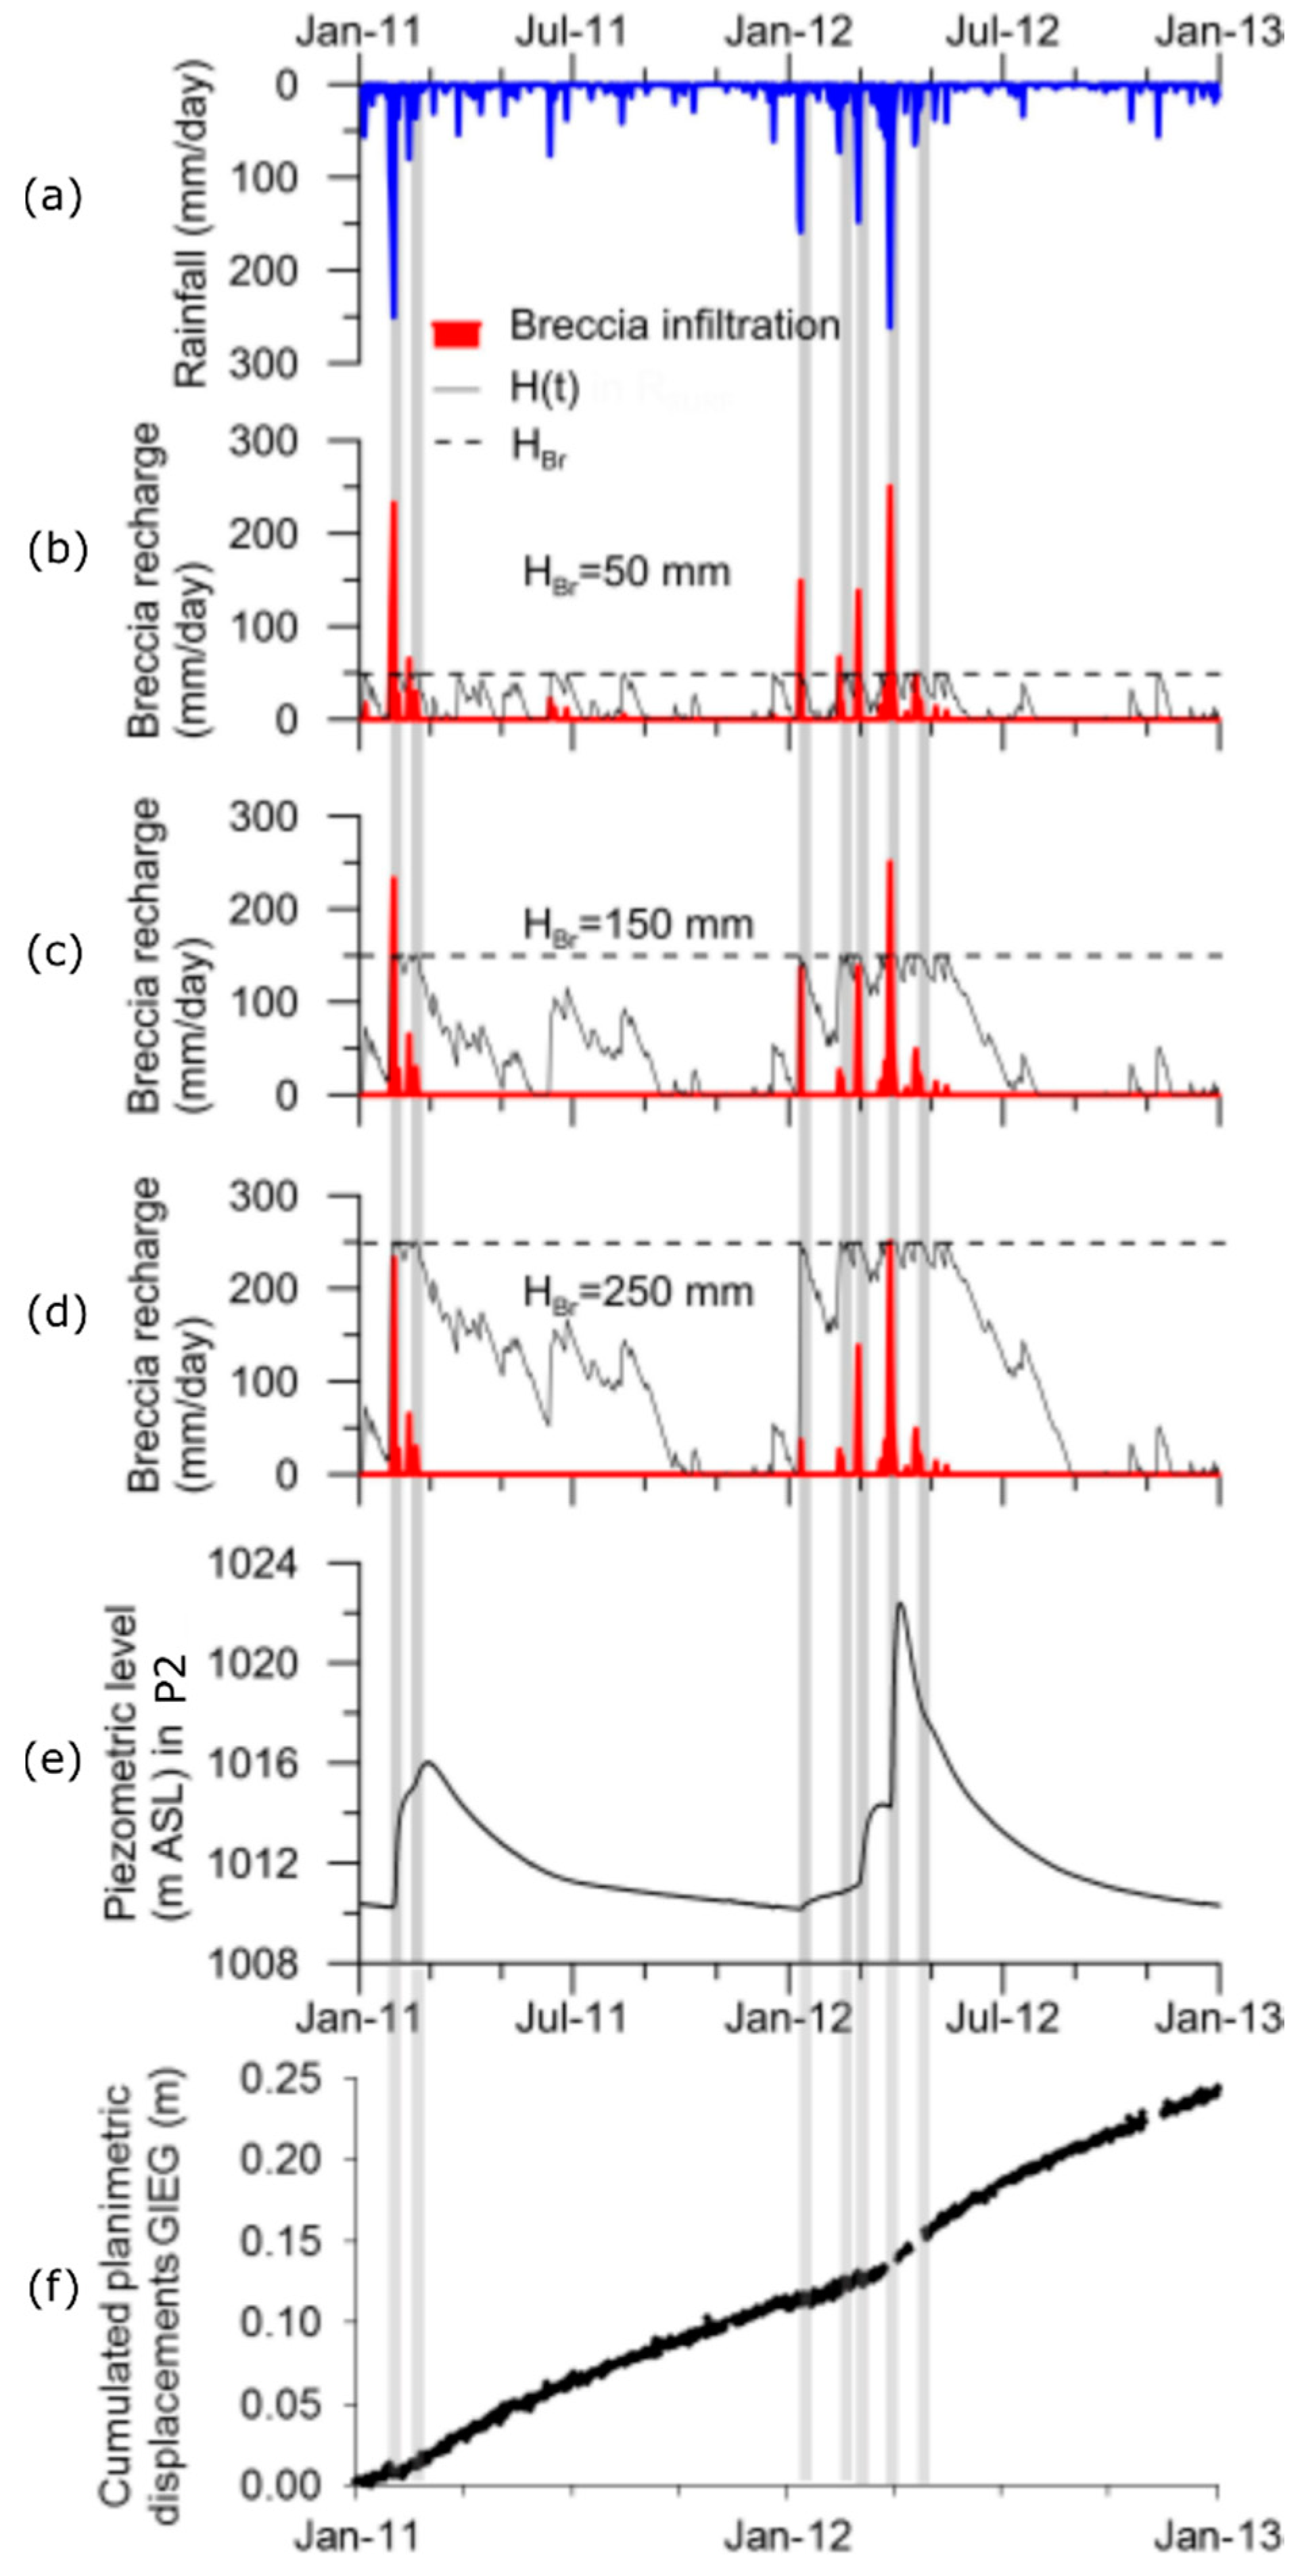
Table 1.
Calculated outflow from the Grand Ilet breccia aquifer (C: Continuous monitoring; PM: One-off measurement; VE: Visual estimate). Q LW corresponds to low-water spring flow.
Table 1.
Calculated outflow from the Grand Ilet breccia aquifer (C: Continuous monitoring; PM: One-off measurement; VE: Visual estimate). Q LW corresponds to low-water spring flow.
| Spring. | Q LW (l/s) | (Q LW)/(Q S6) | 2011 | 2012 | ||||||
|---|---|---|---|---|---|---|---|---|---|---|
| Monitoring Type | Measured Annual Flow (m3/year) | Estimated Annual Flow (m3/year) | Annual Flow Part (%) | Monitoring Type | Measured Annual Flow (m3/year) | Estimated Annual Flow (m3/year) | Annual Flow Part (%) | |||
| S6 | 20.0 | 1.00 | C | 1,175,977 | - | 37.3 | C | 1,801,863 | - | 36.6 |
| S7 | 3.0 | 0.15 | VE | - | 176,397 | 5.6 | VE | - | 270,279 | 5.5 |
| S9 | 0.8 | 0.04 | PM | - | 47,039 | 1.5 | PM | - | 72,075 | 1.5 |
| S8 | 0.5 | 0.03 | VE | - | 29,399 | 0.9 | VE | - | 45,047 | 0.9 |
| S5 | 6.0 | 0.30 | PM | - | 352,793 | 11.2 | PM | - | 540,559 | 11.0 |
| S4 | 3.0 | 0.15 | PM | - | 176,397 | 5.6 | PM | - | 270,279 | 5.5 |
| S3 | 0.5 | 0.03 | VE | - | 29,399 | 0.9 | VE | - | 45,047 | 0.9 |
| S11 | 2.0 | 0.10 | PM | - | 117,598 | 3.7 | PM | - | 180,186 | 3.7 |
| S10 | 1.0 | 0.05 | VE | - | 58,799 | 1.9 | VE | - | 90,093 | 1.8 |
| S15 | 1.9 | 0.10 | PM | - | 146,997 | 4.7 | C | 257,143 | - | 5.2 |
| S16 | 0.5 | 0.03 | PM | - | 29,399 | 0.9 | PM | - | 45,047 | 0.9 |
| S17 | 0.8 | 0.04 | PM | - | 47,039 | 1.5 | C | 131,096 | - | 2.7 |
| S14 | 10.0 | 0.50 | PM | - | 587,989 | 18.7 | PM | - | 900,932 | 18.3 |
| S13 | 3.0 | 0.15 | VE | - | 176,397 | 5.6 | VE | - | 270,279 | 5.5 |
| Total measured outflow (m3/year) | - | - | - | 1,175,977 | - | - | - | 2,190,101 | - | - |
| Total estimated outflow (m3/year) | - | - | - | - | 1,975,642 | - | - | - | 2,729,823 | - |
| Total outflow (m3/year) | - | - | - | 3,151,619 | - | - | 4,919,924 | |||
Table 2.
Entry parameters of the water budget model.
| Parameters | Short-Form Expression | Quantification Method |
|---|---|---|
| Potential Evapotranspiration | PETBC | Calculation based on temperature (Blanley-Criddle equation) |
| Rainfall | R | Measured with tipping-bucket rain gauge |
| Runoff | S | Measured with gauging weirs |
Table 3.
Characteristics of rainfall episodes that generated significant aquifer recharge between January 2011 and December 2012.
Table 3.
Characteristics of rainfall episodes that generated significant aquifer recharge between January 2011 and December 2012.
| Date (First Day of Rainfall during the Episode under Consideration) | Cumulated Rainfall (mm) | Length (day) |
|---|---|---|
| 29 January 2011 | 655 | 4 |
| 12 February. 2011 | 80 | 1 |
| 10 January 2012 | 303 | 2 |
| 12 February 2012 | 164 | 4 |
| 29 February 2012 | 267 | 3 |
| 29 March 2012 | 541 | 3 |
Table 4.
Calibration and validation of the water budget based on estimated outflow. A sensitivity analysis was performed with an HBr value ranging from 250 mm to 50 mm for the landslide’s breccia. The best-balanced budget is obtained for a HBr value of 250 mm.
Table 4.
Calibration and validation of the water budget based on estimated outflow. A sensitivity analysis was performed with an HBr value ranging from 250 mm to 50 mm for the landslide’s breccia. The best-balanced budget is obtained for a HBr value of 250 mm.
| Period | 2011 | 2012 | 2011 | 2012 | 2011 | 2012 | |
|---|---|---|---|---|---|---|---|
| Calibration Parameters | HBr Breccias (mm) | 250 | 150 | 50 | |||
| HRamp Rampart (mm) | 50 | 50 | 50 | ||||
| Results | Outflow from springs (m3/year) | 3,151,619 | 4,919,924 | 3,151,619 | 4,919,924 | 3,151,619 | 4,919,924 |
| Calculated outflow for the model (m3/year) | 2,997,815 | 5,831,608 | 3,407,230 | 6,241,023 | 4,161,024 | 6,852,124 | |
| Deviation (%) | −5 | 19 | 8 | 27 | 32 | 39 | |
Table 5.
Water budget at a yearly scale (years 2011 and 2012) for the breccia and rampart watersheds. The H values for soil reservoirs used for the breccia and rampart watersheds are 250 mm and 50 mm respectively.
Table 5.
Water budget at a yearly scale (years 2011 and 2012) for the breccia and rampart watersheds. The H values for soil reservoirs used for the breccia and rampart watersheds are 250 mm and 50 mm respectively.
| Period | 2011 | 2012 | 2011–2012 | |||
|---|---|---|---|---|---|---|
| Watershed | Breccia | Rampart | Breccia | Rampart | Breccia | Rampart |
| Rainfall R (mm) | 2143 | 2143 | 2634 | 2634 | 4777 | 4777 |
| Number of Recharge Episodes | 2 | 10 | 5 | 9 | 7 | 19 |
| Actual Evapotranspiration ET (mm) | 1548 | 761 | 1443 | 739 | 2990 | 1500 |
| Runoff S (mm) | 25 | 663 | 26 | 902 | 51 | 1565 |
| Infiltration Ar (mm) | 555 | 682 | 1174 | 1008 | 1728 | 1690 |
| Remaining stock in the soil reservoir (mm) | 15 | 37 | 8 | 23 | 8 | 23 |
| S/R (%) | 1 | 31 | 1 | 34 | 1 | 33 |
| ET/R (%) | 72 | 36 | 55 | 28 | 63 | 31 |
| Ar/R (%) | 26 | 32 | 45 | 38 | 36 | 35 |
© 2018 by the authors. Licensee MDPI, Basel, Switzerland. This article is an open access article distributed under the terms and conditions of the Creative Commons Attribution (CC BY) license (http://creativecommons.org/licenses/by/4.0/).
Share and Cite
MDPI and ACS Style
Belle, P.; Aunay, B.; Lachassagne, P.; Ladouche, B.; Join, J.-L. Control of Tropical Landcover and Soil Properties on Landslides’ Aquifer Recharge, Piezometry and Dynamics. Water 2018, 10, 1491. https://doi.org/10.3390/w10101491
AMA Style
Belle P, Aunay B, Lachassagne P, Ladouche B, Join J-L. Control of Tropical Landcover and Soil Properties on Landslides’ Aquifer Recharge, Piezometry and Dynamics. Water. 2018; 10(10):1491. https://doi.org/10.3390/w10101491
Chicago/Turabian StyleBelle, Pierre, Bertrand Aunay, Patrick Lachassagne, Bernard Ladouche, and Jean-Lambert Join. 2018. "Control of Tropical Landcover and Soil Properties on Landslides’ Aquifer Recharge, Piezometry and Dynamics" Water 10, no. 10: 1491. https://doi.org/10.3390/w10101491
Note that from the first issue of 2016, this journal uses article numbers instead of page numbers. See further details here.