Article

Abundance, Distribution, and Drivers of Microplastic Contamination in Urban River Environments

School of Geography, Earth and Environmental Sciences, University of Birmingham, Birmingham B15 2TT, UK
*
Author to whom correspondence should be addressed.
Water 2018, 10(11), 1597; https://doi.org/10.3390/w10111597
Submission received: 10 September 2018 / Revised: 31 October 2018 / Accepted: 1 November 2018 / Published: 7 November 2018
(This article belongs to the Section Water Quality and Contamination)

Abstract

:
Given the persistence of microplastics in the environment and their potential toxicity to ecosystems, understanding of likely microplastic accumulation ‘hotspots’ in rivers is urgently needed. To contribute to this challenge, this paper reports results of a microplastic survey from a heavily urbanised catchment, the River Tame and four of its tributaries, which flows through the city of Birmingham, UK. All sediment sampled was found to contain microplastics with an average abundance of 165 particles kg−1. While urban areas generally have a greater abundance of microplastics as compared with rural, there is no simple relationship between microplastic numbers and population density or proximity to wastewater treatment sites. The greatest change in microplastic abundance was due to the presence of a lake along the course of the River Tame—i.e., flow velocities are reduced on entering the lake, which promotes the deposition of fine sediment and potentially microplastics. This suggests that the greatest concentrations of microplastics will not be found in-channel but rather on the floodplain and other low velocity environments such as meander cutoffs. We also identified a new mechanism of microplastic fixation in freshwater environments through ecological engineers, specifically caddisflies, that incorporated microplastics into their casing. These results highlight the need to explore further hydrodynamic and ecological impacts on microplastics fate and transport in rivers.

Graphical Abstract

1. Introduction

Microplastics are now recognised as a pervasive pollutant within marine environments, with the first evidence of their wide spread accumulation in freshwater and terrestrial environments recently published [1,2,3]. Current estimates suggest that 8 million metric tonnes of plastic enter the oceans every day [4]. Due to its high durability and variable potential for physical or biogeochemical breakdown, microplastics residence times in the environment can range from hundreds to thousands of years [5,6]. However, while it is acknowledged that river environments provide an important conduit for microplastics between inland terrestrial inputs and marine environments, there is still very little research on the abundance, patterns, and characteristics of microplastic particles in freshwater environments that would allow us to better understand their fate and transport as well as where microplastics may accumulate [7,8,9,10,11]. This is of concern given the growing evidence of the impacts of microplastics on ecosystem and public health. An adequate assessment of microplastic risks to the environment and public health critically requires more detailed field-based evidence of microplastic types and properties within river corridors in order to benchmark regional variations in exposure to microplastics and their associated pollutants, and identify at risk ecosystems.
Ingestion of microplastics in marine organisms by pelagic (herring and mackerel) and demersal (cod, dab, and flounder) fish [12], shrimp, mussels, as well as copepods, cladocerans, rotifers, polychaete larvae, ciliates [13], echinoderms and bryozoans [14], and invertebrates with a range of feeding strategies—including filter feeders (barnacles), deposit feeders (lugworms) and detritivores (amphipods, sea cucumbers)—have been reported [15,16]. While studies are less prevalent in freshwaters, Sanchez et al. [17] observed ingestion of microplastics, ranging from 250–1000 µm, in 12% of the Wild Gudgeon fish they surveyed. Likewise, Steer et al. [18] identified 2.9% of fish larvae with ingested microplastics, 66% of which were fibres. Once ingested, a small fraction of the microplastics can translocate to tissue and even the liver depending on their size, causing inflammation and lipid accumulation [19], reduced growth [20], immobilisation [21], and mortality [22]. However, it must be noted that lab-scale studies of impacts typically use pristine microplastic particles which have not been weathered, aged, or coated with biomolecules, and much higher concentrations of microplastic particles than would be typical in the environment (e.g., [23]). Although the propagation of microplastics along the food chain has not been reported in the freshwater literature, marine studies have quantified transition of microplastic particles between meso and macrozooplankton [24] and between the blue mussel and littoral crab [25]. Marine studies have also quantified the ecotoxicological impacts within benthic organisms [26,27]. It is therefore highly likely that the observed uptake into food webs and impacts of microplastics in marine ecosystems are also replicated in freshwaters.
Thus, an emerging concern, given that microplastics have likely been accumulating for decades in freshwater systems, is to what extent microplastics have been deposited in river environments and whether they are preferentially building up in ‘hotspots’ of pollution. Because of the paucity of studies in river environments, transport mechanisms and likely microplastics accumulation hotspots in river catchments are unknown. Studies to date have largely been restricted to establishing the presence or absence of microplastics from a restricted range of samples at a few sites. For example, a key source of microplastics within rivers has been identified as wastewater treatment works (WwTw). Murphy et al. [28] found that despite a 98% removal rate of a WwTw on the River Clyde, Glasgow this still resulted in an estimated 6.5 × 10⁷ microplastic particles per day being discharged in sewage effluent. Microplastic spheres and fibres may enter WwTw in the form of microbeads (spheres) released from personal care products and textile degradation (fibres) from washing machines. Thus, if these microplastic types are found in abundance it may be indicative of a point source of pollution in typically urban catchments, for example. Peters and Bratton [29] found significantly more plastics in Sunfish within urban areas compared to upstream and downstream sites in the Brazos River Basin. However, polymers removed via WwTw are often retained in the sewage sludge that can then be applied to agricultural land, providing a more diffuse rural pathway. Plastics are also discarded in landfill [6], which may typically result in formation of secondary microplastic particles with a more fragmented irregular shape [5]. However, despite being urgently needed, systematic characterizations of microplastic particles of different compositions, shapes, sizes, and densities, that would help identify the likely sources in freshwaters, are still limited to a very few case studies [30,31,32]. There is therefore substantial uncertainty about the types of microplastics, their physical and chemical properties and hence the potential breakdown products and accumulation hotspots to be expected in rivers locally. The differentiation between primary microplastics (i.e., microbeads made for human care products) and secondary microplastics (from breakdown of macroplastic waste) also remains largely unknown within freshwaters.
It is clear that there is currently a lack of studies quantifying microplastic abundance in river benthic environments. The aim of this paper is to establish the magnitude of microplastic contaminant in benthic sediment and to explain the observed patterns of abundance and distribution. This was achieved by: (1) determining the abundance and distribution of microplastics along a 45-km urban-rural transect of the River Tame, UK; (2) characterising the spatial variability of microplastic abundance and composition for four main tributaries of the River Tame; and (3) identifying likely controls of microplastic abundance, at a range of scales, in the benthic environment.

2. Materials and Methods

The field-based research for this study was undertaken in the upper River Tame catchment, located within the West Midlands in the United Kingdom. The upper River Tame flows in an easterly direction through the city of Birmingham, the UK’s second largest city with substantial industrial heritage, before flowing in a northerly direction where it discharges into the River Trent; a main contributor to the River Humber estuary. The Humber discharges into the North Sea, where a range of 100–3600 microplastic particles kg−1 has been reported in sediment along its coastline [33]. The catchment of the River Tame represents one of the most urbanized systems in the UK and has a range of pollutant inputs from diffuse and point sources [34]. These include roads, factory yards, contaminated land [34], and point sources derived from WwTw and industrial sites [35].
Six sampling locations were identified along the River Tame, over a distance of ~45 km (Figure 1). The three upstream sites (T1, T2, and T3) are all located within the highly urbanised area of the city of Birmingham. The three downstream sites (T4, T5, and T6) represent a more rural but still populated area outside of the city. Sampling locations at four tributaries of the River Tame were also selected (Figure 1) based on sub-catchment characteristics which are thought to influence abundance and composition of microplastic particles, specifically, level of urbanization and presence of WwTw:
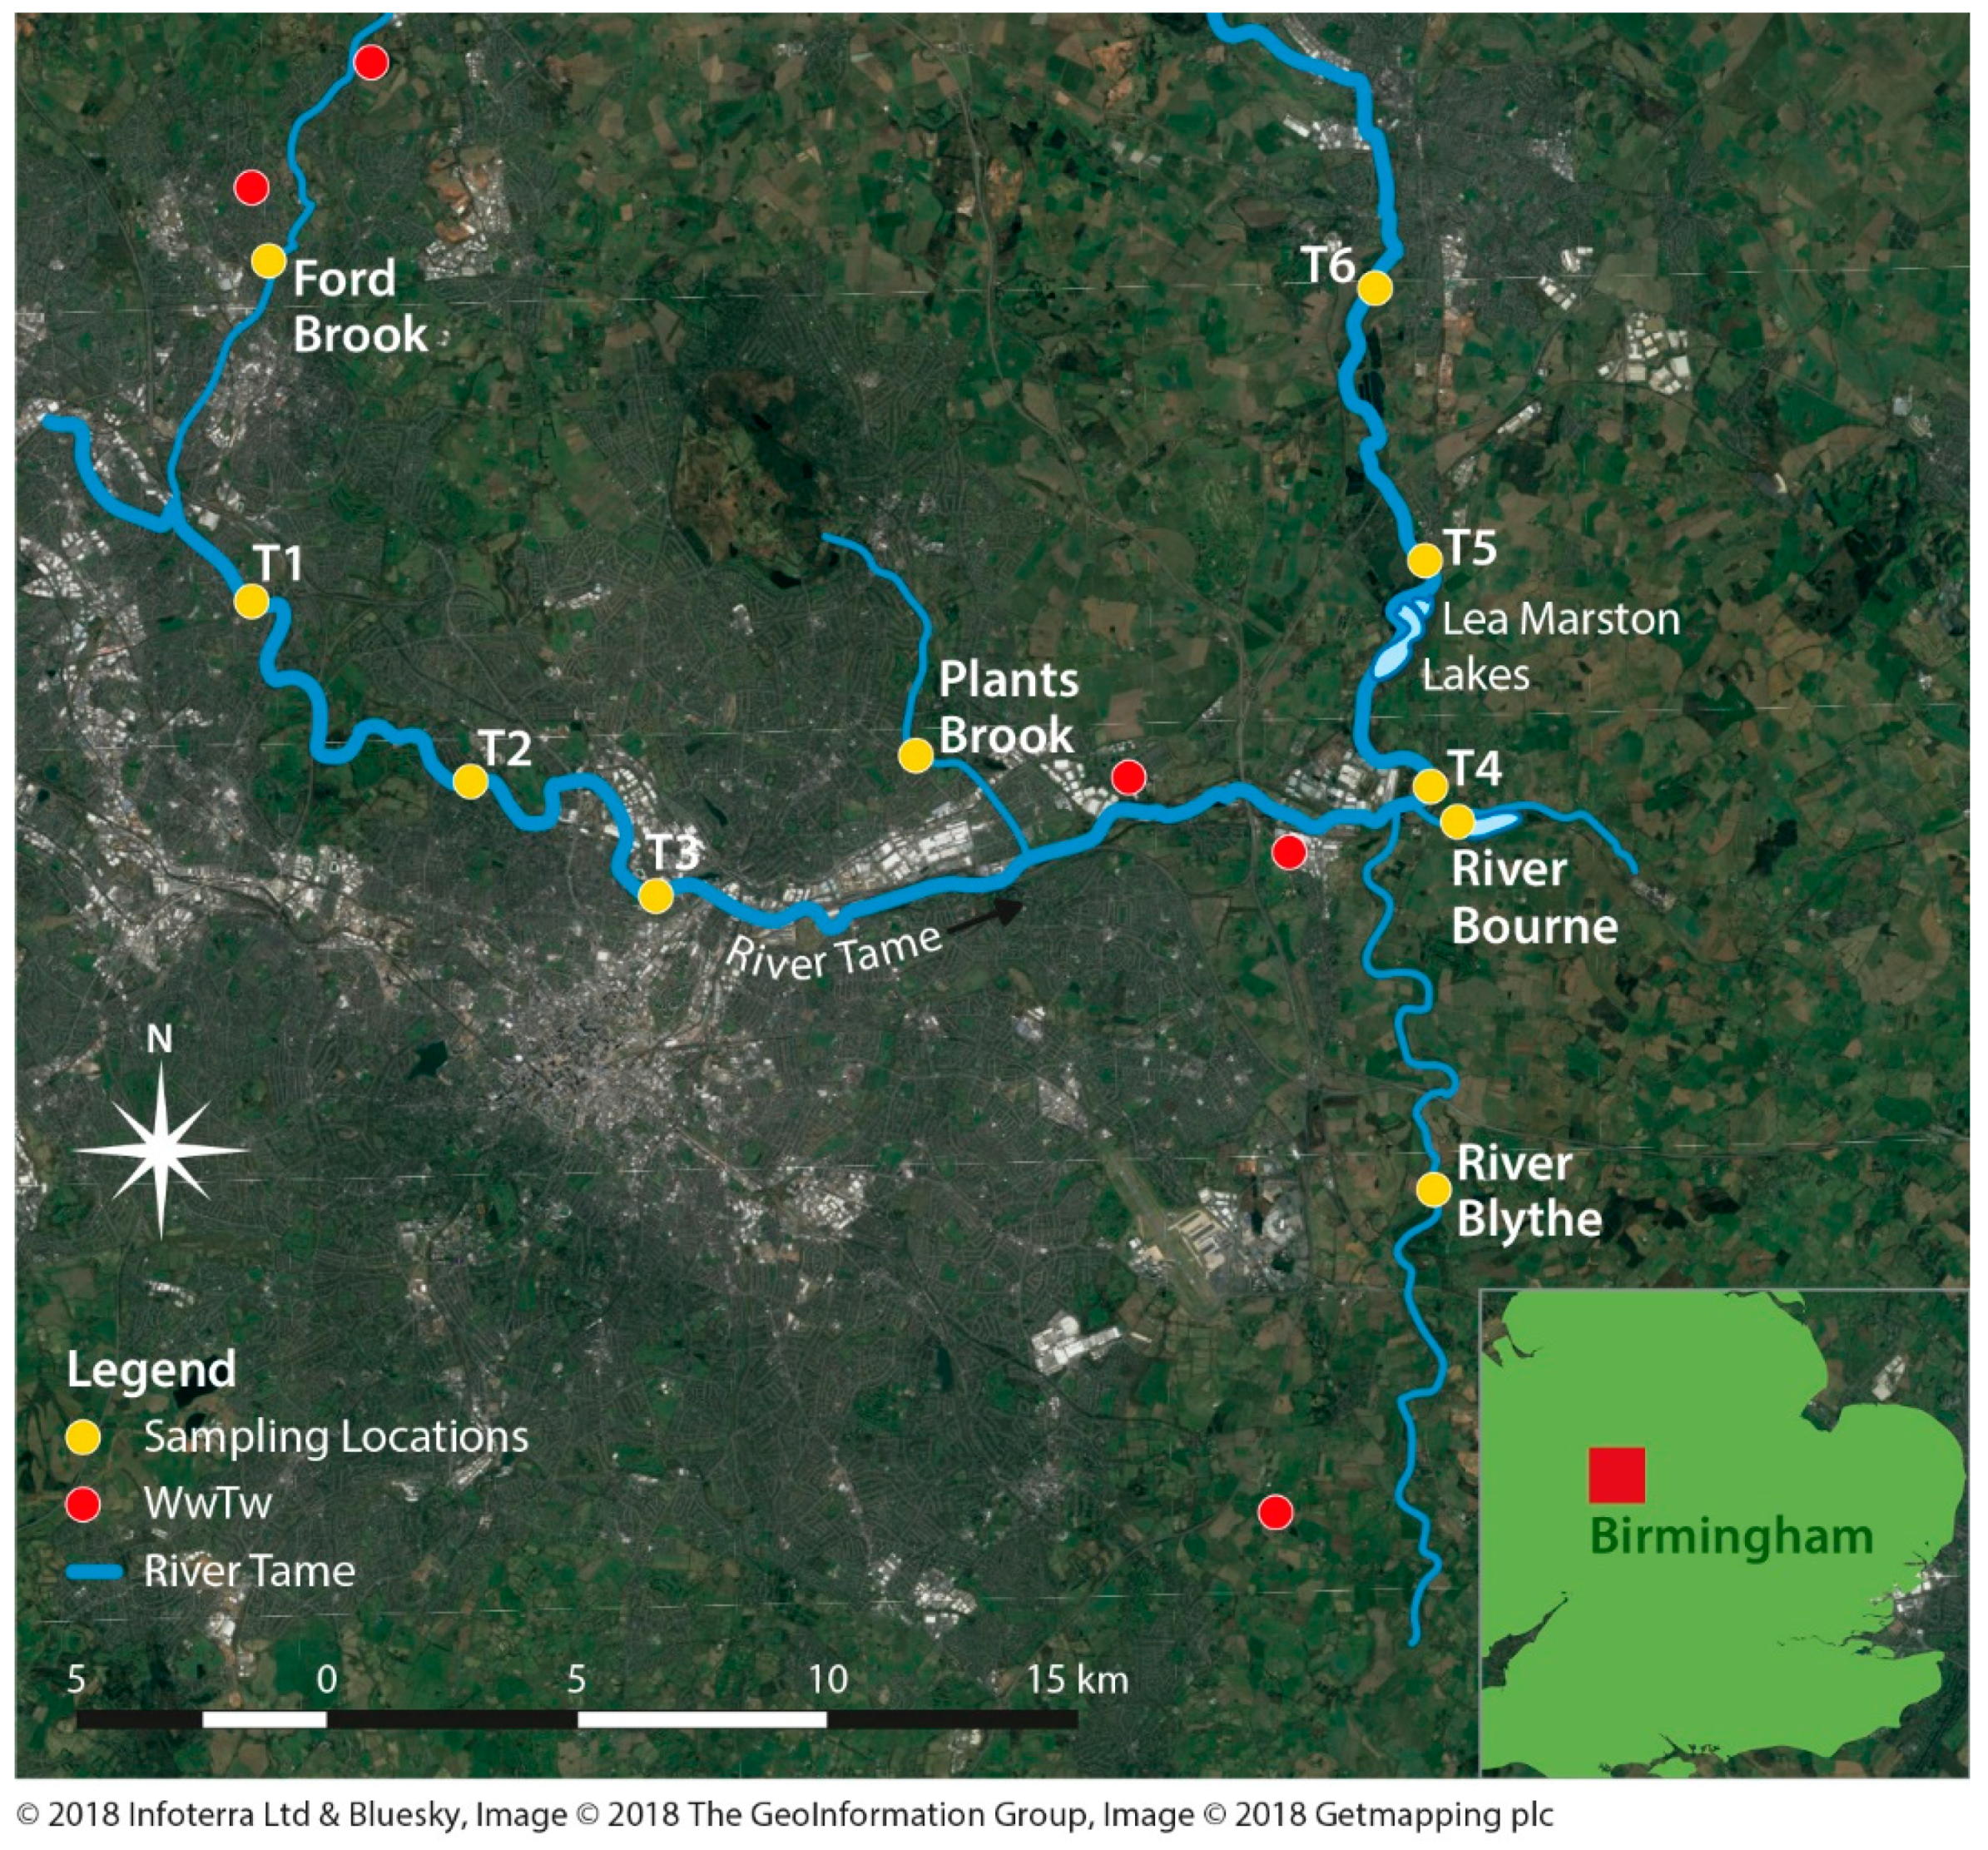
  • Ford Brook (FB) is an urbanized tributary fed by effluent from two WwTw;
  • Plants Brook (PB) is an urbanized tributary with no WwTw effluent;
  • River Blythe (BL) is a largely rural tributary with WwTw effluent from Barston WwTw;
  • River Bourne (RB) is a rural tributary with no WwTw effluent.
The sampling strategy was thus designed to provide an overall catchment perspective on microplastic abundance as well as allowing an assessment of potential sources and their relative effect on the abundance and composition of microplastics. To assess whether the degree of urbanisation had an impact on microplastic abundance at each site the population density was also estimated. This was done using the population data of the local districts within 3 km (upstream) of each site and then generating an average population density estimate.
Sediment samples were collected between June–July 2017 during baseflow conditions. Following the protocol outlined by Horton et al. [1], at each site four 250 mL samples of sediment were collected along a three metre transect at one-metre intervals; resulting in a 1 litre bulk sample for each site. In each case a stainless-steel scoop was used to collect sediment at depths of approximately 5–10 cm, ensuring minimal volume of surface water was retained in the containers. In order to provide sufficient sample replication to reduce sampling bias and account for natural variability along the channel [36], two extra samples, 100 m apart, were collected within each tributary. This resulted in a total of 18 composite samples being collected. Because fine-grained sediment typically accumulates in riverine locations with low flow velocity, it was hypothesised that microplastic abundance could also be influenced by overall river flow. To provide some indication as to what extent flow velocity may influence the quantity of microplastics found average flow velocity was measured using a propeller-type current meter at each site at the time of sample collection.
The 1 L samples were wet sieved to retain four size fractions: 63–<250 µm, 250–<1000 µm, 1–<2 mm, and 2–4 mm. The two larger size ranges were selected for a direct inter-comparison with the results from Horton et al., (2017) for the River Thames, UK. The smaller size fractions were included given their abundance and impacts reported in other studies [30,37] and the lack of studies distinguishing between different size ranges [38]. It is noted that the velocity measurements taken at each site provide a snapshot of the flow regime at the time of sample collection but do not provide a longer temporal record of hydrodynamics at the site. The relative proportion of fine-grained sediment at each site may thus provide a more meaningful proxy of the overall hydrodynamic conditions. Thus, we postulate that sites with more fine-grained sediment may have more quiescent flow conditions which could also lead to greater microplastic deposition and hence abundance.
The four size fractions were rinsed into individual (weighed) containers and dried in an oven at 50 °C over a 42-h period. When the samples had dried their dry weight was calculated. After weighing, sediment within each size fraction was transferred to 250 mL glass beakers, each filled with approximately 75 mL of the sample. A zinc chloride (ZnCl2) solution (density 1.7 g cm−3) was added to each size fraction to float the microplastic material following a modified version of the procedure outlined by Thompson et al. [39]. Samples were stirred for 30 s and allowed to settle for 15 min. Although a saturated NaCl solution was used by Thompson et al. [39] the solution is less dense than some microplastic particles such as polyvinylchloride. Zinc chloride was thus used in this study as all microplastic particle types are expected to float given the highest density particle has a lower density than the ZnCl2 solution [40]. After flotation, a separate ZnCl2 solution was added to the mixture to allow the floating microplastics to overflow into a larger container for further analysis, with further ZnCl2 solutions was used to remove particles attached to the outside of the beaker after the overflow process to retain the maximal amount. The overflowed particles were then transferred to a petri dish and dried in an oven at 30 °C.
Acid digestion, to remove organic material, was not attempted in the study, as previous studies have cited the destruction of some polymers with low pH tolerance when using H2SO4 and HNO3. In addition, H2O2 is a bleaching agent, which can alter plastic particle colour and impede visual identification. This was appropriate as there were low levels of organic material which were easily discarded when tested for hardness via pressure applied by forceps.
Total counts of all plastics, their size ranges and shapes were identified and enumerated under a binocular microscope (Carl Zeiss Stemi 2000) ×50 magnification. Plastics were initially identified following criteria set out by Hidalgo-Ruz et al. [38] and Nor and Obbard [41]:
  • unnatural homogeneous colour such as blue or yellow;
  • unnatural shape such as spherical;
  • homogenous texture;
  • have homogenous width and are not tapered at the end.
The particles were further sorted based on their size and shape given that these physical properties affect both their transport within the environment and their bioavailability [16]. Any identified particles suspected to be natural debris were tested for hardness via pressure applied by forceps.
Individual plastic particles were grouped by shape based on standards outlined by Helm [42]:
  • fragments,
  • commercial fragments (melted plastic appearance),
  • spherical beads,
  • irregular beads,
  • foam,
  • fibres,
  • film.
This criterion aims to determine the relative influence of land use—such as industry—on the overall abundance of microplastics in the environment.
To establish the range of materials within the identified microplastics 30 particles were selected for Fourier transform infrared spectroscopy (FT-IR) analysis using a Bruker Vector 22 equipped with a diamond ATR unit, with samples recorded on OPUS software. The spectra were recorded over the range 500–4000 cm−1 at a resolution of 2 cm−1. Particles from the smallest size fraction (63–250 µm) were not included in the FT-IR analysis as their small size could not initially be extracted. Spectra were compared to frequently applied polymer libraries as used in other studies [43].

3. Results

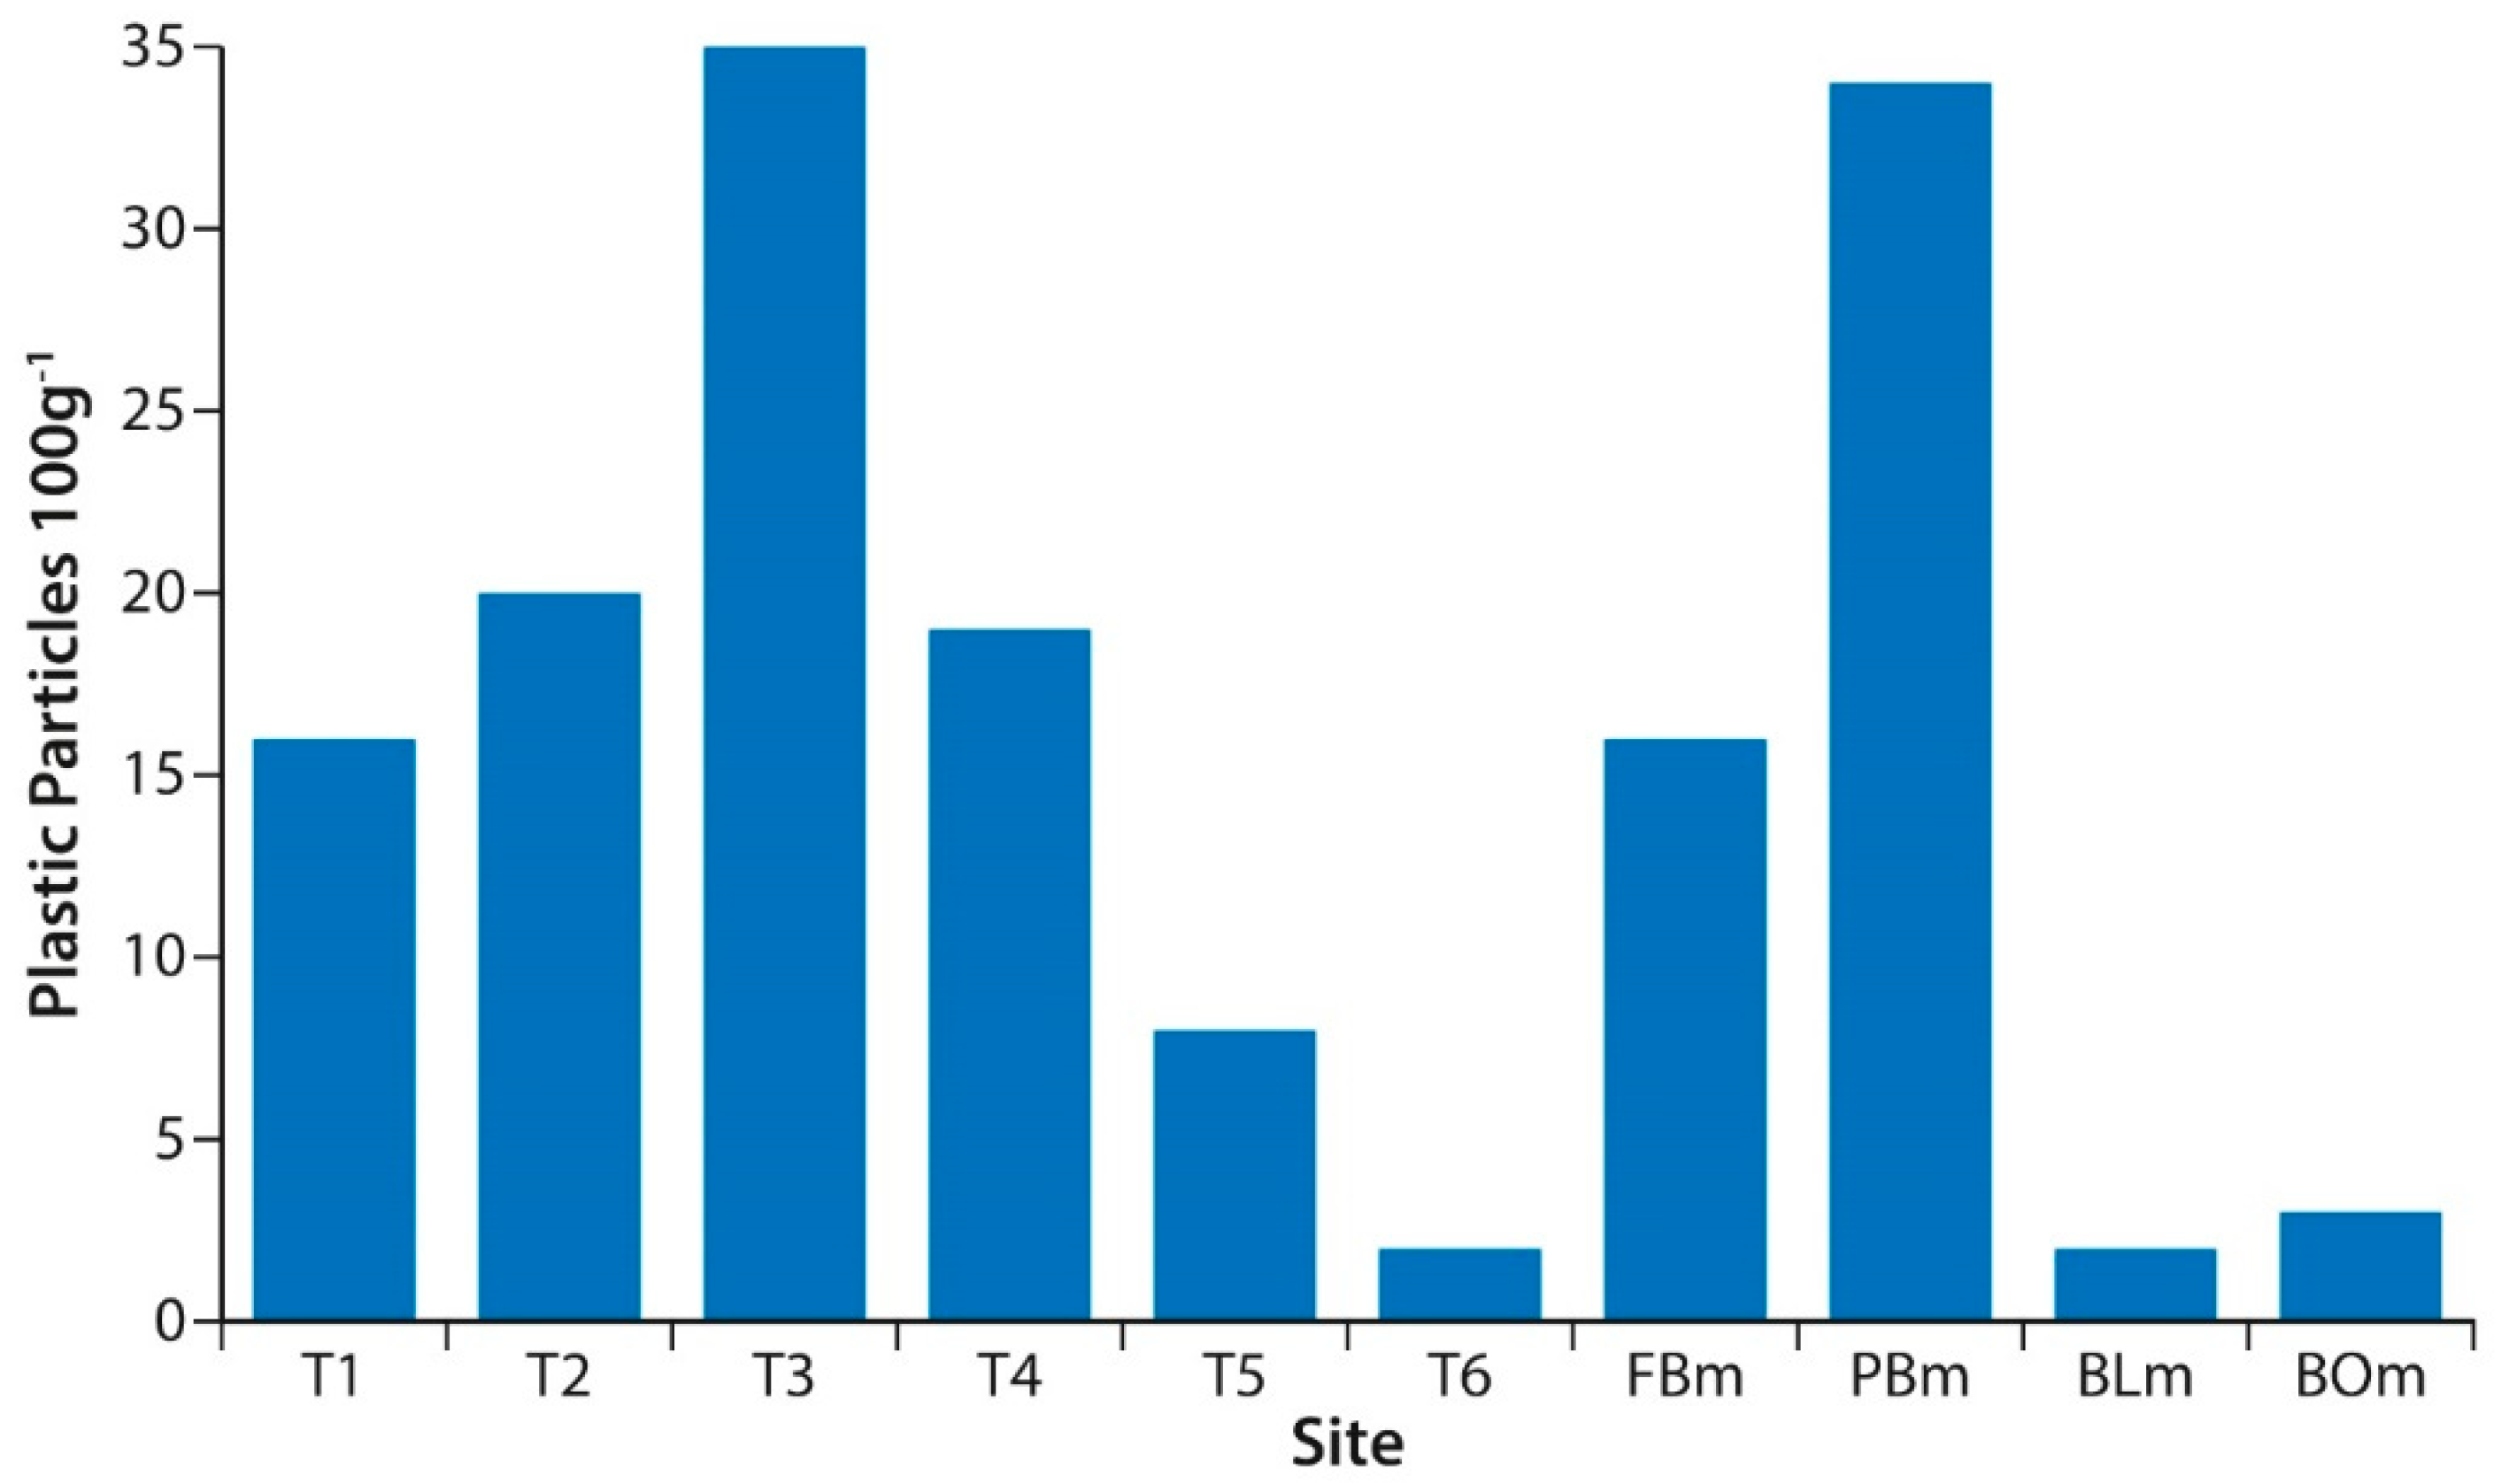
3.1. Microplastic Abundance

Microplastic particles were evident at all sampling sites (including tributary replicates) with a total of 1507 plastic particles found throughout the upper River Tame and its tributaries (average 11 particles 100 g−1, n = 18). Abundance of plastic particles was 65% higher in the more urban section of the River Tame (average 24 particles 100 g−1) compared to more rural sites of the River Tame (average 9 particles 100 g−1; see Table 1 and Figure 2). With T3 recording the highest microplastic numbers (35 particles 100 g−1) within the urban section and T6 recording the lowest count (2 particles 100 g−1), located within the rural section (Table 1 and Figure 2). Overall, a trend of decreasing abundance with distance from the urban centre was evident (Table 1 and Figure 2). Similarly, urban tributaries (FB, PB) had significantly higher microplastic concentrations compared to rural (BL, BO) tributaries (Table 2); (Mann–Whitney U test, P < 0.05, n = 12). Of particular note is the order of magnitude decrease in abundance that occurs from upstream to downstream of Lea Marston Lakes. The four sampling sites upstream of the lakes (T1–T4) have an average abundance of 23 particles 100 g−1, compared to just 5 particles 100 g−1 for the two sites downstream of the lake (T5–T6).
To place these results in context Table 3 summarises the published microplastic data from rivers to date. While these are only a few studies, typical values appear to be on the order of 102 particles kg−1. The Wagner et al. [44] results are somewhat lower than others, which may be due to the small sample size that represented an exploratory dataset only. Hurley et al. [2] report significantly higher levels than the other data for UK rivers. This is likely an artificial difference due to a different sample collection method. They collected both water and sediment from the river bed, therefore data might not be directly comparable to previous studies, which collected sediment only. These differences in sampling protocols highlight a clear need for consensus and agreed best practice or standard procedures on how microplastics are sampled in rivers and what units should be used to report data to facilitate meaningful comparisons.

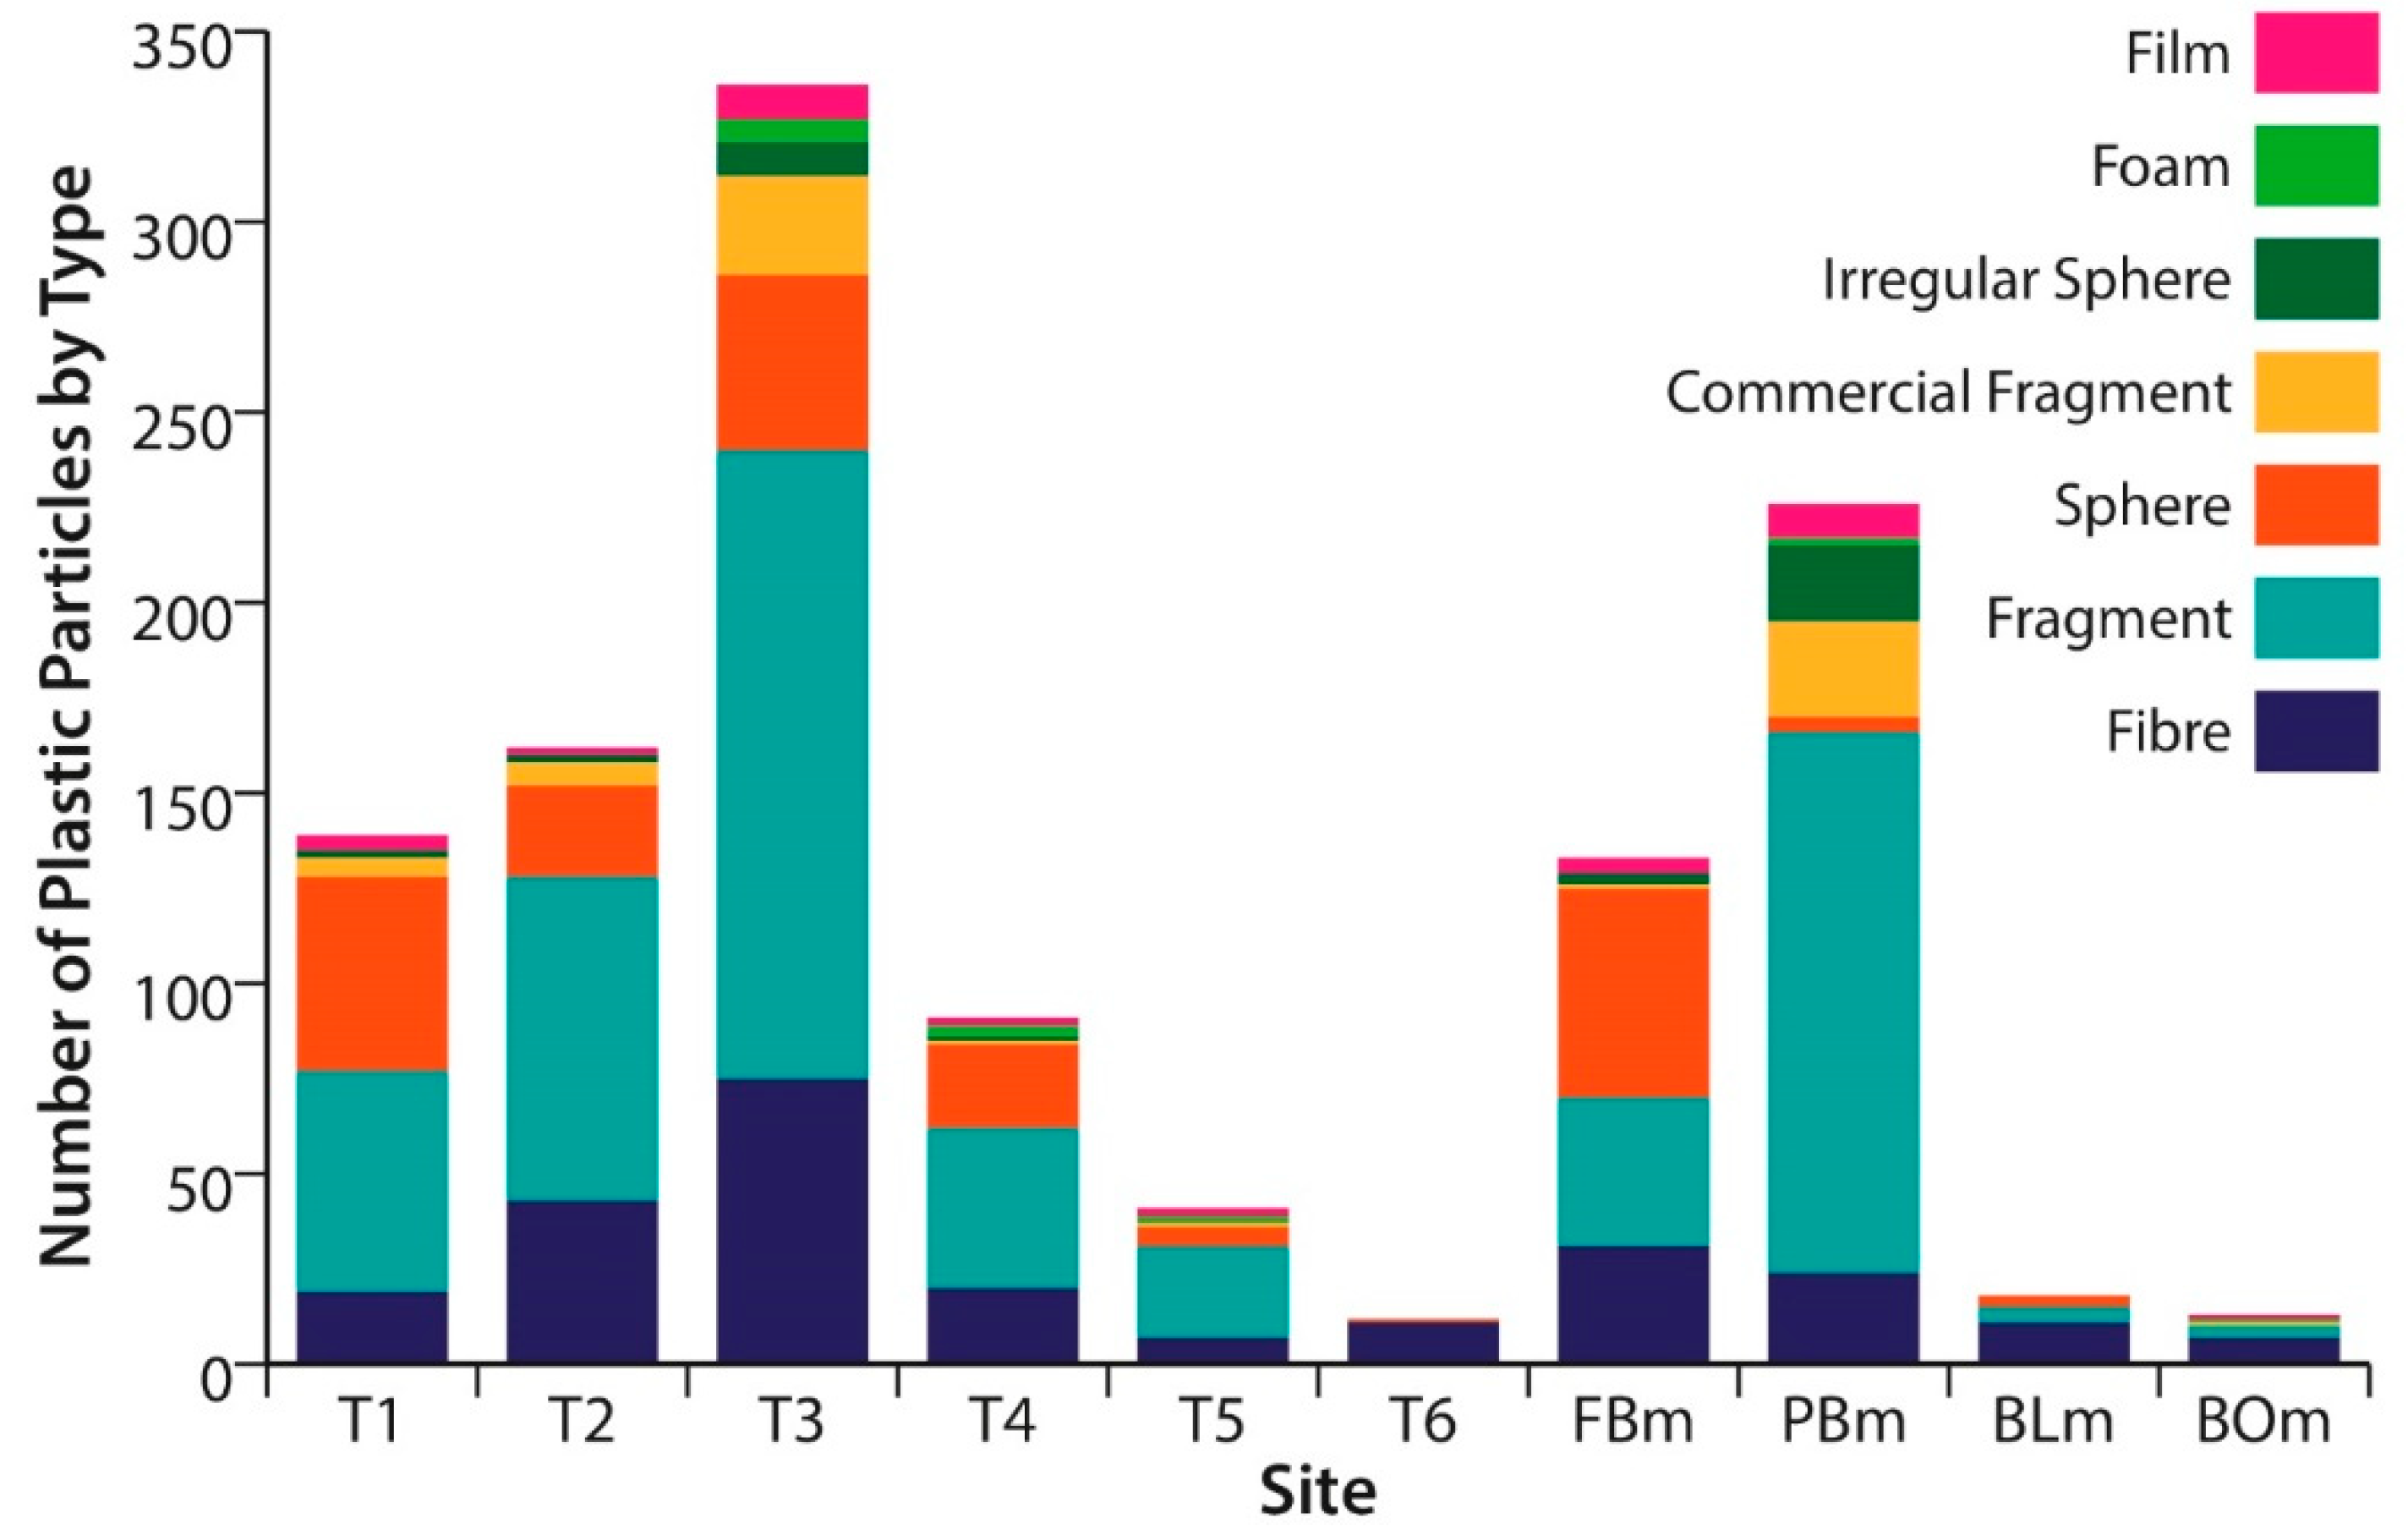
3.2. Microplastic Particle Shapes

All microplastic types were found in both the urban and rural sections of the River Tame. Fragments were the most abundant particle shape found within the study area accounting for ~49% of the total microplastics found. Fibres were the second most abundant particle type and contributed ~22% of the total plastic count. The composition of microplastics shows little variation along the urban–rural transition of the River Tame with a similar range of microplastic shapes found at sites T1–T3 and T4–T6 (Table 1 and Figure 3). The abundance of foams, films, irregular spheres, and commercial fragments never exceed more than 15% of the total composition along the main River Tame, commercial fragments being most abundant at T3 (3 particles 100 g−1). Unlike the River Tame sites where fragments dominated, the type of microplastic was more variable within the tributaries. Plants Brook was the only tributary with fragments as the dominant particle type (Table 2 and Figure 3), spheres were abundant at one site (FB), with fibres and fragments forming the majority of particles at the other two tributaries (Table 2 and Figure 3). All microplastic shapes were found in the urban streams (Table 2; FB and PB) with no spheres found at site BO and no commercial fragments evident at site BL, irregular spheres were also absent from both rural tributaries. Fragments, fibres, spheres, and irregular spheres were significantly higher in urban (FB, PB) tributaries compared to rural (BL, BO) tributaries (Mann–Whitney U test, P < 0.05, n = 12), though there was no significant difference found for films, foams, and commercial fragments between urban (FB, PB) and rural (BL, BO) tributaries (Mann–Whitney U test, P > 0.05, n = 12).
Overall, there is thus evidence for a predominance of secondary microplastics (i.e., fragments) within the river bed samples analysed. This suggests that the main driver of microplastic pollution in the Tame catchment is from the degradation of larger plastics from terrestrial sources such as landfill or litter. The predominance of fragments reported herein has also been reported in other studies. Wagner et al. [44] found 60% of the total particle count were fragments along the Rhine. Similarly, Klein et al. [31] also found fragments to be the dominant particle type along the Rhine shoreline. However, this is not universal; Vermaire et al. [30] found 95% of the particle count in the Ottawa River consisted of fibres (e.g., from washing of clothing). Likewise, in contrast to the main River Tame, herein fibres were the dominant particle type at three of the four tributaries (FB, BL, BO; Table 2) comprising 33%, 53%, and 55% of the particle count respectively. Horton et al. [1] also found fibres were the dominant microplastic particles identified at three of their four sites in the Thames catchment.

3.3. Microplastic Sizes

At each sampling location, the two small size categories (<1 mm) were the most abundant size fraction (Table 1). The 250 µm–1 mm size fraction was most prevalent in the urban section of the River Tame (46% of total count), whilst the 2–4 mm size fraction was least abundant (3%). Similarly, the 2–4 mm fraction was least abundant in the rural section (13%), however, the 63–250 µm was most prevalent within the rural River Tame (36%) with the 250 µm–1 mm fraction showing the biggest decrease between the urban and rural section. Concentrations of the larger size fractions (1–4 mm) never exceeded 40% of the total particle count within the River Tame, whilst none were recorded at T6 (Table 1). T3 had the greatest number of plastic particles in all size ranges except for the 63–250 µm size range, which was most prevalent at T1. Unlike particle shape there seems to be no downstream trend in any of the size ranges along the River Tame (Table 1). Small plastic particles (<1 mm) also dominated each tributary (Table 2) with the 250 µm–1 mm size fraction predominating generally, although the 63–250 µm was the most dominant type at site BO (Table 2).

3.4. FT-IR Based Chemical Characterisation of Microplastics

Polyethylene (PE) was found to be the most abundant (50%) plastic type amongst the identified microplastic particles in the research area. Other identified polymers included polyvinylchloride (PVC, 30%) and polymethyl methacrylate (acrylic: 20%). PE and PVC contribute 21% and 19% of global plastic production [46] and are also the most abundant types reported in marine environments [47]. PE is mostly used to manufacture plastic containers and packaging [47] whilst PVC is used in clothing fabric as well as industrial applications [41]. Some particles (20%) could not be definitively identified due to weak spectra, which may indicate that not all particles visually identified as plastic are so. This has been noted by others, for example, Horton et al. [1] found that 7% of particles initially identified as microplastic were natural in origin.

4. Discussion

While this study has reported a general trend of higher abundance of microplastics in more urbanised parts of the catchment, providing an unequivocal explanation for microplastic abundance at each site is less straightforward. There was no significant relationship between population density and the abundance of microplastic (n = 10, R² = 0.284, P > 0.05), as has been noted by others. For example, Klein et al. [31] also found a weak correlation and non-significant relationship between population density and microplastic abundance (number n = 10, R² = 0.03, P > 0.05). WwTw have also been suggested as a key contributor of microplastic contamination [48,49]. Thus, it might be expected that microplastic abundance would be higher downstream from this type of point source. On this basis, it would be expected that Ford Brook (FB) would contain the highest abundance of microplastics out of the four tributaries given its high population density and influence of two sewage treatment works upstream, however, microplastic counts were lower than those recorded at Plants Brook (PB). However, sphere counts (microbeads) were the most abundant particle type (2.26 particles 100 g−1) in FB suggesting that there is an influence from the WwTw on the type of particle found even if not on the abundance. Results of the FT-IR analysis suggest a potential PE spectrum for these transparent beads, which are widely used in cosmetics, and therefore may end up as discharge in sewage outlets [50]. However, WwTw can vary in their efficiency to retain plastic particles and this could potentially explain the low abundance of fibres and spheres at sites FB and BL. For example, Carr et al. [51] observed high microbead removal rates in seven wastewater treatment plants in California. The treatment process resulted in the complete removal of microplastic particles (45–400 µm) via tertiary treatment, whilst no fibres were found in either effluent that had undergone tertiary treatment or that which had only undergone secondary treatment. The inclusion of sand filters within Barston WwTw [52] has been suggested as reducing microplastic abundance (Barston WwTw located upstream of site BL; Figure 1). Similarly, McCormick et al. [53] found that of eight locations downstream of WwTw the only two sites not to record higher abundances than upstream sites had WwTw with sand filters. It is clear that the methods used to treat effluent can thus influence the amount of microplastic discharge.
A multiplicative linear regression did show a significant relationship between microplastic abundance against population and fine sediment (n = 10, R² = 0.488, P < 0.05). The explanation for this result may be that sites with, on average, lower velocities may favour deposition of fine-grained sediment and hence microplastics also (i.e., given their low density they will only become deposited in the bed sediment under low flow conditions where settling can occur). The average velocity for each site at the time of sample collection is presented in Table 1 and Table 2. The highest recorded velocity is at the tributary site FB that may explain the low microplastic abundance within the site compared to its neighbouring urban stream (PB). FB also has a lower concentration of sediment smaller than 1 mm, again suggesting less deposition occurs compared to the other urban tributary (PB). Along the urban section, T1 had the highest velocity and the coarsest sediment load and had the lowest abundance of plastic particles out of the three urban sites tested along the River Tame.
Hydrodynamics may also explain the large variation within the rural section upstream and downstream of Lea Marston Lakes. For example, between the site upstream of the lakes (T4) and the downstream sites at T5 and T6 microplastic particle abundance is reduced by 60%. Lakes have much lower velocities than rivers and are known to be sinks for fine grained sediment and hence potentially for microplastics [54,55]. Wang et al. [56] showed that microplastic abundance had a negative correlation within 20 urban lakes with distance from urban areas (P < 0.05), suggesting each lake acted as a microplastic sink. Therefore, it may be that Lea Marston lakes has the greatest impact on plastic accumulation in the sediment (and thus at least temporary removal from the water column), representing a more dominant control than population density. These findings point to the fact that flow dynamics may represent an important and under researched control on the development of ‘hotspots’ of microplastic accumulation in freshwaters. Thus, low velocity environments such as occur in lakes, floodplains, and meander cutoffs may represent the most likely areas for microplastic accumulation, rather than the channel itself.
A final observation worthy of note is that some microplastic particles were found within caddisfly cases (Figure 4). Caddisfly abundance was variable across the catchment, with 7% of observed cases at PB having microplastics incorporated into the matrix (n = 30), compared to no particles recorded in caddisfly casing at the RB site (n = 30). To date, studies have cited plastic biofilm accumulation [46], algae hetero-aggregation [57] and invertebrate colonization [58] as influencing microplastic density, flux and fate in the environment. This study is the first to report the incorporation of microplastic particles into the matrix of caddisfly casing (a portable refuge often constructed with sand and vegetation) in the field. Laboratory observations have shown that the carapace of Daphnia Magna accumulate polystyrene microplastic particles (unpublished data from Lynch) which may provide a biological sink and route into the food chain. These findings suggest a potentially significant vertical pathway of microplastic particles in the benthic zone given that hydropsychid caddisflies can make up 80% of lotic macroinvertebrate biomass in streams [59]. Furthermore, many groups of aquatic organisms e.g., Diptera utilise organic particles to make tubes or casing [60]. Caddisfly are also thought to colonize areas that are stable to avoid disturbance [61] and thus, ensure higher survival rates during flooding [62]. For example, the binding of sediment with silk strands from caddisfly can stabilize bed sediments within the 2–8 mm size range by increasing the entrainment threshold needed to induce transportation through the water column [63]. This may provide a mechanism that retains microplastics in the channel during high flow events, in contrast to the flushing effect described by Hurley et al. [2].

Author Contributions

Field data collection and laboratory analysis was undertaken by J.T. under the supervision of I.L., S.K., and G.H.S.S., J.T. and G.H.S.S. wrote the initial draft which was then reviewed and edited by I.L. and S.K.

Funding

This research was facilitated by a Leverhulme research grant (PlasticRivers-Fate and transport of microplastics in rivers) awarded to Krause, Lynch, and Sambrook Smith.

Conflicts of Interest

The authors declare no conflict of interest. The funders had no role in the design of the study; in the collection, analyses, or interpretation of data; in the writing of the manuscript, or in the decision to publish the results.

References

  1. Horton, A.A.; Svendsen, C.; Williams, R.J.; Spurgeon, D.J.; Lahive, E. Large microplastic particles in sediments of tributaries of the River Thames, UK—Abundance, sources and methods for effective quantification. Mar. Pollut. Bull. 2017, 114, 218–226. [Google Scholar] [CrossRef] [PubMed]
  2. Hurley, R.; Woodward, J.; Rothwell, J.J. Microplastic contamination of river beds significantly reduced by catchment-wide flooding. Nat. Geosci. 2018, 11, 251–257. [Google Scholar] [CrossRef]
  3. Rochman, C.M. Microplastics research—From sink to source. Science 2018, 360, 28–29. [Google Scholar] [CrossRef] [PubMed]
  4. Jambeck, J.R.; Geyer, R.; Wilcox, C.; Siegler, T.R.; Perryman, M.; Andrady, A.; Narayan, R.; Law, K.L. Plastic waste inputs from land into the ocean. Science 2015, 347, 768–771. [Google Scholar] [CrossRef] [PubMed]
  5. Cole, M.; Lindeque, P.; Halsband, C.; Galloway, T.S. Microplastics as contaminants in the marine environment: A review. Mar. Pollut. Bull. 2011, 62, 2588–2597. [Google Scholar] [CrossRef] [PubMed]
  6. Barnes, D.K.; Galgani, F.; Thompson, R.C.; Barlaz, M. Accumulation and fragmentation of plastic debris in global environments. Philos. Trans. R. Soc. Lond. B Boil. Sci. 2009, 364, 1985–1998. [Google Scholar] [CrossRef] [PubMed] [Green Version]
  7. Zbyszewski, M.; Corcoran, P.L.; Hockin, A. Comparison of the distribution and degradation of plastic debris along shorelines of the Great Lakes, North America. J. Great Lakes Res. 2014, 40, 288–299. [Google Scholar] [CrossRef]
  8. Imhof, H.K.; Ivleva, N.P.; Schmid, J.; Niessner, R.; Laforsch, C. Contamination of beach sediments of a subalpine lake with microplastic particles. Curr. Boil. 2013, 23, R867–R868. [Google Scholar] [CrossRef] [PubMed]
  9. Free, C.M.; Jensen, O.P.; Mason, S.A.; Eriksen, M.; Williamson, N.J.; Boldgiv, B. High-levels of microplastic pollution in a large, remote, mountain lake. Mar. Pollut. Bull. 2014, 85, 156–163. [Google Scholar] [CrossRef] [PubMed]
  10. Mani, T.; Hauk, A.; Walter, U.; Burkhardt-Holm, P. Microplastics profile along the Rhine River. Sci. Rep. 2015, 5, 17988. [Google Scholar] [CrossRef] [PubMed] [Green Version]
  11. Lechner, A.; Keckeis, H.; Lumesberger-Loisl, F.; Zens, B.; Krusch, R.; Tritthart, M.; Glas, M.; Schludermann, E. The Danube so colourful: A potpourri of plastic litter outnumbers fish larvae in Europe’s second largest river. Environ. Pollut. 2014, 188, 177–181. [Google Scholar] [CrossRef] [PubMed]
  12. Rummel, C.D.; Loder, M.G.; Fricke, N.F.; Lang, T.; Griebeler, E.M.; Janke, M.; Gerdts, G. Plastic ingestion by pelagic and demersal fish from the North Sea and Baltic Sea. Mar. Pollut. Bull. 2016, 102, 134–141. [Google Scholar] [CrossRef] [PubMed]
  13. Setälä, O.; Norkko, I.; Lehtiniemi, M. Feeding type affects microplastic ingestion in a coastal invertebrate community. Mar. Pollut. Bull. 2016, 102, 95–101. [Google Scholar] [CrossRef] [PubMed]
  14. Ward, J.E.; Shumway, S.E. Separating the grain from the chaff: Particle selection in suspension- and deposit-feeding bivalves. J. Exp. Mar. Boil. Ecol. 2004, 300, 83–130. [Google Scholar] [CrossRef]
  15. Besseling, E.; Wegner, A.; Foekema, E.M.; Van Den Heuvel-Greve, M.J.; Koelmans, A.A. Effects of microplastic on fitness and PCB bioaccumulation by the lugworm Arenicola marina (L.). Environ. Sci. Technol. 2012, 47, 593–600. [Google Scholar] [CrossRef] [PubMed]
  16. Wright, S.L.; Thompson, R.C.; Galloway, T.S. The physical impacts of microplastics on marine organisms: A review. Environ. Pollut. 2013, 178, 483–492. [Google Scholar] [CrossRef] [PubMed]
  17. Sanchez, W.; Bender, C.; Porcher, J.M. Wild gudgeons (Gobio gobio) from French rivers are contaminated by microplastics: Preliminary study and first evidence. Environ. Res. 2014, 128, 98–100. [Google Scholar] [CrossRef] [PubMed]
  18. Steer, M.; Cole, M.; Thompson, R.C.; Lindeque, P.K. Microplastic ingestion in fish larvae in the western English Channel. Environ. Pollut. 2017, 226, 250–259. [Google Scholar] [CrossRef] [PubMed]
  19. Lu, Y.; Zhang, Y.; Deng, Y.; Jiang, W.; Zhao, Y.; Geng, J.; Ding, L.; Ren, H. Uptake and accumulation of polystyrene microplastics in zebrafish (Danio rerio) and toxic effects in liver. Environ. Sci. Technol. 2016, 50, 4054–4060. [Google Scholar] [CrossRef] [PubMed]
  20. Au, S.Y.; Bruce, T.F.; Bridges, W.C.; Klaine, S.J. Responses of Hyalella azteca to acute and chronic microplastic exposures. Environ. Toxicol. Chem. 2015, 34, 2564–2572. [Google Scholar] [CrossRef] [PubMed]
  21. Rehse, S.; Kloas, W.; Zarfl, C. Short-term exposure with high concentrations of pristine microplastic particles leads to immobilisation of Daphnia magna. Chemosphere 2016, 153, 91–99. [Google Scholar] [CrossRef] [PubMed]
  22. Jemec, A.; Horvat, P.; Kunej, U.; Bele, M.; Kržan, A. Uptake and effects of microplastic textile fibers on freshwater crustacean Daphnia magna. Environ. Pollut. 2016, 219, 201–209. [Google Scholar] [CrossRef] [PubMed]
  23. Nasser, F.; Lynch, I. Secreted protein eco-corona mediates uptake and impacts of polystyrene nanoparticles on Daphnia magna. J. Proteom. 2016, 137, 45–51. [Google Scholar] [CrossRef] [PubMed]
  24. Setälä, O.; Fleming-Lehtinen, V.; Lehtiniemi, M. Ingestion and transfer of microplastics in the planktonic food web. Environ. Pollut. 2014, 185, 77–83. [Google Scholar] [CrossRef] [PubMed]
  25. Farrell, P.; Nelson, K. Trophic level transfer of microplastic: Mytilus edulis (L.) to Carcinus maenas (L.). Environ. Pollut. 2013, 177, 1–3. [Google Scholar] [CrossRef] [PubMed]
  26. Graham, E.R.; Thompson, J.T. Deposit-and suspension-feeding sea cucumbers (Echinodermata) ingest plastic fragments. J. Exp. Mar. Boil. Ecol. 2009, 368, 22–29. [Google Scholar] [CrossRef]
  27. Murray, F.; Cowie, P.R. Plastic contamination in the decapod crustacean Nephrops norvegicus (Linnaeus, 1758). Mar. Pollut. Bull. 2011, 62, 1207–1217. [Google Scholar] [CrossRef] [PubMed]
  28. Murphy, F.; Ewins, C.; Carbonnier, F.; Quinn, B. Wastewater treatment works (WwTW) as a source of microplastics in the aquatic environment. Environ. Sci. Technol. 2016, 50, 5800–5808. [Google Scholar] [CrossRef] [PubMed]
  29. Peters, C.A.; Bratton, S.P. Urbanization is a major influence on microplastic ingestion by sunfish in the Brazos River Basin, Central Texas, USA. Environ. Pollut. 2016, 210, 380–387. [Google Scholar] [CrossRef] [PubMed]
  30. Vermaire, J.C.; Pomeroy, C.; Herczegh, S.M.; Haggart, O.; Murphy, M. Microplastic abundance and distribution in the open water and sediment of the Ottawa River, Canada, and its tributaries. FACETS 2017, 2, 301–314. [Google Scholar] [CrossRef] [Green Version]
  31. Klein, S.; Worch, E.; Knepper, T.P. Occurrence and spatial distribution of microplastics in river shore sediments of the Rhine-Main area in Germany. Environ. Sci. Technol. 2015, 49, 6070–6076. [Google Scholar] [CrossRef] [PubMed]
  32. Nel, H.A.; Dalu, T.; Wasserman, R.J. Sinks and sources: Assessing microplastic abundance in river sediment and deposit feeders in an Austral temperate urban river system. Sci. Total Environ. 2018, 612, 950–956. [Google Scholar] [CrossRef] [PubMed]
  33. Leslie, H.A.; Brandsma, S.H.; van Velzen, M.J.M.; Vethaak, A.D. Microplastics en route: Field measurements in the Dutch river delta and Amsterdam canals, wastewater treatment plants, North Sea sediments and biota. Environ. Int. 2017, 101, 133–142. [Google Scholar] [CrossRef] [PubMed]
  34. Jarvie, H.P.; Oguchi, T.; Neal, C. Pollution regimes and variability in river water quality across the Humber catchment: Interrogation and mapping of an extensive and highly heterogeneous spatial dataset. Sci. Total Environ. 2000, 251, 27–43. [Google Scholar] [CrossRef]
  35. Elliott, S.; Lead, J.R.; Baker, A. Characterisation of the fluorescence from freshwater, planktonic bacteria. Water Res. 2006, 40, 2075–2083. [Google Scholar] [CrossRef] [PubMed]
  36. Eerkes-Medrano, D.; Thompson, R.C.; Aldridge, D.C. Microplastics in freshwater systems: A review of the emerging threats, identification of knowledge gaps and prioritisation of research needs. Water Res. 2015, 75, 63–82. [Google Scholar] [CrossRef] [PubMed]
  37. Gregory, M.R. Environmental implications of plastic debris in marine settings—Entanglement, ingestion, smothering, hangers-on, hitch-hiking and alien invasions. Philos. Trans. R. Soc. Lond. B Boil. Sci. 2009, 364, 2013–2025. [Google Scholar] [CrossRef] [PubMed]
  38. Hidalgo-Ruz, V.; Gutow, L.; Thompson, R.C.; Thiel, M. Microplastics in the marine environment: A review of the methods used for identification and quantification. Environ. Sci. Technol. 2012, 46, 3060–3075. [Google Scholar] [CrossRef] [PubMed]
  39. Thompson, R.C.; Olsen, Y.; Mitchell, R.P.; Davis, A.; Rowland, S.J.; John, A.W.; McGonigle, D.; Russell, A.E. Lost at sea: Where is all the plastic? Science 2004, 304, 838. [Google Scholar] [CrossRef] [PubMed]
  40. Nuelle, M.T.; Dekiff, J.H.; Remy, D.; Fries, E. A new analytical approach for monitoring microplastics in marine sediments. Environ. Pollut. 2014, 184, 161–169. [Google Scholar] [CrossRef] [PubMed]
  41. Nor, N.H.M.; Obbard, J.P. Microplastics in Singapore’s coastal mangrove ecosystems. Mar. Pollut. Bull. 2014, 79, 278–283. [Google Scholar] [PubMed]
  42. Helm, P.A. Improving microplastics source apportionment: A role for microplastic morphology and taxonomy? Anal. Methods 2017, 9, 1328–1331. [Google Scholar] [CrossRef]
  43. Ng, K.L.; Obbard, J.P. Prevalence of microplastics in Singapore’s coastal marine environment. Mar. Pollut. Bull. 2006, 52, 761–767. [Google Scholar] [CrossRef] [PubMed]
  44. Wagner, M.; Scherer, C.; Alvarez-Muñoz, D.; Brennholt, N.; Bourrain, X.; Buchinger, S.; Fries, E.; Grosbois, C.; Klasmeier, J.; Marti, T.; et al. Microplastics in freshwater ecosystems: What we know and what we need to know. Environ. Sci. Eur. 2014, 26, 12. [Google Scholar] [CrossRef] [PubMed]
  45. Wang, J.; Peng, J.; Tan, Z.; Gao, Y.; Zhan, Z.; Chen, Q.; Cai, L. Microplastics in the surface sediments from the Beijiang River littoral zone: Composition, abundance, surface textures and interaction with heavy metals. Chemosphere 2017, 171, 248–258. [Google Scholar] [CrossRef] [PubMed]
  46. Andrady, A.L. Microplastics in the marine environment. Mar. Pollut. Bull. 2011, 62, 1596–1605. [Google Scholar] [CrossRef] [PubMed]
  47. Vianello, A.; Boldrin, A.; Guerriero, P.; Moschino, V.; Rella, R.; Sturaro, A.; Da Ros, L. Microplastic particles in sediments of Lagoon of Venice, Italy: First observations on occurrence, spatial patterns and identification. Estuarine Coast. Shelf Sci. 2013, 130, 54–61. [Google Scholar] [CrossRef]
  48. Browne, M.A.; Crump, P.; Niven, S.J.; Teuten, E.; Tonkin, A.; Galloway, T.; Thompson, R. Accumulation of microplastic on shorelines worldwide: Sources and sinks. Environ. Sci. Technol. 2011, 45, 9175–9179. [Google Scholar] [CrossRef] [PubMed]
  49. Napper, I.E.; Bakir, A.; Rowland, S.J.; Thompson, R.C. Characterisation, quantity and sorptive properties of microplastics extracted from cosmetics. Mar. Pollut. Bull. 2015, 99, 178–185. [Google Scholar] [CrossRef] [PubMed] [Green Version]
  50. Fendall, L.S.; Sewell, M.A. Contributing to marine pollution by washing your face: Microplastics in facial cleansers. Mar. Pollut. Bull. 2009, 58, 1225–1228. [Google Scholar] [CrossRef] [PubMed]
  51. Carr, S.A.; Liu, J.; Tesoro, A.G. Transport and fate of microplastic particles in wastewater treatment plants. Water Res. 2016, 91, 174–182. [Google Scholar] [CrossRef] [PubMed]
  52. Williams, R.J.; Johnson, A.C.; Keller, V.; Wells, C.; Holmes, M.G.R.; Young, A.R. Catchment Risk Assessment of Steroid Oestrogens from Sewage Treatment Works; Environment Agency: Bristol, UK, 2008; Available online: http://nora.nerc.ac.uk/2810/1/SCHO0308BNVO-e-e.pdf (accessed on 7 September 2017).
  53. McCormick, A.R.; Hoellein, T.J.; London, M.G.; Hittie, J.; Scott, J.W.; Kelly, J.J. Microplastic in surface waters of urban rivers: Concentration, sources, and associated bacterial assemblages. Ecosphere 2016, 7, e01556. [Google Scholar] [CrossRef]
  54. Corcoran, P.L.; Norris, T.; Ceccanese, T.; Walzak, M.J.; Helm, P.A.; Marvin, C.H. Hidden plastics of Lake Ontario, Canada and their potential preservation in the sediment record. Environ. Pollut. 2015, 204, 17–25. [Google Scholar] [CrossRef] [PubMed]
  55. Vaughan, R.; Turner, S.D.; Rose, N.L. Microplastics in the sediments of a UK urban lake. Environ. Pollut. 2017, 229, 10–18. [Google Scholar] [CrossRef] [PubMed] [Green Version]
  56. Wang, W.; Ndungu, A.W.; Li, Z.; Wang, J. Microplastics pollution in inland freshwaters of China: A case study in urban surface waters of Wuhan, China. Sci. Total Environ. 2017, 575, 1369–1374. [Google Scholar] [CrossRef] [PubMed]
  57. Lagarde, F.; Olivier, O.; Zanella, M.; Daniel, P.; Hiard, S.; Caruso, A. Microplastic interactions with freshwater microalgae: Hetero-aggregation and changes in plastic density appear strongly dependent on polymer type. Environ. Pollut. 2016, 215, 331–339. [Google Scholar] [CrossRef] [PubMed]
  58. Muthukumar, T.; Aravinthan, A.; Lakshmi, K.; Venkatesan, R.; Vedaprakash, L.; Doble, M. Fouling and stability of polymers and composites in marine environment. Int. Biodeterior. Biodegrad. 2011, 65, 276–284. [Google Scholar] [CrossRef]
  59. Wallace, J.B.; Merritt, R.W. Filter-feeding ecology of aquatic insects. Annu. Rev. Entomol. 1980, 25, 103–132. [Google Scholar] [CrossRef]
  60. Brennan, A.; McLachlan, A.J. Tubes and tube-building in a lotic chironomid (Diptera) community. Hydrobiologia 1979, 67, 173–178. [Google Scholar] [CrossRef]
  61. Death, R.G. The effect of patch disturbance on stream invertebrate community structure: The influence of disturbance history. Oecologia 1996, 108, 567–576. [Google Scholar] [CrossRef] [PubMed]
  62. Matthaei, C.D.; Arbuckle, C.J.; Townsend, C.R. Stable surface stones as refugia for invertebrates during disturbance in a New Zealand stream. J. N. Am. Benthol. Soc. 2000, 19, 82–93. [Google Scholar] [CrossRef]
  63. Cardinale, B.J.; Gelmann, E.R.; Palmer, M.A. Net spinning caddisflies as stream ecosystem engineers: The influence of Hydropsyche on benthic substrate stability. Funct. Ecol. 2004, 18, 381–387. [Google Scholar] [CrossRef]
Figure 1. Study site map indicating location of study sites along the River Tame in Birmingham (labelled T1–T6). Also shown are additional sampling sites on tributaries of the River Tame and locations of wastewater treatment works (WwTw).
Water 10 01597 g001
Figure 2. Plastic particle abundance at each site, see Figure 1 for locations.
Water 10 01597 g002
Figure 3. Distribution of plastic particles by shape at each sampling location, see Figure 1 for location of sites.
Water 10 01597 g003
Figure 4. Example of a microplastic particle (indicated with an arrow) incorporated into caddisfly casing. Microplastic particle is ~1 mm in length.
Water 10 01597 g004
Table 1. Plastic particle abundance, proportion of sediment within each size fraction (# = number of plastic particles within each size fraction), flow velocity at time of sample collection and number of plastic particles within each shape class for the six sample sites along the main River Tame. T1–T3 are more urban sites and T4–T6 predominantly rural; a lake is present between sites T4 and T5. See Figure 1 for the location of each sample site.
Sites
T1T2T3T4T5T6
Velocity ms−10.350.260.310.220.470.16
Plastic particles 100 g−11620351982
% 2–4 mm
(# particles)
24.0
(5)
15.6
(0)
2.2
(16)
17.8
(16)
17.7
(2)
15.2
(0)
% 1–2 mm
(# particles)
22.3
(15)
24.0
(5)
1.4
(61)
7.0
(20)
9.6
(6)
5.3
(0)
% 250 µm–1 mm
(# particles)
48.8
(56)
51.8
(53)
86.7
(188)
66.9
(20)
61.5
(18)
67.1
(9)
% 63 µm–250 µm
(# particles)
4.8
(63)
8.6
(104)
9.7
(71)
8.3
(35)
11.2
(15)
12.5
(3)
Fibre19437520711
Fragment588516542240
Sphere5124462251
Commercial Fragment5626110
Irregular Sphere229100
Foam006320
Film429220
Table 2. Plastic particle abundance, proportion of sediment within each size fraction (# = number of plastic particles within each size fraction), flow velocity at time of sample collection and number of plastic particles within each shape class for the sample sites from the tributaries of the River Tame. The subscripts u, m, and d refer to upstream, middle and downstream samples at each site. FB is an urbanized tributary fed by effluent from two WwTw; PB is an urbanized tributary with no WwTw effluent; BL is a largely rural tributary with WwTw effluent from Barston WwTw; RB is a rural tributary with no WwTw effluent. See Figure 1 for the location of each sample site.
Sites
FBuFBmFBdPBuPBmPBdBLuBLmBLdBOuBOmBOd
Velocity ms−10.730.210.840.130.060.20.180.280.220.10.080.16
Plastic particles 100 g−13166173417422230
% 2–4 mm
(# particles)
28.6
(1)
30.5
(2)
26.4
(4)
28.6
(5)
24.7
(2)
15.4
(3)
5.7
(1)
13.5
(0)
9.7
(0)
15.7
(0)
21.7
(4)
48.9
(0)
% 1–2 mm
(# particles)
17.8
(3)
14.4
(14)
13.3
(11)
21.5
(16)
12.8
(34)
16.0
(20)
2.0
(5)
5.7
(2)
4.6
(1)
12.6
(0)
13.4
(1)
16.5
(0)
% 250 µm–1 mm
(# particles)
44.5
(4)
46.8
(91)
46.7
(6)
45.8
(72)
47.0
(155)
61.0
(77)
71.9
(11)
61.9
(10)
61.0
(5)
65.3
(7)
55.4
(0)
29.4
(1)
% 63 µm–250 µm
(# particles)
9.1
(7)
8.3
(26)
13.7
(10)
4.2
(23)
15.5
(35)
7.6
(23)
20.3
(10)
18.8
(6)
24.7
(6)
6.4
(4)
9.4
(8)
5.2
(0)
Fibre123121172413131161170
Fragment339971142761146031
Sphere0550848130000
Commercial Fragment010142523000010
Irregular Sphere0305202000000
Foam000121200010
Film041090000010
Table 3. Examples of recently published data on microplastic abundance in freshwater environments.
Study LocationMicroplastic CountCitation
River Tame, UK16.5 particles 100 g−1 (mean)This study
River Thames, UK35 particles 100 g−1
(mean)
Horton et al. [1]
Mersey/Irwell, UK281–635 particles 100 g−1
(temporal range)
Hurley et al. [2]
Ottawa River22 particles 100 g−1
(mean)
Vermaire et al. [30]
Rhine-Main area22.8–376 particles 100 g−1
(spatial range)
Klein et al. [31]
Beijing River17.8–54.4 particles 100 g−1
(spatial range)
Wang et al. [45]
Bloukrans River0.6–16 particles 100 g−1
(temporal range)
Nel et al. [32]
Elbe, Mosel, Neckar, and Rhine3.4–6.4 particles 100 g−1
(mean)
Wagner et al. [44]

