Article

Benzotriazole Uptake and Removal in Vegetated Biofilter Mesocosms Planted with Carex praegracilis

1
NSF Engineering Research Center for Re-inventing the Nation’s Urban Water Infrastructure (ReNUWIt), Stanford, CA 94305, USA
2
Department of Civil and Environmental Engineering, Stanford University, Stanford, CA 94305, USA
*
Author to whom correspondence should be addressed.
Water 2018, 10(11), 1605; https://doi.org/10.3390/w10111605
Submission received: 1 October 2018 / Revised: 27 October 2018 / Accepted: 5 November 2018 / Published: 8 November 2018
(This article belongs to the Special Issue Plant and Microbial Processes in Stormwater Treatment Systems)

Abstract

:
Urban stormwater runoff is a significant source of pollutants in surface water bodies. One such pollutant, 1H-benzotriazole, is a persistent, recalcitrant trace organic contaminant commonly used as a corrosion inhibitor in airplane deicing processes, automobile liquids, and engine coolants. This study explored the removal of 1H-benzotriazole from stormwater using bench-scale biofilter mesocosms planted with California native sedge, Carex praegracilis, over a series of three storm events and succeeding monitoring period. Benzotriazole metabolites glycosylated benzotriazole and benzotriazole alanine were detected and benzotriazole and glycosylated benzotriazole partitioning in the system were quantified. With a treatment length of seven days, 97.1% of benzotriazole was removed from stormwater effluent from vegetated biofilter mesocosms. Significant concentrations of benzotriazole and glycosylated benzotriazole were observed in the C. praegracilis leaf and root tissue. Additionally, a significant missing sink of benzotriazole developed in the vegetated biofilter mesocosms. This study suggests that vegetation may increase the operating lifespan of bioretention basins by enhancing the degradation of dissolved trace organic contaminants, thus increasing the sorption capacity of the geomedia.

Graphical Abstract

1. Introduction

Urban stormwater runoff is globally recognized as a significant source of surface water quality impairment through its delivery of pollutants, including nutrients, metals, pathogens, and trace organic contaminants (TrOCs) into surface water bodies [1,2,3]. Bioretention basins are a common, low-cost, decentralized stormwater control strategy to reduce the quantity and improve the quality of urban stormwater while allowing for infiltration and recharge of the groundwater [4,5,6]. Often referred to as biofilters and bioretention cells, bioretention basins contain vegetation, high-permeability geomedia, and underdrains [7]. Bioretention basins are often popular choices because of their aesthetic value and ability to provide biological treatment and phytoremediation [7,8]. For example, bioretention basins are proven to reduce nutrient [9,10,11,12,13], metal [14,15], pathogen [16,17,18], and suspended solids [16,17] loads in stormwater runoff. However, few studies have investigated the removal of TrOCs in stormwater. Moreover, studies of TrOCs in stormwater have focused mainly on hydrophobic organic compounds such as polycyclic aromatic hydrocarbons (PAHs) [19] and polychlorinated biphenyls (PCBs) [20] that sorb particularly well to solids that are physically removed by filtration [21]. Oftentimes, however, more than half of the TrOC pollutant load may exist in the dissolved phase, which is more mobile, bioavailable, and removed by different mechanisms than particle-bound contaminants [1]. This study explores the removal of the labile TrOC 1H-benzotriazole (BT) in biofilter mesocosms vegetated with Carex praegracilis, a drought- and flood-tolerant native field sedge preferred for use in bioretention basins in California [22].
BT is a persistent organic contaminant found in urban and airport stormwater runoff [23,24]. Classified by the U.S. Environmental Protection Agency as a high production volume substance, BT is commonly used as an anticorrosive agent in aircraft deicing fluids, engine coolants, and automobile anti-freeze liquids as well as in dishwashing detergents and dyes [25,26]. BT is microbially recalcitrant with reported bio-transformation half-lives between 43 ± 5 and 83 ± 6 days in aquifer material under various aerobic and anaerobic conditions [27]. Due to its persistence, BT accumulates in the urban environment at environmentally relevant concentrations [28,29]. Fairly water-soluble (Kow = 1.44; PubChem) BT has been found at concentrations up to the mg/L range in stormwater runoff from airports [25] and is frequently found in surface waters in the µg/L range [30]. BT is known to be toxic to vertebrates, with an LC50 of 65 mg/L for fat head minnows (Pimephales promelas) and 102 mg/L for water fleas (Ceriodaphnia dubia) [31]. In addition, BT has been found to impact metabolic processes in the brains of Chinese rare minnows (Gobiocypris rarus), indicating that more studies of chronic exposure are needed [32]. The persistence of BT and our limited understanding of its chronic effects suggest that BT has the potential to pose a risk to aquatic species.
A previous study identified two BT metabolism pathways in the plant Arabidopsis thaliana in a hydroponic system: glycolysis and tryptophan synthesis, followed by auxin synthesis [33]. Glycolysis is catalyzed by glycosyltransferases and is a common pathway used by plants in order to detoxify xenobiotic compounds, creating more soluble compounds, such as glycosylated BT (GBT), that are either nontoxic or less toxic than the parent compound [34,35]. Tryptophan is an essential amino acid necessary to synthesize numerous hormones and auxins in plants [36,37]. Auxins are plant hormones that are necessary for plant processes associated with growth and reproduction, including cell elongation, division, and differentiation [36]. Benzotriazole alanine (M207) is a conjugate of tryptophan, with BT replacing the native indole rings, and is thought to participate in similar BT‒tryptophan and BT‒auxin syntheses, ultimately producing BT‒auxins [33]. LeFevre et al. verified the structures of GBT and M207 to Level 1 Confidence based on Schymanski et al.’s framework [33,38]. While hydroponic studies may be useful for identifying plant metabolism pathways, they do not reflect environmental factors such as contaminant availability in the soil or transformations in the soil and rhizosphere [39].
This study aims to understand the effect of C. praegracilis on BT removal in bench-scale biofilter mesocosms simulating bioretention basins with repeated storm events. Specifically, biofilter mesocosms vegetated with C. praegracilis are compared with nonvegetated biofilter mesocosms with a particular focus on BT removal from effluent, BT distribution within the mesocosm, and the detection of known BT metabolites. Biofilter mesocosms are exposed to three storm events with seven days of treatment time between and then monitored for an additional 21 days. This study hypothesizes that vegetation will improve biofilter mesocosm performance and that BT will be taken up by C. praegracilis and metabolized, yielding similar metabolites as observed previously [33,40]. This study demonstrates that significant masses of BT and BT metabolites were observed in C. praegracilis and that a substantial missing sink of BT developed in the vegetated biofilters after the conclusion of the storm events. This study has implications for design strategies to maximize contaminant removal and increase the operational lifespan of bioretention basins.

2. Materials and Methods

2.1. Materials

Chemicals used in this study include: 1H-Benzotriazole (BT; Fluka, CAS 95-14-7), d4-Benzotriazole (d4-BT; CDN isotopes, CAS: 1185072-03-0), 1-hexopyranosyl-1H-benzotriazole (GBT; ChemDiv 72870191, San Diego, CA, USA). All solvents and chemicals used for LC-MS analysis were of LC-MS grade. Biofilter geomedia consisted of: filtration sand (F-108, CEMEX) with grain size 0.70–0.80 mm; compost (Really Good Compost TMR 04-16, Nature’s Care); and pea gravel (Vigoro Pea Pebble). Plugs of C. praegracilis (Clustered Field Sedge) were purchased from a local nursery (Ladera Garden, Portola Valley, CA, USA) and all soil associated with the plant was removed before transplanting. C. praegracilis, a drought- and flood-tolerant native California sedge, has been documented to uptake nutrients and bioaccumulate metals and is a recommended species for use in bioretention basins in California [10,14,22].

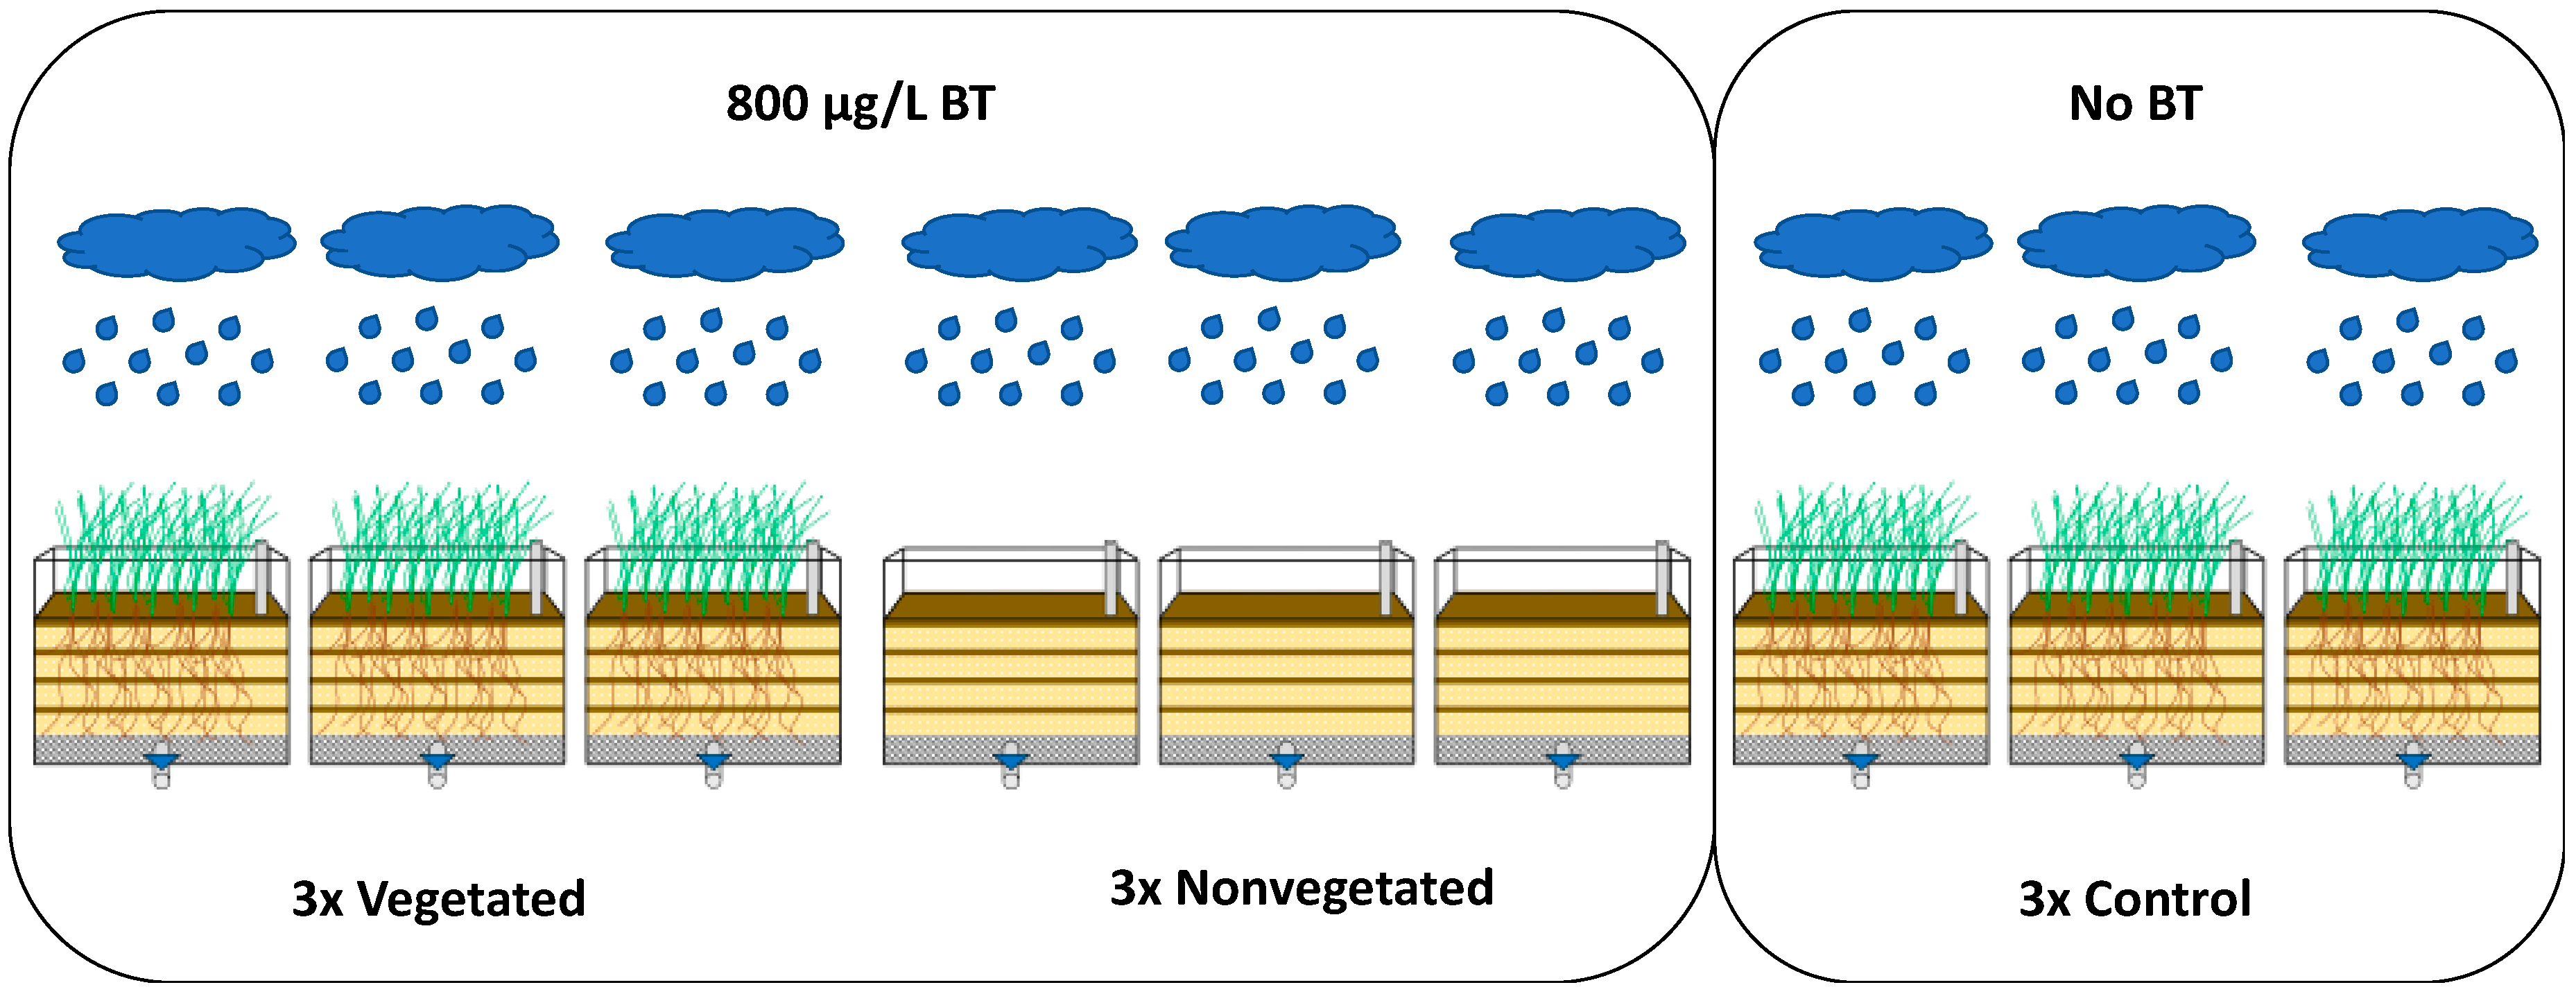
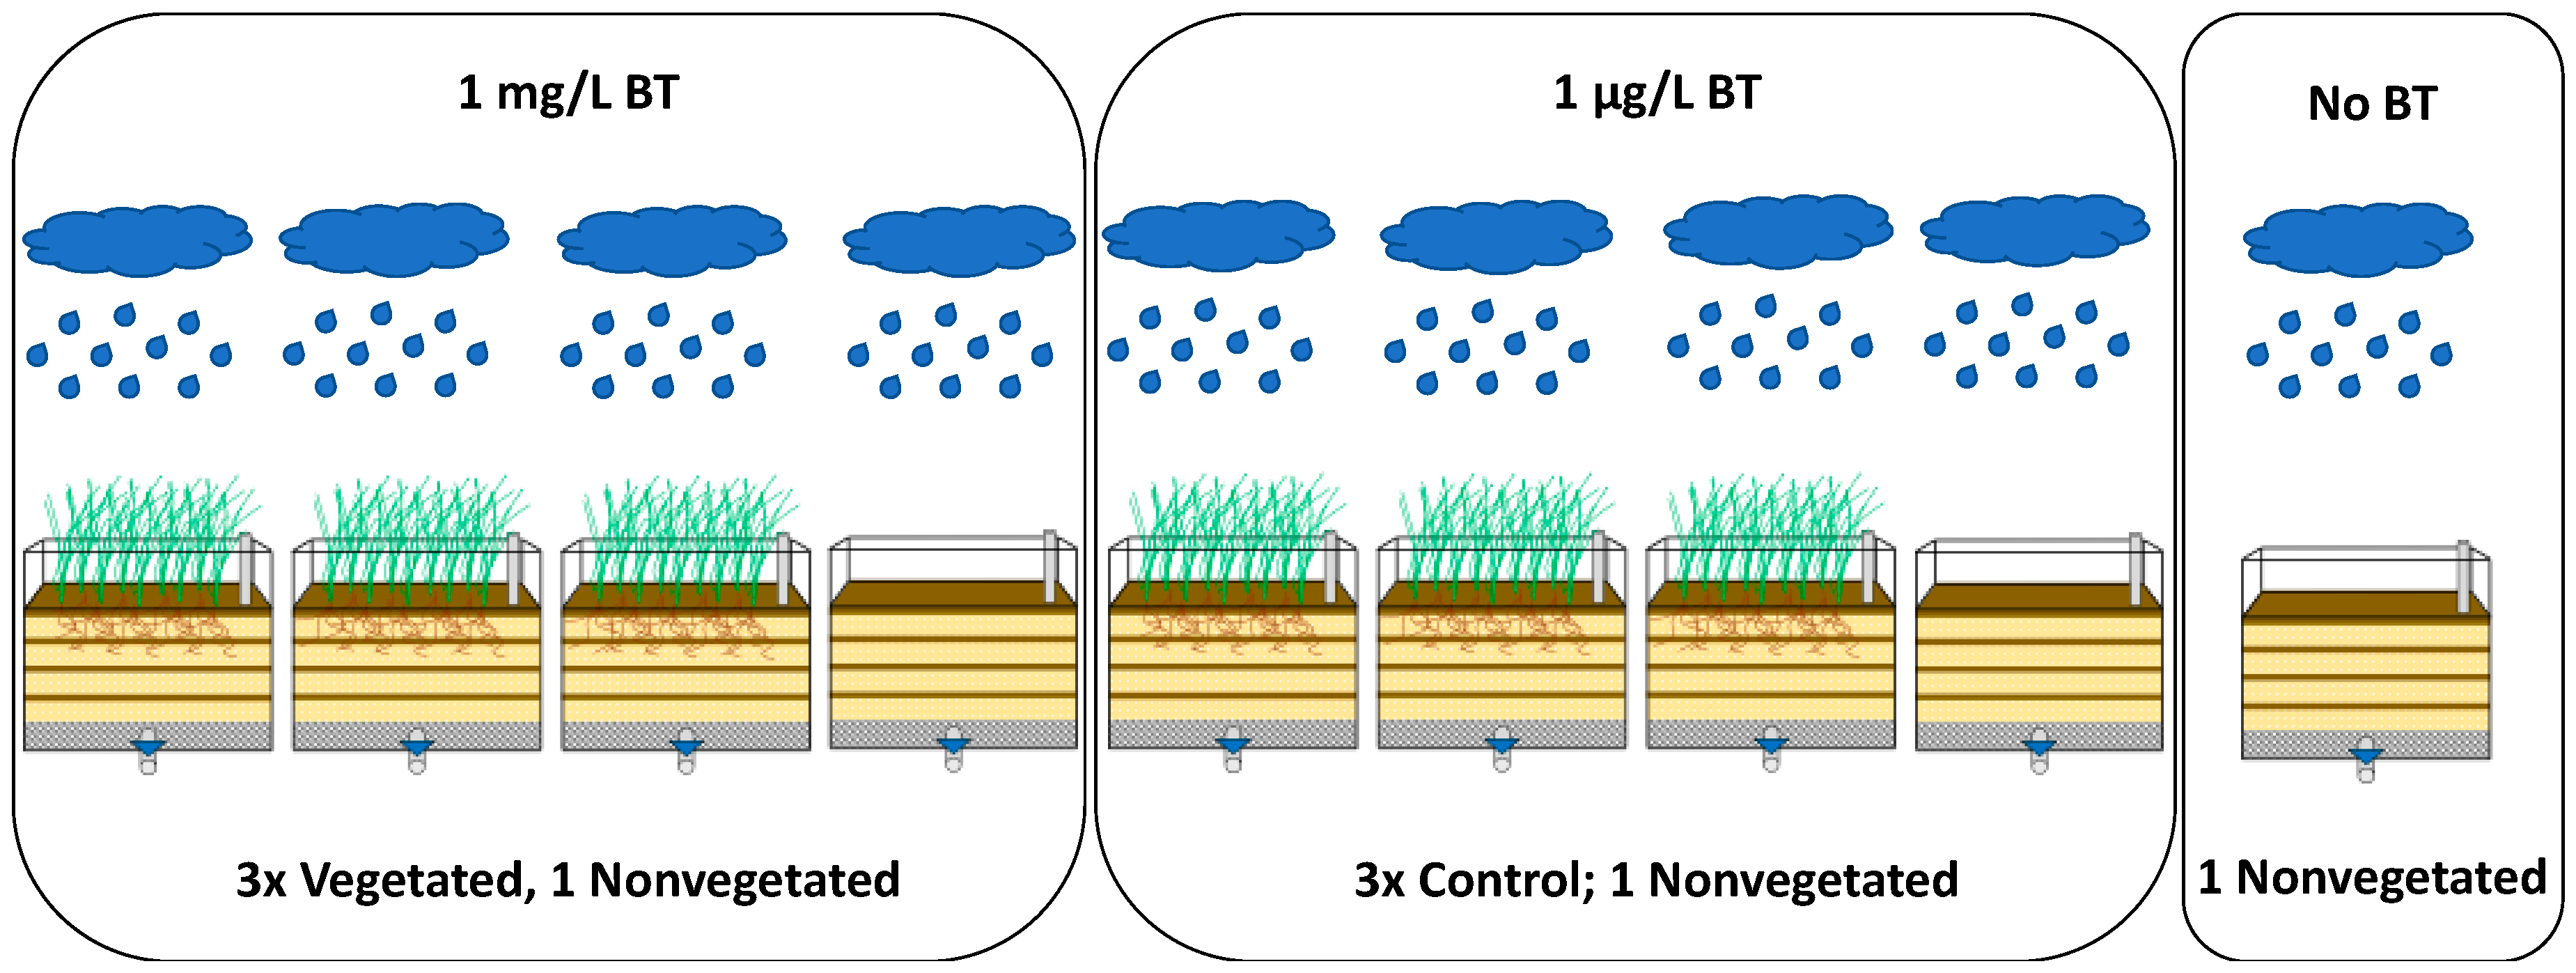
2.2. Experimental Design
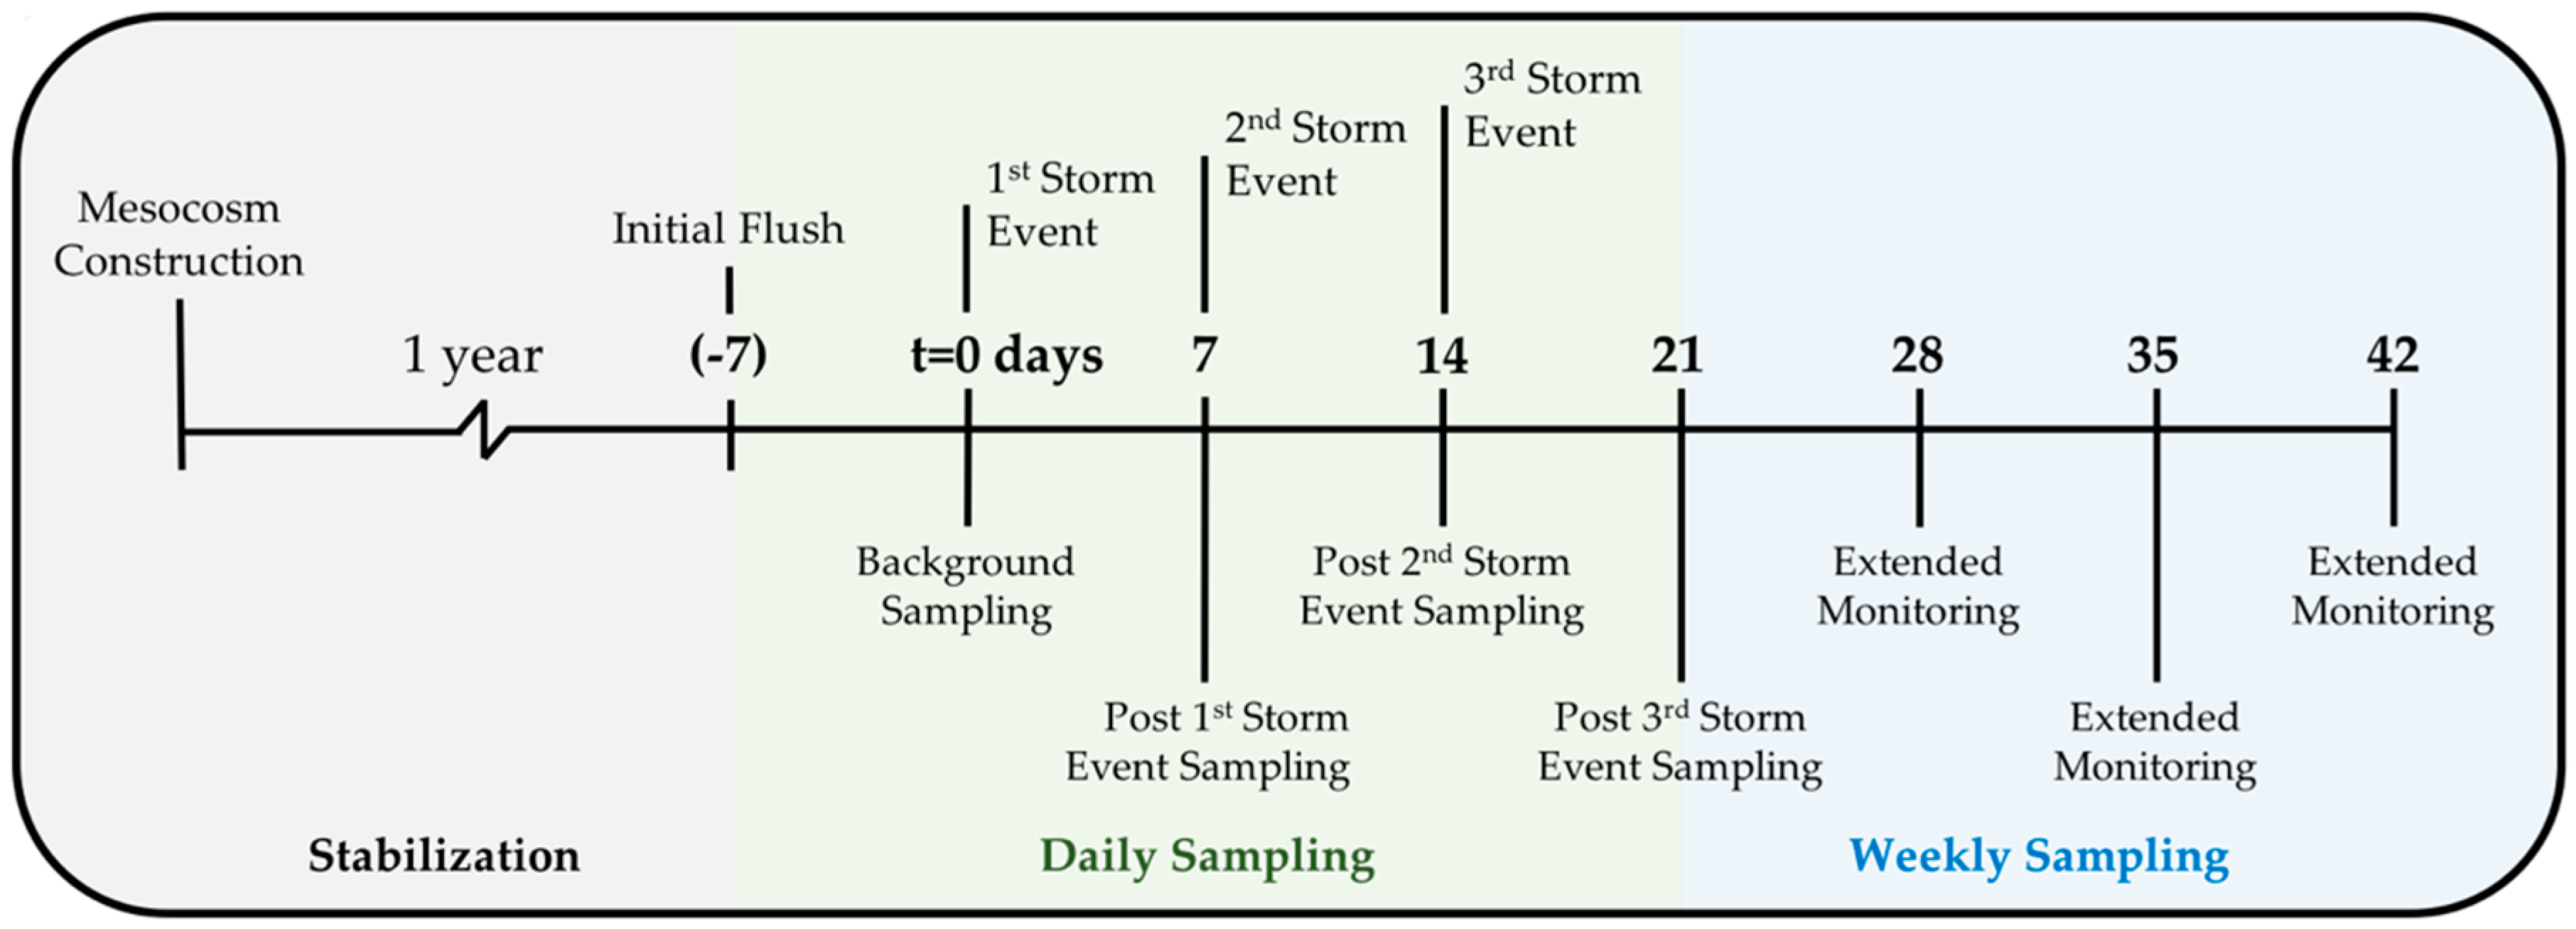
Nine treatment biofilter mesocosms were constructed to simulate a model bioretention system as specified by MS4 Discharges within the Coastal Watersheds of Los Angeles County Bioretention/Bioinfiltration Design Criteria [41]. Polypropylene plastic bins (35 cm × 28 cm × 44 cm) were filled with a layer of gravel followed by alternating layers of sand and compost containing a total of 2 L of gravel, 9.5 L of compost, and 19 L of sand. Perforated screened 1.5 cm inner diameter PVC drainage pipes with outlet controls and 1.5 cm inner diameter PVC pipe monitoring wells were installed in each mesocosm in the gravel layer. Mature C. praegracilis (n = 12 plugs per mesocosm) were transplanted into six mesocosms, of which three were randomly identified as controls, and the remaining three were left unvegetated, as seen in Figure 1. Mesocosms were found to have a pore volume of 14 L. All mesocosms were provided with grow lights (TaoTronics, Rellingen, Germany; 660, 630, and 460 nm wavelength) that operated for 8 h each day. The mesocosms were watered weekly with tap water and the C. praegracilis were allowed to stabilize for one year in order to develop their root system. The C. praegracilis leaves were occasionally trimmed using stainless steel scissors to a height of 15 cm to prevent overcrowding and allow for new growth. Preliminary tests to inform the experiment and sampling protocols were conducted soon after planting, and may be found in Appendix B.
At the beginning of the study, mesocosms were flushed with one pore volume (14 L) of synthetic stormwater. Three storm events, each equivalent to 91 mm (3.6 in) rainfall, were simulated, occurring at weekly intervals (t = 0, 7, 14 days), as seen in Figure 2. Synthetic stormwater was prepared based on a specified recipe [42], with the pH adjusted to 7.5 and without the addition of natural organic matter. The storm events consisted of a pulse of stormwater through the biofilter mesocosms. At the beginning of each storm event, the outlet controls were opened to allow the mesocosms to drain. Synthetic stormwater (14 L) was then poured onto the surface of the biofilter mesocosms and the outlet control was closed when the water level in each mesocosm fell to the pre-determined height in the monitoring well. The vegetated (n = 3) and nonvegetated (n = 3) mesocosms received synthetic stormwater spiked with 800 μg/L BT, while the control (n = 3) mesocosms received non-spiked synthetic stormwater.

2.3. Sampling Plan

Daily monitoring began after an initial flush of stormwater (t = −7) to establish background BT concentrations in the mesocosms and continued for seven days after the third storm event (t = 21), after which monitoring was conducted weekly for three additional weeks (t = 28, 35, 42) for a total experiment time of 49 days, as seen in Figure 2. Daily duplicate pore water samples were obtained from the monitoring well using a glass pipette. C. praegracilis leaf tissue was sampled daily at seven randomly selected locations from each mesocosm. C. praegracilis root tissue samples were obtained every other day by cutting one root segment from a randomly distributed plant. Three geomedia cores were taken weekly from each mesocosm using a 2 cm diameter tube at random locations and analyzed separately. On days with storm events, sampling occurred immediately before the storm event. Duplicate mesocosm effluent was collected promptly after the conclusion of each storm event. Samples were immediately frozen at −20 °C until processing and analysis.
Every seven days (t = 0, 7, …, 42 days), C. praegracilis leaves were cut back to a height of 15 cm and C. praegracilis leaf growth was determined by the mass of trimmed leaves collected. The mass of C. praegracilis leaves trimmed at each time point represented about 12% of the total dry C. praegracilis leaf mass in each mesocosm. Synthetic stormwater was added to all mesocosms daily throughout the experiment to replenish evapotranspiration losses in order to maintain a set water table in the mesocosms. This ensured that mesocosms contained an equal amount of water throughout the experiment in order to prevent the concentration of BT in pore water. Daily synthetic stormwater additions were 1–2% of the total synthetic stormwater in each mesocosm.

2.4. Analytical Methods

2.4.1. Method for Pore Water, Influent, and Effluent

Pore water, influent, and effluent samples (1 mL) were spiked with internal standard (IS), d4-BT, filtered with 0.22 µm PDVF filters, and transferred to auto sampler vials for LC-MS analysis.

2.4.2. Method for C. praegracilis Tissue

C. praegracilis leaf and root tissue samples were extracted using a procedure used by LeFevre et al. [33]. Briefly, leaf and root tissue (dry leaf mass = 0.24 ± 0.05 g; dry root mass = 0.089 ± 0.201 g, median = 0.081 g) were freeze dried for at least three days using a lyophilizer, cut into 5-mm pieces using stainless steel scissors, and placed into 2 mL centrifuge tubes. Extractant solution (1:1 methanol/water by volume), IS and a stainless-steel homogenization bead (5 mm) were added and the sample was frozen at −80 °C for three hours. Samples were thawed and placed on a mixer mill (Retsch, Haan. Germany) for 5 min at a frequency of 30 Hz. Samples were then vortexed for 2 min, placed into a sonication bath for 10 min, and centrifuged at 2000 rpm for 15 min. Supernatant was decanted and filtered using a 0.22 μm PDVF filter into autosampler vials. This extraction was repeated twice more, and samples were analyzed with LC-MS.

2.4.3. Method for Geomedia

Geomedia samples were first freeze-dried, then crushed using a mortar and pestle, and sieved using size #40 (425 µm) sieve in order to separate and weigh both the compost and sand fractions of each sample. These components were then combined into a 50-mL Falcon tube (Fisher Scientific, Hampton, NH, USA). Samples were spiked with IS, and extractant solution (1:1 methanol/water by volume, adjusted to pH = 3.00 using hydrochloric acid) was added. Samples were then vortexed for 4 min, placed into a sonication bath for 1 h 30 min, and centrifuged at 2000 rpm for one hour. Supernatant was collected and two more subsequent extractions were completed. Supernatant was combined, diluted to 250 mL using DI water, and SPE was performed. SPE cartridges (Waters, Milford, MA, USA; Oasis HLB 200 mg 6cc) were conditioned with 2 × 2 mL acetone followed by 3 × 2 mL methanol and 4 × 2 mL Milli-Q water (Millipore Sigma, Darmstadt, Germany). Samples were loaded at a flow rate of no more than 3 mL/min onto the cartridges. Cartridges were dried for at least one hour under nitrogen and eluted with 4 × 2 mL eluent solution (60:40 methanol/acetone). Samples were then evaporated to just before dryness under nitrogen, diluted into 1 mL of 1:1 methanol/water solution, and transferred to auto sampler vials for LC-MS analysis. Method recovery efficiency was observed to be 91 ± 3%.

2.4.4. Mesocosm Deconstruction

At the end of the experiment, mesocosms were dismantled and plant mass was retrieved by sieving and rinsing followed by freeze-drying to measure the total dry mass of C. praegracilis root and leaf tissue in the vegetated and control mesocosms. To assess the potential sorption of BT to the plastic mesocosm container, the mesocosm walls were rinsed with 5 mL of methanol three times and the extracts were analyzed for BT with LC-MS.

2.4.5. LC-MS Analysis

BT and GBT were quantified in positive mode using high-performance liquid chromatography-electrospray ionization tandem mass spectrometry (HPLC-ESI-MS/MS; Applied Biosystems, Foster City, CA, USA; API 3000) with Shimadzu SCL-10A VP system controller (Kyoto, Japan) and Analyst 1.5.2 software (AB SCIEX). A Higgins Analytical Sprite Targa C18 (40 × 2.4 mm, 5 µm) chromatography column (Mountain View, CA, USA) was used. The mobile phases consisted of 0.1% formic acid in water (A) and methanol (B). The mobile phase gradient (as percent of B) was as follows: 5% for 0–0.06 min, 5–95% for 0.06–6.5 min, 95% for 6.5–10 min, and 95–20% for 10–11 min at a flow rate of 0.2 mL/min. The injection volume was 10 µL. A 5-min equilibration time was set between each sample run. Two MRM transitions were used for each compound and may be found in Appendix A. Three six-point internal standard normalized calibration curves were used to account for surrogate recovery and matrix effects during ionization. Separate curves were used for each matrix. The instrument response was linear throughout the calibration ranges (0.1–10 µg/L, 10–500 µg/L, 500–5000 µg/L). Instrument detection and quantification limits were determined by analyte response relative to the baseline.

2.5. Mass Balance and Statistical Analysis

Averaged mass balances were computed for t = 7, 14, 21, 35, 42 days for vegetated, nonvegetated, and control mesocosms. Expected mass in the biofilters was computed by quantifying the mass of BT in the stormwater delivered to each biofilter and adding it to any background BT mass. The mass of BT and BT metabolites was then calculated in each sink (i.e., geomedia, C. praegracilis tissue, pore water, and effluent) for each time point using the known concentrations of BT and BT metabolites and the known mass of each component. The mass of BT metabolite GBT is reported as equivalent BT mass. Mass of C. praegracilis leaf and root tissue was estimated using the total mass of C. praegracilis determined after mesocosm deconstruction.
Statistical analysis was conducted using R Studio (Boston, MA, USA). One-way repeated measures analysis of variance (ANOVA) with post hoc paired t-tests and Tukey HSD tests were used to assess the difference between vegetated, nonvegetated, and control datasets, and linear regression models were used to assess trends. One-sample and Welch two-sample t-tests were used to assess the spatial difference between geomedia concentrations within the center and perimeter of each mesocosm for the vegetated, nonvegetated, and control mesocosms.

3. Results

3.1. Biofilter Performance and C. praegracilis Growth

Vegetated biofilters consistently reduced BT effluent concentration to a greater extent than nonvegetated biofilters, as seen in Figure 3. Vegetated biofilters reduced BT concentrations to 23.4 ± 3.4 µg/L (97.1% reduction) in the effluent while nonvegetated biofilter effluent contained 39.9 ± 10.7 µg/L BT (95.0% reduction), a difference of about 200 µg per storm event. Effluent BT concentrations among the vegetated, nonvegetated, and control mesocosms were found to be significantly different (p < 0.01, repeated measures ANOVA with Tukey HSD). Moreover, time was not observed to significantly affect the effluent BT concentrations (p = 0.41, repeated measures ANOVA).
There was no significant difference between the growth of C. praegracilis in the biofilter mesocosms exposed to BT and control biofilter mesocosms (Table A2) throughout the experiment (p = 0.60, repeated measures ANOVA with Tukey HSD). Likewise, the loss of water due to evapotranspiration from the vegetated mesocosms (Table A3) was statistically similar to that from the control mesocosms (p = 0.99, repeated measures ANOVA with Tukey HSD). The loss of water due to evapotranspiration was significantly greater for the vegetated mesocosms than the nonvegetated mesocosms (p < 0.01, repeated measures ANOVA with Tukey HSD) and also between the control and nonvegetated mesocosms (p < 0.01, repeated measures ANOVA with Tukey HSD). The final total dry mass of C. praegracilis tissue in the vegetated mesocosms was 51.2 ± 6.8 g and 55.0 ± 3.7 g in the control mesocosms. In the vegetated biofilters, the roots made up 52 ± 2% of the total vegetated mass in the biofilter mesocosm, while in the control, the root mass made up 55 ± 3% of the C. praegracilis mass. Upon deconstruction of the mesocosms, the root system was found to be extensive, penetrating the gravel at the bottom of the mesocosms. An increase in organic matter is expected in the vegetated mesocosms due to litter decomposition and release of root exudates, though the increase in organic matter content is not expected to be significant considering that the total mass of C. praegracilis tissue in each mesocosm is ~1.5% of the mass of compost added to each mesocosm.

3.2. The Presence of BT and BT Metabolites in Biofilter Sinks

The expected fate of BT in the biofilters include sorption to the soil, uptake and phytotransformation by C. praegracilis, residing in the pore water, exiting the biofilter through the effluent, and other processes including microbial degradation, photodegradation, and sorption to the plastic bin [43]. BT was detected in the soil, pore water, and C. praegracilis as well as in the mesocosm effluent during the entirety of the sampling period. Sorption to the plastic bin was not a significant sink of BT. Additionally, BT metabolites GBT and M207 were detected in the vegetated biofilters. Metabolite GBT was the most commonly detected metabolite and was quantified in the soil and C. praegracilis tissue. Metabolite M207 was detected in C. praegracilis root tissue but not quantified due to lack of an analytical standard.

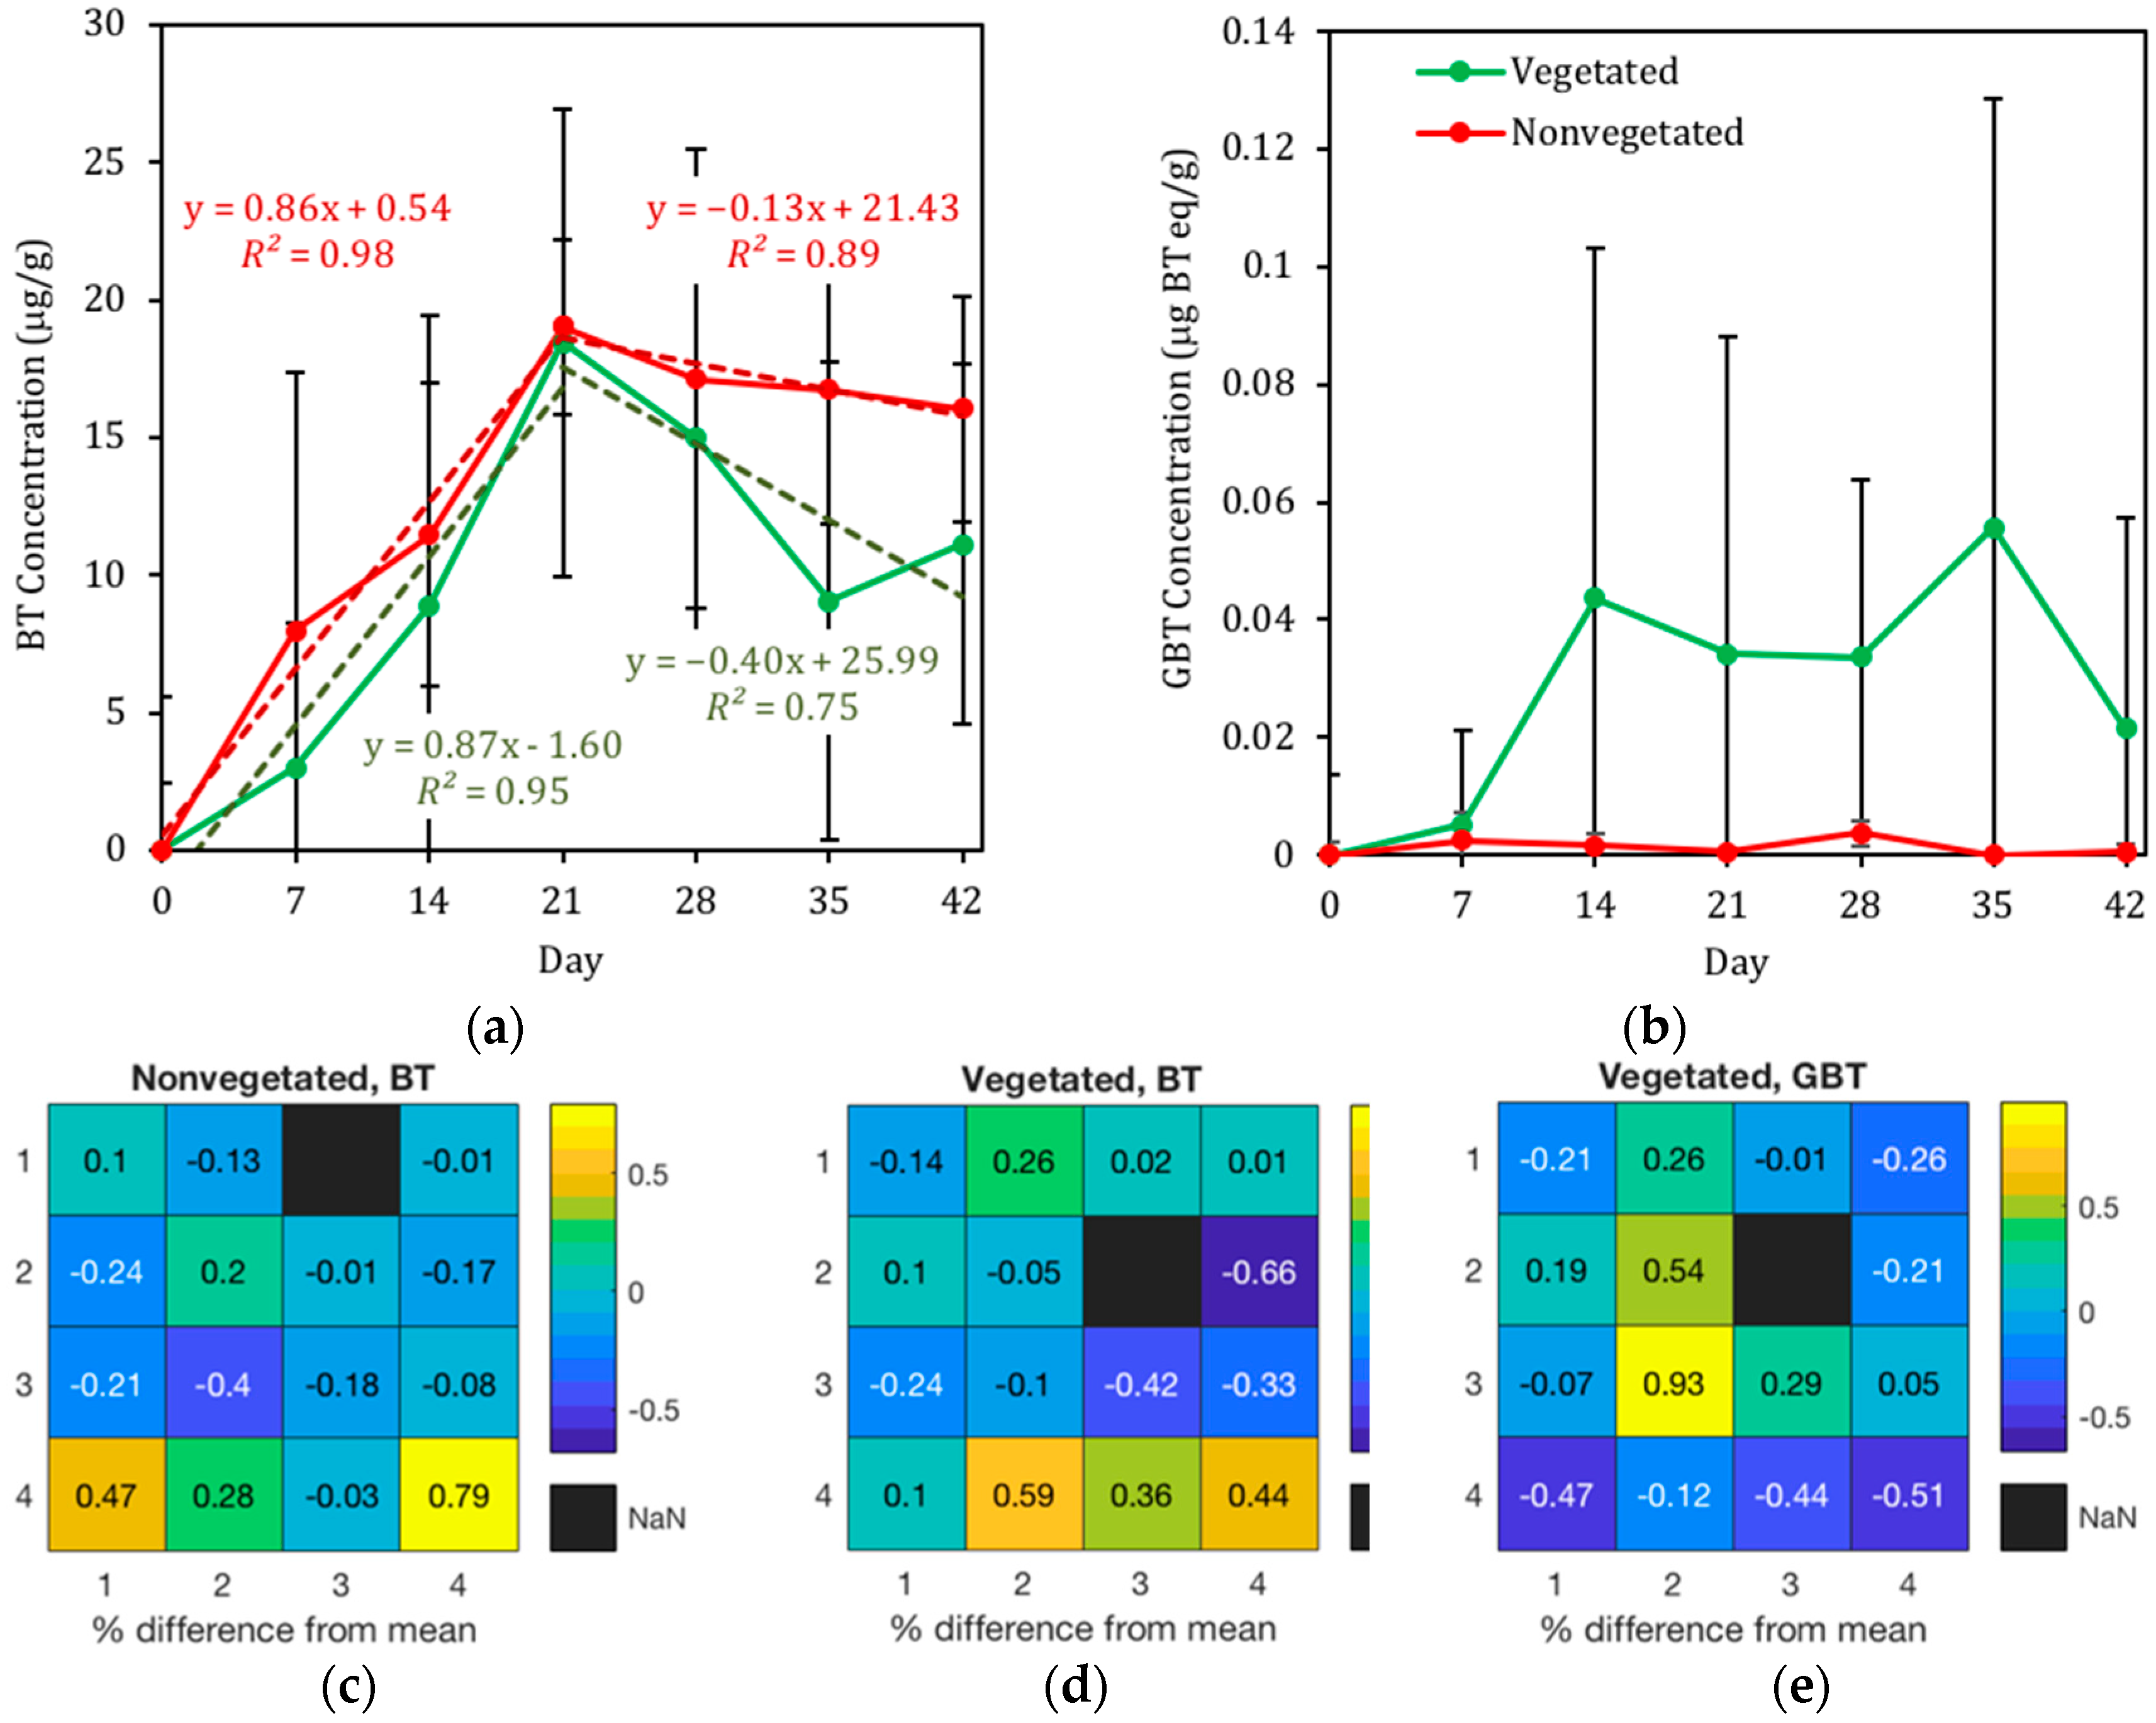
3.2.1. Presence of BT in Geomedia

BT was found in the geomedia of all biofilters exposed to stormwater containing BT (Figure 4a). Geomedia BT concentrations rose consistently in the vegetated and nonvegetated mesocosms with the influx of BT into both the vegetated and nonvegetated biofilters during the storm events. Statistical analysis reveals that there is not a significant difference in the geomedia concentrations of BT in the vegetated and nonvegetated mesocosms within the first 21 days (p = 0.65, repeated measures ANOVA with Tukey HSD). After the conclusion of the storm events, the BT concentration in the geomedia of the vegetated biofilters decreased more rapidly than in the geomedia of the nonvegetated biofilters. The geomedia BT concentrations in the vegetated and nonvegetated mesocosms are significantly different (p = 0.02, repeated measures ANOVA with Tukey HSD) over the final 21 days (Figure 4a).
BT metabolite GBT was also found in the geomedia in the vegetated mesocosms (Figure 4b). GBT concentrations in the geomedia increased during the storm events and then plateaued at a concentration of about 0.05 µg BT equivalents per gram of dry geomedia (Figure 4b). Geomedia concentrations of GBT in the vegetated mesocosms are significantly higher than the GBT concentrations in both the nonvegetated and control mesocosms (p < 0.05, repeated measures ANOVA with paired t-test). Concentrations of GBT in the nonvegetated mesocosms are not significantly different than those in the control mesocosms (p = 0.98, repeated measures ANOVA with Tukey HSD).
BT and GBT concentrations in the geomedia of the vegetated mesocosms were spatially heterogeneous (Figure 4c,e). Notably, BT concentrations are significantly lower in the center of the vegetated biofilters, where the vegetation was most dense, than around the perimeter (p = 0.04, one sample t-test) while no significant trend exists for the nonvegetated biofilters (p = 0.18, one sample t-test; Figure 4d). GBT concentrations in the vegetated mesocosms are visually higher in the center of the mesocosms than in the perimeter (Figure 4e), though exhibit weak statistical significance (p = 0.08, one-sample t-test) due to low and highly variable GBT concentrations of the geomedia.

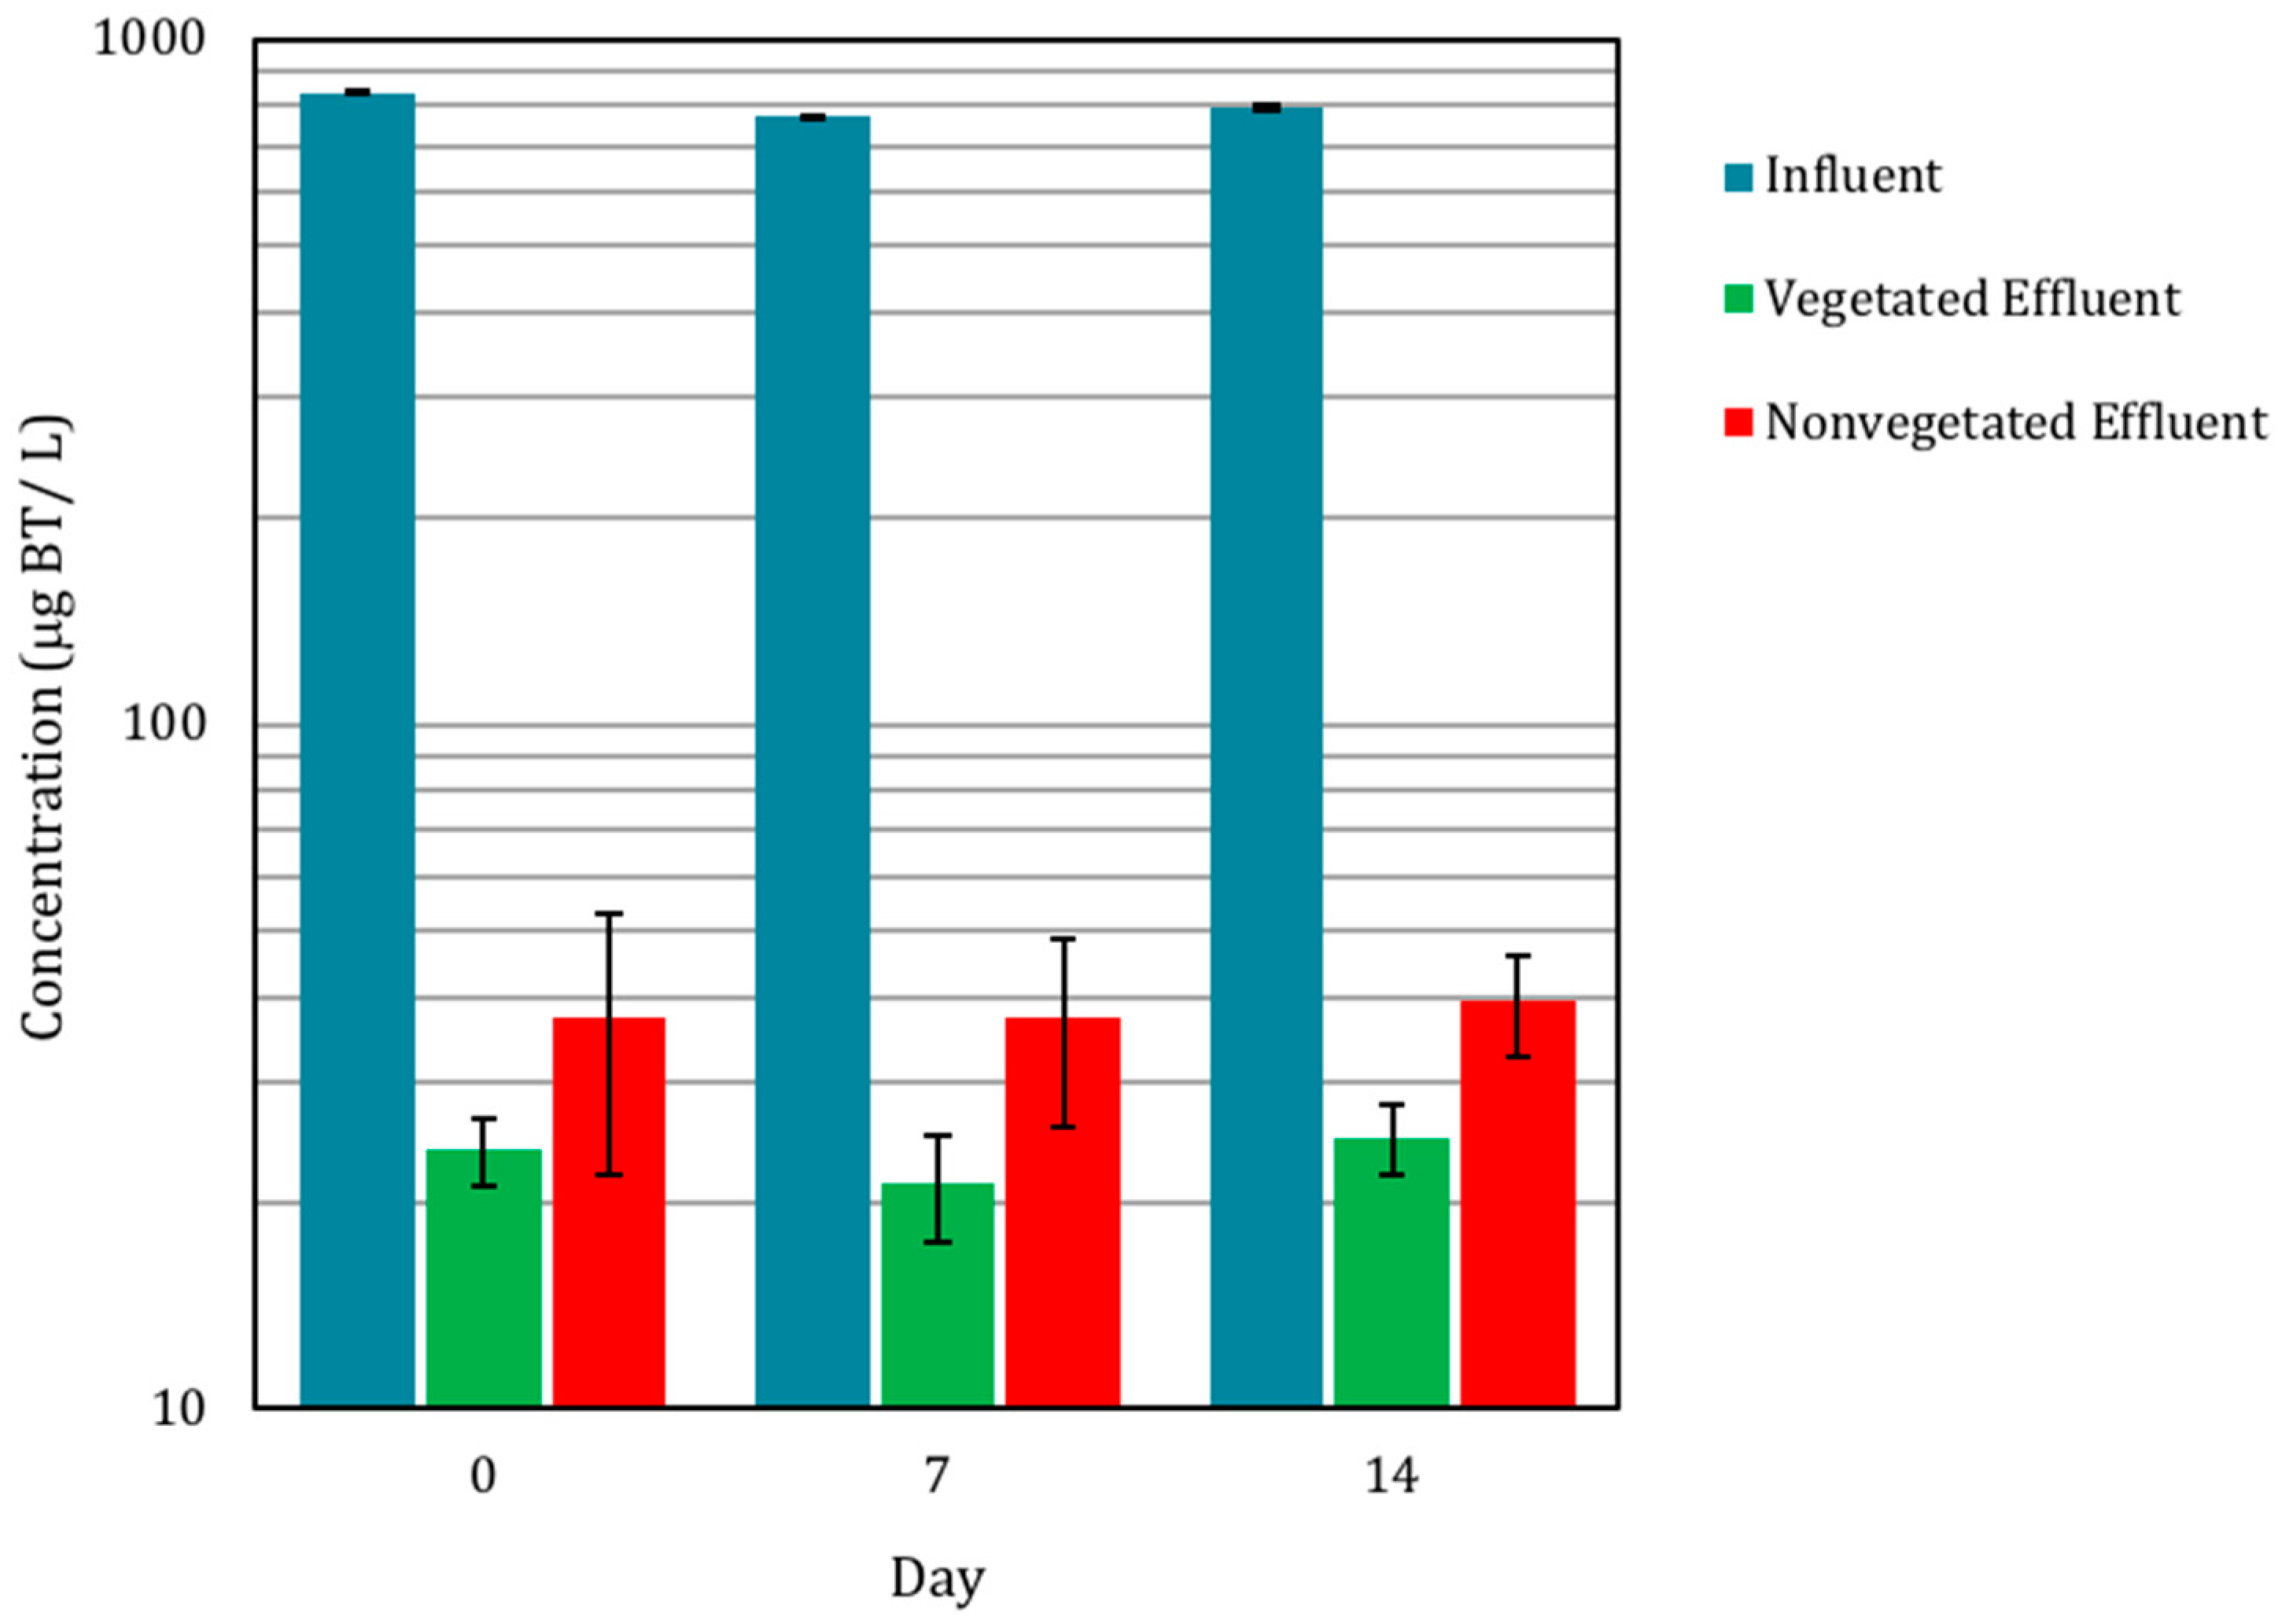
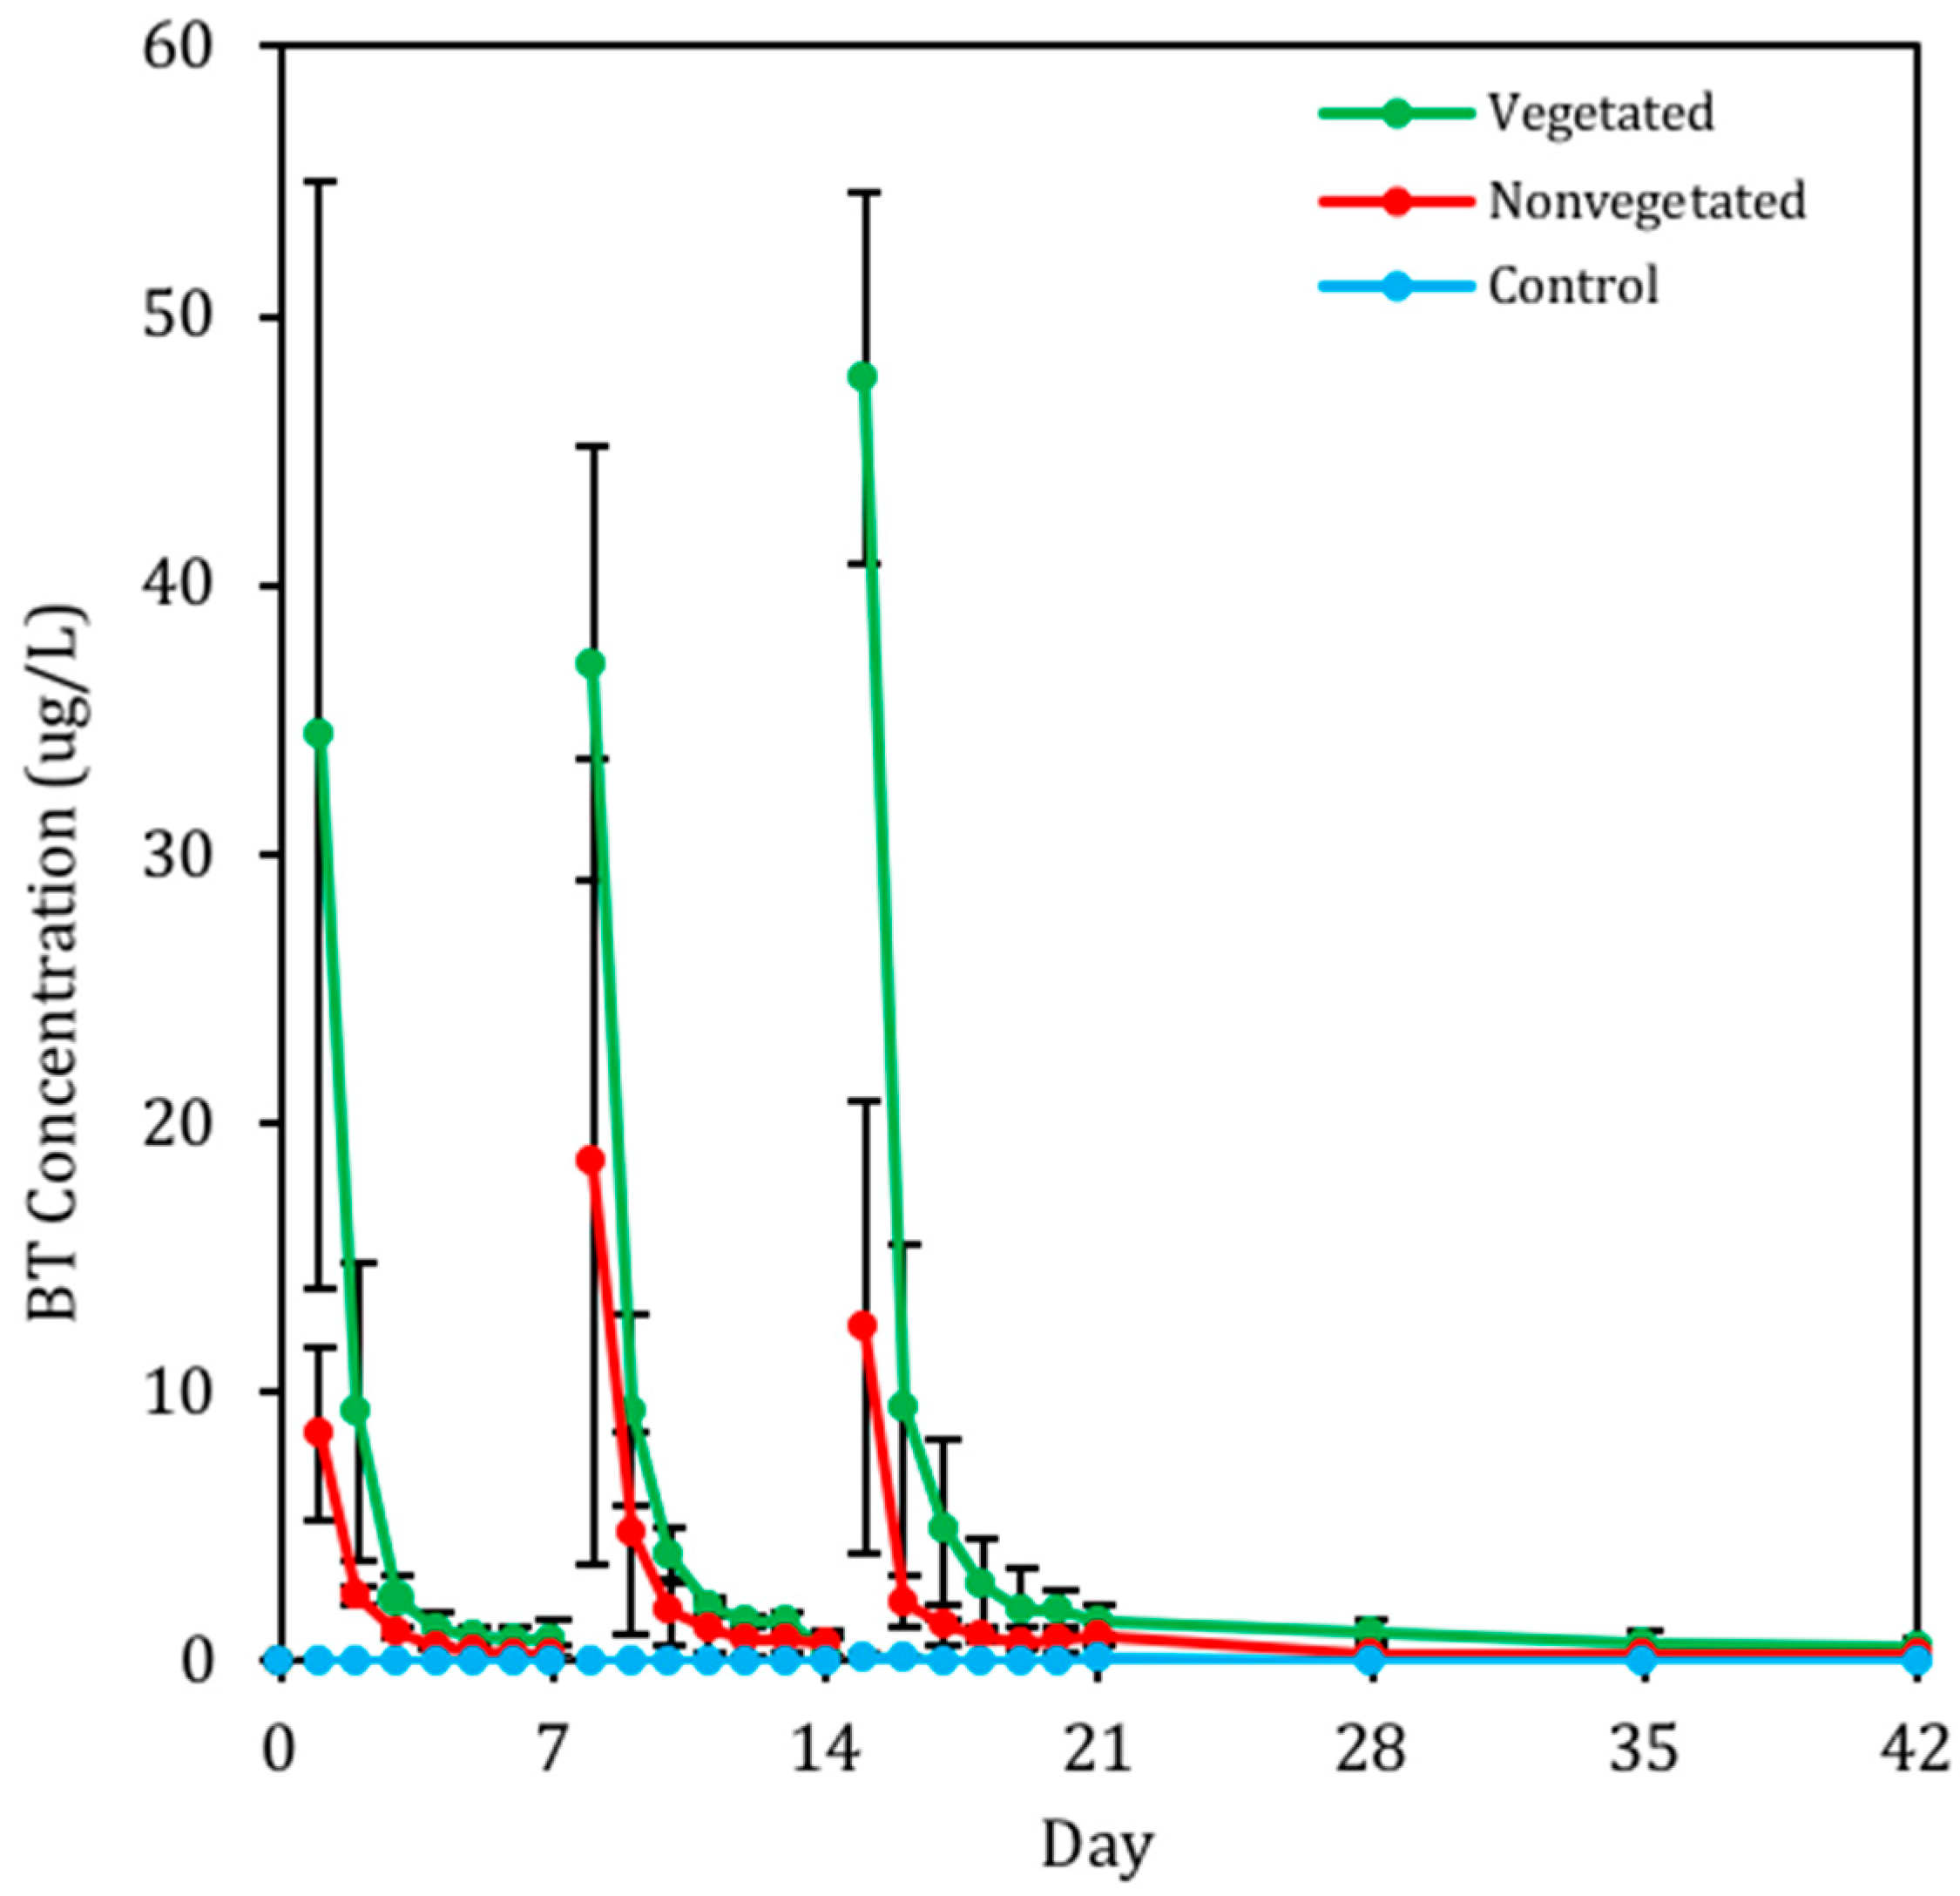
3.2.2. Presence of BT in Pore Water

The concentration of BT in the pore water decreased consistently following the storm events each week (Figure 5). The concentration of BT in the pore water in the vegetated mesocosms was consistently and significantly greater than the nonvegetated mesocosms over the entire sampling period (p < 0.05, repeated measures ANOVA, paired t-test); however, the rate of decrease is not significantly different among the vegetated and nonvegetated mesocosms (p = 0.62, repeated measures ANOVA, Tukey HSD).

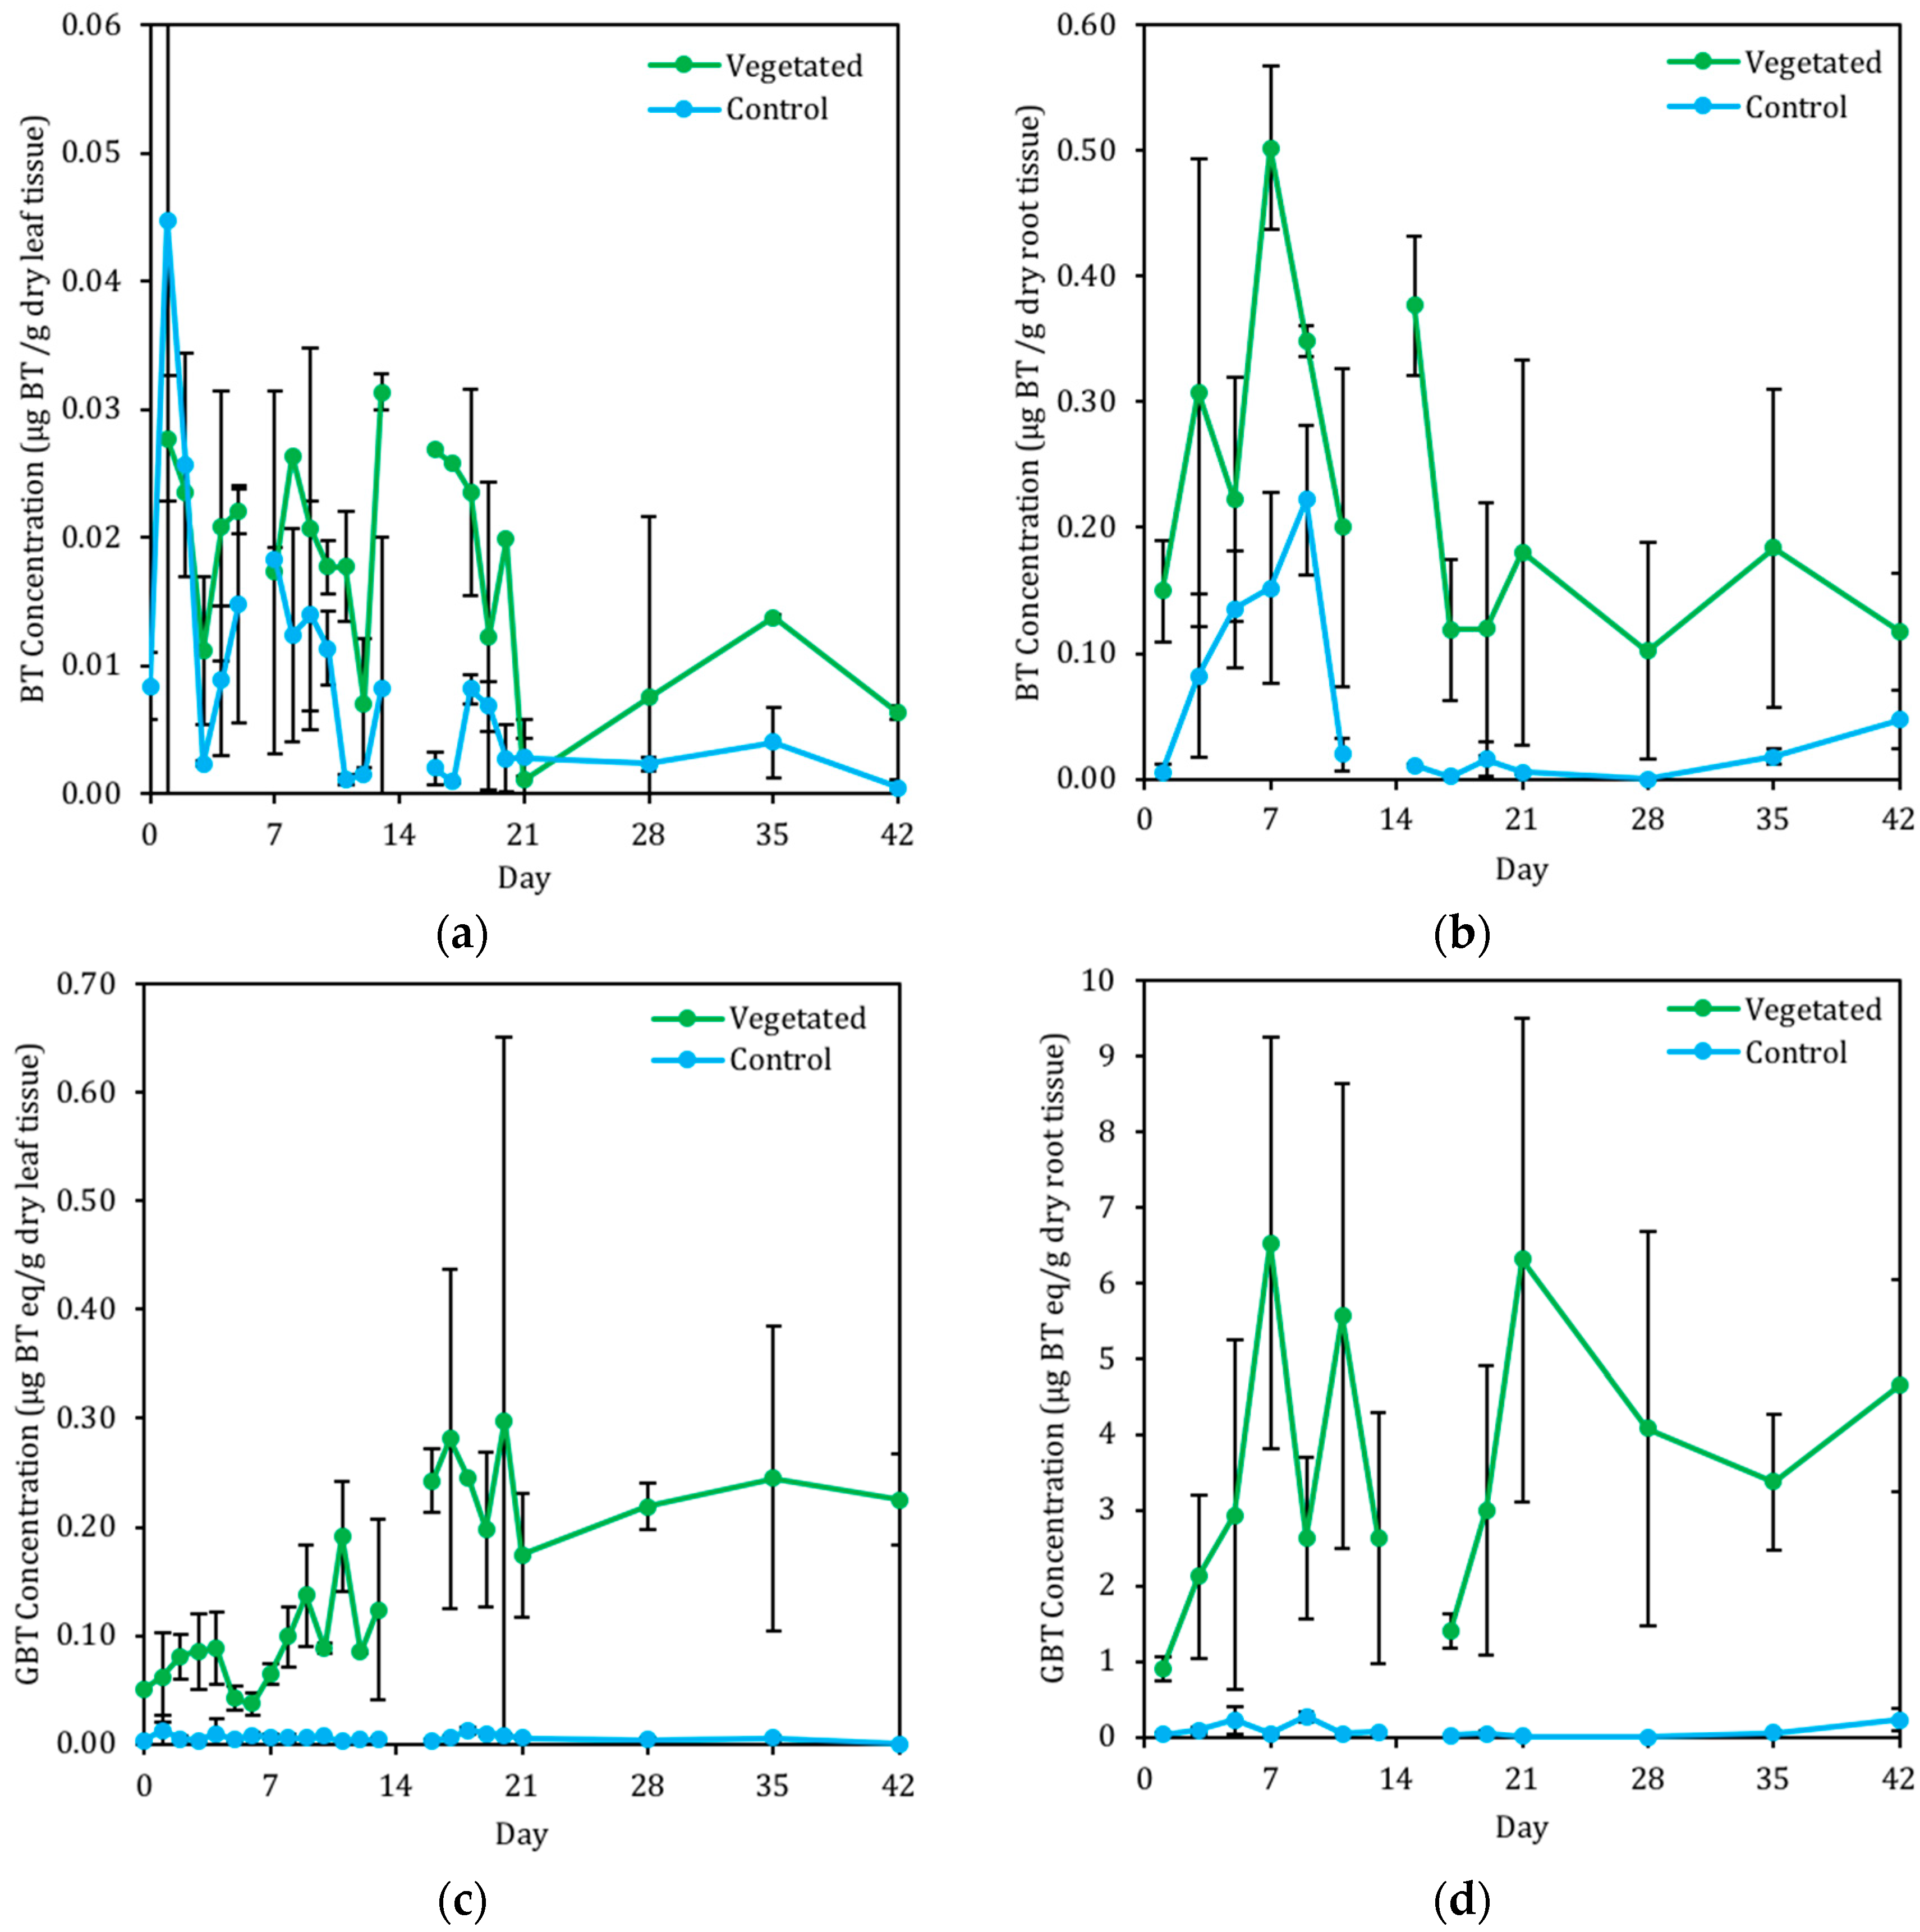
3.2.3. Presence of BT in C. praegracilis

BT was detected in both C. praegracilis leaf and root tissue (Figure 6a,b). BT concentrations in the vegetated mesocosms were significantly different than BT concentrations in the control mesocosms (leaf tissue, p = 0.02, repeated measures ANOVA with paired t-test; root tissue, p < 0.01, repeated measures ANOVA with paired t-test). BT concentrations in the root tissue increased after the first two storm events and then stabilized after the conclusion of the storm events (Figure 6b). BT concentrations stabilized around 0.01 ± 0.008 µg/g in the leaf and 0.15 ± 0.10 µg/g in the root tissue (Figure 6a,b).
GBT was also detected in the C. praegracilis leaf and root tissue (Figure 6c,d). Concentrations of GBT were significantly different in the vegetated mesocosms than GBT concentrations in the nonvegetated mesocosms (leaf tissue, p < 0.01, repeated measures ANOVA with paired t-test; root tissue, p < 0.01, repeated measures with paired t-test). GBT concentrations increased throughout the first three storm events before stabilizing. Concentrations of GBT stabilized around 0.22 ± 0.07 µg BT eq/g in the leaf and 4.60 ± 2.21 µg BT eq/g in the root tissue over the last four weeks (Figure 6c,d). Concentrations of BT and GBT were about 21 times greater in the root tissue than the leaf tissue. Concentrations of GBT were about 30 times greater than BT concentrations in both C. praegracilis leaf and root tissue. GBT represented 96% of the quantifiable mass of ∑BT detected in C. praegracilis.

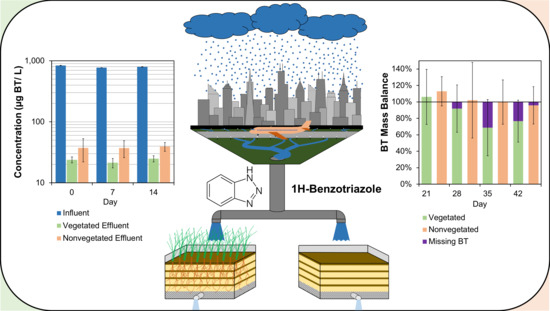
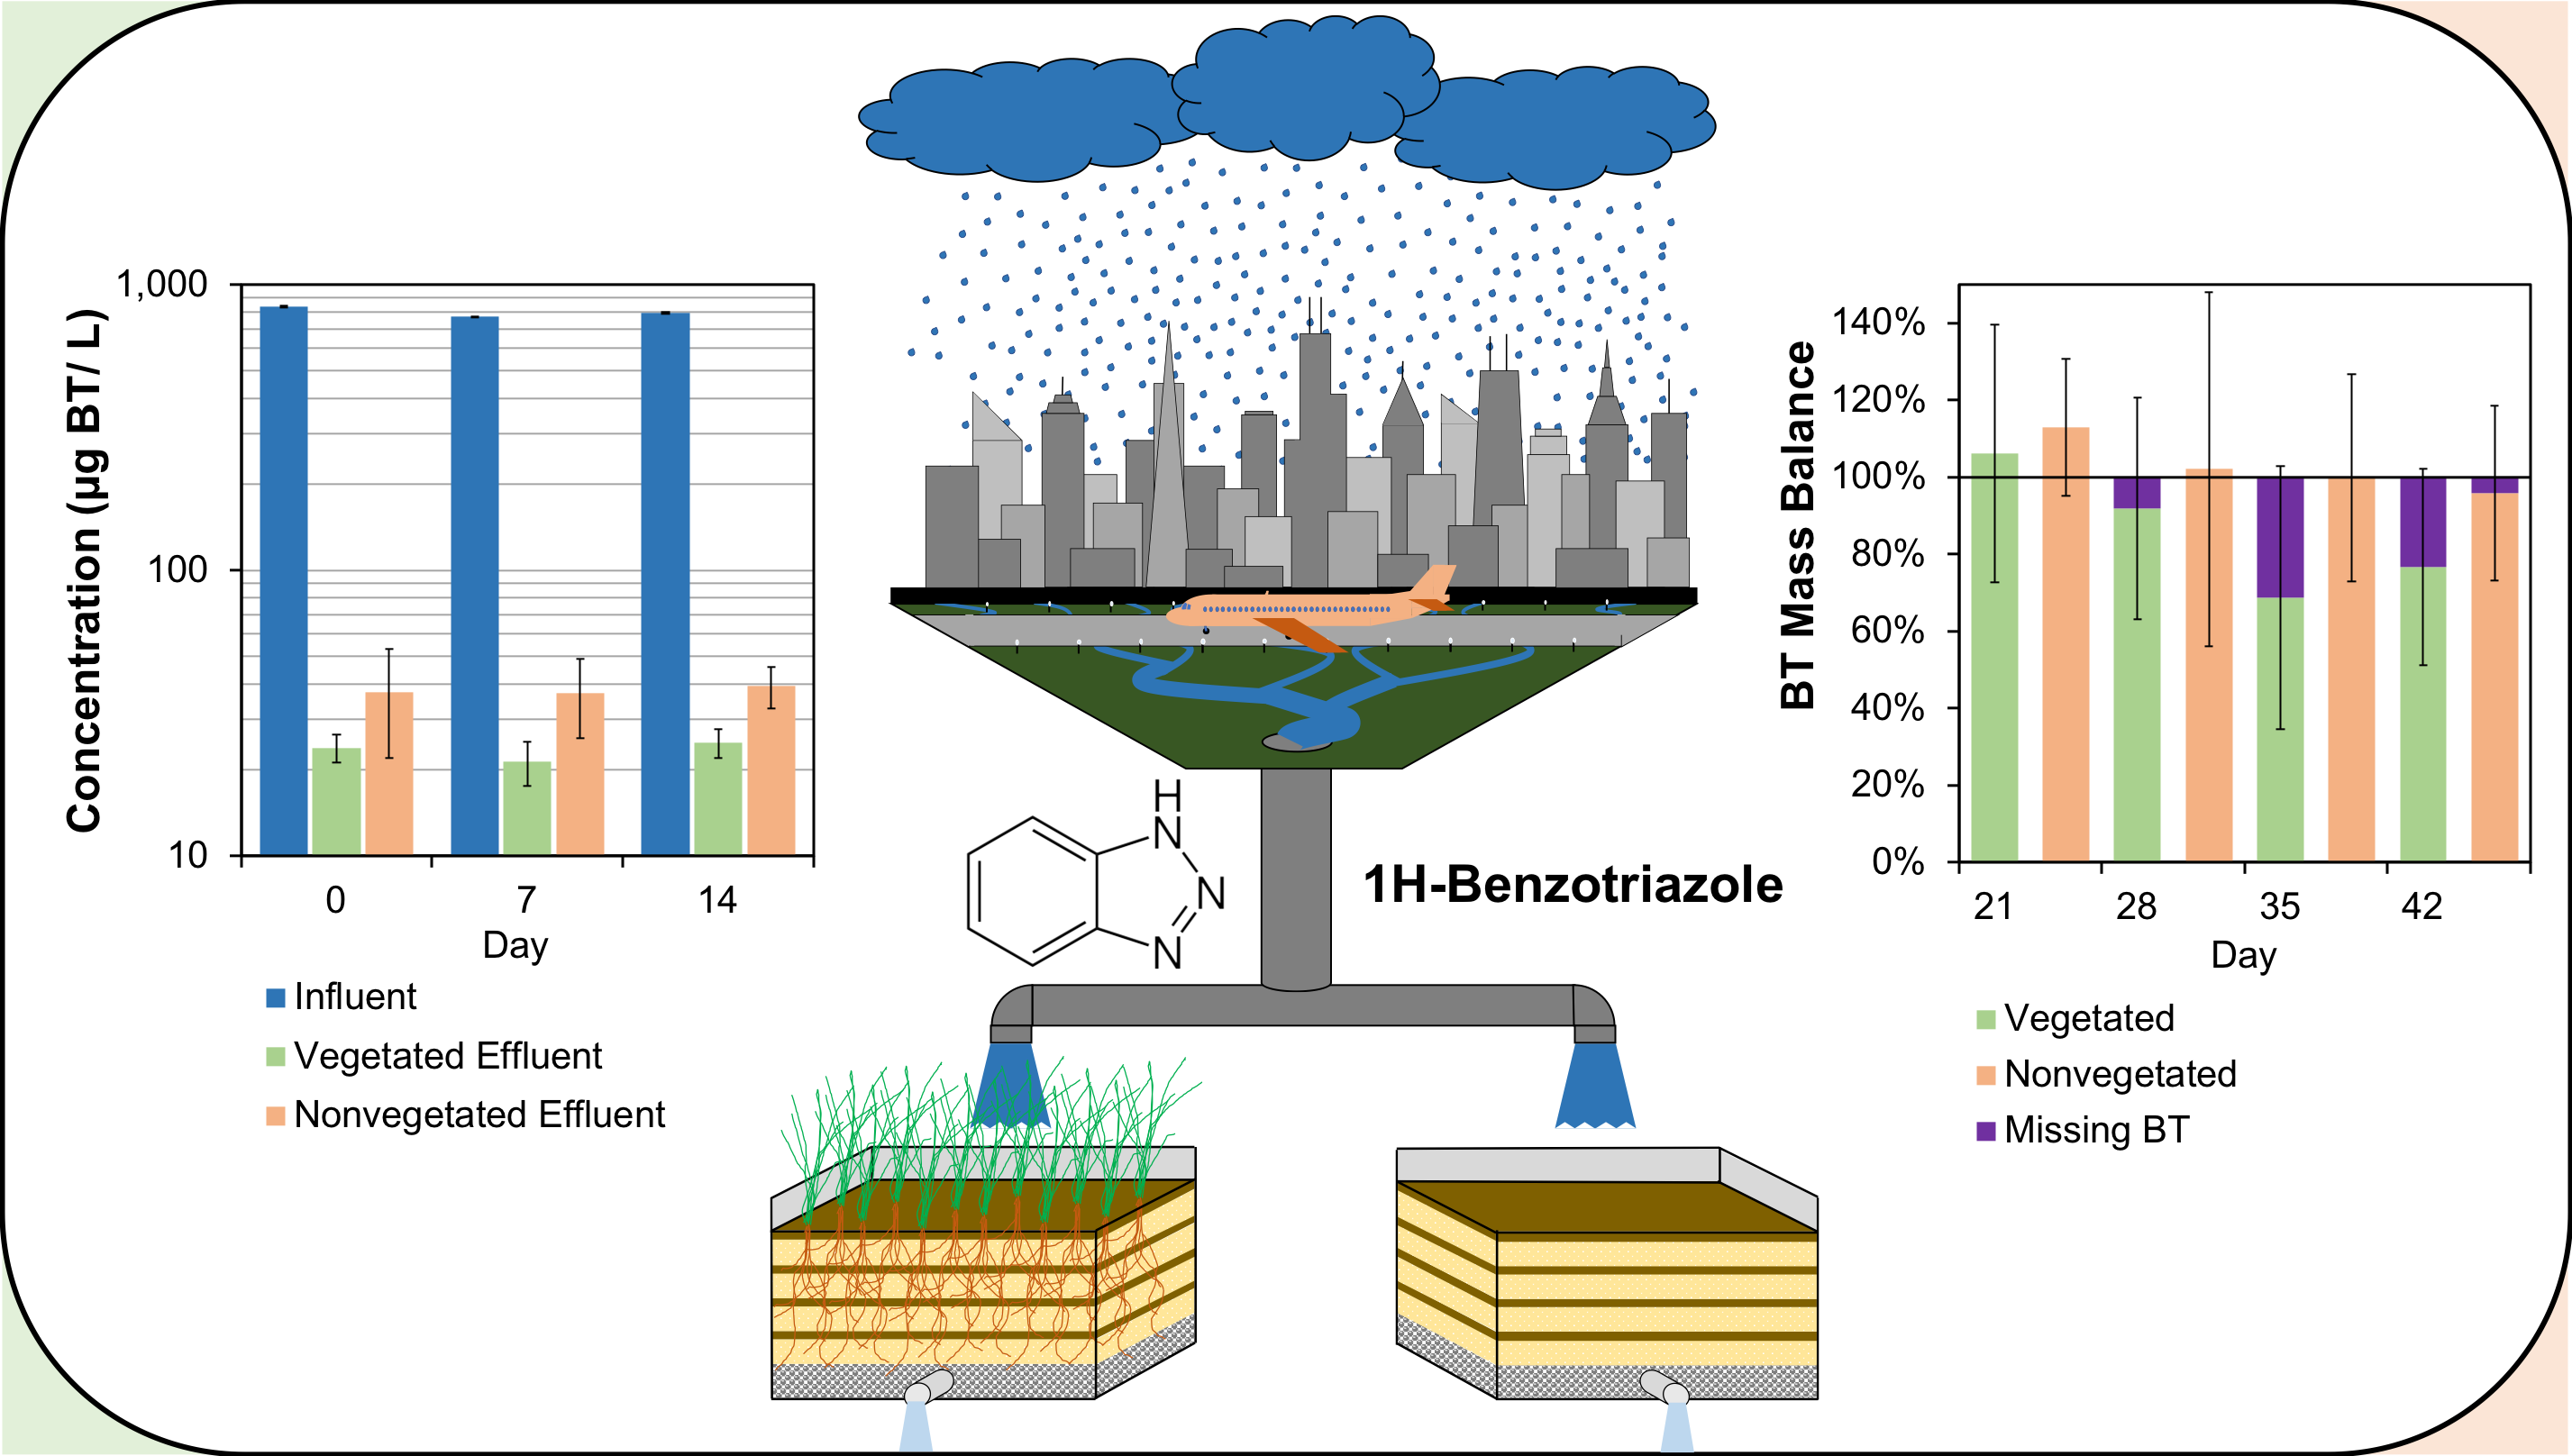
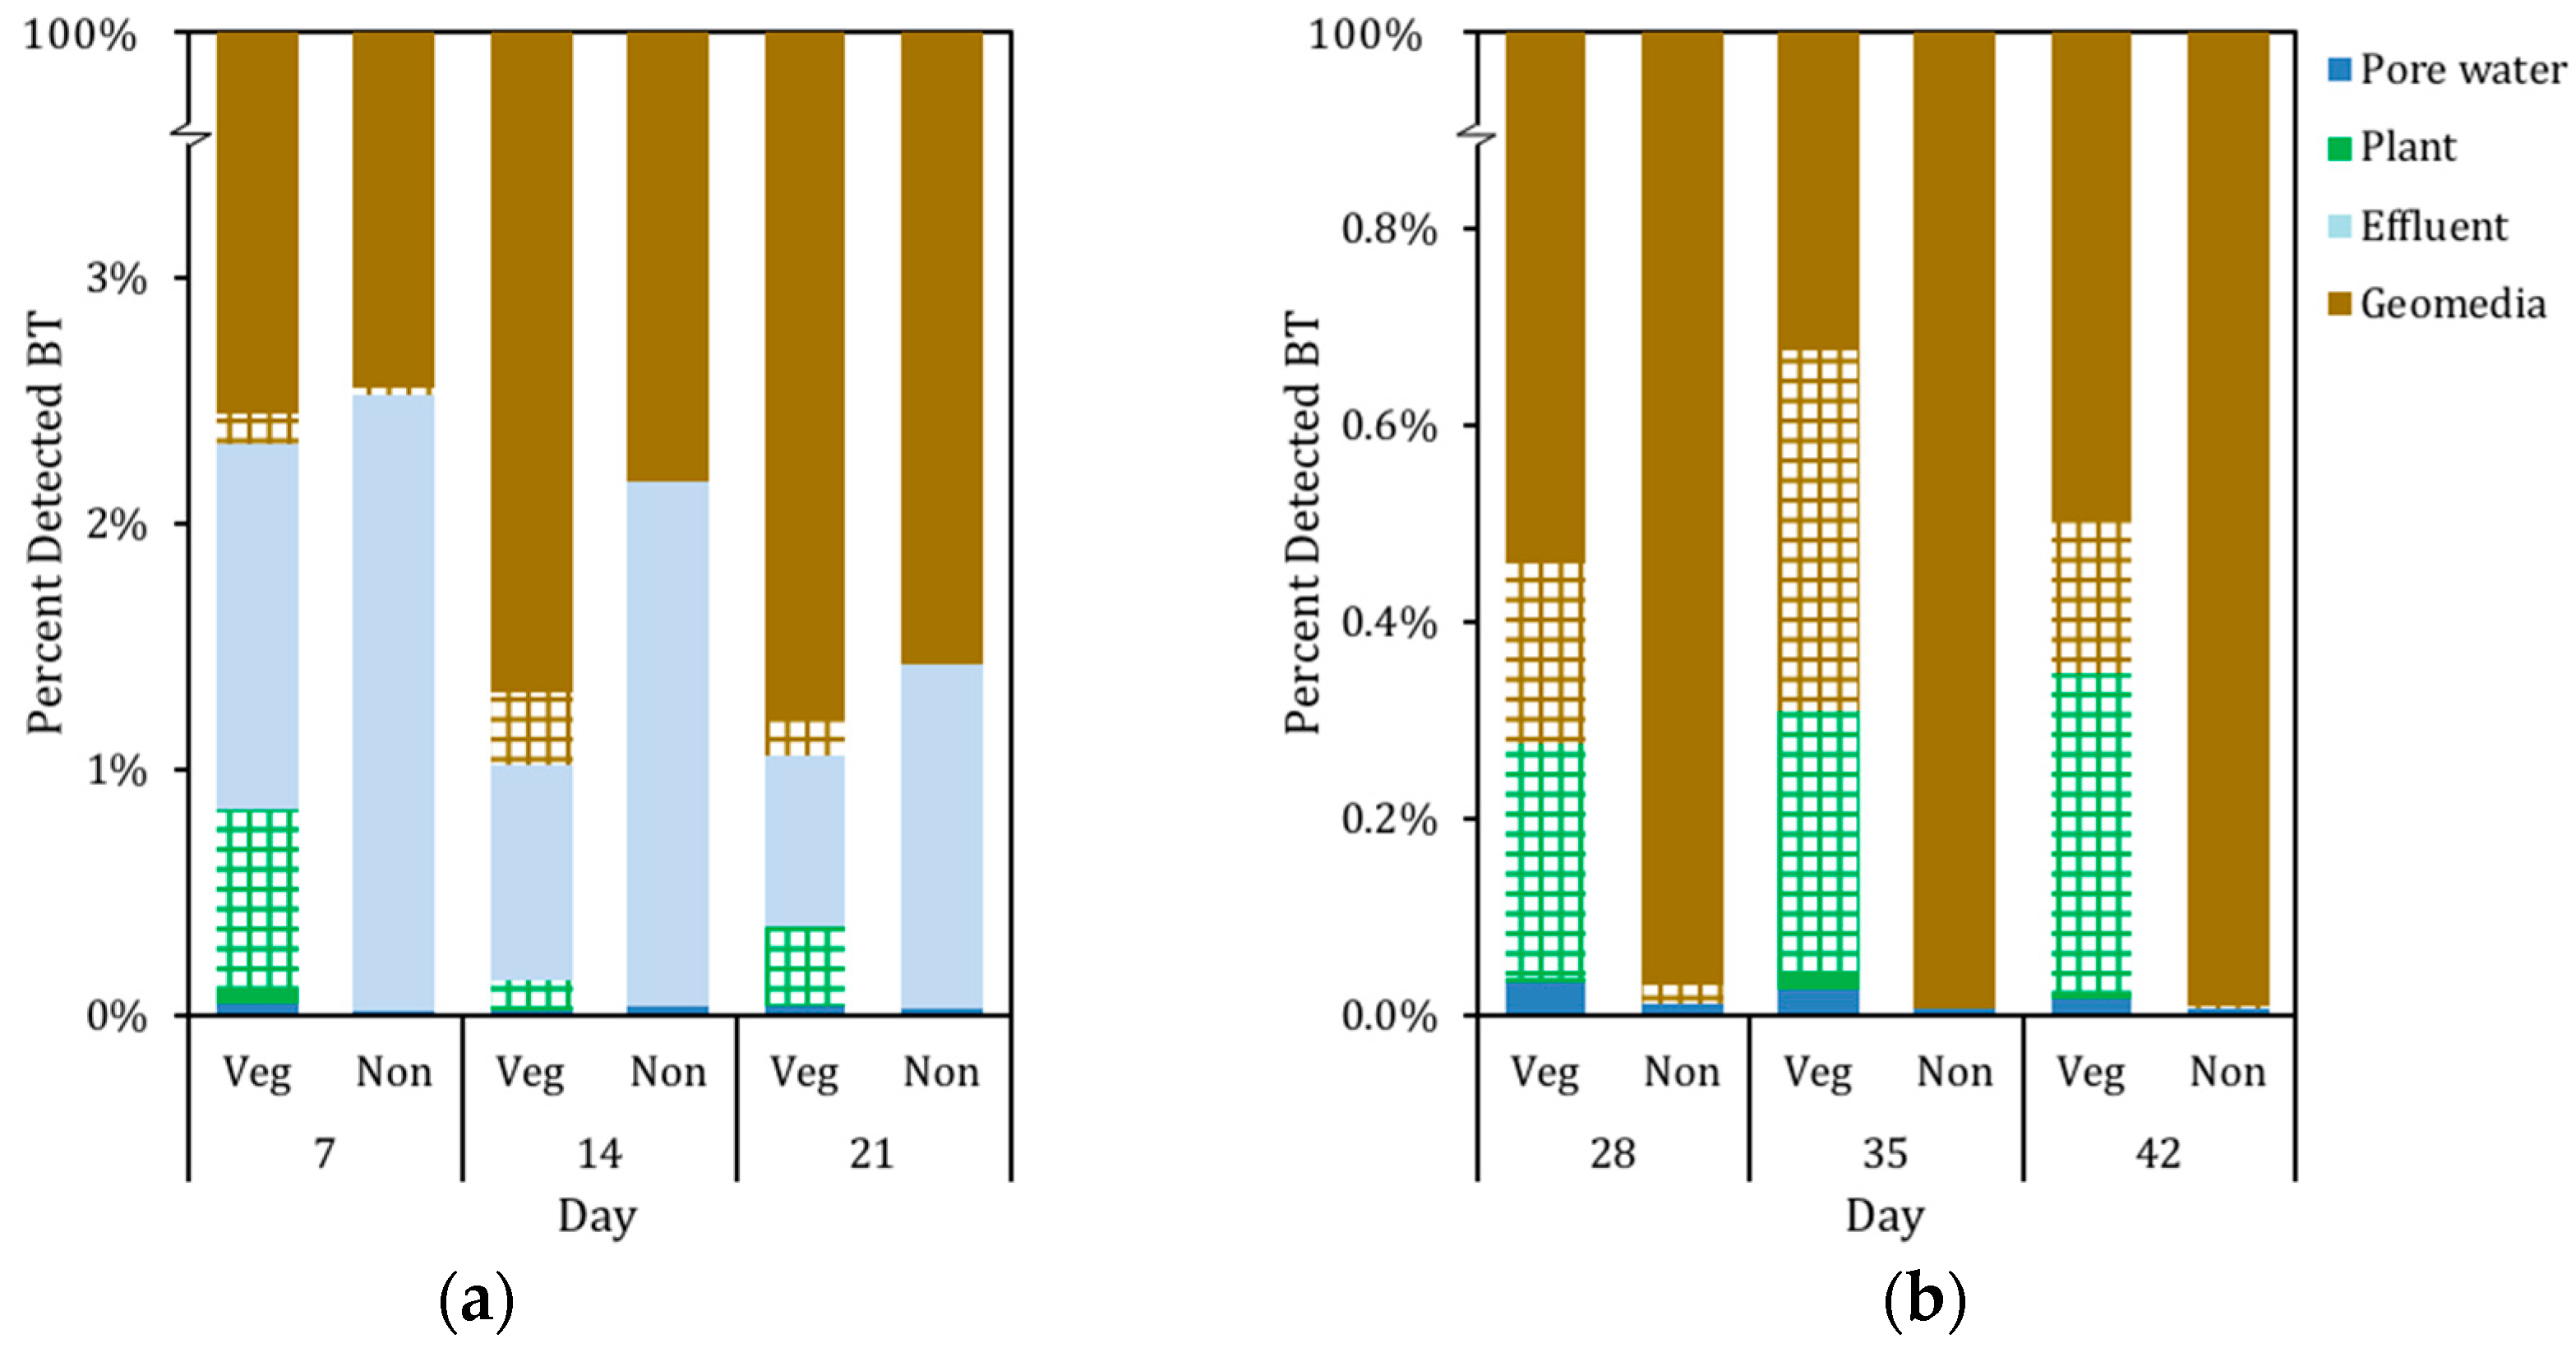
3.3. Mass Distribution of BT in System

BT was mainly distributed in the geomedia (Figure 7a,b). During the first three weeks of BT influx to the system, the distribution of ∑BT in the geomedia increased, signifying that the majority of BT added to the system sorbed to the geomedia in both the vegetated and nonvegetated mesocosms. In the vegetated mesocosms, during the three-week monitoring period after the final storm event, an average of 99.45% of detected BT was found to be sorbed to the geomedia while this value was 100% for the nonvegetated mesocosms. During the monitoring period, the distribution of ∑BT in the geomedia decreased in the vegetated mesocosms, implying that BT desorbed from the geomedia. However, in the nonvegetated mesocosms, the distribution of ∑BT remained constant. During the three weeks after the conclusion of the storm events, C. praegracilis contained on average about 0.28% of the detected ∑BT. The distribution of ∑BT in the C. praegracilis tissue increased during this time, signifying that C. praegracilis was continuing to uptake and metabolize BT.

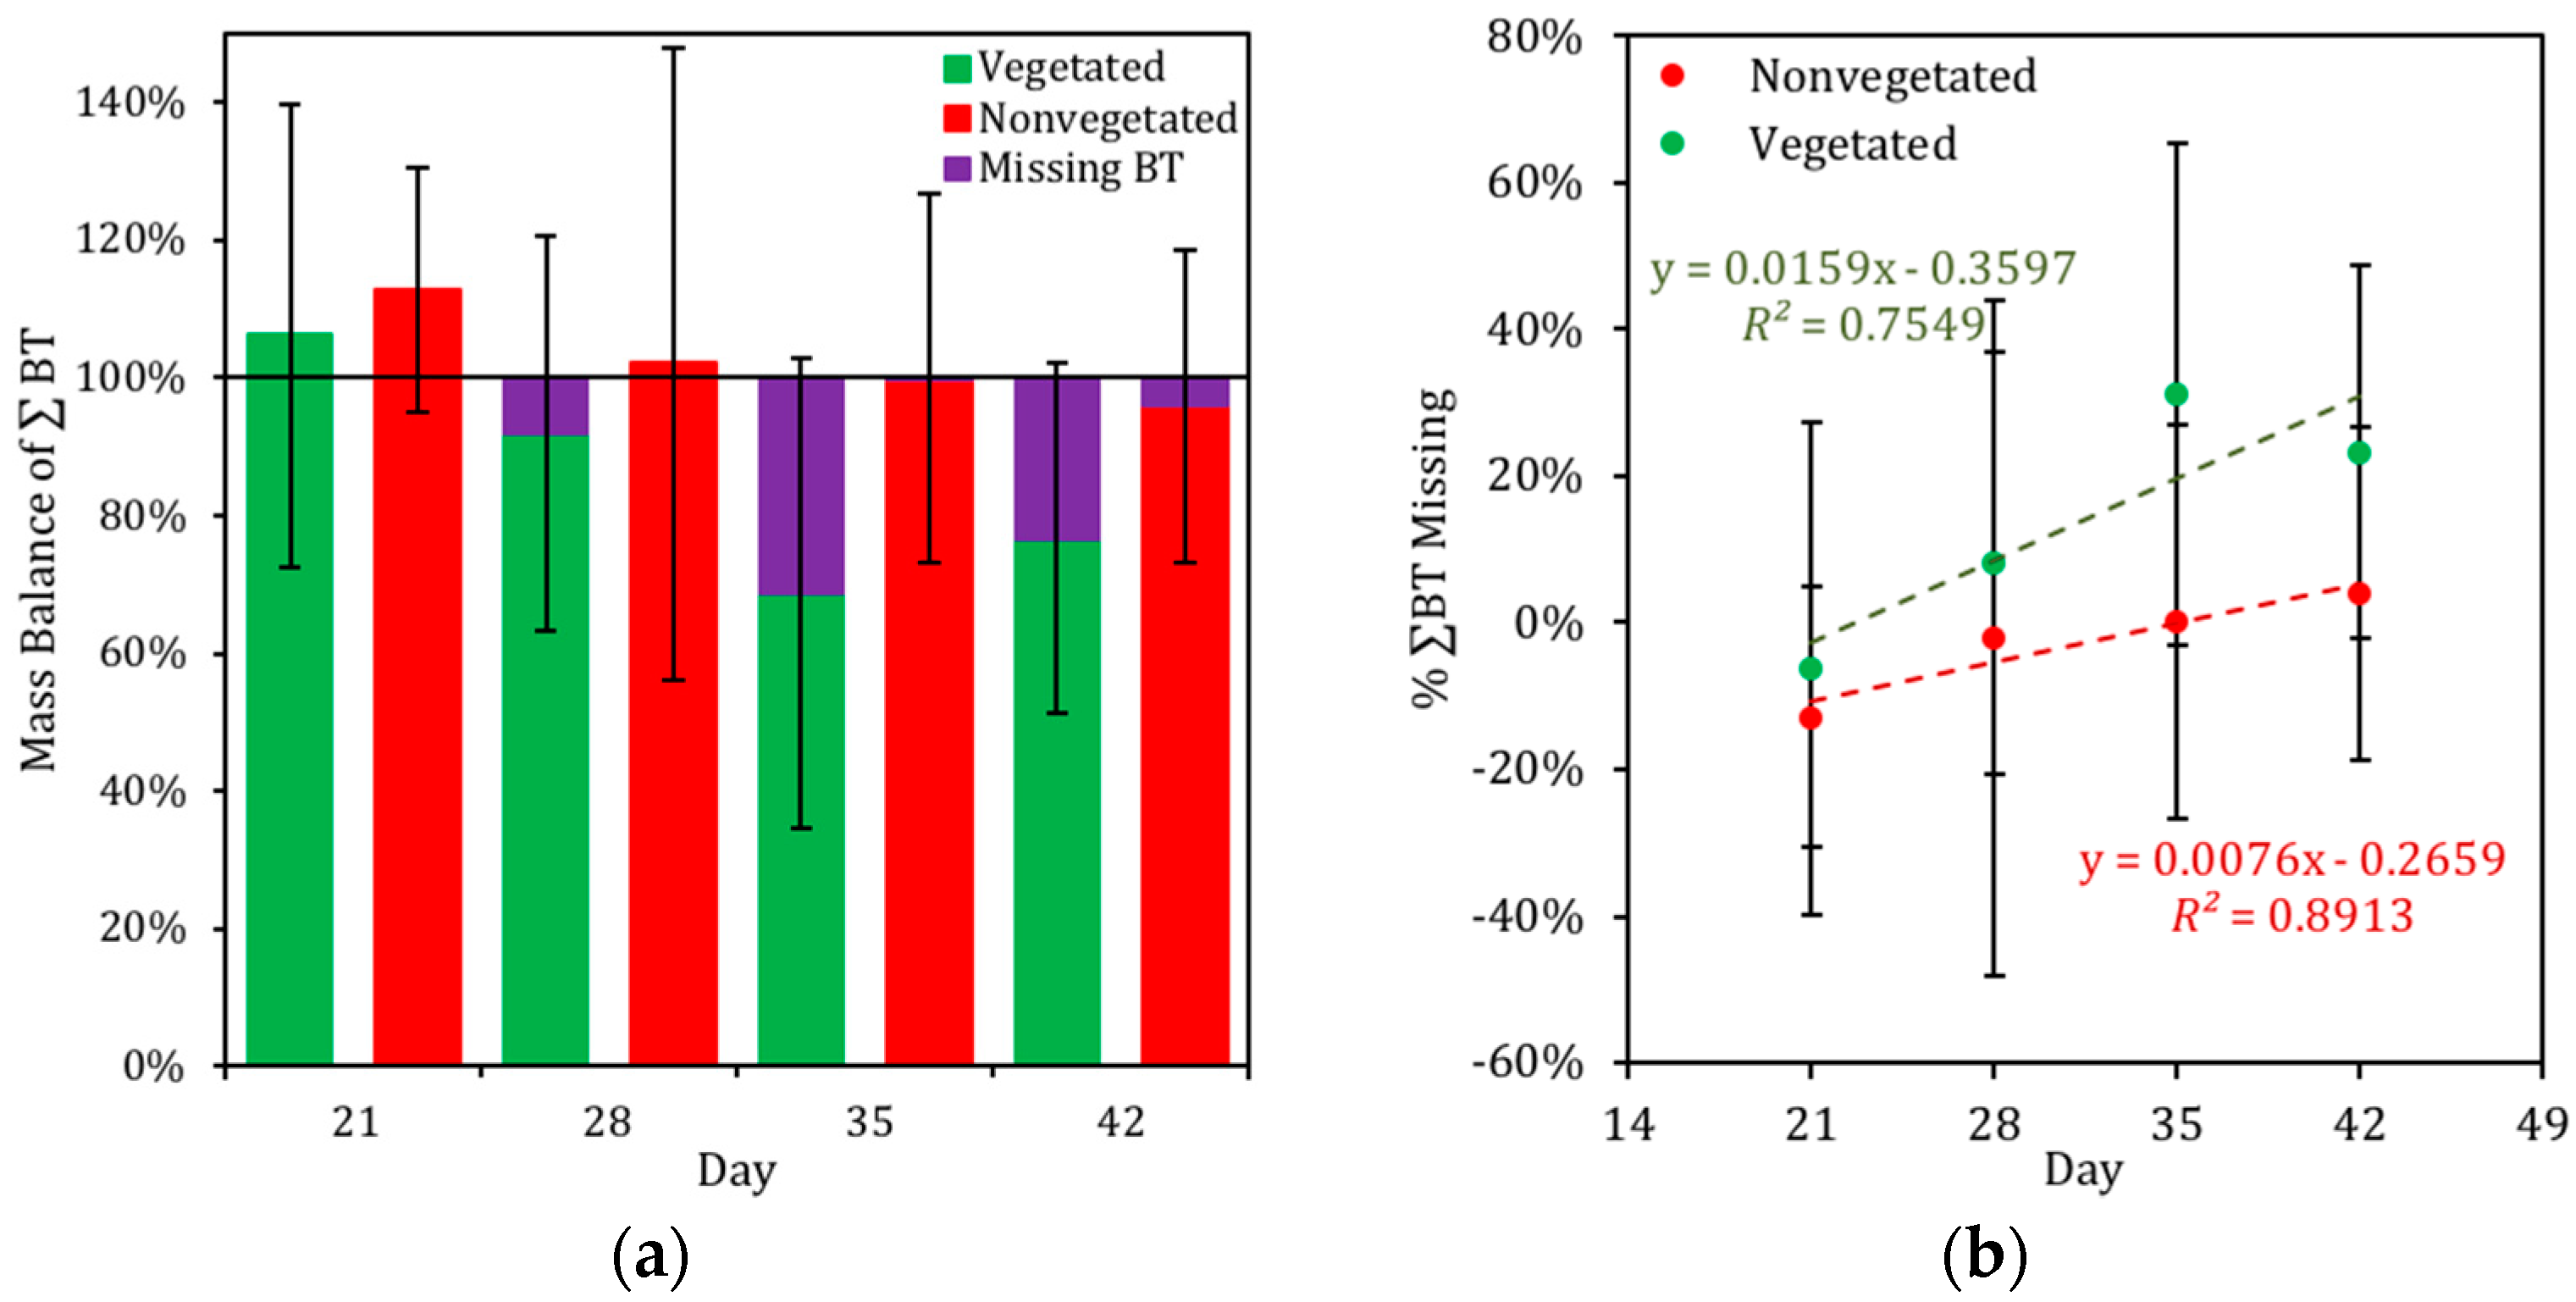
3.4. Mass Balance of BT in the Biofilter Mesocosms

A mass balance of BT in the system is shown in Figure 8a,b. Large standard deviations reflect the large spatial variability of BT and GBT concentrations in the geomedia. During the extended monitoring period, the mass balance for BT in the system approached 100% for the nonvegetated biofilter mesocosms and dropped below 100% for the vegetated biofilter mesocosms. Statistical analysis reveals that the loss of BT is a significant trend in both the vegetated and nonvegetated mesocosms (p = 0.05, repeated measures ANOVA). Significantly more BT is unaccounted for in the vegetated mesocosms compared to the nonvegetated mesocosms (p = 0.05, repeated measures ANOVA with paired t-test).

4. Discussion

4.1. Biofilter Mesocosm Performance and C. praegracilis Growth

The reduction of BT concentrations in the vegetated biofilter mesocosm effluent relative to the nonvegetated biofilter mesocosm effluent (Figure 3) indicates that vegetation provides a benefit to BT removal during the storm events. The mass of BT taken up by C. praegracilis during the first three storm events is about half of the difference in BT mass between the vegetated and nonvegetated mesocosm effluent, indicating that C. praegracilis uptake alone is not able to account for the extra reduction of BT in the vegetated effluent. In addition, BT concentrations in the vegetated and nonvegetated geomedia during the storm events were not significantly different (Figure 4a), suggesting that it is unlikely that the vegetated biofilter mesocosms had a significantly increased sorption capacity. As effluent concentrations are significantly greater than the pore water concentrations in the mesocosms immediately before the storm events (Figure 3 and Figure 5), we hypothesize that ponded stormwater may have entered into the monitoring well, leading directly to the gravel layer near the effluent pipe, bypassing the soil and vegetation and short-circuiting the biofilter mesocosms during the storm events. Thus, it is probable that the reduction in BT pore water concentrations in the vegetated biofilter mesocosms may be attributed to a combination of C. praegracilis uptake and reduced short-circuiting during the storm events.
The heterogeneity of BT concentrations in the geomedia of both the vegetated and nonvegetated mesocosms throughout the first three storm events suggests that the biofilter mesocosms experienced preferential flow, leading to short-circuiting of the biofilter. An investigation of the spatial distribution of BT concentrations in the vegetated and nonvegetated biofilters reveals significantly higher BT concentrations near the front of the biofilters, most notably near the front right corner in which the monitoring well had been placed, as seen in Figure 4c,d. Based on the effluent BT concentration (Figure 3), this short-circuiting appears to be more significant in the nonvegetated biofilters, perhaps because the hydraulic conductivity of the soil in the nonvegetated biofilters is less than in the vegetated biofilters [44]. Vegetation is known to improve the hydraulic conductivity of soil in biofilters by creating macropores in the soil through which stormwater can infiltrate more easily than hard-packed soil [44,45]. As the biofilters in this study were aged for one year, greater hydraulic conductivity was anticipated in the vegetated biofilters compared to the nonvegetated biofilters, as evident by the observation of increased stormwater ponding in the nonvegetated mesocosms relative to the vegetated mesocosms during the storm events. Increasing the hydraulic conductivity of the biofilter mesocosms increases the amount of stormwater treated, minimizing ponding on the surface and short-circuiting the system. Care should be taken to maintain adequate hydraulic conductivity when designing biofilters, and to ensure that minimal stormwater is able to short-circuit through the treatment system by the placement of monitoring wells or overflow weirs.
Plant growth and evapotranspiration were not affected by the presence of BT, as indicated by the absence of statistical difference between the vegetated and control biofilter mesocosms (Table A2). The detection of BT metabolite M207 indicates that tryptophan synthesis followed by auxin synthesis may occur in the C. praegracilis, potentially producing synthetic BT-auxins. Two previously identified BT-auxins are benzotriazole acetyl-alanine (M247) and benzotriazole acetyl-aspartic acid (M293), conjugates of indole-3-acetyl-alanine and indole-3-acetyl-aspartic acid, auxin storage compounds that contribute to the active auxin storage and inactivation in plants [33,46]. While it is unclear the exact effects synthetic BT auxins have on the C. praegracilis, other synthetic xenobiotic auxins have been observed to act as natural auxins, though less potent, including 1-napthalacetic acid (NAA), 2,4-dichloropephnoxyacetic acid (2,4-D), and 3,6-dichloro-2-mehoxybenzoic acid (dicamba) [46]. Auxin interference and manipulation is the basis for some types of herbicides (2,4-D, dicamba) as alteration of natural auxin may have detrimental effects on plants [46,47], but this does not appear to be the case for BT and C. praegracilis. Thus, C. praegracilis appears to be suitable for use in bioretention basins receiving high loads of BT, though studies of C. praegracilis’ resiliency with exposure to other TrOCs are necessary.

4.2. BT and BT Metabolites

BT metabolites detected in the biofilter mesocosms include GBT and M207. While M207 was only detected in C. praegracilis root tissue, GBT was detected in both C. praegracilis leaf and root tissue (Figure 6a–d) and in the geomedia (Figure 4b), indicating that GBT was excreted from the C. praegracilis roots. Glycolysis appears to be the most significant pathway for BT metabolization in C. praegracilis planted in the biofilter mesocosms based on the known metabolism pathways for BT [33] and the mass of GBT observed in the soil and C. praegracilis tissue. Glycosylation of BT can occur without the addition of any functional groups, as BT can be directly N-glycosylated on any of the nitrogen in the triazole ring [33,34].
The presence of BT and GBT in both the C. praegracilis leaf and root tissue (Figure 6a–d) provide insight to how BT and GBT are partitioned and transported within the plant. The low ratio of BT and GBT concentrations in leaf tissue relative to the root tissue may indicate ineffective transport of BT to the leaves, possibly due to low solubility of BT in C. praegracilis xylem sap [48]. While it is possible that BT and GBT in the leaf tissue are photodegraded, this is not expected to be significant as BT is poorly photolyzed in the environment [49,50,51]. The ratios of BT to GBT were nearly equal in both the root and leaf tissue. Different plant species are known to bioaccumulate and metabolize xenobiotic compounds differently [40,52,53]. For example, similar BT metabolites were observed in strawberries (Fragaria ananassa) and lettuce (Lactuca sativa) grown in greenhouses and the field that were irrigated with water containing low levels of BT [40]. LeFevre et al. (2017) detected metabolite GBT in strawberry and lettuce root tissue and M247 in strawberry root tissue while detecting BT all (leaf, root, strawberry fruit) tissue samples [40].
High ratios of GBT to BT in C. praegracilis tissue (Figure 6a–d) as well as the presence of GBT in the geomedia (Figure 4b) indicate that significant masses of BT are metabolized. Spatial analysis of the geomedia samples (Figure 4c–e) reveal that cores sampled near the center of the mesocosms (with the highest density of C. praegracilis) had the lowest concentrations of BT yet the highest concentrations of GBT relative to other cores taken at each particular time point. The nearly-constant concentration of GBT in the C. praegracilis (Figure 6c,d) may represent a steady state concentration of GBT resulting from BT glycolysis and GBT exudation from the C. praegracilis roots [33]. Likewise, the nearly constant concentration of GBT in the biofilter soil (Figure 4b) may represent a steady state concentration of GBT resulting from GBT exudation and further microbial degradation in the rhizosphere.
BT and GBT were detected in the both C. praegracilis leaf and root tissue in the control biofilters (Figure 6a–d), indicating that BT is able to accumulate in C. praegracilis even at low background concentrations over long periods of time. The detection of BT is most likely due to the exposure of the control biofilter mesocosms to BT spiked stormwater during the preliminary tests (Appendix B) as well as continued exposure from low ambient concentrations in the tap water [33,40]. This indicates that BT is able to accumulate in C. praegracilis, even at low background concentrations, and that BT and GBT are able to persist in vegetation for extended periods of time. The ratio of GBT to BT in the C. praegracilis root and leaf tissue is significantly smaller than in the vegetated biofilter mesocosms, suggesting that BT persist longer than GBT. Additionally, higher ratios of BT and GBT in the leaf tissue compared to the root tissue suggest that BT and GBT persist longer in the leaf tissue than in the root tissue. C. praegracilis tissue analyzed during mesocosm deconstruction (t = 84 days) showed similar or higher concentrations of BT and GBT in both the leaf and root tissue of the vegetated mesocosms while there was no significant change in the C. praegracilis leaf and root tissue in the control mesocosms, confirming that C. praegracilis is continuing to process BT.

4.3. Distribution of BT in Biofilter Mesocosms and Missing Sinks

The majority of BT distributed in the geomedia over the course of the study (Figure 7a,b) indicates that sorption to organic matter in the geomedia is the most significant removal mechanism for BT in stormwater. This is not surprising given the sorptivity of BT to organic carbon such as activated carbon and biochar [54,55]. The steady decrease of both BT pore water concentration and pore water mass distribution over the course of the study suggests that the bioavailability of BT should decrease. However, the steady in planta concentrations of BT and GBT indicate that C. praegracilis increases the phytoavailability of BT, perhaps by releasing exudates into the rhizosphere that facilitate the desorption of BT, a phenomenon commonly observed with nutrients [56,57]. While plants typically release exudates in order to facilitate the uptake of deficient nutrients, the released exudates can impact chemistry in the rhizosphere, often allowing for the increased phytoavailability of contaminants including metals [58,59] and PAHs [60].
After the last storm event (t = 21 days), the mass of detected BT in both the vegetated and nonvegetated biofilter mesocosms decreased (Figure 4b), indicating continuing BT loss in the system, likely due to microbial degradation from microbes in the compost. However, significantly more BT is unaccounted for in the vegetated biofilter mesocosms (Figure 8a,b). Thus, vegetation appears to increase the rate of BT loss in the system over time, perhaps due to phytodegradation and phytostimulation. Phytodegradation includes the metabolization of contaminants by plant enzymes in planta and also by plant enzymes that have been excreted by the roots ex planta. One such enzyme known to catalyze the oxidation of phenolic compounds, including PCBs, is laccases [61]. Phytostimulation is the facilitation of microbial degradation and mineralization of contaminants in the rhizosphere. Plants are known to release photosynthesis derived organic compounds, up to 20% of the total carbon fixed by the plant, which serve as carbon sources for microbes, into the rhizosphere [62,63]. In fact, vegetation has been observed to increase the density of microbes in the rhizosphere by one to four orders of magnitude [62,64]. In addition, exudates released by vegetation can facilitate the microbial degradation of organic contaminants by increasing their bioavailability [65].
The decrease of BT mass from the soil in the middle of the vegetated mesocosms (Figure 6c–e) is not explained solely by BT uptake and sequestration in C. praegracilis or by the mass of GBT excreted by C. praegracilis. Thus, it is hypothesized that BT and excreted GBT are further biodegraded in the rhizosphere. Similar dissipation of veterinary antibiotic sulfadiazine and phytotransformation metabolite 4-hydroxy-suladiazine in the rhizosphere of similar vegetated mesocosms have been observed and also hypothesized to result from plant enhanced microbial degradation [66]. In addition, biocides atrazine and parathion have been observed to have significantly higher microbial degradation and mineralization rates in vegetated soils compared to nonvegetated soils [64] and increased degradation rates of PAHs and PCBs have been observed in the rhizosphere [39,67,68]. Submerging the root zone of biofilters, thus creating an anoxic environment, is known to increase metal and nutrient removal [69].
The relatively low hydrophobicity of BT means that BT is hydrophobic enough to pass through the lipid bilayer of membranes while still water soluble enough to travel into cell fluids. This allows BT to become biologically available to microbes and mobile in C. praegracilis while also allowing it to sorb to compost in the soil and be removed from the biofilter effluent [62]. More research is necessary on the microbial activity within the C. praegracilis rhizosphere and the significance of the glycosylated-BT for microbial degradation to better understand the effect of C. praegracilis on BT degradation and mineralization. However, the glycosylation of BT may make GBT more bioavailable to microbes in the rhizosphere because of its increased solubility [62]. Further investigation of the rate of BT and BT metabolite degradation in the rhizosphere of bioretention basins would help determine the optimal retention time of bioretention basins to allow for complete contaminant degradation.

4.4. Environmental Implications

This study demonstrated that bench-scale biofilter mesocosms reduced influent stormwater concentrations of BT by 97.1% after seven days of treatment. Three storm events each delivered an average flux of about 11,735 ± 1176 µg BT, depositing about 35,000 µg BT in each mesocosms over the three storm events. Although the main mechanism of BT removal appeared to be sorption to the geomedia, vegetation appears to provide multiple benefits. In addition to increasing the hydraulic conductivity of the biofilter mesocosms, C. praegracilis appears to significantly decrease BT concentrations in the geomedia over the extended monitoring period, indicating continued phytoremediation well after the storm events have passed. Thus, by facilitating the desorption of BT from the soil and degradation of BT, the sorption capacity of the geomedia is increased, potentially prolonging the operational lifespan of bioretention basins in the field. The use of outlet controls is a beneficial way to control the water level in the biofilter mesocosms to ensure optimal treatment time. Bioretention basins planted with C. praegracilis appear to be promising for reducing the flux of BT and other organic contaminants into surface water bodies and could be implemented by cities and airports to preserve the quality of stormwater running off into local water bodies.

Author Contributions

N.A. and Y.-M.C. conceived the study; N.A., Y.-M.C. and J.C.P. designed the experiments; M.C., E.G., K.D., J.S., J.S.W., Y.-M.C., N.A., and J.C.P. set up the biofilter mesocosms, sampled, and performed the experiments, J.C.P. conducted formal analysis and drafted the manuscript; J.M.W., R.G.L., Y.-M.C., N.A., and J.C.P. reviewed and edited the manuscript.

Funding

This research was funded by the National Science Foundation (NSF), grant number EEC-1028968 (NSF ERC ReNUWIt). M. Carolan was supported by ReNUWIt’s REU program, E. Gamez Jr. and K. Doan were supported by the Stanford RISE program, and J. Sutton was supported by the IGNITE Summer Fellowship Program. J. S. Wiley received support from the United States Military Academy, Department of Geography and Environmental Engineering.

Acknowledgments

The authors thank Wiley Jennings for his assistance with the statistical analysis.

Conflicts of Interest

The authors declare no conflict of interest.

Appendix A

Table A1. HPLC-MS/MS parameters for BT and BT metabolites.
MRM Mass TransitionQ1 Mass [Da]Q3 Mass [Da]Declustering Potential [V]Focusing Potential [V]Entrance Potential [V]Collision Energy [V]Collision Cell Exit Potential [V]Retention Time [min]
1H-BT-1119.95165.11051.000240.00010.00031.0004.0005.58
1H-BT-2119.95192.12751.000240.00010.00025.0006.0005.58
d4-BT-1123.97269.10041.000170.00010.00035.0004.0005.53
d4-BT-2123.97296.00041.000170.00010.00027.0006.0005.53
GBT-1281.900119.90023.000200.00010.00025.00010.0004.49
GBT-2281.90085.00023.000200.00010.00035.00010.0004.49
M207-1207.088120.00036.000170.00010.00022.0008.0004.29
M270-2207.088179.10036.000170.00010.00013.00012.0004.29

Appendix B

Preliminary tests were conducted soon after planting the biofilter mesocosms over a four-week period. The goal of the preliminary experiment was to test the sampling procedures and BT detection under various dosing conditions. Four storm events delivering 26 L (169 mm; 6.6 in) of synthetic stormwater were simulated, of which two of the storm events (storm event = 1, 3) were spiked with BT. Various doses of BT were delivered to the vegetated biofilter mesocosms (1 mg/L), control mesocosms (1 µg/L), and the nonvegetated mesocosms (1 mg/L, 1 µg/L, no BT), as seen in Figure A1. BT was detected in the effluent, pore water, and C. praegracilis tissue at the 1 mg/L level, but not consistently at the 1 µg/L level. BT and GBT concentrations in the C. praegracilis leaf and root tissue show immediate response in BT uptake and metabolism with a lag period of two days followed by a steady decline in BT and GBT concentrations.
Figure A1. Diagram showing nine total biofilter mesocosms used in the preliminary experiment, of which the three vegetated mesocosms and one nonvegetated mesocosm received stormwater spiked with 1 mg/L, the three control mesocosms and one nonvegetated mesocosm received stormwater spiked with 1 µg/L, and one nonvegetated mesocosm did not receive BT.
Water 10 01605 g0a1

Appendix C

Table A2. Mean C. praegracilis new growth.
DayVegetatedControl
Mean 1 [g]Mean 1 [g]
03.52 ±1.66 5.76 ±3.76
73.56 ±2.44 2.13 ±0.69
143.02 ±2.21 1.13 ±0.07
212.17 ±0.43 1.41 ±0.71
281.24 ±0.83 6.70 ±3.37
355.09 ±0.96 2.18 ±0.72
422.47 ±0.63 2.10 ±0.66
Mean3.01 ±1.23 3.06 ±2.22
1 Mean plus/minus one standard deviation (n = 3).
Table A3. Mean daily synthetic stormwater additions.
DayVegetatedNonvegetatedControl
Mean 1 [mL]Mean 1 [mL]Mean 1 [mL]
0 2426 ±136 232 ±161 454 ±157
0 343 ±75 99 ±99 66 ±114
1300 ±147 257 ±39 350 ±220
2199 ±40 143 ±135 220 ±51
3174 ±146 555 ±473 55 ±50
4196 ±75 178 ±58 392 ±13
5415 ±13 219 ±36 378 ±26
6138 ±59 115 ±103 198 ±63
7 2435 ±60 155 ±18 404 ±91
7 3--260 ±248 --
8278 ±97 170 ±87 225 ±45
9268 ±56 208 ±118 258 ±40
10287 ±79 242 ±67 504 ±55
11489 ±80 195 ±75 300 ±42
13271 ±89 318 ±31 290 ±15
14 2580 ±101 253 ±83 473 ±97
14 389 ±154 --216 ±71
15322 ±121 271 ±38 356 ±67
16355 ±29 247 ±97 324 ±85
17153 ±19 68 ±20 192 ±60
18286 ±52 161 ±24 283 ±23
19394 ±73 290 ±42 431 ±160
20227 ±82 114 ±58 245 ±86
21389 ±75 163 ±10 598 ±270
22397 ±236 254 ±78 250 ±22
25616 ±163 418 ±113 511 ±26
26330 ±70 343 ±84 293 ±57
27378 ±17 60 ±104 368 ±19
28260 ±72 59 ±51 293 ±28
29300 ±66 147 ±131 225 ±35
32837 ±72 370 ±115 779 ±123
33316 ±73 133 ±19 243 ±71
35568 ±54 307 ±15 757 ±425
3675 ±27 90 ±75 77 ±20
39674 ±176 416 ±74 339 ±230
40180 ±49 172 ±23 243 ±23
41605 ±181 226 ±81 469 ±174
42255 ±36 150 ±89 262 ±46
Mean329 ±182 212±113324 ±168
1 Mean plus/minus one standard deviation (n = 3). 2 Stormwater addition before sampling on day of storm event. 3 Stormwater addition immediately after storm event.

References

  1. LeFevre, G.H.; Paus, K.H.; Natarajan, P.; Gulliver, J.S.; Novak, P.J.; Hozalski, R.M. Review of Dissolved Pollutants in Urban Storm Water and Their Removal and Fate in Bioretention Cells. J. Environ. Eng. 2015, 141, 23. [Google Scholar] [CrossRef]
  2. Zhou, Q.Q. A Review of Sustainable Urban Drainage Systems Considering the Climate Change and Urbanization Impacts. Water 2014, 6, 976–992. [Google Scholar] [CrossRef] [Green Version]
  3. Hatt, B.E.; Fletcher, T.D.; Walsh, C.J.; Taylor, S.L. The influence of urban density and drainage infrastructure on the concentrations and loads of pollutants in small streams. Environ. Manag. 2004, 34, 112–124. [Google Scholar] [CrossRef] [PubMed]
  4. Clary, J.; Urbonas, B.; Jones, J.; Strecker, E.; Quigley, M.; O’Brien, J. Developing, evaluating and maintaining a standardized stormwater BMP effectiveness database. Water Sci. Technol. 2002, 45, 65–73. [Google Scholar] [CrossRef] [PubMed]
  5. McPhillips, L.; Goodale, C.; Walter, M.T. Nutrient Leaching and Greenhouse Gas Emissions in Grassed Detention and Bioretention Stormwater Basins. J. Sustain. Water Built Environ. 2018, 4, 10. [Google Scholar] [CrossRef]
  6. Davis, A.P.; Hunt, W.F.; Traver, R.G.; Clar, M. Bioretention Technology: Overview of Current Practice and Future Needs. J. Environ. Eng.-ASCE 2009, 135, 109–117. [Google Scholar] [CrossRef]
  7. Liu, J.; Sample, D.J.; Bell, C.; Guan, Y.T. Review and Research Needs of Bioretention Used for the Treatment of Urban Stormwater. Water 2014, 6, 1069–1099. [Google Scholar] [CrossRef] [Green Version]
  8. Muerdter, C.P.; Wong, C.K.; LeFevre, G.H. Emerging investigator series: The role of vegetation in bioretention for stormwater treatment in the built environment: Pollutant removal, hydrologic function, and ancillary benefits. Environ. Sci.-Water Res. Technol. 2018, 4, 592–612. [Google Scholar] [CrossRef]
  9. Shrestha, P.; Hurley, S.E.; Wemple, B.C. Effects of different soil media, vegetation, and hydrologic treatments on nutrient and sediment removal in roadside bioretention systems. Ecol. Eng. 2018, 112, 116–131. [Google Scholar] [CrossRef]
  10. Rycewicz-Borecki, M.; McLean, J.E.; Dupont, R.R. Nitrogen and phosphorus mass balance, retention and uptake in six plant species grown in stormwater bioretention microcosms. Ecol. Eng. 2017, 99, 409–416. [Google Scholar] [CrossRef]
  11. Li, J.K.; Davis, A.P. A unified look at phosphorus treatment using bioretention. Water Res. 2016, 90, 141–155. [Google Scholar] [CrossRef] [PubMed]
  12. Bratieres, K.; Fletcher, T.D.; Deletic, A.; Zinger, Y. Nutrient and sediment removal by stormwater biofilters: A large-scale design optimisation study. Water Res. 2008, 42, 3930–3940. [Google Scholar] [CrossRef] [PubMed]
  13. Cho, K.W.; Song, K.G.; Cho, J.W.; Kim, T.G.; Ahn, K.H. Removal of nitrogen by a layered soil infiltration system during intermittent storm events. Chemosphere 2009, 76, 690–696. [Google Scholar] [CrossRef] [PubMed]
  14. Rycewicz-Borecki, M.; McLean, J.E.; Dupont, R.R. Bioaccumulation of copper, lead, and zinc in six macrophyte species grown in simulated stormwater bioretention systems. J. Environ. Manag. 2016, 166, 267–275. [Google Scholar] [CrossRef] [PubMed]
  15. Davis, A.P.; Shokouhian, M.; Sharma, H.; Minami, C.; Winogradoff, D. Water quality improvement through bioretention: Lead, copper, and zinc removal. Water Environ. Res. 2003, 75, 73–82. [Google Scholar] [CrossRef] [PubMed]
  16. Peng, J.; Cao, Y.P.; Rippy, M.A.; Afrooz, A.; Grant, S.B. Indicator and Pathogen Removal by Low Impact Development Best Management Practices. Water 2016, 8, 24. [Google Scholar] [CrossRef]
  17. Mohanty, S.K.; Torkelson, A.A.; Dodd, H.; Nelson, K.L.; Boehm, A.B. Engineering Solutions to Improve the Removal of Fecal Indicator Bacteria by Bioinfiltration Systems during Intermittent Flow of Stormwater. Environ. Sci. Technol. 2013, 47, 10791–10798. [Google Scholar] [CrossRef] [PubMed] [Green Version]
  18. Chandrasena, G.I.; Shirdashtzadeh, M.; Li, Y.L.; Deletic, A.; Hathaway, J.M.; McCarthy, D.T. Retention and survival of E. coli in stormwater biofilters: Role of vegetation, rhizosphere microorganisms and antimicrobial filter media. Ecol. Eng. 2017, 102, 166–177. [Google Scholar] [CrossRef]
  19. Diblasi, C.J.; Li, H.; Davis, A.P.; Ghosh, U. Removal and Fate of Polycyclic Aromatic Hydrocarbon Pollutants in an Urban Stormwater Bioretention Facility. Environ. Sci. Technol. 2009, 43, 494–502. [Google Scholar] [CrossRef] [PubMed]
  20. David, N.; Leatherbarrow, J.E.; Yee, D.; McKee, L.J. Removal Efficiencies of a Bioretention System for Trace Metals, PCBs, PAHs, and Dioxins in a Semiarid Environment. J. Environ. Eng. 2015, 141, 8. [Google Scholar] [CrossRef]
  21. Tedoldi, D.; Chebbo, G.; Pierlot, D.; Kovacs, Y.; Gromaire, M.C. Impact of runoff infiltration on contaminant accumulation and transport in the soil/filter media of Sustainable Urban Drainage Systems: A literature review. Sci. Total Environ. 2016, 569, 904–926. [Google Scholar] [CrossRef] [PubMed]
  22. Central Coast Low Impact Development Initiative. LID Plant Guidance for Bioretention; Central Coast Water Board: San Luis Obispo, CA, USA, 2018. [Google Scholar]
  23. Stachel, B.; Holthuis, J.U.; Schulz, W.; Seitz, W.; Weber, W.H.; Tegge, K.T.; Dobner, I. Treatment Techniques and Analysis of Stormwater Run-off from Roads in Hamburg, Germany. In Xenobiotics in the Urban Water Cycle: Mass Flows, Environmental Processes, Mitigation and Treatment Strategies; FattaKassinos, D., Bester, K., Kummerer, K., Eds.; Springer: Dordrecht, The Netherland, 2010; Volume 16, pp. 445–461. [Google Scholar]
  24. Kiss, A.; Fries, E. Occurrence of benzotriazoles in the rivers Main, Hengstbach, and Hegbach (Germany). Environ. Sci. Pollut. Res. 2009, 16, 702–710. [Google Scholar] [CrossRef] [PubMed]
  25. Sulej, A.M.; Polkowska, Z.; Astel, A.; Namiesnik, J. Analytical procedures for the determination of fuel combustion products, anti-corrosive compounds, and de-icing compounds in airport runoff water samples. Talanta 2013, 117, 158–167. [Google Scholar] [CrossRef] [PubMed]
  26. Alotaibi, M.D.; McKinley, A.J.; Patterson, B.M.; Reeder, A.Y. Benzotriazoles in the Aquatic Environment: A Review of Their Occurrence, Toxicity, Degradation and Analysis. Water Air Soil Pollut. 2015, 226, 20. [Google Scholar] [CrossRef]
  27. Liu, Y.S.; Ying, G.G.; Shareef, A.; Kookana, R.S. Biodegradation of three selected benzotriazoles in aquifer materials under aerobic and anaerobic conditions. J. Contam. Hydrol. 2013, 151, 131–139. [Google Scholar] [CrossRef] [PubMed] [Green Version]
  28. Kiss, A.; Fries, E. Seasonal source influence on river mass flows of benzotriazoles. J. Environ. Monit. 2012, 14, 697–703. [Google Scholar] [CrossRef] [PubMed]
  29. Giger, W.; Schaffner, C.; Kohler, H.P.E. Benzotriazole and tolyltriazole as aquatic contaminants. 1. Input and occurrence in rivers and lakes. Environ. Sci. Technol. 2006, 40, 7186–7192. [Google Scholar] [CrossRef] [PubMed]
  30. Seeland, A.; Oetken, M.; Kiss, A.; Fries, E.; Oehlmann, J. Acute and chronic toxicity of benzotriazoles to aquatic organisms. Environ. Sci. Pollut. Res. 2012, 19, 1781–1790. [Google Scholar] [CrossRef] [PubMed]
  31. Pillard, D.A.; Cornell, J.S.; Dufresne, D.L.; Hernandez, M.T. Toxicity of benzotriazole and benzotriazole derivatives to three aquatic species. Water Res. 2001, 35, 557–560. [Google Scholar] [CrossRef]
  32. Liang, X.F.; Martyniuk, C.J.; Zha, J.M.; Wang, Z.J. Brain quantitative proteomic responses reveal new insight of benzotriazole neurotoxicity in female Chinese rare minnow (Gobiocypris rarus). Aquatic Toxicol. 2016, 181, 67–75. [Google Scholar] [CrossRef] [PubMed]
  33. LeFevre, G.H.; Muller, C.E.; Lo, R.J.X.; Luthy, R.G.; Sattely, E.S. Rapid Phytotransformation of Benzotriazole Generates Synthetic Tryptophan and Auxin Analogs in Arabidopsis. Environ. Sci. Technol. 2015, 49, 10959–10968. [Google Scholar] [CrossRef] [PubMed]
  34. Coleman, J.O.D.; BlakeKalff, M.M.A.; Davies, T.G.E. Detoxification of xenobiotics by plants: Chemical modification and vacuolar compartmentation. Trends Plant Sci. 1997, 2, 144–151. [Google Scholar] [CrossRef]
  35. Verkleij, J.A.C.; Golan-Goldhirsh, A.; Antosiewisz, D.M.; Schwitzguebel, J.P.; Schroder, P. Dualities in plant tolerance to pollutants and their uptake and translocation to the upper plant parts. Environ. Exp. Bot. 2009, 67, 10–22. [Google Scholar] [CrossRef]
  36. Flasinski, M.; Hac-Wydro, K. Natural vs synthetic auxin: Studies on the interactions between plant hormones and biological membrane lipids. Environ. Res. 2014, 133, 123–134. [Google Scholar] [CrossRef] [PubMed]
  37. Radwanski, E.R.; Last, R.L. Tryptophan biosynthesis and metabolism–biochemical and molecular-genetics. Plant Cell 1995, 7, 921–934. [Google Scholar] [CrossRef] [PubMed]
  38. Schymanski, E.L.; Jeon, J.; Gulde, R.; Fenner, K.; Ruff, M.; Singer, H.P.; Hollender, J. Identifying Small Molecules via High Resolution Mass Spectrometry: Communicating Confidence. Environ. Sci. Technol. 2014, 48, 2097–2098. [Google Scholar] [CrossRef] [PubMed]
  39. Miller, E.L.; Nason, S.L.; Karthikeyan, K.G.; Pedersen, J.A. Root Uptake of Pharmaceuticals and Personal Care Product Ingredients. Environ. Sci. Technol. 2016, 50, 525–541. [Google Scholar] [CrossRef] [PubMed]
  40. LeFevre, G.H.; Lipsky, A.; Hyland, K.C.; Blaine, A.C.; Higgins, C.P.; Luthy, R.G. Benzotriazole (BT) and BT plant metabolites in crops irrigated with recycled water. Environ. Sci.-Water Res. Technol. 2017, 3, 213–223. [Google Scholar] [CrossRef]
  41. Attachment H. Bioretention/Biofiltration Design Criteria; Order No. R4-2012-0175, NPDES PERMIT No. CAS004001; (MS4) Discharge Within the Coastal Watersheds of Los Angeles County: Los Angeles, CA, USA, 2012.
  42. Grebel, J.E.; Charbonnet, J.A.; Sedlak, D.L. Oxidation of organic contaminants by manganese oxide geomedia for passive urban stormwater treatment systems. Water Res. 2016, 88, 481–491. [Google Scholar] [CrossRef] [PubMed] [Green Version]
  43. Grebel, J.E.; Mohanty, S.K.; Torkelson, A.A.; Boehm, A.B.; Higgins, C.P.; Maxwell, R.M.; Nelson, K.L.; Sedlak, D.L. Engineered Infiltration Systems for Urban Stormwater Reclamation. Environ. Eng. Sci. 2013, 30, 437–454. [Google Scholar] [CrossRef]
  44. Hatt, B.E.; Fletcher, T.D.; Deletic, A. Hydrologic and pollutant removal performance of stormwater biofiltration systems at the field scale. J. Hydrol. 2009, 365, 310–321. [Google Scholar] [CrossRef]
  45. Virahsawmy, H.K.; Stewardson, M.J.; Vietz, G.; Fletcher, T.D. Factors that affect the hydraulic performance of raingardens: Implications for design and maintenance. Water Sci. Technol. 2014, 69, 982–988. [Google Scholar] [CrossRef] [PubMed]
  46. Korasick, D.A.; Enders, T.A.; Strader, L.C. Auxin biosynthesis and storage forms. J. Exp. Bot. 2013, 64, 2541–2555. [Google Scholar] [CrossRef] [PubMed] [Green Version]
  47. Woodward, A.W.; Bartel, B. Auxin: Regulation, action, and interaction. Ann. Bot. 2005, 95, 707–735. [Google Scholar] [CrossRef] [PubMed]
  48. Garvin, N.; Doucette, W.J.; White, J.C. Investigating differences in the root to shoot transfer and xylem sap solubility of organic compounds between zucchini, squash and soybean using a pressure chamber method. Chemosphere 2015, 130, 98–102. [Google Scholar] [CrossRef] [PubMed]
  49. Gatidou, G.; Oursouzidou, M.; Stefanatou, A.; Stasinakis, A.S. Removal mechanisms of benzotriazoles in duckweed Lemna minor wastewater treatment systems. Sci. Total Environ. 2017, 596, 12–17. [Google Scholar] [CrossRef] [PubMed]
  50. Felis, E.; Sochacki, A.; Magiera, S. Degradation of benzotriazole and benzothiazole in treatment wetlands and by artificial sunlight. Water Res. 2016, 104, 441–448. [Google Scholar] [CrossRef] [PubMed]
  51. Acero, J.L.; Benitez, F.J.; Real, F.J.; Rodriguez, E. Degradation of selected emerging contaminants by UV-activated persulfate: Kinetics and influence of matrix constituents. Sep. Purif. Technol. 2018, 201, 41–50. [Google Scholar] [CrossRef]
  52. Harms, H.H. Bioaccumulation and metabolic fate of sewage sludge derived organic xenobiotics in plants. Sci. Total Environ. 1996, 185, 83–92. [Google Scholar] [CrossRef]
  53. Malchi, T.; Maor, Y.; Tadmor, G.; Shenker, M.; Chefetz, B. Irrigation of Root Vegetables with Treated Wastewater: Evaluating Uptake of Pharmaceuticals and the Associated Human Health Risks. Environ. Sci. Technol. 2014, 48, 9325–9333. [Google Scholar] [CrossRef] [PubMed]
  54. Reemtsma, T.; Miehe, U.; Duennbier, U.; Jekel, M. Polar pollutants in municipal wastewater and the water cycle: Occurrence and removal of benzotriazoles. Water Res. 2010, 44, 596–604. [Google Scholar] [CrossRef] [PubMed]
  55. Ulrich, B.A.; Vignola, M.; Edgehouse, K.; Werner, D.; Higgins, C.P. Organic Carbon Amendments for Enhanced Biological Attenuation of Trace Organic Contaminants in Biochar-Amended Stormwater Biofilters. Environ. Sci. Technol. 2017, 51, 9184–9193. [Google Scholar] [CrossRef] [PubMed]
  56. Henner, P.; Bredoire, F.; Tailliez, A.; Coppin, F.; Pierrisnard, S.; Camilleri, V.; Keller, C. Influence of root exudation of white lupine (Lupinus albus L.) on uranium phytoavailability in a naturally uranium-rich soil. J. Environ. Radioact. 2018, 190, 39–50. [Google Scholar] [CrossRef] [PubMed]
  57. Giles, C.D.; Richardson, A.E.; Cade-Menun, B.J.; Mezeli, M.M.; Brown, L.K.; Menezes-Blackburn, D.; Darch, T.; Blackwell, M.S.A.; Shand, C.A.; Stutter, M.I.; et al. Phosphorus acquisition by citrate- and phytase-exuding Nicotiana tabacum plant mixtures depends on soil phosphorus availability and root intermingling. Physiol. Plant. 2018, 163, 356–371. [Google Scholar] [CrossRef] [PubMed]
  58. Duffner, A.; Hoffland, E.; Temminghoff, E.J.M. Bioavailability of zinc and phosphorus in calcareous soils as affected by citrate exudation. Plant Soil 2012, 361, 165–175. [Google Scholar] [CrossRef] [Green Version]
  59. Kabas, S.; Saavedra-Mella, F.; Huynh, T.; Kopittke, P.M.; Carter, S.; Huang, L.B. Metal uptake and organic acid exudation of native Acacia species in mine tailings. Aust. J. Bot. 2017, 65, 357–367. [Google Scholar] [CrossRef]
  60. Jia, H.; Hou, D.Y.; Dai, Y.; Lu, H.L.; Yan, C.L. Effects of root exudates on the mobility of pyrene in mangrove sediment water system. Catena 2018, 162, 396–401. [Google Scholar] [CrossRef]
  61. Wang, G.D.; Li, Q.J.; Luo, B.; Chen, X.Y. Ex planta phytoremediation of trichlorophenol and phenolic allelochemicals via an engineered secretory laccase. Nat. Biotechnol. 2004, 22, 893–897. [Google Scholar] [CrossRef] [PubMed]
  62. Pilon-Smits, E. Phytoremediation. In Annual Review of Plant Biology; Annual Reviews: Palo Alto, CA, USA, 2005; Volume 56, pp. 15–39. [Google Scholar]
  63. Wu, H.L.; Wang, X.Z.; He, X.J.; Zhang, S.B.; Liang, R.B.; Shen, J. Effects of root exudates on denitrifier gene abundance, community structure and activity in a micro-polluted constructed wetland. Sci. Total Environ. 2017, 598, 697–703. [Google Scholar] [CrossRef] [PubMed]
  64. Anderson, T.A.; Guthrie, E.A.; Walton, B.T. Bioremediation in the Rhizosphere. Environ. Sci. Technol. 1993, 27, 2630–2636. [Google Scholar] [CrossRef]
  65. Liu, J.H.; Wang, S.N.; Xie, H.J.; Hu, Z.; Zhang, J. Influence of Artificial Root Exudates on Triclosan Removal in Soil under Aerobic and Anaerobic Conditions. Clean-Soil Air Water 2018, 46, 7. [Google Scholar] [CrossRef]
  66. Rosendahl, I.; Siemens, J.; Groeneweg, J.; Linzbach, E.; Laabs, V.; Herrmann, C.; Vereecken, H.; Amelung, W. Dissipation and Sequestration of the Veterinary Antibiotic Sulfadiazine and Its Metabolites under Field Conditions. Environ. Sci. Technol. 2011, 45, 5216–5222. [Google Scholar] [CrossRef] [PubMed]
  67. Gerhardt, K.E.; Huang, X.D.; Glick, B.R.; Greenberg, B.M. Phytoremediation and rhizoremediation of organic soil contaminants: Potential and challenges. Plant Sci. 2009, 176, 20–30. [Google Scholar] [CrossRef]
  68. LeFevre, G.H.; Hozalski, R.M.; Novak, P.J. The role of biodegradation in limiting the accumulation of petroleum hydrocarbons in raingarden soils. Water Res. 2012, 46, 6753–6762. [Google Scholar] [CrossRef] [PubMed]
  69. Blecken, G.T.; Zinger, Y.; Deletic, A.; Fletcher, T.D.; Viklander, M. Impact of a submerged zone and a carbon source on heavy metal removal in stormwater biofilters. Ecol. Eng. 2009, 35, 769–778. [Google Scholar] [CrossRef]
Figure 1. Diagram showing nine total biofilter mesocosms, of which six were planted with C. praegracilis and three were nonvegetated. A monitoring well and an effluent pipe with an outlet control were installed in each mesocosm.
Water 10 01605 g001
Figure 2. Timeline depicting biofilter mesocosm construction, initial flush (t = −7 days), three weekly storm events (t = 0, 7, 14 days), and extended monitoring period (t = 28, 35, 42 days). Daily monitoring occurred from t = −7–21 days, after which addition monitoring occurred on t = 28, 35, 42 days.
Water 10 01605 g002
Figure 3. Log plot of BT concentrations in storm water influent (blue) and effluent during the three storm events for the vegetated (green) and nonvegetated (red) biofilters. Error bars represent one standard deviation (n = 6). The difference between vegetated and nonvegetated effluent is statistically significant (p < 0.01, repeated measures ANOVA with Tukey HSD).
Water 10 01605 g003
Figure 4. Mean concentration of BT (a) and concentration of GBT (b) in biofilter mesocosm geomedia (<425 μm fraction) over the course of the study period in the vegetated biofilters (green) and nonvegetated biofilters (red). Storm events occurred on days 0, 7, and 14. Error bars represent one standard deviation (n = 9). Linear regressions (dashed lines) are plotted with equation of line of best fit and r-squared values for soil BT concentrations in the vegetated (green) and nonvegetated (red) mesocosms during the storm events (t = 0–21 days) and extended monitoring period (t = 21–42 days). Spatial distribution of BT concentrations in the vegetated (c) and nonvegetated (d) biofilter mesocosms and GBT in the vegetated biofilter mesocosms (e). Values reflect the percent difference in concentration of each sample from the mean concentration (n = 9) for the respective sampling period based on the sample’s location in the mesocosm. Nine locations were sampled once during each time point. No significant GBT concentrations were observed in the nonvegetated mesocosms, so data are not shown. A fully screened monitoring well was located in position (4,4).
Water 10 01605 g004
Figure 5. Mean concentration of BT in biofilter mesocosm pore water over the course of the study period (42 days) in the vegetated biofilters (green), nonvegetated biofilters (red), and control biofilters (blue). Storm events occurred on days 0, 7, 14. Error bars represent one standard deviation (n = 3).
Water 10 01605 g005
Figure 6. Mean concentration of BT in C. praegracilis leaf (a) and root (b) tissue in vegetated biofilter mesocosms exposed to BT (green) and control (blue) biofilter mesocosms. Mean concentration of GBT, in BT equivalents, in C. praegracilis leaf (c) and root (d) tissue in vegetated biofilter mesocosms exposed to BT (green) and control (blue) biofilter mesocosms. Storm events occurred on days 0, 7, and 14. Error bars represent one standard deviation (n = 3). Note that tissue samples for days 14, 15, and 16 were visually contaminated with mold and therefore omitted.
Water 10 01605 g006
Figure 7. Plot showing the mass distribution of BT (solid fill) and BT metabolite GBT (hatched fill) detected in vegetated and nonvegetated biofilter mesocosms after the storm events (a) and during the extended monitoring period (b). Metabolite GBT mass is reported in percent BT mass equivalents. Note the break in the y-axis.
Water 10 01605 g007
Figure 8. (a) Mass balance of BT and metabolite GBT in the vegetated (green) and nonvegetated (red) mesocosms over the period of extended monitoring (t = 21–42 days). Percent BT missing is calculated based off the total BT and GBT detected in the mesocosms and the expected BT based off the background concentrations of BT and the total mass of BT added during the storm events. (b) Linear regression of the percent BT missing is plotted for the vegetated (green) and nonvegetated (red) biofilter mesocosms. Equations of best fit and R-squared values are provided. Error bars represent one standard deviation (n = 3).
Water 10 01605 g008

