Riverbed Migrations in Western Taiwan under Climate Change


1
National Science and Technology Center for Disaster Reduction, No. 200, Sec. 3, Beixin Road, Xindian District, New Taipei City 23143, Taiwan
2
Center for Spatial Information Science, The University of Tokyo, 5-1-5 Kashiwanoha Kashiwa, Chiba 277-8568, Japan
*
Author to whom correspondence should be addressed.
Water 2018, 10(11), 1631; https://doi.org/10.3390/w10111631
Submission received: 2 November 2018
/
Revised: 7 November 2018
/
Accepted: 8 November 2018
/
Published: 12 November 2018
(This article belongs to the Special Issue Modeling and Practice of Erosion and Sediment Transport under Change)
Abstract
:In recent years, extreme weather phenomena have occurred worldwide, resulting in many catastrophic disasters. Under the impact of climate change, the frequency of extreme rainfall events in Taiwan will increase, according to a report on climate change in Taiwan. This study analyzed riverbed migrations, such as degradation and aggradation, caused by extreme rainfall events under climate change for the Choshui River, Taiwan. We used the CCHE1D model to simulate changes in flow discharge and riverbed caused by typhoon events for the base period (1979–2003) and the end of the 21st century (2075–2099) according to the climate change scenario of representative concentration pathways 8.5 (RCP8.5) and dynamical downscaling of rainfall data in Taiwan. According to the results on flow discharge, at the end of the 21st century, the average peak flow during extreme rainfall events will increase by 20% relative to the base period, but the time required to reach the peak will be 8 h shorter than that in the base period. In terms of the results of degradation and aggradation of the riverbed, at the end of the 21st century, the amount of aggradation will increase by 33% over that of the base period. In the future, upstream sediment will be blocked by the Chichi weir, increasing the severity of scouring downstream. In addition, due to the increased peak flow discharge in the future, the scouring of the pier may be more serious than it is currently. More detailed 2D or 3D hydrological models are necessary in future works, which could adequately address the erosive phenomena created by bridge piers. Our results indicate that not only will flood disasters occur within a shorter time duration, but the catchment will also face more severe degradation and aggradation in the future.
Keywords:
aggradation; CCHE1D; climate change; degradation; dynamical downscaling; flow discharge; migration; riverbed; sediment1. Introduction
Global climate change has led to changes in the spatial and temporal distribution of precipitation, evaporation, and runoff, which in turn contribute to environmental issues such as frequent droughts, increased flooding, waterlogging disasters, and aggravated soil erosion [1]. At the present time, one of the main problems in soil erosion research around the world is to assess the impact of climate change on sediment cycling [2]. It is expected that the increase in global precipitation will affect the extent, frequency, and magnitude of soil erosion and sediment redistribution [3,4]. This could lead to more severe hydrological cycles [5] and increased rainfall erosivity [6]. Nevertheless, contrasting impacts have recently been found in different parts of the world. Zhao et al. [7] observed that owing to anthropogenic causes, the sediment export from the Loess Plateau of China has increased significantly, but with the recent climate change, stream flow and sediment load have decreased enormously. Foster et al. [8] analyzed changes in sediment transport for the Karoo uplands, South Africa, and found that the sediment yield has generally increased over the past decades, which is related to factors such as the increase in the frequency of high magnitude rainfall events.
Numerical models have been employed in engineering studies to predict the flow discharge and riverbed migrations along rivers. Several 1-D models have been proposed, and each model has its advantages and limitations [9]. The use of these models requires the proper simulation of hydraulic conditions [10]. The development of 1-D models is mainly focused on numerical aspects of the advection–dispersion equation [11,12,13] and exchange with dead zones [14,15,16]. Some 1-D models, such as the SIMCAT [17], QUAL2KW [18], and Multiphysics software COMSOL [19], are limited to steady flow conditions, while other models, such as the OTIS [20], CCHE1D [21], MIKE 11 [22], SD model [23], HEC-RAS [24], and ADISTS [25], can simulate unsteady flows and solute transport. In general, the validation testing focuses on theoretical situations or simplified river geometries in limited spatial and temporal scales [26].
Climate change is an important issue that has attracted growing attention in recent years. The report of the International Panel on Climate Change (IPCC) noted that rises in temperature and sea level are ongoing and that appropriate adaptations to reduce disaster risk are necessary [1]. In the current changing environment, both the probability of the occurrence of a strong typhoon and the rainfall intensity during a typhoon event will increase [27,28,29]. Many studies have explored the potential effects of different climate change scenarios on runoff and sediment yield in catchments [30,31,32,33,34]. In addition, there are also several studies focused on the impact of a changing climate on fluvial hydro-morphodynamics, as well as on the uncertainties related to future scenarios [35,36,37,38,39,40,41]. According to the Taiwan climate change report, the frequency of extreme rainfall events has also increased in the past 20 years in Taiwan [42]. Under the impact of climate change, extreme rainfall events will become more frequent, and riverbed migrations, such as degradation and aggradation, will become more serious, possibly affecting existing constructions and land use, and even human life and property. Therefore, the objectives of this study were to calibrate and validate a general one-dimensional channel network model for the Choshui River in western Taiwan and to assess changes in flow discharge and riverbed caused by typhoon events for the base period (1979–2003) and the end of the 21st century (2075–2099) according to the climate change scenario and dynamical downscaling of rainfall data in Taiwan.
2. Study Area
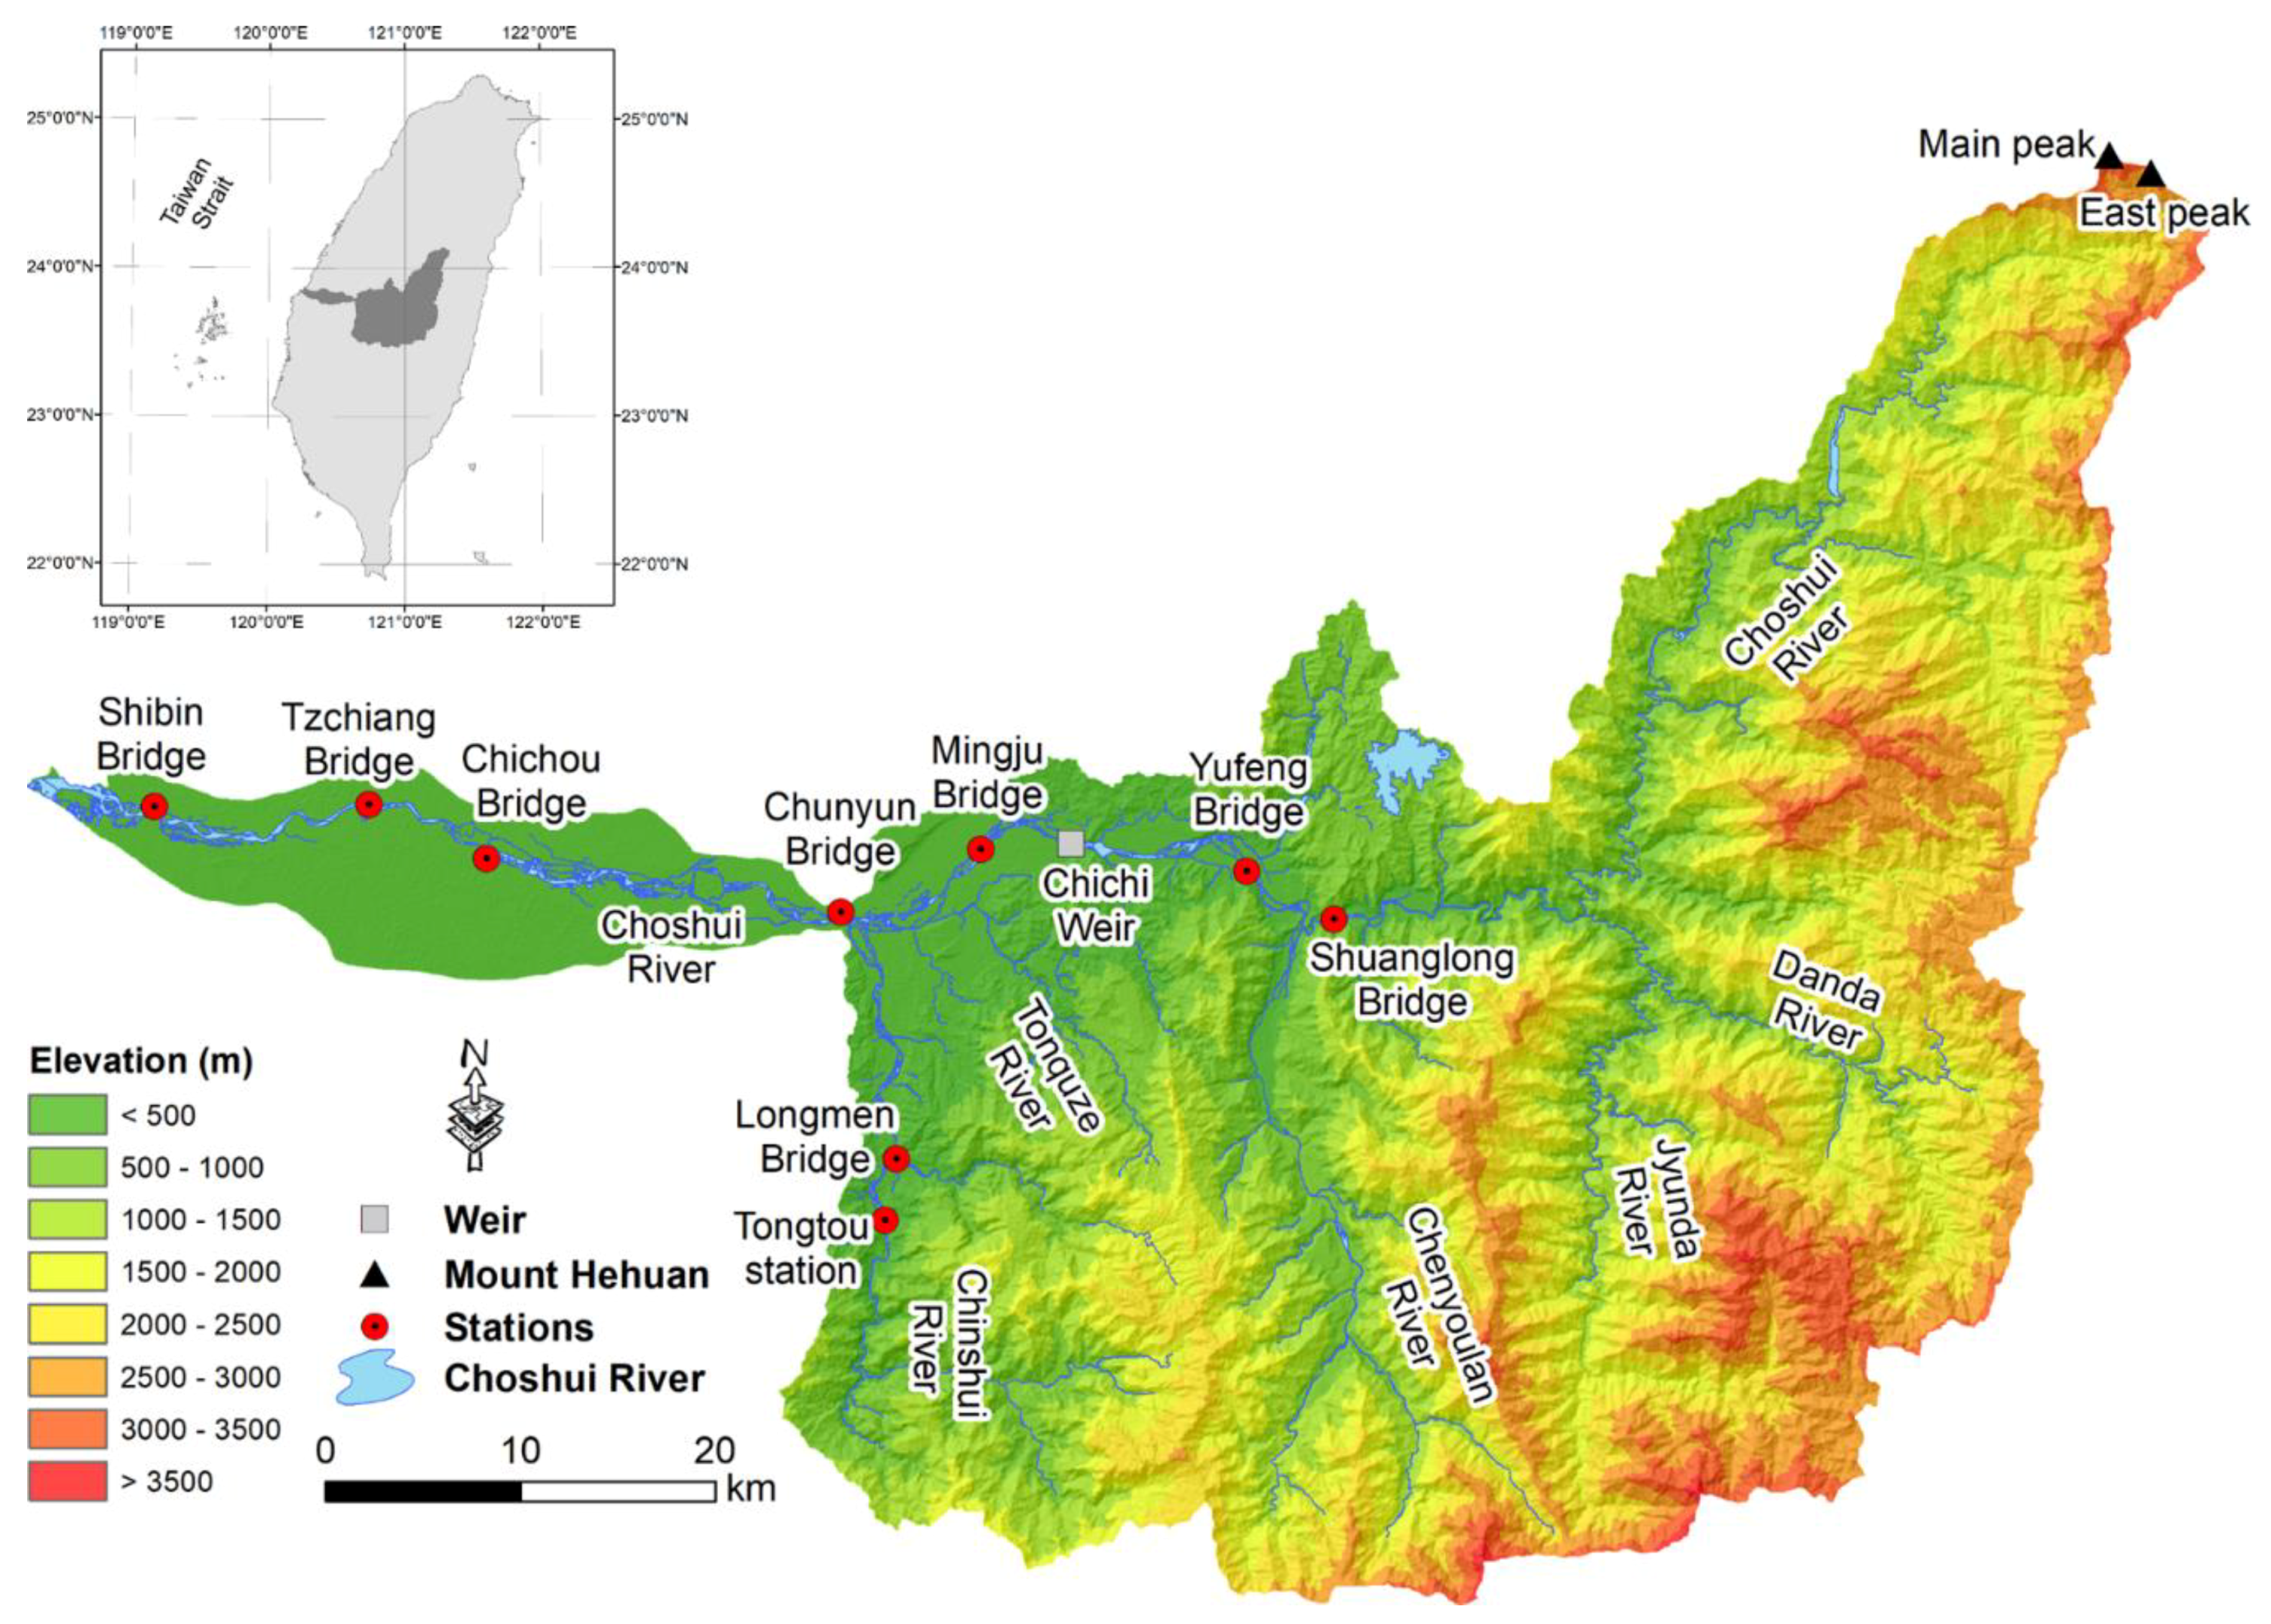
The Choshui River, located in western Taiwan, originates from the saddle between the main peak and east peak of Mount Hehuan. It flows through Nantou County, Chiayi County, Yunlin County, and Changhua County before reaching the Taiwan Strait. Having a mainstream about 187 km long, it is the longest river in Taiwan, and it has an average slope of 0.53%. The main tributaries of Choshui River are the Danda River, Jyunda River, Chenyoulan River, Tonpuze River, and Chingshui River. The Choshui River catchment covers an area of about 3157 km2, which is the second largest catchment area in Taiwan. The topography slopes downward from east to west and the area of elevation >1000 m accounts for 64% of the catchment area. The slope decreases from east to west, and the area of slope >29% accounts for 62.5%, with an average slope of 54.5% (Figure 1).
The Choshui River catchment is characterized by friable Miocene and Pliocene sedimentary, metasedimentary, and low-grade metamorphic rocks and Quaternary alluvium deposits [43]. The soil cover in this area is mainly composed of colluvial soil, alluvial soil, and lithosol, with some yellow soil and laterite [44]. The Choshui River catchment can be divided into upstream and downstream areas at the Chunyun Bridge. The upstream area is well-covered with vegetation; the total area of natural forest and artificial forest is about 470 km2, accounting for 92% of all land use. In the downstream area, agriculture occupies 1530 km2, accounting for 85.5% of the land use, and the construction area is about 56 km2, accounting for 3.14%.
The annual average rainfall in the Choshui River catchment is 2200 mm, but the spatial distribution of rainfall varies greatly. The annual rainfall in the upstream area can average 2500 mm, in contrast to 1100 mm in the downstream area and only 830 mm in the coastal area. The flow discharge of the Choshui River varies enormously between wet and dry seasons. About 80% of the total flow discharge is discharged during the wet season (May–October) [45]. According to [46], from the convergence of the Choshui River and the Chingshui River to the estuary, the flow discharges of the five-, 10-, 50-, and 100-year recurrence intervals are 0.65 × 10⁴, 1.11 × 10⁴, 1.44 × 10⁴, 2.27 × 10⁴, and 2.66 × 10⁴ m3/s, respectively.
3. Data and Methods
3.1. CCHE1D Model
The National Center for Computational Hydroscience and Engineering of the University of Mississippi has developed a general one-dimensional channel network model that can simulate steady and unsteady flows and sedimentation processes in dendritic channel networks, including fractional sediment transport, riverbed aggradation and degradation, riverbed materials, bank erosion, and the resulting channel morphologic changes [21], which is called the CCHE1D model. The CCHE1D model solves the Saint–Venant equation and applies the implicit Preissmann four-point finite-difference and discrete-governing equation. A linear iterative method was developed in the model for the discrete-governing equation, which is solved by the double-sweep method. The one-dimensional hydraulic governing equations are as follows [47,48]:
Continuity equation:
Momentum equation:
where x and t are the spatial (m) and temporal (s) axes, A is the flow area (m2), Q is the flow discharge (m3/s), q is the side discharge per unit channel length (m2/s), h is the water surface elevation (m), Sf and S0 are the friction slope and riverbed slope (m/m), β is the correction factor due to the non-uniformity of velocity distribution in the cross section, and g is the gravitational acceleration (m/s2).
In addition, when the inertial force is small, the diffusion wave model can be used for the hydraulic routing. In general, when the Froude number is less than 0.5, the first two items on the left side of Equation (2) can be ignored. Then the momentum equation can be rewritten into the diffusion wave model, and the equation is as follows:
Equation (3) can still be used when the Froude number is larger than 0.5 if the simulation case is close to a uniform flow, because the first two items on the left side of Equation (2) will be sufficiently small to be ignored.
In terms of the sediment transport model, the CCHE1D model uses the non-equilibrium sediment transport concept to calculate the non-uniform sediment transport in the river. The equation for the non-equilibrium and non-uniform sediment transport control of total load is expressed as follows:
where Ctk is the section-averaged sediment concentration of size class k (kg/m3), Qtk is the actual sediment transport rate (kg/s), Qt*k is the sediment transport capacity or the so-called equilibrium transport rate (kg/s), L is the non-equilibrium adaptation length of sediment transport (m), and qlk is the side inflow or outflow sediment discharge from bank boundaries or tributary streams per unit channel length (kg/m/s).
The CCHE1D model offers the following four sediment discharge formulas for calculation: (1) SEDTRA module [49]; (2) Wu et al. formula [50]; (3) Modified Ackers and White’s 1973 formula [51]; and (4) Modified Engelund and Hansen’s 1967 formula [47]. In this study, we used the Wu et al. formula for our analyses because it is the most suitable formula for Taiwan, according to previous studies [52,53].
3.2. Parameter Setting for the Model
This study used the measured profile data of the Choshui River (2004, 2008, and 2012), provided by the 4th River Management Office of Taiwan, to build the model and set parameters. We used the measured profile data of 2004 as the initial topography for flood event simulations after 2004. Then the measured profile data of 2008 were used for calibrating the model, and those of 2012 were used for validation. We simulated the mainstream of the Choshui River for about 76 km from the Shuanglong Bridge (5 km upstream of the Yufeng Bridge) to the estuary. The tributary of the Choshui River, the Chingshui River, for about 13 km from the Longmen Bridge to the convergence with the mainstream was also simulated, and the results were used as the input data for the Choshui River.
This study used flow discharge during the wet seasons from 2004 to 2007 as the model calibration and continued to use flow discharge during the wet seasons from 2008 to 2011 as the validation. We used the change of time series in flow discharge during the period of the wet season for simulations. Flow discharge observed at the Yufeng Bridge station was used as the upstream boundary condition of the Choshui River, while flow discharge observed at the Tongtou station (2.5 km upstream of the Longmen Bridge) was used as the upstream boundary condition of the Chingshui River. However, the Tongtou station was abandoned on 31 August 2009, so for points later than that, we used the flow discharge observed at the Longmen Bridge station (Figure 1). For the downstream, the open boundary method was applied for simulations.
Data of the grain size distribution of the riverbed of the Choshui River were measured in 2007, while those of the Chingshui River were measured in 2008 [46,54]. Manning’s roughness coefficients for a riverbed of 0.029–0.044 were used, as recommended in government reports [46,54]. We applied the rating curves of flow discharge and sediment discharge to calculate the input of sediment, and also considered wash load in the calculations (Figure 2). Correlation coefficients (r2) of rating curves for the Choshui River and the Chingshui River are 0.58 and 0.47 respectively. Although the r2 is not very high, this study is mainly focused on riverbed migrations caused by heavy rainfall, which show a better correlation between flow discharge and sediment concentration when flow discharge is high (Figure 2). For the other general parameters for sediment transport simulation, this study set the suspended load adaptation coefficient (α) as 1.0, bed load adaptation length (L) as 1000 m, and mixing layer as 2.0 m. According to [46], nine groups of representative particle sizes were selected, ranging from 0.001 to 1000 m, and a porosity of 0.4 was used. Yeh et al. [50] have made a sensitivity analysis on parameters of CCHE1D model in the Choshui River and found that the sensitivity of most parameters is not high. Only the thickness of mixing layer is sensitive to the degradation and aggradation of riverbed. This study followed the model parameters suggested by them for the parameter setting to get the most accurate results.
3.3. Assessing Degradation and Aggradation Conditions of Rivers under Climate Change
The resolution of the general circulation model (GCM) used for climate estimation and simulation is usually 100–200 km. Consequently, it is difficult to identify the structure of a typhoon with a radius of less than several hundred kilometers. Owing to the low spatial resolution of the model, it is impossible to reasonably simulate the extreme weather system with a physical model, and it is impossible to carry out extreme weather estimation under climate change [55,56]. Therefore, this study used a climate projection simulated from the high-resolution (approximately 20 km horizontal resolution) atmospheric general circulation model (AGCM) developed by the Meteorological Research Institute (MRI) under the Japan Meteorological Agency (JMA) [57]. The low boundary drive by ensemble mean sea surface temperature (SST) of the climate change scenario of representative concentration pathways 8.5 (RCP8.5) in Coupled Model Intercomparison Project Phase 5 (CMIP5) [58] is called MRI-AGCM. This model has been validated for the simulation of typhoon generation [59,60]. However, the 20-km horizontal resolution still could not necessarily reflect the precipitation intensity caused by topographical effects in Taiwan. Therefore, the MRI-AGCM data were dynamically downscaled using the Weather Research and Forecasting Model (WRF), proposed by the US National Center for Atmospheric Research (NCAR), to obtain more realistic rainfall data for Taiwan with spatial and temporal resolutions of 5 km per hour.
Based on the downscaled rainfall data, there were 87 typhoons during the base period (1979–2003) and will be 43 typhoons in the last quarter of the 21st century. We selected eight typhoons in the base period and four typhoons at the end of the century, which accounted for the top 10% of the total rainfall for the Choshui River catchment among all typhoons in the two periods, to discuss the impact of climate change on riverbed migrations.
4. Results and Discussion
4.1. Model Calibration and Validation
This study used flow discharge during the wet seasons from 2004 to 2007 as the model calibration and continued to use flow discharge during the wet seasons from 2008 to 2011 as the validation. The total times for both periods of calibration and validation were 18,790 and 16,590 h, respectively. Figure 3 shows the comparison result between calibration and validation of the measured and simulated flow discharges at the Chunyun Bridge. We can find that the simulated peak flow discharge during typhoons is underestimated both in calibration and validation. Even so, trends of simulated and measured flow discharge are similar. The maximum percent errors of peak discharge (EQp) are −1.98% in the calibration and −9.50% in the validation. Overall, the coefficient of efficiency (CE) of the CCHE1D model in the calibration and validation are 0.85 and 0.83, respectively, indicating that the CCHE1D model can accurately simulate the rise and decline of peak discharge; therefore, we can use this model for simulating sediment transport under climate change scenarios.
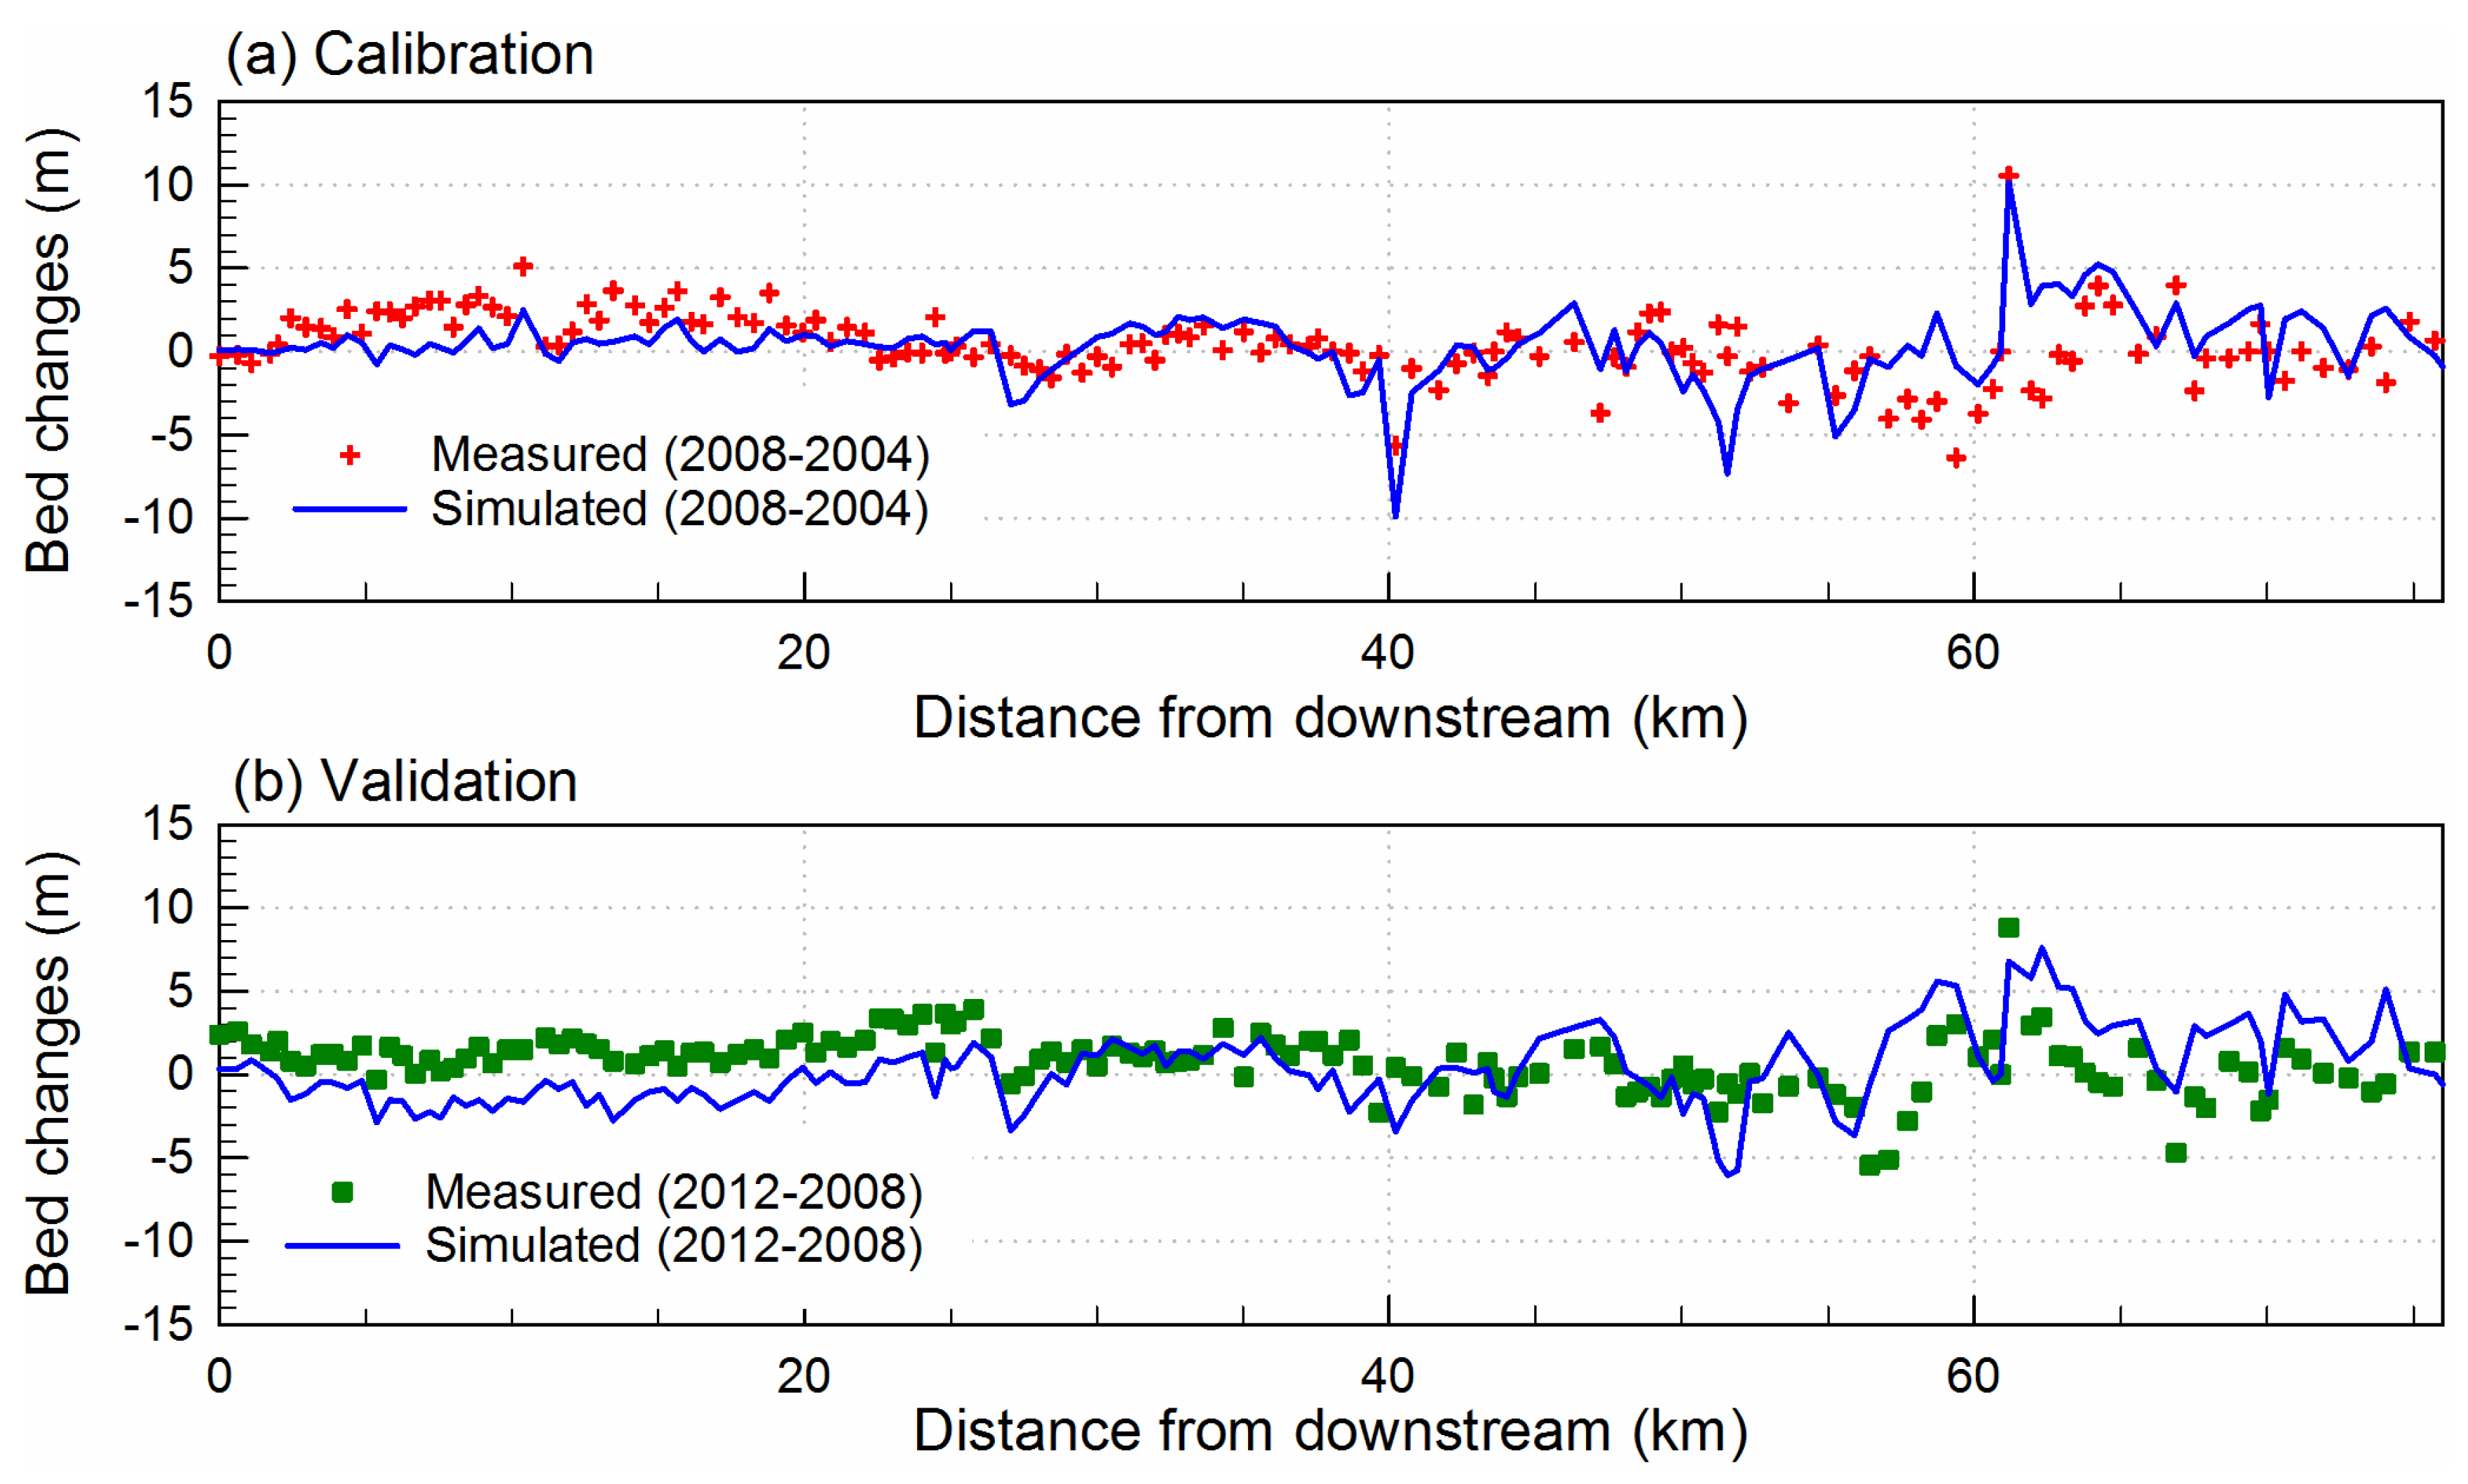
In terms of degradation and aggradation in the river, this study used the measured profile data of 2004 as the initial topography for flood event simulations after 2004. Then the measured profile data of 2008 were used for calibrating the model and the measured profile data of 2012 were used for validation. Figure 4a shows the calibration result of the riverbed changes during 2004–2008 using the lowest point of each section along the river. The CCHE1D model can reasonably reproduce the process of degradation and aggradation in the river. Figure 4b shows the validation results of the riverbed changes for 2008–2012. It can be found that if this set of parameters is used, although the aggradation in downstream was underestimated, the riverbed changes in degradation and aggradation for most parts could be well validated. This represents that the CCHE1D model can truly grasp characteristics of degradation and aggradation in the Choshui River, so this model can also be used to simulate the degradation and aggradation in the river under climate change scenarios.
4.2. Peak Flow Discharge during Typhoons under Climate Change
Based on the downscaled rainfall data, there were 87 typhoons during the base period (1979–2003) and will be 43 typhoons in the last quarter of the 21st century (2075–2099). Table 1 shows the simulation results of peak flow discharge of each of the top 20 typhoons during the two periods, accounting for the top 20 of the total rainfall amounts for the Choshui River catchment among all typhoons, at the Chunyun Bridge. According to the government report [44], the peak flow discharge of the 100-year recurrence interval (Q100) in the Choshui River before the Chingshui River merges with it is 25,394 m3/s, which was used as the basis for the design of levees. We can find from the simulation results that the peak flow discharge during two typhoon events in the base period is greater than Q100, while the peak flow discharge during three typhoon events at the end of the 21st century is greater than Q100. This result indicates that, relative to the base period, the Choshui River is more likely to have a flood overflow at the end of the 21st century.
In addition, the peak flow discharge of the two-year recurrence interval (Q2) in the Choshui River before the Chingshui River merge point is 5829 m3/s [44]. The peak flow discharge caused by two typhoon events in the base period is less than Q2, and the peak flow discharge of six typhoon events at the end of the 21st century is less than Q2. This result suggests that the flood disasters caused by extreme rainfall events will be less frequent at the end of the 21st century than in the base period. We could assess from the above results that the sediment transport in the Choshui River was more frequent in the base period than it will be at the end of the 21st century; however, at the end of the 21st century, the severity of sediment migration will be more obvious than that in the base period.
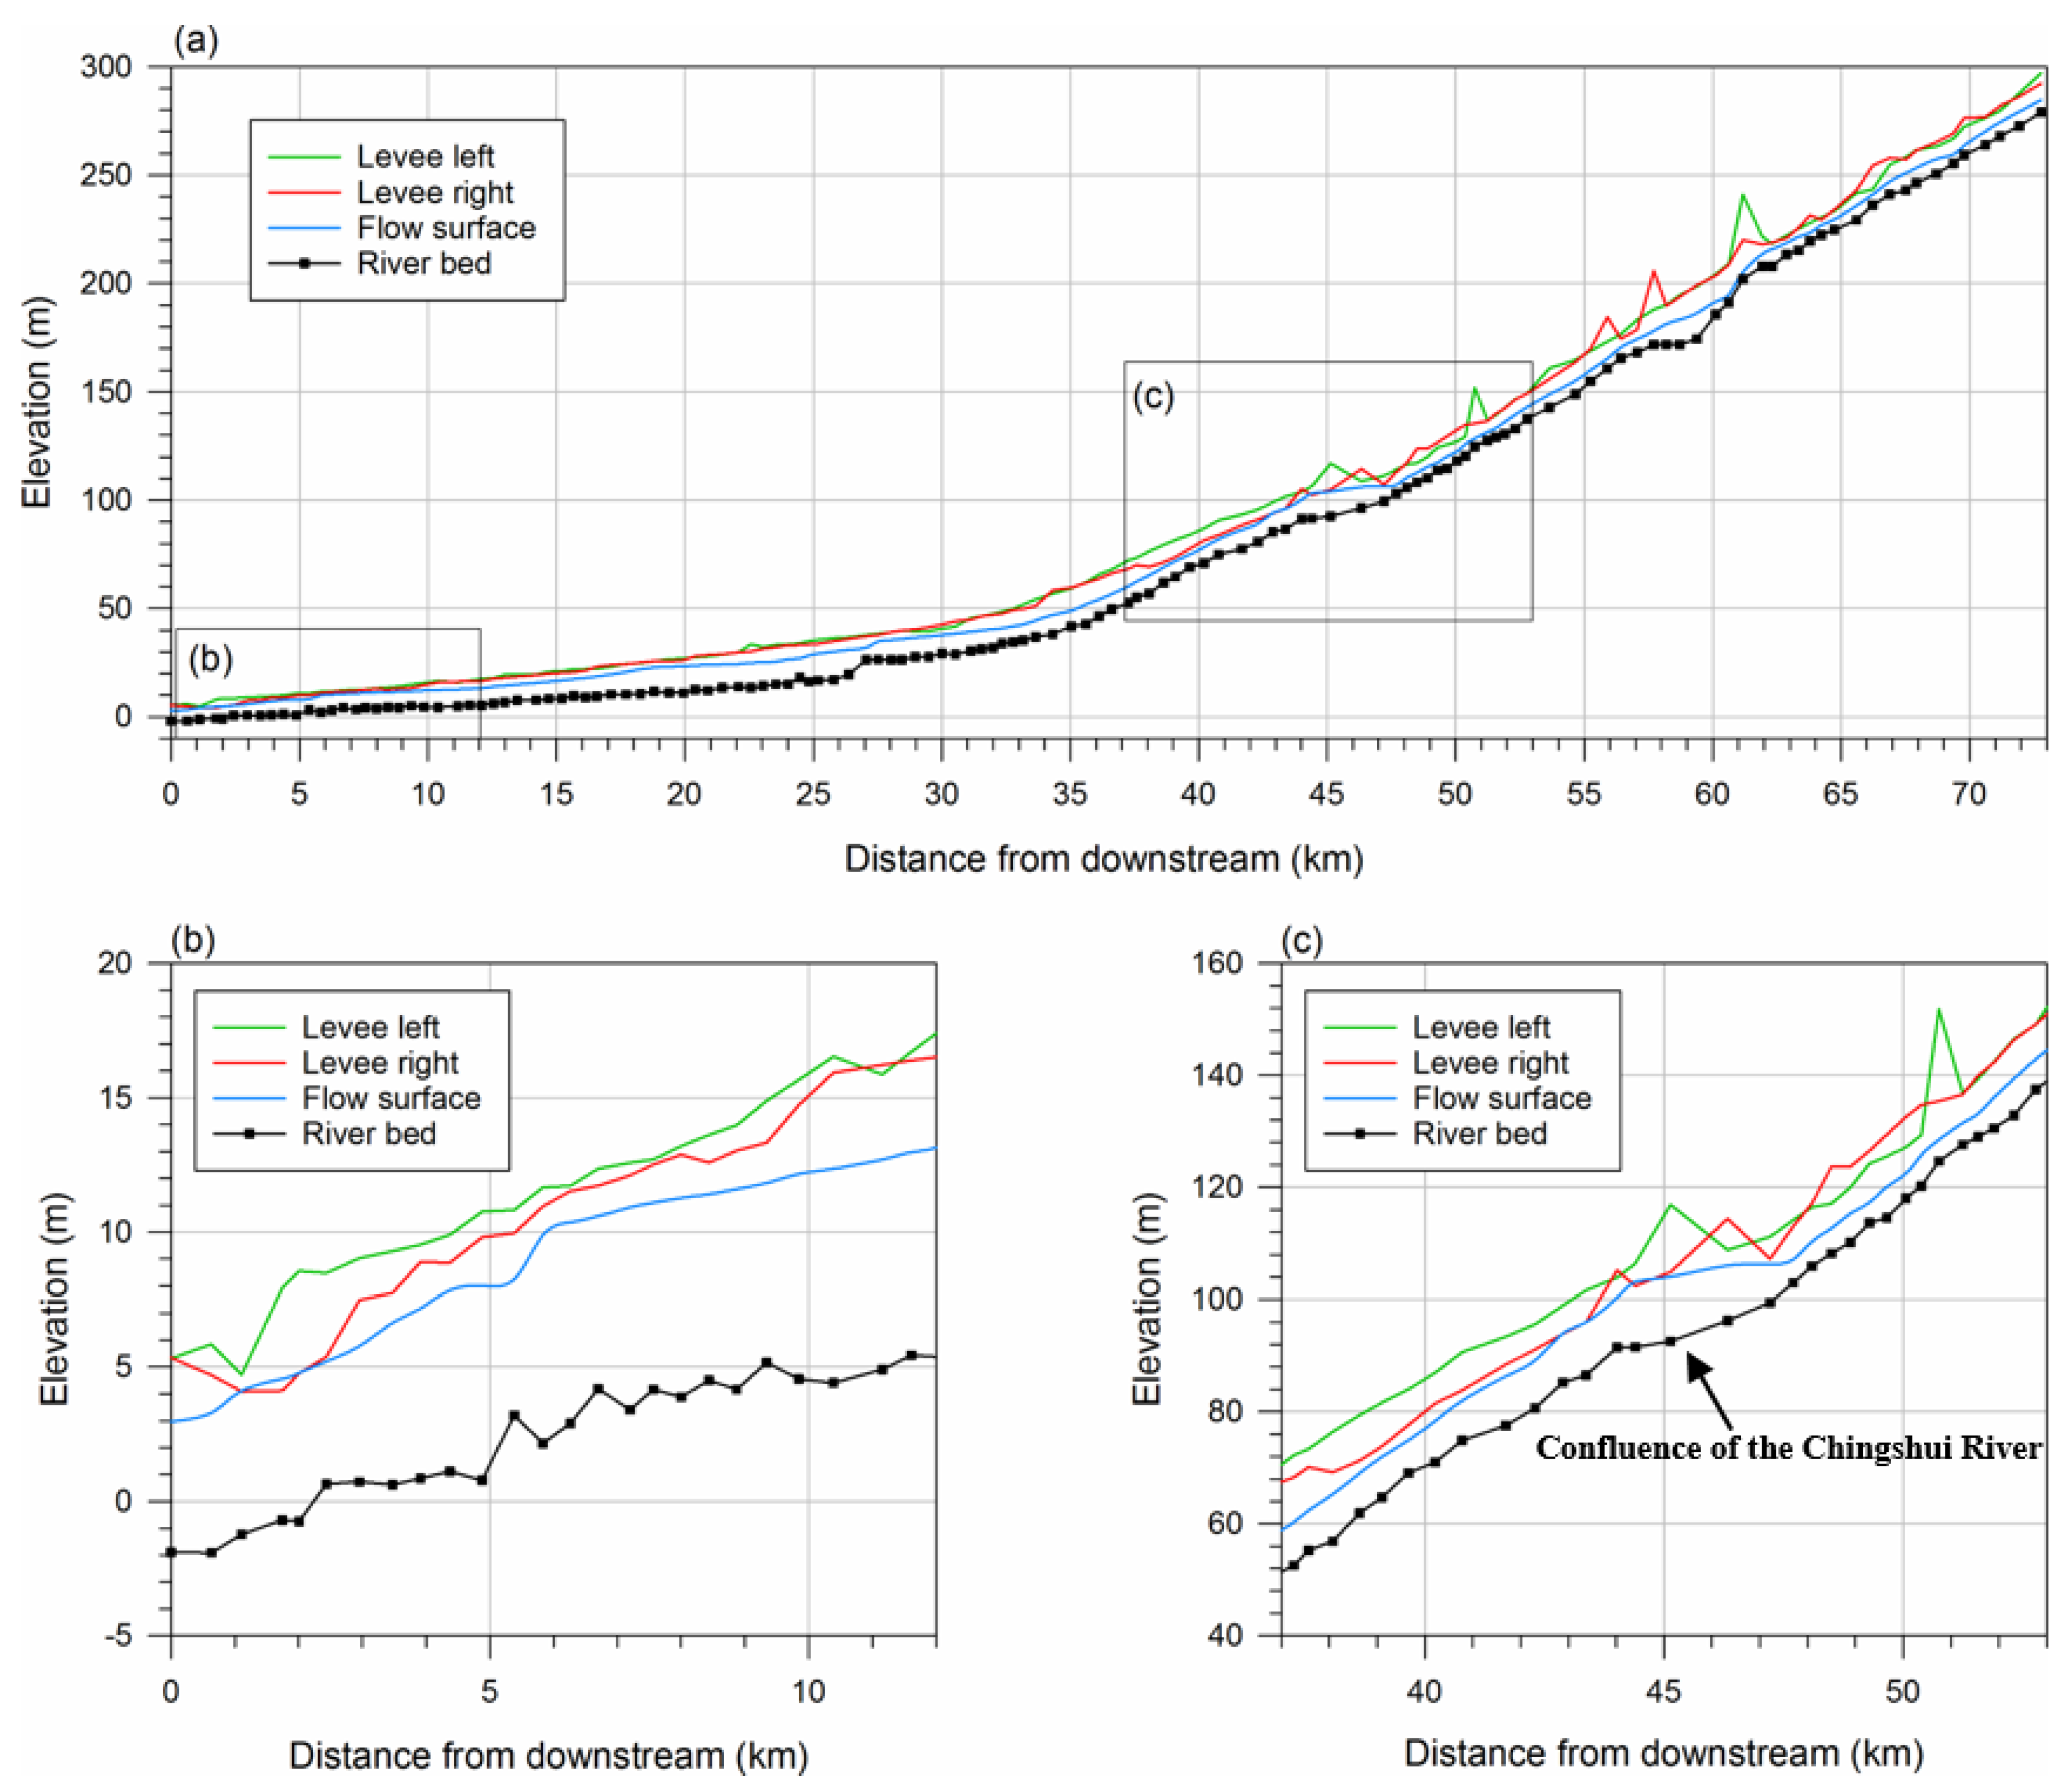
Here we selected the top 10% typhoons during the base period (1979–2003; n = 8) and during the end of the 21st century (2075–2099; n = 4), respectively, according to the total rainfall for the Choshui River catchment, for the following discussion on peak flow discharge along the whole reach of the Choshui River. The average peak flow discharges at the Yufeng Bridge in the base period and at the end of the 21st century are 17,443 and 20,916 m3/s, respectively. On average, it takes about 48 and 40 h to reach the peak values. We can notice that the average peak flow caused by extreme rainfall events at the end of the 21st century will increase by 20% from the base period, but the time required to reach the peak at the end of the 21st century will be 8 h shorter than that in the base period. It means that we will face greater flood events and need more urgent response time in the future. Figure 5a shows the simulation result of the most severe flood event at the end of the 21st century (peak flow discharge = 29,513 m3/s at the Chunyun Bridge). During the most severe flood event at the end of the 21st century, the locations where the overflow may occur are the estuary and the confluence of the Choshui River and Chingshui River (Figure 5b,c). Generally, in the case of normal energy transfer, energy transfer from upstream to downstream will be affected by topography and other factors, and energy will be lost, resulting in a lower water level downstream than upstream. The above water level is the result of quantitative simulations; however, the real situation is a dynamic flow. Therefore, the real downstream water level may be lower than the simulation result of the quantitative flow owing to energy losses, but it is still necessary to pay attention to flood control safety.
4.3. Changes in Degradation and Aggradation of the Riverbed under Climate Change
Changes in degradation and aggradation of the riverbed of the Choshui River under climate change scenarios are shown in Figure 6. The Choshui River can be divided into three simulation zones according to the artificial weir and the intersection of the main stream and tributary: (I) the estuary to the Chunyun Bridge; (II) the Chunyun Bridge to the Chichi weir; (III) the Chichi weir to the Shuanglong Bridge. It can be found from the results that zone I presents a slight aggradation from the base period to the end of the 21st century; however, the problem of pier scouring still requires attention. Zone II is located at lower reaches of the Chichi weir, so the riverbed suffers from strong changes in degradation and aggradation. At the end of the 21st century, the degree of degradation will be more serious than that in the base period. Because of the effect of the Chichi weir, zone III has obvious sediment accumulation in the upper part of the weir, resulting in the aggradation of the riverbed in the area. However, the location of the Yufeng Bridge shows clear degradation. Overall, the simulation results show that the entire area of simulated reaches is aggraded and that the amount of aggradation increases by about 33% at the end of the 21st century as compared with the base period.
Li et al. [61] pointed out that the landslide volume in the Choshui River catchment will increase by 14% at the end of the 21st century, relative to that of the base period. This should also be reflected in the results of degradation and aggradation of the riverbed. Landslides in the Choshui River catchment will increase in the future, and landslide materials will accumulate in rivers. On the other hand, the increase of peak flow discharge in the future will severely flush the surrounding structures and downstream areas, which may cause crises such as damaged bridges and dam dumping.
Although degradation and aggradation of the riverbed are natural phenomena of a river, under the effect of climate change, the rainfall pattern will change to short duration-high intensity rainfall in the future [27,28,29]. This change will result in more serious degradation and aggradation of the riverbed in a catchment than occurs in the present situation. It could be imagined that not only will the response time during flood events be shortened, but also more serious riverbed migrations will occur in the future.
5. Conclusions
This study used the flow discharge during the wet seasons from 2004 to 2012 for calibration and validation of the CCHE1D model, a general one-dimensional channel network model that can simulate steady and unsteady flows and sedimentation processes in dendritic channel networks, along the Choshui River in western Taiwan. The CCHE1D model was used for simulating changes in flow discharge and riverbed caused by typhoon events for the base period (1979–2003) and the end of the 21st century (2075–2099). According to the climate change scenario of RCP8.5 and dynamically downscaled rainfall data in Taiwan, from the base period to the end of the 21st century, average peak flow caused by extreme rainfall events will increase by about 20%, but the time required to reach the peak at the end of the 21st century will be 8 h shorter than that in the base period. For the same time period, the amount of aggradation along the Choshui River will increase by about 33% from the base period to the end of the 21st century. Upper and lower parts of the Chichi weir will show large changes in aggradation and degradation, respectively, and the pier may suffer from serious scouring owing to the increase in peak flow discharge in the future. Our results could provide useful information to related authorities for the decision making on plans of public construction and land use in a changing climate. In future works, it is essential to use 2D or 3D hydrological models to adequately address problems such as the erosive phenomena created by bridge piers.
Author Contributions
Y.-C.C. collected the data, performed the statistical and simulation analysis, and drafted the manuscript. C.-W.C. conceived of the study, participated in its design and coordination, and drafted the manuscript. H.-C.L. and Y.-M.C. participated in the design of the study and provided methods. All authors read and approved the final manuscript.
Funding
This research was supported by the Taiwan Climate Change Projection and Information Platform (TCCIP; MOST106-2621-M-865-001).
Acknowledgments
We would like to thank the theme C of the Program for Risk Information on Climate Change of Japan (SOUSEI-C) for providing the MRI-AGCM data.
Conflicts of Interest
The authors declare no conflict of interest.
References
- IPCC. Climate Change 2007: The Physical Science Basis. Summary for Policymakers; Contribution of working group I to the fourth assessment report; The Intergovernmental Panel on Climate Change: Geneva, Switzerland, 2007. [Google Scholar]
- Mullan, D.; Favis-Mortlock, D.; Fealy, R. Addressing key limitations associated with modelling soil erosion under the impacts of future climate change. Agric. Meteorol. 2012, 156, 18–30. [Google Scholar] [CrossRef] [Green Version]
- Peizhen, Z.; Molnar, P.; Downs, W.R. Increased sedimentation rates and grain sizes 2–4 Myr ago due to the influence of climate change on erosion rates. Nature 2001, 410, 891–897. [Google Scholar] [CrossRef] [PubMed]
- Pruski, F.F.; Nearing, M.A. Climate-induced changes in erosion during the 21st century for eight US locations. Water Resour. Res. 2002, 38. [Google Scholar] [CrossRef]
- Nearing, M.A.; Jetten, V.; Baffaut, C.; Cerdan, O.; Couturier, A.; Hernandez, M.; Le Bissonnais, Y.; Nichols, M.H.; Nunes, J.P.; Renschler, C.S.; et al. Modeling response of soil erosion and runoff to changes in precipitation and cover. Catena 2005, 61, 131–154. [Google Scholar] [CrossRef]
- Nearing, M.A.; Pruski, F.F.; O’Neill, M.R. Expected climate change impacts on soil erosion rates: A review. J. Soil Water Conserv. USA 2004, 59, 43–50. [Google Scholar]
- Zhao, G.; Mu, X.; Wen, Z.; Wang, F.; Gao, P. Soil erosion, conservation and eco-environment changes in the Loess Plateau of China. Land Degrad. Dev. 2013, 24, 499–510. [Google Scholar] [CrossRef]
- Foster, I.D.L.; Rowntree, K.M.; Boardman, J.; Mighall, T.M. Changing sediment yield and sediment dynamics in the Karoo uplands, South Africa; post-European impacts. Land Degrad. Dev. 2012, 23, 508–522. [Google Scholar] [CrossRef] [Green Version]
- Cox, B.A. A review of currently available in-stream water-quality models and their applicability for simulating dissolved oxygen in lowland rivers. Sci. Total. Environ. 2003, 314, 335–377. [Google Scholar] [CrossRef]
- Leibundgut, C.; Maloszewski, P.; Kuülls, C. Tracers in Hydrology; Wiley-Blackwell: Hoboken, NJ, USA, 2009. [Google Scholar]
- Russell, T.F.; Celia, M.A. An overview of research on Eulerian–Lagrangian Localised Adjoint Methods (ELLAM). Adv. Water Resour. 2002, 25, 1215–1231. [Google Scholar] [CrossRef]
- Rubio, A.D.; Zalts, A.; El Hasi, C.D. Numerical solution of the advection–reaction–diffusion equation at different scales. Environ. Model. Softw. 2008, 23, 90–95. [Google Scholar] [CrossRef]
- Shen, C.; Phanikumar, M.S. An efficient space-fractional dispersion approximation for stream solute transport modeling. Adv. Water Resour. 2009, 32, 1482–1494. [Google Scholar] [CrossRef]
- Bencala, K.E.; Walters, R.A. Simulation of solute transport in a mountain pool-and-riffle stream: A transient storage model. Water Resour. Res. 1983, 19, 718–724. [Google Scholar] [CrossRef]
- Wörman, A.; Packman, A.I.; Johansson, H.; Jonsson, K. Effect of flow-induced exchange in hyporheic zones on longitudinal transport of solutes in streams and rivers. Water Resour. Res. 2002, 38, 61. [Google Scholar] [CrossRef]
- Anderson, E.J.; Phanikumar, M.S. Surface storage dynamics in large rivers: Comparing three-dimensional particle transport, one-dimensional fractional derivative, and multirate transient storage models. Water Resour. Res. 2011, 47. [Google Scholar] [CrossRef] [Green Version]
- UK Environment Agency. SIMCAT 7.6: A Guide and Reference for Users; UK Environment Agency: Bristol, UK, 2001.
- Pelletier, G.J.; Chapra, C.S.; Tao, H. QUAL2Kw, A framework for modeling water quality in streams and rivers using a genetic algorithm for calibration. Environ. Model. Softw. 2006, 21, 419–425. [Google Scholar] [CrossRef]
- Ani, E.C.; Wallis, S.; Kraslawski, A.; Agachi, P.S. Development, calibration and evaluation of two mathematical models for pollutant transport in a small river. Environ. Model. Softw. 2009, 24, 1139–1152. [Google Scholar] [CrossRef]
- Runkel, R.L. One-Dimensional Transport with Inflow and Storage (OTIS): A Solute Transport Model for Streams and Rivers; Water-Resources Investigations Report; United States Geological Survey: Reston, VA, USA, 1998; 80p.
- Vieira, D.A.N. Integrated Modeling of Watershed and Channel Processes. Ph.D. Thesis, University of Mississippi, Oxford, MS, USA, 2004. [Google Scholar]
- Danish Hydraulic Institute (DHI). MIKE 11-A Modelling System for Rivers and Channels; Danish Hydraulic Institute: Horsholm, Denmark, 2007. [Google Scholar]
- Deng, Z.Q.; Jung, H.S. Scaling dispersion model for pollutant transport in rivers. Environ. Model. Softw. 2009, 24, 627–631. [Google Scholar] [CrossRef]
- US Army Corps of Engineers (USACE). HEC-RAS River Analysis System; User’s Manual—Version 4.1; USACE: Washington, DC, USA, 2010.
- Launay, M.; Le Coz, J.; Camenen, B.; Walter, C.; Angot, H.; Dramaisa, G.; Faure, J.F.; Coquery, M. Calibrating pollutant dispersion in 1-D hydraulic models of river networks. J. Hydro-Environ. Res. 2015, 9, 120–132. [Google Scholar] [CrossRef] [Green Version]
- Zerihun, D.; Furman, A.; Warrick, A.W.; Sanchez, C.A. Coupled surface–subsurface solute transport model for irrigation borders and basins. I. model development. J. Irrig. Drain. Eng. 2005, 131, 396–406. [Google Scholar] [CrossRef]
- Emanuel, K. Increasing destructiveness of tropical cyclones over the past 30 years. Nature 2005, 436, 686–688. [Google Scholar] [CrossRef] [PubMed]
- Webster, P.J.; Holland, G.J.; Curry, J.A.; Chang, H.R. Changes in tropical cyclone number, duration, and intensity in a warming environment. Science 2005, 309, 1844–1846. [Google Scholar] [CrossRef] [PubMed]
- Tu, J.Y.; Chou, C.; Chu, P.S. The abrupt shift of typhoon activity in the vicinity of Taiwan and its association with western North Pacific–East Asian climate change. J. Clim. 2009, 22, 3617–3628. [Google Scholar] [CrossRef]
- Bussi, G.; Francés, F.; Horel, E.; López-Tarazón, J.A.; Batalla, R.J. Modelling the impact of climate change on sediment yield in a highly erodible Mediterranean catchment. J. Soils Sediments 2014, 14, 1921–1937. [Google Scholar] [CrossRef]
- Lee, S.Y.; Hamlet, A.F.; Grossman, E.E. Impacts of climate change on regulated streamflow, hydrologic extremes, hydropower production, and sediment discharge in the Skagit river basin. Northwest Sci. 2016, 90, 23–43. [Google Scholar] [CrossRef]
- Laura, M.; Tartari, G.; Salerno, F.; Valsecchi, L.; Bravi, C.; Lorenzi, E.; Genoni, P.; Guzzella, L. Climate change impacts on sediment quality of Subalpine reservoirs: Implications on management. Water 2017, 9, 680. [Google Scholar] [CrossRef]
- Ren, Z.; Feng, Z.; Li, P.; Wang, D.; Cheng, S.; Gong, J. Response of runoff and sediment yield from climate change in the Yanhe watershed, China. J. Coast. Res. 2017, 80, 30–35. [Google Scholar] [CrossRef]
- Dahl, T.A.; Kendall, A.D.; Hyndman, D.W. Impacts of projected climate change on sediment yield and dredging costs. Hydrol. Process. 2018, 32, 1223–1234. [Google Scholar] [CrossRef]
- Ashmore, P.; Church, M. The Impact of Climate Change on Rivers and River Processes in Canada; Geological Survey of Canada: Ottawa, ON, Canada, 2001; Volume 555.
- Bronstert, A. Floods and climate change: Interactions and impacts. Risk Anal. Int. J. 2003, 23, 545–557. [Google Scholar] [CrossRef]
- Pfister, L.; Kwadijk, J.; Musy, A.; Bronstert, A.; Hoffmann, L. Climate change, land use change and runoff prediction in the Rhine–Meuse basins. River Res. Appl. 2004, 20, 229–241. [Google Scholar] [CrossRef]
- Döll, P.; Zhang, J. Impact of climate change on freshwater ecosystems: A global-scale analysis of ecologically relevant river flow alterations. Hydrol. Earth Syst. Sci. 2010, 14, 783–799. [Google Scholar] [CrossRef] [Green Version]
- Guerrero, M.; Nones, M.; Saurral, R.; Montroull, N.; Szupiany, R.N. Parana River morphodynamics in the context of climate change. Int. J. River Basin Manag. 2013, 11, 423–437. [Google Scholar] [CrossRef]
- Piniewski, M.; Meresa, H.K.; Romanowicz, R.; Osuch, M.; Szcześniak, M.; Kardel, I.; Okruszko, T.; Mezghani, A.; Kundzewicz, Z.W. What can we learn from the projections of changes of flow patterns? Results from Polish case studies. Acta Geophys. 2017, 65, 809–827. [Google Scholar] [CrossRef]
- Garijo, C.; Mediero, L. Influence of climate change on flood magnitude and seasonality in the Arga River catchment in Spain. Acta Geophys. 2018, 66, 769–790. [Google Scholar] [CrossRef]
- Hsu, H.H.; Chou, C.; Wu, Y.C.; Lu, M.M.; Chen, C.T.; Chen, Y.M. Climate Change in Taiwan: Scientific Report 2011 (Summary); National Science Council: Taipei, Taiwan, 2011. [Google Scholar]
- Ho, C.S. An Introduction to the Geology of Taiwan: Explanatory Text of the Geologic Map of Taiwan; Central Geological Survey, Ministry of Economic Affairs: Taipei, Taiwan, 1988.
- Water Resources Planning Institute (WRPI). Review Report on Jhuo-Shuei River Basin Integrated Regulation Plan; Water Resources Agency, Ministry of Economic Affairs: Taichung, Taiwan, 2011.
- Water Resources Planning Institute (WRPI). A Study of Flood Control and Sediment Management Due to Climate Change of Jhuoshuei River; Water Resources Agency, Ministry of Economic Affairs: Taichung, Taiwan, 2013.
- Water Resources Planning Institute (WRPI). Review Report on River Planning of Jhuo-Shuei River; Water Resources Agency, Ministry of Economic Affairs: Taichung, Taiwan, 2007.
- Wu, W.; Vieira, D.A. One-Dimensional Channel Network Model CCHE1D Version 3.0—Technical Manual; The University of Mississippi, National Center for Computational Hydroscience and Engineering: Oxford, MS, USA, 2002. [Google Scholar]
- Wu, W.; Vieira, D.A.; Wang, S.S.Y. One-Dimensional Numerical Model for Nonuniform Sediment Transport under Unsteady Flows in Channel Networks. J. Hydraul. Eng. 2004, 130, 914–923. [Google Scholar] [CrossRef]
- Garbrecht, J.; Kuhnle, R.; Alonso, C. A Sediment Transport Capacity Formulation for Application to Large Channel Networks. J. Soil Water Conserv. 1995, 50, 527–529. [Google Scholar]
- Wu, W.; Wang, S.S.Y.; Jia, Y. Nonuniform sediment transport in alluvial rivers. J. Hydraul. Res. 2000, 38, 427–434. [Google Scholar] [CrossRef]
- Proffitt, G.T.; Sutherland, A.J. Transport of non-uniform sediments. J. Hydraul. Res. 1983, 21, 33–43. [Google Scholar] [CrossRef]
- Yeh, K.C.; Wang, S.Y.; Wu, W.M.; Lien, H.C.; Liao, C.T. Implement and Application Study of NCCHE’s River Migration Models; Water Resources Planning Institute, WRA: Taichung, Taiwan, 2007.
- Liao, C.T.; Yeh, K.C.; Huang, M.W. Development and application of 2-D mobile-bed model with bedrock river evolution mechanism. J. Hydro-Environ. Res. 2014, 8, 210–222. [Google Scholar] [CrossRef]
- Water Resources Planning Institute (WRPI). Report on River Planning of Cing-Shuei River, Tributary of Jhuo-Shuei River; Water Resources Agency, Ministry of Economic Affairs: Taichung, Taiwan, 2008.
- Roble, R.G.; Ridley, E.C. A thermosphere-ionosphere-mesosphere-electrodynamics general circulation model (TIME-GCM): Equinox solar cycle minimum simulations (30–500 km). Geophys. Res. Lett. 1994, 21, 417–420. [Google Scholar] [CrossRef]
- Johns, T.C.; Carnell, R.E.; Crossley, J.F.; Gregory, J.M.; Mitchell, J.F.; Senior, C.A.; Tett, S.F.B.; Wood, R.A. The second Hadley Centre coupled ocean-atmosphere GCM: Model description, spinup and validation. Clim. Dynam. 1997, 13, 103–134. [Google Scholar] [CrossRef]
- Mizuta, R.; Yoshimura, H.; Murakami, H.; Matsueda, M.; Endo, H.; Ose, T.; Kamiguchi, K.; Hosaka, M.; Sugi, M.; Yukimoto, S.; et al. Climate simulations using MRI-AGCM3.2 with 20-km grid. J. Meteor. Soc. Jpn. 2012, 90A, 233–258. [Google Scholar] [CrossRef]
- Mizuta, R.; Arakawa, O.; Ose, T.; Kusunoki, S.; Endo, H.; Kitoh, A. Classification of CMIP5 future climate responses by the tropical sea surface temperature changes. SOLA 2014, 10, 167–171. [Google Scholar] [CrossRef]
- Murakami, H.; Wang, Y.; Yoshimura, H.; Mizuta, R.; Sugi, M.; Shindo, E.; Adachi, Y.; Yukimoto, S.; Hosaka, M.; Kusunoki, S.; et al. Future changes in tropical cyclone activity projected by the new high-resolution MRI-AGCM. J. Clim. 2012, 25, 3237–3260. [Google Scholar] [CrossRef]
- Murakami, H.; Hsu, P.C.; Arakawa, O.; Li, T. Influence of model biases on projected future changes in tropical cyclone frequency of occurrence. J. Clim. 2014, 27, 2159–2181. [Google Scholar] [CrossRef]
- Li, H.C.; Shih, H.J.; Wu, T.; Chao, Y.C.; Chen, W.B.; Cheng, C.T.; Chen, D.R.; Jang, J.H.; Chen, Y.M. The Loss Assessment for Cho-Shui River Basin in the End of Century under Climate Change; NCDR 104-T09; National Science and Technology Center for Disaster Reduction: Taipei, Taiwan, 2015.
Figure 1.
Choshui River catchment of Taiwan.

Figure 2.
Rating curves of flow discharge and sediment concentration for (a) the Yufeng Bridge station (1994/2–2013/5), and (b) the Tongtou station (1994/6–2009/8) and the Longmen Bridge station (2009/10–2013/5).
Figure 2.
Rating curves of flow discharge and sediment concentration for (a) the Yufeng Bridge station (1994/2–2013/5), and (b) the Tongtou station (1994/6–2009/8) and the Longmen Bridge station (2009/10–2013/5).

Figure 3.
Calibration and validation of the measured and simulated flow discharge at the Chunyun Bridge.
Figure 3.
Calibration and validation of the measured and simulated flow discharge at the Chunyun Bridge.

Figure 4.
(a) Calibration result of the riverbed changes during 2004–2008 and (b) the validation result of the riverbed changes during 2008–2012 using the lowest point of each section along the river.
Figure 4.
(a) Calibration result of the riverbed changes during 2004–2008 and (b) the validation result of the riverbed changes during 2008–2012 using the lowest point of each section along the river.

Figure 5.
Simulation result of the most severe flood event at the end of the 21st century.

Figure 6.
Changes in erosion and aggradation of the riverbed in the Choshui River under climate change scenarios.
Figure 6.
Changes in erosion and aggradation of the riverbed in the Choshui River under climate change scenarios.


Table 1.
Simulation results of peak flow discharge of each of the top 20 typhoons during the two periods at the Chunyun Bridge.
Table 1.
Simulation results of peak flow discharge of each of the top 20 typhoons during the two periods at the Chunyun Bridge.
| Event Ranking | Base Period (m3/s) | End of the 21st Century (m3/s) |
|---|---|---|
| 1 | 16,325 | 14,000 |
| 2 | 27,005 ** | 26,873 ** |
| 3 | 20,897 | 29,513 ** |
| 4 | 10,015 | 13,278 |
| 5 | 25,577 ** | 27,600 ** |
| 6 | 7422 | 15,706 |
| 7 | 23,515 | 23,062 |
| 8 | 8788 | 11,561 |
| 9 | 23,195 | 14,170 |
| 10 | 11,830 | 22,305 |
| 11 | 11,620 | 17,313 |
| 12 | 14,842 | 11,857 |
| 13 | 5071 * | 9660 |
| 14 | 8931 | 8662 |
| 15 | 6519 | 5045 * |
| 16 | 9048 | 2794 * |
| 17 | 7128 | 2175 * |
| 18 | 7977 | 3716 * |
| 19 | 9437 | 3730 * |
| 20 | 5341 * | 1068 * |
* represents that the peak flow discharge is less than that of the two-year recurrence interval (Q2 = 5829 m3/s). ** represents that the peak flow discharge is greater than that of the 100-year recurrence interval (Q100 = 25,394 m3/s).
© 2018 by the authors. Licensee MDPI, Basel, Switzerland. This article is an open access article distributed under the terms and conditions of the Creative Commons Attribution (CC BY) license (http://creativecommons.org/licenses/by/4.0/).
Share and Cite
MDPI and ACS Style
Chao, Y.-C.; Chen, C.-W.; Li, H.-C.; Chen, Y.-M. Riverbed Migrations in Western Taiwan under Climate Change. Water 2018, 10, 1631. https://doi.org/10.3390/w10111631
AMA Style
Chao Y-C, Chen C-W, Li H-C, Chen Y-M. Riverbed Migrations in Western Taiwan under Climate Change. Water. 2018; 10(11):1631. https://doi.org/10.3390/w10111631
Chicago/Turabian StyleChao, Yi-Chiung, Chi-Wen Chen, Hsin-Chi Li, and Yung-Ming Chen. 2018. "Riverbed Migrations in Western Taiwan under Climate Change" Water 10, no. 11: 1631. https://doi.org/10.3390/w10111631
Note that from the first issue of 2016, this journal uses article numbers instead of page numbers. See further details here.