Research on Validity Examination of Simulated Results of Eggplant Water Requirements with Drip Irrigation under Mulch in Sunlight Greenhouse


School of Water Conservancy, North China University of Water Resources and Electric Power, Zhengzhou 450045, China
*
Author to whom correspondence should be addressed.
Water 2018, 10(2), 130; https://doi.org/10.3390/w10020130
Submission received: 8 December 2017
/
Revised: 18 January 2018
/
Accepted: 23 January 2018
/
Published: 31 January 2018
Abstract
:In order to explore the validity of the single and dual crop coefficient approaches in sunlight greenhouses, eggplant with drip irrigation was taken as the study object, and the crop water requirement was calculated via field experiments in a sunlight greenhouse. Results indicated that the results of the two model simulations are satisfactory. Model parameters of the single crop coefficient approach are perfect with a correlation index (R2) of 0.8374, a regression coefficient of 0.8281, an average mean absolute error of 0.2335 mm/day, an average standard error of 0.28 mm/day, a consistency index of relative unbiasedness of 0.9530, and a residual variance of 0.0785. For the dual crop coefficient approach, the model parameters had a correlation index (R2) of 0.8597, a regression coefficient of 0.8220, an average mean absolute error of 0.2196 mm/day, an average standard error of 0.27 mm/day, a consistency index of relative unbiasedness of 0.9543, and a residual variance of 0.0685. The results indicated that the dual crop coefficient model was better than the single crop coefficient model. Our research can provide some reference for the study of crop water requirements with drip irrigation under mulch in a sunlight greenhouse.
1. Introduction
Scientifically, irrigation management is significant for improving the environment, alleviating diseases and insect pests, and promoting yield and quality of greenhouse eggplant [1]. Therefore, the accurate calculation of the crop water requirement is of great significance for agricultural development and water saving irrigation.
The single and dual crop coefficient methods recommended by the Food and Agriculture Organization of the United Nations (FAO) are the most common methods to calculate crop water requirements in a greenhouse. In the single crop coefficient method, the effect of both crop transpiration (T) and soil evaporation (E) are integrated into a single crop coefficient, and the coefficient incorporates crop characteristics and averaged effects of evaporation from the soil. In the dual crop coefficient method, the effects of E and T are separately determined, and the crop coefficient is divided into the basal crop coefficient and soil evaporation coefficient [2]. The key to calculating the actual crop water requirement by using the above two methods was the crop coefficient (Kc) and the reference crop evapotranspiration (ET0). For Kc, Abedi-koupai et al. [3] analyzed the variation of Kc for cucumber, tomato, and pepper at initial, growth, middle and later stages, respectively, by using a micro-lysimeter. Razmi et al. [4] discussed the changes of tomato Kc in glasshouses, and considered that the Kc was 0.85, 1.0, and 0.77 at the growth, mid-growth, and later growth stages, respectively. Qiu et al. [5] analyzed the effect of planting density on Kc by introducing the vegetation density coefficient. Many studies indicated that the dual crop coefficient method can provide a more precise approach of determining actual water requirements, and the single crop coefficient method was often used to estimate irrigation scheduling [6,7,8,9,10,11]. Qiu et al. [11] simulated the water consumption of tomato in a solar greenhouse using the dual crop coefficient method, indicating a good agreement between the simulated and measured values. It also indicated that the transpiration of plants was the most important part of water consumption. Gong et al. [12] estimated soil evaporation and crop transpiration of tomatoes in a sunlight greenhouse by using the dual crop coefficient method under different water conditions, and the results indicated that the precision in high water treatment was higher than in low water treatment. However, the above studies mostly used the research method of the dual crop coefficient to calculate the crop water requirement. Although the water consumption of crops can meet the demand of crop water to some extent, the preparation of crop water demand also needs to be studied experimentally.
Many studies indicated that the research on the single crop coefficient was mainly focused on field research [13,14,15]. For example, Su et al. [16] calculated the water requirement of winter wheat and waxy corn using the single crop coefficient under sprinkling irrigation. Fan and Cai [17] compared crop water demand calculated by the single crop coefficient method through field trials. The results showed that there was a good correlation between the crop water requirements calculated by the single crop coefficient and measured values. However, due to the environmental differences between the greenhouse and the field, there is still a lack of studies for greenhouse vegetables. Therefore, it is necessary to carry out research on calculating the crop water demand model and verification of the model validity in greenhouse systems.
In order to test the validity, an examination of the single and dual crop coefficient methods was conducted. We took eggplant with drip irrigation under mulch in a sunlight greenhouse as the research object to calculate the crop water requirement through a long-term field experiment. The results have laid a certain foundation for the calculation of the crop water requirement under drip irrigation in a sunlight greenhouse.
2. Materials and Methods
2.1. Situation of the Test Area
Experiments were carried out in the sunlight greenhouse of the comprehensive experimental base of the Chinese Academy of Agricultural Sciences, which is located at 35°19′ N and 113°53′ E. The area has a temperate continental monsoon climate with mild climate. The soil is sandy loam, topsoil bulk density was 1.38 g/cm3, the field capacity was 23% (water mass rate), and the groundwater depth was greater than 5 m. The content of soil available nitrogen, available phosphorus, and available potassium were, respectively, 45.3 mg/kg, 4.2 mg/kg, and 91.2 mg/kg. The soil organic matter content was 31.3 g/kg.
The standard greenhouses that had fan-shaped sections and were south-facing, with the back to the north, were used. No drip polyethylene film, externally equipped with cold-proof quilting for heat insulation, the roof top and side can be manually opened for ventilation. During the experiment, the main planting vegetables in the greenhouse were eggplant. The test was conducted from September 2014 to May 2015 in an area of 60 m × 9 m (the height of wall was 2.5 m) of the greenhouse, the tested variety of eggplant was purple eggplant 702, eggplant spacing was 1.6 m, the row spacing was 45 cm, and transplanting and planting was performed on 6 September 2014. The irrigation method of drip irrigation under film was adopted in the experiment. Every line was laid with a drip irrigation belt, and the spatial interval of the emitters in each drip tape was arranged at the root of each plant.
2.2. Experimental Design
The experiment was set up in a sunlight greenhouse that was divided into two parts (No. 1 East and No. 6 West). No. 1 East and No. 6 West were treated with the same management system and processing method during the trial period. No. 1 East was used for establishing the test model, and No. 6 West was used for verification of the validity of the model. The experiments in the two greenhouses were set up three times in duplicate. A three-way pipe was installed in the inlet pipe of the drip irrigation in the greenhouse, and each test plot consisted of a water meter and a control gate to control the irrigation water quantity. Irrigation was started when the soil water content was lower than 70% of the field water holding capacity, and the amount of irrigation water restored the soil moisture of 0–80 cm to the field water holding capacity. According to the water meter, the irrigation was stopped when the amount of water reached the irrigation upper limit. Each test plot laid out a test pit for observation in the absence of any groundwater recharge, the pit size was 3.2 m × 1.4 m, and the pit depth was 1.0 cm. Two dark pipes were laid along the length of two sunlight greenhouses, which were used to drain in order to control the underground water level, with a pitch of 4.5 m, a greenhouse side of 3 m, an underground pipe depth of 1.2 m, an open sump was arranged between the greenhouses, and a water pump was used to promptly discharge the water.
2.3. Content and Methods of Measurement
- (1)
- Greenhouse environment: The solar radiation, net radiation, and relative humidity and air temperature were constantly monitored with an automatic weather station at 2.0 m height above ground level. The solar radiation was measured by a radiometer (LI200X, Campbell Scientific, Inc., Logan, UT, USA), using a net radiometer (LI200X, Campbell Scientific Inc., Logan, UT, USA) to measure net radiation, the air temperature and relative humidity were measured by a temperature and relative humidity recorder (CS215, Campbell Scientific Inc., Logan, UT, USA). The soil heat flux was measured with heat flux plates (HFP01, Hukseflux, Delft, The Netherlands) inserted at 5 cm below the ground surface. All data were collected by a CR1000 data logger (Campbell Scientific Inc., Logan, UT, USA). Additionally, the reference water surface evaporation was also measured with an E601 evaporation pan at the same level.
- (2)
- Soil moisture content: soil water content of 0–80 cm was measured by using a TRIME-IPH time domain reflector (micromodultechnik GmbH, Berlin, Germany). The TRIME-IPH was calibrated before measuring soil moisture content. The methods of calibration are as follows: for the loam under different water conditions, the deviation between the drying method and the TRIME-IPH method was compared, and the maximum deviation of the moisture content measured by TRIME-IPH was less than 0.02 compared with the soil moisture content measured by the drying method. This shows that it was feasible to use the TRIME-IPH to measure the soil water content.
- (3)
- Soil evaporation: micro-lysimeters, which were used to measure soil evaporation, were installed in each plot line of eggplant. The specification of each micro-lysimeter is as follows: it was made from galvanized iron, consisting of an inner cylinder (with a diameter of 10 cm) and an outer cylinder (with a diameter of 11 cm), with a thickness and height of 0.5 cm and 35 cm, respectively. The inner cylinder was weighed daily at 8 a.m. using an electronic balance with a precision of 0.1 g, and the soil of the inner tank was replaced every two days, as well as after irrigation. Three replications were set for each plot.
- (4)
- Crop height: eggplant height was measured every observed day using a ruler. The range of measurement was from the soil surface to the highest position of the canopy.
3. Methods of Crop Water Requirement Measurement
Crop water requirements were calculated by the FAO recommended single crop coefficient method [18], as shown in Equation (1), and the dual crop coefficient method [2], such as Equation (2):
where ETc represents the crop water requirement (mm); ET0 is the reference crop water requirement (mm); Kc is the integrated crop coefficient; Ks is the soil water correction coefficient, and since the test was full irrigation, Ks was 1.0. Equation (1) can be turned into Equation (3):
3.1. Actual Crop Water Requirement
Using the TRIME-IPH, the change of soil moisture content was measured, and the crop water requirement was calculated by the water balance equation [19]:
where ETc is the actual crop water requirement (mm); I is the amount of irrigation (mm); P is the amount of rainfall (mm); ΔW is the variation of soil water storage (mm); R is surface runoff (mm); and S is the net flux of the lower boundary of soil (mm) (the net flux upward was negative, and downward was positive).
In sunlight greenhouses, rain cannot enter, so P = 0; the test used the drip irrigation under the film method, with no run off, so R = 0. In the greenhouse a test pit was set up, and since the plastic film and the surrounding soil was separated from the supply and leakage of groundwater, S = 0; Equation (4) was simplified as:
3.2. Reference Crop Water Requirement
The Penman-Monteith formula calculation recommended by the FAO to calculate the reference crop water requirement ET0 was used [13]:
Since the minimum wind speed in the greenhouse can be ignored, u2 = 0, Equation (6) can be simplified as [20]:
where ET0 is the reference crop required water (mm); Rn is the surface net radiation (MJ/(m2·day)); G is the soil heat flux (MJ/(m2·day)); γ is the gamma humidity table constant (kPa/°C); and Δ is the saturated vapor pressure curve slope (kPa/°C).
3.3. Single Crop Coefficient
The single crop coefficient method considered the plant transpiration and soil evaporation as a whole, using a comprehensive coefficient. FAO-56 recommended four growth stages of eggplant and three typical values; the single crop coefficient of different stages of eggplant were Kcini = 0.6, Kcmid = 1.05, Kcend = 0.9, respectively.
According to the meteorological conditions in the greenhouse [2], Kcmid and Kcend were modified if the average wind speed u2 is not equal to 2.0 m/s at 2 m height, and in the middle and later period the minimum relative humidity average RHmin ≠ 45%. The formula was modified:
where RHmin is the daily average minimum relative humidity in the growth stage, %; and h is the average height of the crop during the growing period (m).
In the initial stage, the soil evaporation accounted for a small proportion of the total evapotranspiration due to the use of drip irrigation under film, so the effect of soil evaporation can be ignored when calculating Kcini.
3.4. Dual Crop Coefficient
FAO-56 recommended basic crop coefficients for each stage of the eggplant were Kcbini = 0.15, Kcbmid = 1.00, and Kcbend = 0.8, respectively. If the average wind speed u2 was not equal to 2.0 m/s at 2 m height, the minimum relative humidity average RHmin was not equal to 45% in the middle and later periods of the eggplant growth, and Kcb > 0.45, Kcbmid and Kcbend were modified as follows:
After irrigation, the topsoil wetting Ke value was large; when the topsoil was dry, Ke was small or even zero. Calculation of the soil evaporation coefficient is performed as follows:
where Kcmax is the maximum value of the crop coefficient after rainfall; and Kr is the surface soil evaporation attenuation coefficient determined by the accumulated evaporation depth. few is the proportion of the soil that takes place between the soil and the evaporation of the soil. The soil evaporation coefficient Ke can be neglected for the experiment because the experimental conditions reflected the drip irrigation under mulch in the greenhouse.
3.5. Model Validation
According to the simulation of the water requirement by single and dual crop coefficient methods and the measured water requirement, with the method of correlation analysis, we obtained the correlation index R2 and regression coefficient b. By the residual estimation error indicator method, we calculated the mean absolute error (MAE), root mean square error (RMSE), residual variance, Var(ER), and relative unbiased consistency index, dIA [21].
- (1)
- Correlation index R2. If R2 was closer to 1, it indicated that the variability of the observed value can be solved by the simulation model:where Qi is the actual observation values; is the mean value of measured value; Pi is the predictive value of the model; and was the mean value of predicted value.
- (2)
- Regression coefficient b. If b was closer to 1, it indicated that the predicted value was closer to the actual value:
- (3)
- Average absolute error, MAE:
- (4)
- Average standard error, RMSE:
- (5)
- Variance of the residual, Var(ER):
- (6)
- Relative deviation of the consistency index, dIA:
4. Results and Analysis
4.1. Changes of the Measured Crop Coefficient
The eggplant crop coefficient Kcm was calculated by the measured data in the No. 1 East. The Kcm was the ratio of the actual water demand of eggplant (ETc) and the reference water requirement (ET0) (Ks = 1 because of the lack of water stress), and Kcm is shown in Figure 1. From Figure 1, Kcm in the early stage of growth was 0.86, with the growth rate of the crop gradually increasing, Kcm reached the maximum in the middle growth stage and, later, the Kcm gradually decreased as the crops gradually withered. In the early, the middle, and the late growth stages of the crop, the crop coefficients were 0.86, 1.49, and 0.8, respectively. The results were close to those of Ge et al. [22].
4.2. Values of Single and Dual Crop Coefficients
The values of the single and dual crop plants in different growth stages were identified by the table given by FAO-56: The single crop coefficient method: Kcini = 0.6, Kcmid = 1.05, and Kcend = 0.9. The base crop coefficient based on dual crop coefficient method: Kcbini = 0.15, Kcbmid = 1.00, and Kcbend = 0.80.
The stage crop coefficient recommended by FAO-56 was modified by meteorological data RHmin, u2, and h in the greenhouse, and the modified crop coefficient values were as follows: the single crop coefficient method: Kcin I = 0.60, Kcmid = 1.03, and Kcend = 0.88; the base crop coefficient based on the dual crop coefficient method: Kcbin I =0.15, Kcbmid = 0.98, and Kcbend = 0.79.
During the early, middle, and late eggplant growth stages the measured crop coefficients were 0.87, 1.32, and 0.99 in No. 1 East, respectively. The comparison of the results showed that the modified FAO-56 recommended values and measured values deviated greatly because the wind speed was zero and the growth stage of the average daily minimum relative humidity values were more than 45% in the greenhouse, hence, the modified value was smaller. Vu et al. [23] thought the difference was mainly induced by crop varieties and a different test climate. Therefore, according to the principle that the absolute deviation between the measured values and recommended values were the smallest, the correction coefficient u of the cultivated crop coefficient was introduced, and the correction factor considered the observed temperature and radiation in the greenhouse. The correction formula for crop coefficient is:
where is the crop coefficient modified values; Ke is the FAO-56 recommended crop coefficient values; and u is the greenhouse crop coefficient correction coefficient. Assuming that u, the greenhouse temperature T, and radiation R, the following relationship exists:
where R is the greenhouse radiation (MJ/(m2·day)); T is the greenhouse temperature (Celsius); and X1, X2, X3 are empirical coefficients. The unit dimension was 1.
By regression analysis: single crop coefficient method: X1 = –0.053, X2 = –0.004, X3 = 1.548; dual crop coefficient method: X1 = –0.048, X2 = –0.003, X3 = 1.660. X2 and X1 were negative numbers, the u decreased with the increase of the indoor temperature and indoor radiation. The corrected value Kc1 was very close to the actual average value Kc2.
4.3. Model Validity Test
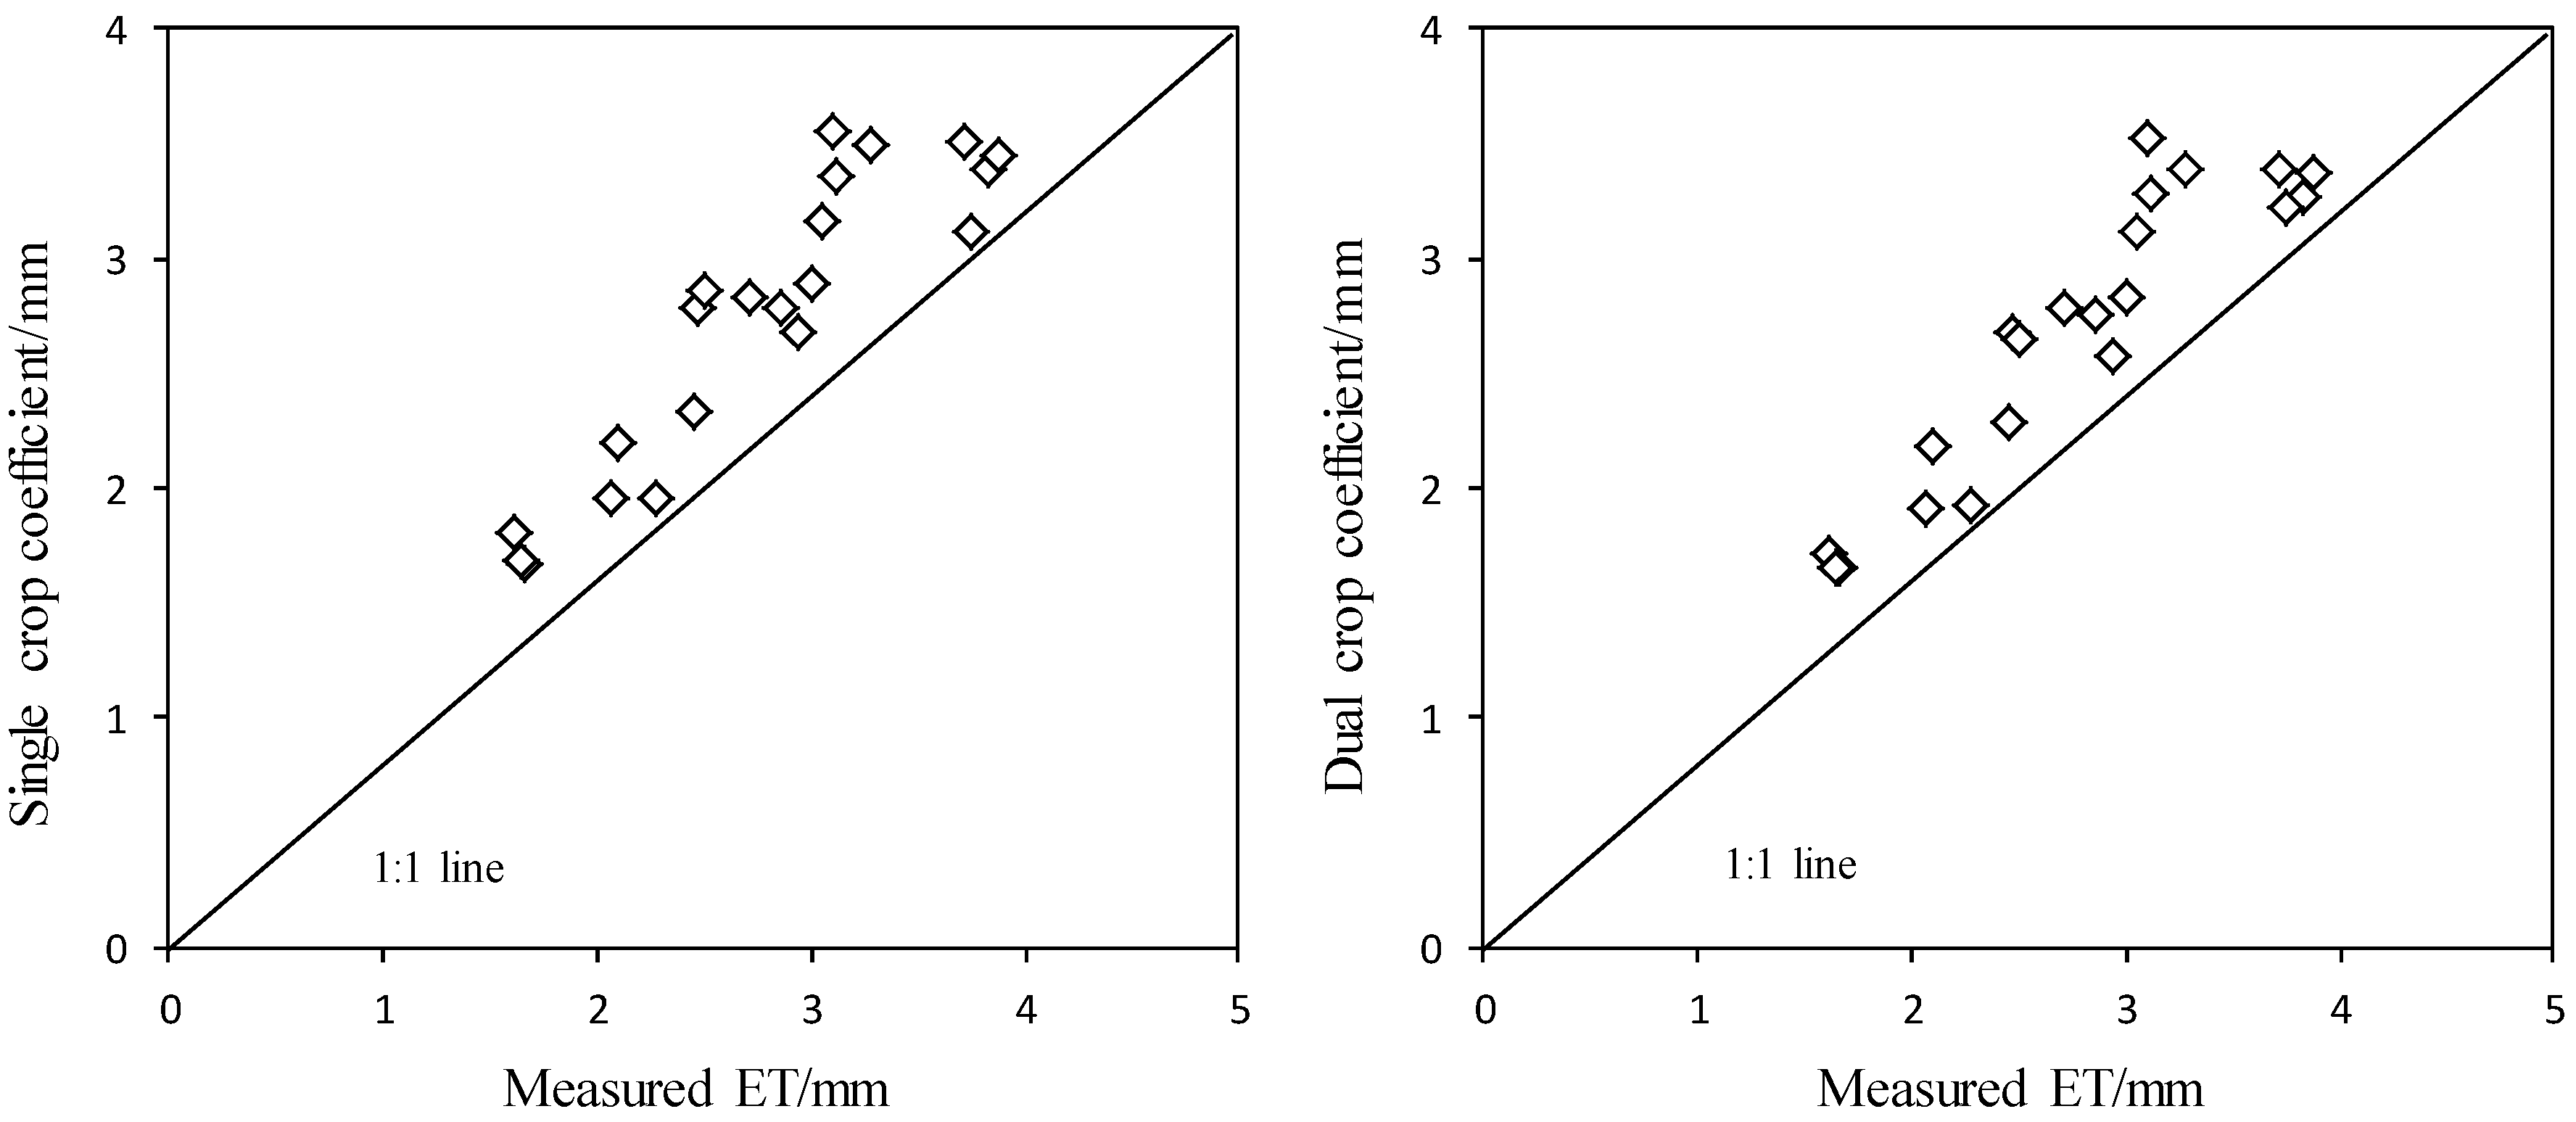
Figure 2 shows the seasonal variations of the daily ET estimated by the single crop coefficient and the dual crop coefficient at the same period in the East 1 greenhouse, and the crop water requirement of eggplant in West 6 measured by water balance equation were also plotted for comparison. It can be seen from Figure 2 that the change laws of ET calculated by single and dual crop coefficient were basically coincident with measured values, and the degree of deviation was small. For single crop coefficient, the maximum deviation occurred at 200 days after transplanting, and the minimum deviation occurred at 80 days after transplanting, the values were 0.64 mm and 0.01 mm, respectively. While for dual crop coefficient, the maximum deviation occurred at 170 days after transplanting, and the minimum deviation occurred at 80 days after transplanting, the values were 0.56 mm and 0.01 mm, respectively. The single crop coefficient and the dual crop coefficient underestimated the daily ET by 1.1% and 3.3% respectively during the entire experimental period (Figure 3). It shows that both of these methods have high estimation accuracy, and can be used to estimate the evapotranspiration of eggplant in greenhouse.
The results of the model effectiveness test are shown in Table 1. Figure 2 and Table 1 show that the fitting degree of simulated values by the single crop coefficient method and the measured values were higher, and their correlation coefficient R2 was 0.8374, the regression coefficient b was 0.8281, the average absolute error MAE was 0.2335 mm/day, the average standard error variance RMSE was 0.28 mm/day, the residual variance Var(ER) was 0.0785, and the relative unbiased consistency index dIA was 0.9530. The fitting degree of simulated values by the dual crop coefficient method and measured values were higher than the single crop coefficient method, and their correlation coefficient R2 was 0.8597, the regression coefficient b was 0.8220, the average absolute error MAE was 0.2196 mm/day, the average standard error variance RMSE was 0.27 mm/day, the residual variance Var(ER) was 0.0685, and the relative deviation of the consistency index dIA was 0.9543. The above statistics indicated that the single and dual crop coefficient methods’ simulated values and the measured values had a good fit, and the simulation of the dual crop coefficient model was closer to the measured values.
5. Conclusions
Based on the study of eggplant under mulch drip irrigation in a greenhouse, using the single and dual crop coefficient methods, two calculation models of crop water requirements were established. The comparison between the model data and the measured data were carried out, and the following conclusions are drawn:
- (1)
- The crop coefficient can be calculated by using the measured data in the greenhouse. The crop coefficient was 0.86 in the early stage of growth, 1.49 in the middle stage and 0.8 in the late stage.
- (2)
- The change rules between simulated crop water requirement of the single and dual crop coefficient method and measured crop water requirement in the whole growth period were consistent, and the deviation between them was small.
- (3)
- The regression coefficient and correlation coefficient between the simulated values by the single and dual crop coefficient method and measured values were obtained by the regression analysis method. With the single crop coefficient method, the regression coefficient b was 0.8281, and R2 was 0.8374; with the dual crop coefficient method, the regression coefficient b was 0.8220, R2 was 0.8597, and the fitting degrees of the two models were both good.
- (4)
- The degree of deviation between the simulated values and the measured values of the single and dual crop coefficient methods were given quantitatively by the error indication method of residual error estimation. With the dual crop coefficient method, MAE was 0.2196 mm/day, RMSE was 0.27 mm/day, and Var(ER) was 0.0685, which were all smaller than the values of single crop coefficient method. The dual crop coefficient method of dIA was 0.9543 which was larger than the single crop coefficient method of dIA that was 0.9530, and it showed that the crop water requirement calculated by the dual crop coefficient method was closer to the measured crop water requirement.
- (5)
- Although the test object and test conditions were relatively limited, the research results of the crop water requirement model can be used to determine water savings and the high efficiency irrigation system of crops. When applied in other regions, it should be revised according to the specific local conditions in order to improve the accuracy of the simulation.
Acknowledgments
This research was supported by the National Science and Technology Support Project of China (2007BAD88B02), Henan Provincial Department of Education Science and Technology Research Key Project (12A210018) and National Natural Science Foundation of China (51709110). Meanwhile, thank Jiankun Ge for contributing reagents/materials/analysis tools.
Author Contributions
Shunsheng Wang and Xuewen Gong conceived and designed the experiments; Bo Li performed the experiments; Bo Li and Xuewen Gong analyzed the data; Shunsheng Wang wrote the paper. All the authors have revised and approved the final manuscript.
Conflicts of Interest
The authors declare no conflict of interest.
References
- Wang, F.; Du, T.S.; Qiu, R.J.; Dong, P.G. Effects of deficit irrigation on yield and water use efficiency of tomato in solar greenhouse. Trans. Chin. Soc. Agric. Eng. 2010, 26, 46–52. [Google Scholar]
- Allen, R.G.; Pereira, L.S.; Raes, D.; Smith, M. Crop Evapotranspiration—Guidelines for Computing Crop Water Requirements; FAO Irrigation and Drainage Paper 56; Food and Agriculture Organization: Rome, Italy, 1998. [Google Scholar]
- Abedikoupai, J.; Eslamian, S.S.; Zareian, M.J. Measurement and modeling of water requirement and crop coefficient for cucumber, tomato and pepper using microlysimeter in greenhouse. J. Sci. Technol. Greenh. Cult. 2011, 2, 51–64. [Google Scholar]
- Razmi, Z.; Ghaemi, A.A. Crop and soil-water stress coefficients of tomato in the glass-greenhouse conditions. J. Sci. Technol. Greenh. Cult. 2011, 2, 75–87. [Google Scholar]
- Qiu, R.J.; Song, J.; Du, T.S.; Kang, S.Z.; Tong, L.; Chen, R.S.; Wu, L.S. Response of evapotranspiration and yield to planting density of solar greenhouse grown tomato in northwest China. Agric. Water Manag. 2013, 130, 44–51. [Google Scholar] [CrossRef]
- Odhiambo, L.O.; Irmak, S. Evaluation of the impact of surface residue cover on single and dual crop coefficient for estimating soybean actual evapotranspiration. Agric. Water Manag. 2012, 104, 221–234. [Google Scholar] [CrossRef]
- Yu, C.; Chao, L.B.; Gao, R.Z.; Zhu, Z.Y. Validity examination of simulated results of crop water requirements. Trans. Chin. Soc. Agric. Eng. 2009, 25, 13–21. [Google Scholar]
- Feng, Y.; Cui, N.B.; Gong, D.Z.; Wang, H.B.; Hao, W.P.; Mei, X.R. Estimating rainfed spring maize evapotranspiration using modified dual crop coefficient approach based on leaf area index. Trans. Chin. Soc. Agric. Eng. 2016, 32, 90–98. [Google Scholar]
- Liu, Y.W.; Zhu, Z.Y.; Wu, Y.J.; Jing, Y.L. Comparison of evapotranspiration of the Natural Vegetation in the Otindag Sandy Area Using Two Calculation Methods. Trans. Chin. Soc. Agric. Mach. 2010, 41, 84–88. [Google Scholar]
- Poblete-Echeverría, C.A.; Ortega-Farias, S.O. Evaluation of single and dual crop coefficients over a drip-irrigated Merlot vineyard (Vitis vinifera L.) using combined measurements of sap flow sensors and an eddy covariance system. Aust. J. Grape Wine Res. 2013, 19, 249–260. [Google Scholar] [CrossRef]
- Qiu, R.J.; Du, T.S.; Chen, R.Q. Application of the dual crop coefficient model for estimating tomato evapotranspiration in greenhouse. J. Hydraul. Eng. 2015, 6, 678–686. [Google Scholar]
- Gong, X.W.; Liu, H.; Sun, J.S.; Ma, X.J.; Wang, W.N.; Cui, Y.S. Modeling evapotranspiration of greenhouse tomato under different water conditions based on the dual crop coefficient method. Chin. J. Appl. Ecol. 2017, 28, 1255–1264. [Google Scholar]
- Liu, Y.; Wang, L.; Ni, G.H.; Cong, Z.T. Spatial distribution characteristics of irrigation water requirement for main crops in China. Trans. Chin. Soc. Agric. Eng. 2009, 25, 6–12. [Google Scholar]
- Zhang, B.; Yuan, S.Q.; Cheng, L.; Yuan, J.; Cong, X. Model for predicting crop water requirements by using L-M optimization algorithm BP neural network. Trans. Chin. Soc. Agric. Eng. 2004, 20, 73–76. [Google Scholar]
- Wu, Y.L.; Tian, G.Z.; Wang, Y.F. Analysis of crop water requirement based on refined SEBS model. Agric. Res. Arid Areas 2015, 1, 113–118, 193. [Google Scholar]
- Su, M.S.; Li, J.S.; Rao, M.J. Estimation of crop coefficients for sprinkler-irrigated winter wheat and sweet corn using a weighing lysimeter. Trans. Chin. Soc. Agric. Eng. 2005, 21, 25–29. [Google Scholar]
- Fan, Y.Q.; Cai, H.J. Comparison of crop water requirements computed by single crop coefficient approach and crop coefficient approach. J. Hydraul. Eng. 2002, 3, 50–54. [Google Scholar]
- Wang, S.S.; Fei, L.J.; Gao, C.C. Experiment on single crop cofficient of summer maize under different furrow irrigations. Trans. Chin. Soc. Agric. Eng. 2013, 44, 105–111. [Google Scholar]
- Orgaz, F.; Ferna’ndez, M.D.; Bonachela, S.; Gallardo, M.; Fereres, E. Evapotranspiration of horticultural crops in an unheated plastic greenhouse. Agric. Water Manag. 2005, 72, 81–96. [Google Scholar] [CrossRef]
- Chen, X.M.; Cai, H.J.; Li, H.X.; Wang, J.; Du, W.J. Calculation of crop evapotranspiration in greenhouse. Chin. J. Appl. Ecol. 2007, 18, 317–321. [Google Scholar]
- Willmott, C.J.; Matsuura, K. Advantages of the Mean Absolute Error (MAE) over the Root Mean Square Error (RMSE) in Assessing Average Model Performance. Clim. Res. 2005, 30, 79–82. [Google Scholar] [CrossRef]
- Ge, J.K.; Li, H.H.; Peng, C.W. Research on crop coefficient of eggplant with drip irrigation under mulch in sunlight greenhouse. J. Irrig. Drain. 2015, 34, 59–62. [Google Scholar]
- Vu, S.H.; Watanabe, H.; Takagi, K. Application of FAO-56 for evaluating evapotranspiration in simulation of pollutant runoff from paddy rice field in Japan. Agric. Water Manag. 2005, 76, 195–210. [Google Scholar] [CrossRef]
Figure 1.
Curve of measured crop coefficient.
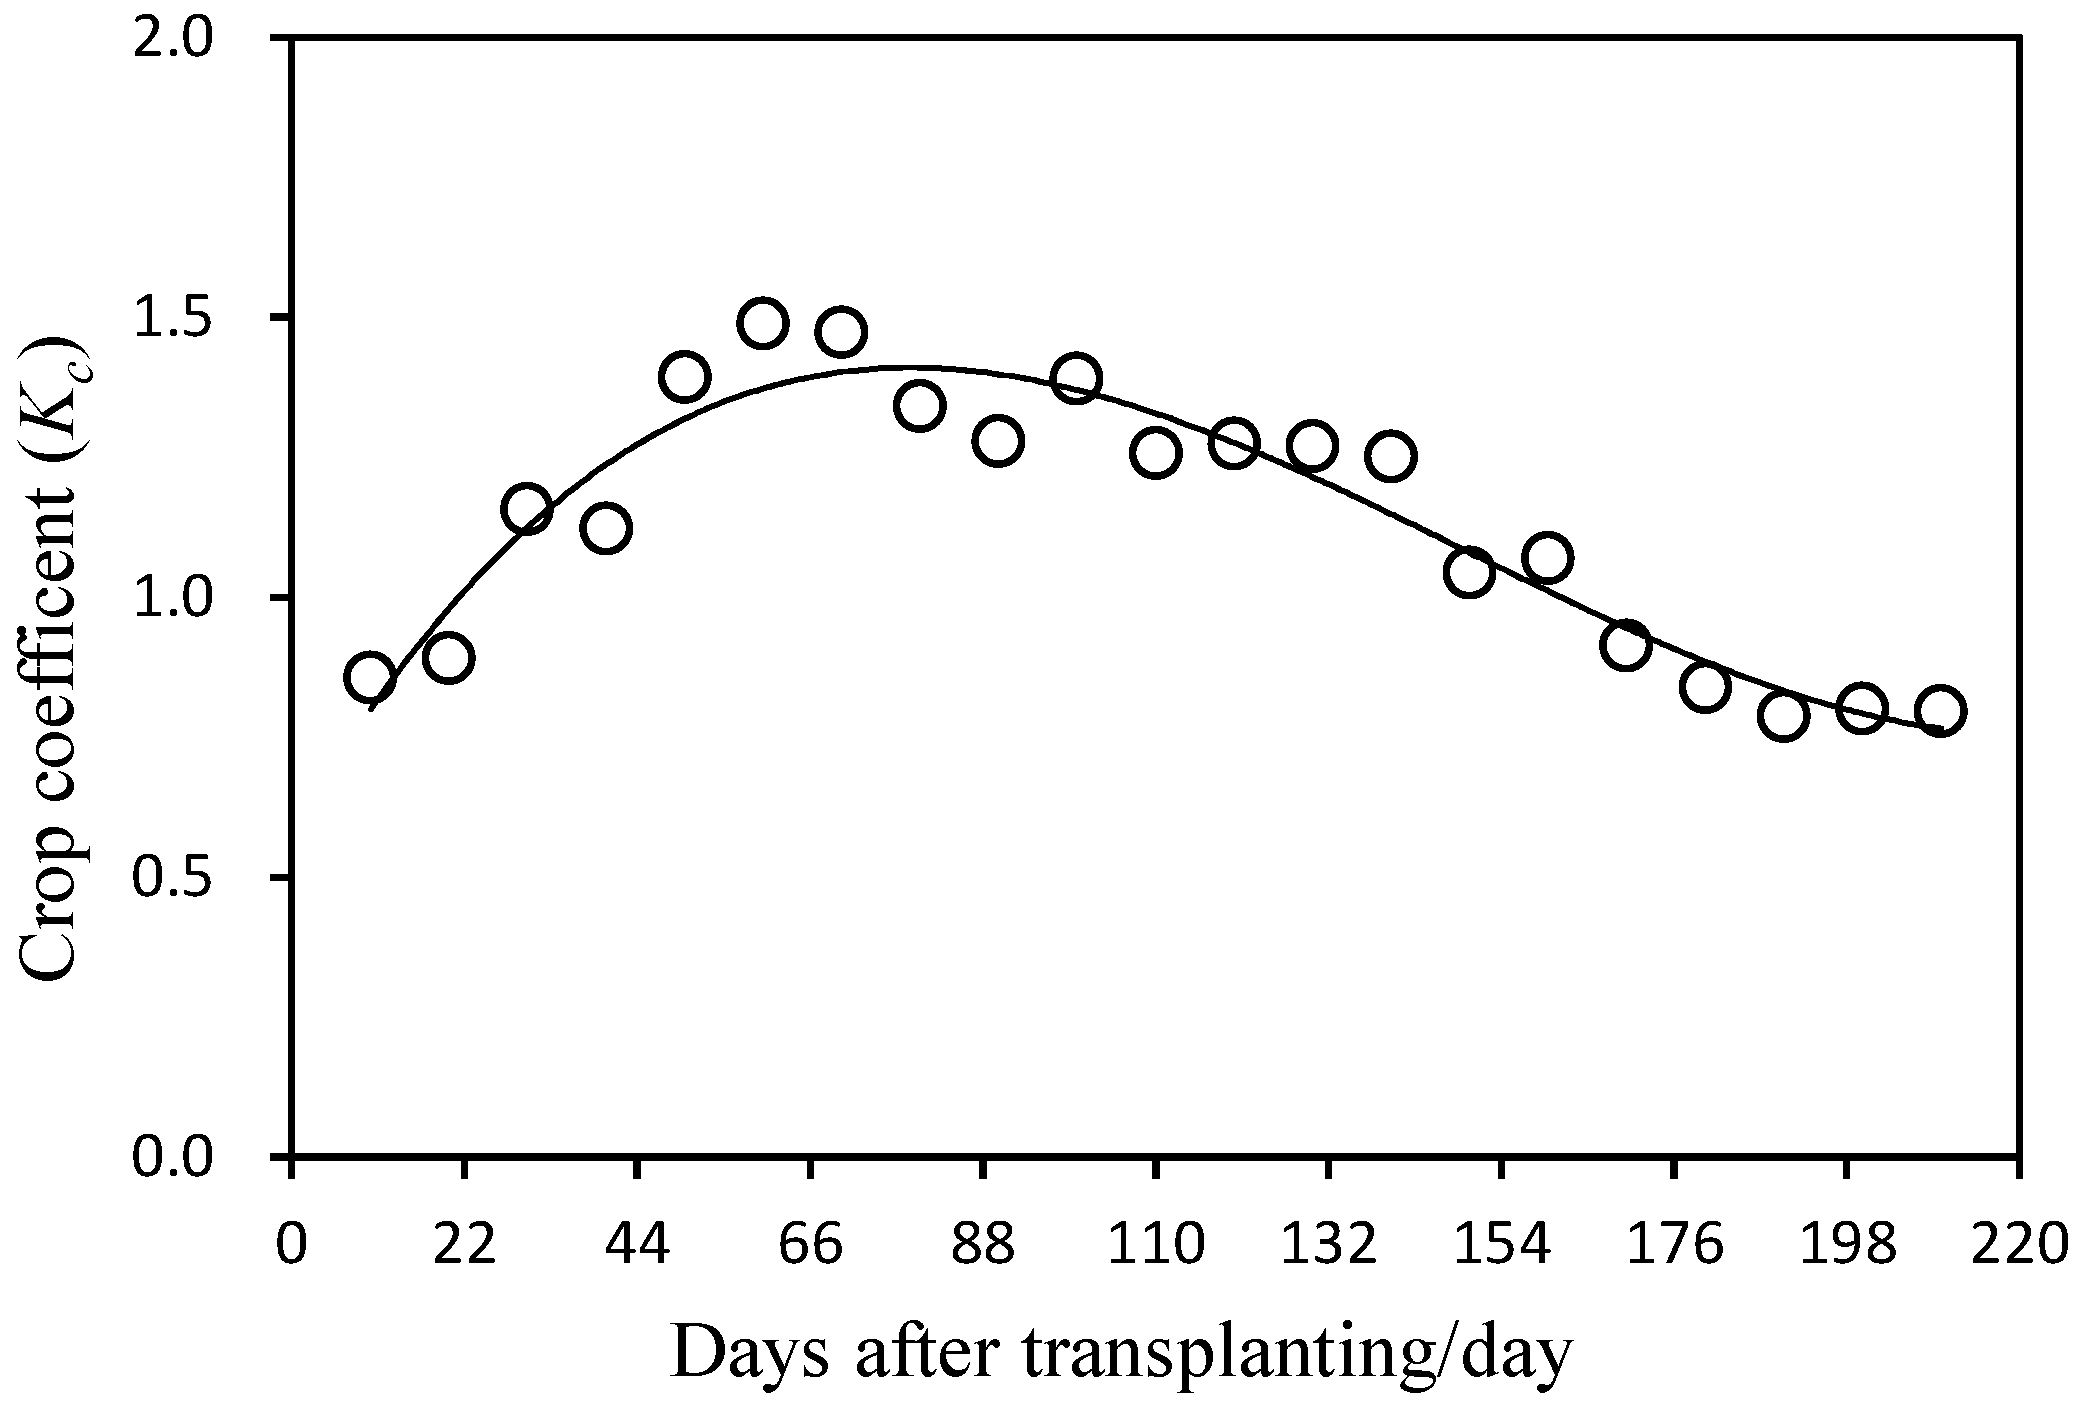
Figure 2.
Seasonal variations of the daily evapotranspiration (ET) estimated by single and dual crop coefficient and measured values.
Figure 2.
Seasonal variations of the daily evapotranspiration (ET) estimated by single and dual crop coefficient and measured values.
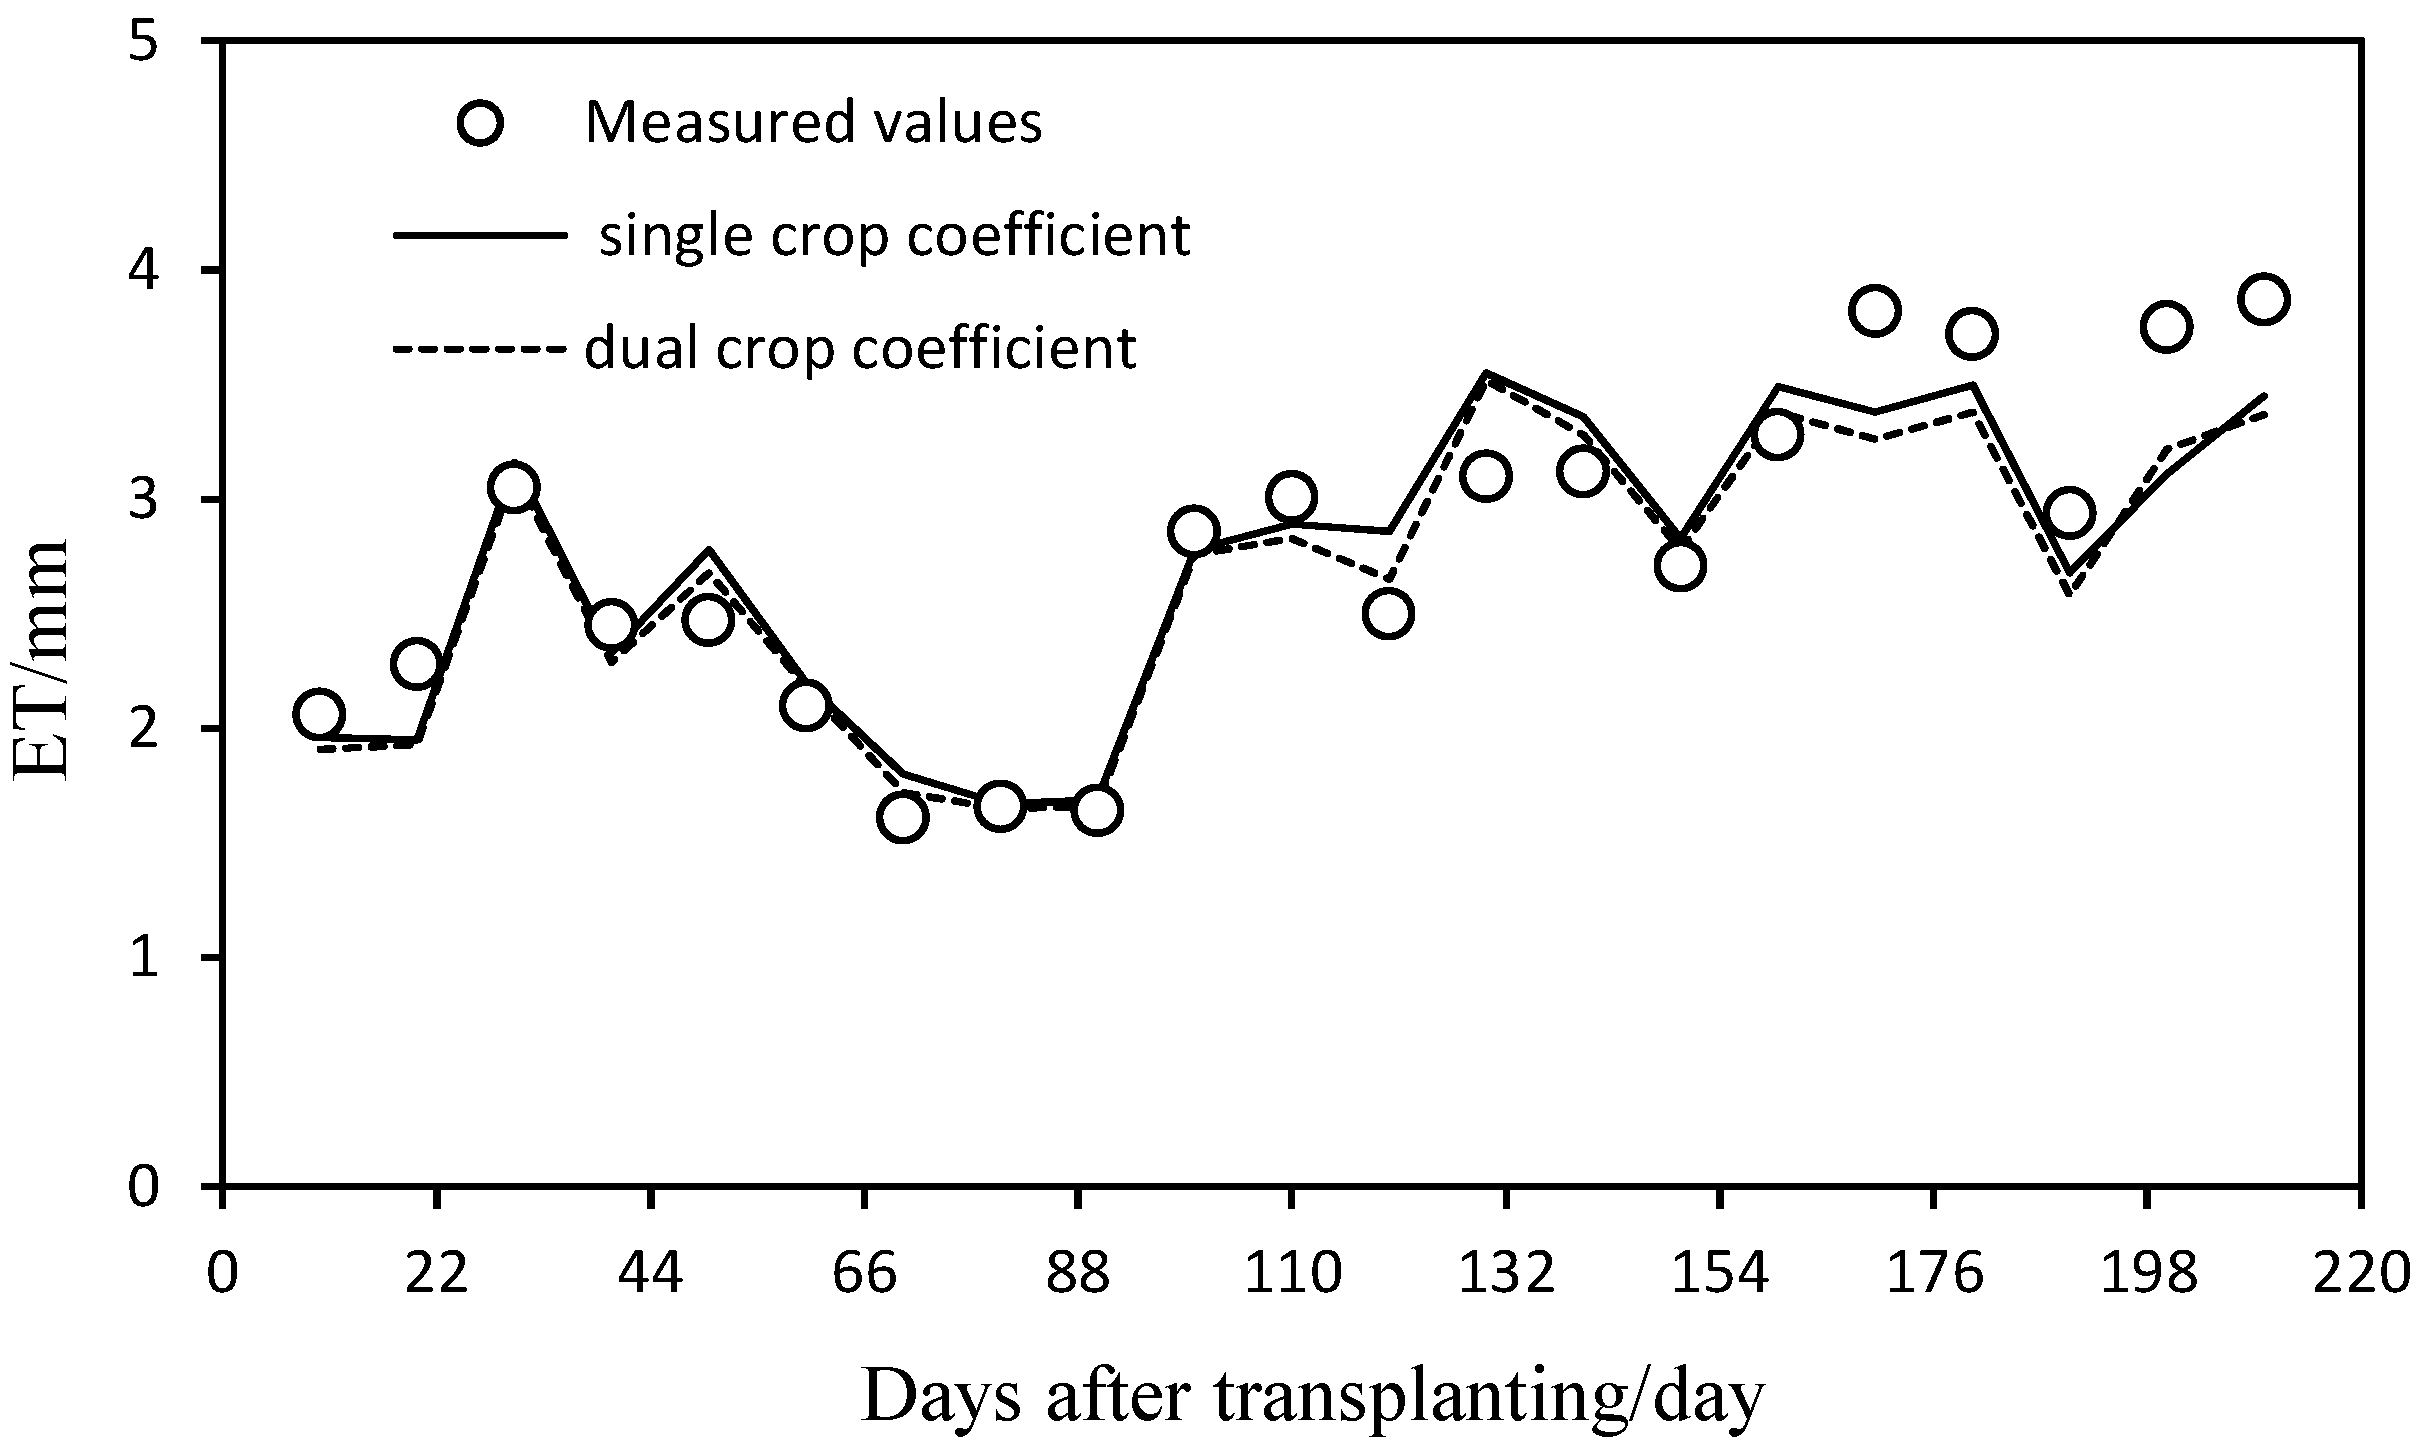
Figure 3.
Comparison between evapotranspiration (ET) estimated by single and dual crop coefficient and measured values.
Figure 3.
Comparison between evapotranspiration (ET) estimated by single and dual crop coefficient and measured values.

Table 1.
Average estimated parameters by regression analysis and indicating residual estimation errors for eggplant.
Table 1.
Average estimated parameters by regression analysis and indicating residual estimation errors for eggplant.
| Method | R2 | MAE | RMSE | dIA | b | Var(ER) |
|---|---|---|---|---|---|---|
| Single crop coefficient | 0.8374 | 0.2335 | 0.2800 | 0.9530 | 0.8281 | 0.0785 |
| Dual crop coefficient | 0.8597 | 0.2196 | 0.2700 | 0.9543 | 0.8220 | 0.0685 |
© 2018 by the authors. Licensee MDPI, Basel, Switzerland. This article is an open access article distributed under the terms and conditions of the Creative Commons Attribution (CC BY) license (http://creativecommons.org/licenses/by/4.0/).
Share and Cite
MDPI and ACS Style
Wang, S.; Li, B.; Gong, X. Research on Validity Examination of Simulated Results of Eggplant Water Requirements with Drip Irrigation under Mulch in Sunlight Greenhouse. Water 2018, 10, 130. https://doi.org/10.3390/w10020130
AMA Style
Wang S, Li B, Gong X. Research on Validity Examination of Simulated Results of Eggplant Water Requirements with Drip Irrigation under Mulch in Sunlight Greenhouse. Water. 2018; 10(2):130. https://doi.org/10.3390/w10020130
Chicago/Turabian StyleWang, Shunsheng, Bo Li, and Xuewen Gong. 2018. "Research on Validity Examination of Simulated Results of Eggplant Water Requirements with Drip Irrigation under Mulch in Sunlight Greenhouse" Water 10, no. 2: 130. https://doi.org/10.3390/w10020130
Note that from the first issue of 2016, this journal uses article numbers instead of page numbers. See further details here.