Article

Decision Support System for the Design and Planning of Low-Impact Development Practices: The Case of Seoul

1
Department of Civil Engineering, Portland State University, Portland, OR 97207, USA
2
Department of Civil Engineering, Seoul National University of Science and Technology, Gongneung-ro, Nowon-gu, Seoul 01811, Korea
*
Author to whom correspondence should be addressed.
Water 2018, 10(2), 146; https://doi.org/10.3390/w10020146
Submission received: 3 December 2017 / Revised: 18 January 2018 / Accepted: 30 January 2018 / Published: 2 February 2018

Abstract

:
This study presented the conceptual framework of the water-management analysis module (WMAM) to derive effective physical specifications for the design and planning of low-impact development (LID) practices using the storm-water management model (SWMM). This decision-support system can be used for six LID types and has the following key capabilities: determining relevant LID design parameters within the SWMM that critically influence the hydrological cycle components using a simple sensitivity analysis and determining the best hydrological values for LID planning specification. This study analyzed a highly urbanized university campus as a case study to determine the design and planning specifications for an infiltration trench and permeable pavement. In addition, the performance of different LID practices during high-intensity rainfall events was compared. The results indicate that the WMAM can be very useful in determining many LID design and planning parameters.

1. Introduction

Over the past several decades, floods have become more prevalent and streamflow has been reduced or depleted due to increased runoff and higher peak flow caused by an increased impervious surface ratio. In addition, water quality within large urban streams has deteriorated dramatically. To prevent these negative impacts, implementation of low-impact development (LID) practices has become a popular way of mitigating against frequent natural disasters [1]. Thus, LID practices have been proposed to maintain the pre-development hydrological features of urbanized districts, thereby mitigating the negative effects on receiving waters and watersheds [2]. LID practices used at a catchment level have been demonstrated to significantly reduce runoff volumes, peak flows and mass exports of several pollutants in storm water relative to traditional development [3,4].
However, there has been great ambiguity in the determination of physical LID specifications that support efficient design and planning [5], e.g., what values of specific LID components should be selected, or what sizes or numbers of LID practices should be used. Specific design and planning values for LID practices are difficult to achieve because different LID types and sizes can have similar effects on hydrological components [6]. Thus, various studies to find the best solution for LID design and planning have been performed [7,8,9,10,11,12].
Several hydrological models that analyze LID practices have been developed [13], including the best management-practice decision-support system (BMPDSS) [14], BMPs SELECTion expert system [15], rainfall–watershed bioretention (RWB) model [16], diagnostic decision-support system [17] and water-management prioritization module [18]. However, very few hydrologic models can simulate LID performance. The storm-water management model (SWMM) developed by the Environmental Protection Agency (EPA) has been updated to assess the hydrological performance of various LID types and supports a function that compares simulation results before and after the installation of LID practices.
The PCSWMM, XPSWMM and others have been greatly improved based on the original SWMM concept and program. Although they have their own unique advantages, including the integration of GIS and 2D/3D hydraulic analyses, they are unable to inform the best physical specifications of LID design and planning for urbanized study regions. Although they support effective tools for simulating the hydrological effects of various LID types, they cannot simulate multiple scenarios for LID designs and planning parameters [18]. Recent studies on LID applications incorporating the aforementioned decision-support systems (DSS) have been limited to applications for effectively mitigating flood risks and reducing runoff and pollutant levels in urban areas [19,20,21].
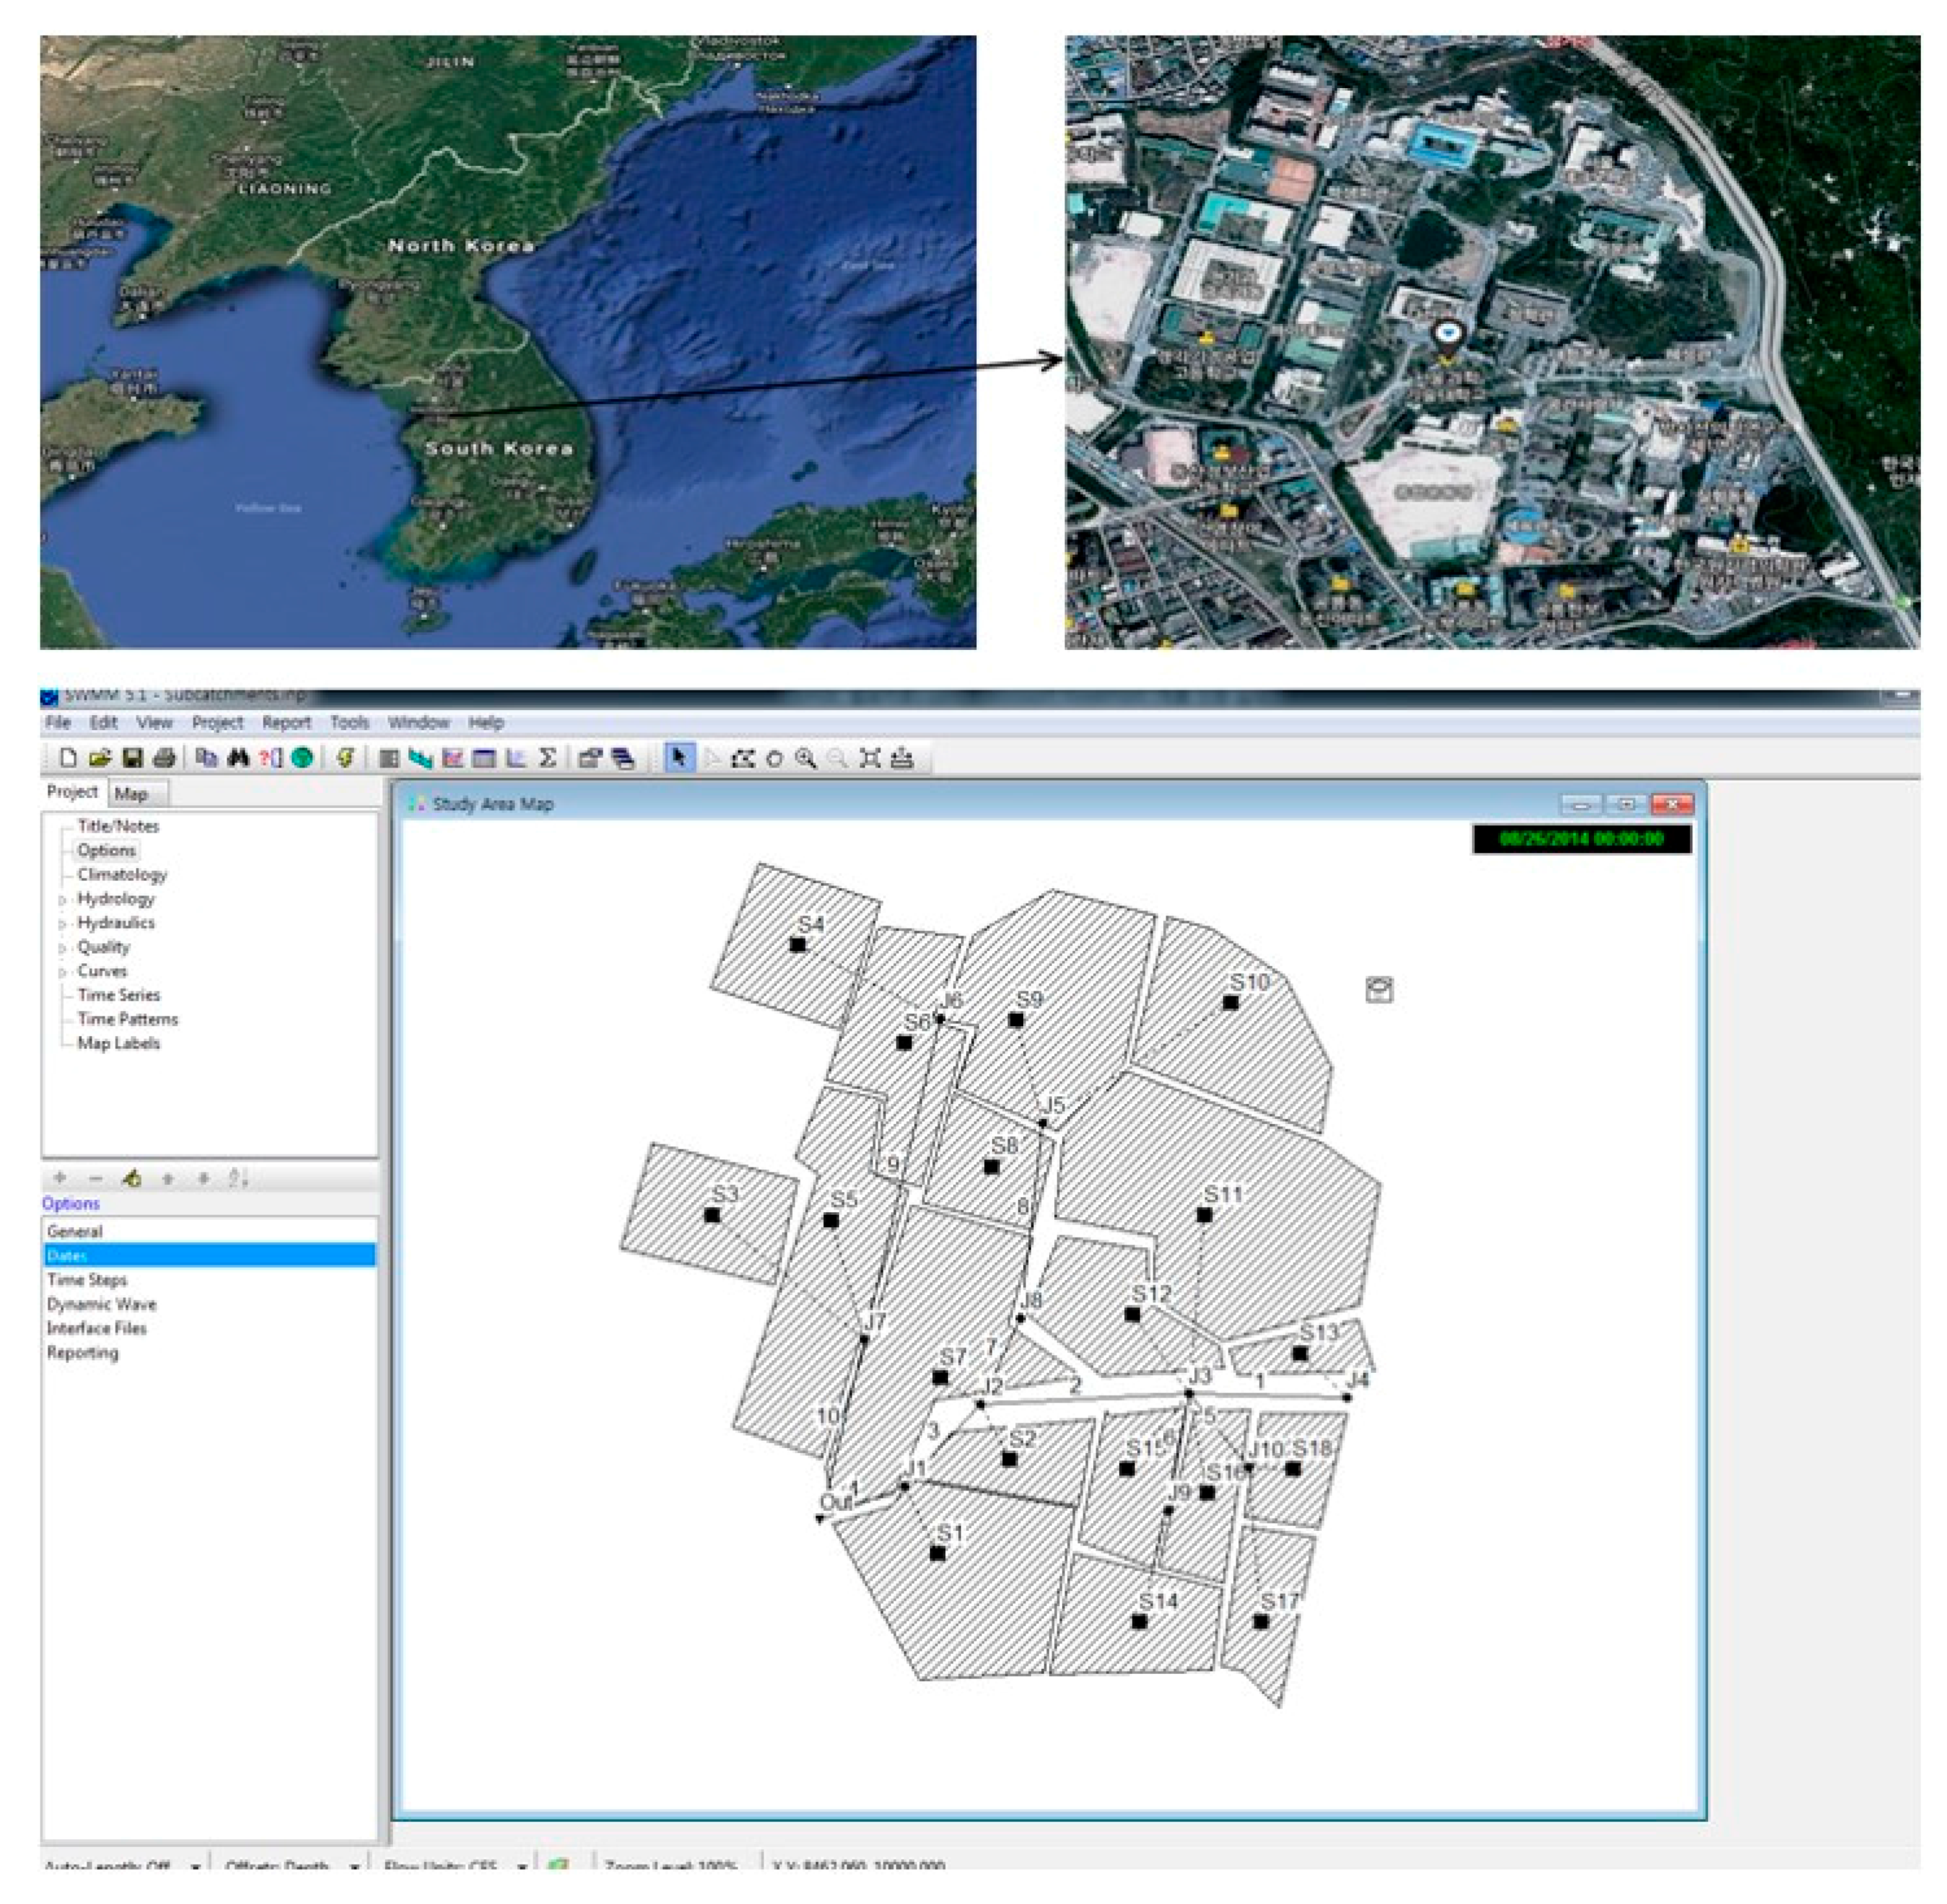
This study developed a web-based DSS named the water-management analysis module (WMAM) to determine the best specifications for LID design and planning in any urban area. The WMAM was applied to a university campus in South Korea that has been heavily urbanized. A highly urbanized area of Seoul was selected as the study area.

2. Materials and Methods

2.1. Description of the Storm-Water Management Model (SWMM) Low-Impact Development (LID) Function

The EPA SWMM [22] is a program that has been widely used to simulate urban runoff quantity and quality [23] and has also been frequently used to evaluate the effects of storm-water management based on conventional drainage systems [24] or LID designs [25]. The current version (5.1.012) provides a modeling platform for studying the hydrologic responses of various LID practices such as rain barrels, swales, permeable pavements, green roofs, rain gardens, bio-retention cells and infiltration trenches. LID control modules that provide detention storage, enhanced infiltration and evapotranspiration of runoff from localized surrounding areas have been implemented in the SWMM to simulate the hydrological behavior of such source control technologies since 2005 [26].
LID controls are represented by a combination of vertical layers whose properties include thickness, void volume, hydraulic conductivity, and underdrain characteristics; these properties are defined on a per-unit-area basis [25]. These LID controls can then be placed within selected subcatchments at any desired size or areal coverage.
The SWMM consists of an ‘LID control editor’, ‘LID group editor’, and ‘LID usage editor’. The LID control editor is used to define a LID physical specification that can be deployed throughout a study area to store, infiltrate, and evaporate subcatchment runoff. The LID group editor is used to add any type of LID controls to a specific subcatchment. In the end, the LID usage editor is used to describe how each LID control added to a LID group is deployed within the group’s subcatchment. In this LID usage editor, ‘percent of initially saturated’, ‘percent impervious area treated’, ‘area of each unit’, ‘number of replicate units’ and ‘return all outflow to pervious area’ are defined in a quantitative and qualitative way [26].

2.2. Sensitivity Analysis

Sensitivity analysis quantifies the uncertainty that can be defined as a relative variation in the output of a model (numerical or otherwise) according to variations in the input of a model [27]. The sensitivity analyses can be performed for the following purposes: first, to determine which parameters need to be analyzed, thereby reducing output uncertainty; second, to determine which parameters are irrelevant and can thus be removed from the final model; third, to determine which inputs contribute most to output variability; fourth, to determine which parameters are most highly correlated with the output; and fifth, once the model is in use, to determine the consequences of changing a given input parameter [28]. There are many different ways to conduct sensitivity analyses; however, when answering such questions, various analyses may not produce identical results.
A sensitivity analysis was performed in order to identify which parameters would be most effective in minimizing differences between before and after variations. Parametric sensitivity can be mathematically expressed as:
S P i = Q P i = f ( P i + Δ P i ; P j | j 1 ) f ( P 1 ,   P 2 , , P n ) Δ P i
where S P i is the sensitivity of parameter P i , Q is the output function, and P i is the parameter of the system response function under consideration [29].
This study used a one-at-a-time sensitivity index to quantify sensitivity by varying one parameter at a time while holding the others fixed. That is, it means the rate of change in one output component with respect to a change in the input parameters, such as berm height, vegetation volume fraction, and flow coefficient.

2.3. Study Area and Data Used

The WMAM was formulated in a highly urbanized area in Seoul, Korea, as described in Figure 1, which shows a SWMM modeling map. The study region is located between latitude 37° N and longitude 127° E. The entire area is 508,690 m2, and its urban area ratio is 92.7%. The study area is largely covered by buildings, roads and parking lots. Subcatchment S5 was selected from among 18 subcatchments for the construction of an infiltration trench because its imperviousness percentage exceeded 80%, and the area was thus more likely to be developed. Daily rainfall data for 17–26 August 2014, for the Seoul observatory were utilized in this study. A small rainfall event was used, as it proved more appropriate for the LID performance analysis. S5 covers an area of 9.14 ac (approximately 37,000 m2), which corresponds to approximately 7% of the total area. Its slope is 0.5%, and its imperviousness area ratio is approximately 80%, as S5 is primarily covered by an asphalt road. Manning’s N for the impervious and pervious areas was estimated at 0.013 and 0.38, respectively, and had been previously calibrated in urban areas of South Korea. The depth of depression storage in the impervious and pervious areas. was assumed to be 2.338 mm [30]. This value can be calibrated for precise simulations based on field discharge measurements.
The study area was simplified to 18 subcatchments and 10 junctions according to elevation, drainage system and stream network (Figure 1). The physical information was collected from a digital-elevation model (DEM), Google Earth (pro) and a land-use map, and meteorological data were obtained from the Korea Meteorological Administration.

3. Systematic Water-Management Analysis Module (WMAM) Procedure

The WMAM is a DSS used to identify the design and planning parameter specifications for LID practices and is based on the SWMM 5.1. There are six types of LID practices with between 5 and 23 design parameters each; the WMAM was developed to guide users through the automatic generation and simulation of the various LID design-parameter combinations. In addition, six LID practice planning parameters are included in the SWMM, resulting in many available combinations. A scenario analysis was conducted to estimate whether a case was good or bad and thus better define a given effect by comparing various cases. The analysis was designed to facilitate improved decision making by enabling outcomes and their implications to be considered. Six types of LID practices—bio-retention cells, rain gardens, green roofs, rain barrels, permeable pavement, and infiltration trenches—are available for use in the WMAM. The module’s primary function is to determine the most effective SWMM parameters for the design and planning of LID practices based on sensitivity and multi-scenario analyses of various hydrological components. Sensitive and effective parameters that critically influence total runoff, peak flows, infiltration and other factors can be identified through sensitivity analyses, and various cases can be simulated in detail through multi-scenario analyses.
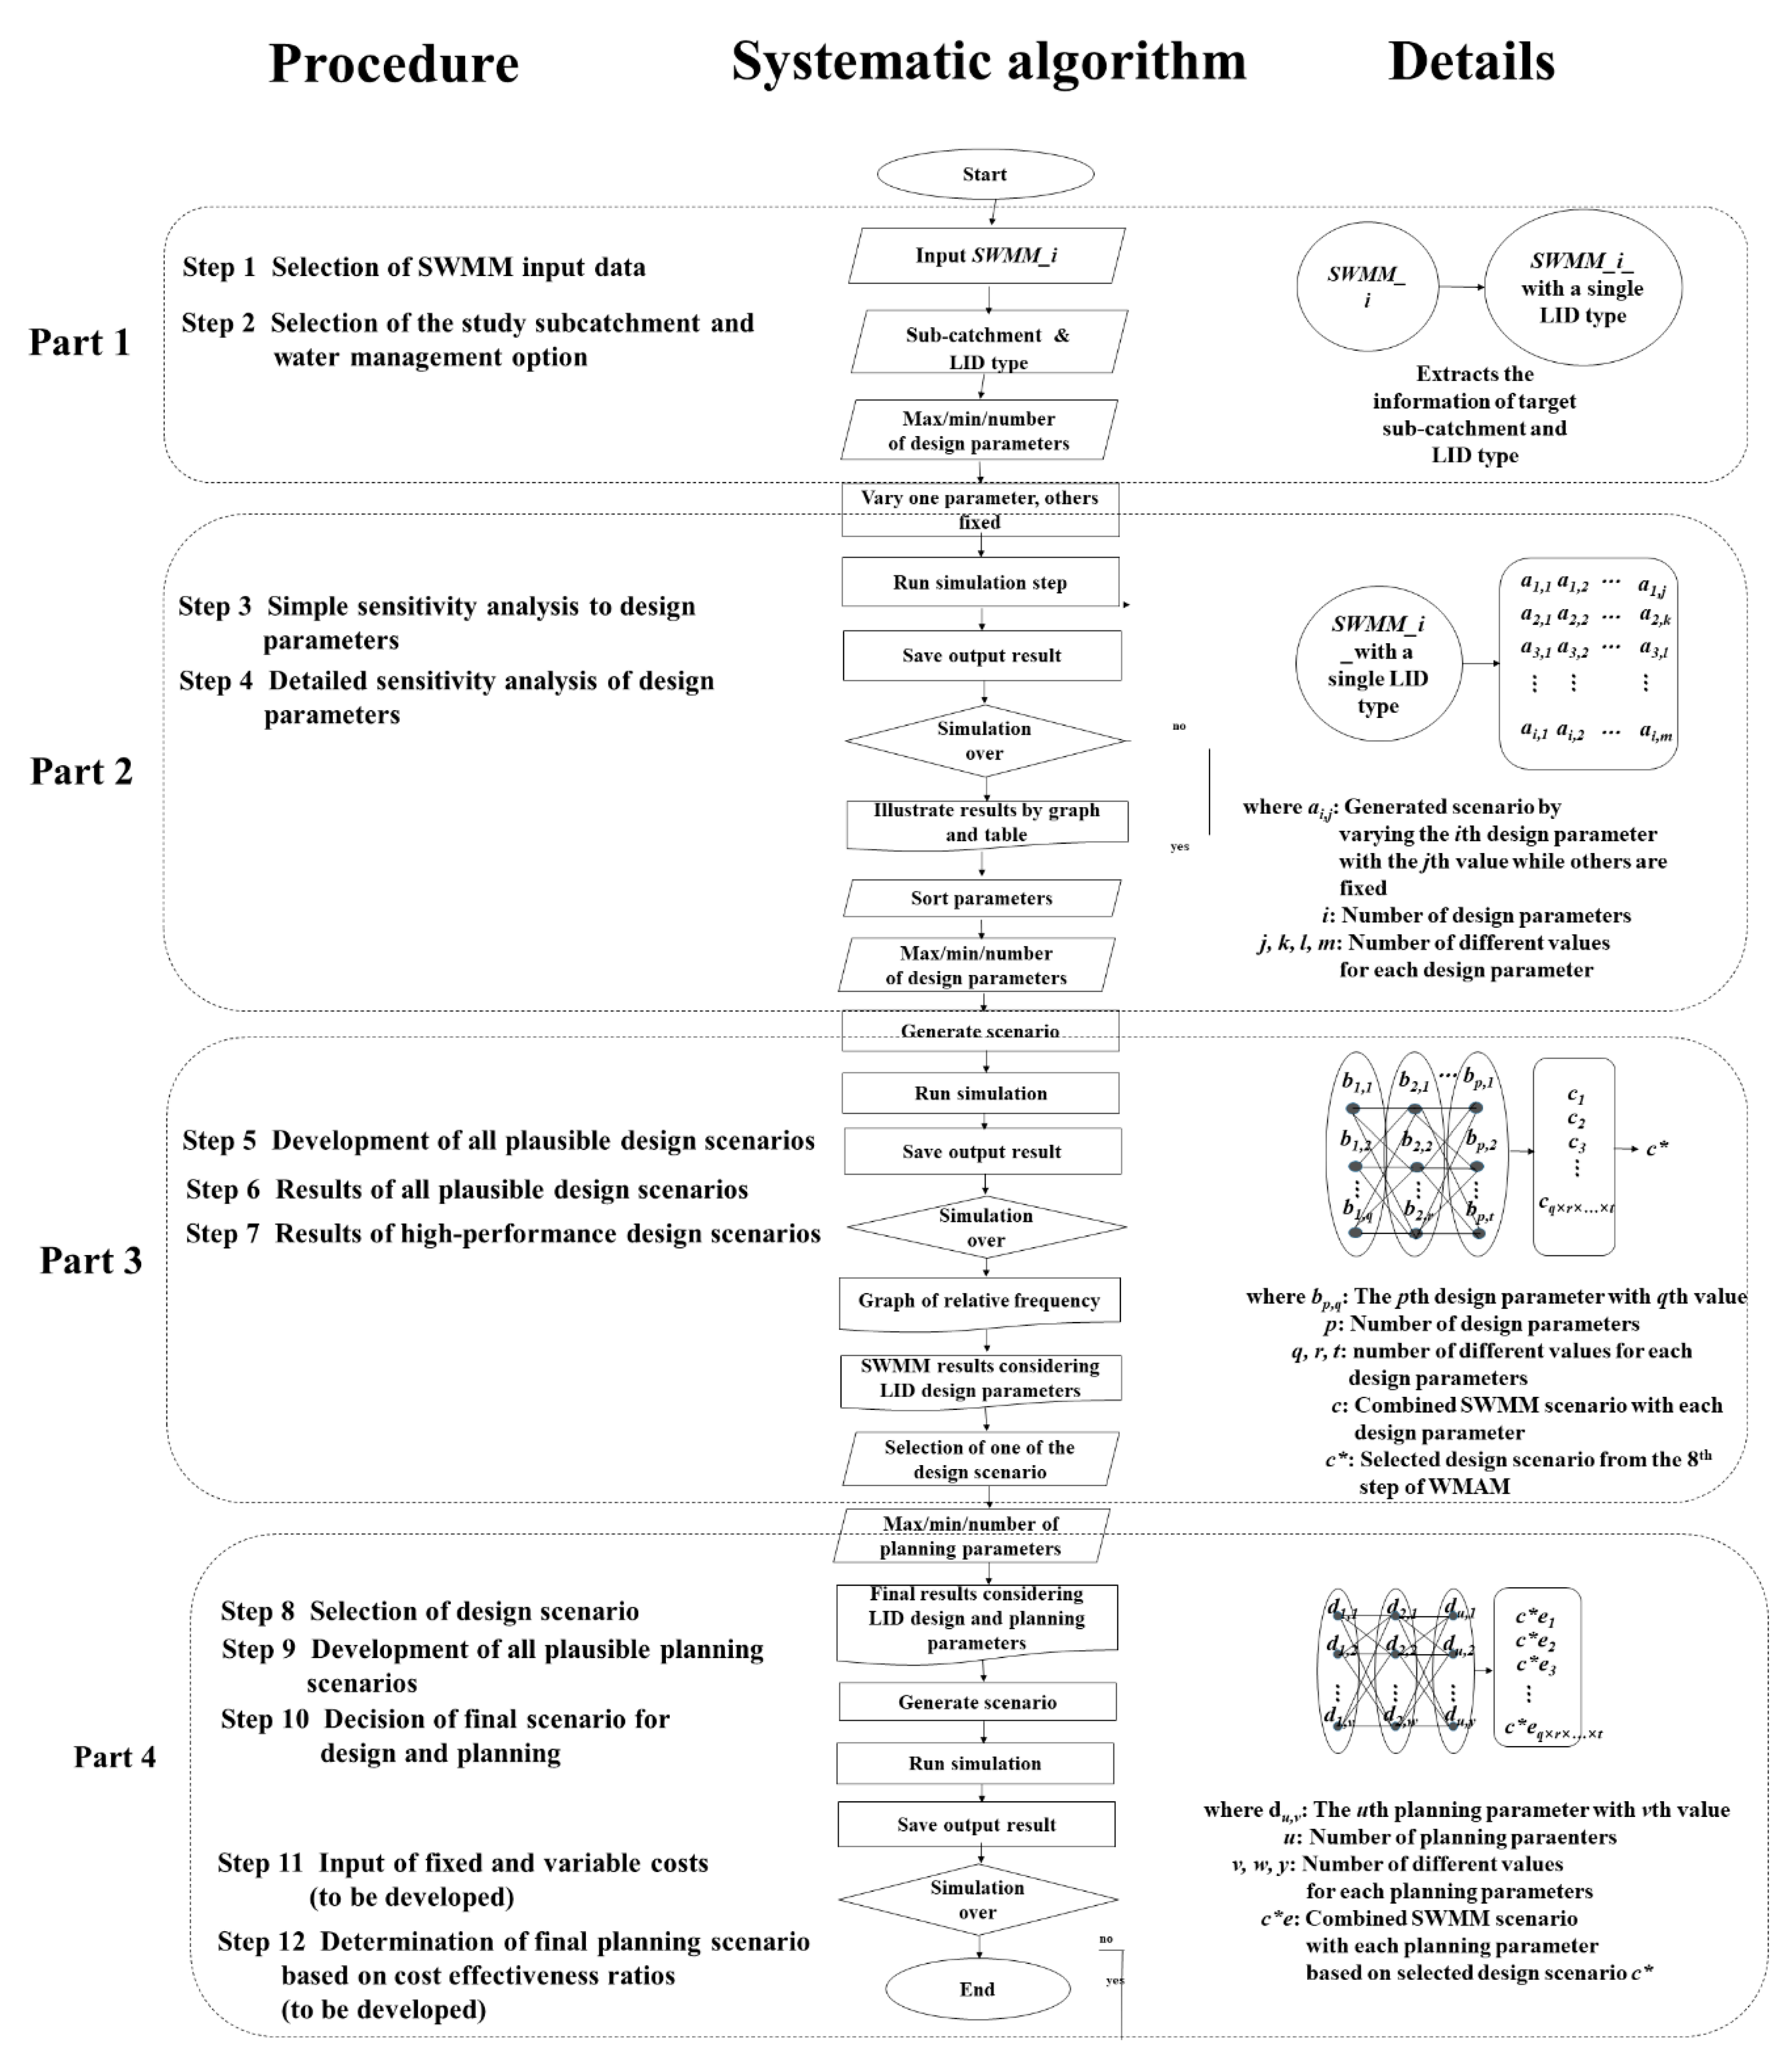
The procedure developed in this study utilizes the SWMM to determine all effective design and planning parameters related to LID practices based on automatic SWMM simulation results [10]. A flowchart of the WMAM and its details is presented in Figure 2. The WMAM includes 10 steps divided into four systematic parts: (1) loading the SWMM file and selecting the target subcatchment and LID type; (2) sensitivity analysis of the LID design parameters; (3) multiple scenario analysis of the LID design parameters; and (4) multiple scenario analysis of the LID planning parameters. The WMAM ‘procedure’ describes the 10 steps that users should follow for the developed DSS; its ‘systematic algorithm’ describes the logic of how the WMAM functions to determine the best LID design and planning. The ‘details’ section in Figure 2 describes the scenario generation and operation process based on the SWMM using the input information.
Part 1: For the WMAM, an SWMM input file, hereinafter referred to as SWMM_i, containing each LID practice should be constructed for the area of interest. Once the SWMM_i is loaded and the target subcatchment and LID types are selected in steps 1 and 2, respectively, SWMM_i is modified to another form. It excludes other information on LID types, except for the selected subcatchment and LID type.
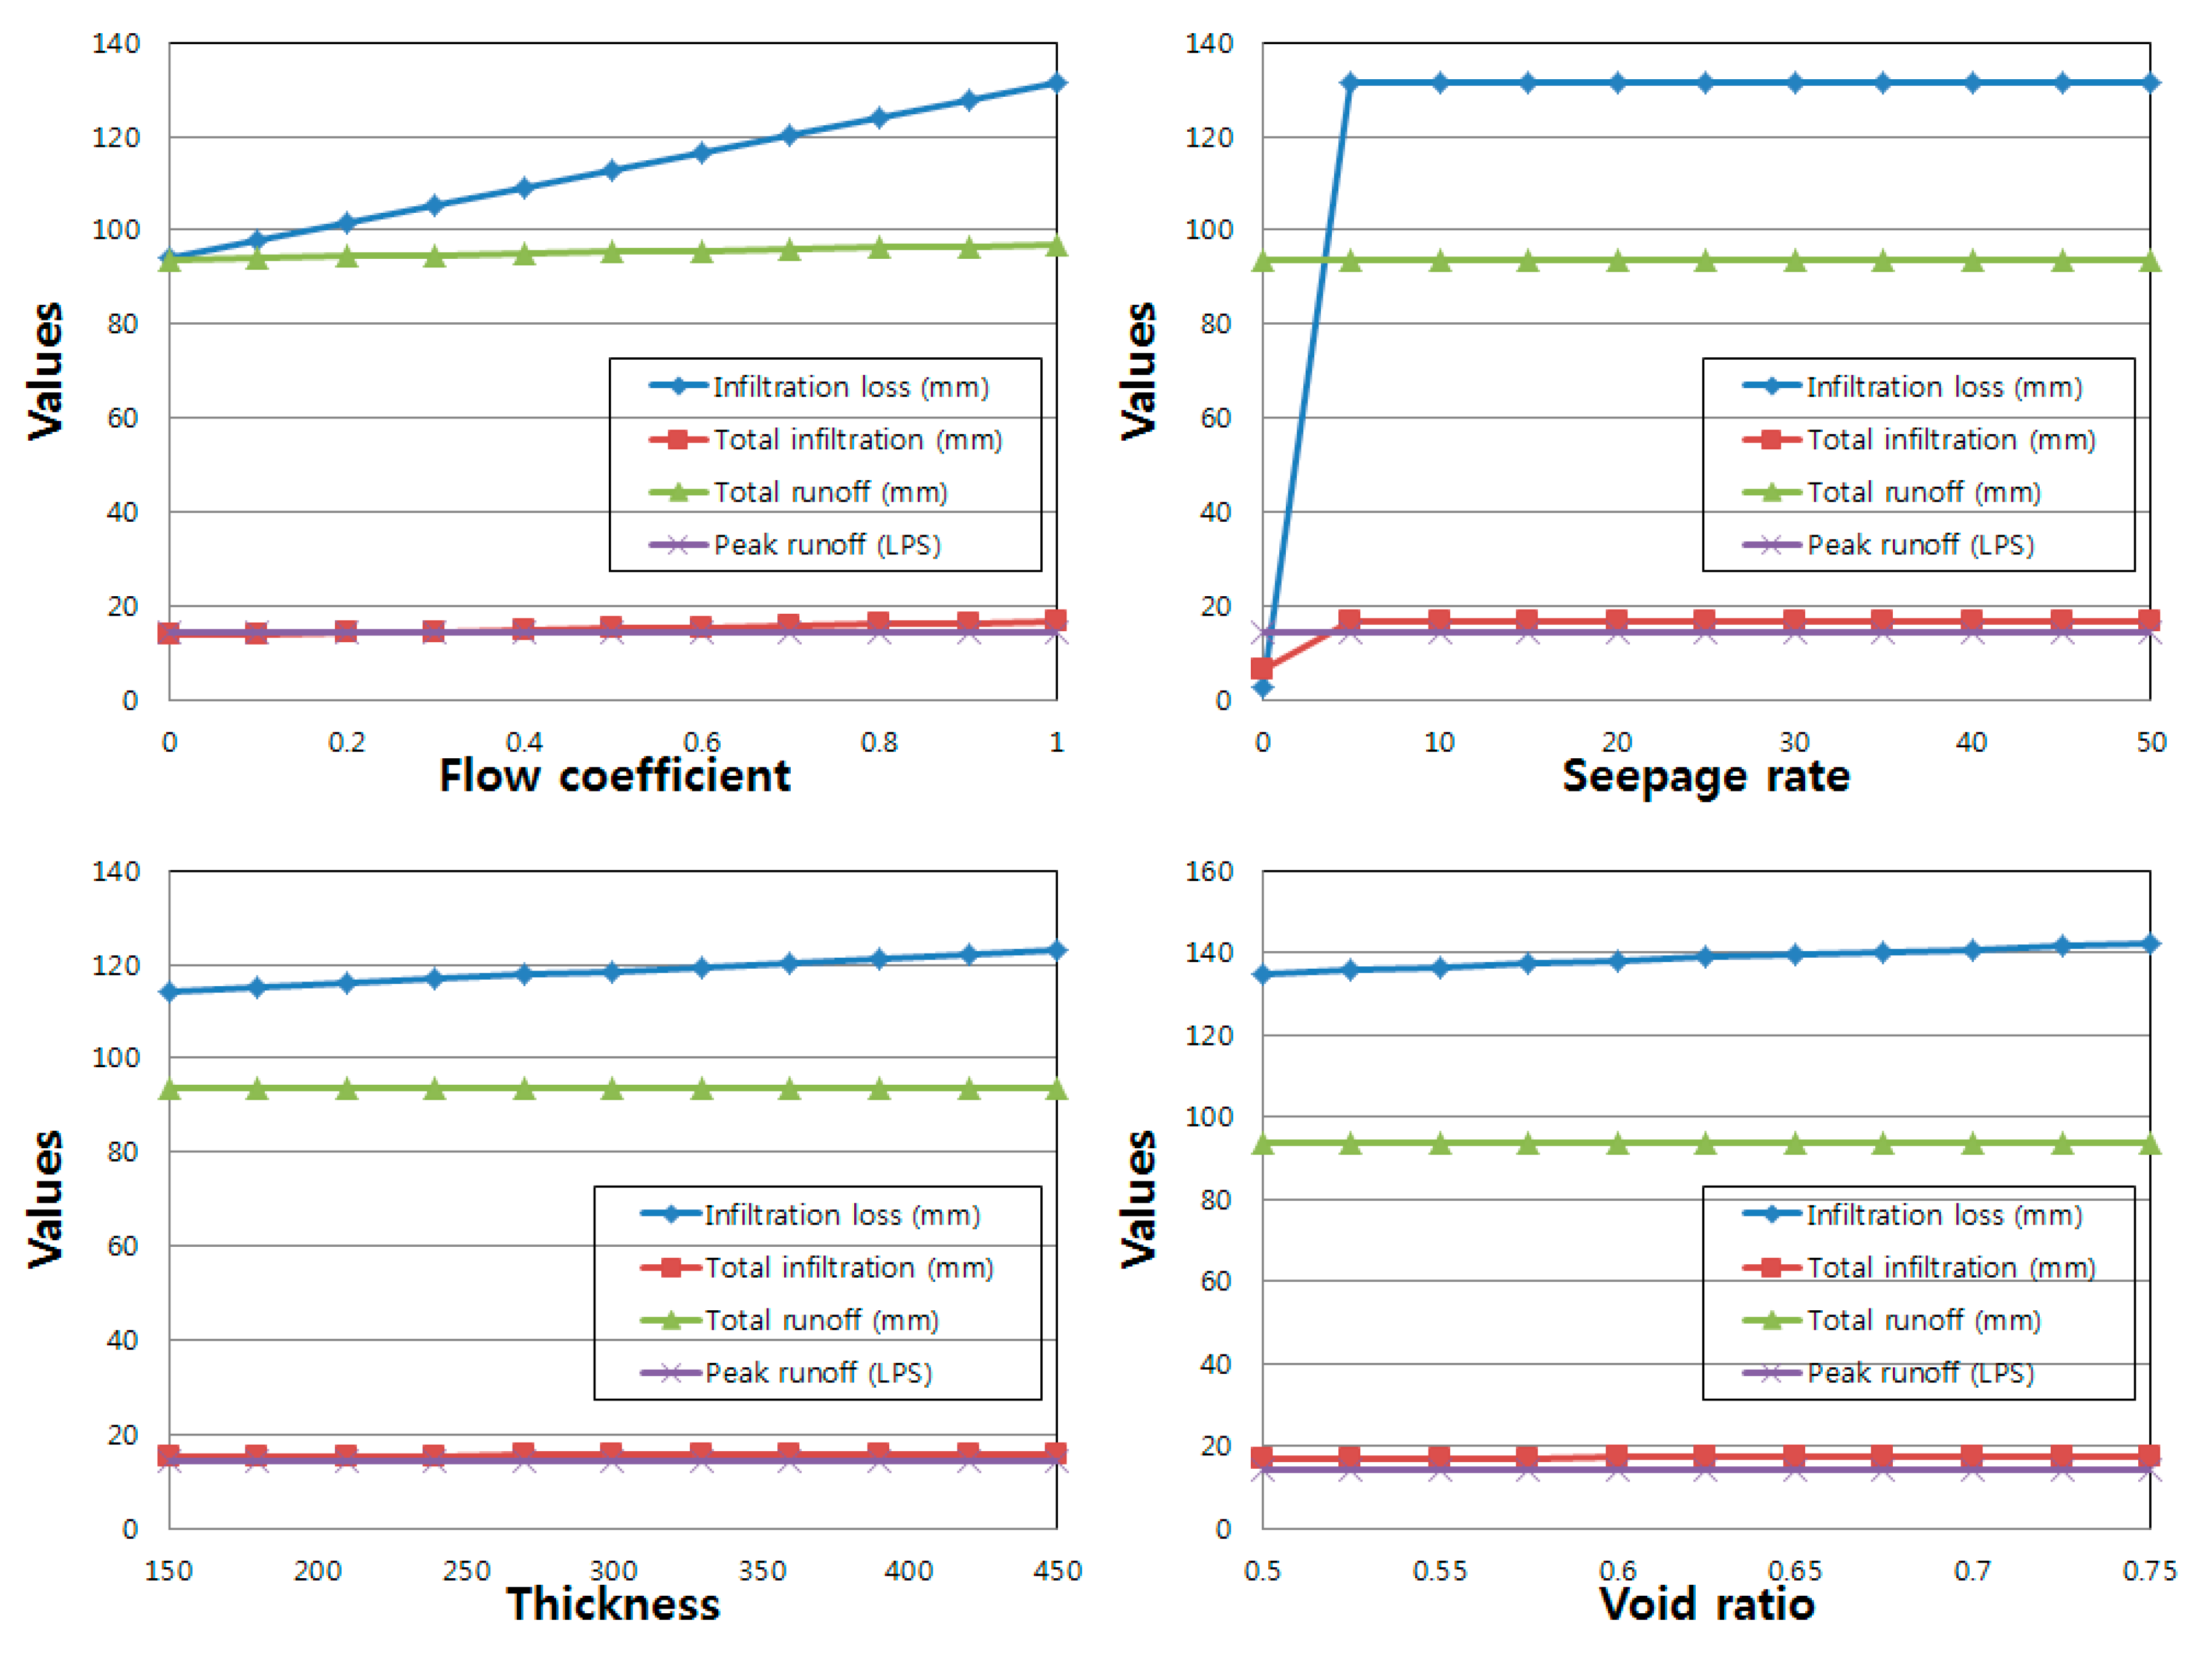
Part 2: The WMAM automatically generates and simulates all SWMM input files corresponding to the values added in step 3, and a sensitivity analysis of the design parameters is conducted. In the third step, because the necessary parameters for all LID types differ, they automatically appear according to the selected LID type. To generate all possible scenarios for sensitivity analysis, minimum and maximum parameter values and the number of scenarios considered should be defined in this step. For example, if there are i design parameters related to the selected LID type and if the number used for the analysis of each design parameter is 11, the WMAM runs i × 11 times to simulate all cases. If there are different values for each parameter (j, k, l, and m), the total number of cases used in the SWMM simulation will be the sum of the given values (j + k + l + m). In the fourth step, the WMAM simulates all defined scenarios in step 3 with a single click and then analyzes all results. Hydrological results (e.g., total runoff, peak runoff, runoff coefficient, infiltration loss, surface outflow and final storage) are illustrated in graphs and tables. Users are able to know which design parameters influence the hydrological results most, and critical LID design parameters significantly affecting the hydrological components can be identified and screened by the user. In addition, any parameter showing no or slight effects on the important hydrological component can be removed from further analysis. This step can significantly reduce the number of all available scenarios that are not meaningful.
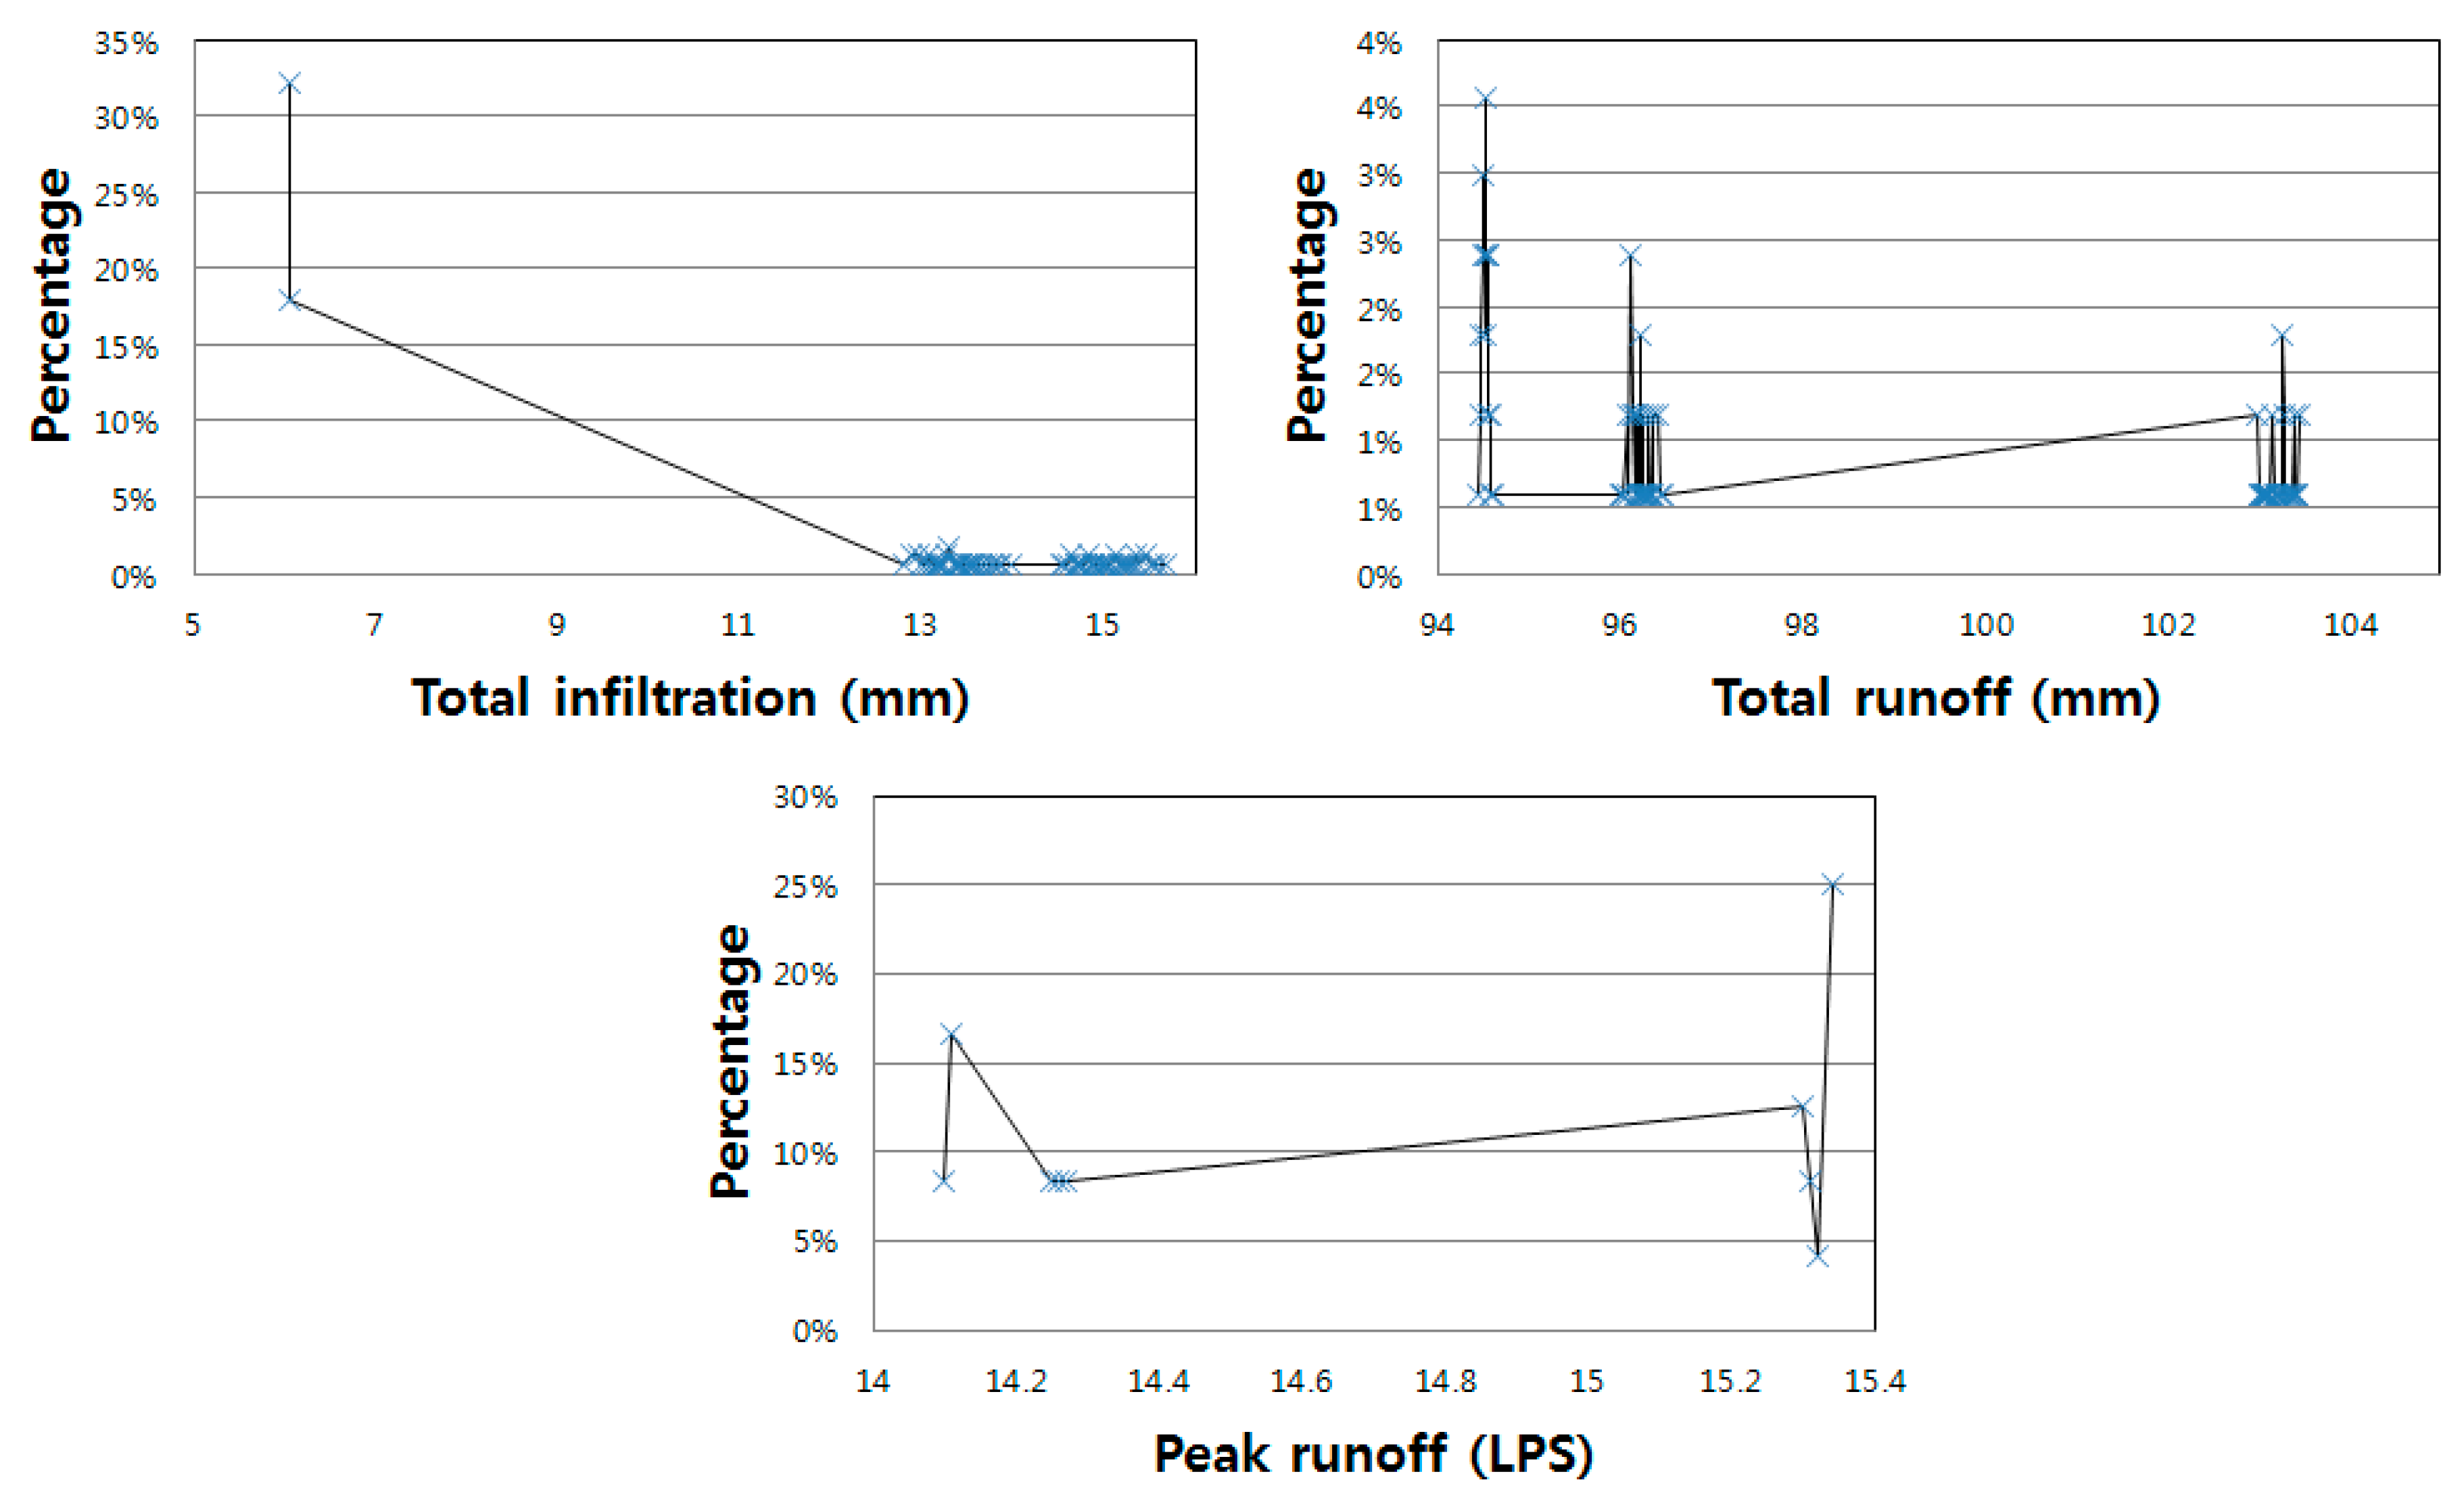
Part 3: The WMAM automatically generates various scenarios of the LID design parameters and simulates SWMM based on values entered in step 5. In the fifth step, the selected LID design parameters from the fourth step automatically appear, and users are then asked to re-enter all value ranges of the selected parameters. Target scenarios are defined in the same way as in the third step by entering minimum, maximum, and total numbers. However, this step considers all possible combined scenarios of design parameters. For example, assume that four design parameters are selected from the sensitivity analysis and that their quantities of plausible scenarios are q, r, s, and t. The WMAM will simulate the SWMM q × r × s × t times to analyze all possible combined cases of effective LID design. In the sixth step, the graph of relative frequency appears after many calculations, and users can then identify the distribution of hydrological performance. Additional simulations and calculations can be performed if users wish to find narrower value ranges for the design parameters. In the seventh step, users can recalculate all results for a specific hydrological component, and the top performance scenario can be identified.
Part 4: The WMAM automatically generates various scenarios of the LID planning parameters and runs the SWMM based on the values entered in step 9 and the scenario selected in step 8. In the eighth step, users must select the most effective scenario for LID design. Because some of the scenarios perform the same for all hydrological factors, users can choose any scenario based on other criteria, such as economic efficiency or social preferences. In the ninth step, users must enter all possible ranges of planning parameters to determine the parameters’ degrees of sensitivity to hydrological variables. Scenarios are defined as in step 5. All available combined scenarios of all planning parameters are included in this step. Because most planning parameters affect purchase and installation costs, proper numbers and sizes should be carefully determined. For example, assume that four planning parameters are selected as important criteria for LID planning and that their quantities of plausible scenarios are a, b, c, and d. The WMAM will perform the SWMM a × b × c × d times to analyze all possible combined cases of LID planning. In the tenth step, relative frequency graphs of the selected hydrological variables are presented. Users can thus choose the appropriate LID planning parameters based on their satisfactory performance. Of course, SWMM input and output files produced during this step can be downloaded for further analysis in the SWMM. The WMAM automatically generates various scenarios based on the values entered in step 9. In the end, one design and one planning parameter set will be derived from these four parts.
Thus, the WMAM can simulate numerous combinations of LID design and planning parameters and identify the most efficient scenario through a systematic process. Any step can be repeated to reduce the available value range. In future years, additional steps will be enhanced to determine the economic efficiencies of multiple LID planning scenarios based on cost-effectiveness ratios. In step 11, users enter approximate fixed and variable costs of feasible scenarios into hydrological criteria and the duration of the LID practice. The cost-effectiveness ratios for all hydrological components are then calculated. Finally, the proposed LID planning specification can be determined based on economic feasibility levels.

4. Results.

4.1. Simulation Results With and Without Infiltration Trenches

This study used the WMAM to quickly compare all simulated results from various cases with and without the installation of an LID practice. The construction of an infiltration trench, a frequently used LID practice, in a selected subcatchment was proposed in this case study. Infiltration trenches are narrow ditches filled with gravel that intercept runoff from upslope impervious areas. In this study, peak runoff and total infiltration amounts were compared for every case and were determined to be much more effective when peak runoff decreases and total infiltration increases.
The study area without an infiltration trench was first simulated. An infiltration trench was then designed and planned within subcatchment S5 using the SWMM. Design and planning parameters were estimated and entered based on field conditions. Finally, the WMAM was used to analyze diverse design and planning scenarios for the installed infiltration trench in subcatchment S5.
Total runoff, peak runoff and total infiltration results for subcatchment S5 are listed in the first row of Table 1. Total runoff was recorded as 101.87 (mm), peak runoff was recorded as 15.21 (LPS), and total infiltration was recorded as 6.48 (mm). It is assumed that total runoff and peak runoff results will decrease when an infiltration trench is constructed in subcatchment S5.

4.2. Infiltration-Trench Simulation Results

To compare the SWMM simulation results without and with an infiltration trench in subcatchment S5, an infiltration trench was added to the SWMM input file used in Section 4.1. Relatively certain values obtained from previous studies [28] were added to the design parameters for the infiltration trench in this study (Table 2). Berm height, vegetation volume fraction, surface roughness, and surface slope, which are affiliated with the surface layer, were set at 150.0 (mm), 0.0, 0.013, and 5 (%), respectively. Thickness, void ratio, seepage rate, and clogging factor, which are affiliated with the storage layer, were set at 750 (mm), 0.4, 210 (mm/h), and 0, respectively. The flow coefficient, flow exponent, and offset height, which are affiliated with the drain layer, were set at 0.0, 0.5, and 0.0 (mm), respectively.
The planning parameters for the infiltration trench were calculated to exceed 10% of subcatchment area S5 (Table 2) for infiltration trench construction in the undeveloped area of S5. Ten infiltration trenches were planned for construction in subcatchment S5. Each infiltration trench covered 460 m2 and had a surface width of 1 m per unit. The percentage of treated impervious area and that of the initially saturated area were both set to 0.
The construction results for the S5 infiltration trench are listed in the second row of Table 1. Total runoff reached 93.8 (mm), peak runoff reached 14.04 (LPS), and total infiltration reached 16.58 (mm). Total and peak runoff decreased, and total infiltration increased after infiltration-trench installation.

4.3. WMAM Application

The infiltration trench’s performance can be simulated via repeated runs of the EPA’s SWMM 5.1. However, the number of simulations required would become too large, as the best design and planning specifications must be carefully determined. The WMAM can be used to reduce the time and effort required from common users through automatic input-file generation and output-file analyses.
The SWMM input file constructed for the study area was loaded during step 1. Subcatchment S5 and the infiltration trench were selected as the target area and LID type, respectively, during the second step. In the third step, a simple sensitivity analysis was performed for 11 infiltration-trench design parameters. Maximum and minimum values and the number (n) of considered values were defined, and then 11n scenarios were automatically simulated and analyzed using the SWMM. According to the sensitivity principle, the SWMM simulates every case with a change in a single design parameter while the other parameters remain fixed. In the fourth step, the flow coefficient, seepage rate, thickness, and void ratio were found to be very sensitive parameters that influenced the hydrological component results, as shown in Figure 3 and Table 3. The inserted seepage rate values for the sensitivity analysis reached a minimum of 0.01 and a maximum of 5 and were found to be sensitive, while infiltration losses varied from 2.52 (mm) to 131.43 (mm) per the SWMM results. Thickness, void ratio, and flow coefficient values were effective at changing infiltration losses. As several design parameters are related to a single LID type, this step is very important. When the best design LID parameters are identified, combinations of highly effective parameters should be considered. The number of possible simulation scenarios becomes very high when ineffective design parameters are not ignored. Therefore, critical LID design parameters for the study area must be screened through a sensitivity analysis so that meaningful LID design cases can be identified.
Sensitive LID design parameters were used in our multiple scenario analysis. In the fifth step, after the addition of maximum and minimum values and the number of considered scenarios for the selected parameters, 168 combined scenarios were generated and automatically simulated. From the relative frequency graph generated in the sixth step, we can determine how many scenarios exhibit high or low performance according to our analyses of the 168 SWMM simulation results. As shown in Figure 4, approximately 0.006% of the 168 scenarios presented the highest value of total infiltration. As a result, a single scenario was found to provide the best set of LID design parameters. The relative frequency graphs show all results for total runoff, peak runoff, final storage, runoff coefficient, surface outflow and others. This procedure can thus help identify better combinations through a brief examination.
In the seventh step, details of the multi-scenario analysis were outlined. Multiple results of hydrological components can be selected and compared. Combined LID design-parameter values were simulated by the WMAM, and the corresponding results were calculated (Table 4). The highest total infiltration value was 15.67 (mm) when the flow coefficient (FC), seepage rate (SR), thickness (T), and void ratio (VR) were 0.3, 50, 450 and 0.75, respectively. All SWMM input and output files for the considered scenarios are available for download. This step is useful because it efficiently generates various scenarios and simulates the SWMM quickly. Moreover, users can compare target results based on a supporting list of results and use (load) downloaded files of the EPA’s SWMM 5.1 for further analysis.
The best scenario for infiltration loss (FC: 0.3; SR: 50; T: 450; and VR: 0.75) was selected in the eighth step. In the ninth step, users can employ all plausible LID planning scenario specifications using the number of scenarios considered and minimum and maximum values, as shown in Table 5. For example, if three numbers (30, 70, and 3) are entered for the initially saturated (PoIS) value percentages, the values used to combine scenarios will be [30, 50, 70]. Accordingly, Table 5 shows that (0, 50, 100), (1000, 2400), (3, 5) and (1, 2) were used for the percentage of impervious area treated (PoIAT), the area of each unit (AoEU), the number of units (NoU), and the surface width per unit (SWPU), respectively. Finally, (0, 1) was set as the return for all outflows to the previous area (RAOTPA). In this study, zero is positive and 1 is negative. In the end, 144 scenarios for LID planning parameters were generated and simulated.
All simulated LID planning scenario results were analyzed as shown in Table 6. Users can thus check the final hydrological component results of various LID planning parameters. Specifically, users can compare results by changing target hydrological components and scenarios that exhibit the best results. This step involves generating and automatically simulating scenarios and supporting SWMM input and output files for download. Relative frequency graphs help users identify the most effective scenarios. In the end, the WMAM results include LID designs and planning parameters.
One of the best LID design and planning scenarios of the 144 scenarios generated was derived using the WMAM as shown in Table 7. The corresponding results are listed in the third row of Table 1. Total runoff reached 48.76 (mm), peak runoff reached 7.28 (LPS), and total infiltration reached 67.87 (mm). These results show that use of the WMAM can reduce the time and effort required through a comparison of all simulated results with the various cases shown in Section 4.2 and Section 4.3. Total and peak runoff decreased significantly without an infiltration trench. Moreover, the derived WMAM results present better design and planning conditions than the individual SWMM simulation results with IT; and the change ratios associated with total and peak runoff were found to be −48% and −48.12%, respectively. In addition, the total infiltration estimated by the WMAM increased by 307.35% relative to the general SWMM LID simulation results with IT.
Hydrographs of the three case studies (the SWMM results without LID practices, the SWMM results with LID practices, and the WMAM application) are shown in Figure 5. As shown in the figure, the results of the WMAM application reveal significant efficiency in decreasing the discharge among the three case studies. Although each case used the same rainfall data, the peak of each graph indicates that runoff may decrease when LID practices are implemented and may decrease substantially more when the WMAM is used to design and plan the implementation of LID practices.

4.4. Application for High-Intensity Rainfall Event

This study was conducted based on a low-intensity rainfall event that resulted in 110 mm of rainfall over 10 days (17–26 August 2014) according to observations from the Seoul observatory.
The WMAM can also be used for high-intensity rainfall events. A real rainfall event from the same observatory that resulted in 374.5 mm of rainfall over 10 days (13–22 August 2012) was selected and simulated, as shown in Table 8. The maximum rainfall intensity during the heavy-rainfall event was 137 mm/day (21 August 2012). The total infiltration increased from 38 (mm) to 181.21 (mm), and the total runoff and peak runoff decreased from 307.49 (mm) to 167.89 (mm) and from 52.93 (LPS) to 29.7 (LPS), respectively, when the WMAM was used. However, compared to the low-intensity rainfall data, the relative change in the total infiltration was higher, whereas those of the total and peak runoffs were slightly lower under heavy-rainfall conditions. Although the relative changes in the total and peak runoff decreased, actual runoff decreased by factors of approximately 2.9 to 3.4. Figure 6 illustrates part of the subcatchment S5 hydrograph during the high-intensity rainfall event. The solid black bar on the top of the graph represents the high-intensity rainfall. The shapes of the graph differ because different rainfall data were used. The peak and total discharge were higher when the heavy rainfall event was used. Moreover, compared to the low-intensity rainfall event, the increase in the discharge rate was much greater when the high-intensity rainfall event was used. However, compared to the application with no LID practices and with a manually entered infiltration trench, the WMAM was found to be significantly more effective in decreasing the peak and total discharge. Therefore, the WMAM results indicate high efficiencies for both major and minor rainfall events.
Although only infiltration trenches were applied to this study, the WMAM can determine the optimal specifications for the other five LID types. In this study, the results for permeable pavement are shown in Table 9. Permeable pavements are excavated areas filled with gravel and paved over with a porous concrete or asphalt mix. The design and planning parameters for the permeable pavement were nearly the same as those of the infiltration trench, and new parameter values that refer to the soil and pavement layers were determined through the application of the WMAM. According to the sensitivity analysis of the WMAM, thickness (soil layer, 450 mm) and porosity (0.3) were additionally selected as sensitive parameters. The total infiltration increased by approximately 26.06% when the WMAM was used.
However, the relative changes in the total and peak runoffs using the WMAM compared to the manual simulation were only −13.44% and −0.78%, respectively. Figure 6 illustrates the hydrograph of the WMAM results for subcatchment S5 when using infiltration trenches and permeable pavements as LID practices. The peak and total discharge amounts increased when permeable pavement was used as the LID practice in place of infiltration trenches. Because there are differences between infiltration trenches and permeable pavement in the context of their design parameters, further studies are planned.

5. Conclusions

Many countries have suffered from floods, and the resulting damage has been tremendous. Therefore, LID practices have been considered to mitigate flood damages in urban areas. In addition, LID practices such as bio-retention cells, infiltration trenches, rain barrels, and pervious pavement have various positive functions, which include enhancement of water quality, aesthetic benefits, minor water supply, and groundwater recharge. Thus, in developed countries, the preference is to install LID practices when an area is being newly developed or re-developed. These practices can attenuate peak flows and increase lags in the timing of peaks which increase and decrease, respectively, due to urbanization. However, it is not easy to validate LID practices and find optimal hydrological design specifications.
The EPA’s SWMM and other extensions have been frequently used to simulate the hydrological function of LID practices. However, they cannot easily be used to identify the best LID design and planning specifications, as such extensions require the completion of numerous simulations and manual comparisons by changing all important parameters of LID design and planning to determine hydrological performance. The WMAM, a DSS based on the EPA’s SWMM 5.1 for LID design and planning, was developed in 2015 based on a 10-step systematic procedure and was applied to a real area to determine the most effective LID design and planning parameters. The WMAM offers a user-friendly web-based system that supports automatic scenario generation, SWMM simulation and results analysis. Specifically, the WMAM offers the following capabilities: (1) determining significant LID design parameters that critically influence the hydrological components of a study area via a simple sensitivity analysis; and (2) determining the best LID planning parameters for any hydrological aspect.
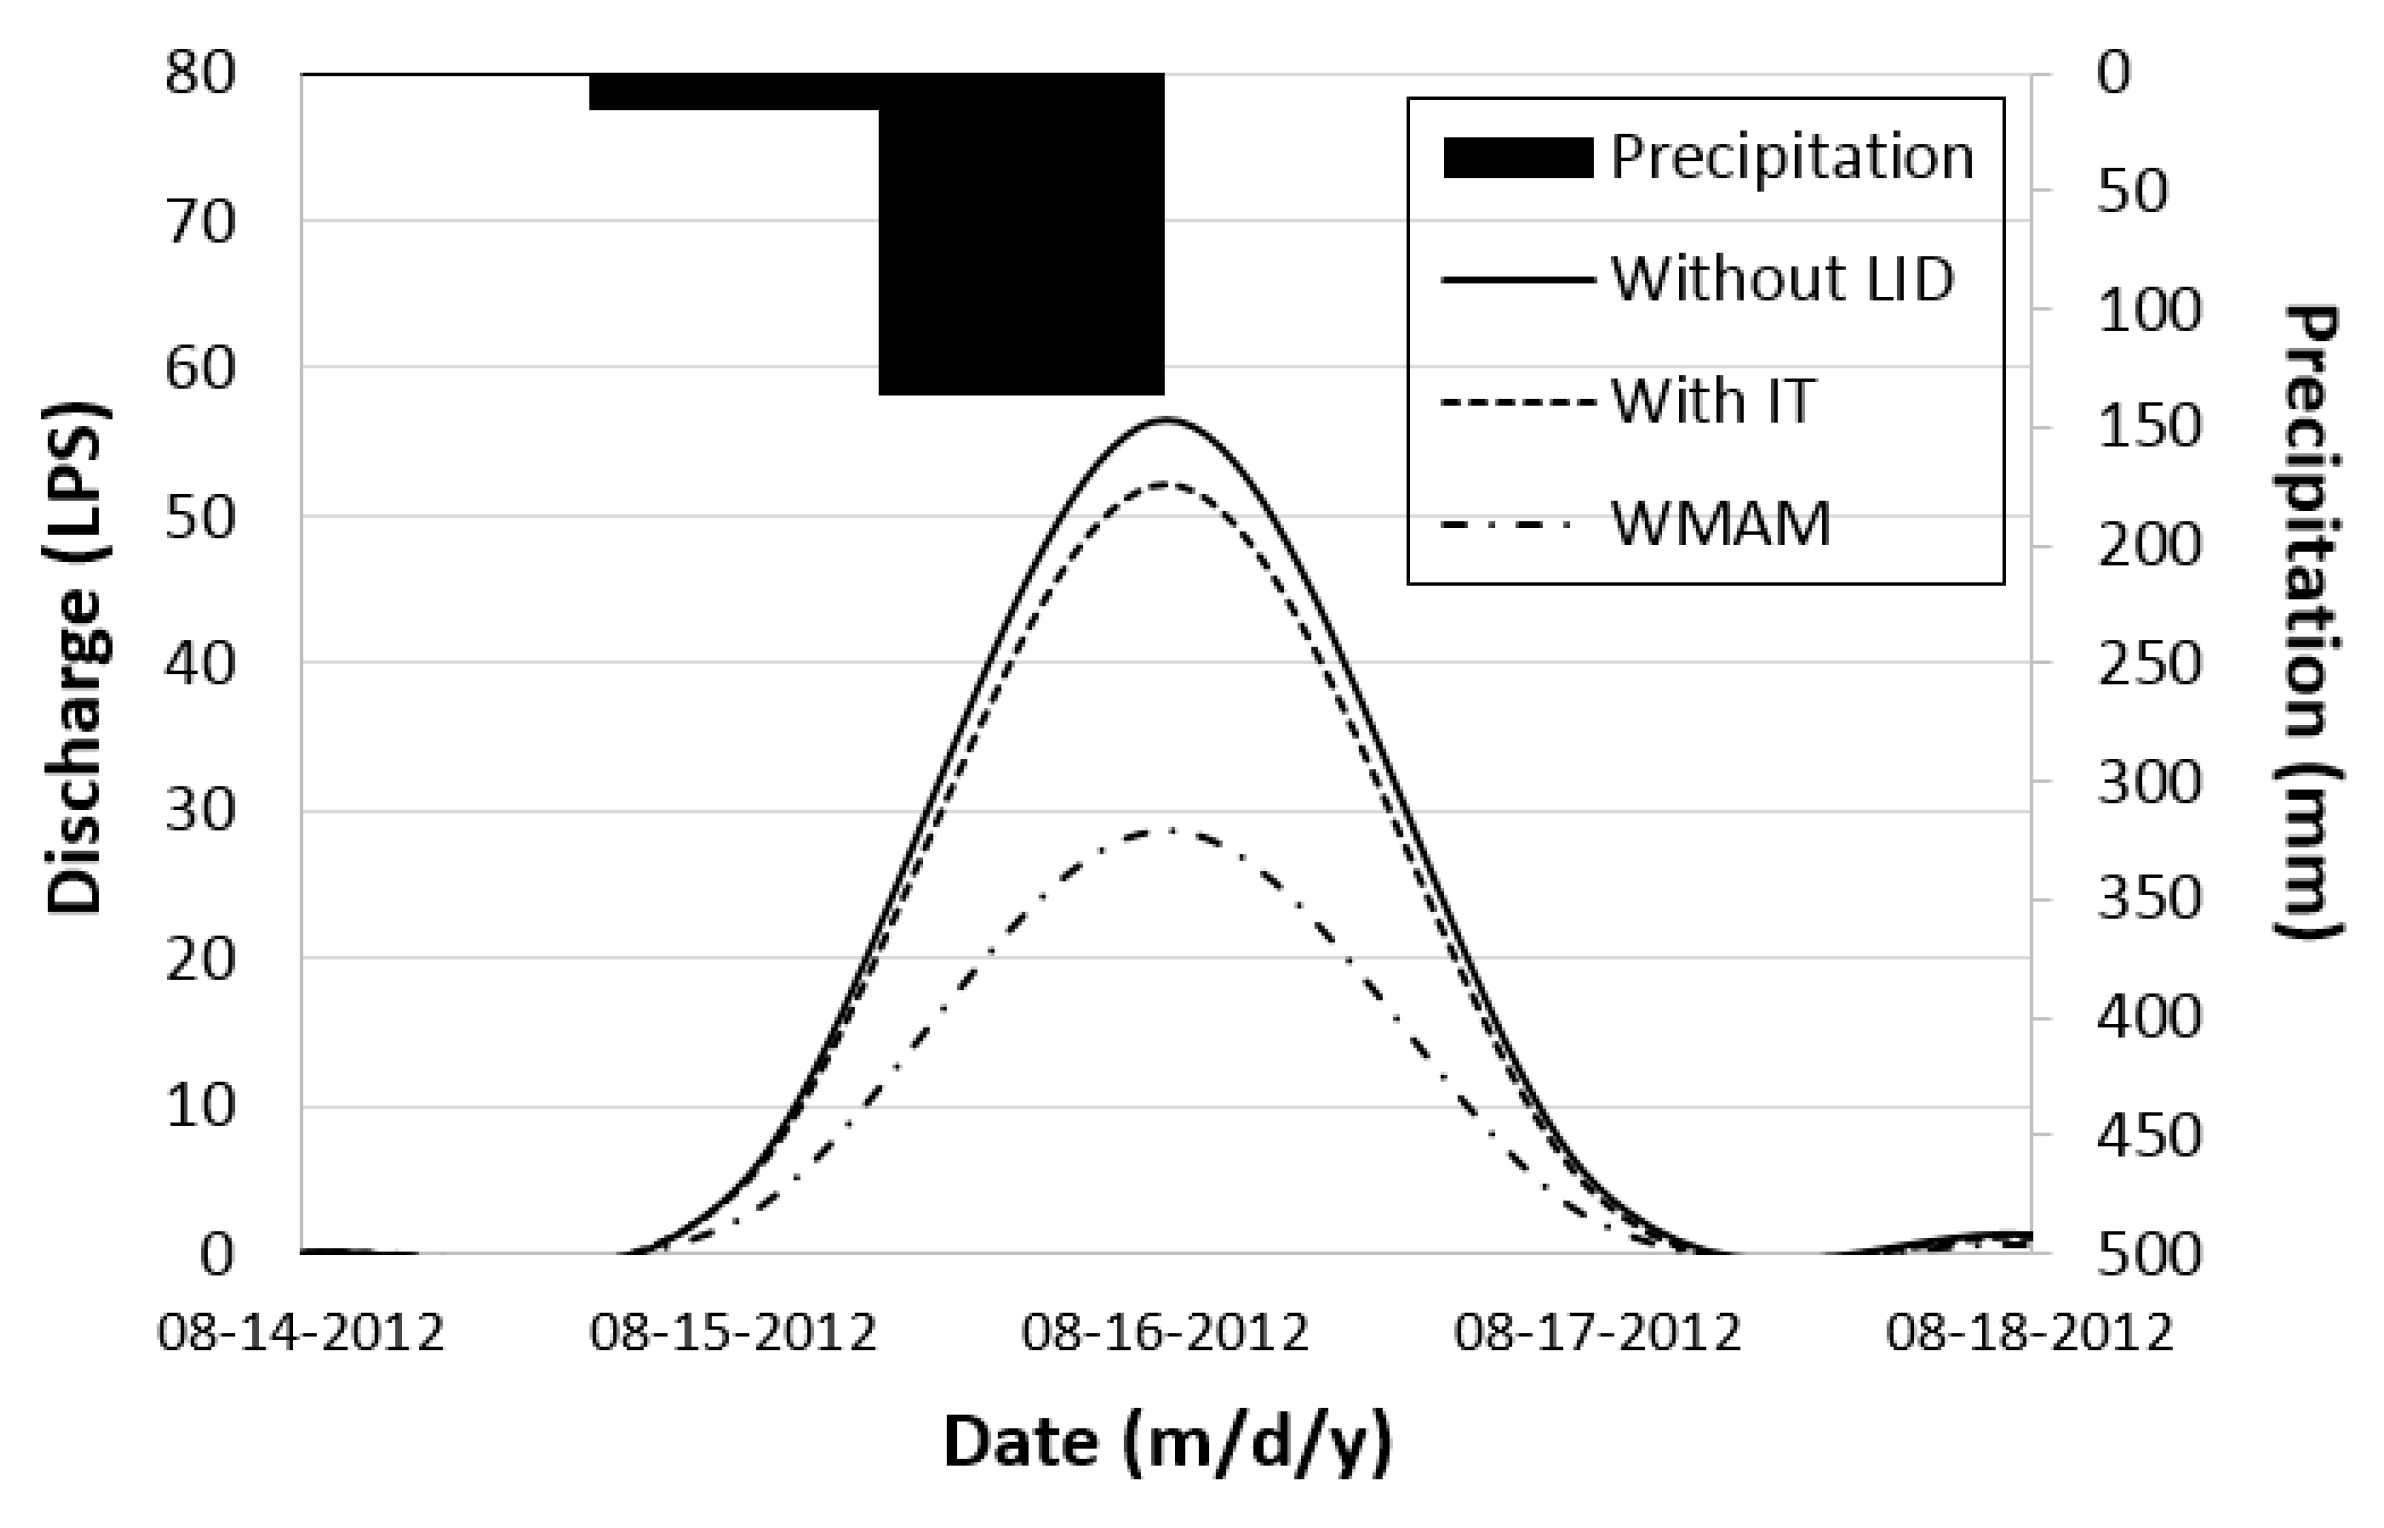
The case study shows that the WMAM supports a tool by which to determine effective LID design and planning parameters of various types by decreasing total and peak runoffs and by increasing infiltration. These results were compared with manually selected parameters. Finally, those superior scenarios with the best LID design and planning parameter values were identified by the WMAM, illustrating that the WMAM can be used in urban planning and urban-watershed management.

Acknowledgments

This research was supported by a grant (17AWMP-B083066-04) from the Advanced Water Management Research Program funded by the Korean government’s Ministry of Land, Infrastructure and Transport. This study was also supported by funding from the National Research Foundation of Korea (NRF-2016R1D1A1B04931844).

Author Contributions

Eun-Sung Chung conceived and designed the experiments; Jae-Yeol Song and Soo Hyun Kim performed the experiments; Jae-Yeol Song and Eun-Sung Chung analyzed the data; Eun-Sung Chung contributed reagents/materials/analysis tools; and Jae-Yeol Song wrote the paper.

Conflicts of Interest

The authors declare no conflict of interest.

References

  1. Dietz, M.E. Low impact development practices: A review of current research and recommendations for future directions. Water Air Soil Pollut. 2007, 186, 351–363. [Google Scholar] [CrossRef]
  2. Wang, X.; Shuster, W.; Pal, C.; Buchberger, S.; Bonta, J.; Avadhanula, K. Low impact development design-integrating suitability analysis and site planning for reduction of post-development stormwater quantity. Sustainability 2010, 2, 2467–2482. [Google Scholar] [CrossRef]
  3. Gilroy, K.L.; McCuen, R.H. Spatio-temporal effects of low impact development practices. J. Hydrol. 2009, 367, 228–236. [Google Scholar] [CrossRef]
  4. Palla, A.; Gnecco, I. Hydrologic modeling of low impact development systems at the urban catchment scale. J. Hydrol. 2015, 528, 361–368. [Google Scholar] [CrossRef]
  5. Liu, Y.; Ahiablame, L.M.; Bralts, V.F.; Engel, B.A. Enhancing a rainfall-runoff model to assess the impacts of BMPs and LID practices on storm runoff. J. Environ. Manag. 2015, 147, 12–23. [Google Scholar] [CrossRef] [PubMed]
  6. Ahmed, K.; Chung, E.S.; Song, J.Y.; Shahid, S. Effective design and planning specification of low impact development practices using water Management Analysis Module (WMAM): Case of Malaysia. Water 2017, 9, 173. [Google Scholar] [CrossRef]
  7. Rushton, B.T. Low-impact parking lot design reduces runoff and pollutant loads. J. Water Resour. Plan. Manag. 2001, 127, 172–179. [Google Scholar] [CrossRef]
  8. Jia, H.; Lu, Y.; Yu, S.L.; Chen, Y. Planning of LID–BMPs for urban runoff control: The case of Beijing Olympic Village. Sep. Purif. Technol. 2012, 84, 112–119. [Google Scholar] [CrossRef]
  9. Damodaram, C.; Zechman, E.M. Simulation-optimization approach to design low impact development for managing peak flow alterations in urbanizing watersheds. J. Water Resour. Plan. Manag. 2013, 139, 290–298. [Google Scholar] [CrossRef]
  10. Li, F.; Duan, H.; Yan, H.; Tao, T. Multi-objective optimal design of detention tanks in the urban stormwater drainage system: Framework development and case study. Water Resour. Manag. 2015, 29, 2125–2137. [Google Scholar] [CrossRef]
  11. Youn, S.G.; Kang, W.G.; Chung, E.S.; Sung, J.H. Probabilistic estimation of storage capacity for rainwater harvesting system considering climate change. Resour. Conserv. Recycl. 2012, 65, 136–144. [Google Scholar] [CrossRef]
  12. Chung, E.S.; Kim, Y. Development of fuzzy multi-criteria approach to prioritize locations of treated wastewater use considering climate change scenarios. J. Environ. Manag. 2014, 46, 505–516. [Google Scholar] [CrossRef] [PubMed]
  13. Martin, C.; Ruperd, Y.; Legret, M. Urban stormwater drainage management: The development of a multicriteria decision aid approach for best management practices. Eur. J. Oper. Res. 2007, 181, 338–349. [Google Scholar] [CrossRef]
  14. Prince George’s County. BMP/LID Decision Support System for Watershed Based Stormwater Management, User’s Guide; Department of Environmental Resources Programs and Planning Division: Largo, FL, USA, 2005.
  15. Jia, H.; Yao, H.; Tang, Y.; Yu, S.L.; Field, R.; Tafuri, A.N. LID-BMPs planning for urban runoff control and the case study in China. J. Environ. Manag. 2015, 149, 65–76. [Google Scholar] [CrossRef] [PubMed]
  16. Gülbaz, S.; Kazezyılmaz-Alhan, C.M. Hydrological model of LID with rainfall-watershed-bioretention system. Water Resour. Manag. 2017, 31, 1931–1946. [Google Scholar] [CrossRef]
  17. Wang, Y.; Montas, H.J.; Brubaker, K.L.; Leisnham, P.T.; Shirmohammadi, A.; Chanse, V.; Rockler, A.K. A diagnostic decision support system for BMP selection in small urban watershed. Water Resour. Manag. 2017, 31, 1649–1664. [Google Scholar] [CrossRef]
  18. Song, J.Y.; Chung, E.S. A multi-criteria decision analysis framework for prioritizing sites and types of low impact development practices. Water 2017, 9, 291. [Google Scholar] [CrossRef]
  19. Liu, Y.; Bralts, V.F.; Engel, B.A. Evaluating the effectiveness of management practices on hydrology and water quality at watershed scale with a rainfall-runoff model. Sci. Total Environ. 2015, 511, 298–308. [Google Scholar] [CrossRef] [PubMed]
  20. Ahiablame, L.; Shakya, R. Modeling flood reduction effects of low impact development at a watershed scale. J. Environ. Manag. 2016, 171, 81–91. [Google Scholar] [CrossRef] [PubMed]
  21. Aryal, S.K.; Ashbolt, S.; McIntosh, B.S.; Petrone, K.P.; Maheepala, S.; Chowdhury, R.K.; Gardener, T.; Gardiner, R. Assessing and mitigating the hydrological impacts of urbanisation in semi-urban catchments using the storm water management model. Water Resour. Manag. 2016, 30, 5437–5454. [Google Scholar] [CrossRef]
  22. Rossman, L.A.; Huber, W.C. Storm Water Management Model Reference Manual Volume I-Hydrology, Revised ed.; United States Environmental Protection Agency: Cincinnati, OH, USA, 2016.
  23. Gironás, J.; Roesner, L.A.; Rossman, L.A.; Davis, J. A new applications manual for the Storm water Management Model (SWMM). Environ. Model. Softw. 2010, 25, 813–814. [Google Scholar] [CrossRef]
  24. Zoppou, C. Review of urban storm water models. Environ. Model. Softw. 2001, 16, 195–231. [Google Scholar] [CrossRef]
  25. Liu, Y.; Cibin, R.; Bralts, V.F.; Chaubey, I.; Bowling, L.C.; Engel, B.A. Optimal selection and placement of BMPs and LID practices with a rain-runoff model. Environ. Model. Softw. 2016, 80, 281–296. [Google Scholar] [CrossRef]
  26. Cipolla, S.S.; Maglionico, M.; Stojkov, I. A long-term hydrological modelling of an extensive green roof by means of SWMM. Ecol. Eng. 2016, 95, 876–887. [Google Scholar] [CrossRef]
  27. Saltelli, A. Sensitivity analysis for importance assessment. Risk Anal. 2002, 22, 579–590. [Google Scholar] [CrossRef] [PubMed]
  28. Hamby, D.M. A review of techniques for parameter sensitivity analysis of environmental models. Environ. Monit. Assess. 1994, 32, 135–154. [Google Scholar] [CrossRef] [PubMed]
  29. Lee, K.S.; Chung, E.S. Hydrological effects of climate change, groundwater withdrawal, and land use in a small Korean watershed. Hydrol. Process. 2007, 21, 3046–3056. [Google Scholar] [CrossRef]
  30. Kang, T.; Lee, S. Modification of the SCE-UA to include constraints embedding an adaptive penalty function and application: Application approach. Water Resour. Manag. 2014, 28, 2145–2159. [Google Scholar] [CrossRef]
Figure 1. Storm-water management model (SWMM) modeling map of the study area.
Water 10 00146 g001
Figure 2. Detailed water-management analysis module (WMAM) procedure.
Water 10 00146 g002
Figure 3. Sensitivity analysis of the sensitive design parameters.
Water 10 00146 g003
Figure 4. Graph of the relative frequencies of the simulated scenarios.
Water 10 00146 g004
Figure 5. Hydrographs of subcatchment S5 for the three case studies.
Water 10 00146 g005
Figure 6. Hydrographs of subcatchment S5 using high-intensity rainfall data.
Water 10 00146 g006
Table 1. Comparison of total runoff, peak runoff and total infiltration for three cases.
CaseTotal Runoff (mm)Peak Runoff (LPS)Total Infiltration (mm)
Without infiltration trench101.8715.216.48
With infiltration trench (default value)93.814.0416.58
With infiltration trench from WMAM48.767.2867.87
Table 2. Applied design and planning parameters for infiltration trench.
LayerParameterUnitValueSensitivity
Design parametersSurfaceBerm heightmm150X
Vegetation volume fraction 0.0X
Surface roughnessManning’s n0.013X
Surface slope%5X
StorageThicknessmm750O
Void ratio 0.4O
Seepage ratemm/h210O
Clogging factor 0X
DrainFlow coefficient 0O
Flow exponent 0.5X
Offset heightmm0X
Planning parameters Area of each unitm2460-
Number of unitsEA10-
Surface width per unitm1-
% initially saturated%0-
% of impervious area treated%0-
Table 3. Sensitivity analysis results for infiltration loss.
Design ParameterInserted ValueInfiltration Loss
MinMaxMinMax
Flow coefficient0194.29131.43
Seepage rate0.01502.52131.43
Thickness150450114.29122.86
Void ratio0.50.75135142.14
Table 4. Results of the simulated scenarios for the low-impact development (LID) design parameters (step 7 of the WMAM).
Flow CoefficientSeepage RateThicknessVoid RatioTotal Infiltration (mm)Total Runoff (mm)Peak Runoff (LPS)
0.3504500.7515.6794.5314.1
0.3504500.715.694.5414.1
0.3504500.6515.5294.5514.11
0.3504000.7515.5194.5214.1
0.3504000.715.4494.5314.1
0.3504500.615.4494.5614.11
0.3504000.6515.3794.5414.11
0.3503500.7515.3594.5114.1
0.3504500.5515.3594.5814.11
0.3504000.615.394.5614.11
Table 5. Entered values for generating LID planning scenarios (step 9 of the WMAM).
LID UsageUnitMinMaxCount
% initially saturated%30703
% of impervious area treated%01003
Area of each unitm2100024002
Number of replicate units 352
Return all outflow to previous areay/n012
Surface width per unitm122
Table 6. Results of the simulated scenarios for the LID planning parameters (step 10 of the WMAM).
Percent of Initially Saturated (%)Percent of Impervious Area Treated (%)Area of Each Unit (m2)Number of Replicate Units (EA)Return All Outflow to Pervious Area (y/n)Surface Width Per Unit (m)Total Infiltration (mm)Total Runoff (mm)Peak Runoff (LPS)
305010003y262.5450.797.64
305010003n162.4150.797.64
305010005n167.8748.767.28
305010005n267.8748.767.28
50024005y166.9873.6115
50024005y266.9873.6115
50024005n166.9873.6115
50024005n266.9873.6115
505010003y165.3851.077.64
505010003y265.3851.077.64
505010003n165.3851.077.64
505010003n265.3851.077.64
Table 7. Results of the derived best LID design and planning scenario using the WMAM.
Design Parameters
SurfaceBerm height (mm)Vegetative volume fractionSurface roughness (Manning’s n)Surface slope (%)
000.11
StorageThickness (mm)Void ratioSeepage rate (mm/h)Clogging factor
4500.75500
DrainFlow coefficientFlow exponentOffset height (mm)
0.30.56
Planning Parameters
AoEU (m2)NoU (EA)SWPU (m)PIS (%)PoIAT (%)RAOTPA (y/n)
1000513050n
Relative Changes in the WMAM Results Compared to SWMM with IT
Total runoffPeak runoffTotal infiltration
−48%−48.12%307.35%
Table 8. Comparison of the WMAM results to a high-rainfall event.
CaseThis StudyHigh Rainfall Event
LID TypeInfiltration Trench
Total Rainfall110 mm374.5 mm
UnitTotal Infiltration (mm)Total Runoff (mm)Peak Runoff (LPS)Total Infiltration (mm)Total Runoff (mm)Peak Runoff (LPS)
With LID16.5896.814.0438307.4952.93
WMAM67.8748.767.28181.21167.8929.7
Relative change309.35%−48%−48.14%376.86%−45.4%−44.88%
Table 9. Comparison of the WMAM results to different LID types.
CaseThis StudyDifferent LID
LID TypeInfiltration TrenchPermeable Pavement
Total Rainfall110 mm
Hydrologic Component (Unit)Total Infiltration (mm)Total Runoff (mm)Peak Runoff (LPS)Total Infiltration (mm)Total Runoff (mm)Peak Runoff (LPS)
With LID16.5896.814.0415.0493.8314.04
WMAM67.8748.767.2818.9681.2213.93
Relative change309.35%−48%−48.14%26.06%−13.44%−0.78%

