Evaluation of Water Security in Kathmandu Valley before and after Water Transfer from another Basin
by
Bhesh Raj Thapa
1,2,*, 
Hiroshi Ishidaira
1,
Vishnu Prasad Pandey
2,
Tilak Mohan Bhandari
3 and
Narendra Man Shakya
4 1
Interdisciplinary Research Center for River Basin Environment (ICRE), University of Yamanashi, Takeda 4-3-11, Kofu, Yamanashi 400-8511, Japan
2
International Water Management Institute (IWMI), Nepal Office, Durbar Tole, Pulchowk-3, Lalitpur, G. P. O. Box 8975, EPC 416, Kathmandu 44600, Nepal
3
Kathmanu Upatyaka Khanepani Limited (KUKL), Tripureshowr, Kathmandu 44600, Nepal
4
Department of Civil Engineering, Institute of Engineering, Tribhuvan University, Pulchowk, Lalitpur 44700, Nepal
*
Author to whom correspondence should be addressed.
Water 2018, 10(2), 224; https://doi.org/10.3390/w10020224
Submission received: 19 December 2017
/
Revised: 13 February 2018
/
Accepted: 17 February 2018
/
Published: 23 February 2018
Abstract
:Kathmandu Upatyaka Khanepani Limited (KUKL) has planned to harness water from outside the valley from Melamchi as an inter-basin project to supply water inside the ring road (core valley area) of the Kathmandu Valley (KV). The project, called the “Melamchi Water Supply Project (MWSP)”, is expected to have its first phase completed by the end of September 2018 and its second phase completed by the end of 2023 to supply 170 MLD (million liters a day) through the first phase and an additional 340 MLD through the second phase. The area has recently faced a severe water deficit and KUKL’s existing infrastructure has had a limited capability, supplying only 19% of the water that is demanded in its service areas during the dry season and 31% during the wet season. In this context, this study aims to assess the temporal trends and spatial distribution of household water security index (WSI), defined as a ratio of supply to demand for domestic water use for basic human water requirements (50 L per capita per day (lpcd)) and economic growth (135 lpcd) as demand in pre- and post-MWSP scenarios. For this purpose, data on water demand and supply with infrastructure were used to map the spatial distribution of WSI and per capita water supply using ArcMap. Results show a severe water insecurity condition in the year 2017 in all KUKL service areas (SAs), which is likely to improve after completion of the MWSP. It is likely that recent distribution network and strategies may lead to inequality in water distribution within the SAs. This can possibly be addressed by expanding existing distribution networks and redistributing potable water, which can serve an additional 1.21 million people in the area. Service providers may have to develop strategies to strengthen a set of measures including improving water supply infrastructures, optimizing water loss, harnessing additional water from hills, and managing water within and outside the KUKL SAs in the long run to cover the entire KV.
1. Introduction
Fresh water is a key resource for human health, prosperity, and biodiversity. Water is likely to be a constraint on economic growth. The cost of global water insecurity is estimated to be $500 billion annually and is likely to be a drag on the world economy by 1% or more of gross domestic product (GDP) [1]. The United Nations (UN) general assembly has set the global agenda to achieve universal and equitable access to safe and affordable drinking water for all by the year 2030 as one of its sustainable development goals (SDG) for the water sector. To achieve and measure those targets, water security has emerged as a prominent issue among water and development communities globally. The concept of water security is complex [2] because it incorporates different dimensions. It needs to consider local, regional, and national perspectives of holistic water management and must balance resources protection with resource uses associated with health, education, energy, and food security.
Water security (and its reverse, water insecurity) at any level, whether from a household perspective or a global one, is about more than just sustainable access to adequate quantities and an acceptable quality of water for people and economic activities at an affordable cost to lead clean, healthy, and productive lives [2]. It is also about healthy aquatic ecosystems and protection against water-related disasters in a climates of peace and political stability [3,4]. Security is an imbalance between supply and demand that varies with local conditions [5]. Translating water security into numerical terms helps clarify the concept and reduce ambiguity. Therefore, several indicator-based water security-related indices have been developed to quantify water insecurity or security [6,7]. Different researchers have defined components of water security differently and have included: basic needs, agricultural production, environmental flows, risk management, and independence [6]; household, economic, urban, environmental, and resilience to water-related disaster [8]. Other indicators and indices that are used for similar purposes include the basic human need index [9], the water stress index [10], the watershed sustainability index [11], the water supply index [12], the water security status indicator [13], and the water poverty index [14]. The details of several water security indicators and their dimensions are listed by [15].
A national-level analysis of water security by the Asian Development Bank (ADB) in 2016 shows that South Asia had the lowest overall water security index in 2014 in the Asia-Pacific region [3]. Nepal positions itself 43rd out of 48 Asian and Pacific countries and fourth among six South Asian countries with a national water security (NWS) index of 2 out of 5. For the five dimensions of water security considered in the ADB (2016) study, out of a possible score of 20, Nepal got 5.3 for households, 11.3 for the economy, 6.0 for urban, 10.7 for the environment, and 4.0 for resilience. This reflects water insecurity in all aspects. Hence, to achieve water security and enhance/sustain economic development, investment in water infrastructure and institutions in developing member countries is crucial [3].
While focusing on the security of potable water for a household, it is crucial to satisfy needs for household water, sanitation, and hygiene. Various international organizations like the World Bank (WB) and the World Health Organization (WHO) have recommended 50 L per capita per day (lpcd) as the basic water requirement for drinking, sanitation and hygiene, cooking, and bathing [9,16]. Higher water requirements were proposed by different organizations and researchers for the economical use of water for domestic and industrial needs, such as 274 lpcd [17,18] or 135 lpcd [19,20]. The government of Nepal aims to provide 135 lpcd of domestic water to the residents of Kathmandu Valley by the year 2025 [21] after the completion of MWSP.
To achieve the sustainable development goal (SDG) target for the water sector, the government of Nepal (GoN) is investing in several water-related infrastructure developments across the country. The development of infrastructure and institutions is overcoming urban water insecurity in large cities [22]. One of the largest projects in the water sector since the year 2000 has been an inter-basin water transfer project called Melamchi Water Supply Project (MWSP), which aims to bring water to the Kathmandu Valley (KV) from water sources outside the valley. MWSP plans to supply 510 million liters a day (MLD) of water in two phases: 170 MLD in the first phase by the year 2018, and an additional 340 MLD in the second phase by the year 2023. Whether or not this mega project can contribute to achieving the SDG target in Nepal remains to be seen.
In this context, the main purpose of this study is to assess water security in the KV in different stages of MWSP implementation through considering the basic human need of 50 lpcd and the planned water supply of 135 lpcd. This research has used a ratio of water supply to demand as an indicator of water security. Based on the evaluation of water security statuses, recommendations will be made for long-term solutions in order to supply adequate water and reduce the deficit between water demand and supply in different time periods.
2. Materials and Methods
2.1. Study Area
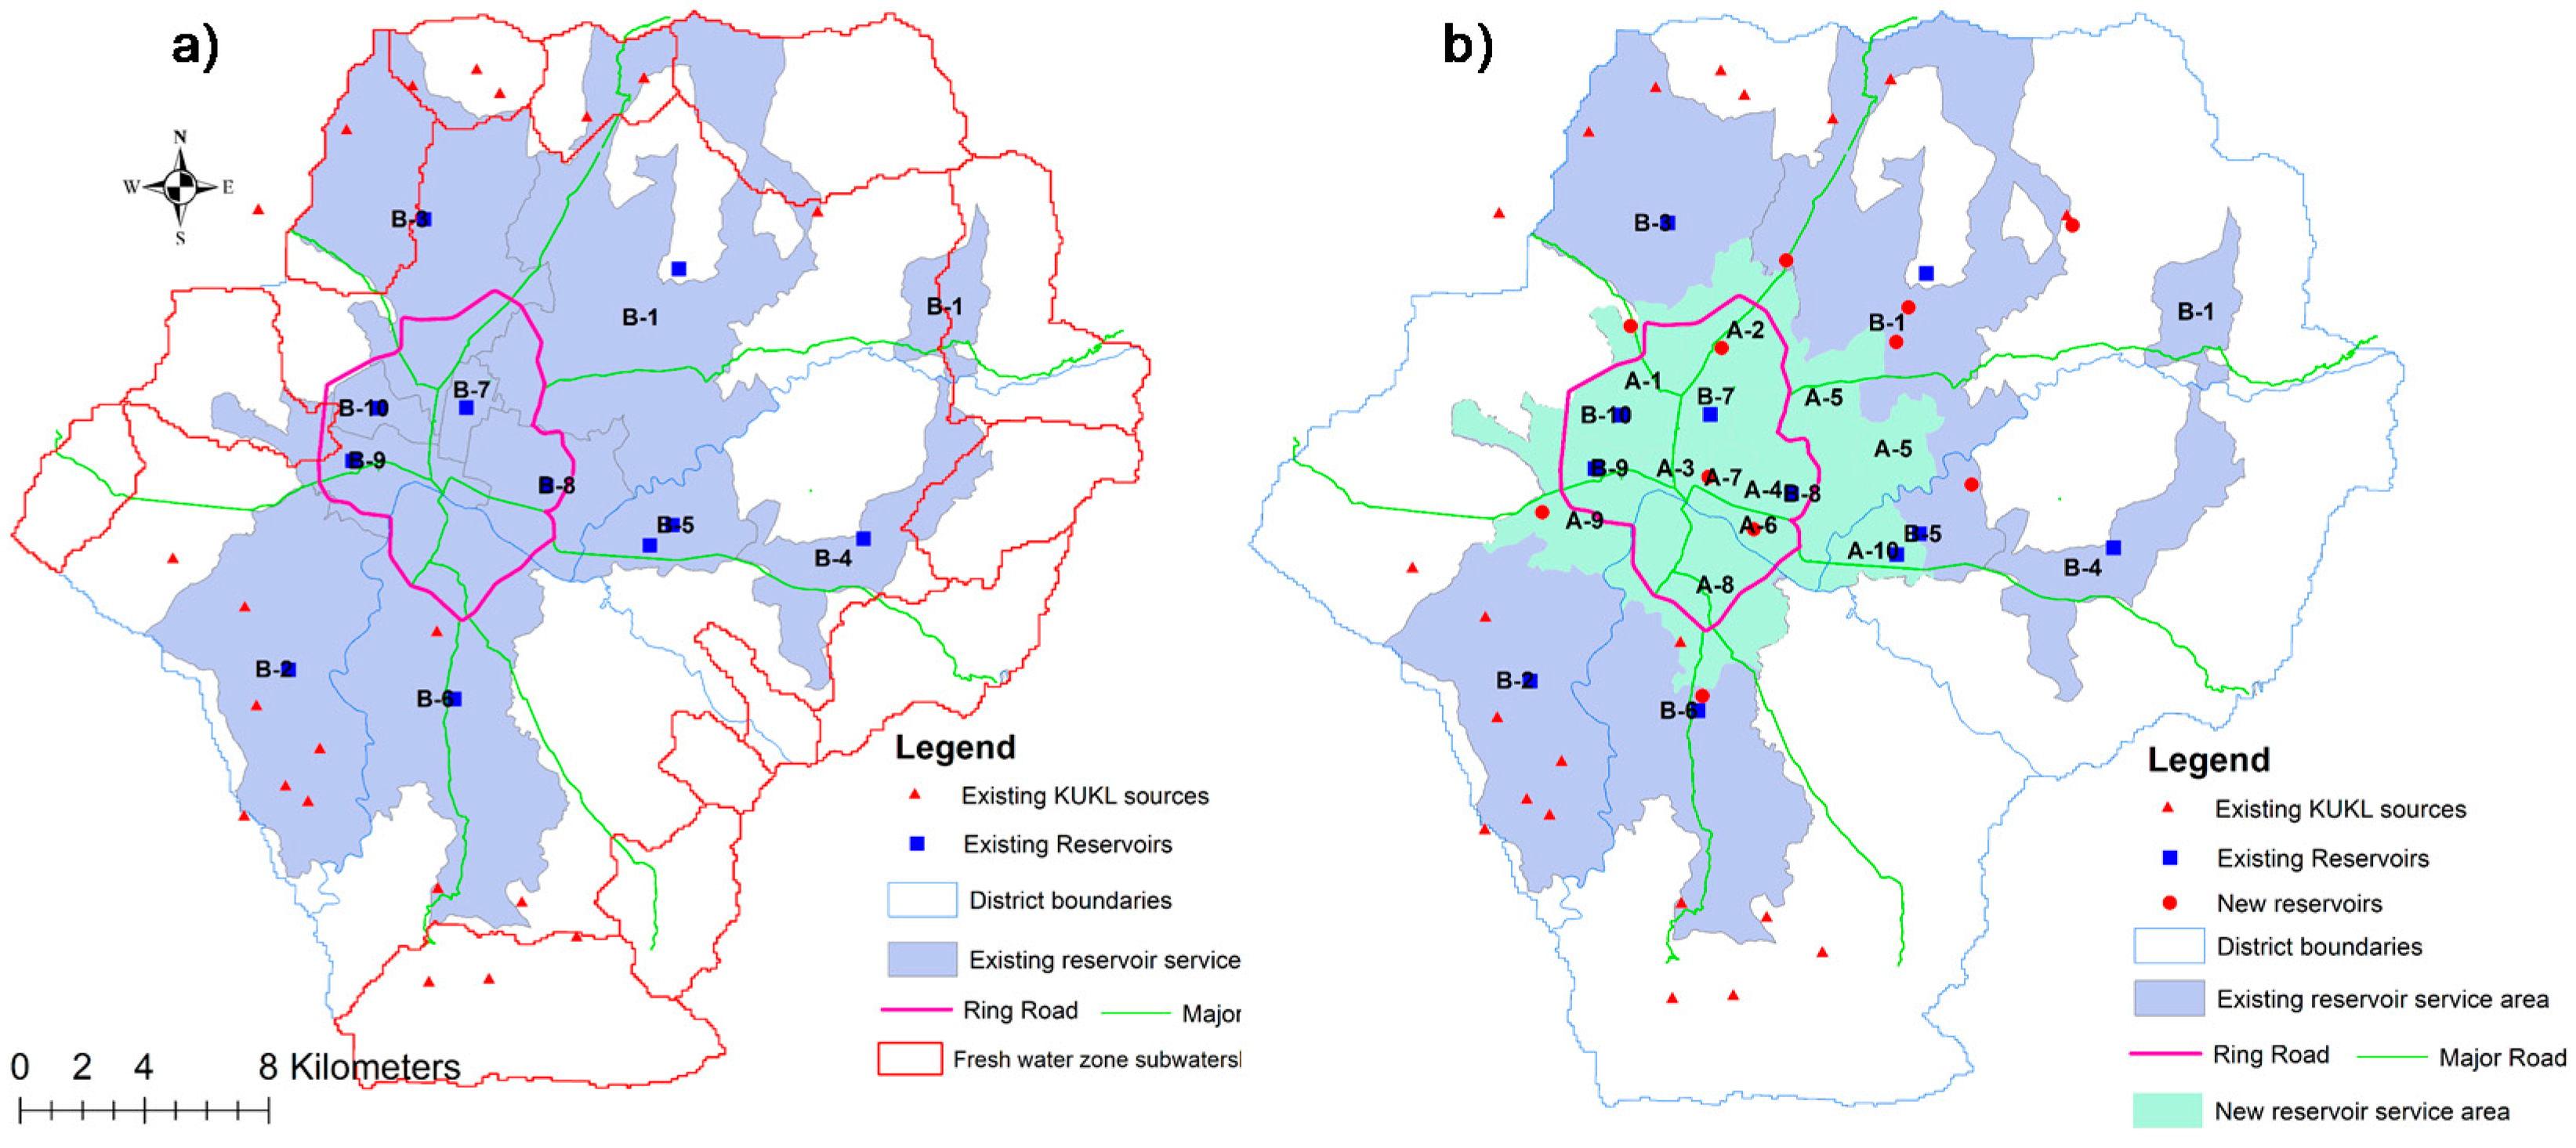
The Kathmandu Valley (KV) is a watershed area of 664 km2 and is bowl-shaped, consisting of three districts: Kathmandu, Bhaktpur, and Lalitpur. Kathmandu Upatyaka Khanepani Limited (KUKL) is the agency responsible for supplying most of the potable water in the KV. KUKL covers 45% of the total valley area and serves 71% of the valley’s population [23], with potable water and the rest of the demand met through private groundwater pumping wells, water tankers from vendors, dug wells, and water bottle industries. KUKL plans to supply an additional 510 MLD water through two phases (170 MLD in the first phase and an additional 340 MLD in the second phase) of MWSP by constructing 10 new reservoirs. KUKL plans to supply Melamachi water inside the ring road (the major road in Figure 1b) through 10 new reservoirs (under construction and to be completed in the first phase of MWSP), and the rest of the area will be served by existing KUKL reservoirs, as shown in Figure 1a,b and the name of services area, area served by each reservoirs before and after the MWSP is tabulated in Table 1. The new reservoirs will supply water at a low capacity after completion of the first phase of MWSP and at full capacity after completion of the second phase. The water quality of all the rivers in the surrounding hills is still good. Water quality deteriorates gradually as it flows down towards the urbanized area in the valley. All of KV is categorized as zone I (a natural conservation zone) and has good water quality. Similarly, zone II (a rural zone) is moderately polluted, zone III (a peri-urban zone) is critically polluted, zone IV (an urban zone) is extremely polluted, and zone V (a downstream zone) is extremely polluted [24]. Such zones are based on the Saprobic approach (biologically determined water quality classes). In addition to this, physico-chemical parameters of water such as temperature, dissolved oxygen, pH, electrical conductivity, and biochemical oxygen demand were also considered [24]. KUKL is tapping stream and spring sources in the natural conservation zone (the red boundary line in Figure 1a) and supplying fresh potable water to existing reservoirs. This means that the rest of the zones are not suitable for potable water supply.
The population in the Kathmandu Valley has grown rapidly, from 1.11 million in 1991 to 1.65 million in 2001 and 2.53 million in 2011. The corresponding water demand is also increasing steadily. Demand was 35.1 MLD in 1988, 155 MLD in 2000, 320 MLD in 2009, and 370 MLD in 2015 [23]. Agricultural land in the KV decreased from 62% to 42% from 1984 to 2000 [25]. If this trend continues, by 2025 there will be no agricultural fields left, since recently most agricultural land has been converted into built-up areas [25]. Such rapid urbanization may have exacerbated the decline by increasing impermeable surfaces in the valley’s groundwater recharge areas [26]. KUKL is supplying only 115 MLD during the wet season and 69 MLD during the dry season based on data from 2015 [27]. The deficit (255 MLD in the wet season and 301 MLD in the dry season) of water demand and supply is assumed to be met through privately dug wells, tube wells, water tankers from vendors (both spring and groundwater), stone spouts, rainwater harvesting, and water bottle industries. A recent study [28] estimated that the deficit will further increase to reach 322 MLD by 2021, and groundwater recharge will also decrease with increasing runoff [29], contributing to water insecurity in KV. A short-term solution to address the deficit could be harvesting an additional 67 MLD in the dry season and 87 MLD in the wet season from the hills surrounding the valley [30].
2.2. Methodology
The main focus of this study is to evaluate the spatial distribution of the water security situation from the state of today’s distribution to the implementation of different phases of MWSP. For this, population from the census, the population projection rate, water demand, and water supply in various service areas (SAs) were estimated. Based on the water security index, household water security was mapped in ArcMap 10.3. The overall methodology adopted and data used are described and presented in Table 2 and Figure 2.
2.2.1. Estimation of Potable Water Demand and Supply
The existing and planned water supply data for each SA were taken from the KUKL/MWSP reports. Water demand is the potable water demand for each service area, considering per capita demand as 135 lpcd for basic as well as economic growth and 50 lpcd for basic human water requirements. The population for the year 2017 (current), 2018 (after the first phase of MWSP), 2024 (after the second phase of MWSP), and 2030 (future, i.e., post-MWSP or SDG target year) were estimated for each SA based on the population projection rate published by the Center Bureau of Statistics (CBS) [31], using the 2011 population [32] as the base data. The population projection rate was only available at a district level. Hence, to make it more relevant to ward and village development committee (VDCs) levels, the incremental rate of population from 2001 [33] and 2011 [32] census data was calculated. That rate, based on growth between 2001 and 2011, is known as the old growth rate and was converted into the new growth rate at ward or VDCs levels using Equation (1).
The new growth rate at ward or VDC level (NGR) is estimated as
where NGR is the new growth rate, OGR is the old growth rate, the subscript i represents ward level for municipalities and VDCs, and j is the corresponding district (Kathmandu, Lalitpur, and Bhaktapur). OGRi and OGRj are the growth rates calculated from the population census data from 2001 and 2011. NGRj is obtained from projected growth rates for corresponding districts. The ward is the smallest unit of political boundary and VDC/municipalities are formed by combining several wards depending upon the size. The service area is the area served by one or more reservoirs, which may consist of different wards of different VDC/municipalities. SAs are the area defined by KUKL for their service delivery purpose based on their branch office.
The ward and VDC level annual population beyond 2011 was projected based on exponential growth formula as follows as estimated by [28]:
where Pt is the population at time t, P0 is the population at time t0, r is the new growth rate (NGR) calculated from Equation (1), t is the time in years (number of periods), and e is exponential.
Pt = P0 * ert,
After knowing the population for each SA for different time periods (2016, 2018, 2024 and 2030), water demand is calculated as follows:
Demand (D) is estimated considering population and per capita water demand as:
For basic human water requirement = Population × 50 lpcd
For economic growth = Population × 135 lpcd
Supply (S) is taken from the KUKL report for 2016; for other years those data were taken from the Melamchi Water Supply Project Implementation Directorate (MWSPID) and the Kathmandu Valley Water Supply Management Board (KVWSMB).
2.2.2. Estimation of Household Water Security Index (WSI)
Water supply per capita is calculated as the ratio of total water supplied to the total population in each SA for the corresponding year. Similarly, the household water security index (WSI) is calculated only considering the quantity aspect for both criteria (135 lpcd and 50 lpcd demand), assuming KUKL will provide good quality of water as follows:
WSI = (Amount of water supply, S)/(Potable water demand, D).
2.2.3. Re-Allocation of Available Freshwater for Equitable Distribution
In 2030, an additional 510 MLD water is expected to be added to the KUKL’s existing system. KUKL has planned to supply this water mostly inside the ring road. The outside area is planned to be served by existing old networks. There could be inequality in the distribution of water, which may lead to conflict in terms of water quantity and quality within the SAs. There is a possibility of getting good-quality water from new reservoirs and new distribution networks compared to the existing infrastructure. Hence, this study attempts to reallocate the water from surplus SAs to deficit SAs. For equitable distribution of water, the redistribution proposed in this study is based on the following criteria: distance from reservoirs, availability of pipe networks, administrative boundaries, and ensuring 135 lpcd of water availability in each service area. For this, the surplus/deficit amount of water was quantified, assuming that there was 135 lpcd demand and supply capacity for each reservoir. The population that can be served by this surplus amount of available water was estimated. The administrative boundaries (without MWSP water) near the new reservoir were identified and maps were prepared based on the ward population for year 2030.
3. Results and Discussion
3.1. Estimation of Population and Adopted Annual Growth Rate
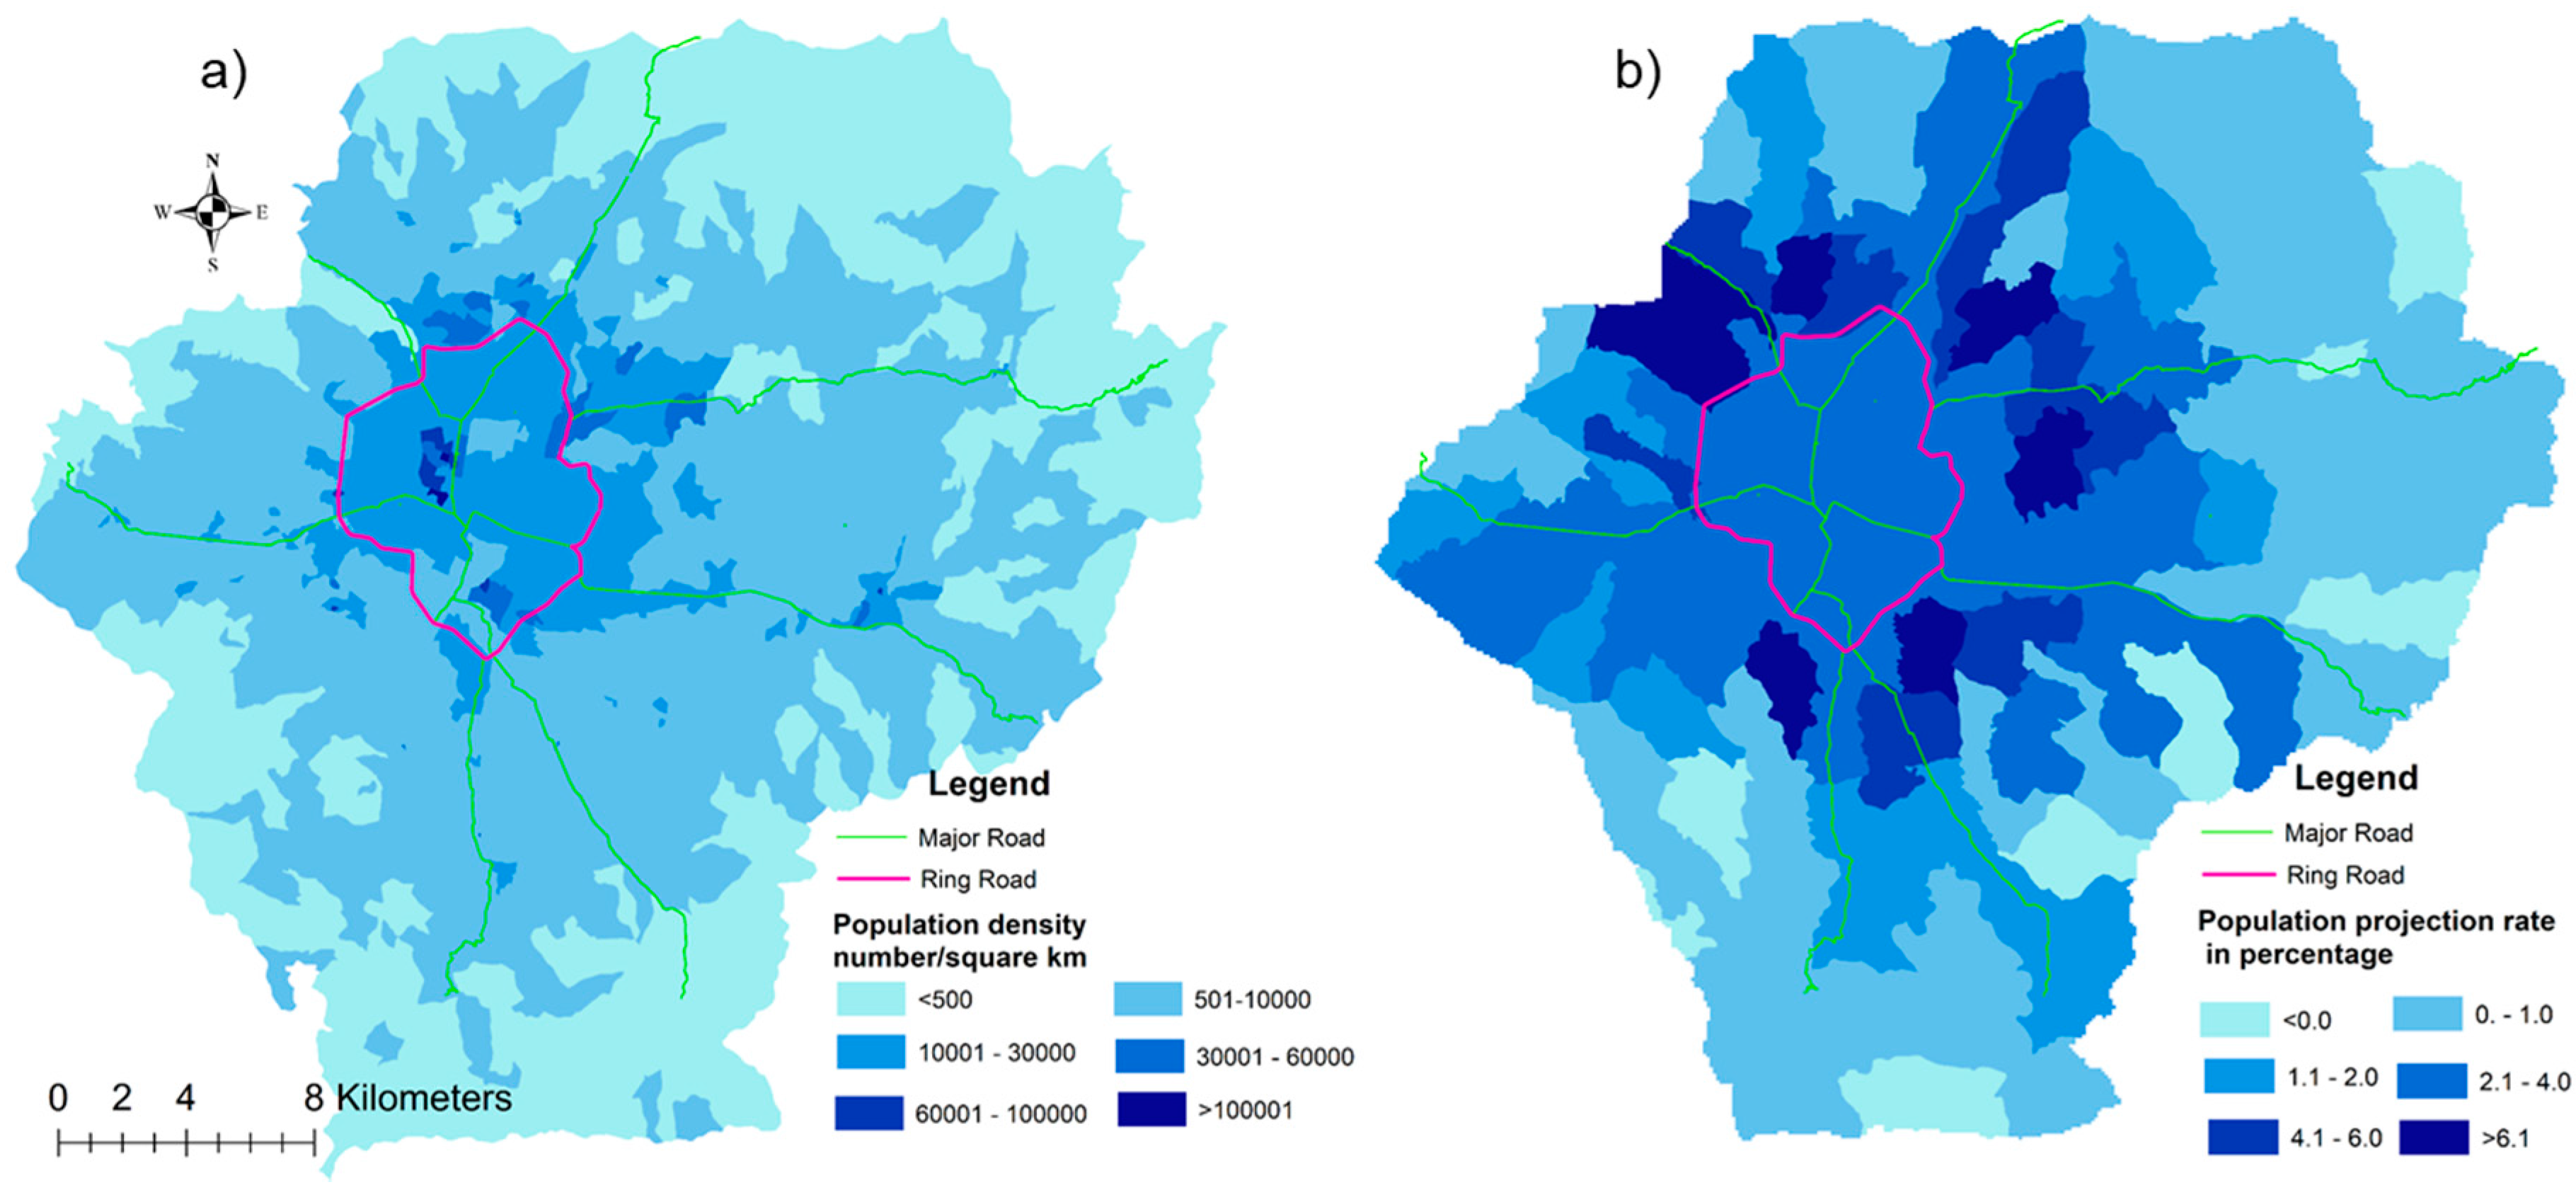
In this study, 2011 population data from the census were taken as the base and the population for future periods was projected based on the projection rate estimated by CBS. Results show a higher population density inside the ring road and along the major road network (Figure 3a). The percentage annual growth rate adopted for this study is as shown in Figure 3b; the higher value in the periphery of the ring road, where physical infrastructures like road, hospital, and schoolwere already developed and free land space is available for residence.
3.2. Distribution of Water Supply within KUKL Service Areas: Now and after MWSP (Phase I)
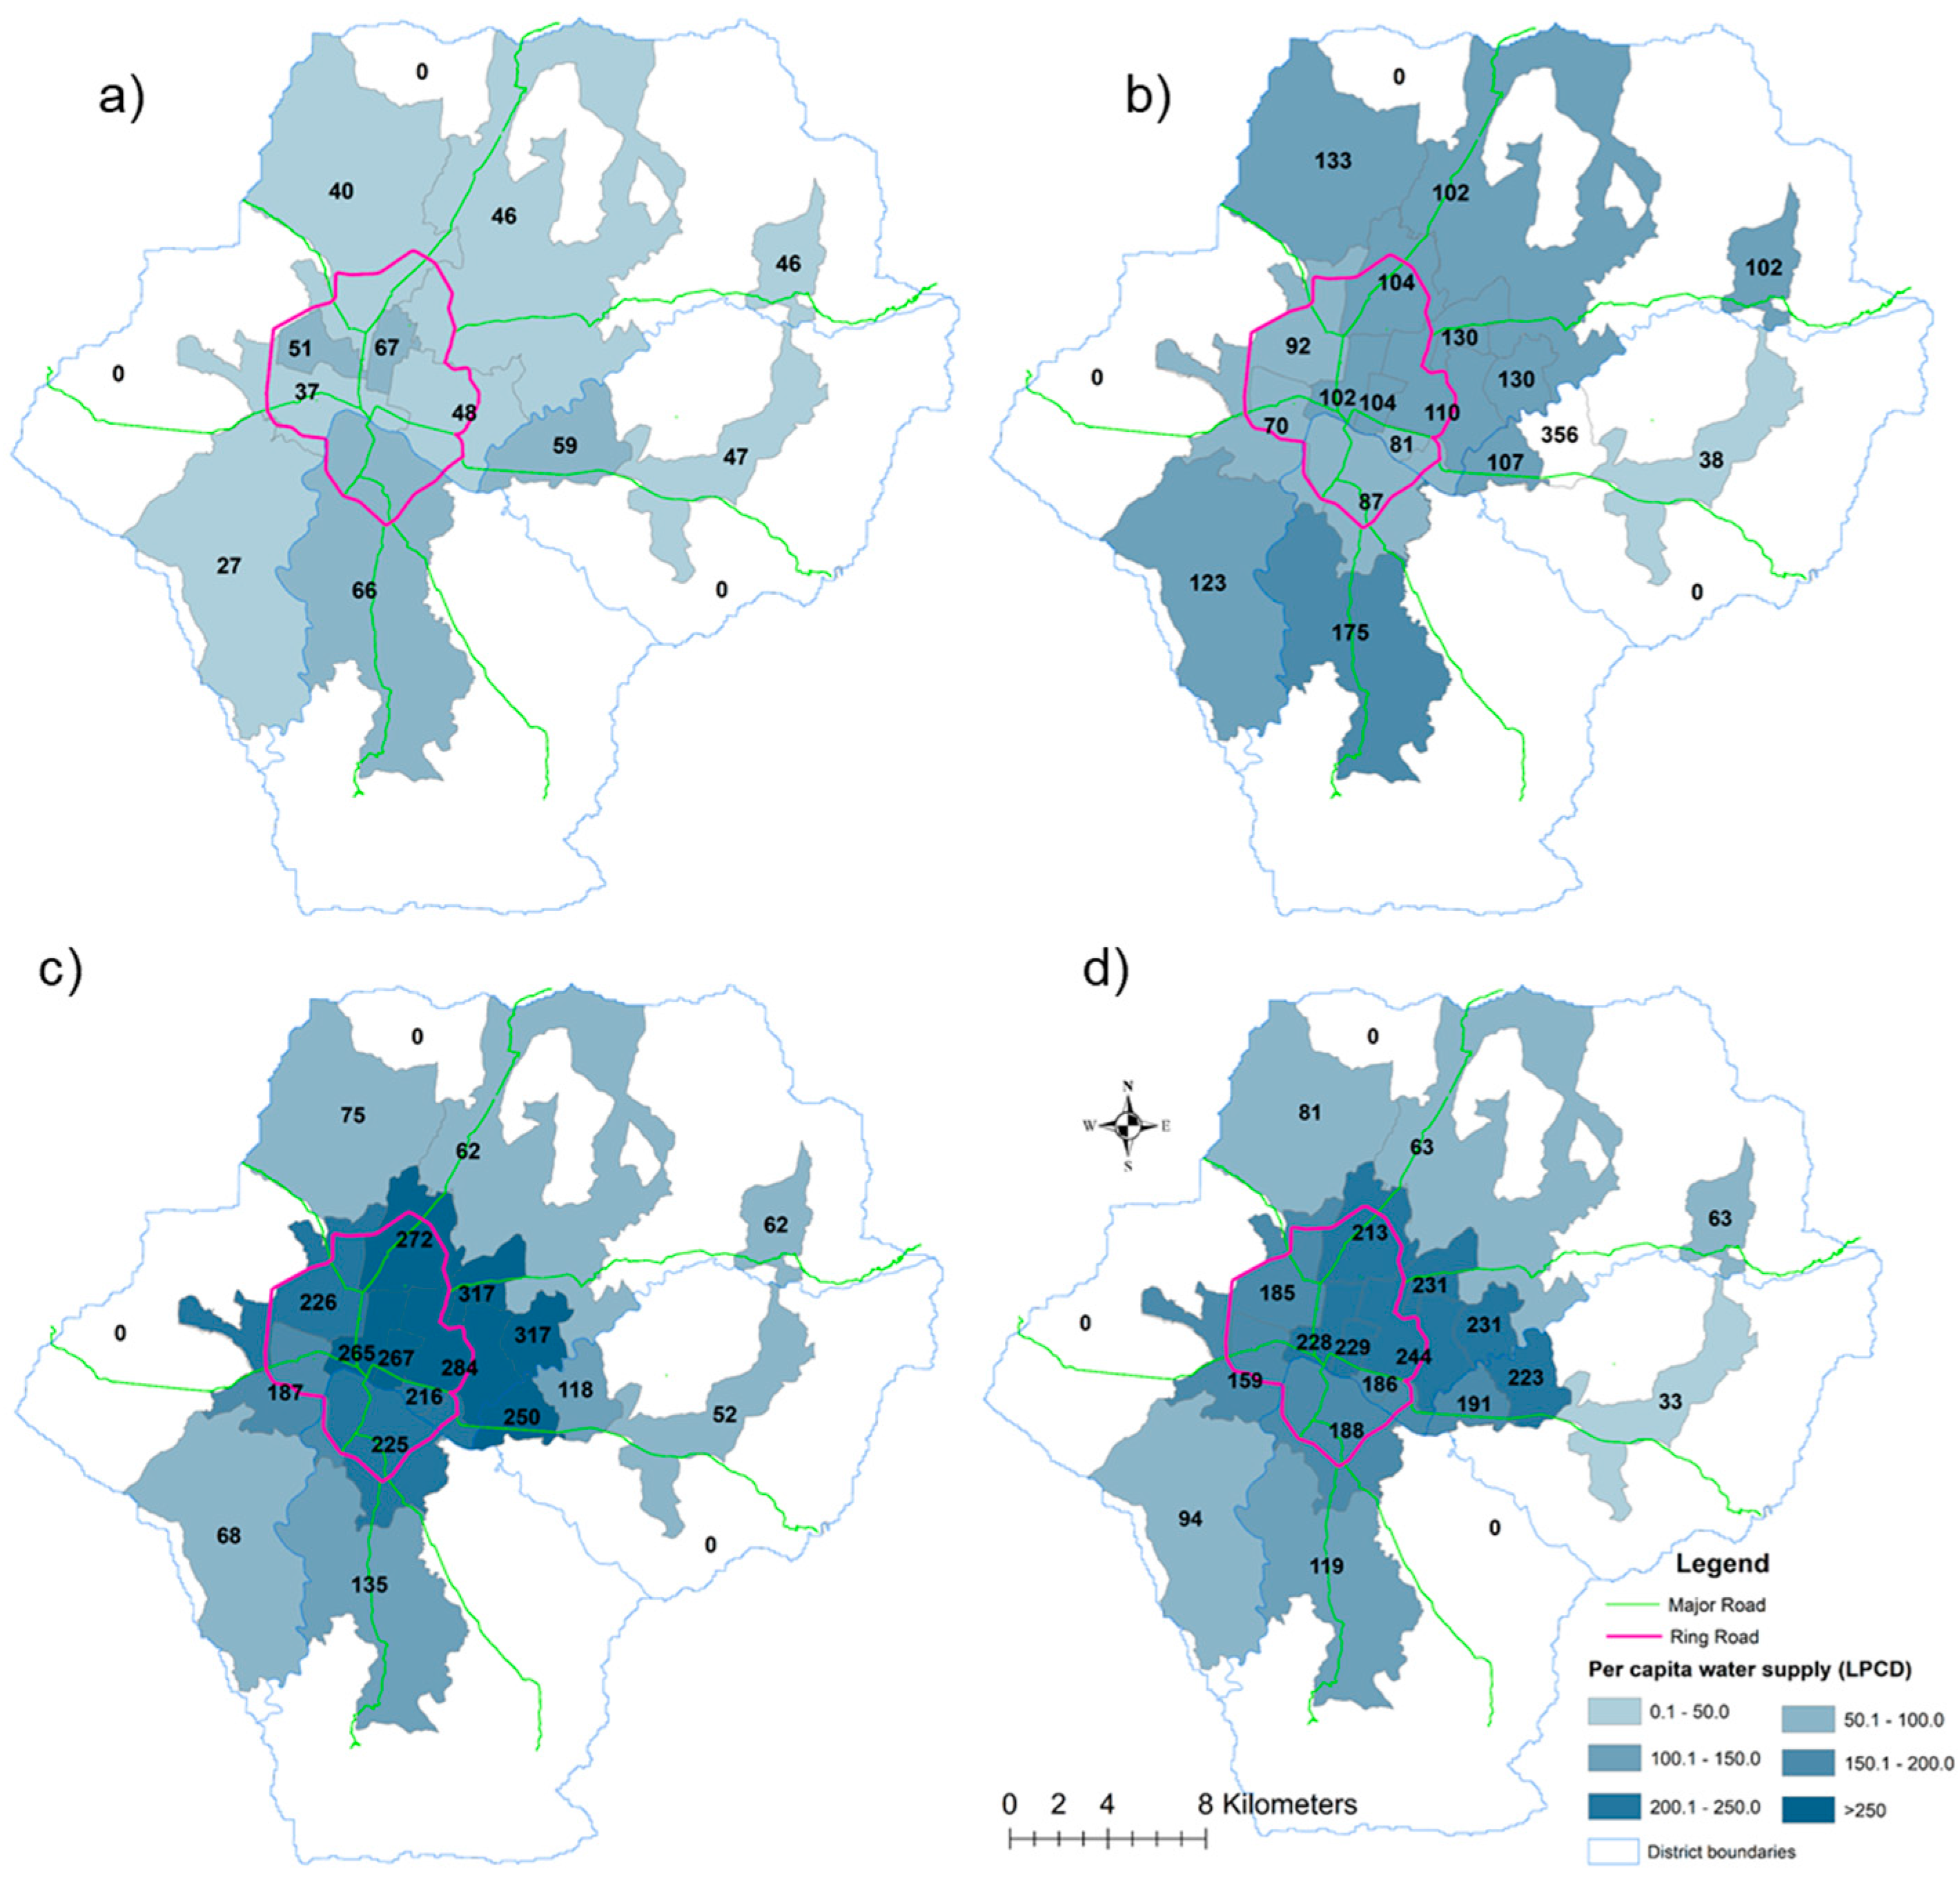
KUKL has planned to serve the KV through existing as well as new service reservoirs, as shown in Figure 1. In 2017, all service areas had limited water supply through existing reservoirs; only SA B-5, 6, 7, and 10 met the basic human water requirements. None of the SAs met the water required for economic growth. After the first phase of MWSP in 2018, the water supply situation is expected to improve significantly within the inner part of the ring road as this area will be served with water from new reservoirs (the red dots in Figure 1b) through an improved distribution network. After the first phase of MWSP, all SAs could meet the basic human water requirement and only SAs B-5 and B-6 could meet the required water for economic growth. This shows that even after 170 MLD additional water after the completion of the first phase of MWSP, most SAs will still face water scarcity.
3.3. Distribution of Water Supply within KUKL Service Areas: After MWSP (Phase II) and Post-MWSP
After the second phase of MWSP in 2024, the water supply situation in the area served by new reservoirs is expected to improve significantly and reach 317 lpcd, whereas the area served by existing reservoirs is expected to deteriorate further to 52 lpcd. The reason behind this is the high demand: the population growth rate is expected to be higher outside the ring road area, where most SAs are served by existing reservoir. In addition, rather than supply increasing, a decrease in supply is expected because of the deterioration of old pipe networks.
From Figure 4 and Figure 5, it is clear that there is some inequity in water distribution in service areas, which may lead to social conflict among users. From Figure 4 and Figure 5, it is clear that those SAs served by new reservoirs are getting more than 135 lpcd water and those SAs served by existing reservoirs are getting less than 135 lpcd water. Hence, water must be redistributed to deficit service areas served by existing reservoirs from surplus service areas.
3.4. Evaluation of Household Water Security Index (WSI)
Water security at a household level was estimated for both basic human water requirements and economic growth using Equation (3) considering 50 lpcd and 135 lpcd as per capita demand, respectively.
3.4.1. For 2017
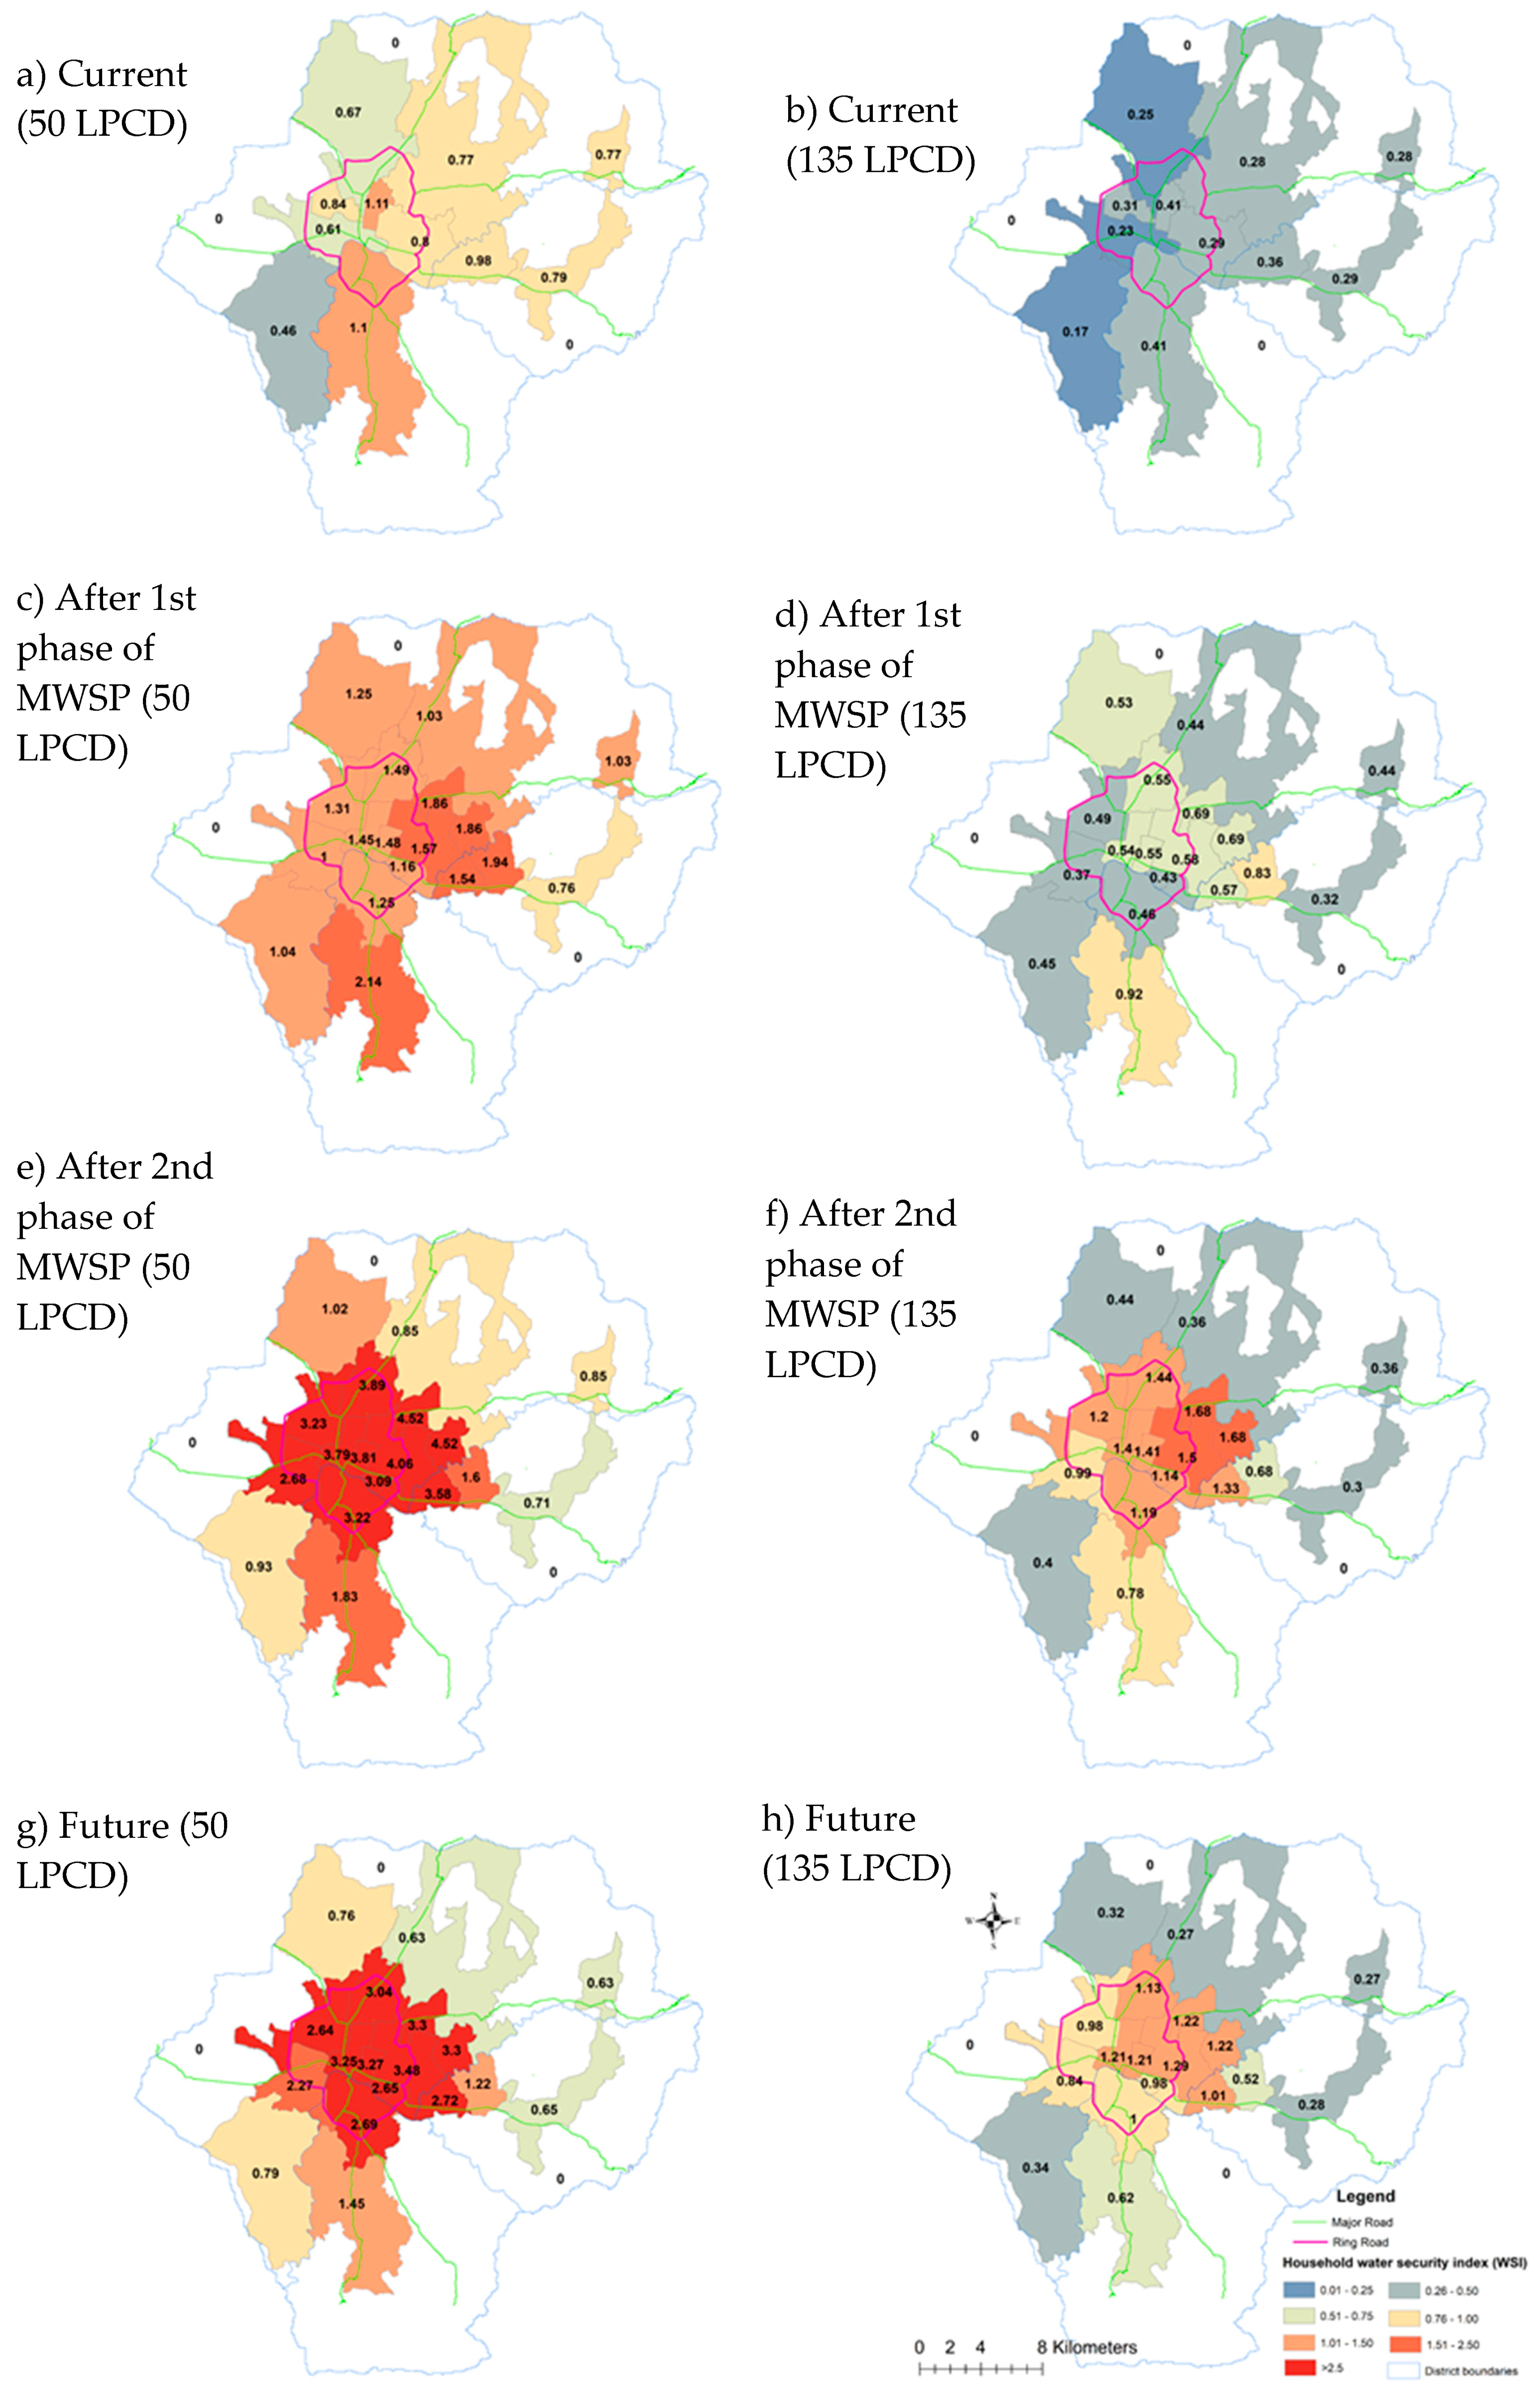
The demand for economic growth is not fully satisfied for all the service areas, whereas, it was nearly sufficient to meet the basic human water requirement for SAs B-5, 6, 7, and 10. This shows that the WSI for 50 lpcd demand is greater than 0.7 in all SAs except B-2, 3, and 9, as presented in Figure 5a. Similarly, for 135 lpcd demand, WSI is less than 0.5 in all the SAs, as presented in Figure 5b. This shows that water supply from KUKL is not sufficient to meet basic or economic growth requirements in almost all SAs.
3.4.2. For 2018
After the first phase of MWSP, the water security situation for all SAs will significantly improve and the WSI will be greater than 1.0 in all the SAs except B-4 for 50 lpcd demand, as presented in Figure 5c. However, water is not sufficient to meet the demands of economic growth, which is clearly shown by the WSI less than 1.0 in all the SAs, as presented in Figure 5d.
3.4.3. For 2024
After the second phase of MWSP, all the SAs are served with both new and old reservoirs and will have a water security index greater than 1.0 for 50 lpcd demand and nearly equal to 1.0 in SAs B-2, 3, and 4, as presented in Figure 5e. The SAs served by new reservoirs have a WSI greater than 1.0, but SAs served by existing reservoirs have less than 0.5 in all except B-6 for 135 lpcd demand, as presented in Figure 5f.
3.4.4. For 2030
In the future, all the SAs served with new reservoirs will have a water security index greater than 1.0 for basic human requirements (50 lpcd), as presented in Figure 5g. However, the SAs served by existing reservoir have a WSI around 0.7, except B-6, for 50 lpcd demand. Similarly, for 135 lpcd demand, all the SAs served by new reservoirs have a WSI greater than 1.0. SAs served by existing reservoirs have around 0.3 for all except B-6, as presented in Figure 5h.
The results from the four cases show that there is a general water deficit situation in the SAs served by existing reservoirs, likely to be improved after completion of MWSP. It is also clear that there could be inequality in water distribution within the service areas. Service areas inside the ring road have a WSI greater than 1.0 and outside the ring road they have less than 1.0. Hence, there is a possibility of the reallocation of available water by expanding the SAs served by new reservoirs for equitable distribution of potable water within KUKL SA.
3.5. Redistribution of Water Supply for Equitable Distribution
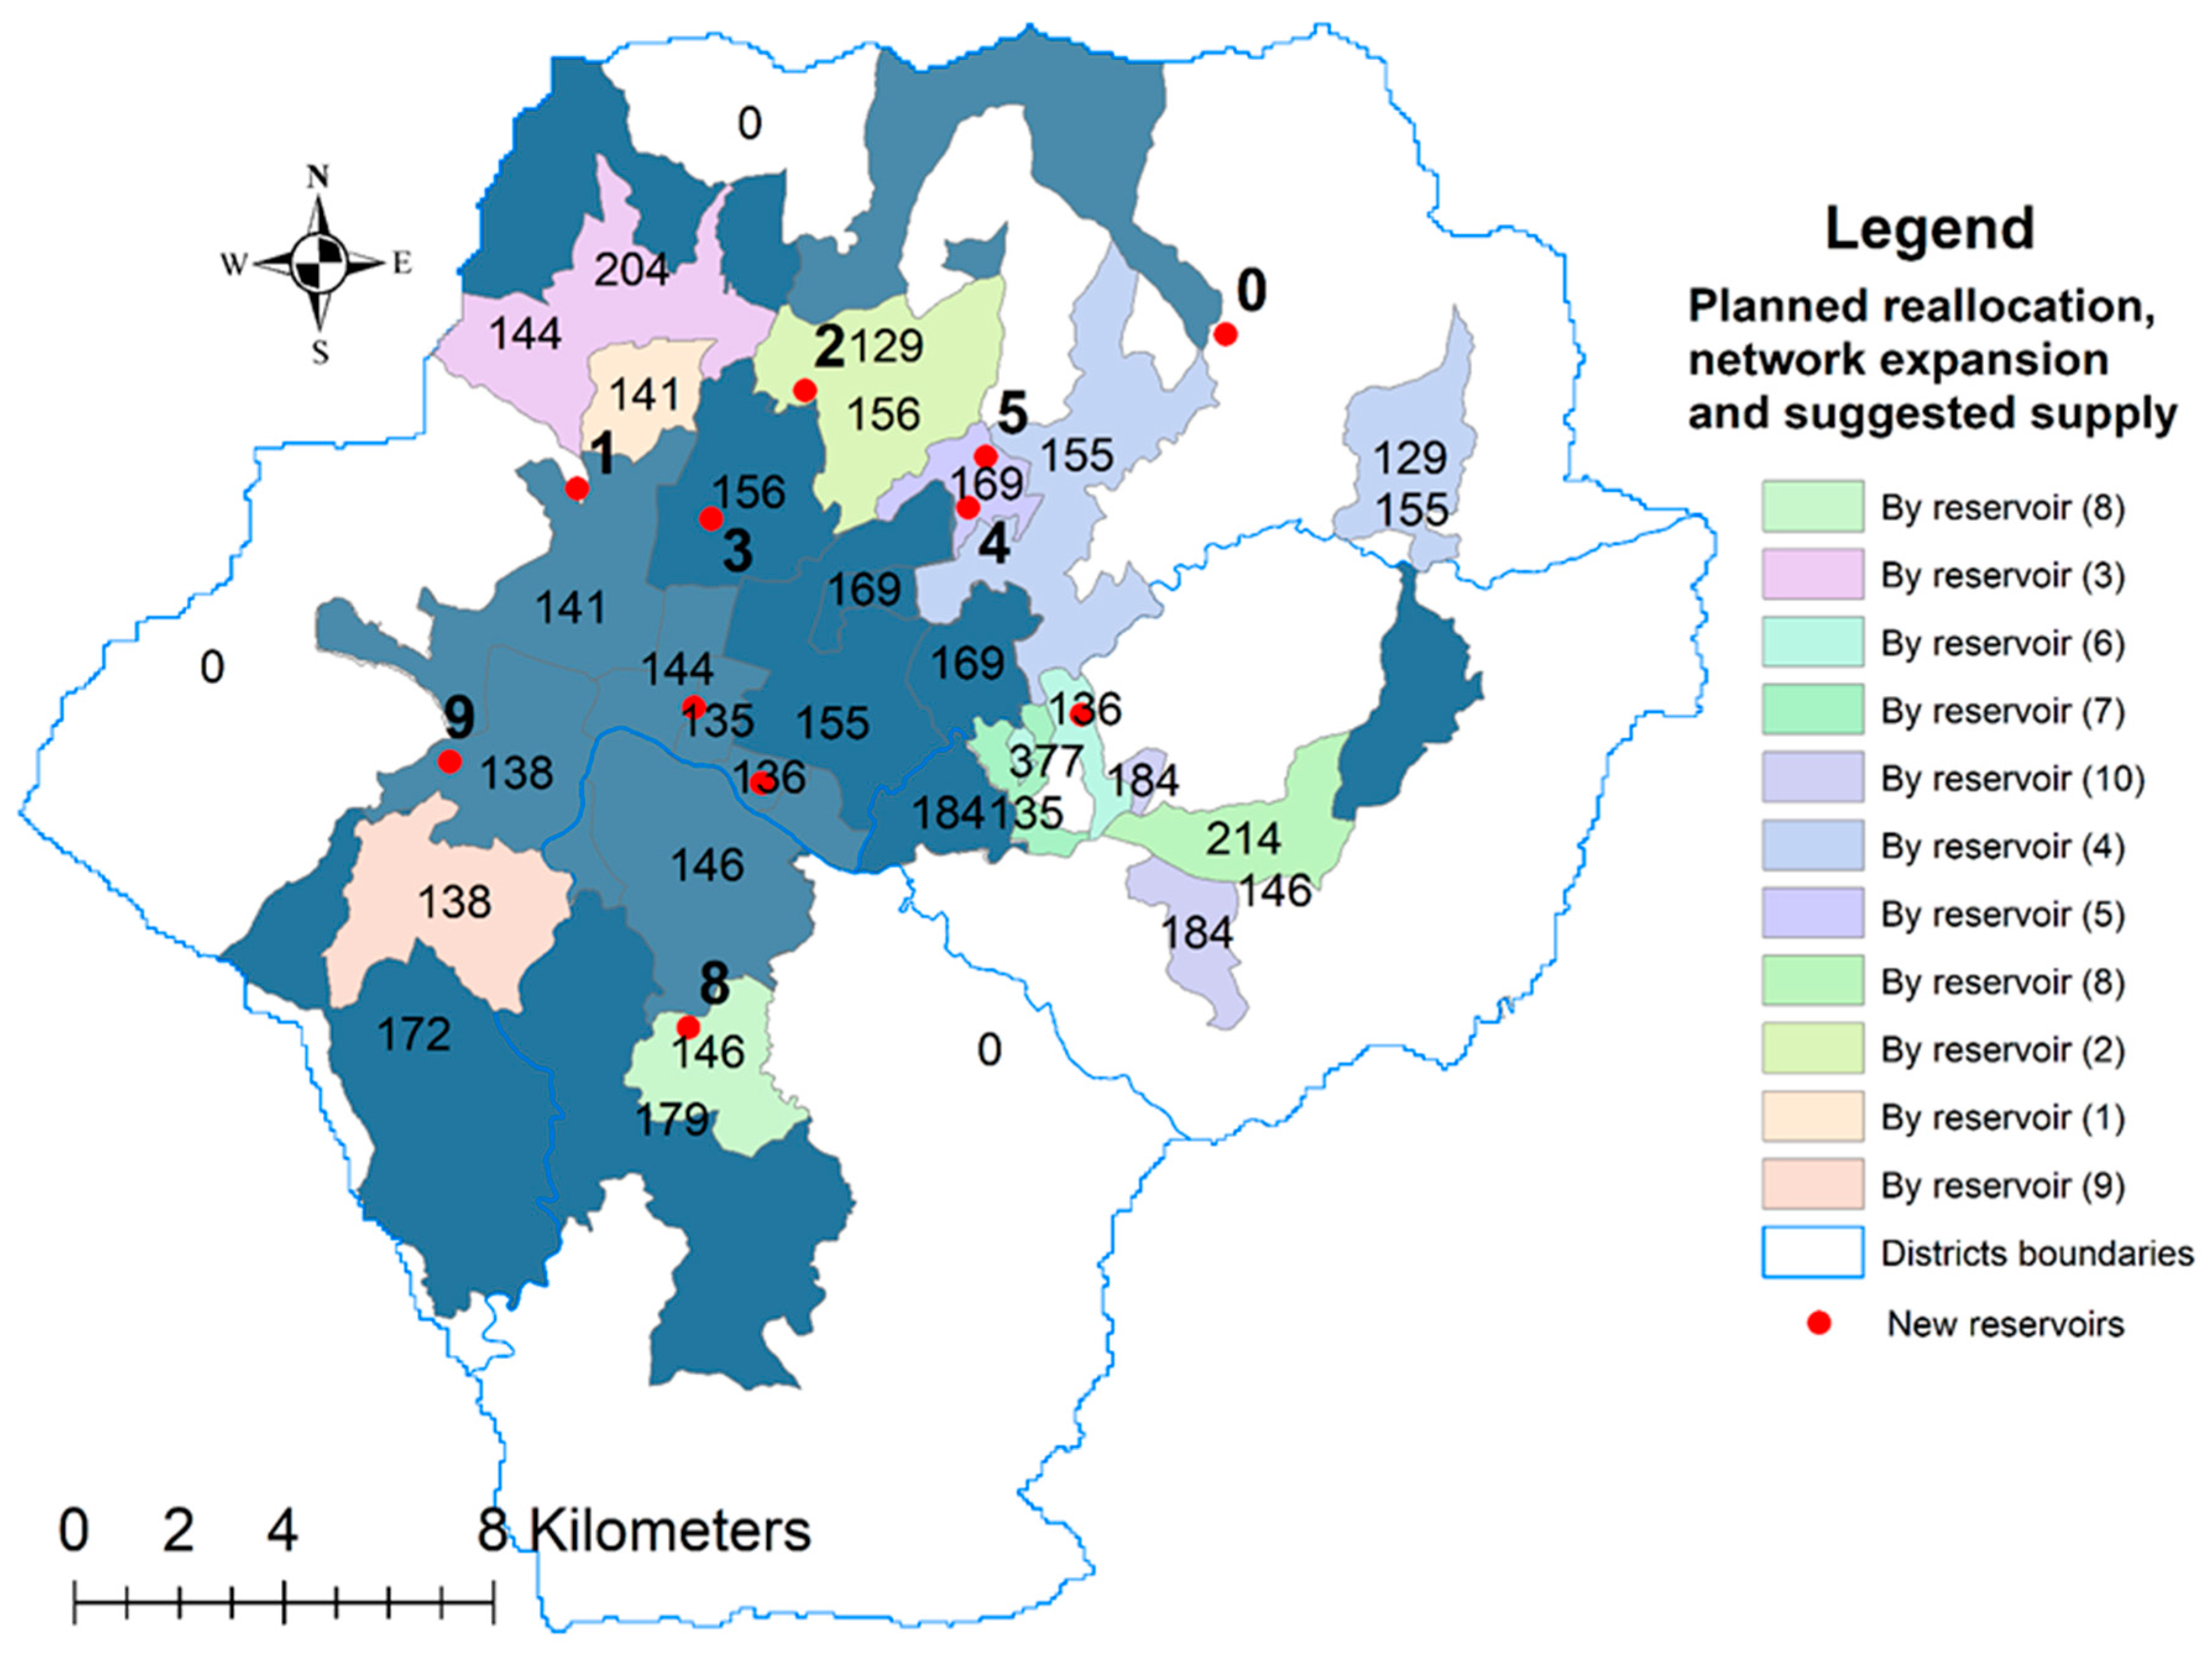
The per capita water supplied in the SAs served by new reservoirs is comparatively higher than the existing reservoirs in 2030. The possible water redistribution is shown by a different color than the original serviced area (light blue), as shown in Figure 6. After redistributing water from surplus to deficit reservoirs out of the existing reservoir SAs, it is seen that 90% of water harnessed for SA B-3 can be used for an expansion of SA in no-service areas (white area in Figure 6). Similarly, the water available in SA B-5 can also be used for SA expansion. Redistributing available water in new reservoirs in the way shown in Figure 6 can serve an additional 1.21 million people in the periphery of current improved distribution networks. Redistribution is done with existing available resources and MWSP water. The additional water available from hills and existing networks’ surplus water from SA B-3 and B-5 can be used for expanding the KUKL’s existing SAs with good-quality water for the entire KV. In addition to this, water loss from the KUKL system needs to be reduced to minimize the non-revenue water loss. Sometimes the poor management of physical infrastructure is not suitable to satisfy users, which leads to water insecurity. Water loss is a phenomenon frequently observed within water distribution networks [34]. Low pressure throughout the network does not satisfy the demand of users, but on the other hand excessive pressure causes water loss. To solve this problem, we can insert special hydraulic machines, pumps at turbines, throttle control valves, and pressure reduction valves [35,36].
4. Conclusions
This study analyzed the water security situation using a water demand/supply-based indicator for different future time periods corresponding to MWSP phases. From the results, it can be concluded that the water security situation is likely to improve gradually and meet all the water demands within KUKL SAs. However, the current strategy for water distribution will lead to unequal distribution, will not have sufficient water to cover the entire valley, and may result in social conflict. As a solution, it is suggested to redistribute freshwater from the reservoirs by expanding KUKL’s existing distribution network improvement area, as in Figure 6. This can help water supply services reach an additional 1.21 million people in the valley.
In addition to this, water left over in the natural conservation zone can be quantified after deducting the existing use from that area using a surface hydrological model in the future. Hydrological modeling can provide ideas on how much, where, and at what time additional water can be supplied to the KUKL system by developing small-scale water supply schemes.
As the ultimate goal of KUKL is to supply potable water to all residents within the entire KV, it is an appropriate time for KUKL to start preparing an inventory of community-based and other agency-supplied water infrastructures outside the existing SA (the white area in Figure 6). Those infrastructures can later be integrated with the KUKL system for the proper management of freshwater supply systems throughout the valley.
This research is mainly based on the CBS 2011 population data as well as the projection rate estimated by CBS (2014), assuming 135 lpcd and 50 lpcd demand, which can be improved by identifying actual water use pattern in SAs of KV. In addition to this, the service area and supply capacity can be changed over time, which can be included in future studies.
Acknowledgments
The authors would like to acknowledge the JST-JICA SATREPS Project in Nepal (PI: Futaba Kazama, University of Yamanashi, Japan; Narendra Man Shakya, Tribuvan University, Nepal) and the Ministry of Education, Culture, Sports, Science and Technology, Japan (MEXT) for supporting this study financially. The authors also express their thanks to several organizations in Nepal: the Department of Hydrology and Meteorology (DHM); the Melamchi Water Supply Project (MWSP); the MWS Project Implementation Directory (MWSPPID); and the Kathmandu Valley Water Supply Management Board (KVWSMB) Center for Research for Environment Energy and Water (CREEW) for useful data and information. The authors are also thankful to Sanjeev Bikram Rana, Executive Director, KVWSMB; Ram Prasad Kharel, Procurement Officer, Senior Divisional Engineer (SDE), MWSP; Himesha Nanda Vaidya, SDE, MWSPID; Nabin Tiwari, Engineer, KVWSMB; and Anoj Khanal, Hydrogeologist, KVWSMB for their kind support during data collection and interpretation. We would like to thank Patrick Drown for improving the quality of English in the paper. Constructive comments from three anonymous reviewers also improved the quality of the paper.
Author Contributions
Hiroshi Ishidaira, Narendra Man Shakya and Tilak Mohan Bhandari conceived and supervised the study. Bhesh Raj Thapa and Vishnu Prasad Pandey contributed for the design, data analysis, and manuscript preparation.
Conflicts of Interest
The authors declare no conflict of interest.
References
- Sadoff, C.W.; Hall, J.W.; Grey, D.; Aerts, J.C.J.H.; Ait-Kadi, M.; Brown, C.; Cox, A.; Dadson, S.; Garrick, D.; Kelman, J.; et al. Securing Water, Sustaining Growth: Report of the GWP/OECD Task Force on Water Security and Sustainable Growth; University of Oxford: Oxford, UK, 2015. [Google Scholar]
- Global Water Partnership. Towards Water Security: Framework for Action; Global Water Partnership: Stockholm, Sweden, 2000; Available online: http://www.gwp.org/globalassets/global/toolbox/references/towards-water-security.-a-framework-for-action.-mobilising-political-will-to-act-gwp-2000.pdf (accessed on 20 February 2018).
- Asian Development Bank (ADB). Asian Water Development Outlook 2016; Strengthening Water Security in Asia and the Pacific; ADB: Manila, Philippines, 2016. [Google Scholar]
- UN-Water. Water Security and the Global Water Agenda: A UN-Water Analytical Brief; United Nations University: Hamilton, ON, Canada, 2013. [Google Scholar] [CrossRef]
- Fischer, G.; Hizsnyik, E.; Tramberend, S.; Wiberg, D. Towards Indicators for Water Security—A Global Hydro-Economic Classification of Water Challenges; IIASA Interim Rep. 2015; (IR-15-013); IIASA: Laxenburg, Austria, 2015. [Google Scholar]
- Lautze, J.; Manthrithilake, H. Water security: Old concepts, new package, what value? Nat. Resour. Forum 2012, 36, 76–87. [Google Scholar] [CrossRef]
- Rijsberman, F.R. Water scarcity: Fact or fiction? Agric. Water Manag. 2006, 80, 5–22. [Google Scholar] [CrossRef]
- Asian Development Bank (ADB). Asian Water Development Outlook 2013; Measuring Water Security in Asia and the Pacific; ADB: Manila, Philippines, 2013. [Google Scholar]
- Gleick, P. The human right to water. Water Policy 1998, 1, 487–503. [Google Scholar] [CrossRef]
- Falkenmark, M.; Lundquist, J.; Widstran, C. Macro-scale water scarcity requires micro scale approaches: Aspects of vulnerability in semi-arid development. Nat. Resour. Forum 1989, 13, 258–267. [Google Scholar] [CrossRef] [PubMed]
- Chaves, H.M.L.; Alipaz, S. An integrated indicator based on basin hydrology, environment, life, and policy: The watershed sustainability index. Water Resour. Manag. 2007, 21, 883–895. [Google Scholar] [CrossRef]
- Mcnulty, S.G.; Sun, G.; Myers, J.A.M.; Cohen, E.C. Robbing Peter to Pay Paul: Tradeoffs between Ecosystem Carbon Sequestration and Water Yield. In Proceeding of the Watershed Management Conference, Madilson, WI, USA, 23–27 August 2010; pp. 103–114. [Google Scholar] [CrossRef]
- Norman, E.S.; Dunn, G.; Bakker, K.; Allen, D.M.; de Albuquerque, R.C. Water Security Assessment: Integrating Governance and Freshwater Indicators. Water Resour. Manag. 2013, 27, 535–551. [Google Scholar] [CrossRef]
- Sullivan, C.A.; Meigh, J.R.; Giacomello, A.M. The water poverty index: Development and application at the community scale. Nat. Resour. Forum 2003, 27, 189–199. [Google Scholar] [CrossRef]
- Dickson, S.E.; Schuster-Wallace, C.J.; Newton, J.J. Water Security Assessment Indicators: The Rural Context. Water Resour. Manag. 2016, 30, 1567–1604. [Google Scholar] [CrossRef]
- UN Office of the High Commissioner for Human Rights (OHCHR). Fact Sheet No. 35, The Right to Water; UN Office of the High Commissioner for Human Rights (OHCHR): Geneva, Switzerland, 2010. [Google Scholar]
- Falkenmark, M. Fresh water: Time for a modified approach. Ambio 1986, 15, 192–200. [Google Scholar]
- Shuval, H.I. Approaches to Resolving the Water Conflicts between Israel and her Neighbors—A Regional Water-for-Peace Plan. Water Int. 1992, 17, 133–143. [Google Scholar] [CrossRef]
- Bureau of Indian Standards (BIS). Is 1172:1993 Code of Basic Requirements for Water Supply, Drainage and Sanitation; Fourth Revision; Bureau of Indian Standards (BIS): New Delhi, India, 1993.
- Chenoweth, J. Minimum water requirement for social and economic development. Desalination 2008, 229, 245–256. [Google Scholar] [CrossRef] [Green Version]
- Asian Development Bank (ADB). Report and Recommendation of the President to the Board of Directors Proposed Loan for Additional Financing Nepal: Kathmandu Valley Water Supply Improvement Project; Asian Development Bank (ADB): Kathmandu, Nepal, 2015. [Google Scholar]
- Padowski, J.C.; Carrera, L.; Jawitz, J.W. Overcoming Urban Water Insecurity with Infrastructure and Institutions. Water Resour. Manag. 2016, 30, 4913–4926. [Google Scholar] [CrossRef]
- Thapa, B.R.; Ishidaira, H.; Pandey, V.P.; Shakya, N.M. Impact Assessment of Gorkha Earthquake 2015 on Portable Water Supply in Kathmandu Valley: Preliminary Analysis. J. Jpn. Soc. Civ. Eng. 2016, 72, 61–66. [Google Scholar] [CrossRef]
- National Trust for Nature Conservation (NTNC). Bagmati Action Plan (2009–2014); National Trust for Nature Conservation: Lalitpur, Nepal, 2008. [Google Scholar]
- International Centre for Integrated Mountain Development (ICIMOD). Kathmandu Valley Environment Outlook; International Centre for Integrated Mountain Development (ICIMOD): Kathmandu, Nepal, 2007. [Google Scholar]
- Gautam, D.; Thapa, B.R.; Prajapati, R.N. Indigenous water management system in Nepal: Cultural dimensions of water distribution, cascaded reuse and harvesting in Bhaktapur City. Environ. Dev. Sustain. 2017, 1–12. [Google Scholar] [CrossRef]
- Kathmandu Upatyka Khanepani Limited (KUKL). Kathmandu Upatyaka Khanepani Limited Annual Report; Kathmandu Upatyka Khanepani Limited: Kathmandu, Nepal, 2015. [Google Scholar]
- Udmale, P.; Ishidaira, H.; Thapa, B.; Shakya, N. The Status of Domestic Water Demand: Supply Deficit in the Kathmandu Valley, Nepal. Water 2016, 8, 196. [Google Scholar] [CrossRef]
- Thapa, B.R.; Ishidaira, H.; Pandey, V.P.; Shakya, N.M. A multi-model approach for analyzing water balance dynamics in Kathmandu Valley, Nepal. J. Hydrol. Reg. Stud. 2017, 9, 149–162. [Google Scholar] [CrossRef]
- Thapa, B.R.; Ishidaira, H.; Bui, T.H.; Shakya, N.M. Evaluation of water resources in mountainous region of Kathmandu Valley using high resolution satellite precipitation product. J. JSCE Ser. G Environ. Res. 2016, 72, 27–33. [Google Scholar] [CrossRef]
- Central Bureau of Statistics (CBS). National Population and Housing Census 2011 (Population Projection 2011-2031); Central Bureau of Statistics: Kathmandu, Nepal, 2014.
- Central Bureau of Statistics (CBS). National Population and Housing Census 2011 (National Report); Central Bureau of Statistics: Kathmandu, Nepal, 2012. [Google Scholar]
- Central Bureau of Statistics (CBS). Population Monograph of Nepal: Vol.-2; Central Bureau of Statistics: Kathmandu, Nepal, 2003. [Google Scholar]
- Covelli, C.; Cozzolino, L.; Cimorelli, L.; Della Morte, R.; Pianese, D. A model to simulate leakage through joints in water distribution systems. Water Sci. Technol. Water Supply 2015, 15, 852–863. [Google Scholar] [CrossRef]
- Covelli, C.; Cozzolino, L.; Cimorelli, L.; Della Morte, R.; Pianese, D. Optimal Location and Setting of PRVs in WDS for Leakage Minimization. Water Resour. Manag. 2016, 30, 1803–1817. [Google Scholar] [CrossRef]
- Samir, N.; Kansoh, R.; Elbarki, W.; Fleifle, A. Pressure control for minimizing leakage in water distribution systems. Alex. Eng. J. 2017, 56, 601–612. [Google Scholar] [CrossRef]
Figure 1.
Study area showing (a) conservation zone for freshwater, KUKL’s existing sources and service areas, and hydro meteorological stations, (b) planned water supply service areas after Melamchi Water Supply Project (MWSP). New reservoir service areas will get water from MWSP and existing reservoirs will get water from the existing network.

Figure 2.
Overall methodological framework (KUKL: Kathmandu Khanepani Upatyaka Limited, MWSP: Melamchi Water Supply Project, SAs: Service Areas, lpcd: liter per capita per day, CBS: Center Bureau of Statistics).
Figure 2.
Overall methodological framework (KUKL: Kathmandu Khanepani Upatyaka Limited, MWSP: Melamchi Water Supply Project, SAs: Service Areas, lpcd: liter per capita per day, CBS: Center Bureau of Statistics).

Figure 3.
Estimating current and future population: (a) ward-wise population density for base year 2011, (b) adopted ward/VDC wise percentage annual growth rate.
Figure 3.
Estimating current and future population: (a) ward-wise population density for base year 2011, (b) adopted ward/VDC wise percentage annual growth rate.

Figure 4.
Per capita water supply (lpcd) in each service area: (a) current (2017), (b) after the first phase of MWSP), (c) after the second phase of MWSP, (d) post-MWSP (2030 or sustainable development target year).
Figure 4.
Per capita water supply (lpcd) in each service area: (a) current (2017), (b) after the first phase of MWSP), (c) after the second phase of MWSP, (d) post-MWSP (2030 or sustainable development target year).

Figure 5.
Household water security index: (a) current (basic), (b) current (economic growth), (c) after first phase of mwsp (basic), (d) after first phase of mwsp (economic growth), (e) after second phase of mwsp (basic), (f) after second phase of mwsp (economic growth), (g) future (basic), (h) future (economic growth).

Figure 6.
Water redistribution scenario by respective reservoir (values in lpcd) with improved distribution network in KV (reservoir 0 is the main reservoir at Sundarijal, which receives water from MWSP).
Figure 6.
Water redistribution scenario by respective reservoir (values in lpcd) with improved distribution network in KV (reservoir 0 is the main reservoir at Sundarijal, which receives water from MWSP).


Table 1.
Description of Service area shown in Figure 1.
Table 1.
Description of Service area shown in Figure 1.
| Service Area (SA) No | SAs by Existing Reservoirs | Service Area (SA) No | SAa by Existing Reservoirs | Service Area (SA) No | SAs by New Reservoirs | Service Area (SA) No | SAs by New Reservoirs |
|---|---|---|---|---|---|---|---|
| B-1 | Mahankalchour | B-6 | Lalitpur | A-1 | Balaju North | A-6 | Minbhavan East |
| B-2 | Kritipur | B-7 | Kamaladi | A-2 | Bansbari North | A-7 | Anamnagar East |
| B-3 | Maharajgunj | B-8 | Baneshowr | A-3 | Panipokhari East | A-8 | Khumaltar North |
| B-4 | Bhaktapur | B-9 | Tripureshowr | A-4 | Mahankalchour North | A-9 | Kritipur North |
| B-5 | Madhyapur Thimi | B-10 | Chhetrapati | A-5 | Arubari North | A-10 | Tigeni North |
Table 2.
Data used, source, and extent.
| Type | Description | Source | Original Spatial Resolution | Remarks |
|---|---|---|---|---|
| Socio-economic data | Population data (ward wise) | CBS | Ward level | 2011 |
| Population projection rate | CBS | District level | 2014 | |
| Bulk distribution system network | MWSPID | Poly Line | 2016 | |
| SAs demarcation (digitized) | KVWSMB/MWSPID/KUKL | Ward level | 2016 | |
| Surface water source and reservoir location | Point location | 2016 | ||
| Water supply data | Service area (SA)—wise water supply | Measured (yearly) and estimated yearly | 2015 and 2016 |
Notes: KUKL: Kathmandu Khanepani Upatyaka Limited, CBS: Center Bureau of Statistics, KVWSMB: Kathmandu valley water supply management board, MWSPID: Melamchi water supply project implementation directorate SA: Service area.
© 2018 by the authors. Licensee MDPI, Basel, Switzerland. This article is an open access article distributed under the terms and conditions of the Creative Commons Attribution (CC BY) license (http://creativecommons.org/licenses/by/4.0/).
Share and Cite
MDPI and ACS Style
Thapa, B.R.; Ishidaira, H.; Pandey, V.P.; Bhandari, T.M.; Shakya, N.M. Evaluation of Water Security in Kathmandu Valley before and after Water Transfer from another Basin. Water 2018, 10, 224. https://doi.org/10.3390/w10020224
AMA Style
Thapa BR, Ishidaira H, Pandey VP, Bhandari TM, Shakya NM. Evaluation of Water Security in Kathmandu Valley before and after Water Transfer from another Basin. Water. 2018; 10(2):224. https://doi.org/10.3390/w10020224
Chicago/Turabian StyleThapa, Bhesh Raj, Hiroshi Ishidaira, Vishnu Prasad Pandey, Tilak Mohan Bhandari, and Narendra Man Shakya. 2018. "Evaluation of Water Security in Kathmandu Valley before and after Water Transfer from another Basin" Water 10, no. 2: 224. https://doi.org/10.3390/w10020224
Note that from the first issue of 2016, this journal uses article numbers instead of page numbers. See further details here.