1. Introduction
Nutrient pollution due to high loads of nitrogen and phosphorus causes costly impacts on the tourism, commercial fishing, recreation, hunting, real estate, and water treatment sectors of the economy [
1]. Noting that 50% of the nation’s streams have medium to high nutrient levels and 78% of coastal waters experience eutrophication, the Environmental Protection Agency (EPA) has urged states to adopt numeric nutrient criteria to reduce nitrogen and phosphorus loads on U.S. waters [
2].
Nutrient load reduction costs in the nation’s waters are significant and range from
$35 million/year in the 16,500 km
2 Wisconsin Fox-Wolf River watershed [
3] to
$203 million/year in the 26,200 km
2 Connecticut River/Long Island Sound Basin [
4]. The Chesapeake Bay Program [
5] estimated that restoration of the 166,000 km
2 Chesapeake Bay watershed could cost
$1 billion/year. Rabotyagov et al. [
6] estimated a cost of
$1.8 billion/year to reduce nutrient loads and increase dissolved oxygen levels in the 492,000 km
2 Upper Mississippi River Basin. Lyon and Farrow [
7] reported to the EPA that the Federal Clean Water Act stormwater programs could cost up to
$14 billion/year nationwide.
The Interstate Commission on the Delaware River Basin [
8] once called the Delaware River near Philadelphia “one of the most grossly polluted areas in the United States.” In 1961, President John F. Kennedy and the governors of Delaware, New Jersey, New York, and Pennsylvania signed the Delaware River Basin Commission (DRBC) Compact as one of the first models of Federalism or shared power in water management between the Federal government and the states [
9]. For over half a century, the DRBC has been empowered by this compulsory 1961 Federal/state compact to oversee water pollution control programs on the Delaware River [
10,
11].
Water quality has been impaired by nutrient pollution [
12,
13,
14,
15,
16] but the estuary has recovered in the last several decades due to restoration efforts by DRBC, EPA, and the states [
17,
18,
19]. A century-long water quality record reconstructed by Sharp [
20] indicates that the tidal Delaware has made one of the most extensive recoveries of any estuary in the world as dissolved oxygen levels declined to zero during the 1950s and 1960s and increased to near 400 μmol/L by the turn of the 21st century.
While pollutant loadings have decreased and water quality has measurably improved in the Delaware Estuary since the adoption of the 1961 DRBC Compact, dissolved oxygen levels still do not fully meet the criterion of 3.5 mg/L during the summer when dissolved oxygen saturation declines with warming water temperatures. Scientists with the Delaware Estuary Program and the DRBC have discussed setting more rigorous dissolved oxygen criteria along the tidal Delaware River (to at least 5.0 mg/L) to protect the year-round propagation of anadromous fish such as the American shad and Atlantic sturgeon [
21,
22]. More stringent dissolved oxygen criteria would also address the prospect of atmospheric warming and rising sea levels that are projected to increase water temperatures, raise salinity, and further depress dissolved oxygen saturation.
While dissolved oxygen levels have recovered over the last half-century, little is known about modern costs to restore the Delaware River to meet fishable water quality standards. The objectives of this research are to estimate the costs of investments to reduce pollutant loads and restore the Delaware River to meet more protective year-round fishable dissolved oxygen criteria in accordance with DRBC, EPA, and state water quality standards.
2. The Delaware River
While just the 33rd largest river in the United States, the Delaware River is the longest undammed river east of the Mississippi, extending 390 mi (628 km) from the 3000 ft (970 m) high Catskill Mountains in New York State to the mouth of the Delaware Bay at Cape May, New Jersey. The river is fed by 216 streams including its two largest tributaries (the Schuylkill and Lehigh River) and drains 13,539 mi2 (35,077 km2) in Delaware, Pennsylvania, New Jersey, New York, and a small part of Maryland.
The Delaware Basin covers just 0.4% of the continental U.S., yet supplies drinking water to 5% of the nation’s population and the first (New York City) and seventh (Philadelphia) largest metropolitan economies in the nation [
23]. Over 16 million people rely on the Delaware Basin for drinking water, including 8.2 million people who live in the watershed and 8 million people who live outside the basin in New York City and central New Jersey. Between 2000 and 2010, the population in the Delaware Basin increased by half a million people, an amount equal to the combined population of the cities of Camden, Trenton, and Wilmington.
The Delaware Estuary extends 130 mi (208 km) from the Atlantic Ocean to the head of tide at Trenton [
24]. High nutrient loads discharged from tributaries near Philadelphia and rural streams along the bay are diluted by saltwater as the estuary widens toward the mouth of the bay [
13]. The Delaware Estuary recirculates every 8 days (
Table 1) with half mixing with freshwater from the Delaware River at Trenton, Schuylkill, Lehigh, Brandywine, and smaller tributaries and the other half from the Atlantic Ocean [
17]. The estuary is relatively turbid with a light extinction coefficient of 0.3–7.0 [
25].
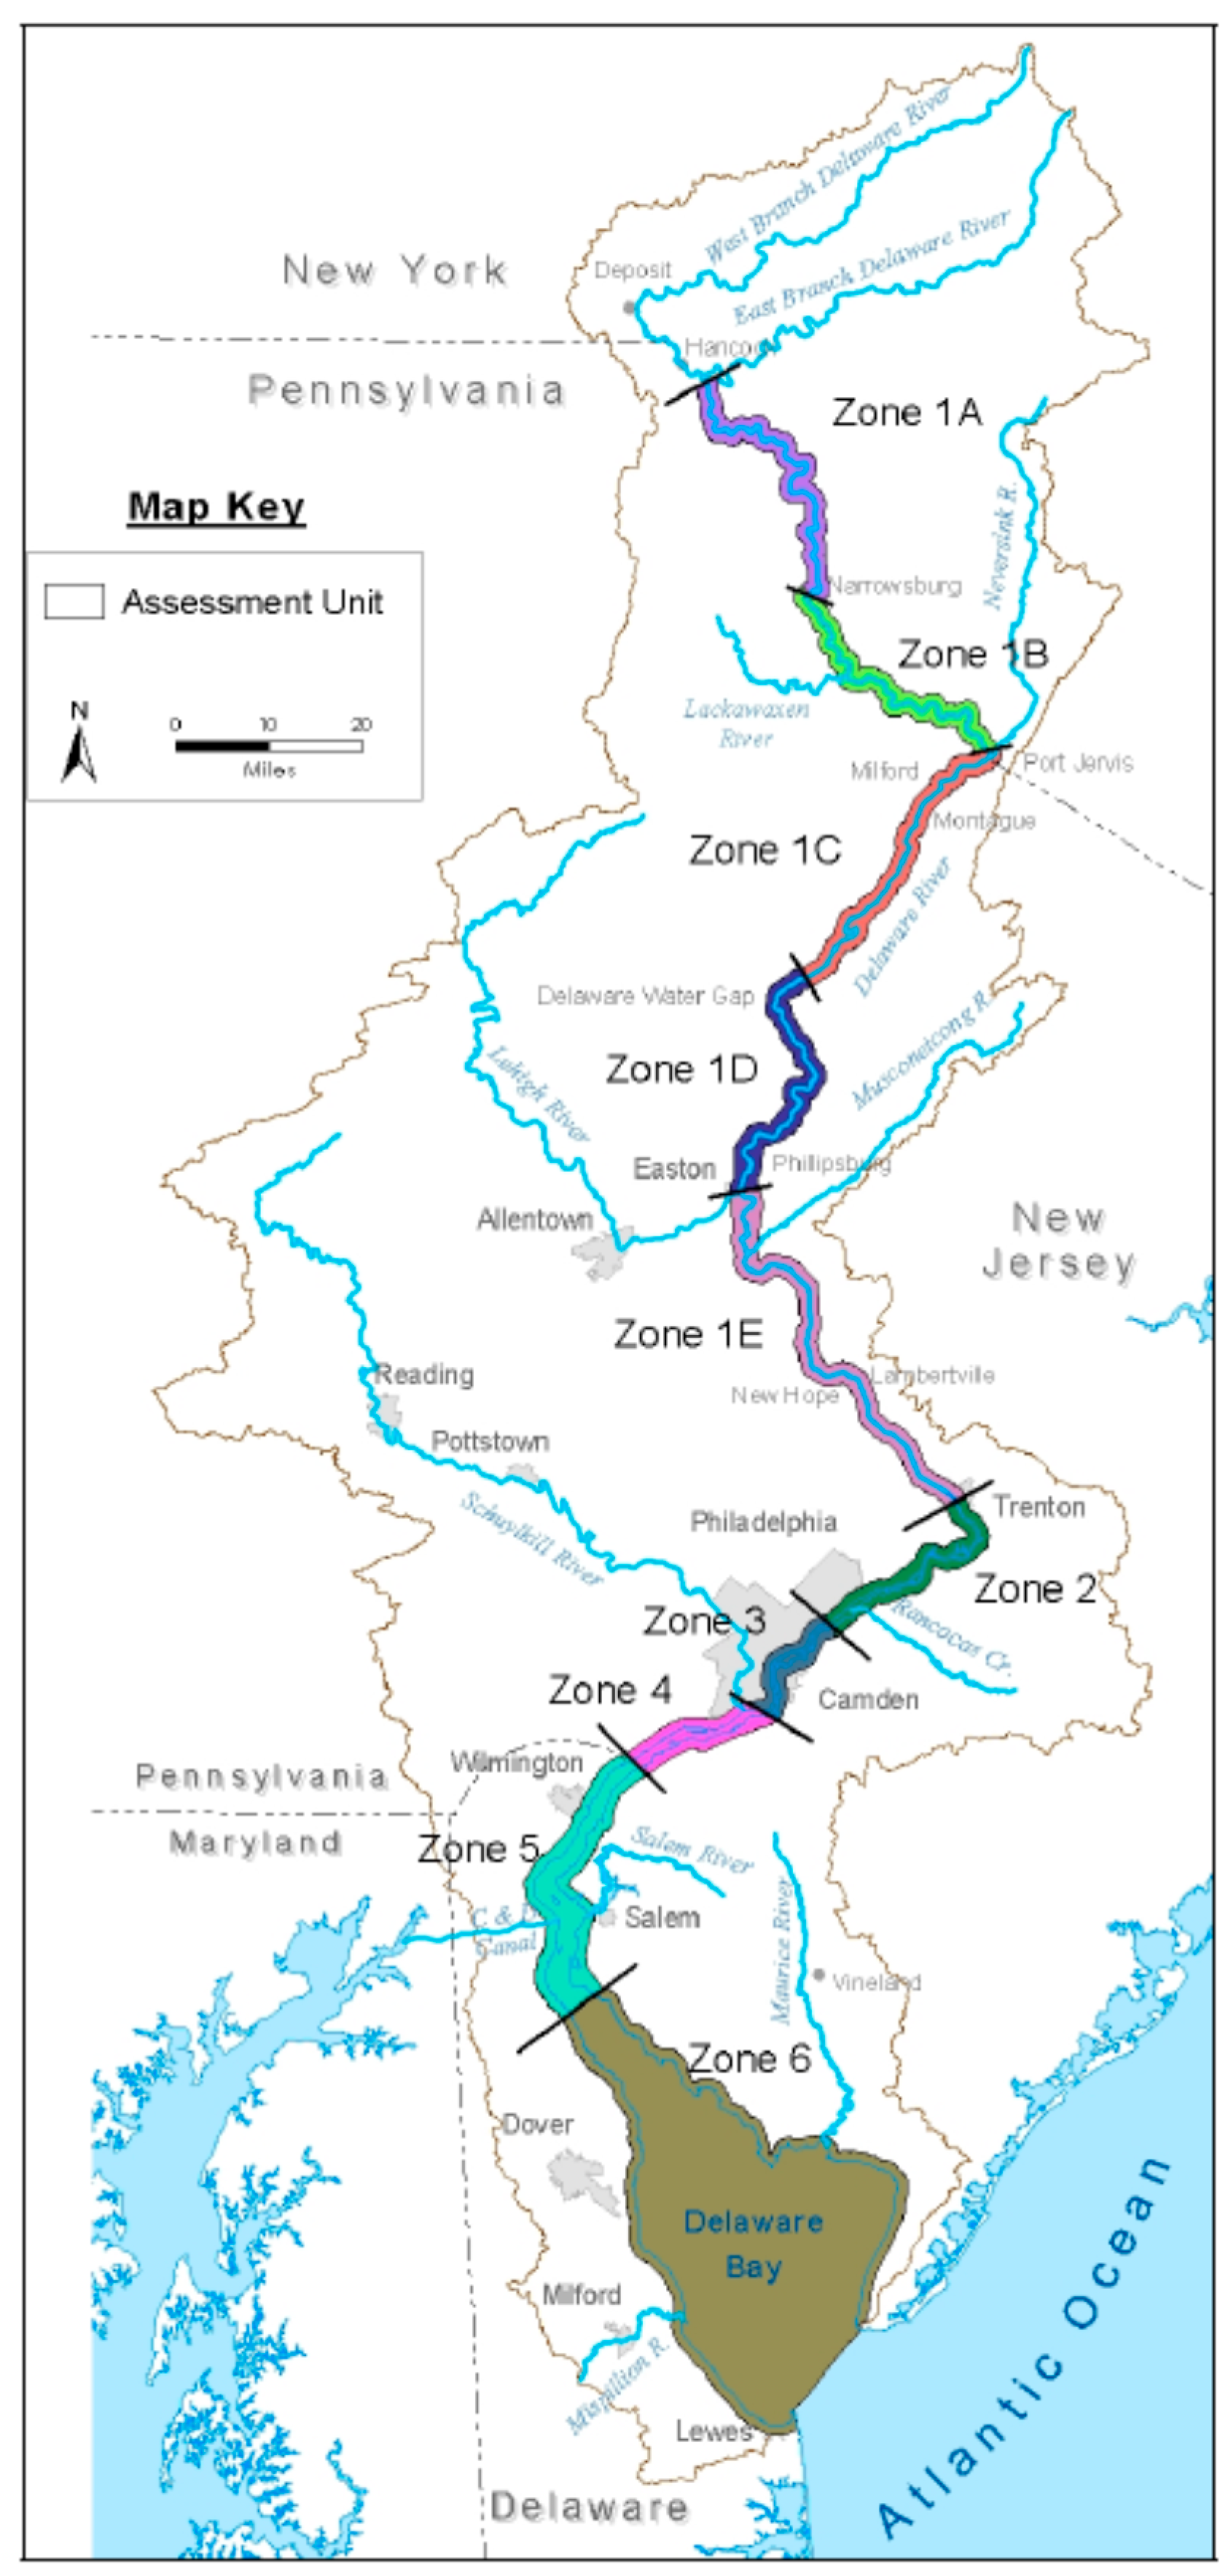
The DRBC [
26,
27] classifies the Delaware River and Bay according to 10 nontidal and tidal water quality management zones based on (a) Agricultural, Industrial, and Public Water Supply; (b) Wildlife, Fish and Aquatic Life; (c) Recreation (Swimming, Boating, Fishing, Wading); (d) Navigation; and (e) Waste Assimilation designated uses (
Figure 1). In the tidal Delaware, the summer dissolved oxygen criterion varies from 3.5 mg/L in Zones 3 and 4 (from Rancocas Creek past Philadelphia to Wilmington) to 4.5 mg/L in Zone 5 (from Wilmington to the Chesapeake & Delaware Canal). Minimum dissolved oxygen criteria are 6.5 mg/L during spring and fall in Zones 2 through 5 to allow for seasonal spawning and propagation of resident and anadromous fish.
Despite high nutrient loading, the Delaware Estuary does not exhibit classic eutrophication symptoms of hypoxia or algal blooms as observed in the nearby Chesapeake Bay. Algal blooms are inhibited by the assimilative capacity of wetlands that rim the Delaware Bay and by low light levels in the well-flushed and turbid Delaware Estuary. Through the wide 17 mi (27 km) mouth of Delaware Bay, the Atlantic Ocean contributes significant tidal flushing, thus limiting algal blooms that cause fish kills except during an occasional spring bloom in the mid estuary [
17].
During the 1960s when the river was anoxic and a decade before the 1970s Federal Clean Water Act Amendments, the DRBC imposed waste load allocations on 80 dischargers and adopted the first interstate water quality standards along the Delaware River. The Federal Water Pollution Control Administration (FWPCA) and Harvard Water Program [
28,
29,
30,
31] issued an economic report in 1966 that concluded that water supply and recreation benefits due to improved water quality in the Delaware River would exceed water pollution control costs [
32,
33,
34,
35].
The 1966 FWPCA study estimated pollutant reduction costs ranged from
$150 million to achieve a dissolved oxygen level of 2.5 mg/L to
$490 million to achieve a dissolved oxygen criterion of 4.5 mg/L with diminishing marginal costs of improvement occurring at dissolved oxygen of 3.0 mg/L (
Table 2). Thomann [
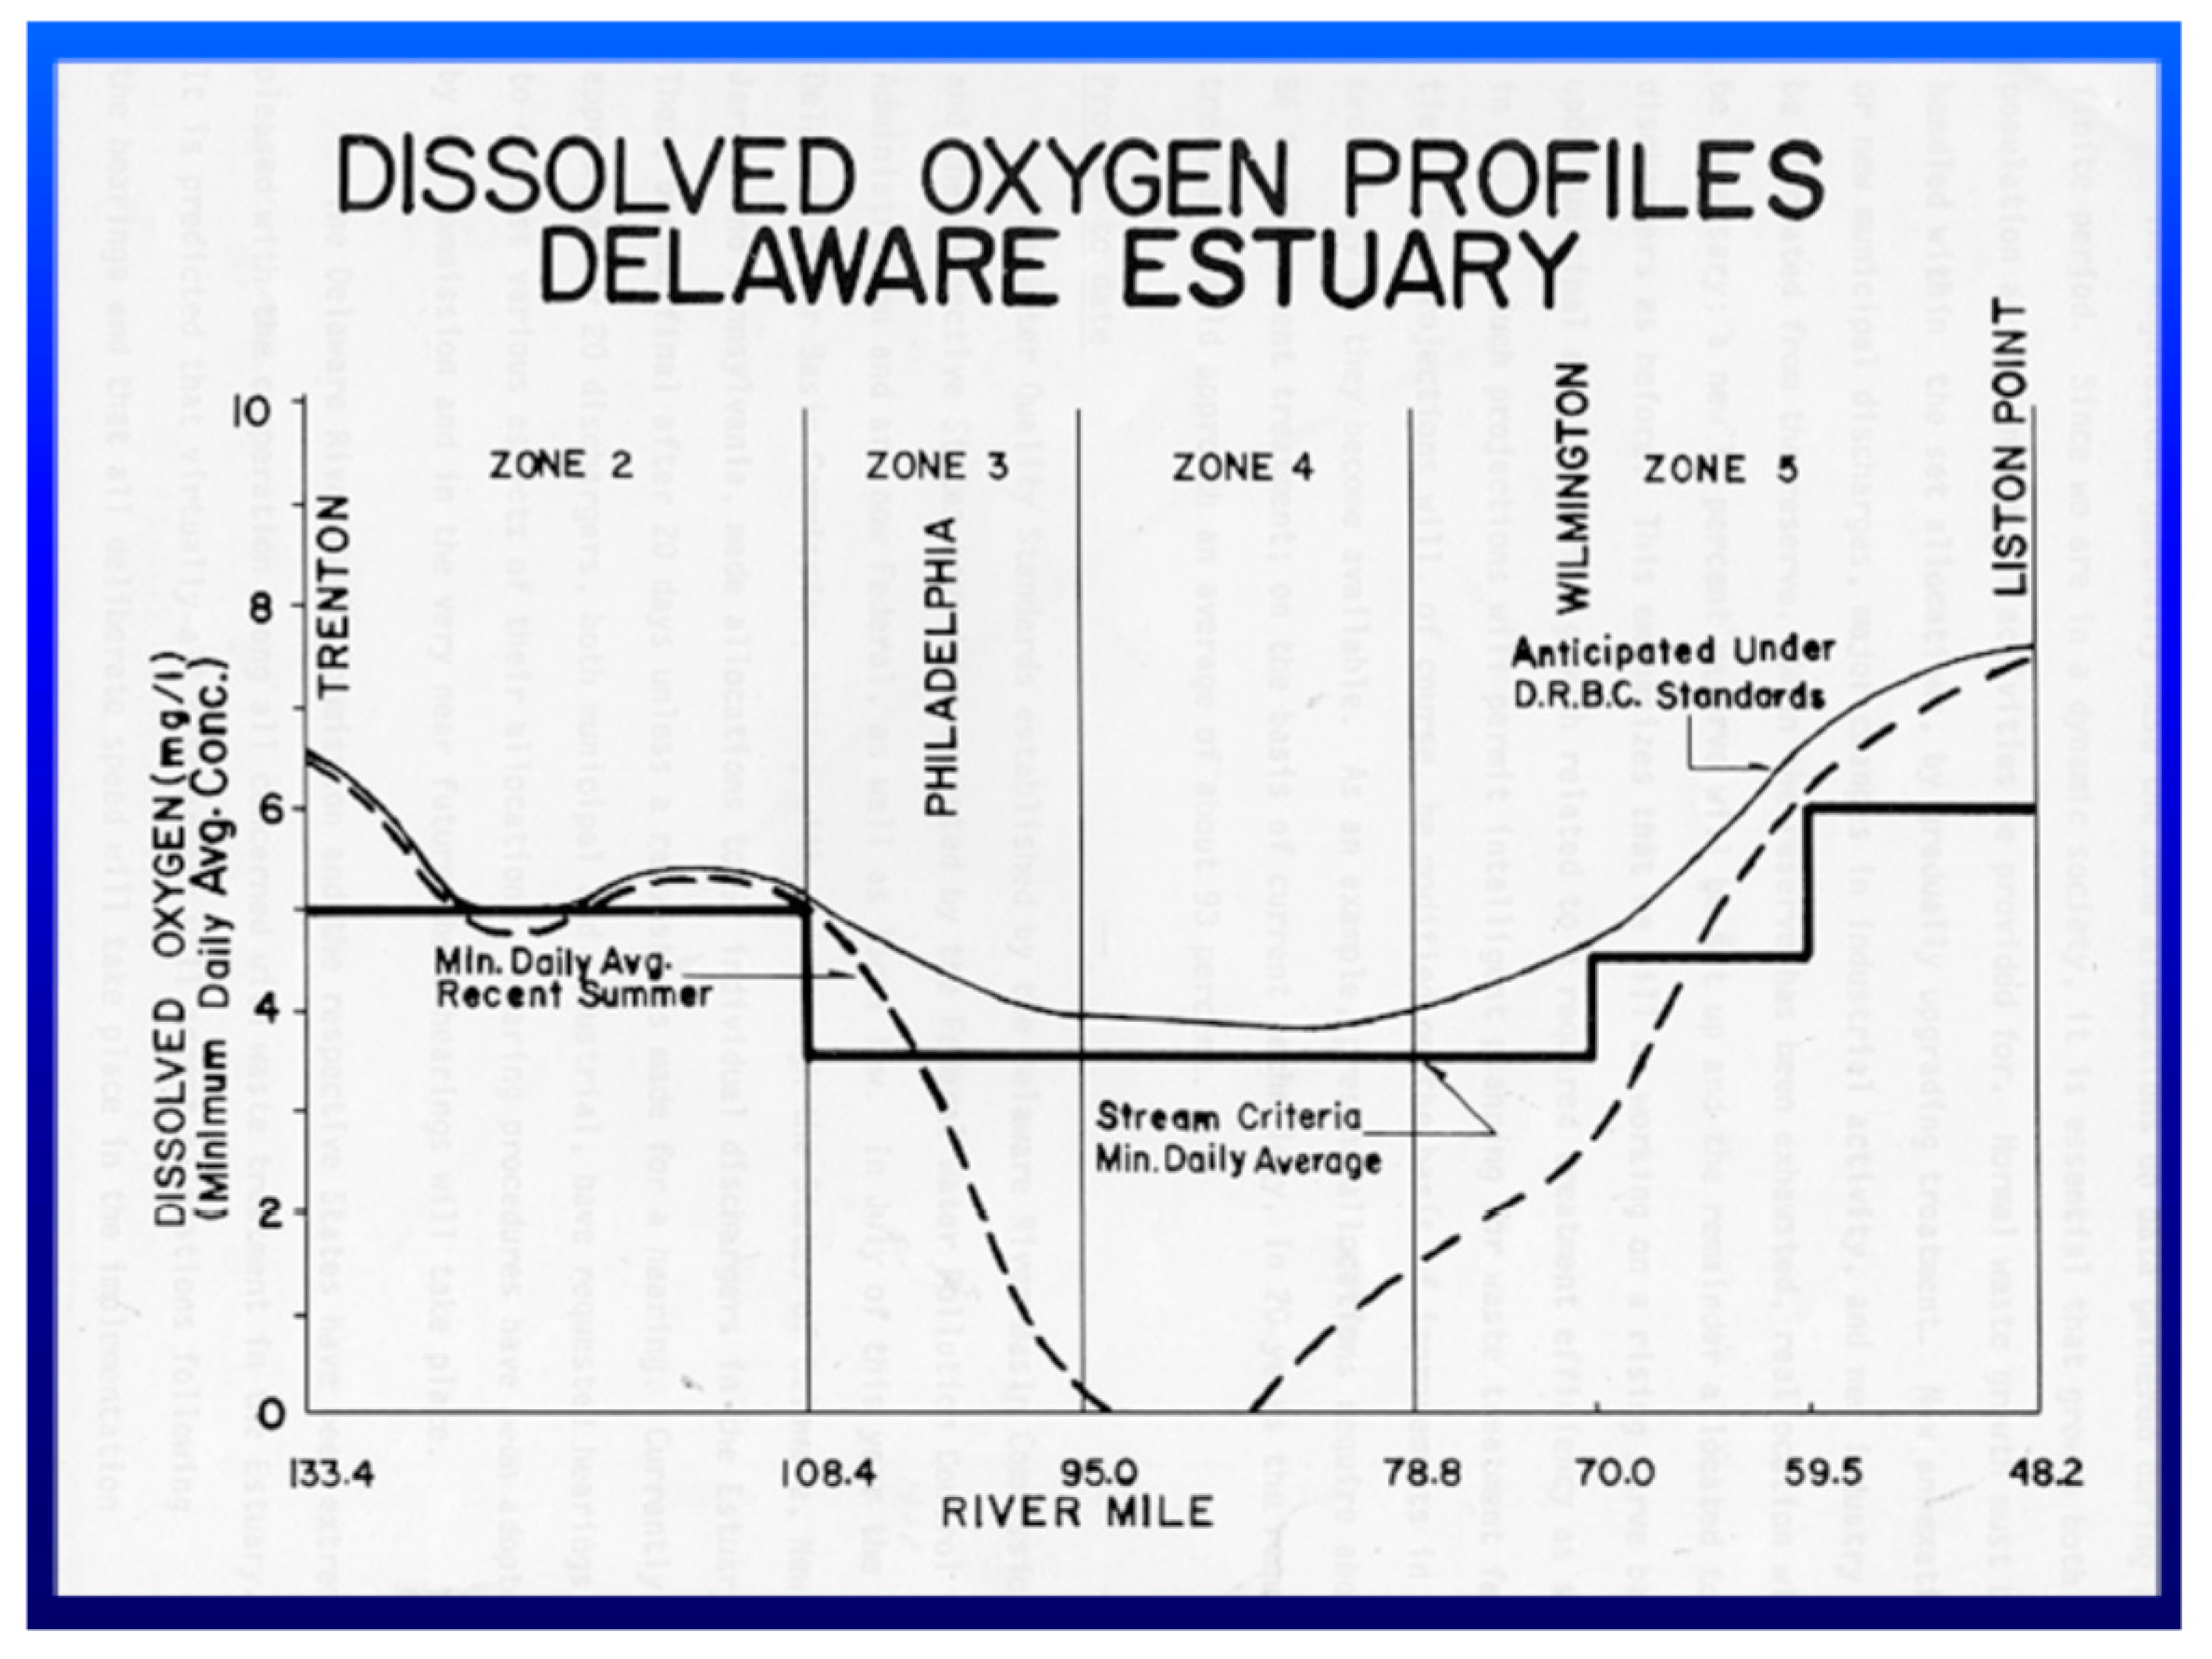
33] estimated that shad passage would achieve 80% survival if dissolved oxygen improved from 0.5 mg/L in 1964 to a future level of 3.0 mg/L. In 1967, the DRBC considered this economic analysis and set the current dissolved oxygen standard of 3.5 mg/L in the Delaware River near Philadelphia to support the spring and fall migration of anadromous fish. In 1968, the DRBC quite presciently anticipated that the waste load abatement plan would remove 85% to 90% of carbonaceous BOD and boost dissolved oxygen from near zero to 4.0 mg/L at Philadelphia (
Figure 2).
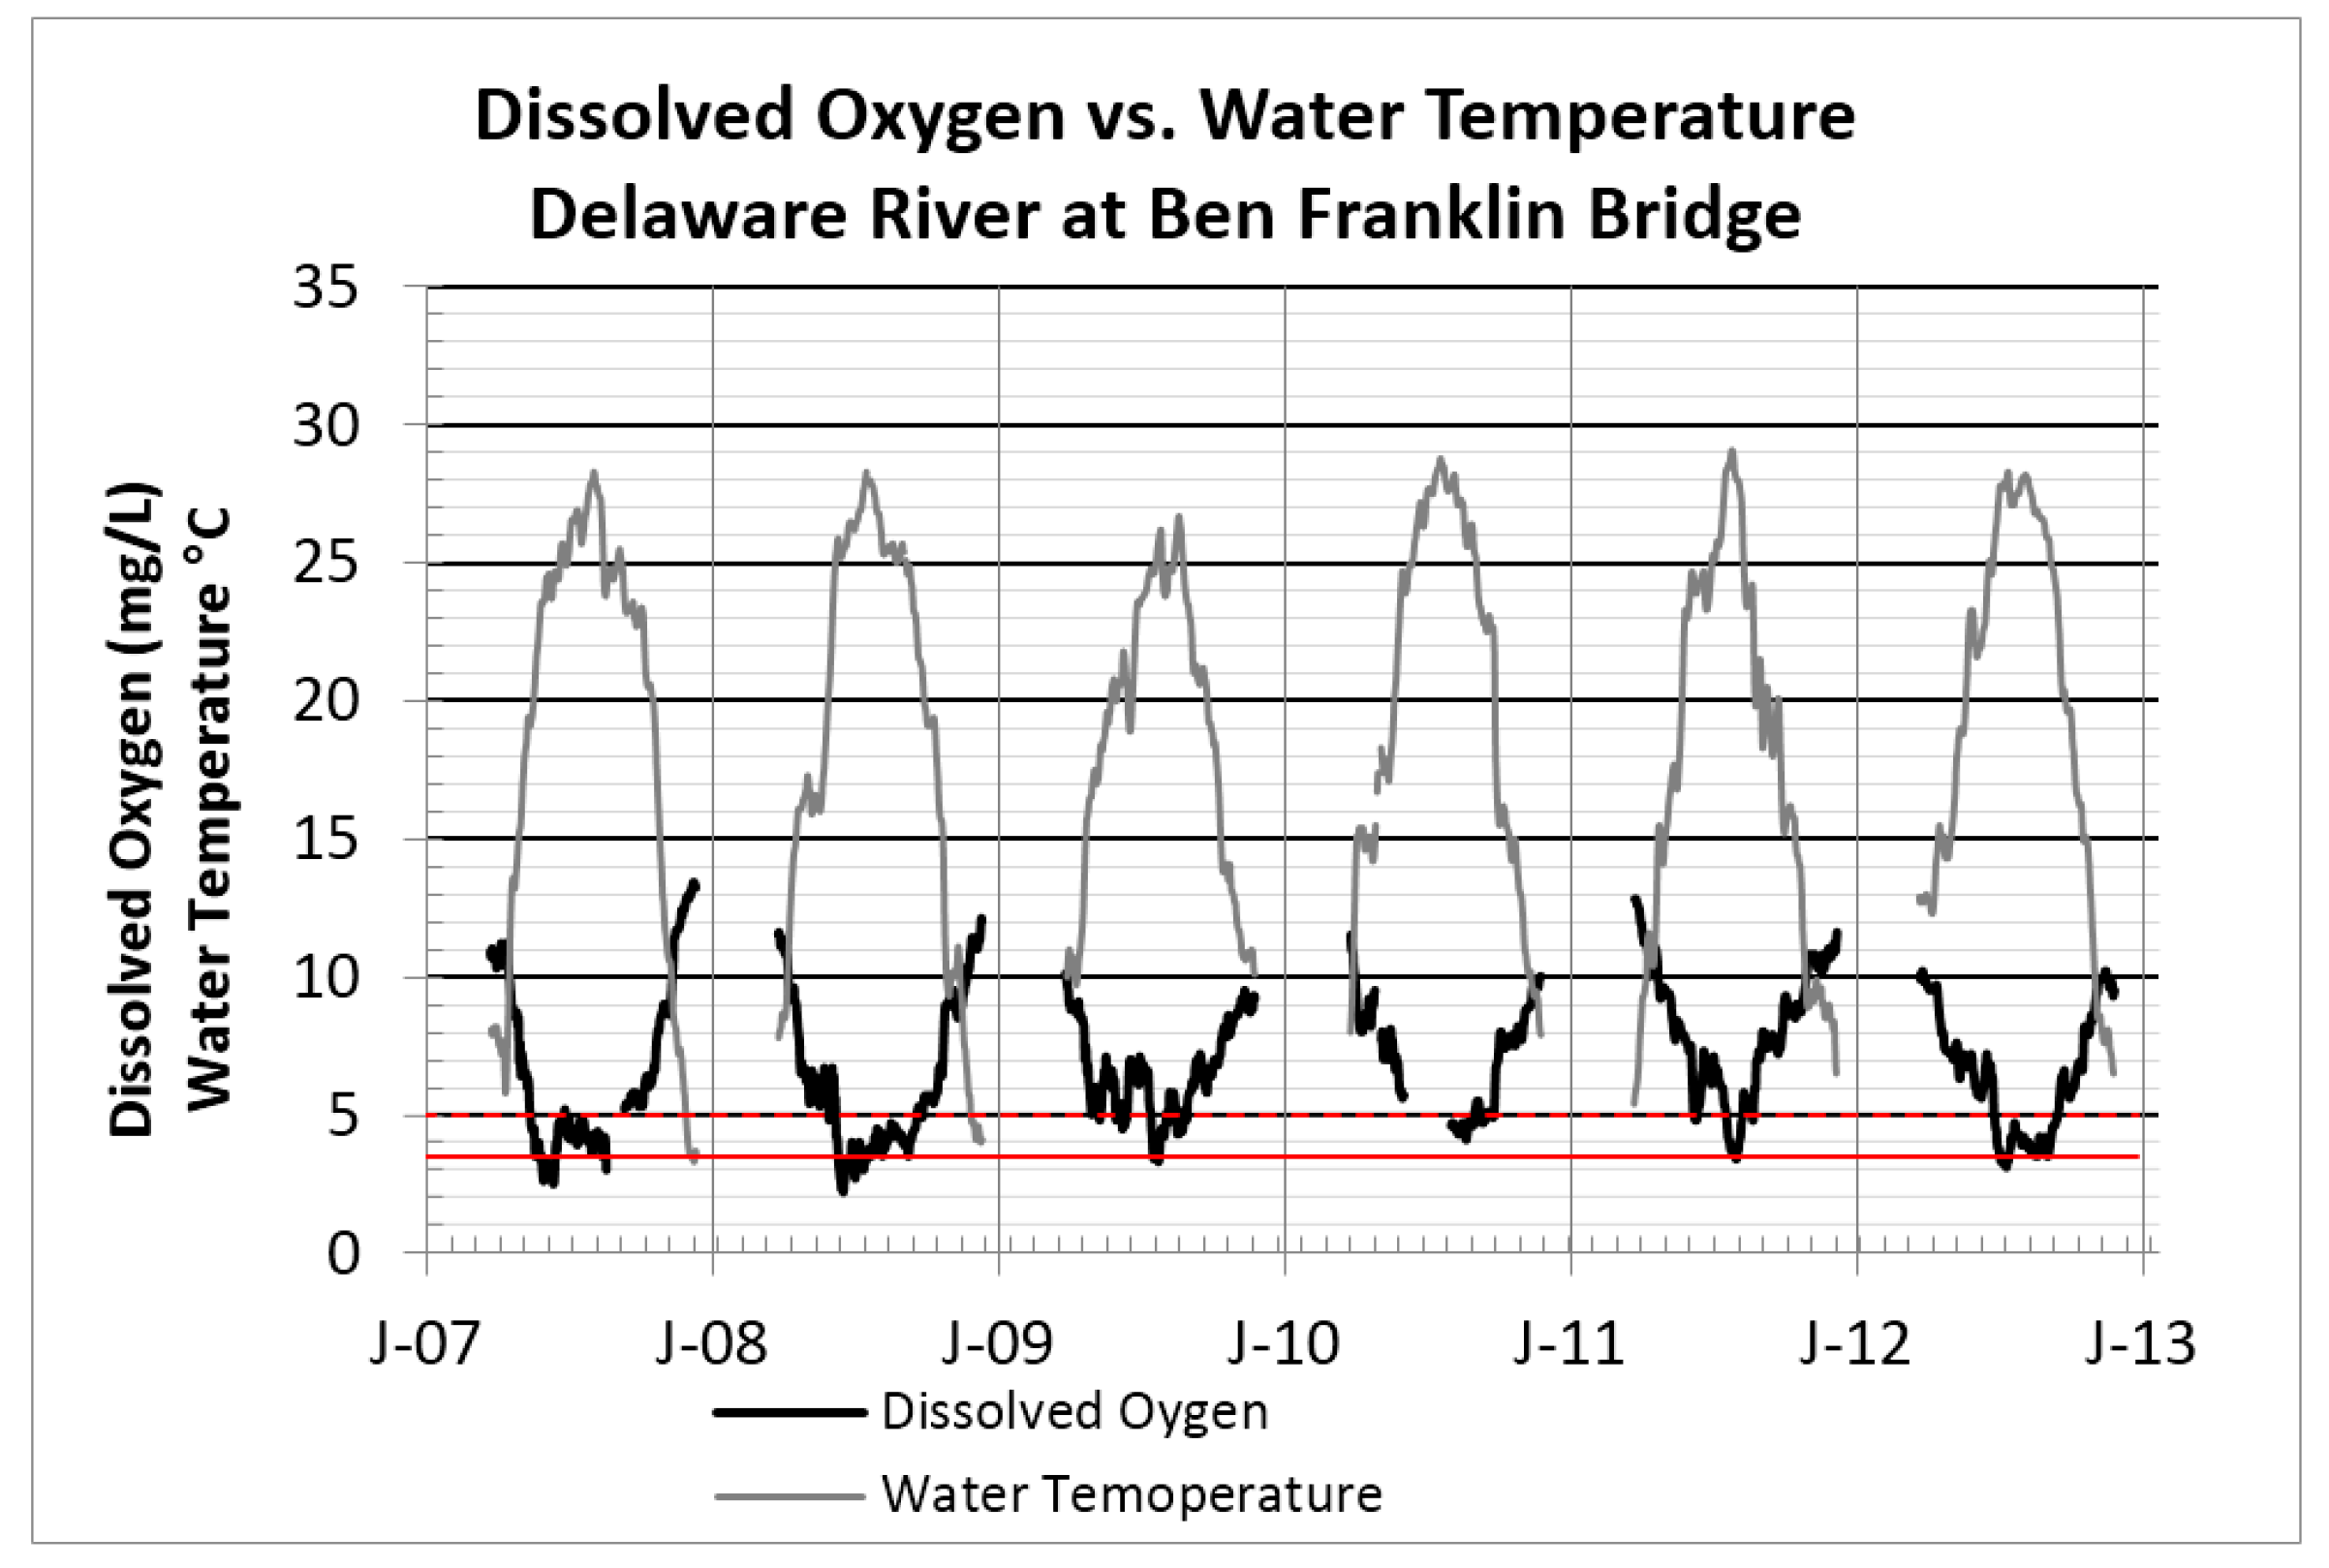
Dissolved oxygen levels in the Delaware Estuary vary by water temperature, sunlight, winds, and pollutant loads [
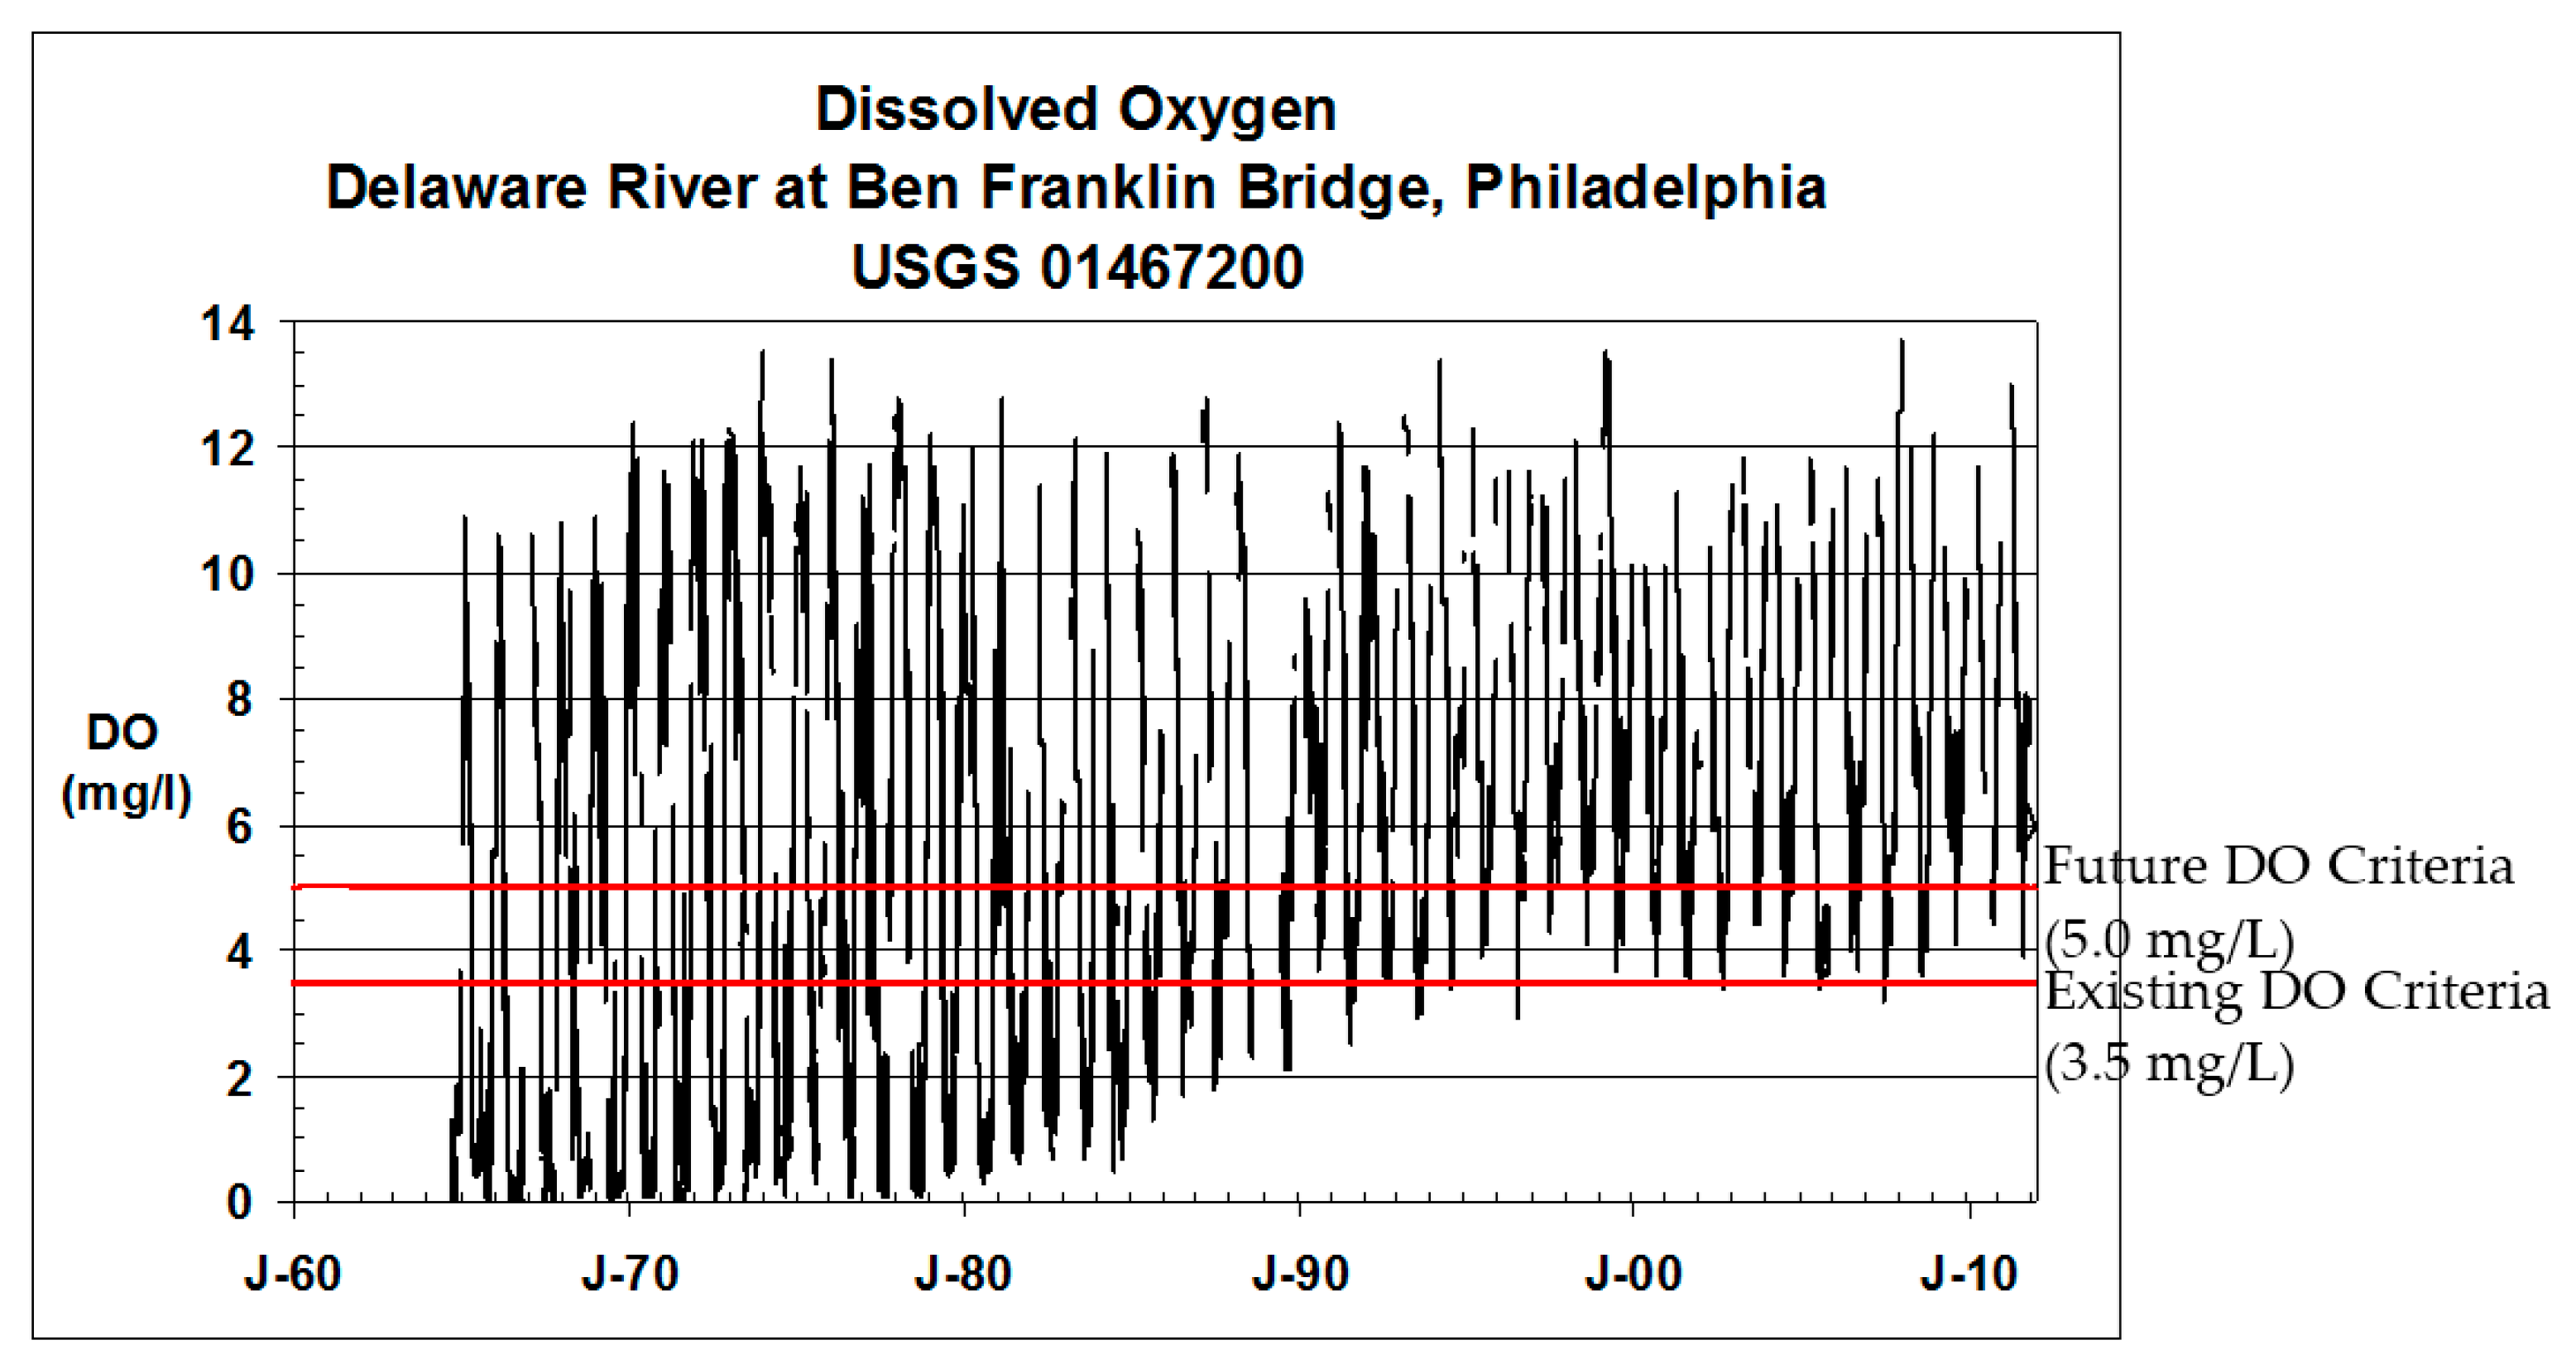
1]. By 2010, dissolved oxygen levels in the Delaware River at Ben Franklin Bridge at Philadelphia mostly exceeded the criterion except for violations below 3.5 mg/L during the hot summer months of June through August (
Figure 3). During warm summers, 0.5% of readings since 2000 did not meet the 3.5 mg/L criterion. In July and August, dissolved oxygen in the Delaware River at Philadelphia occasionally declined below the 3.5 mg/L criterion (46% dissolved oxygen saturation) when water temperatures approached 30 °C or 86 °F (
Figure 4). At 30 °C, dissolved oxygen is 100% saturated at 7.54 mg/L and 80% saturated at 6 mg/L; therefore, when water temperatures rise to 30 °C, a future DRBC dissolved oxygen standard higher than 5 mg/L (66% saturation) may prove difficult to achieve given the warm water temperatures that occur during summer.
Scientists on the Delaware Estuary Program Science and Technical Advisory Committee have recommended that the DRBC raise the fishable dissolved oxygen standard from the current level of 3.5 mg/L to at least 5.0 mg/L in Zones 3 and 4 from Philadelphia to Wilmington, given that the literature suggests that the current dissolved oxygen criterion of 3.5 mg/L is too low to support the year-round survival of anadromous shad and sturgeon [
36,
37]. Secor and Gunderson [
38] found that juvenile Atlantic sturgeon may suffer over 50% mortality at 25 °C (77 °F) when dissolved oxygen is 3.5 mg/L. Juvenile shortnose sturgeon are prone to 50% mortality when dissolved oxygen declines below 3.0 mg/L at 25 °C [
39]. In 2017, the DRBC passed a resolution authorizing basin commission scientists to begin reviewing water quality regulations to determine whether dissolved oxygen criteria should be increased from the current 3.5 mg/L to a higher level to provide more protection of anadromous fish spawning and year-round propagation of the fishery.
4. Methods
With the following research, we estimate the modern costs of the nitrogen pollutant load reductions necessary to increase dissolved oxygen from the current criterion (3.5 mg/L) to a future, more stringent water quality standard (5.0 mg/L) in the Delaware River. To estimate the most cost-effective combination of nitrogen load reductions, we (1) quantified nitrogen loads in the Delaware Basin from atmospheric, urban/suburban, wastewater, and agricultural sources and estimated the pollutant load reductions needed to improve dissolved oxygen in the Delaware River from the current 3.5 mg/L to a future, more protective standard; (2) estimated the costs of nitrogen load reductions to improve the dissolved oxygen levels in the tidal Delaware River for various best management practice scenarios; and (3) constructed marginal abatement cost curves to define the annual least costs to raise the dissolved oxygen levels to more stringent fishable criteria.
Nitrogen Loads: We estimated annual nitrogen loads in the Delaware Basin in Delaware, New Jersey, New York, and Pennsylvania using the USGS SPAtially Referenced Regressions on Watershed (SPARROW) model [
40]. The SPARROW model has been calibrated by the USGS to estimate nitrogen loads for the base year 2002 from point sources (wastewater discharges) and nonpoint sources (atmospheric deposition, agriculture fertilizer/manure, and urban/suburban land) and accounts for watershed characteristics such as precipitation, temperature, soil permeability, stream density, flow rate, velocity, and lake/reservoir hydraulics [
41]. The USGS SPARROW model simulates nitrogen removal based on hydrological processes such as denitrification, particulate settling, and water velocity [
42]. SPARROW is a nonlinear least squares regression model where the mean annual N load, as the dependent variable, is weighted by land-to-water movement, instream transport, and assimilation of nitrogen as the explanatory variable (
Table 3). Since the USGS SPARROW model calibrates the nitrogen load estimates with EPA STORET water quality monitoring data, the model is well correlated as coefficients of determination (r
2) are 0.83 for yield and 0.97 for load, which explains 83% to 97% of the variance between the predictive model and observed water quality data.
Nitrogen Load Reduction Costs: We estimated the N load reductions needed to improve water quality to meet a future 5.0 mg/L dissolved oxygen standard in the Delaware River between Philadelphia and Wilmington. We examined the EPA Water Quality Analysis Simulation Program (WASP), USGS Hydrological Simulation Program-Fortran (HSPF), and Generalized Watershed Loading Function (GWLF) to estimate Total Maximum Daily Load (TMDL) pollutant load reductions in the lower Delaware Basin [
43]. These hydrodynamic models suggest “better-than-secondary” treatment is needed to meet a more stringent dissolved oxygen water quality standard of 5 mg/L in the Delaware River at Philadelphia.
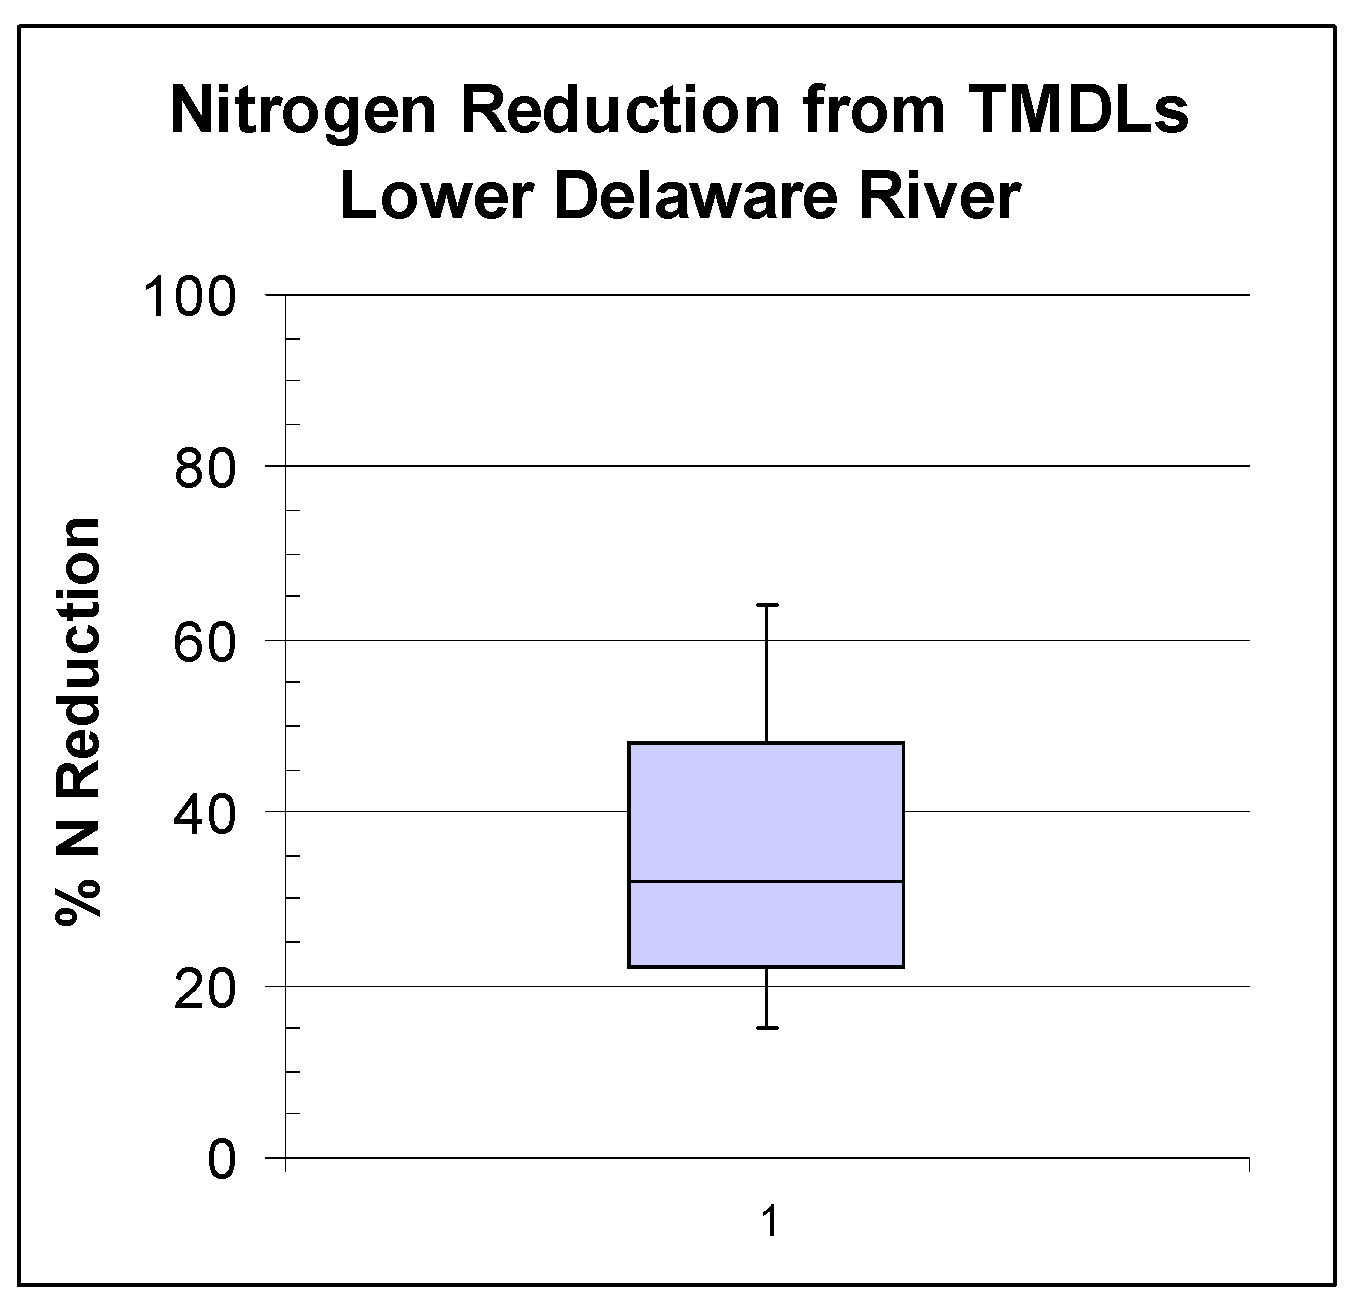
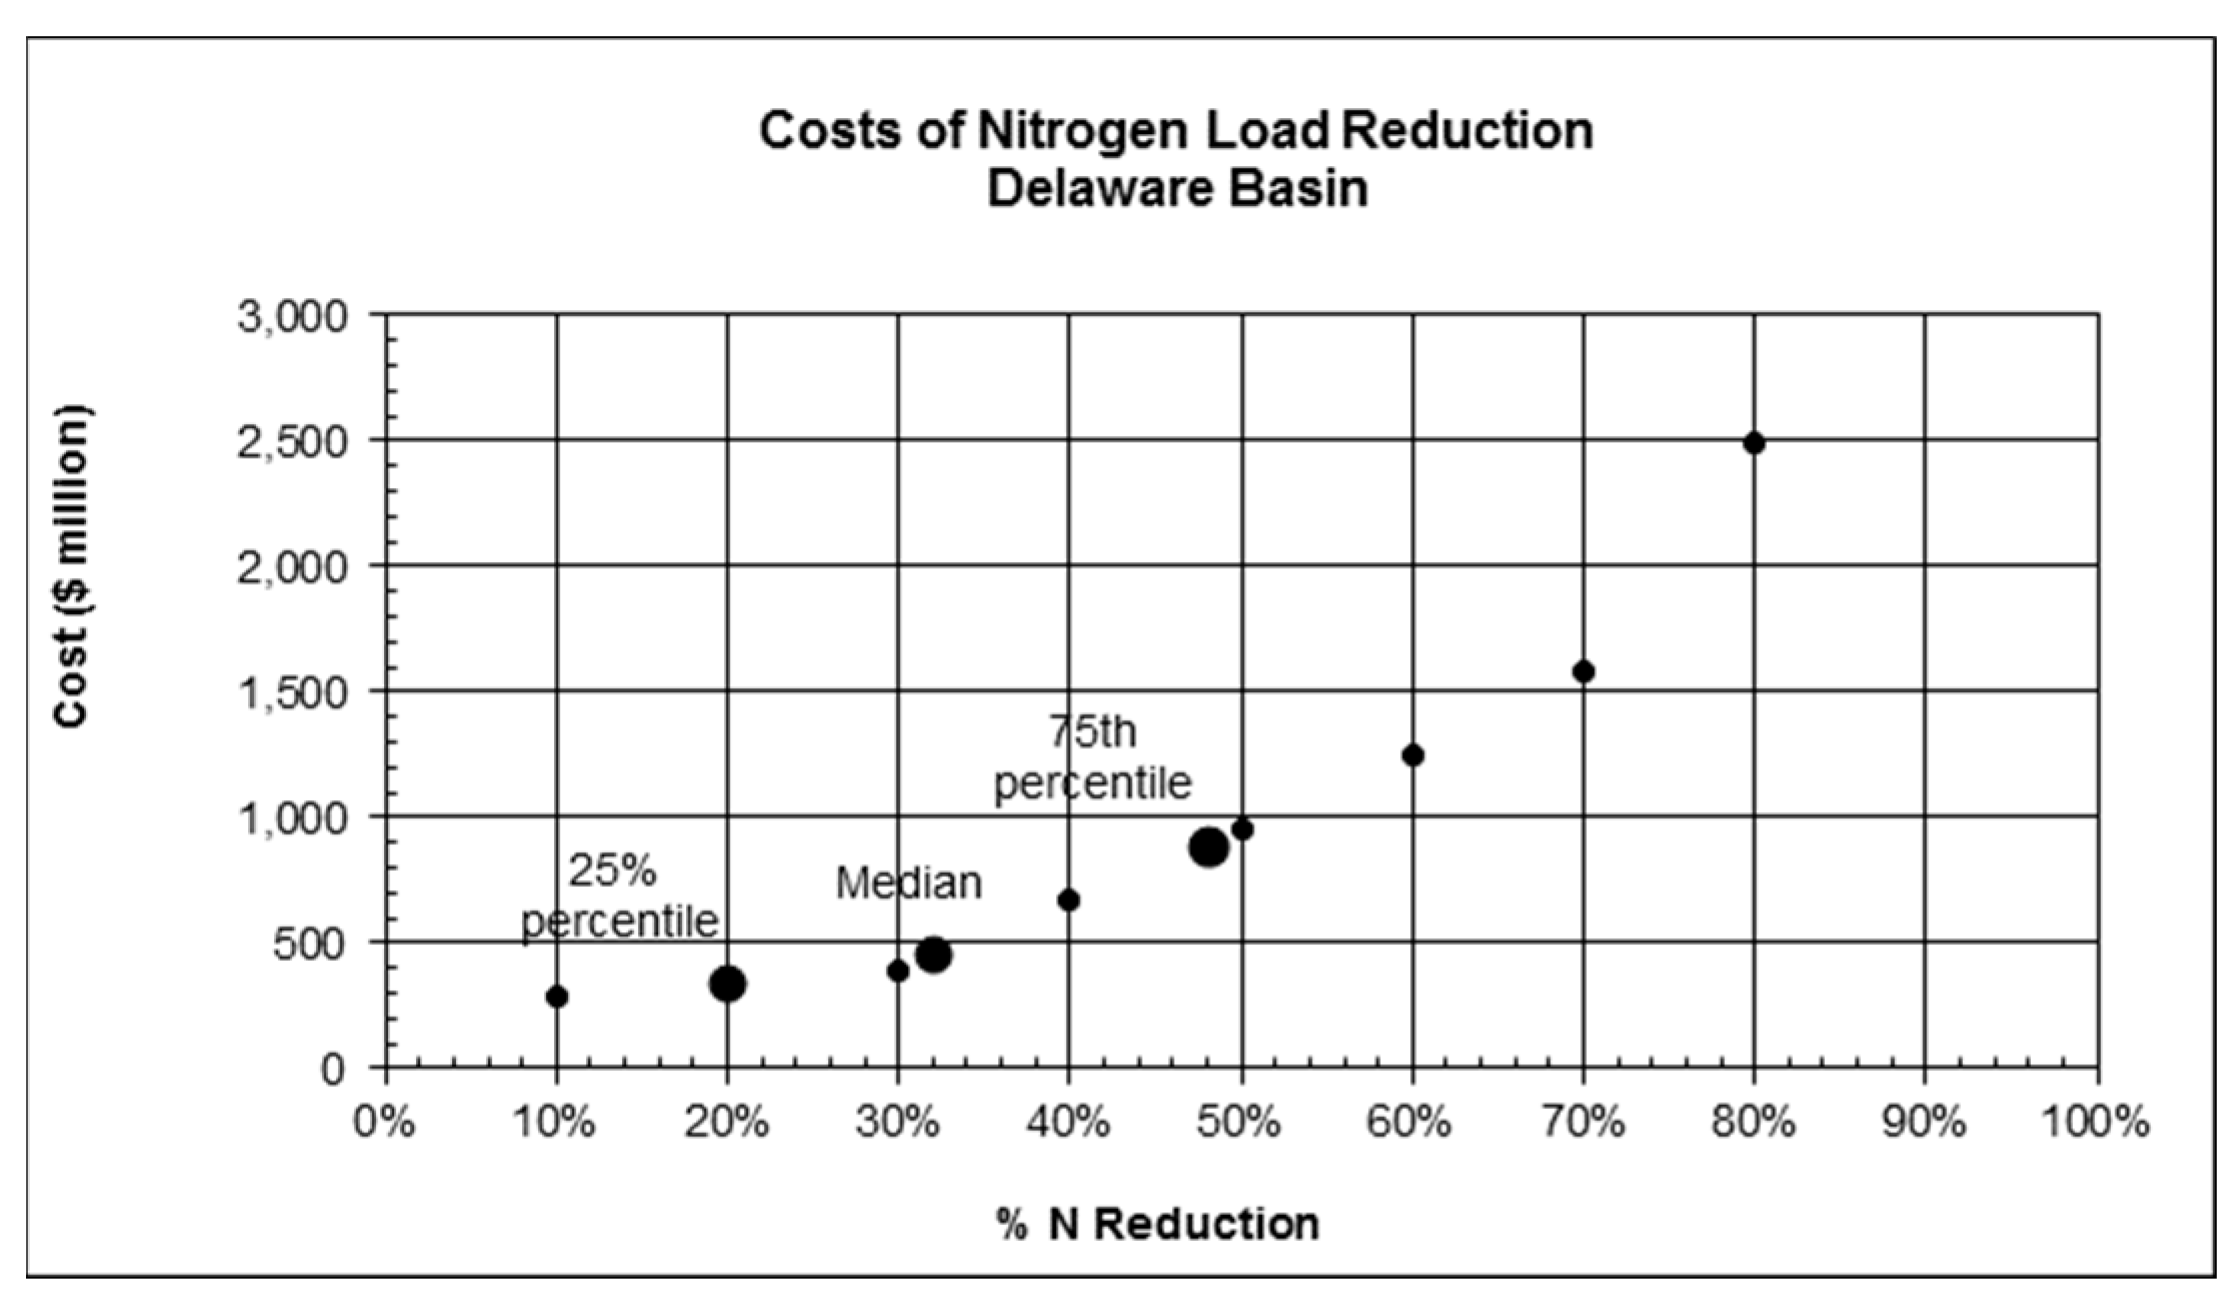
We reviewed a survey of 15 TMDL models by Scatena et al. [
44] in the lower Delaware River that suggests that achieving a dissolved oxygen target of 5.0 mg/L would require a 32% (median) reduction in nitrogen loading to water bodies, within a range from 20% (25th percentile) to 48% (75th percentile) reduction (
Figure 5). Similarly, the Brandywine-Christina watershed TMDL model estimated that a 38% reduction in nitrogen loads is needed to meet a dissolved oxygen water quality criterion of 5 mg/L in the watershed that contributes 8% of the N load to the Delaware Estuary [
45].
Best Management Practice (BMP) Installation Costs: We derived the unit costs of N load reductions (
$/lb N reduced) for point source wastewater treatment BMPs and nonpoint source BMPs such as atmospheric controls (vehicle exhaust and industrial plant scrubbers), urban stormwater retrofitting, stream restoration, wetlands, and agricultural practices such as no till, cover crops, forest buffers, and animal waste management (
Table 4).
We calculated the costs to reduce nitrogen loads by 20% (25th percentile), by 32% (median), and by 48% (75th percentile) to meet a more stringent DRBC dissolved oxygen standard by multiplying N load reduction rates (kg/year) by the unit cost (
$/kg) (in 2010 dollars) for atmospheric NOX reduction, wastewater treatment, agriculture conservation, and urban/suburban BMPs. The combined Total Maximum Daily Load (TMDL) models for the Delaware River required nitrogen load reductions of 32% (median) within a range of 20% (25th percentile) and 48% (75th percentile). Using benefit (value) transfer principles, we reviewed the literature [
46,
47,
48,
49] and translated nitrogen load reduction costs (
$/kg) from nearby watersheds (such as the Chesapeake Bay) to the Delaware River watershed since the adjacent watersheds share similar climate, soils, topography, physiography, and hydrogeology.
Total Nitrogen Load Reduction Costs: We estimated the costs to reduce nitrogen loads by the median 32% by maximizing load reductions from least cost agriculture and wastewater sources for the following five options. We estimated the nitrogen load reduction costs by multiplying the necessary nitrogen load reduction from the SPARROW model (kg N/year) by the nitrogen load reduction costs ($/kg N). Option 1 would reduce nitrogen loads equally by the median 32% from all sources (agriculture, wastewater, atmospheric, and urban/suburban stormwater). Option 2 would reduce nitrogen loads from agriculture by 32%, wastewater by 47%, atmospheric deposition by 5%, and urban/suburban stormwater by 5%. Option 3 would reduce nitrogen loads from agriculture by 60%, wastewater by 29%, atmospheric deposition by 5%, and urban/suburban stormwater by 5%. Option 4 would reduce nitrogen loads from agriculture by 75%, wastewater by 20%, atmospheric deposition by 5%, and urban/suburban stormwater by 5%. Options 5 would reduce nitrogen loads from agriculture by 90%, wastewater by 10%, atmospheric deposition by 5%, and urban/suburban stormwater by 5%.
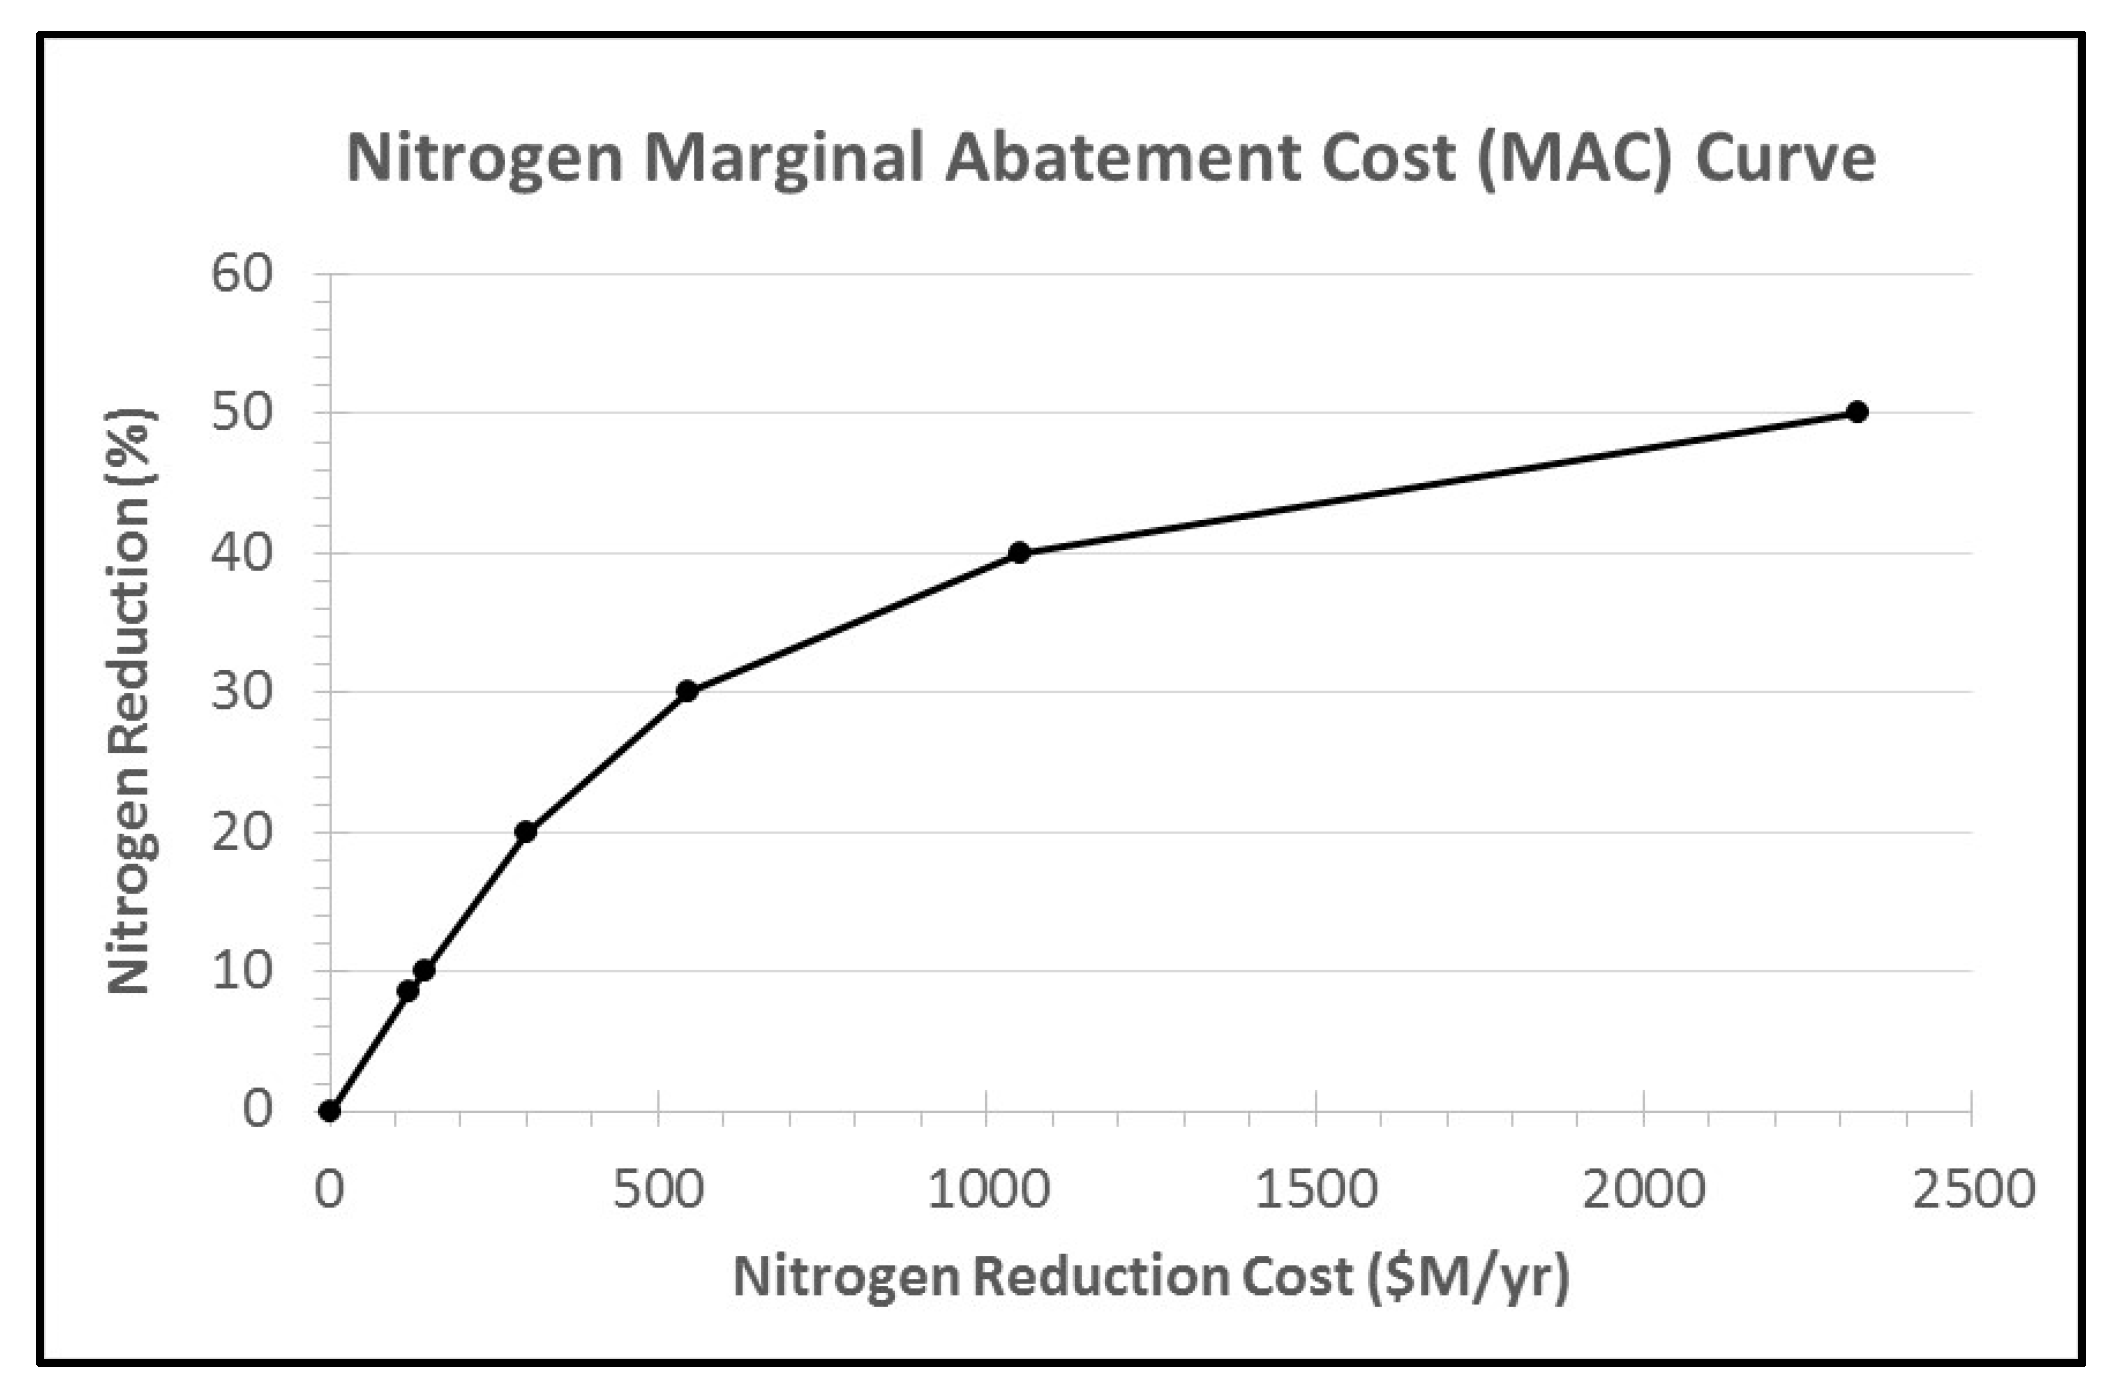
Marginal Abatement Costs: We constructed nitrogen marginal abatement cost (MAC) curves to determine the most cost-effective N load reductions to improve water quality by raising dissolved oxygen in the Delaware River to more stringent fishable criteria. The marginal cost curves show the change in cost compared with the change in reduced pollutant loads. The MAC curve is constructed by plotting pollutant load reductions by percentage or in kg/year (lb/year) for the practices and by the annual costs of these measures. The MAC curves are constructed by plotting N load reduction costs (
$/year) on the horizontal axis and 25th, 50th (median), and 75th percentile N load reductions on the vertical axis. Typical marginal abatement cost curves [
50] depict relatively inexpensive measures on the left and more expensive measures to the right (
Figure 6).
5. Results
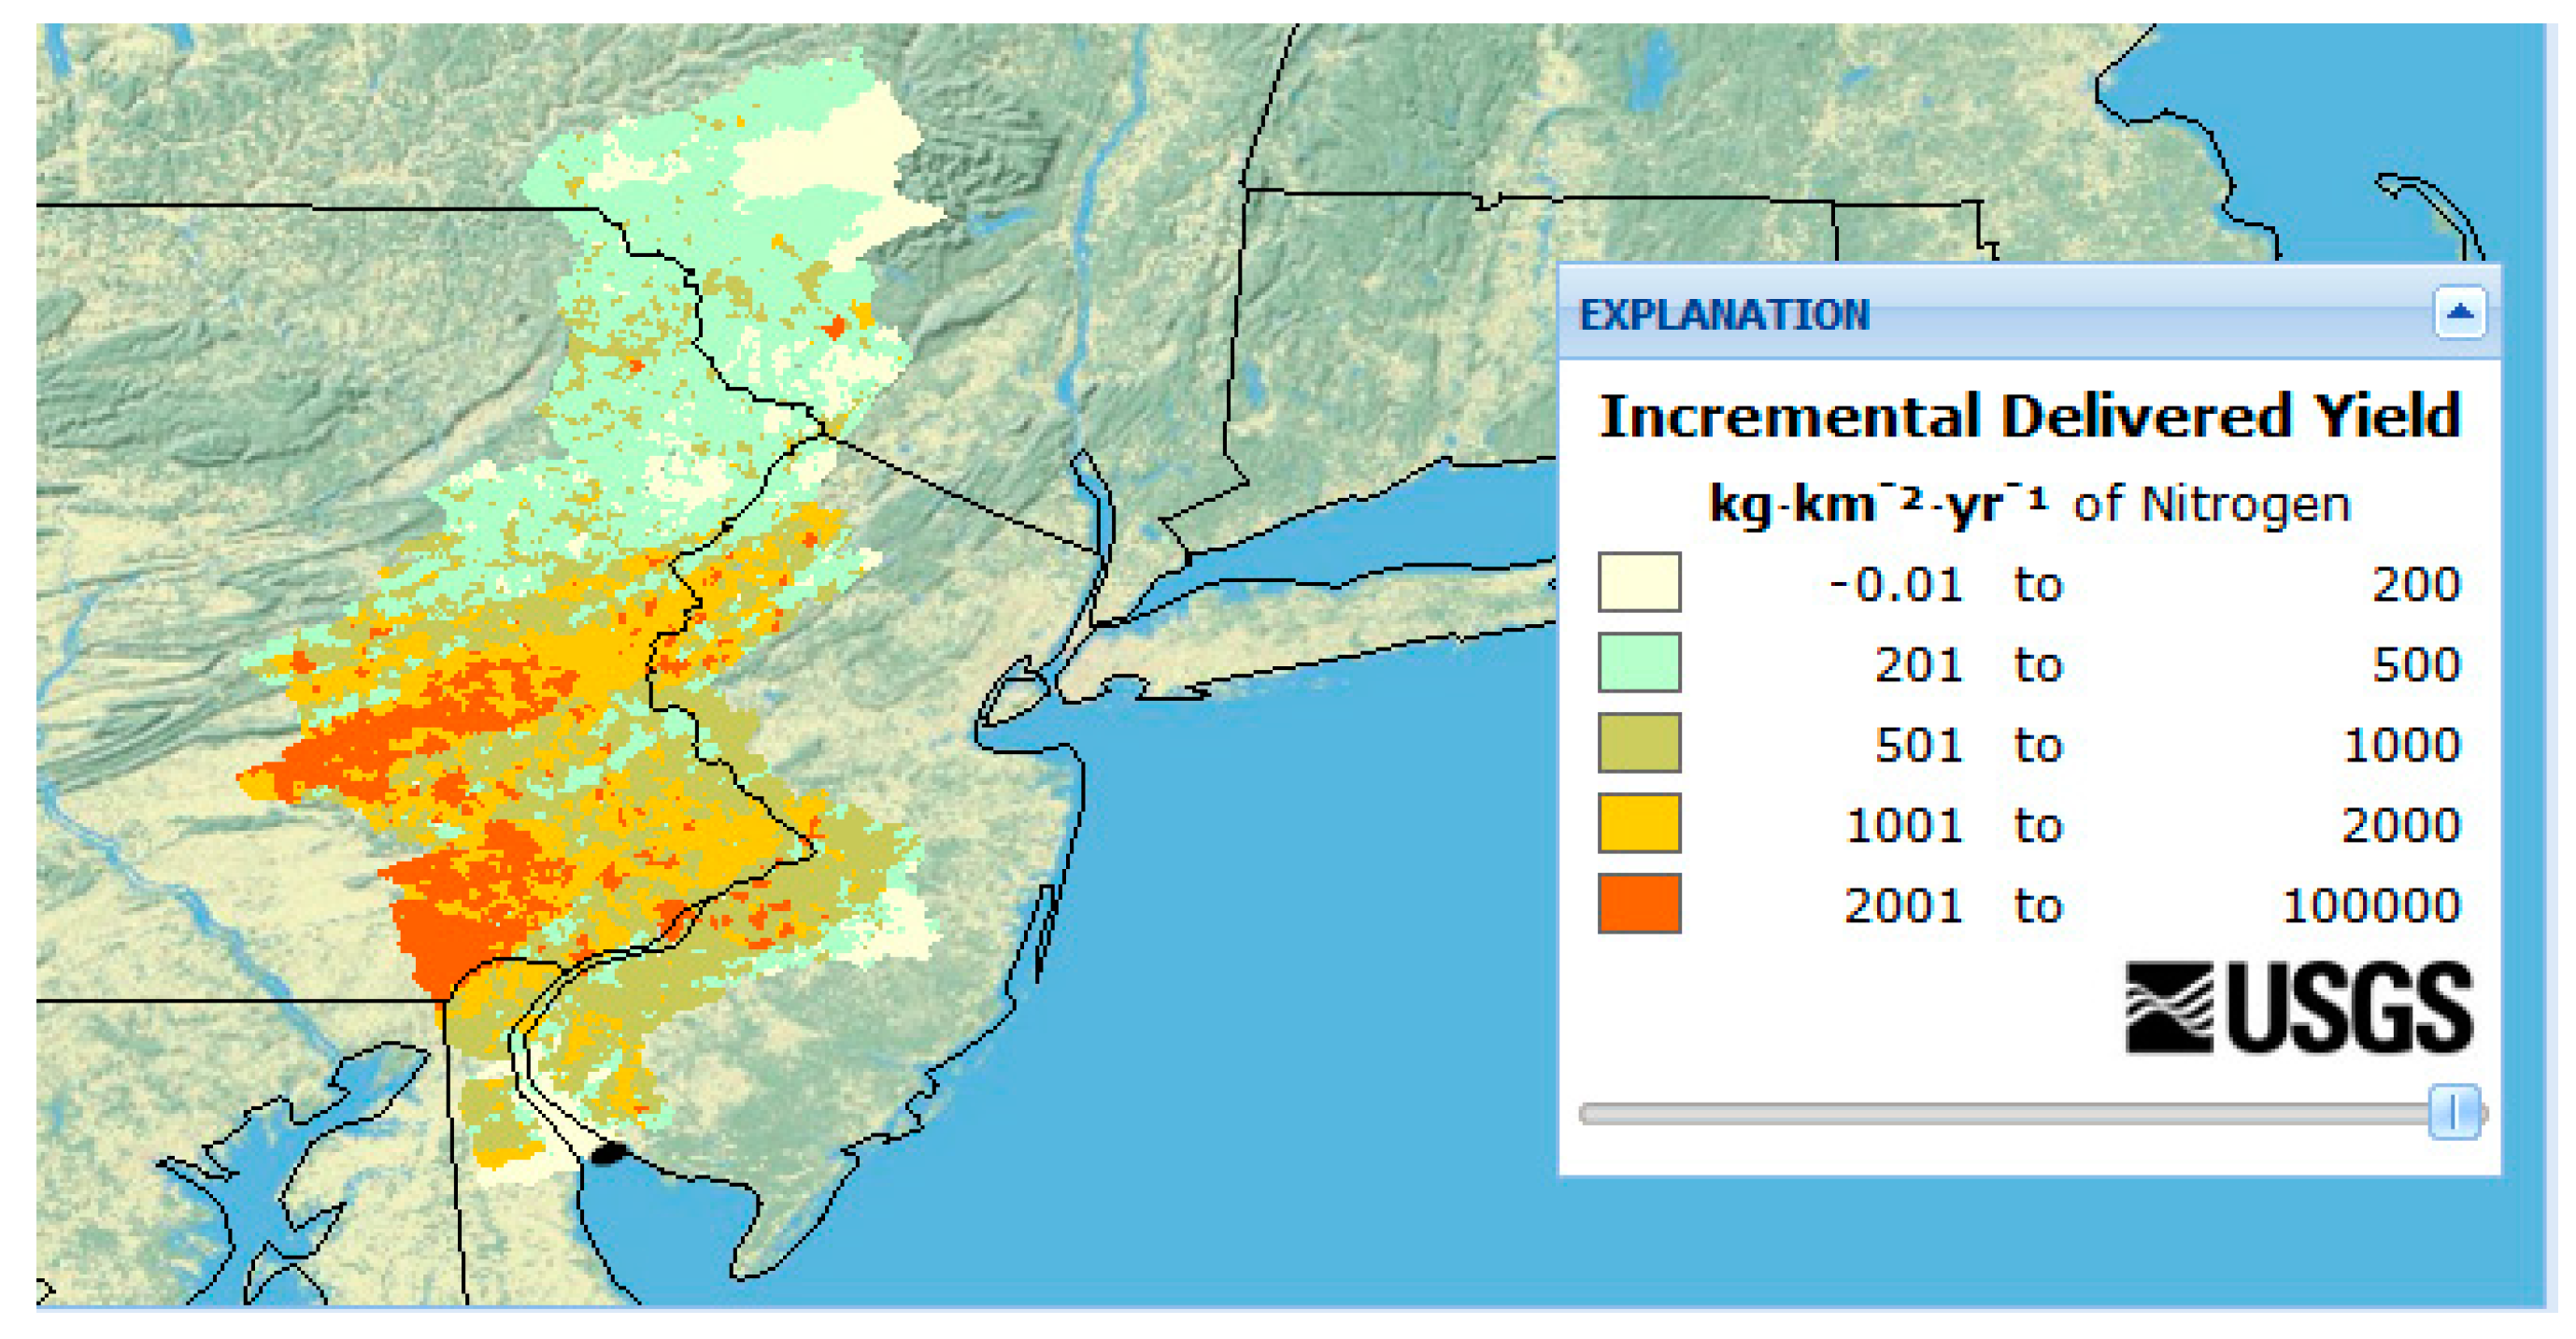
Results from our use of the USGS SPARROW model indicates that the highest nitrogen loads in the Delaware River watershed are delivered in the Schuylkill River and Brandywine-Christina watersheds in southeastern Pennsylvania (
Figure 7). The Delaware River receives the second-highest nitrogen load of any river basin along the Atlantic Coast of the USA (
Table 5). The SPARROW model utilizes land cover data to predict the nitrogen loads from urban/suburban and agricultural runoff. Our GIS analysis utilizing 2006 NOAA Coastal Services Center (CSC) land use/land cover data indicates that the Delaware River Basin was covered by 63% forest/wetlands, 20% agriculture, and 17% urban/suburban land. Pennsylvania covers 51%, New Jersey and New York each cover 21%, and Delaware covers 8% of the Delaware River Basin. The spatial distribution and fragmentation of land cover types affect pollutant loads to waterways; for example, farmed areas next to streams will deliver a higher nitrogen yield that can be filtered by riparian forested buffer areas. Based on the delivery fraction of nitrogen (proportion of N load delivered to the outlet), BMPs implemented in watersheds closest to the Delaware Estuary provide the most immediate improvements in water quality.
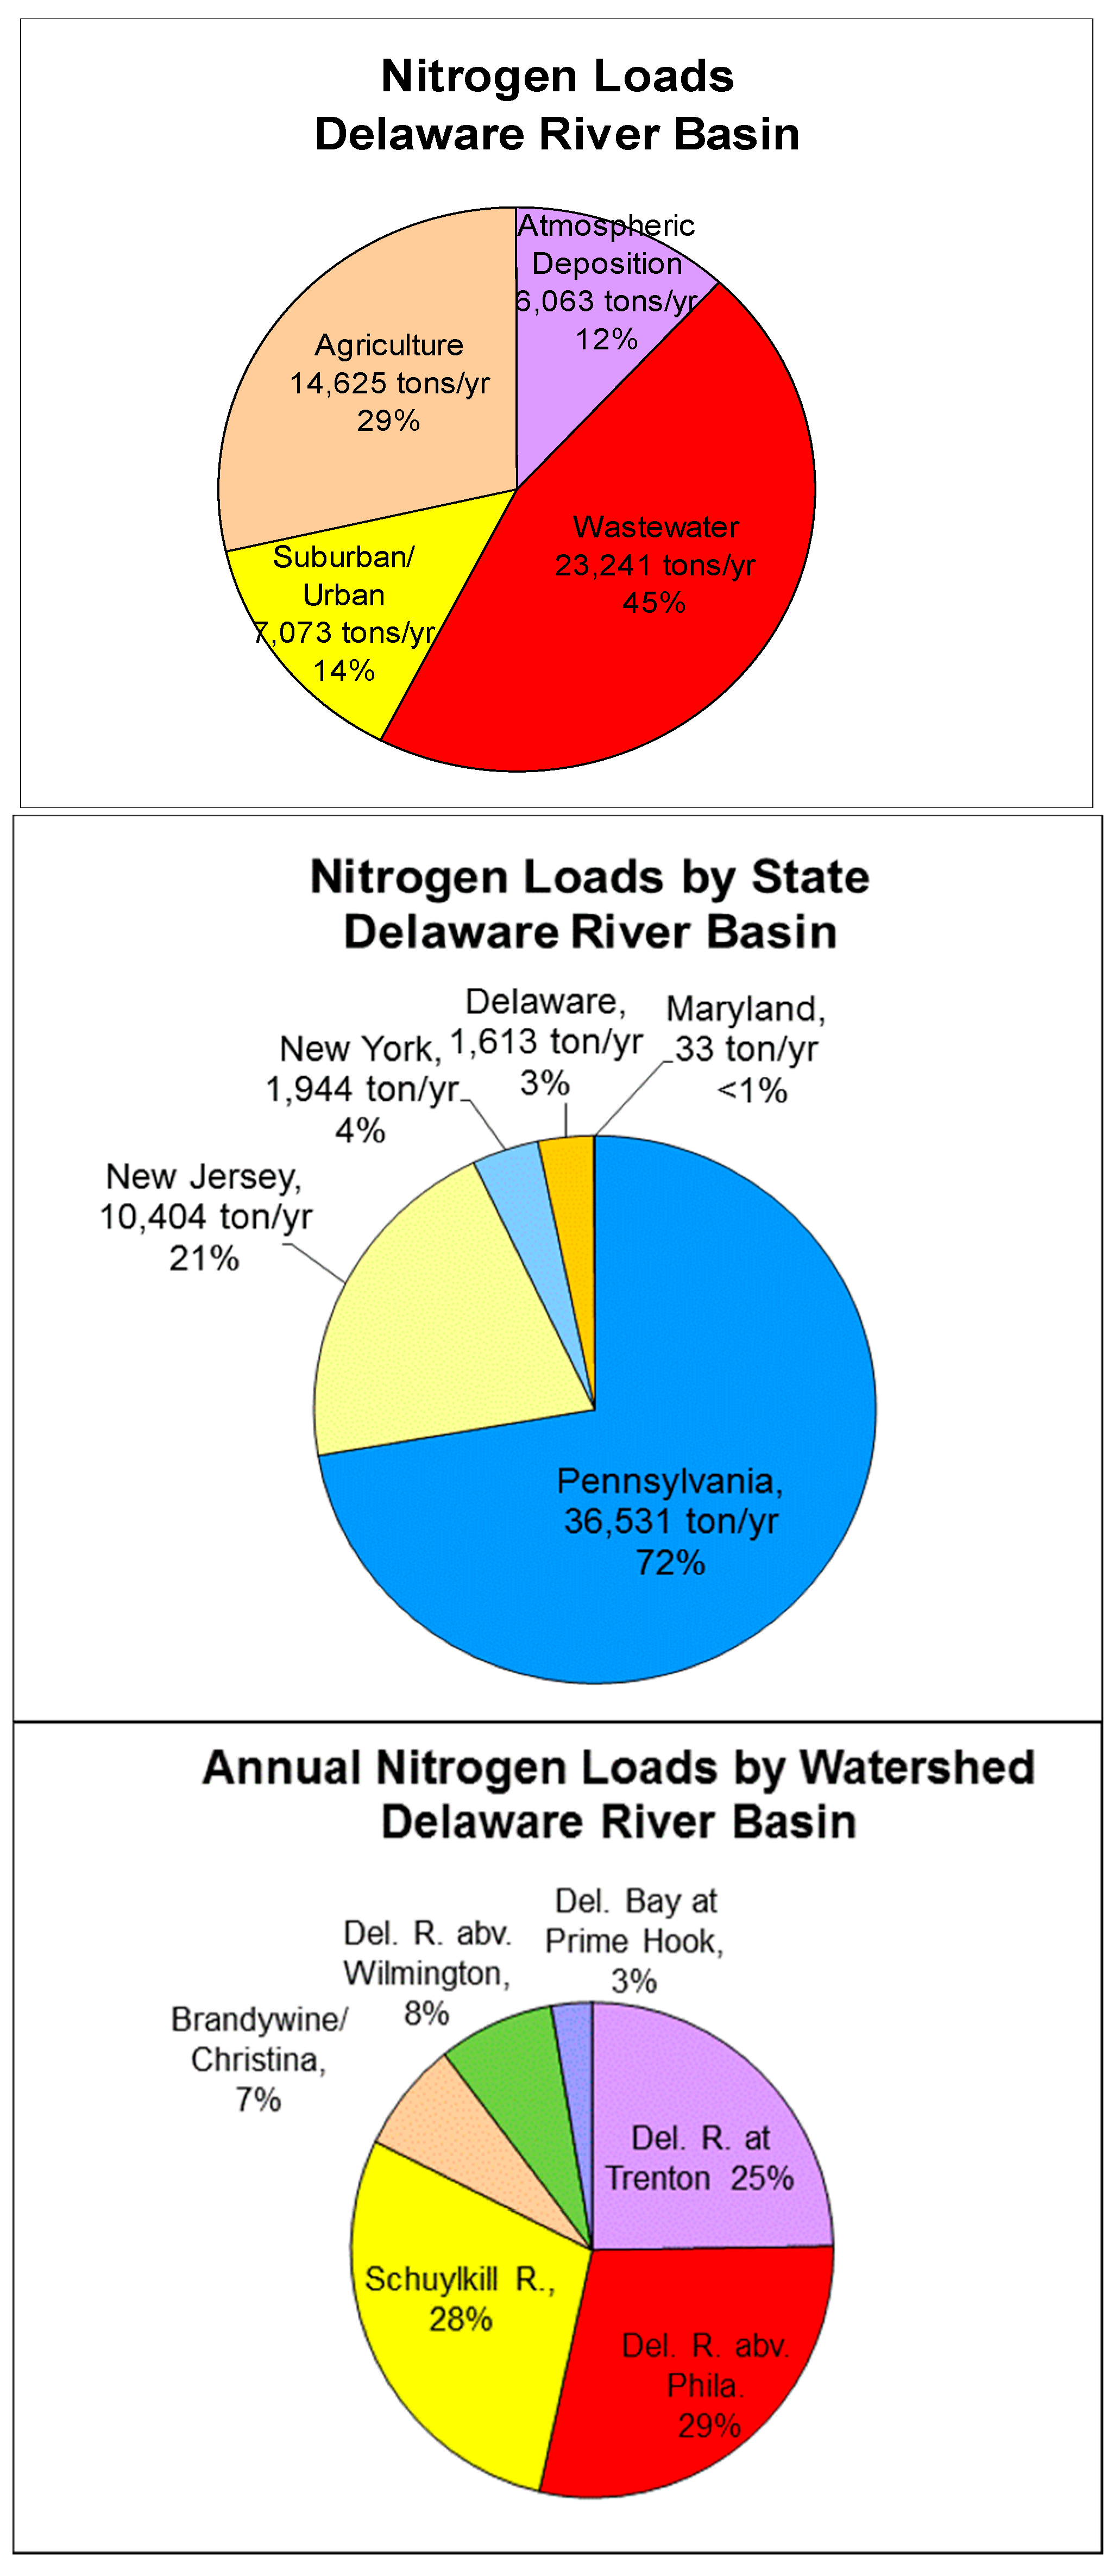
In the Delaware Basin, our analysis using the SPARROW model indicates that almost half (46%) of the nitrogen flows from wastewater discharges and a third (29%) emanates from agriculture fertilizer/manure runoff (
Figure 8). Urban/suburban stormwater from the cities and suburbs delivers just over 10% of the N load. The airshed of the Delaware River is 10 times larger than its watershed and atmospheric deposition from industries and vehicles contributes 12% of the nitrogen to the estuary. Together, Pennsylvania and New Jersey discharge over 90% of the nitrogen to the Delaware Basin with half from wastewater discharges and a quarter to a third from agriculture. New York and Delaware contribute 4% and 3% of the nitrogen, respectively.
From the USGS SPARROW model, we found that three watersheds—the Delaware River at Trenton, Schuylkill River, and above-Philadelphia tributaries—deliver 80% of the nitrogen load to the estuary. Above Trenton, the Lehigh River contributes 9% of the N load to the Delaware River. Below Philadelphia, the Brandywine-Christina, Delaware River above Wilmington, and Delaware Estuary at Prime Hook watersheds contribute 7%, 8%, and 3% of the N loads, respectively. Wastewater discharges are the predominant sources of N in the Delaware River above Philadelphia (82%), Schuylkill (46%), and above-Wilmington (68%) watersheds. Agriculture is the primary N source in the Delaware River at the Trenton (34%), Brandywine-Christina (77%), and Delaware Bay at Prime Hook (72%) watersheds and the second-highest N source in the Schuylkill watershed (35%).
We observed that nitrogen loads at USGS gages compare within 25–30% (±) of modeled loads from SPARROW [
51]. The observed annual N load at Delaware River at Trenton is 14.2 million kg (31.2 million lb) compared to 11.4 million kg (25.1 million lb) from SPARROW. Along the Schuylkill, the observed annual N load is 9.4 million kg (20.8 million lb) versus 13.1 million kg (28.9 million lb) from the SPARROW model. The variance may be due to the difference between loads modeled during the SPARROW base year of 2002 and the period of recording at each of the stream monitoring stations. Also, the observed data would include nitrogen loads delivered by groundwater to the streams and the SPARROW model may under-report groundwater sources of nitrogen. Given the variance of 25–30% (±) between the observed and modeled nitrogen loads in the Delaware River Basin, we expect the costs of pollutant load reduction programs in the watershed will vary by a similar amount.
Our synthesis of the literature [
5,
46,
47,
48,
49] reveals that nitrogen reduction costs vary from
$2.64–
$24.20/kg N (
$1.20–
$11.0
$/lb N) for agricultural conservation,
$18.83–
$174/kg N (
$8.56–
$79.00
$/lb N) for wastewater treatment,
$165–
$639/kg N (
$75.00–
$132.00
$/lb N) for airborne emissions controls, and
$198–
$1100/kg N (
$90.00–
$500.00
$/lb N) for urban/suburban stormwater retrofit BMPs (
Table 6). Wastewater treatment N load reduction costs vary from
$18.83–
$60.83/kg N (
$8.56–
$27.65
$/lb N) in the Chesapeake Bay watershed to
$38.06/kg N (
$17.30
$/lb N) in the Connecticut River Basin and
$139.00–
$174.00/kg N (
$63.00–
$79.00
$/lb N) in Maine and New Hampshire. Airborne deposition nitrogen load reduction costs in the Chesapeake Bay range from
$165/kg N (
$75.00/lb N) for Clean Air Act programs to
$639/kg N (
$132.00/lb N) for low-emission vehicle programs. Urban stormwater retrofitting is a more expensive option with costs that range from
$198–
$1100/kg N (
$90–
$500/lb N) reduced.
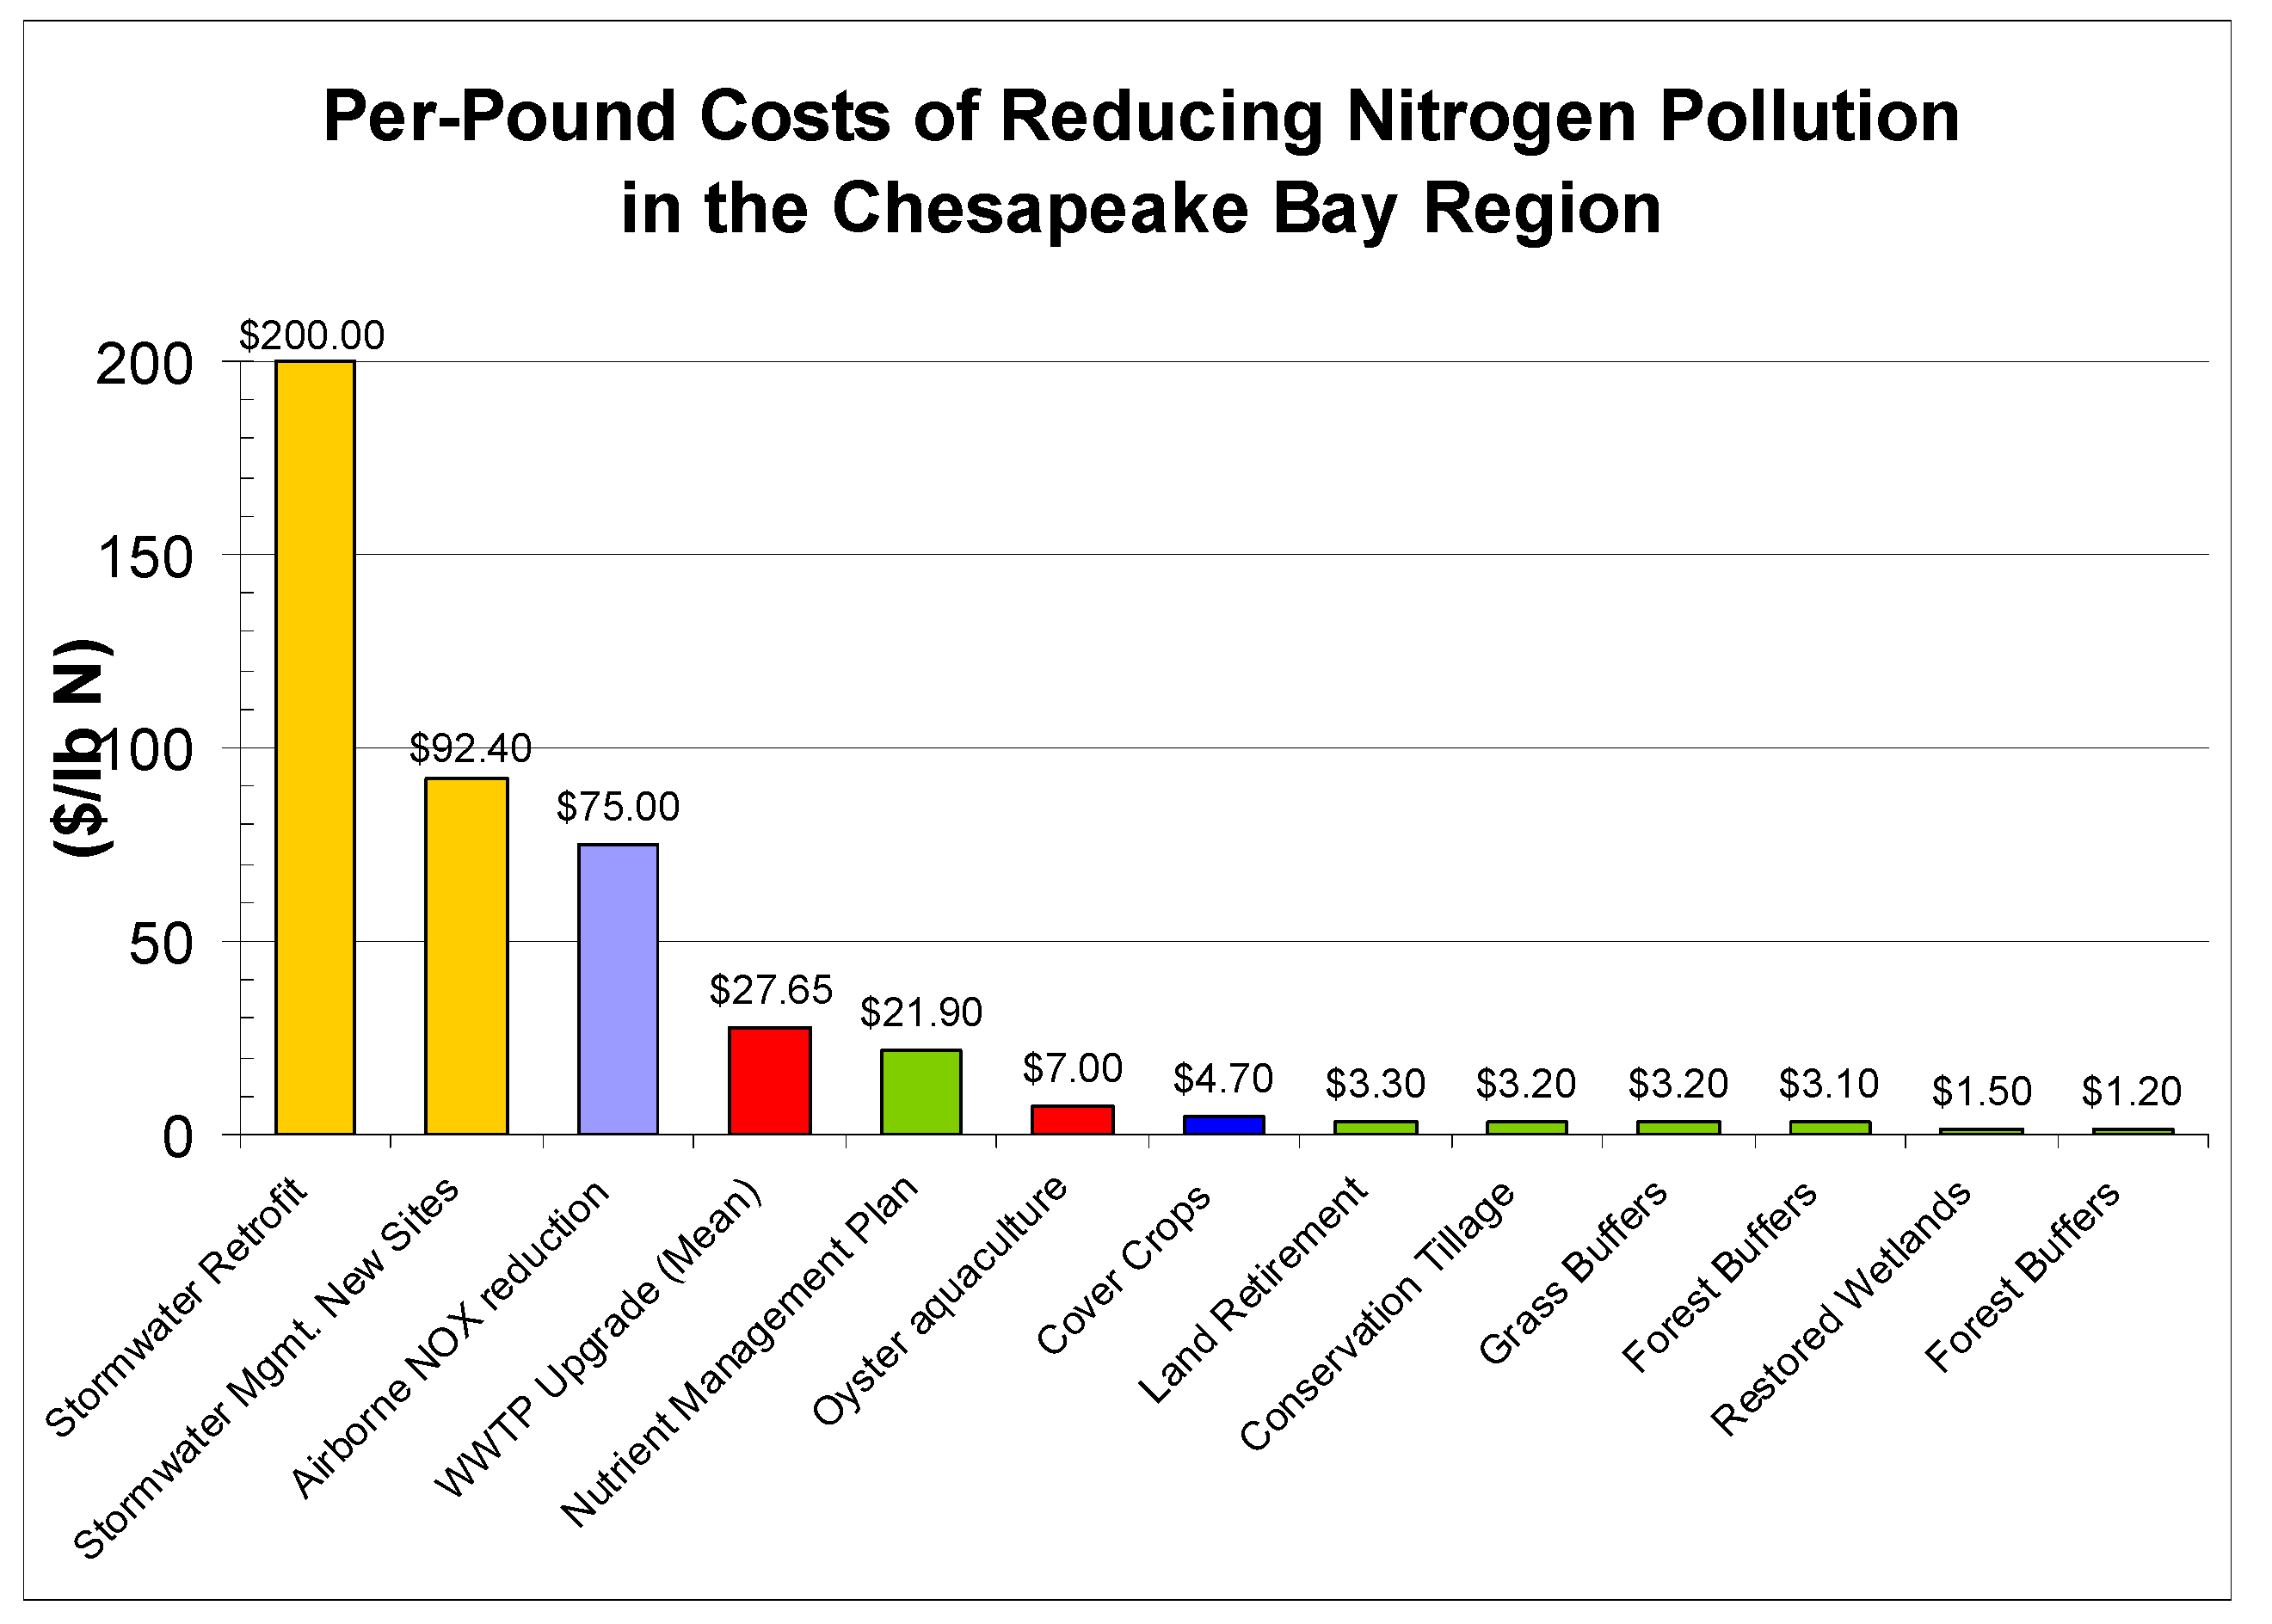
Our survey of the literature indicates that agricultural conservation practices reduce N loads by 40% for grass buffers to 90% for cover crops at unit costs that range from $2.64/kg N ($1.20/lb N) for forest buffers to $22.24/kg N ($10.11/lb N) for cover crops. Agricultural nutrient management plans reduce N by 20% at a cost of $4.41 $/lb N. No-till cropping can reduce N by 55% at a cost of $7.04/kg N ($3.20/lb N) reduced. Forest buffers remove 50% of N at $2.64 to $14.94/kg N ($1.20 to $6.79 $/lb N). Grass buffers remove 40% of N at $3.45 to $14.87/kg N ($1.57 to 6.76 $/lb N).
We calculated the costs to reduce nitrogen loads by 20% (25th percentile), 32% (median), and 48% (75th percentile) to meet a more stringent DRBC dissolved oxygen standard by multiplying N load reduction rates (kg/year) by the unit cost (
$/kg) (in 2010 dollars) for atmospheric NOX reduction
$165/kg (
$75.00/lb), wastewater treatment
$61.60/kg (
$28.00/lb), agriculture conservation
$11.00/kg (
$5.00/lb), and urban/suburban
$440/kg (
$200/lb) BMPs (
Figure 9).
Under Option 1, we estimate that nitrogen loads must be reduced by 14.7 million kg/year (32.3 million lb/year) to achieve 32% reductions applied equally to all sources (
Table 7). Under this uniform load reduction scenario, wastewater N loads are reduced by 6.8 million kg/year (14.9 million lb/year) followed by agriculture by 4.3 million kg/year (9.4 million lb/year), urban/suburban by 2.0 million kg/year (4.5 million lb/year), and atmospheric by 1.8 million kg/year (3.9 million lb/year). The cost to reduce N loads evenly by 32% for each source is
$1.66 billion/year with the largest costs borne by urban/suburban stormwater retrofitting (
$905 million/year) with the highest unit cost, followed by wastewater discharge (
$416 million/year), atmospheric NOX reduction (
$291 million/year), and agriculture conservation (
$47 million) with the lowest unit cost.
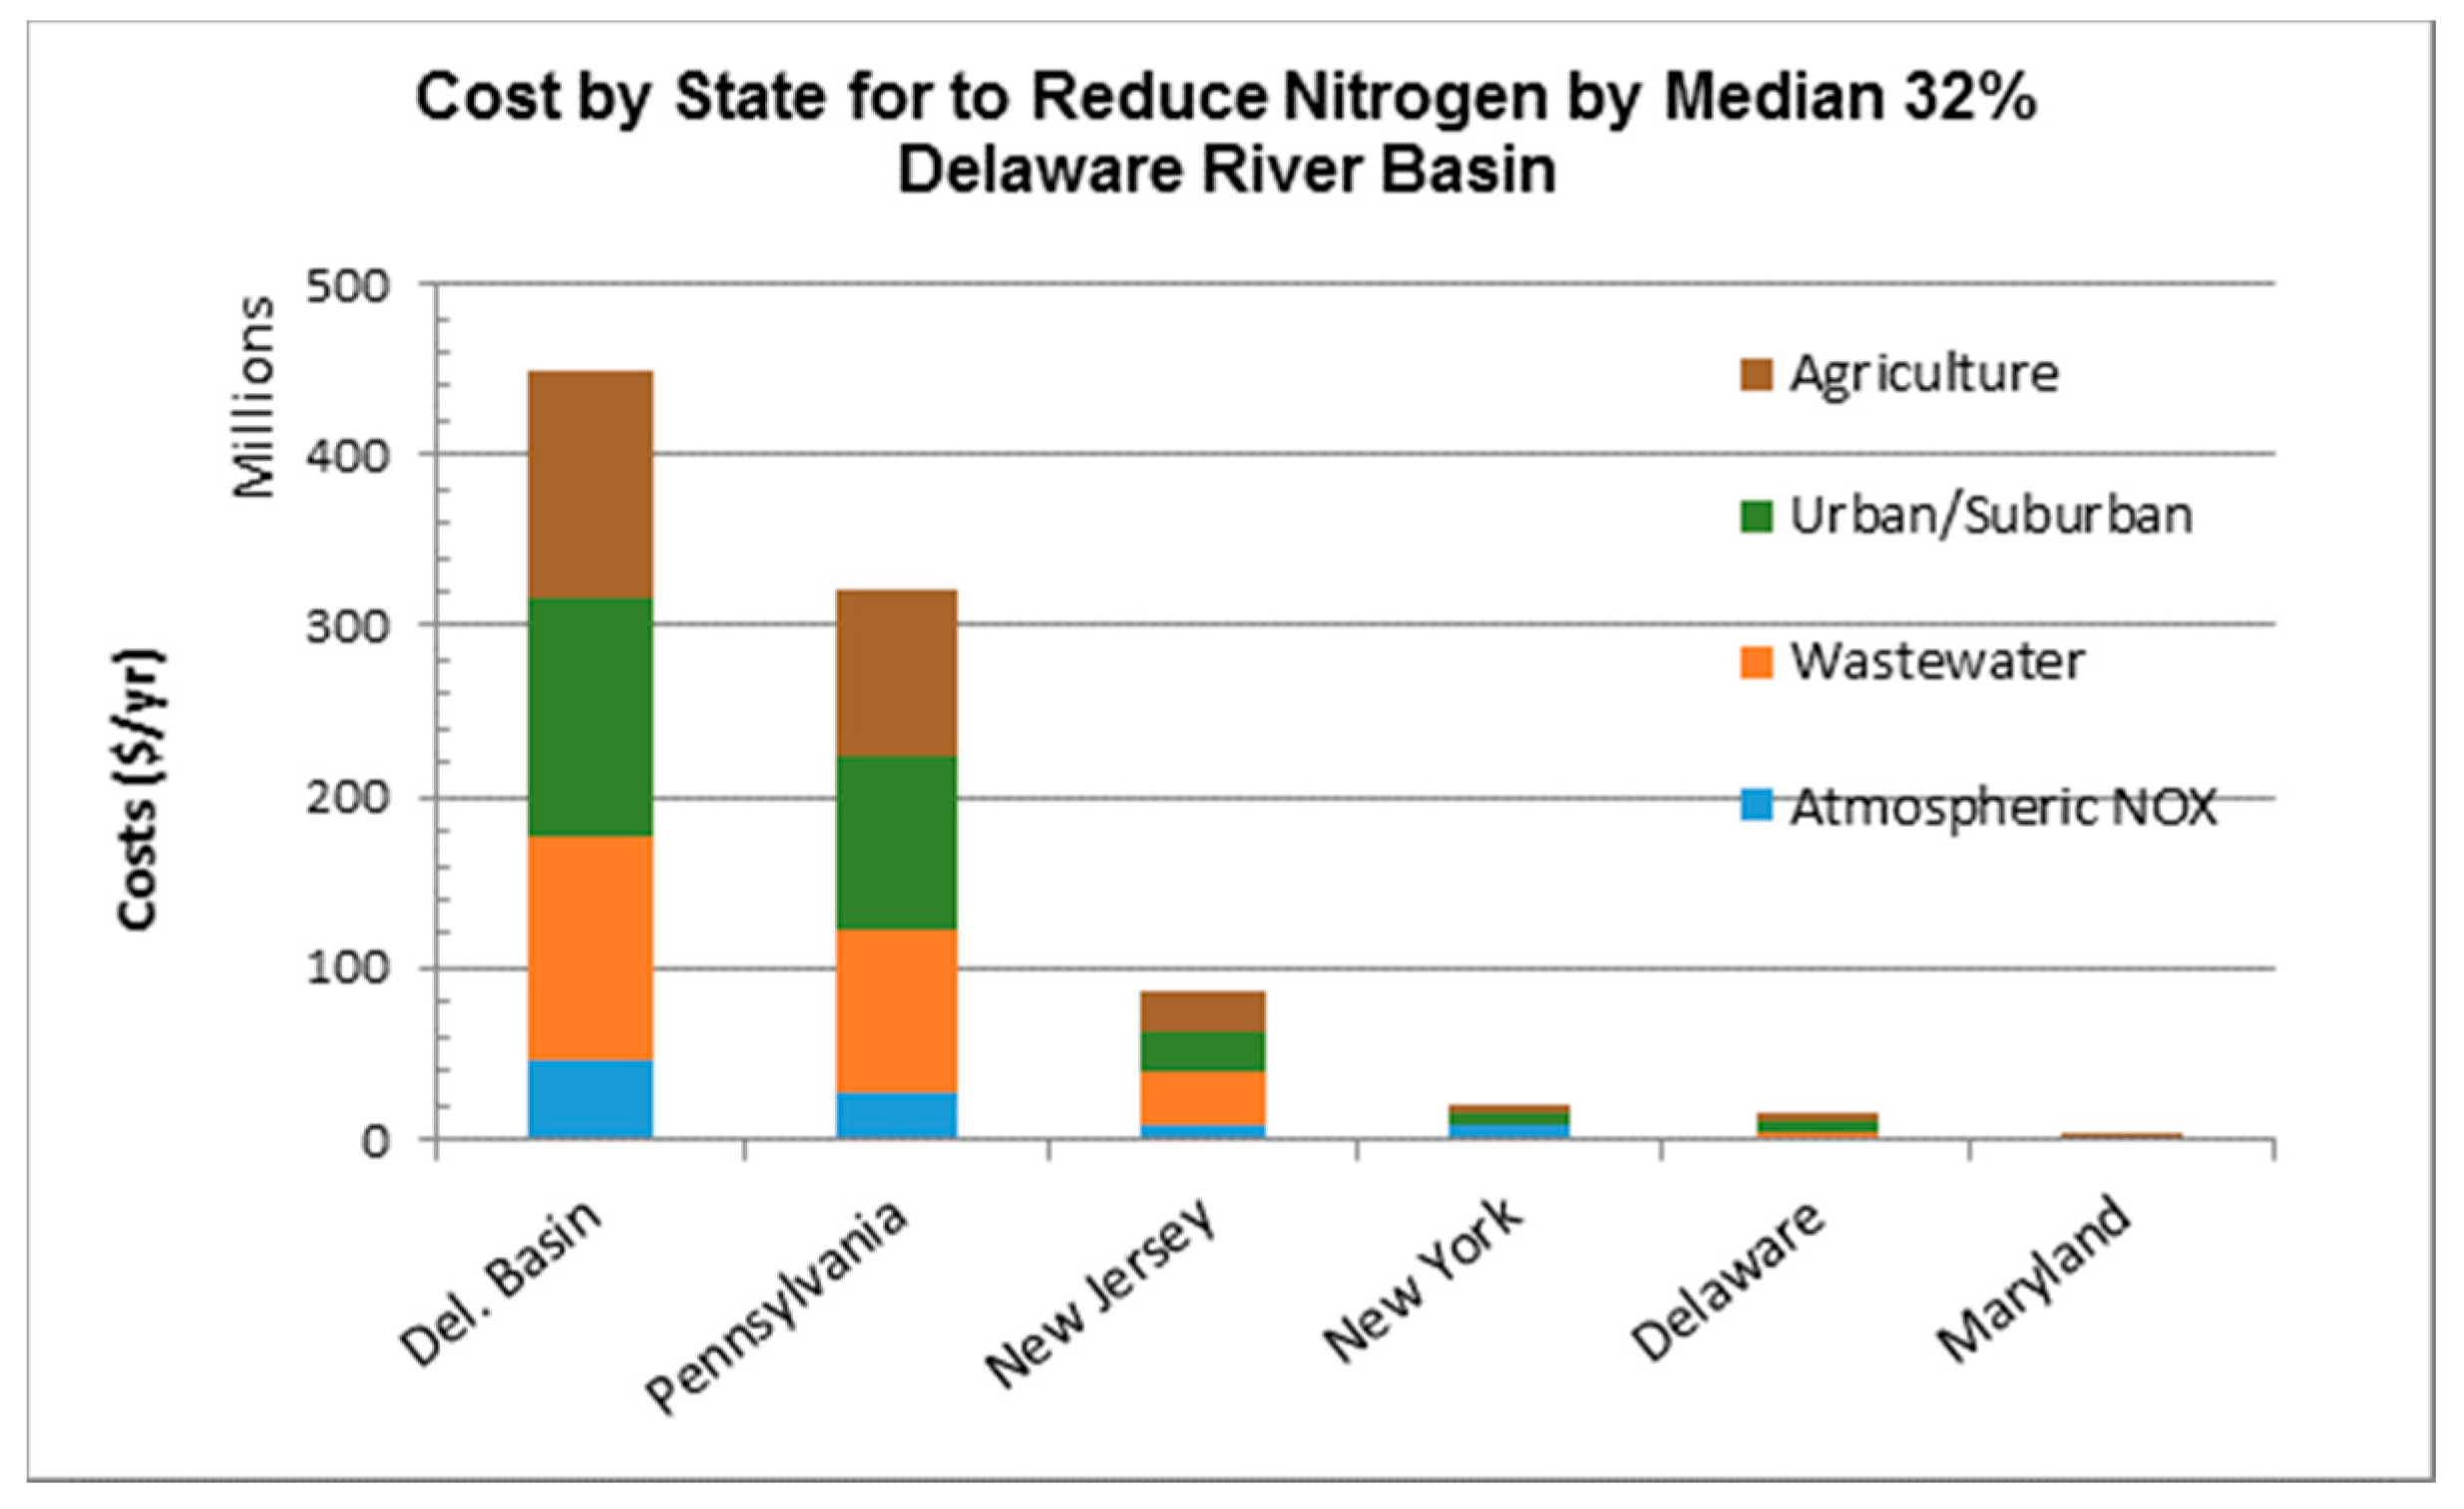
According to Option 1, to reduce N equally by 32% from all sources, we estimate that annual loads must be reduced by 10.6 million kg in Pennsylvania for $1.2 billion, 3.0 million kg in New Jersey for $317 million, 600,000 kg in New York for $95 million, 500,000 kg in Delaware for $60 million, and 11,000 kg in Maryland for $700,000.
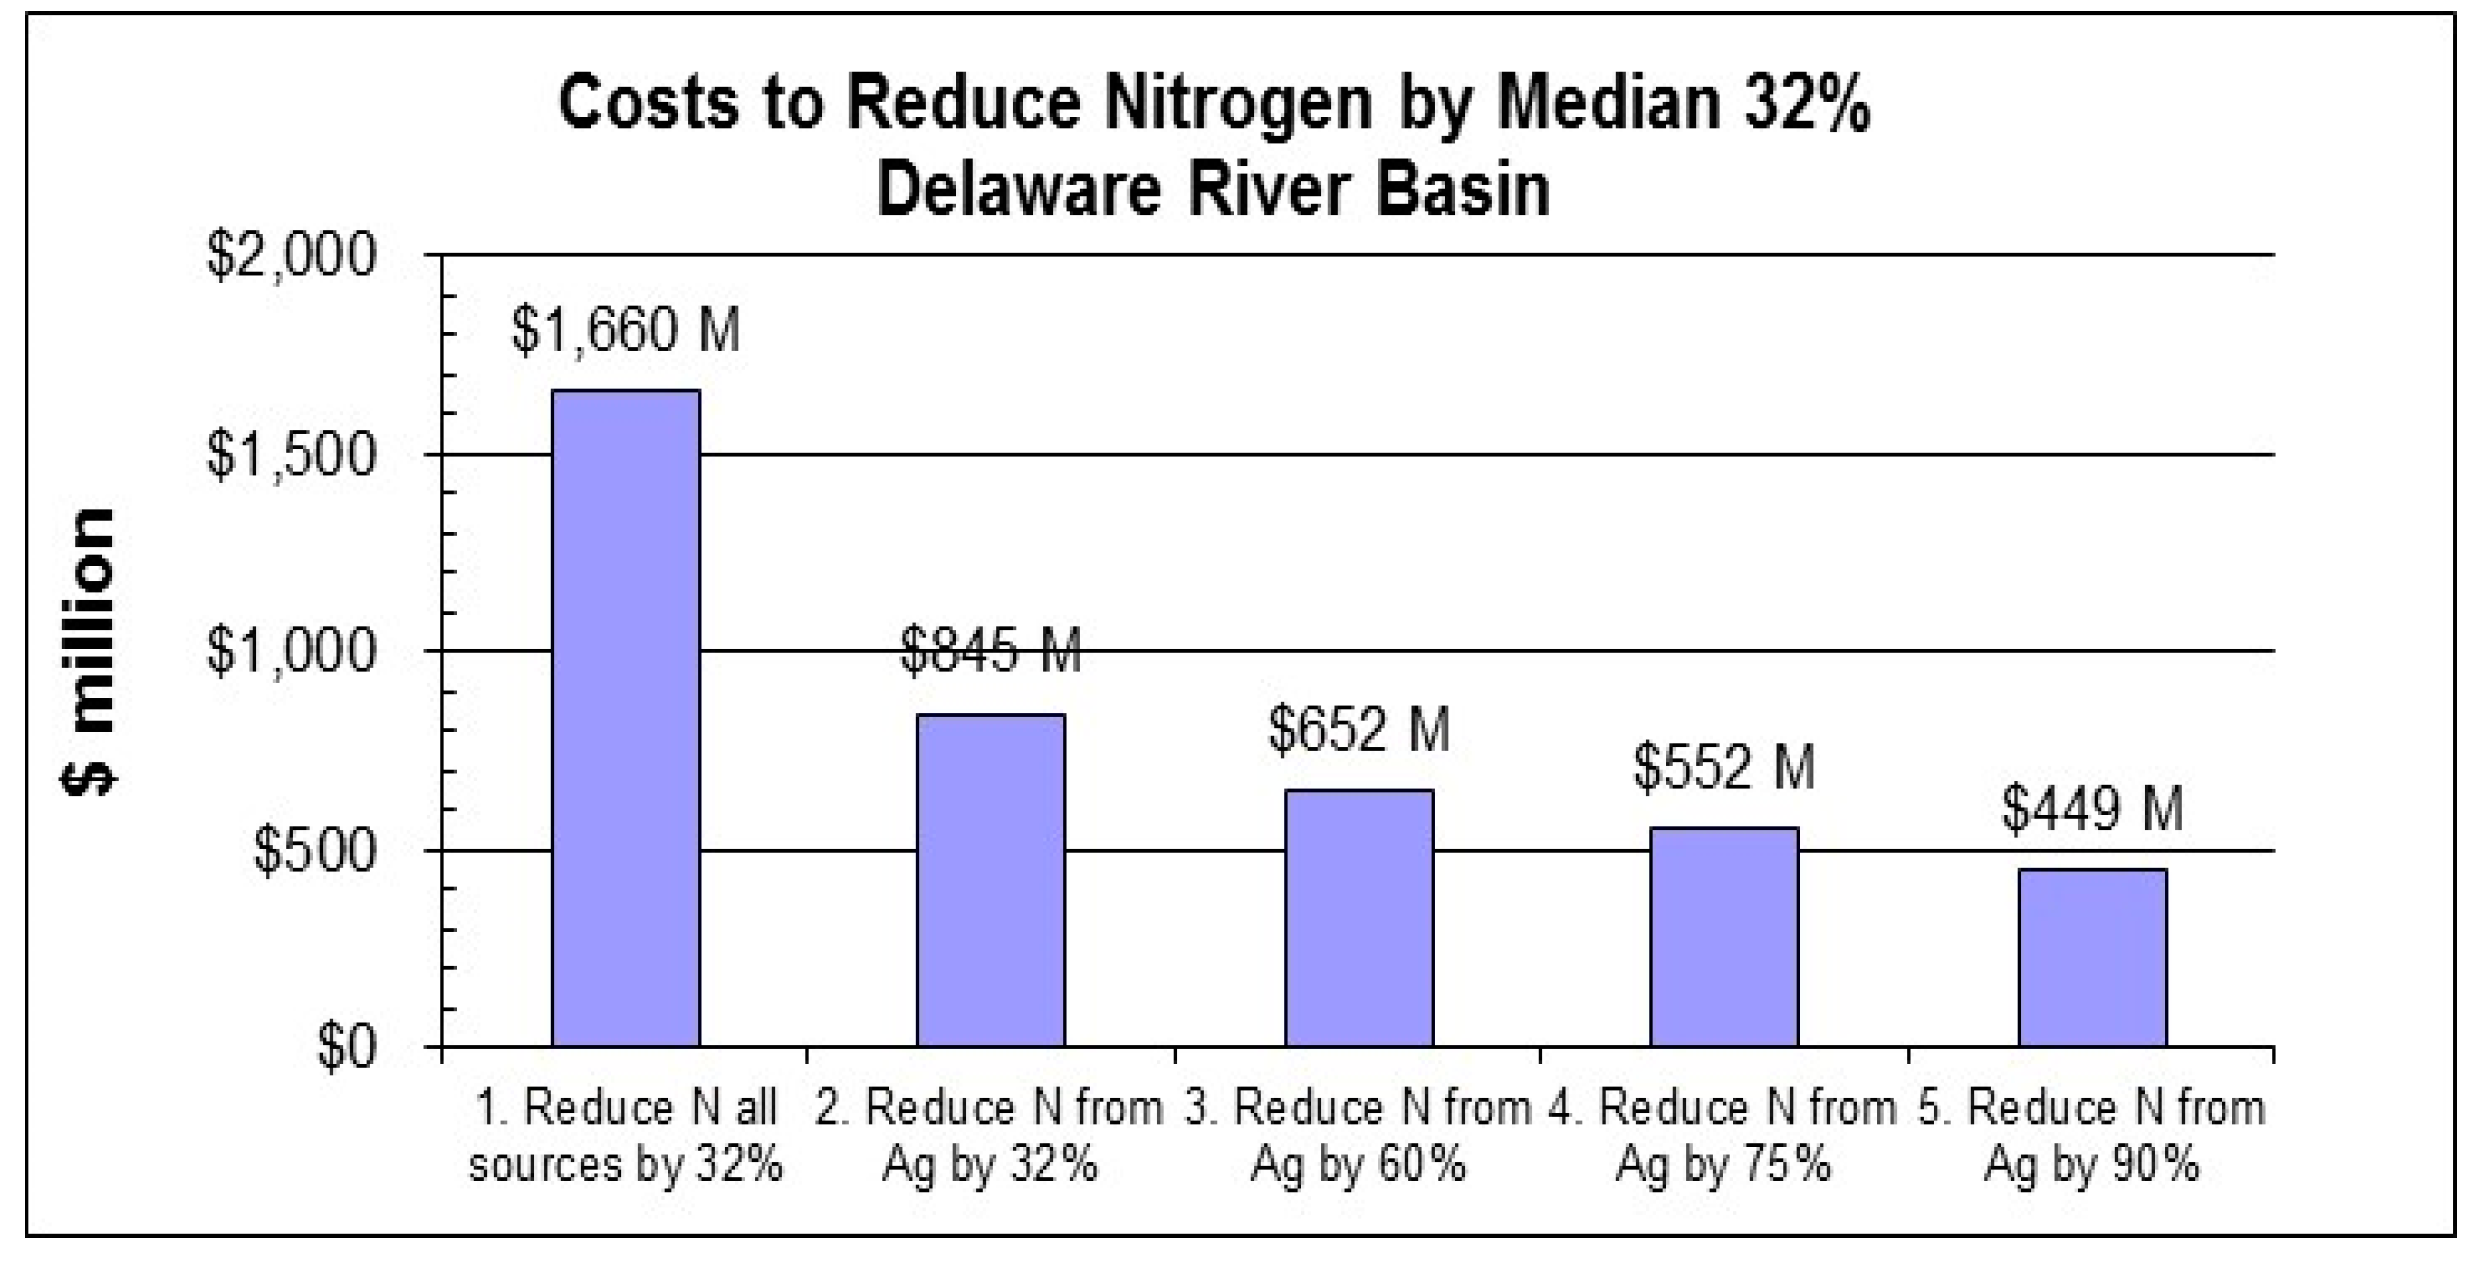
Our review of the TMDL models suggest that nitrogen loads should be reduced by a median 32% within a range of 20% (25th percentile) to 48% (75th percentile) to increase dissolved oxygen levels from the current DRBC criterion (3.5 mg/L) to meet a future standard (5.0 mg/L) in the Delaware River. By maximizing least cost agricultural and wastewater BMP options and minimizing higher cost airborne emissions and urban stormwater BMPs (
Figure 10), annual costs to reduce N loads by 32% in the Delaware Basin are cut from
$1.66 billion for Option 1 (reduce loads evenly for all sources) to
$845 million for Option 2 (reduce Ag N by 32%),
$652 million for Option 3 (reduce Ag N by 60%),
$552 million for Option 4 (reduce Ag N by 75%), and
$449 million for Option 5 (reduce Ag N by 90%).
We found that the least cost (Option 5) would reduce N loads by the median 32% or 14.5 million kg/year (32 million lb/year) by reducing atmospheric NOX by 5%, wastewater N by 10%, urban/suburban N by 5%, and agricultural N by 90%. Annual costs range from $334, $449, and $904 million to reduce N loads by 20% (25th percentile), 32% (median), and 48% (75th percentile), respectively.
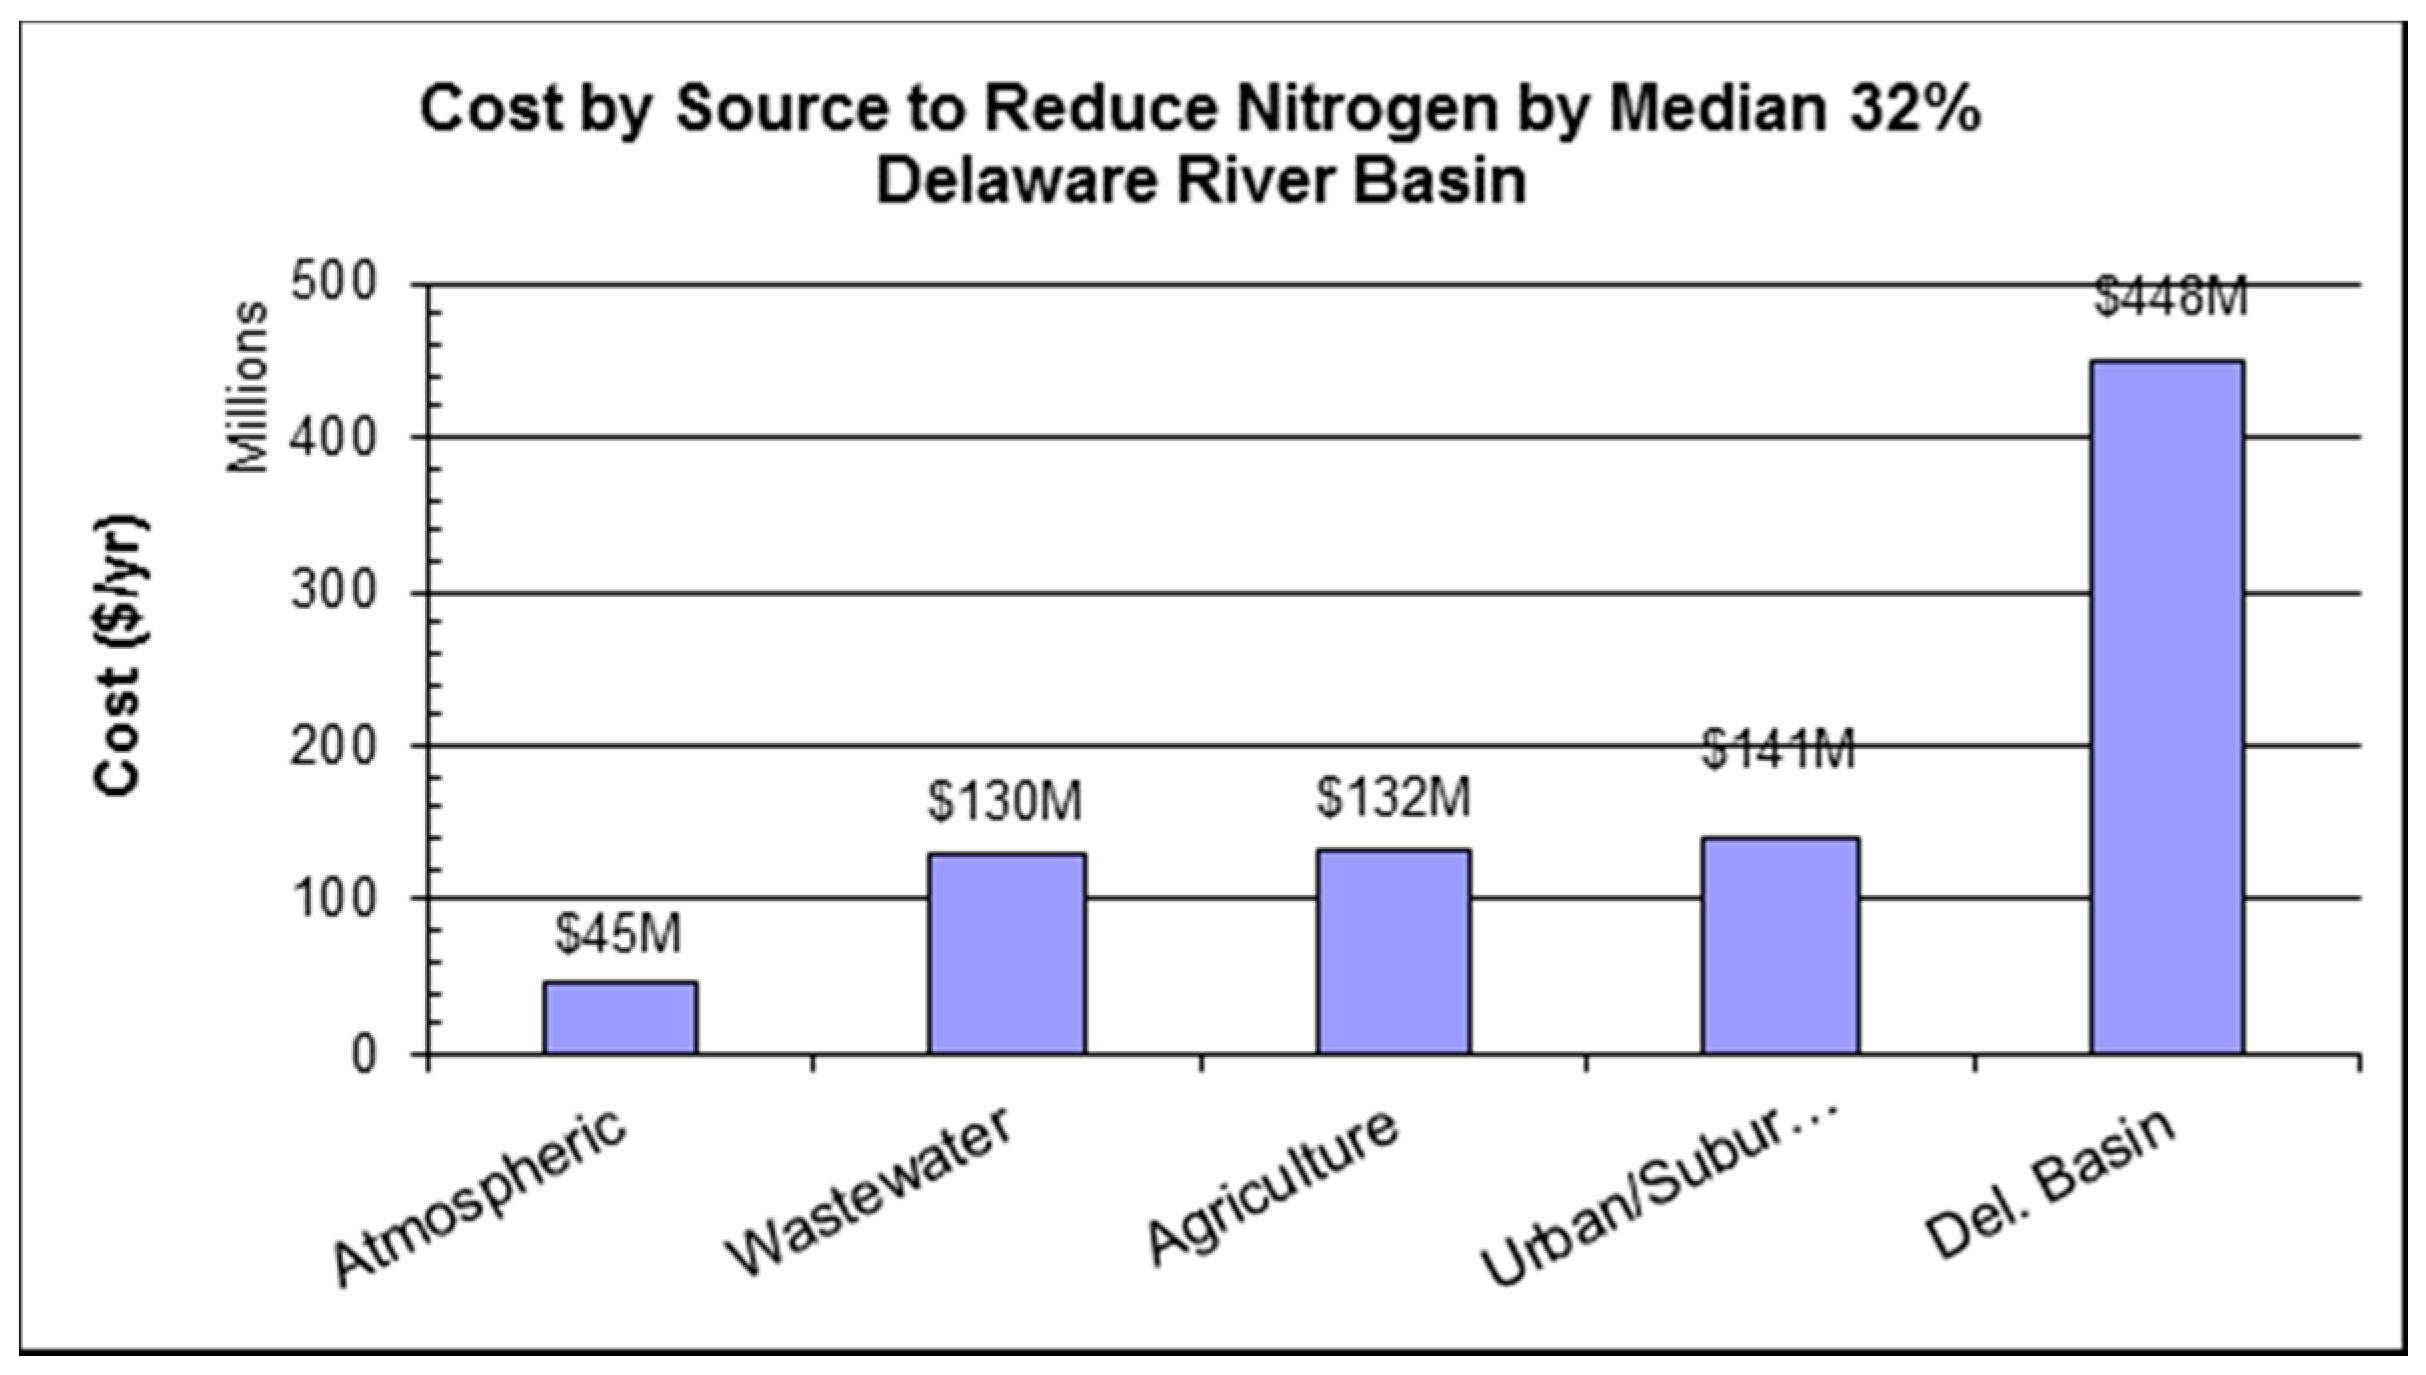
According to Option 5, we conclude that the annual least cost to reduce N loads by 32% in the Delaware Basin is
$449 million, including
$141 million for urban/suburban retrofitting,
$132 million for agriculture conservation,
$130 million for wastewater treatment, and
$45 million for atmospheric NOX reduction (
Figure 11). Covering half of the Basin, Pennsylvania’s annual share is
$322 million or 72% of the N load reduction cost (
Figure 12). New Jersey would bear
$87 million or 19% of the cost. New York State would contribute
$19 million or 4% of the N reduction cost. Delaware would assume
$16 million or 4% of the cost. Maryland’s share would be
$337,000.
On a watershed basis, we estimate that the Delaware River at Trenton contributes 25% of the nitrogen load, predominately from agricultural sources, for
$132 million or 30% of the total cost (
Figure 13 and
Table 8). The Schuylkill contributes 30% of the N load, mostly from wastewater and agricultural sources, at a cost of
$124 million or 28% of the total cost. The tributaries between Philadelphia and Trenton contribute 29% of the N load, mostly from wastewater, with a cost of
$104 million or 24% of the total. The Brandywine-Christina watershed, where over three-quarters of the nitrogen flows from agriculture, would cost
$37 million (8% of the N load reduction cost). The watersheds between Wilmington and Philadelphia would require
$32 million or 7% of the total cost to reduce mostly wastewater N loads. The Delaware Bay watershed between Prime Hook and Wilmington would cost
$13 million to reduce the mostly agricultural N loads from the Coastal Plain streams on either side of the bay.
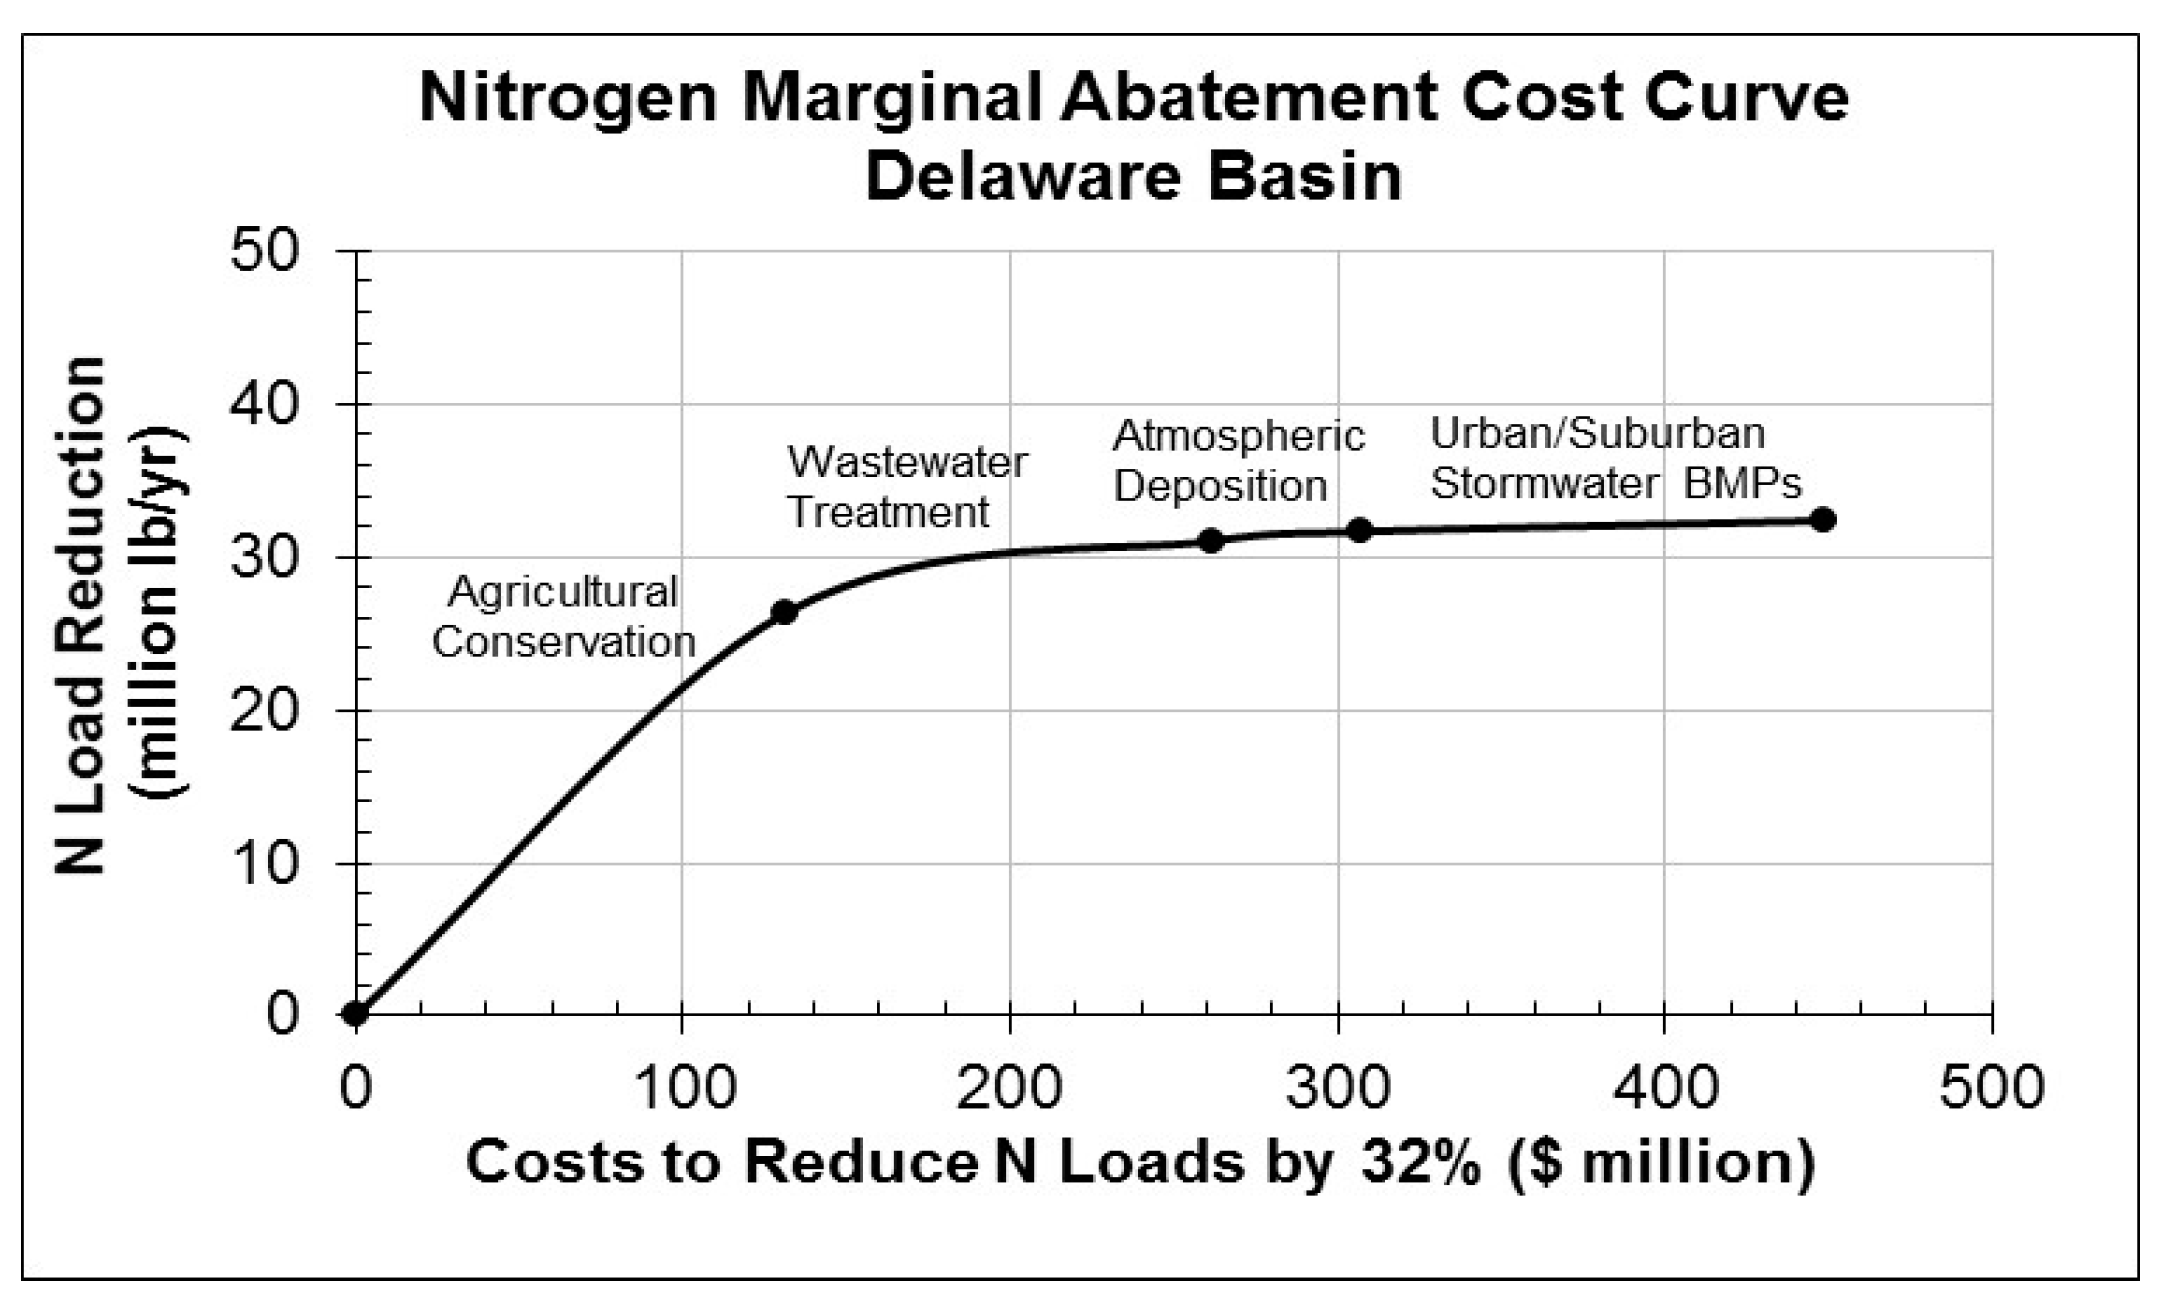
We constructed marginal abatement cost curves (
Figure 14 and
Figure 15) that illustrate the least costs to reduce nitrogen loads by the median 32% within a range of 20% (25th percentile) to 48% (75th percentile). The nitrogen MAC curve indicates that, by prioritizing investments in agriculture conservation and some wastewater treatment projects first, 90% of the nitrogen (13.6 million kg N/year) (30 million lb N/year) can be removed for just 35% (
$160 million) of the
$449 million total cost. The remaining 0.9 million kg N/year (2 million lb N/year) or 10% of the N load reduction will require 65% (
$290 million/year) of the total cost to implement the remaining wastewater treatment followed by more expensive atmospheric deposition, and urban/suburban projects. The marginal abatement cost (MAC) curves define the most cost-effective combination of nitrogen reduction strategies to improve dissolved oxygen to a future DRBC standard to provide year-round propagation of anadromous fish. The least cost agriculture and wastewater treatment reductions would be implemented first in priority watersheds, followed by higher cost atmospheric deposition and urban suburban runoff controls. After the less costly agricultural and wastewater BMPs are implemented, nitrogen reduction in the Delaware Basin becomes incrementally less cost-effective after 30% N reduction as the slope of the cost curve flattens. Increasingly higher investments in costly atmospheric and urban/suburban controls provide a diminishing rate of return in terms of pollutant removal efficiency per dollar spent.
We compared the 1966 Delaware River economic valuation study to our 2017 modern study. Adjusting to 2010 dollars and starting from a base dissolved oxygen level of 3 mg/L, our review of the 1966 Delaware Estuary economic study indicates that the annual costs to improve water quality ranged from
$58–
$87 million to achieve summer dissolved oxygen of 4.0 mg/L to
$180–
$209 million to reach 4.5 mg/L (
Table 9). These estimates from the 50-year old economic study compare with our 21st century least cost (Option 5), which indicates that annual costs of
$50 million would need to be invested to reduce pollutant loads to improve dissolved oxygen levels to 4.0 mg/L,
$150 million would be needed to reach a dissolved oxygen level of 4.5 mg/L, and
$449 million would be needed to reach a dissolved oxygen level of 5.0 mg/L in the Delaware River.
While the costs of the 1966 study and our 2017 economic study compare favorably, the methods and approaches differ. The 1966 economic study explored only the costs of point source load reductions (wastewater treatment plant upgrades) of nitrogen whereas our 2017 analysis estimated the costs of point sources such as wastewater treatment plants and nonpoint sources (airborne deposition, stormwater, and agriculture) sources of nitrogen. Also, the 1966 study estimated costs of nitrogen load reduction starting from a baseline of very poor water quality (dissolved oxygen levels at or near zero) and the 2017 study estimates costs of load reduction starting at a baseline of moderate water quality (dissolved oxygen level at 3.5 mg/L) in the Delaware River.
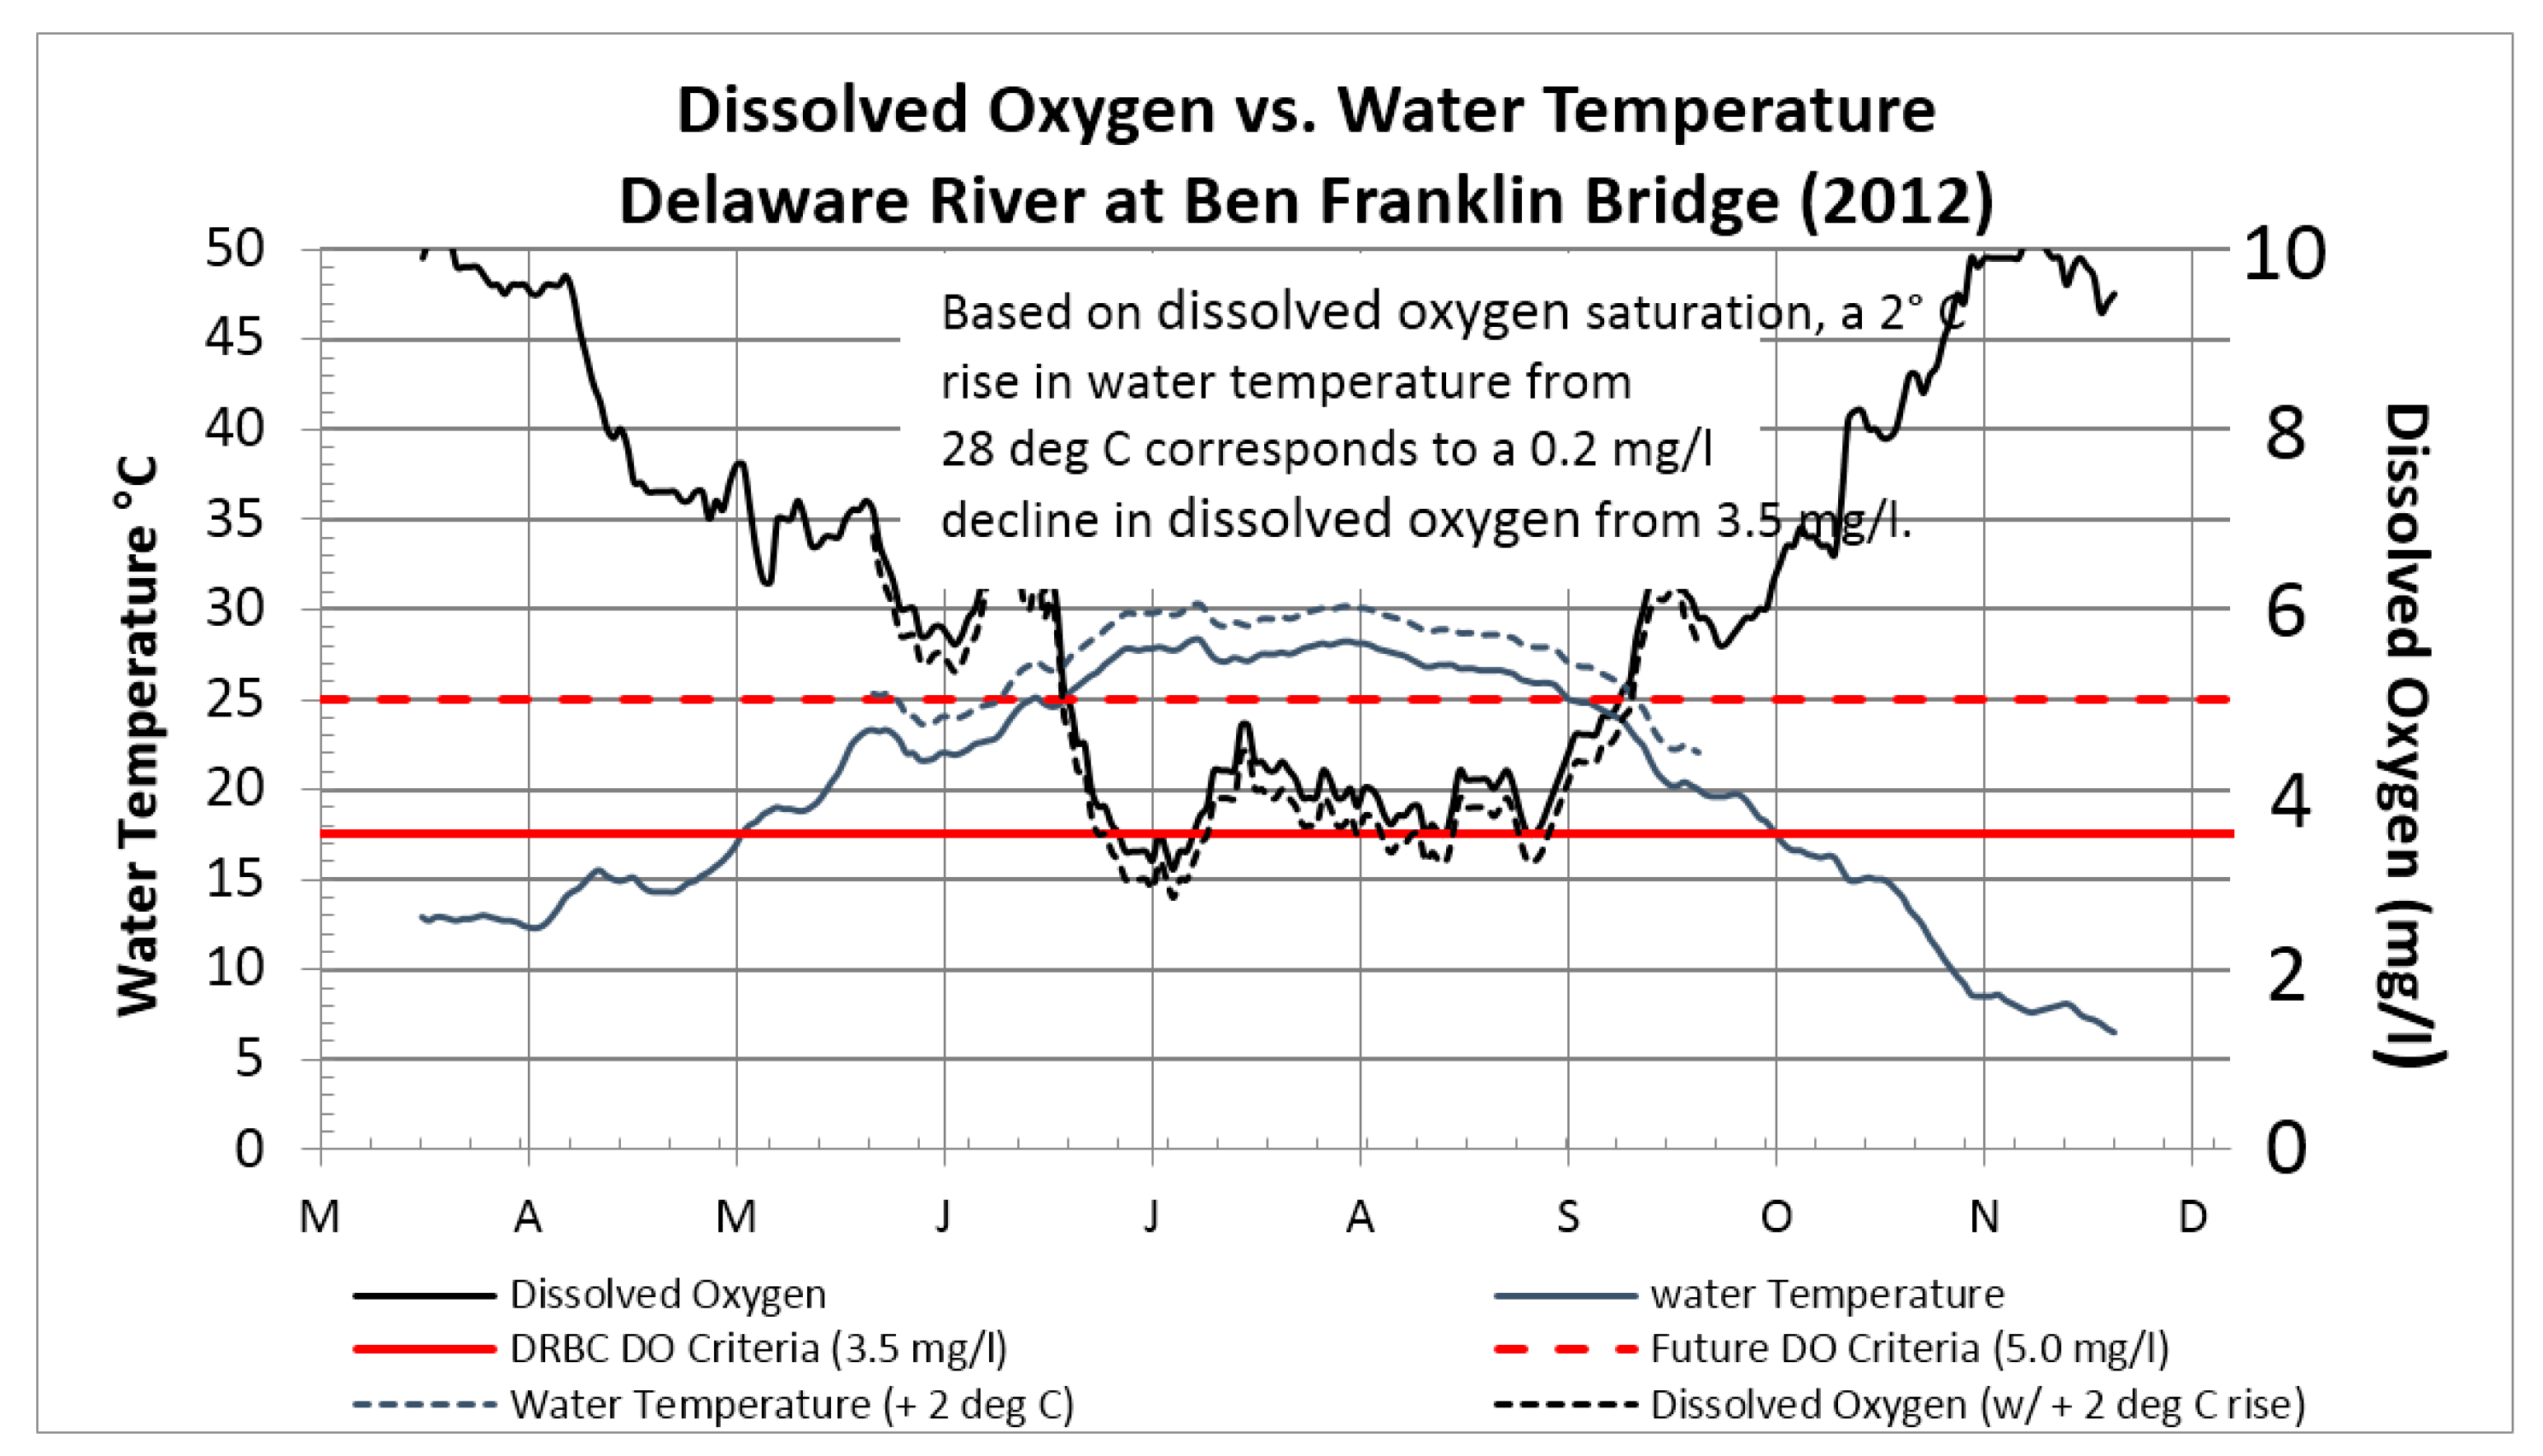
We point out an important consideration concerning the inverse relationship between dissolved oxygen saturation and water temperature in the Delaware River (
Figure 16). The costs of achieving improved water quality in the Delaware River to meet more stringent dissolved oxygen criteria are based on conditions where water temperatures peak near 30 °C (86 °F), usually in July and August. At 30 °C, freshwater dissolved oxygen 100% saturation is 7.54 mg/L and dissolved oxygen is 46% saturated at 3.5 mg/L, 53% saturated at 4.0 mg/L, 66% saturated at 5.0 mg/L, and 80% saturated at 6.0 mg/L. Should water temperatures in the tidal Delaware River increase by 2 °C to peak summer levels of 30 °C, based on saturation, dissolved oxygen levels will decline by about 0.2 mg/L without any decrease in nutrient loading. More research is needed utilizing a new hydrodynamic model to be developed by the DRBC that would explore the influence of water temperature and salinity on dissolved oxygen in the Delaware Estuary.
Based on the delivery fraction of nitrogen (i.e., fraction of nitrogen load delivered to the outlet), implementation of BMPs in watersheds closest to the Delaware Estuary would provide the most immediate improvements in water quality. The SPARROW model indicates that the delivered yield of nitrogen from watersheds far from the estuary, such as headwaters of the Delaware River in New York State and upper Lehigh and Schuylkill basins, are less likely to influence dissolved oxygen levels in the Delaware Estuary. Nitrogen reduction practices should be cost-effectively invested in watersheds that deliver the highest yield of nitrogen and are close to the estuary.
Groundwater can contribute significant nitrogen and phosphorus loads to surface waters. For instance, half of the nonpoint source N load to the Chesapeake Bay flows through groundwater and the other half flows to the bay via surface runoff [
52]. Depending on soil permeability, it could take years for nutrients such as N and P in groundwater to reach the Delaware Estuary from source waters [
53]. The implementation of nitrogen source controls for airborne emissions and wastewater treatment would have an immediate effect in improving water quality in the Delaware River, whereas urban, suburban, and agriculture BMPS could take months to years to make an impact on water quality, depending on soils and the physiographic province. The SPARROW model does not account for direct contributions of nitrogen from groundwater; therefore, it is likely that nitrogen loads to the tidal Delaware River are underestimated in this analysis. Additional modeling—particularly geographically resolved hydrodynamic modeling, with explicit inclusion of groundwater transport—is needed to address this quantitatively.
6. Conclusions
The Delaware River and its tributaries have made a notable recovery in the half-century since JFK signed the DRBC Compact in 1961, Richard Nixon formed the EPA in 1970, and Congress passed the Federal Clean Water Act Amendments during the 1970s. A first-of-its-kind 1966 benefit–cost analysis conducted by the Federal Water Pollution Control Administration (FWPCA) concluded that it would be cost-effective for the DRBC to fund a multi-million-dollar per year waste load abatement program to raise dissolved oxygen levels to boatable and fishable standards that would, in turn, generate economic activity.
In 1967, the DRBC used this benefit–cost analysis to set dissolved oxygen criterion at 3.5 mg/L along the river from Philadelphia to Wilmington, where this water quality standard has stood for over four decades. The FWPCA and DRBC were indeed prescient, as multi-billion-dollar investments in Delaware River water pollution control programs have boosted the water quality, as measured by dissolved oxygen—from anoxia during the 1960s, to levels that meet the DRBC criterion of 3.5 mg/L most of the year (except during the increasingly hot summers).
While the water quality in the Delaware River has recovered over the last half-century, the Partnership for the Delaware Estuary Science and Technical Advisory Committee (PDE STAC) has called for raising the dissolved oxygen standard from 3.5 mg/L, which has stood since the 1960s, to a higher level of protection. A more rigorous standard of at least 5 mg/L or 6 mg/L would provide for more year-round protection of anadromous fish, such as the recovering American shad and the nearly extirpated Atlantic sturgeon (just placed on the Federal Endangered Species List). A more rigorous dissolved oxygen standard would also provide protection against atmospheric warming that is projected to increase water temperatures, raise sea levels, and elevate chloride levels, all of which act in combination to reduce dissolved oxygen saturation.
By maximizing least cost agricultural and wastewater BMPs and minimizing higher cost airborne emissions and urban stormwater retrofitting BMPs, we estimate that the annual costs to reduce nitrogen loads by 32% in the Delaware Basin are reduced by more than 300%, from $1.66 billion for Option 1 (reduce N equally from all sources by 32%) to $449 million for Option 5 (reduce Agriculture N by 90%). Our interpretation of the nitrogen marginal abatement cost (MAC) curves shows it to be more cost-effective to prioritize upstream investments in agricultural conservation and wastewater treatment, as these controls have lower unit nitrogen reduction costs that are up to an order of magnitude less than the more expensive airborne emission source control and urban/suburban best management practices.
This research concludes, through a marginal abatement cost (MAC) analysis, that it would be cost-effective to raise dissolved oxygen levels to meet a more stringent standard by prioritizing agricultural conservation and some wastewater treatment investments in the Delaware River watershed to remove 90% of the nitrogen load by 13.6 million kg N/year (30 million lb N/year) for just 35% ($160 million) of the $449 million total cost. We estimate that the annual costs to reduce nitrogen loads and increase dissolved oxygen to meet a more stringent standard in the Delaware River include $45 million for atmospheric NOX reduction, $130 million for wastewater treatment, $132 million for agriculture conservation, and $141 million for urban stormwater retrofitting.
In 2010 dollars, the annual costs from the 1966 Delaware Estuary economic study range from $58–$87 million to achieve summer dissolved oxygen of 4.0 mg/L to $180–$209 million to reach dissolved oxygen of 4.5 mg/L. Estimates from this 50-year-old economic study compare with our 21st century least cost analysis (Option 5), which estimates that an annual investment of $50 million is needed to reduce nutrient loads and increase dissolved oxygen levels to 4.0 mg/L, $150 million is needed for dissolved oxygen to reach 4.5 mg/L, and $449 million is needed for dissolved oxygen to reach 5.0 mg/L in the Delaware River.
This economic cost analysis of the pollutant load reductions needed to improve water quality in the Delaware River is influenced by (1) the inverse relationship between water temperature and dissolved oxygen; (2) the delivery fraction of nitrogen; and (3) the groundwater time of travel. Since dissolved oxygen (DO) saturation and water temperature is inversely related, rising water temperatures in the Delaware River to near 30 °C (86 °F) during summer may depress dissolved oxygen levels without any decrease in nutrient loading, thus offsetting future pollution load reduction efforts. Based on the delivery fraction of nitrogen (i.e., fraction of nitrogen load delivered to the outlet), nitrogen reduction practices should be cost-effectively invested in watersheds close to the estuary that deliver the highest yield of nitrogen. Depending on soil permeability, long groundwater time of travel may occur; therefore, the effects of urban/suburban stormwater and agriculture nitrogen load reduction BMPs in source water many miles from the Delaware River may take months to years to have a positive impact on water quality.


