Freshwater Ecosystem Services in Mining Regions: Modelling Options for Policy Development Support


1
Department of Animal Sciences and Aquatic Ecology, Ghent University, Coupure Links 653, 9000 Ghent, Belgium
2
Department of Earth and Environmental Sciences, KU Leuven, Celestjnenlaan 200E, 3001 Leuven, Belgium
*
Author to whom correspondence should be addressed.
Water 2018, 10(4), 531; https://doi.org/10.3390/w10040531
Submission received: 14 March 2018
/
Revised: 18 April 2018
/
Accepted: 20 April 2018
/
Published: 23 April 2018
(This article belongs to the Special Issue Advances in Ecological Water System Modeling: Integration and Leanification as a Basis for Application in Environmental Management)
Abstract
:The ecosystem services (ES) approach offers an integrated perspective of social-ecological systems, suitable for holistic assessments of mining impacts. Yet for ES models to be policy-relevant, methodological consensus in mining contexts is needed. We review articles assessing ES in mining areas focusing on freshwater components and policy support potential. Twenty-six articles were analysed concerning (i) methodological complexity (data types, number of parameters, processes and ecosystem–human integration level) and (ii) potential applicability for policy development (communication of uncertainties, scenario simulation, stakeholder participation and management recommendations). Articles illustrate mining impacts on ES through valuation exercises mostly. However, the lack of ground- and surface-water measurements, as well as insufficient representation of the connectivity among soil, water and humans, leave room for improvements. Inclusion of mining-specific environmental stressors models, increasing resolution of topographies, determination of baseline ES patterns and inclusion of multi-stakeholder perspectives are advantageous for policy support. We argue that achieving more holistic assessments exhorts practitioners to aim for high social-ecological connectivity using mechanistic models where possible and using inductive methods only where necessary. Due to data constraints, cause–effect networks might be the most feasible and best solution. Thus, a policy-oriented framework is proposed, in which data science is directed to environmental modelling for analysis of mining impacts on water ES.
1. Introduction
Unsustainable patterns of anthropogenic water use are a major concern due to increasing population growth and demand for goods and services [1,2,3]. The allocation of natural resources for extractive purposes, like metallic, non-metallic or energy mineral mining, results in considerable shifts in the benefit flow from ecosystems to humans. The requirements of large quantities of freshwater resources and surfaces for inland mineral mining results in a considerable threat to biota [4,5,6,7]. Also, freshwater production processes can be damaged, since most of the richest ore deposits are found in mountains of upmost hydrological importance, as headwaters or for aquifer recharge and water table level maintenance [4,8]. Mining impacts on water quality are also demonstrated. Turbidity, toxicity (e.g., mercury, cyanide, heavy metals, arsenic), eutrophication, pH destabilization, aquatic community disturbance and riparian habitat fragmentation are commonly reported mining impacts on freshwater habitats [4,9,10,11]. Despite the high environmental risk, mining activities sustain a substantial part of many countries’ economies. Considering that metal demand cannot be met by global recycling rates [12,13], the mining industry is urged to align mineral exploitation with sustainable development [14].
Official tools, like environmental impact assessments (EIA), are used to determine if a mining project complies with socio-environmental soundness or not [5,15]. Despite EIA’s key role in supporting decision-making in mining contexts, deficient assessments can arise from incomplete scoping of local needs, concealment of unsustainable mining practices [16,17] and feeble environmental policies towards mining [18,19]. Sustainable management of water resources requires an accurate deliberation of social-ecological impacts from mining, with the help of all the concerned stakeholders [3,5,20]. As suggested by the Millennium Ecosystem Assessment [1], the inclusion of ecosystem services (ES) is crucial to address natural resource management with a more realistic and dynamic view of the human–ecosystem interaction. ES are direct and indirect benefits that humans receive from natural processes, highlighting our dependence on the health of ecosystems [21,22,23]. In fact, including ES assessment (ESA) in EIA [24] has shown to provide better stakeholder interaction for impact deliberation [25,26], greater focus on rural development and local livelihoods [27,28], and more restoration options [29]. Moreover, ESA makes use of a system-level understanding of environmental issues, like studying multiple feedbacks in a watershed for multi-sector management objectives [30]. Optimal data acquisition, processing and interpretation [31,32] help the completeness and accuracy of ESA.
1.1. Freshwater Ecosystem Services in Mining Regions
The ES concept describes freshwater systems as providers of a broad range of benefits. Besides water provision or waterways for transport, stakeholders in mining contexts also perceive regulatory (e.g., buffering of flows), cultural (e.g., recreation) and supporting (e.g., nutrient cycling) services from lakes, rivers and aquifers. In addition, terrestrial processes such as soil development or water use by plants can determine hydrologic attributes (quantity, quality, location and timing) of freshwater flows. The importance of considering these processes for assessing ES is clearly stated in the reviews by Brauman et al. (2007) [33] and by Hallouin et al. (2018) [34]. Hydrologic processes are needed for biophysical production of freshwater ES. When the effects from terrestrial ecosystems on freshwater hydrologic attributes constitute a benefit to humans, the term ‘hydrologic service’ is used [33]. Losses of hydrological structures due to mining activities (e.g., mountaintop removal or dewatering) can irreversibly affect freshwater production and aquatic biodiversity [4]. For modelling freshwater ES in mining regions, McIntyre et al. (2014) point out main challenges in ‘improving (relevance, quantity and quality of) observations of freshwater ecosystems before and after the influence of mining’, as well as the need to enhance stakeholder participation and the effective use of data and indicators [34]. Specifically for measuring biophysical states of water, increasing software availability [35,36], data acquisition awareness among general public and increasing affordability of devices for measuring water variables [37] are promising for generating primary data for robust assessments.
1.2. Justification of This Review
ES studies in mining regions have shown that ES value plummets in mining sites [35,36,37]. The impairment of local livelihoods [26,38] and the unfeasibility of a full recovery of baseline ES [39,40,41] have also been demonstrated. In fact, mined lands offer limited possibilities for restoring ecosystem functions [42]. Despite these precedents, the inherent high complexity of social-ecological systems (SES) [43] and the methodological multiplicity for assessing ES leave room for more precise modelling of mining influences on freshwater ES [44,45,46,47], including both negative and positive feedbacks for the full SES. Fast and holistic assessments of (potential) mining impacts on freshwater ES must be developed through agreements among different experts addressing a single case study [48].
However, since no single ES modelling approach covers all needs and specifications [44], and given the growing interest to build holistic assessments, it is important to draw lessons from multiple efforts addressing ES case studies in mining regions and propose common ground for increasing policy relevance in future applications. We review ESA practice for inland mining contexts, scoping the consideration of ecological processes, water biophysical state indicators, stakeholder involvement and knowledge generation for policy development. To strengthen the validity of ESA, the scientific community recommends the use of accurate indicators for ES quantification [46,49], transparent communication of uncertainties [50,51], consideration of multiple demands, flows and interactions [52,53], and overall model robustness [44,54]. Thus, ES modelling approaches are analysed to reveal general trends in ESA for mining. Next, a systemic depiction of links and components serves us to generalize how freshwater ES are often assessed in mining contexts. Finally, a proposed framework revolves around how to build robust modelling approaches that support decision-making.
2. Materials and Methods
The reviewed articles were taken from the Web of Science (WOS) online database, on 20 March 2017, using the following search algorithm: publication year = 2000–2016; topic = ecosystem* service* + mining; document type = article, yielding 202 publications. The search used 2000 as the starting year because ESA frameworks were encouraged after the Millennium Ecosystem Assessment (MEA) of 2005 [1]. Other terms like ‘ecological services’, ‘ecosystem goods’ or ‘environmental services’ were not considered to focus on those articles relying on the assessment school recommended by MEA, thus referring to human benefits from natural processes strictly as ‘ecosystem services’. The term ‘mine*’ was not used for topic search because it narrowed the number of resulting articles to less than half. After obtaining raw results, 30 papers were excluded due to having marine ecosystems or data mining focus. Next, 57 papers without modelling applications (i.e., reviews, framework proposals, mining technologies, business, social, economic or policy papers) were also excluded. Likewise, 89 articles mentioned ES but did not assess them, and were also excluded. Twenty-six articles that fitted our reviewed scope were evaluated using the criteria and classes shown in Table 1, namely mining focus, ES value basis, data sources, indicators of water biophysical state, ecological functionality, integration of human–ecosystem spheres, model complexity, ESA output, trade-offs analysis, scenario simulation, uncertainty assessment and stakeholder participation.
We considered that studies applying the ES value coefficients approach from Costanza et al. [21] have ecological functionality only if site-specific field investigations were also present. Conversely, studies applying such coefficient without field verifications were considered as ‘null’ ecological functionality. A scheme that summarises the reviewed practice was generated based on the ‘drivers-pressures-states-impacts on ES-responses’ (DPSER) [55] framework, to have a systemic view of the overall modelling approach used in mining contexts. The different ES were adjusted to the common international classification of ES (CICES) [56] to avoid multiplicity in definitions and classifications.
3. Results and Discussions
A quantitative overview of results for our reviewing criteria (Table 1) in selected articles can be found in Appendix A, Table A1 (policy-oriented aspects) and Table A2 (methodological aspects). Preliminary implications of the reviewed aspects are discussed here, focusing on data and methodological preferences from reviewed articles. Then, we discuss characteristics in reviewed applications that offer policy support potential. Finally, a scheme of the main elements and interactions used by models is integrated in a single environmental management framework (DPSER) to depict ESA potential in mining contexts.
3.1. Methodological Choices for ESA in Mining Contexts
Involving expert modelers at early stages of problem definition and goal identification is crucial for selecting modelling tools and deciding on potential system simplifications [57]. Onset assumptions for addressing a case study, as well as the choice of parameters and processes to be modelled, can bias the outcome of an ESA [58]. These methodological choices are also critical for capturing particularities from the mining context itself, either in terms of extension, severity and occurrence of potential impacts, as well as for the unique social dimensions and corporate responsibility [59] inherent to a case study. The latter pertains to the social responsibility and sustainability reports from mining companies [16].
3.1.1. Focus on Mining and Its Impacts
Reviewed papers illustrated case studies situated in either pre-, post- or current mining lands, with extensions ranging from 50 m transects [60] and patches of several kilometres, to regions of thousands of square kilometres. Post-mining case studies included abandoned mines and restored sites (e.g., for recreation, reforestation or bioremediation) used for non-metallic (e.g., carbon, gravel or sand) and metallic (e.g., iron, zinc, cobalt or gold) resource extraction. Furthermore, the focus on mining activities was reduced in a few articles, either by combining mining with other land uses (e.g., ‘mining-industrial land’ or ‘settlements and mining sites’) [36,61,62], or disregarding the environmental impacts of mining [63], or mentioning it briefly [64,65]. Despite not having primary focus on mining, these articles added relevant ES knowledge for mining contexts, like the link between mining and cultural perception of climate change [64] or the consideration of daily earnings from small-scale sand mining as part of the total ES value [63]. Unexpectedly, no paper fitting our scope was published in WOS during the 2000s.
Approaches for mineral exploitation can differ depending on the location and concentration of the targeted mineral, as well as on the type of lease for exploitation (e.g., large-scale concessions, artisanal with permit or illegal mining). Most non-metallic minerals can be extracted at surface by stripping, while metal-rich ores are located deeper, thus requiring rock removal [66]. Strategies for accessing ore layers can include tunnelling (i.e., subsurface mining) or huge explosions (i.e., open-pit mining). Also, some precious metals can be found in river sediments and be extracted in situ by placer mining [67]. In the case of artisanal mining, exploitation takes place in smaller patches of landscape, resulting in scattered impacts that can remain undetected [68]. Insufficient waste-treatment and biosafety measures [69] are also typical in artisanal and illegal mining. Therefore, it is important to consider that major stressors of ecosystem functions could differ among mining contexts. e.g., artisanal mining nearby water bodies has higher chances to deteriorate water quality [70]; mountaintop removal impairs aquifer recharge [4]; open-pits decrease the level of water table [8]; tunnelling mining directly affects groundwater functions [71]. In turn, other impacts like acid mine drainage [72], spoil disposal, vegetation removal and soil erosion will contribute to the cascade of impacts on water resources. Also, different stages of mining operations require different responses to potential impacts, since the severity and distribution of environmental stressors is dynamic like the mining process itself [5,73]. During exploration and prospecting phases, a baseline for ES is determined, and impacts are to be avoided. In the exploitation phase, or actual mining, ecosystems are constantly under different types of pressure, and the focus is shifted towards impact minimisation and risk prevention. Later, during mine closure, rehabilitation of ES should preferably be based on scoped needs from all concerned stakeholders, as well as on the recovery potential of ecosystems [42]. More insights about the variability in timing and location of mining operations and its implications for assessing mining projects holistically are covered in the review by Lechner et al. (2017) [59].
Indicators reflecting environmental states that are directly or indirectly impacted by mining activities can differ at each stage, type or location of mining operations [74] making it necessary to define boundary conditions prior to addressing data collection. For assessing mining impacts on freshwater ES, best-suited indicators for specific mining contexts are needed. These indicators should include measures of ecosystem functions that closely reflect the potential ES delivery. Establishing indicators for both coarse and fine scales is also desirable, since mining and its legacy can impact water bodies locally as well as at further distances [8].
3.1.2. Data for ES Valuation in Mining Contexts
The different types of bases for valuing ES, data sources and indicators of biophysical state of water considered by reviewed articles are shown in Figure 1. The horizontal axis (percentage of publications) is ordered from most recent (2016) to older applications. A trend towards more pluralistic valuation of ES developed in recent years, particularly in 2016 (dark-blue colour in Figure 1). Bases to assess ES values included (i) socially attributed scores for ES (i.e., cultural basis); (ii) land-use/land-cover (LULC) areas with corresponding ES value coefficients; (iii) non-land-use-based proxies for ES (e.g., landscape photographs, topography maps or biodiversity indicators); and (iv) measurements of ecosystem functions. Regarding environmental data, field measurements of biophysical features were used in less than half of the articles. Calculation of ecosystem functions from secondary data [35,37,65,75,76,77], like meteorological records or existing LULC maps, predominated over calculations from primary biophysical measurements [40,60,78,79,80]. The ease for acquisition of secondary proxy indicators [81] explains their presence in nearly 92% of articles (Appendix A Table A2). Biodiversity, a prominent proxy-indicator of the functioning of ecosystems [82,83], was measured directly from biota counts [39,40,60] or estimated from habitat quality scores for specific LULC types [35,79]. The machine learning technique ‘RandomForest’ served for coupling these two types of biodiversity measurements [84]. Another common foundation for ES valuation is LULC area, a well-known proxy indicator for spatially explicit assessments of ES. Almost two thirds of the reviewed practice relied on LULC-based valuation using Geographic Information Systems (GIS). GIS databases also contained hydrographic, topographic, pedologic, digital elevation, surface temperature, rainfall, radiation, greenhouse gases concentration or carbon stock data maps. Also, field experiments could provide data for ES: a four-year reforestation application on mined lands [40] and a bioremediation test on metal-polluted soils [60] were studied for recovering specific ES in abandoned mined lands.
Despite the fact that ES are influenced by site-specific attributes from both people and ecosystems, less than 45% of studies valued ES culturally [26,63,64,77,78,80,85,86,87,88], or considered ecological functions for extrapolating them to ES values [35,37,40,60,65,75,76,77,78,79,80]. Public consultation, either by focus group discussions, on-line, on-site questionnaires or open questions, was applied in half of studies (‘interviews’ in Figure 1), including a smaller fraction using expert knowledge [35,78,85,88]. Exceptionally, Mazzotta et al. [77] calculated the recreational value of fishing without direct human consultation, but coupling existing ecological and socio-economic data in meta-regression models. Data acquisition from local ES beneficiaries was improved by using local terminology and materials for ES scoring (e.g., chalk powder, stones or grass) [87], and by preventing bias due to proximity of the interviewer [85]. Interestingly, indigenous knowledge was hardly used to validate technical data [64]. Most articles (~70%) rather filled their data requirements with pre-existing data.
Methodological developments for converting remote sensing products into ES maps, as well as the increasing accessibility to LULC databases, support the implementation of spatially explicit ES models [89]. However, the high versatility of GIS data for environmental modelling is mainly challenged by its inaccurate multi-scale reusability [79] and potential information loss after resampling [84]. Inconsistency in the choice of sampling technologies, spatial–temporal resolution of data, available budget and other uncontrolled features (e.g., cultural bias, climate change) can result in biased ES maps and correlation coefficients [45,90]. For instance, biophysical measurements offer finer resolution than regional LULC maps, but the latter can be preferred to cover more extensive areas, as well as to reduce costs and labour intensity for practitioners [91]. Although unrealistic at times, ES valuation is based on assumptions from scientific consensus or expert knowledge. For example, biodiversity conservation is essential for the functioning of ecosystems, as it is for human well-being [92]. Conversely, the influence that biodiversity has on social valuation of ES is debatable [93], thus, the importance of public consultation [85]. Expert opinion helps in complementing what biophysical measurements might tell and non-expert participation adds information about social values of ES. These assumptions can simplify complex systems for analytical purposes [94]. Specific data is thus needed to fill minimum model requirements for a specific ES model [47]. Moreover, linking social features with natural structures [95] in mining contexts must incorporate perspectives from not most, but all concerned stakeholders [96].
3.1.3. Indicators of Water Biophysical State
As shown in Figure 1, reviewed articles measured freshwater ES by using the area of water bodies or water landscapes mostly, and fewer times using volumetric flows reflecting anthropic consumption or precipitation. Freshwater ES proxies are often taken from secondary sources, while primary field data like nitrogen, phosphorus contents [78], or pH measurements [60] are scarcely used. Despite the undoubtable influence of mining activities on soil–water interactions, groundwater measurements were limited to two articles using the water content in soil as part of their models (i.e., a measure of soil moisture). Few articles had little focus on water resources [26,39,40,64,80,86,88], or justified omission due to data scarcity reasons [35]. Alternatively, if enough data records are available, hydrological modelling is a good option for the quantification of freshwater ES provision [97]. In reviewed practice, water quality and groundwater recharge were modelled using land use scores for water quality [79] and long-term precipitation and evapotranspiration data [76], respectively. Notably, coefficients for subsidence water bodies (i.e., influenced by upstream mining operations) [98], as well as weighing factors for seasonal rivers [36,75], were adjusted for mining regions without the explicit support of hydrological models.
Water data collection, processing and interpretation might involve experts, managers and users at different levels of assessment of water resources [97]. While mining impacts on water quality and quantity are major concerns of local people [4,9,69], management of water resources requires also biophysical flows and economic valuations [99]. In mining regions, competing use and distribution of water resources stresses the urgent need to describe freshwater ES production biophysically. High quality indicators of ES are thus needed for addressing sustainability of water resources [74]. The quality of an ES indicator depends on its representativeness of the object of interest (i.e., indicandum), its feasibility of aggregation, measurability, normative relevance, comprehensibility and transparency in the level of certainty. A strong foundation in cause–effect relationships and network-based analyses also determines the quality of ES indicators [100]. Furthermore, measuring cumulative changes that are indirectly induced by mining reflects potential social-economic consequences [59]. For instance, lowering water table levels [8], due to groundwater abstraction or pit excavations, will irreversibly affect hydrological cycles [4,74]. Oxidizing geological layers due to dewatering during exploitation can lead to acidification, and when pumping stops and mining ceases, acid mine drainage can end in irrigation systems. Also, functional traits in mining-subsidiary habitats can shift due to river pollution [11,101] or habitat fragmentation [35], eventually altering the cascade of ecosystem functions that provide water ES. These aspects, however, were absent in freshwater ES models applied to mining regions.
3.1.4. Complexity, Human–Ecosystem Integration and Ecological Functionality in ES Models
Modelling approaches were evaluated in levels of ecological functionality, three-layered interaction (i.e., coupling natural systems to social and economic systems) [102] and complexity (i.e., number of parameters), as defined in Table 1. Results suggest that current practice tends to reduce efficiency in at least one of these three aspects. As shown in Table 2, most models were either medium or high in complexity (i.e., requiring >9 or >16 parameters respectively), and medium-to-low in ecological functionality. Occasionally, high ecological functionality could be achieved with medium to high level of complexity, and medium level of interaction [60,76]. However, most articles (~73%) had low or null consideration of ecological functionality, despite some models requiring a high number of parameters [35,40,65]. Also, most articles missed a connection with either biophysical, social or economic spheres, resulting in models of medium interaction mainly (Table A2). Interaction and complexity were primarily unrelated, as illustrated by data-intensive applications that had medium level of interaction [35,40,60,65,75,79]. Some models could assess three layers (biophysical, social and economic) using a maximum of eight parameters, i.e., models of high interaction and low complexity [64,80]. Although the latter can satisfy specific assessment goals, cross-discipline properties of the system (i.e., resulting from three-layered interactions) [102] might be oversimplified. Implications for using simple versus more complex algorithms are discussed in Section 4.2.
Methodological variations are presumably linked to the diverse disciplinary focus among selected articles: e.g., environmental economics, landscape planning, environmental management and land restoration. Different disciplinary focus also translates into different levels of robustness in ES models in mining regions. While models can be fed with different types of environmental data, it is desired that the modelling exercise provides the most realistic possible picture of the studied system. For that end, ES models should be grounded in ecological networks prior to social and economic layers [44,102]. A much-needed biophysical realism in the assessments invokes high ecological connectivity among environmental compartments (biosphere, hydrosphere, lithosphere and atmosphere) [103]. Yet, a certain level of simplification in the assessment is expected, as well as for knowledge communication. Therefore, a balance between functionality and interaction in models, with a realistic level of complexity, should be optimised for the overall ES assessment.
3.2. Policy-Oriented Efforts in Reviewed Assessments
Besides achieving robustness in the assessment of water ES, the policy arena asks for model outputs that are easily visualized and interpreted by non-scientific audiences [104], allowing salient and collaborative development of management responses. For example, ES value standardization (e.g., from 1 to 10, or from 0 to 100) is intended for non-expert communication, which is convenient for stakeholder involvement. The explicit inclusion of uncertainties in derived recommendations [51] is also critical, considering that mining regions are prone to constant social-ecological changes, and ES trade-off patterns can change with the different stages of mining operations.
3.2.1. Scenario Simulation, Trade-Offs and Uncertainties
Scenario simulations were used in three different ways: (i) to compare different mined-land restoration budgets and the related willingness to pay (WTP) for recreation [80]; (ii) to compare WTP per captured fish under two hypothetical mining scenarios [77]; (iii) to compare the influence of different rehabilitation alternatives on ES trade-offs [86,105]; and (iv) to predict LULC changes to inform policy makers [61,79]. Also, climate variability, policy changes [61] and rules for land conversion [105] could be incorporated in some simulation applications.
Trade-offs were assessed from two perspectives: either as the interplay between ES provision and socio-economic growth [36,38,78], or as the increase in provision of certain ES at the expense of another service [39,84]. The latter is calculated using matrix approaches [84] or spatial correlation for different ES [65]. Both views could reveal deterioration of ES as a result of mining. Also, a retrospective analysis helped to identify ES trade-off trends for informing land use planners [84].
Uncertainties could be presented as part of experimental results, but ignored for the overall ESA [40,60]. Variability indicators included standard errors, p-values and confidence intervals [35,77,85]. According to one study [38], delivering a monetary range as final ES valuation is unlikely to change main conclusions. However, most of the reviewed articles failed to account for uncertainties (78%) either by showing no data variability indicator or by mentioning uncertainty implications vaguely [26,36,39,61,62,63,64,65,75,76,79,84,86,87,88,105]. Flaws in uncertainty assessment were related to insufficient discussion of error bars, use of mean values only [79,84], and rescaling of final ES score [35,60,76,79]. Moreover, some articles had no single mention of uncertainties [37,78,80,98].
As suggested for mining contexts, sustainable use of water resources implies the protection of biophysical thresholds despite socio-economic priorities [74], providing systemic limits to actions [106]. These hierarchical constraints can be explored by modelling hypothetical scenario that would provide relevant information for decision-makers [107]. Combined assessment of trade-offs, hypothetical scenario and uncertainties was not applied in ESA for mining. These three aspects are important for policy-oriented environmental modelling [108], helping to anticipate responses to social-ecological changes. Extensive extractive activities, like mining, require substantial knowledge on management options. If uncertainties are considered, and underlying theory and data are firm enough, ES trade-off simulations can support management decisions [109]. Furthermore, the accuracy of model outputs is inherently subject to deviations in raw data, and theoretical simplification of a real system. Eventually, propagation of uncertainties from input data throughout the ES modelling exercise will have an effect on policy recommendations [50], and should therefore be explicitly taken into consideration.
3.2.2. Stakeholders Involvement and ESA Outcome
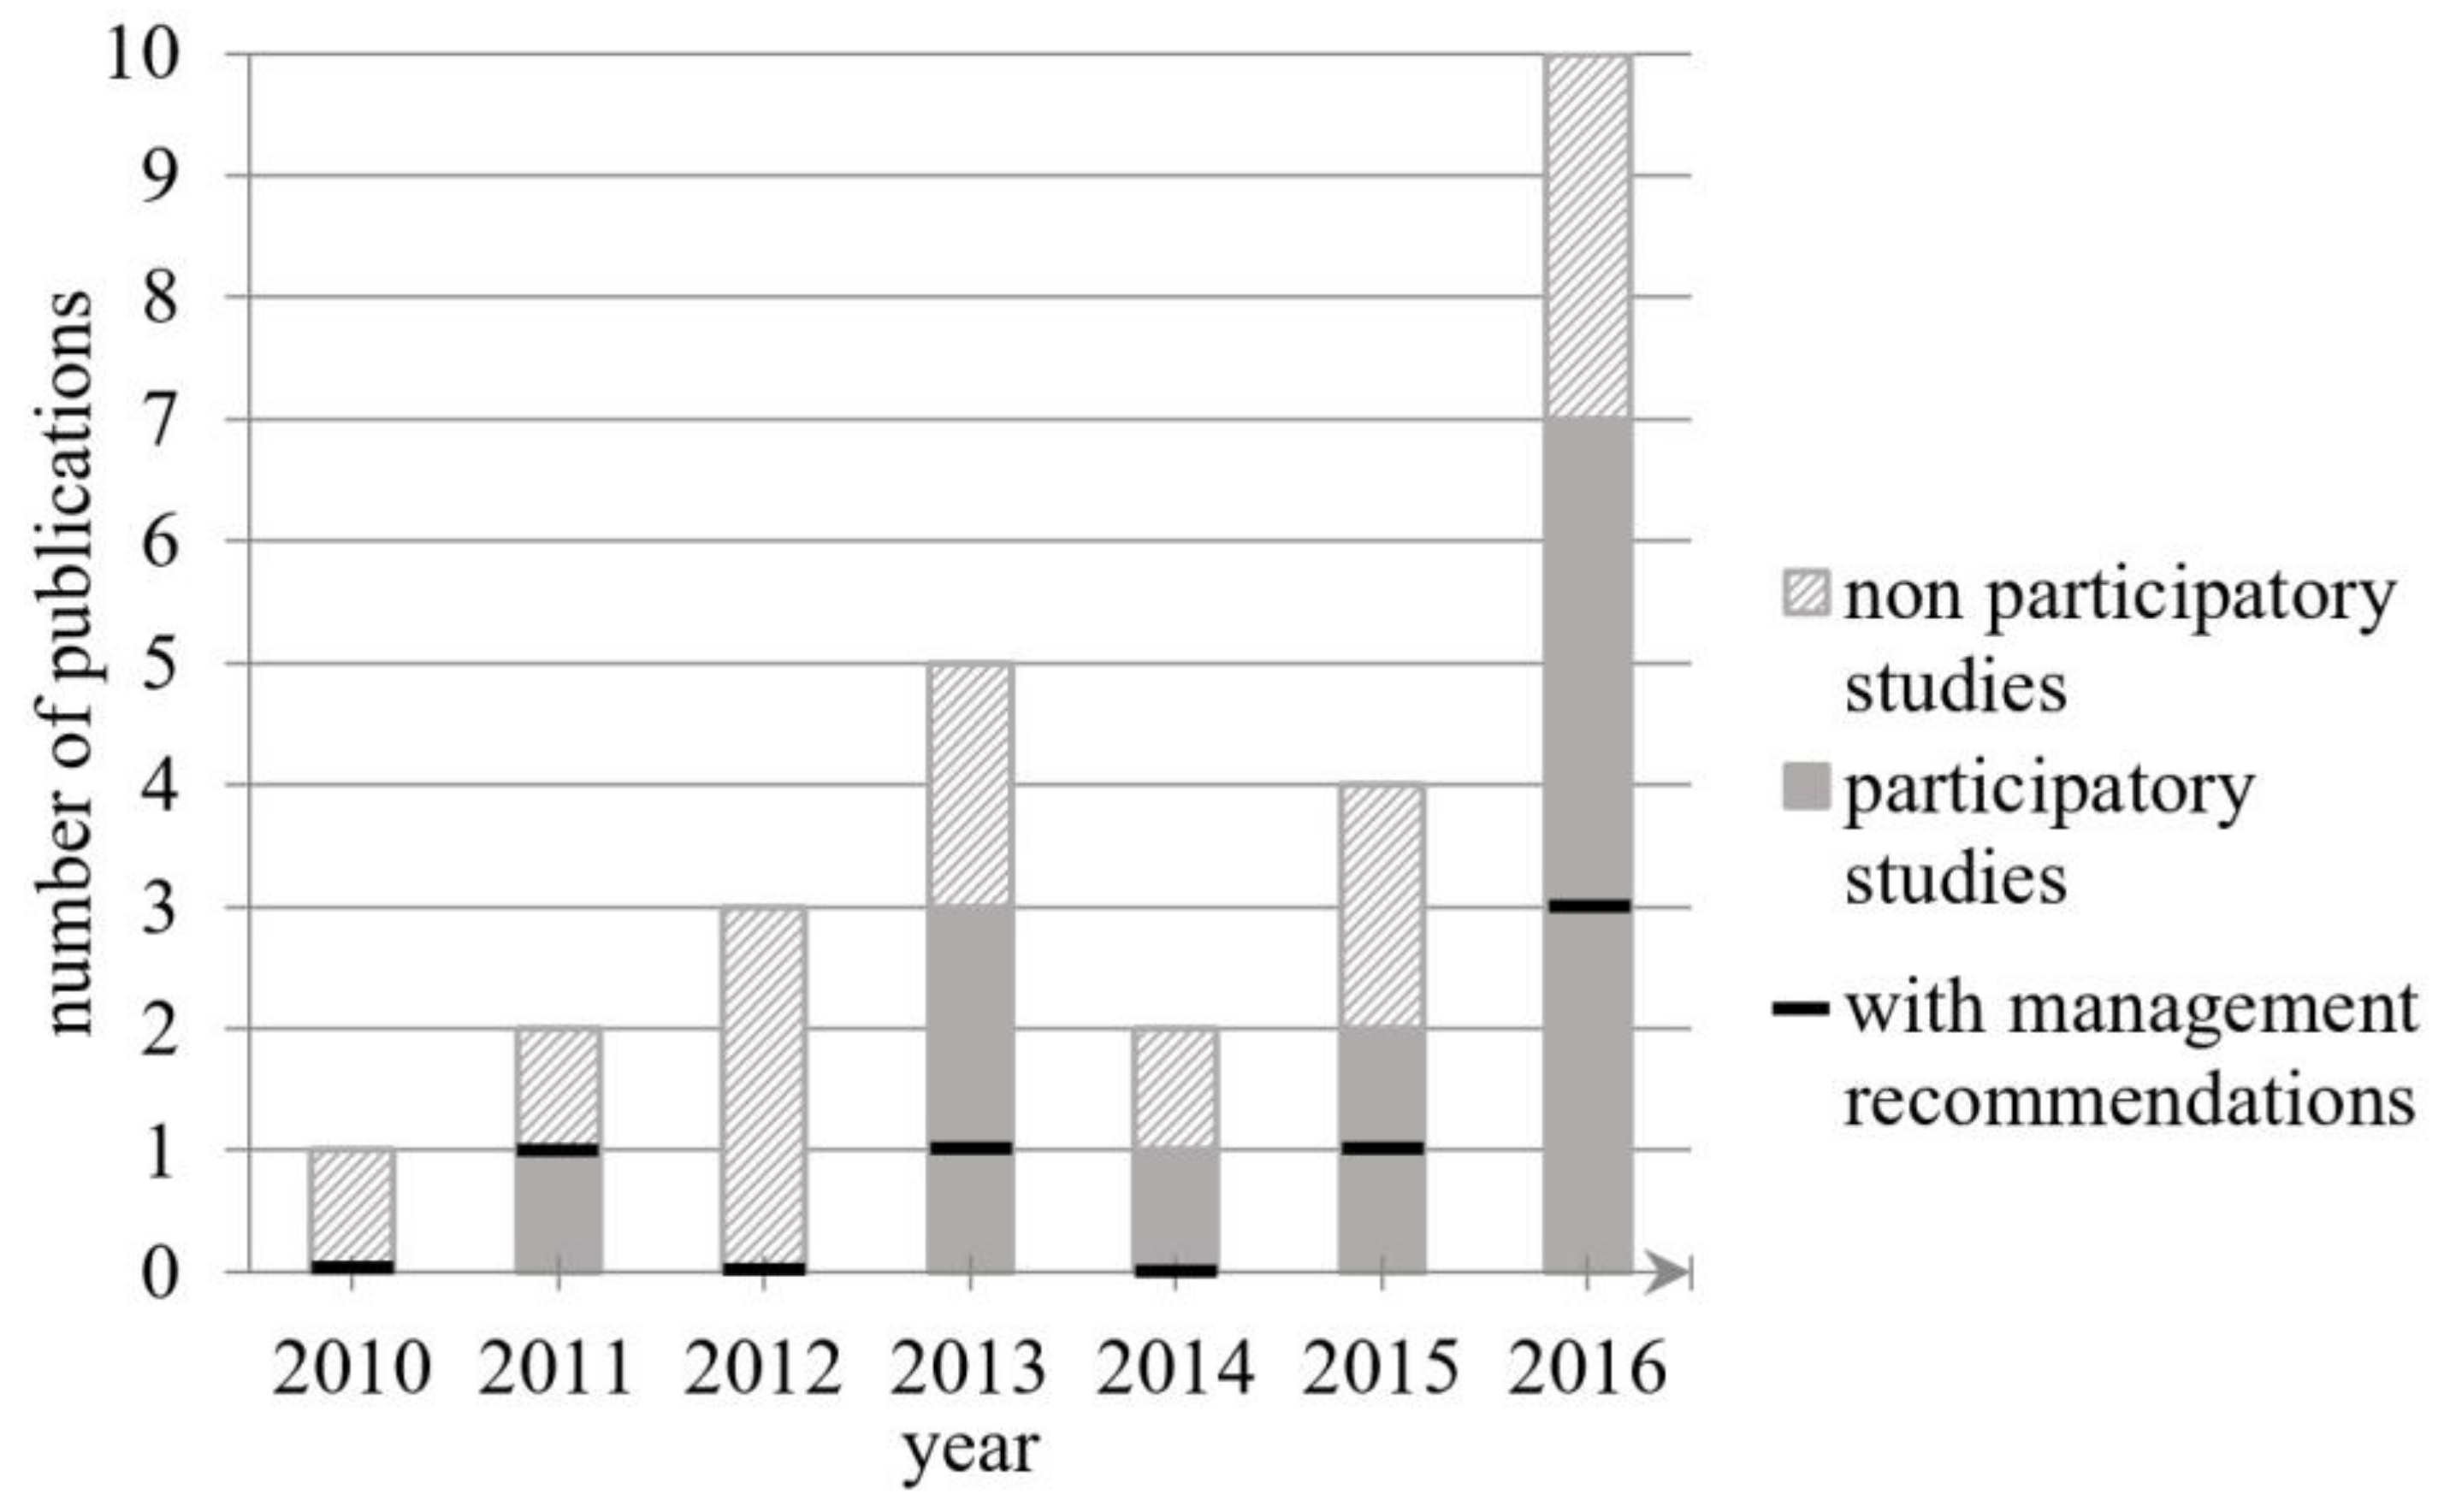
Human consultation provides crucial knowledge on local perceptions and distribution of natural benefits among stakeholders [110]. Incorporating people’s concerns at the microscale [20,111] and trivial livelihood activities [112] contribute to ESA’s legitimacy. However, few articles applied a stakeholder-engaging ESA framework [26,80,86]. Other means of reaching stakeholders included participation through surveys for cultural valuation of (post-)mining landscapes [26,63,78,80,86,87,88], expert consultation [35,38,79,85,88,105] and focus group discussions [64,87,88]. The contrast between expert and non-expert knowledge [85], and the consideration of mining impacts on humans [64,80,88] (e.g., disservices or health effects), were rarely present in reviewed practice. Regarding the outcome from ESA, it was generally delivered as values of ES (~77%), rather than management responses or recommendations (~23%) (Table A2). The inclusion of social assessment was frequent in those articles delivering responses as final output of ESA (Figure 2). Compensation schemes after water resource damage estimation [78], and a prediction of the best rehabilitation option for mining legacy [39,80,86,105] were the most policy-oriented applications.
Despite the fact that some studies provided no policy recommendations, all authors could at least deliver certain knowledge on ES patterns, often capturing mining impacts on SES as a result of degradation of ES in areas where mining takes, or took, place. Articles illustrate (indirect) consequences of mining on ES status, but efforts to reach decision-making were dispersed among different research fields. Remarkably, most hypothetical scenario simulations focused on mining legacies [80,86,105], or were used for predicting trends in landscape changes [61,79]. Few authors captured a baseline state for ES (i.e., pre-mining state) [76,77]. Methodological combinations that could strengthen the support for policy were absent (e.g., responses with transparent communication of uncertainties, or valuation including uncertainty and trade-offs assessment).
Integrated social-ecological modelling is likely to result in concrete actions if society learns and gains awareness about scientifically sound recommendations [113]. A solution to avoid much divergence in modelling strategies to support decision-making (i.e., driven by unintelligible communication of the modelling process and results to stakeholders) can be the use of cause–effect frameworks. Environmental management frameworks consider human–environment relationships from a cause–effect perspective with focus on societal patterns [114,115], capturing complex social-ecological issues holistically. Flexible and adaptive tools, like the drivers-pressures-states-impacts-responses (DPSIR) framework, help to target SES responses more efficiently [116]. Such framework has proven helpful for identifying environmental problems that deserve major attention and responses [114]. Particularly for mining, implementation of sustainability suggests the establishment of stricter environmental legislations, permanent monitoring of pollution, and impact assessment based on multi-stakeholder collaboration [20,96].
3.3. Fitting the Practice in an Environmental Management Scheme
In view of the different levels of ESA outputs and stakeholder engagement, as well as the evident methodological multiplicity, the reviewed practice was integrated in a single framework. Placing ‘impact on ES’ at the core of DPSIR has been suggested for ecosystem-based management [55], resulting in the DPSER framework [100]. DPSER conserves the flexibility and structuralist advantages of DPSIR, as well as the ability to determine crucial indicators at each level of DPSER, including those for ES trade-offs [55].
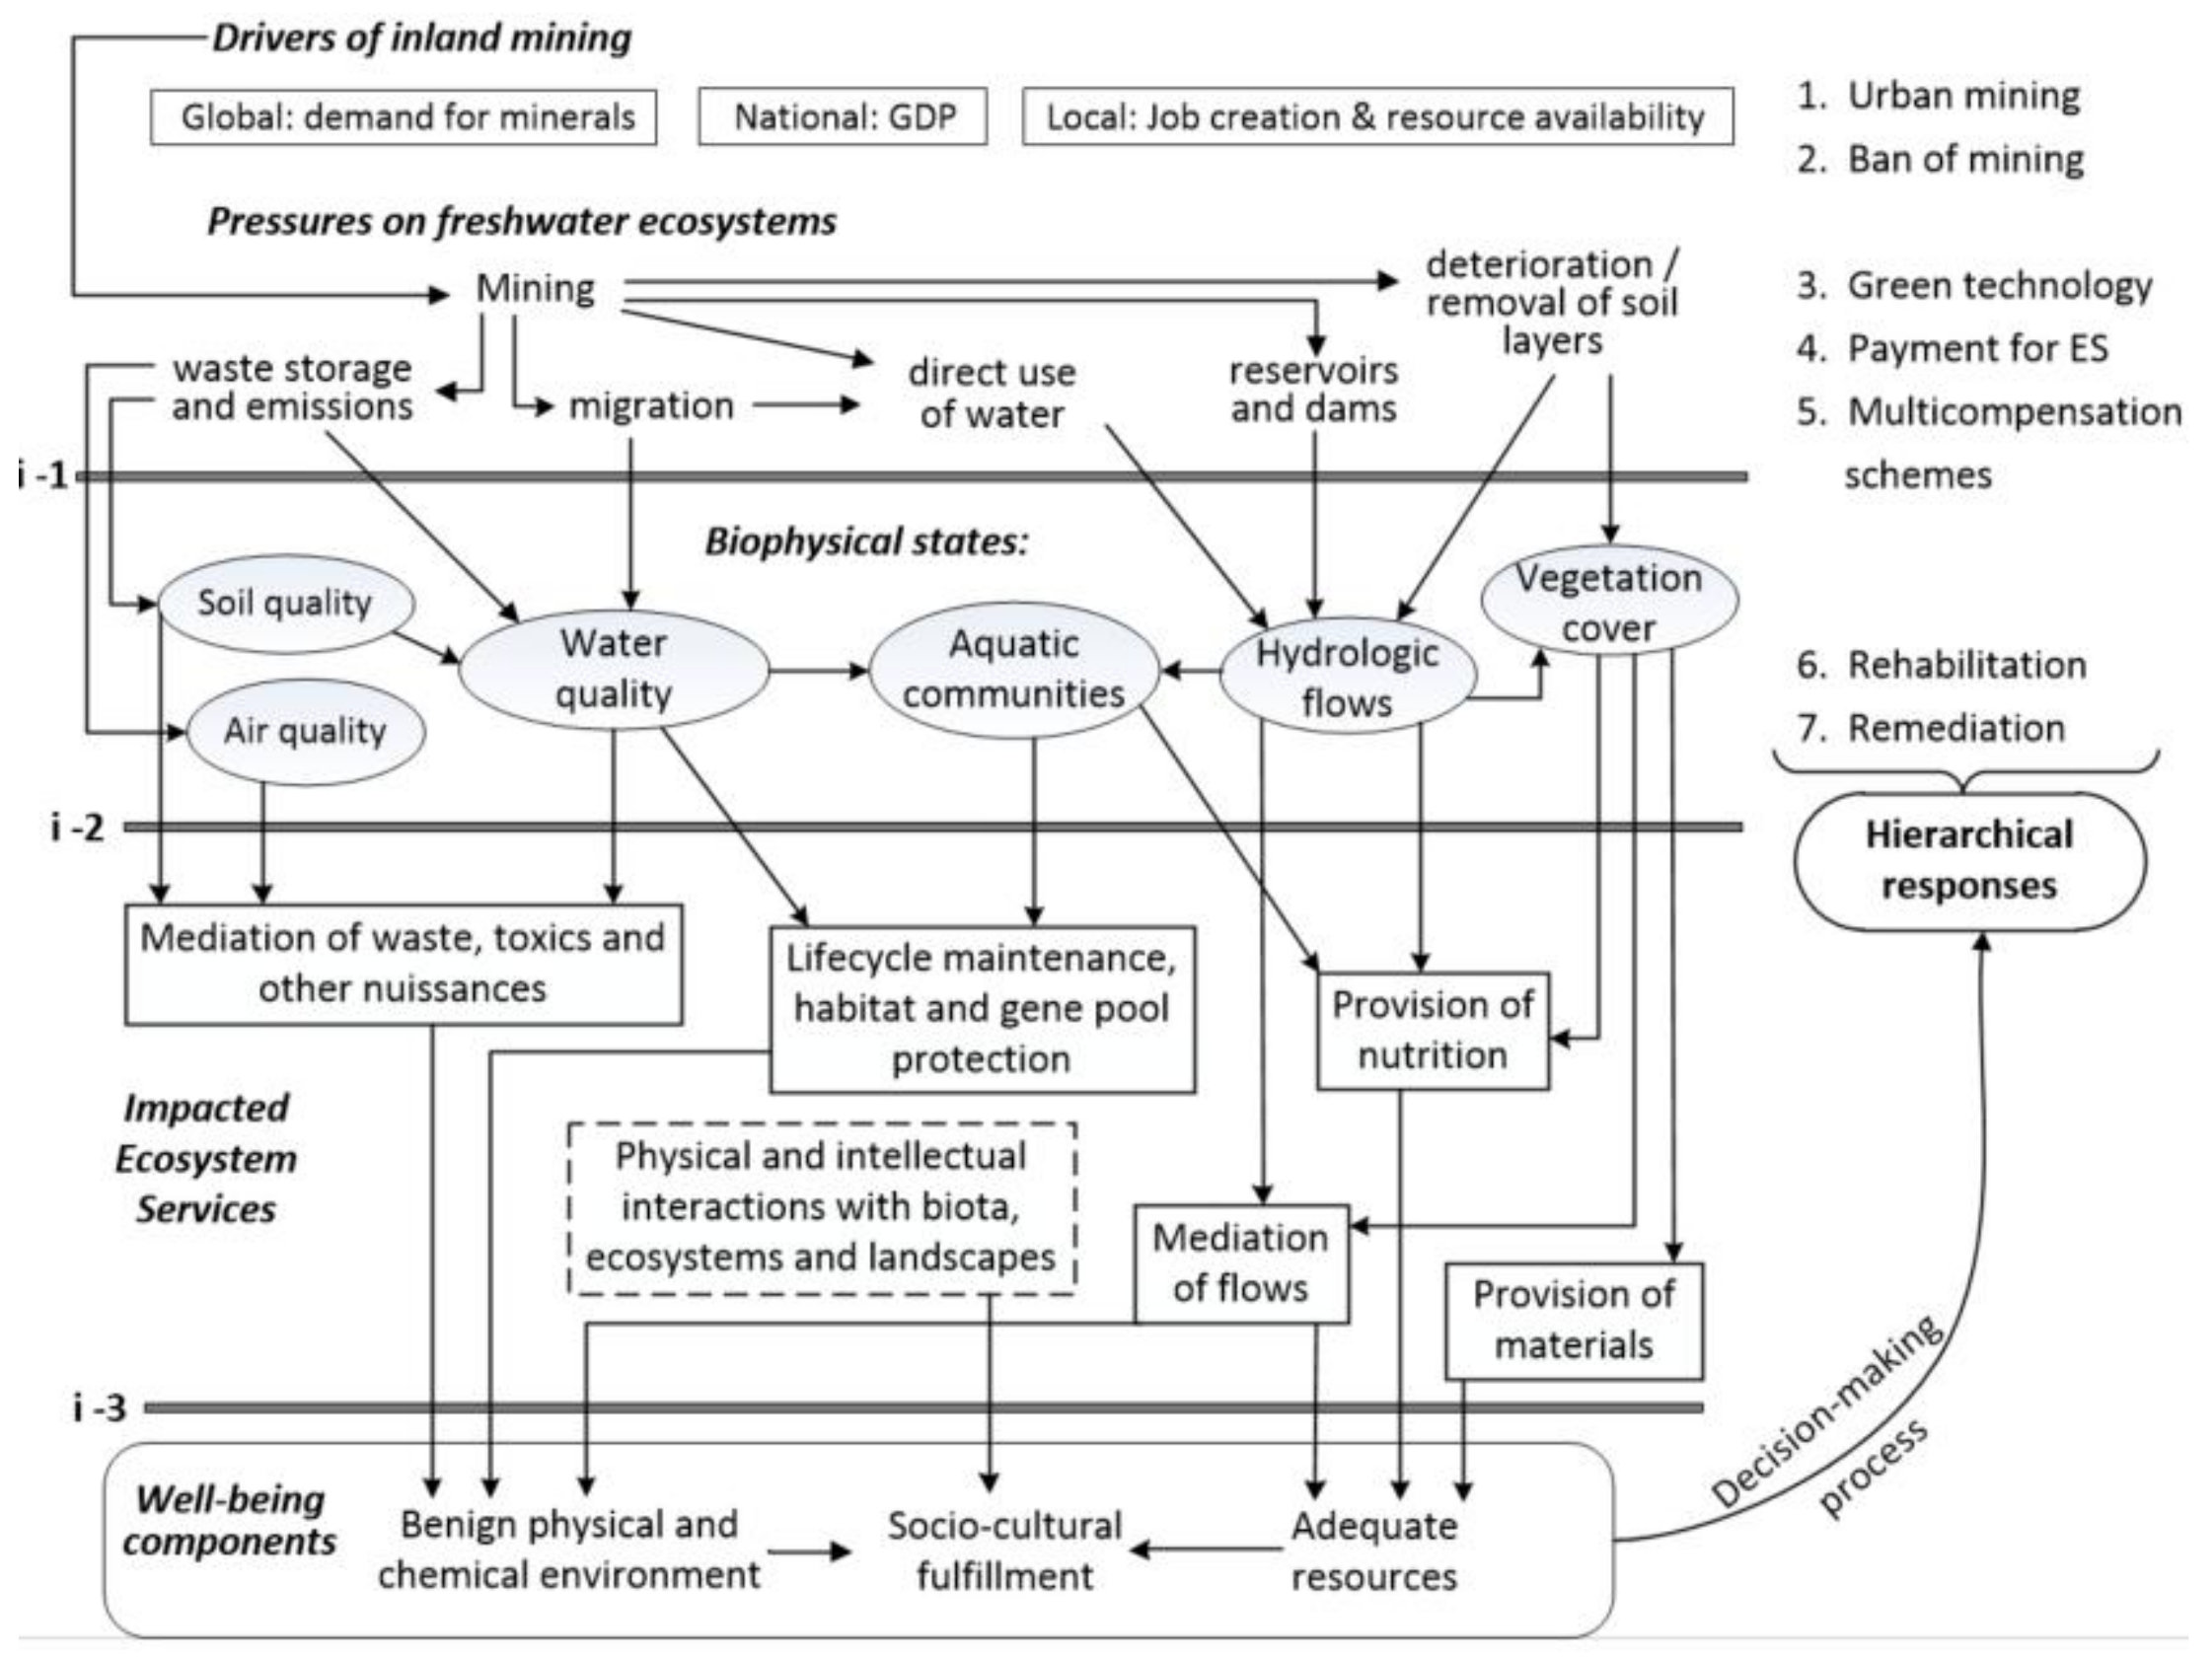
Although articles had no clear DPSER structure, we identified elements and links in reviewed practice that could be organized in such framework (Figure 3). For instance, drivers were often identified from the site description or introductory parts of articles, while pressures, states and impacts were taken from the assessment part. Although most scheme components were taken from reviewed articles, some conceptual links were disregarded due to our scope, e.g., less regulation of water quality as a result of less water flow is not accounted, or services produced in the atmospheric compartment are not represented, both due to the existence of much stronger pressures on water quality and quantity. Also, the subjectivity of human perception on biophysical structures and biological assemblages [82] was avoided by grouping non-cultural biodiversity-related services within the ‘lifecycle maintenance, habitat and gene pool protection’ group from CICES [56]. Moreover, all cultural ES were grouped within ‘physical and intellectual interactions with biota, ecosystems and landscapes’, since this review is not focused on cultural ES. Also, four types of management recommendations were identified, from which only one is of a preventive nature (i.e., mining ban). Other delivered ‘responses’ were mostly focused on end-of-pipe actions like rehabilitation, remediation or compensation schemes. Notably, these responses need to be hierarchically chosen according to the recovery potential of ecosystems [42], or any measure diminishing the severity of drivers and pressures shown in Figure 3.
Likewise for ESA, DPSIR-inspired frameworks can have issues with multiplicity of definitions and terminologies; e.g., considering ‘pressures’ that others consider as ‘drivers’. We simplified all ES by using the CICES terminology [56]. Presumably because this standardized classification is recent, linking all ES from reviewed practice to the CICES classes [56] was not always feasible. Thus, ES were classified in 6 bundles: 5 CICES divisions (provision of materials; provision of nutrition; mediation of flows; physical and intellectual interaction with biota, ecosystems and landscapes; mediation of waste, toxics and other nuisances) and 1 CICES group (lifecycle maintenance, habitat and gene pool protection). Likewise, impacts on humans were simplified to three well-being components: benign physical and chemical environment, socio-cultural fulfilment, and adequate resources [80].
The resulting scheme (Figure 3) is focused on freshwater ES, hence ‘Atmospheric composition and climate regulation’ are excluded, and ‘Mediation of flows’ refers to hydrological cycle maintenance and erosion prevention mainly, rather than to gaseous flows. ‘Provision of nutrition’ englobes services such as cultivated crops, reared animals, fish production and drinking water. The division ‘mediation of waste, toxics and other nuisances’ relates to the deterioration of physicochemical quality due to mining activities. ‘Drivers’ of mining activities are bound to socio-economic and hydrogeological possibilities, with prevalence of economic growth and natural resource availability, respectively. ‘Pressures’ indicated in the scheme are those strictly linked to mining activities. ‘States’ represent either field measurements or environmental data that were used for the assessment of ES. These biophysical states (Figure 3) are linked through assumptions for the most realistic representation of ecological functions that can be modelled. Lastly, mining impacts were divided into two stages: first towards ES (‘i-2’ in Figure 3), and then from ES to human well-being components (‘i-3’ in Figure 3). Splitting mining impacts into two stages provides an interface to identify ES flows to users and potential human feedbacks [53], helpful for elucidating environmental management priorities. The resulting scheme (Figure 3) can serve as inspiration for building cause–effect network models, combining biophysical, social and economic layers.
Perhaps the greatest responsibility to construct these models correctly relies on each specialist, particularly for choosing the optimal data sources and model types that help link anthropogenic pressures with biophysical states (‘i-1’ in Figure 3), and to model those changes in biophysical states as changes in rates of service provision to people (‘i-2’ in Figure 3). Also, focusing on an interface between ES and components of human well-being (‘i-3’ in Figure 3) can help in informing socially sound decisions. In the hypothetical case that practitioners agree in one overarching systemic view of the relationship between inland mining and ES, like the one depicted in Figure 3, the issues of multiplicity in ESA will be reduced, and communication with stakeholders facilitated.
4. Main Discussion
Mining certainly brings fast economic development (i.e., GDP and employment), leading to division in opinion between stakeholders using ES but not benefiting from mining activities, and those that do, including governmental bodies [20,112,117]. Including different value types is of great use if biophysical data and site-specific expert knowledge can support it. The mineral product itself constitutes natural capital, although unrenewable at life-span scales. Valorisation of mineral products might be a step further in identifying the performance of driving forces in ESA, but biophysical foundations for describing the transition of ecological processes into services is more crucial for assessing mining impacts on ES [74,102]. Knowledge on biophysical ES production in post-mining contexts is available from biotechnological experiments and field interventions, but their applicability in holistic ESA remains unexplored. Restoration of mined lands is embedded in environmental policy for many years already [41], and related research is focusing on ecosystem structure and ecological functioning as a result of post-mining reforestation, favouring the understanding of ES dynamics in mined landscapes [118,119]. Moreover, cultural bias, data multiplicity and choice for best-suited models make overall robustness in ESA a challenging task [44,54]. Thus, for adding social and economic layers to a biophysical network, clear boundary conditions must define the assessment methodology [120].
Regardless of spatial extent, geographical location or type of mineral extracted, assesment of mining impacts has been traditionally guided by quality standards (e.g., heavy metal concentrations) [121] from environmental legislation, presumably overlooking other types of impacts on SES. Weak environmental policies and enforcement for mining lead to detrimental effects on ecology [122]. By acknowledging the intrinsic value of biodiversity and natural structures in the maintenance of ecosystem functions, and the subsequent dependence of human well-being on the functioning of ecosystems, the ES concept is essential for developing policies that steer sustainable development of humans [123].
To achieve policy relevance, a systemic-functional view of assessment elements needs to be expanded. Mining-related ecological processes have been focusing on mining remediation and rehabilitation aspects mainly, while baseline determinations are also needed. For instance, the ‘biophysical states’ from the DPSER framework (Figure 3) can be reclassified as ‘potential changes during extraction’, and ‘potential changes after closure of mine’, and the social-ecological impacts (i-3 in Figure 3) can be organized hierarchically to address potential responses for the full SES [74], rather than at single components. Much focus on economic revenues for the mines can result in deterioration of SES in the surroundings. Furthermore, the expansion of (illegal) artisanal mining activities, which are putting human health and natural processes under pressure [7,69], is an additional challenge for modellers in the field. The effects that illegal mining has on biophysical structures is not distributed as in large-scale mining operations, making biophysical assessment in illegal contexts [68] an extra challenge. Despite a general need for high complexity in ES analyses, understanding by the general public should be facilitated. Thus, results from ES models require a clear translation to implications on people’s livelihood (i.e., part of social values), avoiding unnecessary complexity [113]. For modellers, the high diversity in choices for ES data usage and models urges the need for methodological agreements under ESA frameworks specific for mining.
4.1. Data Science, Acquisition and Transformation
Among the multiple assessment approaches, a clear preference for simple algorithms was denoted, probably due to time and data limitations. Uncertainty is justified in some cases if policy objectives and participation are means for empirical validation. Data-scarce scenarios are characterised by insufficient hydrological or meteorological stations, or no robust environmental monitoring programs, hampering primary data acquisition and resting the focus on process-based models. Benefit transfer approaches have been commonly used for ES valuation when primary data is insufficient [124]. Also, the processing of remote sensing products can measure certain biophysical features used in ESA [89], allowing monitoring of mining areas of difficult access (e.g., mountaintops). Moreover, satellite products’ quality and availability will continue to increase in the coming years [125]. Notably, new possibilities for ESA in data-scarce regions are available due to increasing environmental awareness and technological developments, like the citizen’s science approach [32] to collect primary data. Citizen’s science means that research design, data collection and results interpretation are carried out as a collaborative effort between scientists and the general public [32].
Knowledge-based models are also available to deal with data scarcity in a case study: Bayesian belief networks (BBN) and structural equations modelling (SEM) are network-based models successfully applied in ESA [126,127]. Being based on known causal relationships represented in a graphic network, BBN and SEM are efficient for analysing highly complex systems (e.g., ESA of mining projects) and explaining model structure to stakeholders for salient collaboration. The ability of these models to work with scarce or incomplete data is supported by its transparent formulation based on theories, expert knowledge and empirical data. In BBN, the systemic interrelation among elements of assessment is represented by an acyclic network of nodes (i.e., parameters), wherein each node contains variables with corresponding probability distribution drawn either from input data or from statistical relationships between ‘parent’ and ‘child’ nodes. Although BBN are unable to capture feedback loops in the acyclic network, they maintain transparency of uncertainties throughout the assessment, as well as in derived recommendations [127]. SEM estimate latent constructs (e.g., potential ES or perceived ES benefit) using statistical analyses on observable variables (e.g., ecologic processes, societal patterns), with the possibility to evaluate direct and indirect feedback loops [128].
Despite current ‘big data’ era motivates modelling applications, a major challenge remains in ensuring data quality, like avoiding redundant information [79]. Also, human and instrumental sources of biases point to a need for improving sampling strategies. Explicit uncertainty assessment and data selection algorithms [129] can help in making a selection of the best-suited data for environmental models. Data selection algorithms used in computer science are useful for environmental applications. In silico iteration of multiple model runs using different data subsets support identification of well-performing models and variable inclusion decisions [129]. Reviewed ES models in mining regions have made use of correction factors for terrain slopes, mining subsidence water bodies and seasonal rivers. Ideally, such coefficients should be transferable to increase model reusability in ESA [130]. Moreover, data applicability also depends on known associated links, limiting practitioners to model those relationships where validated knowledge is available [127].
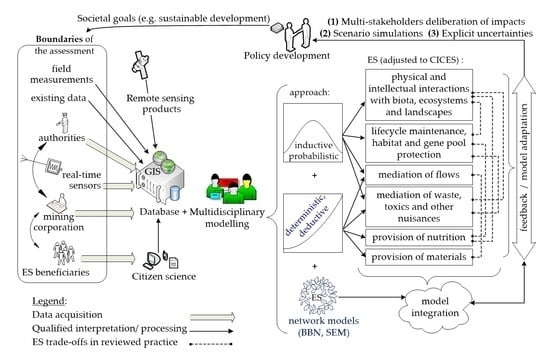
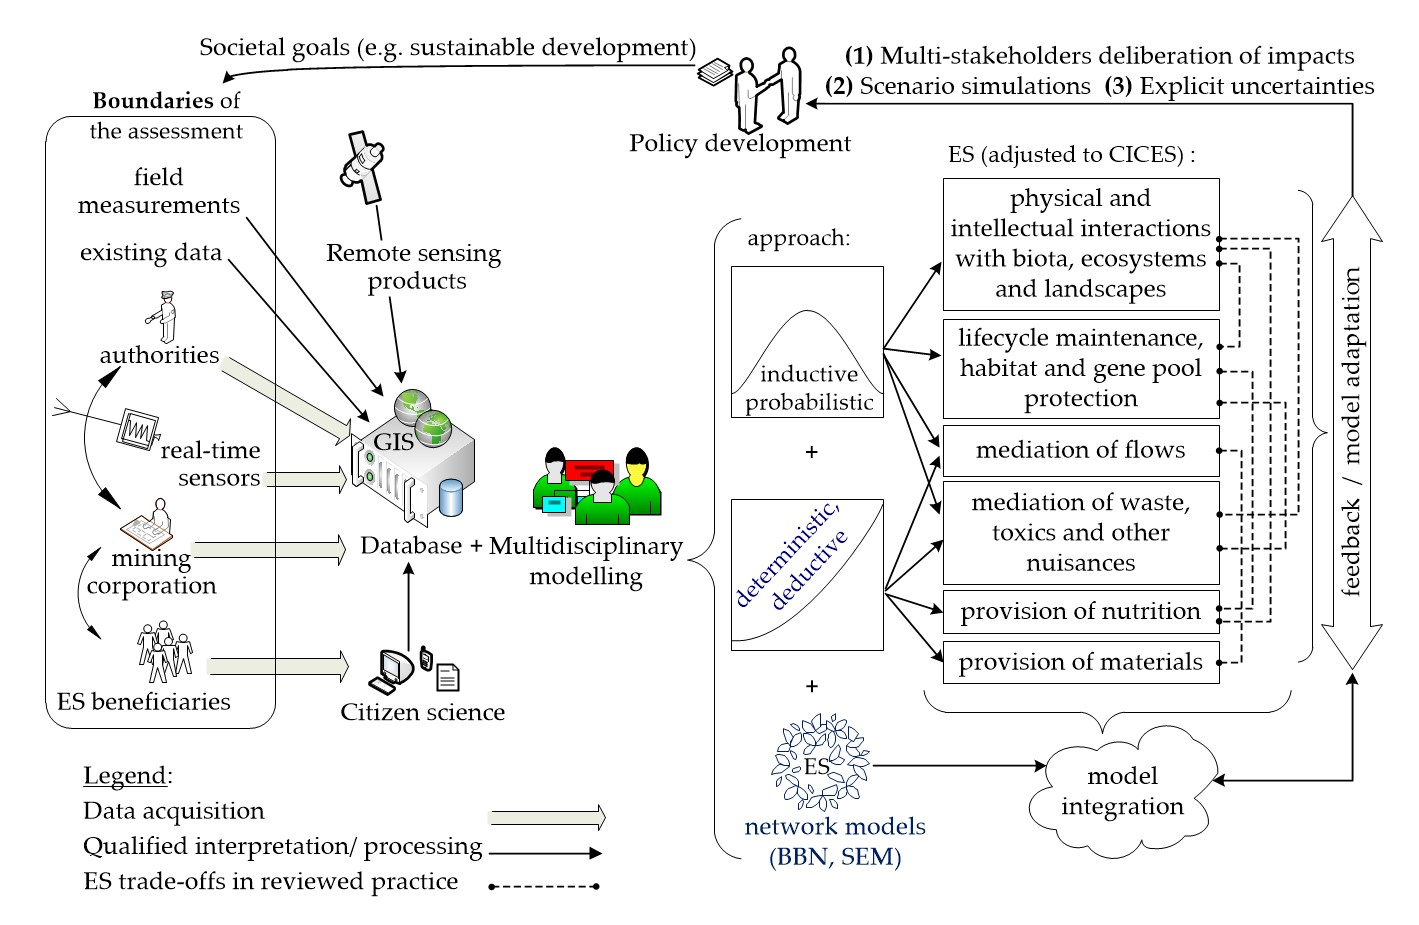
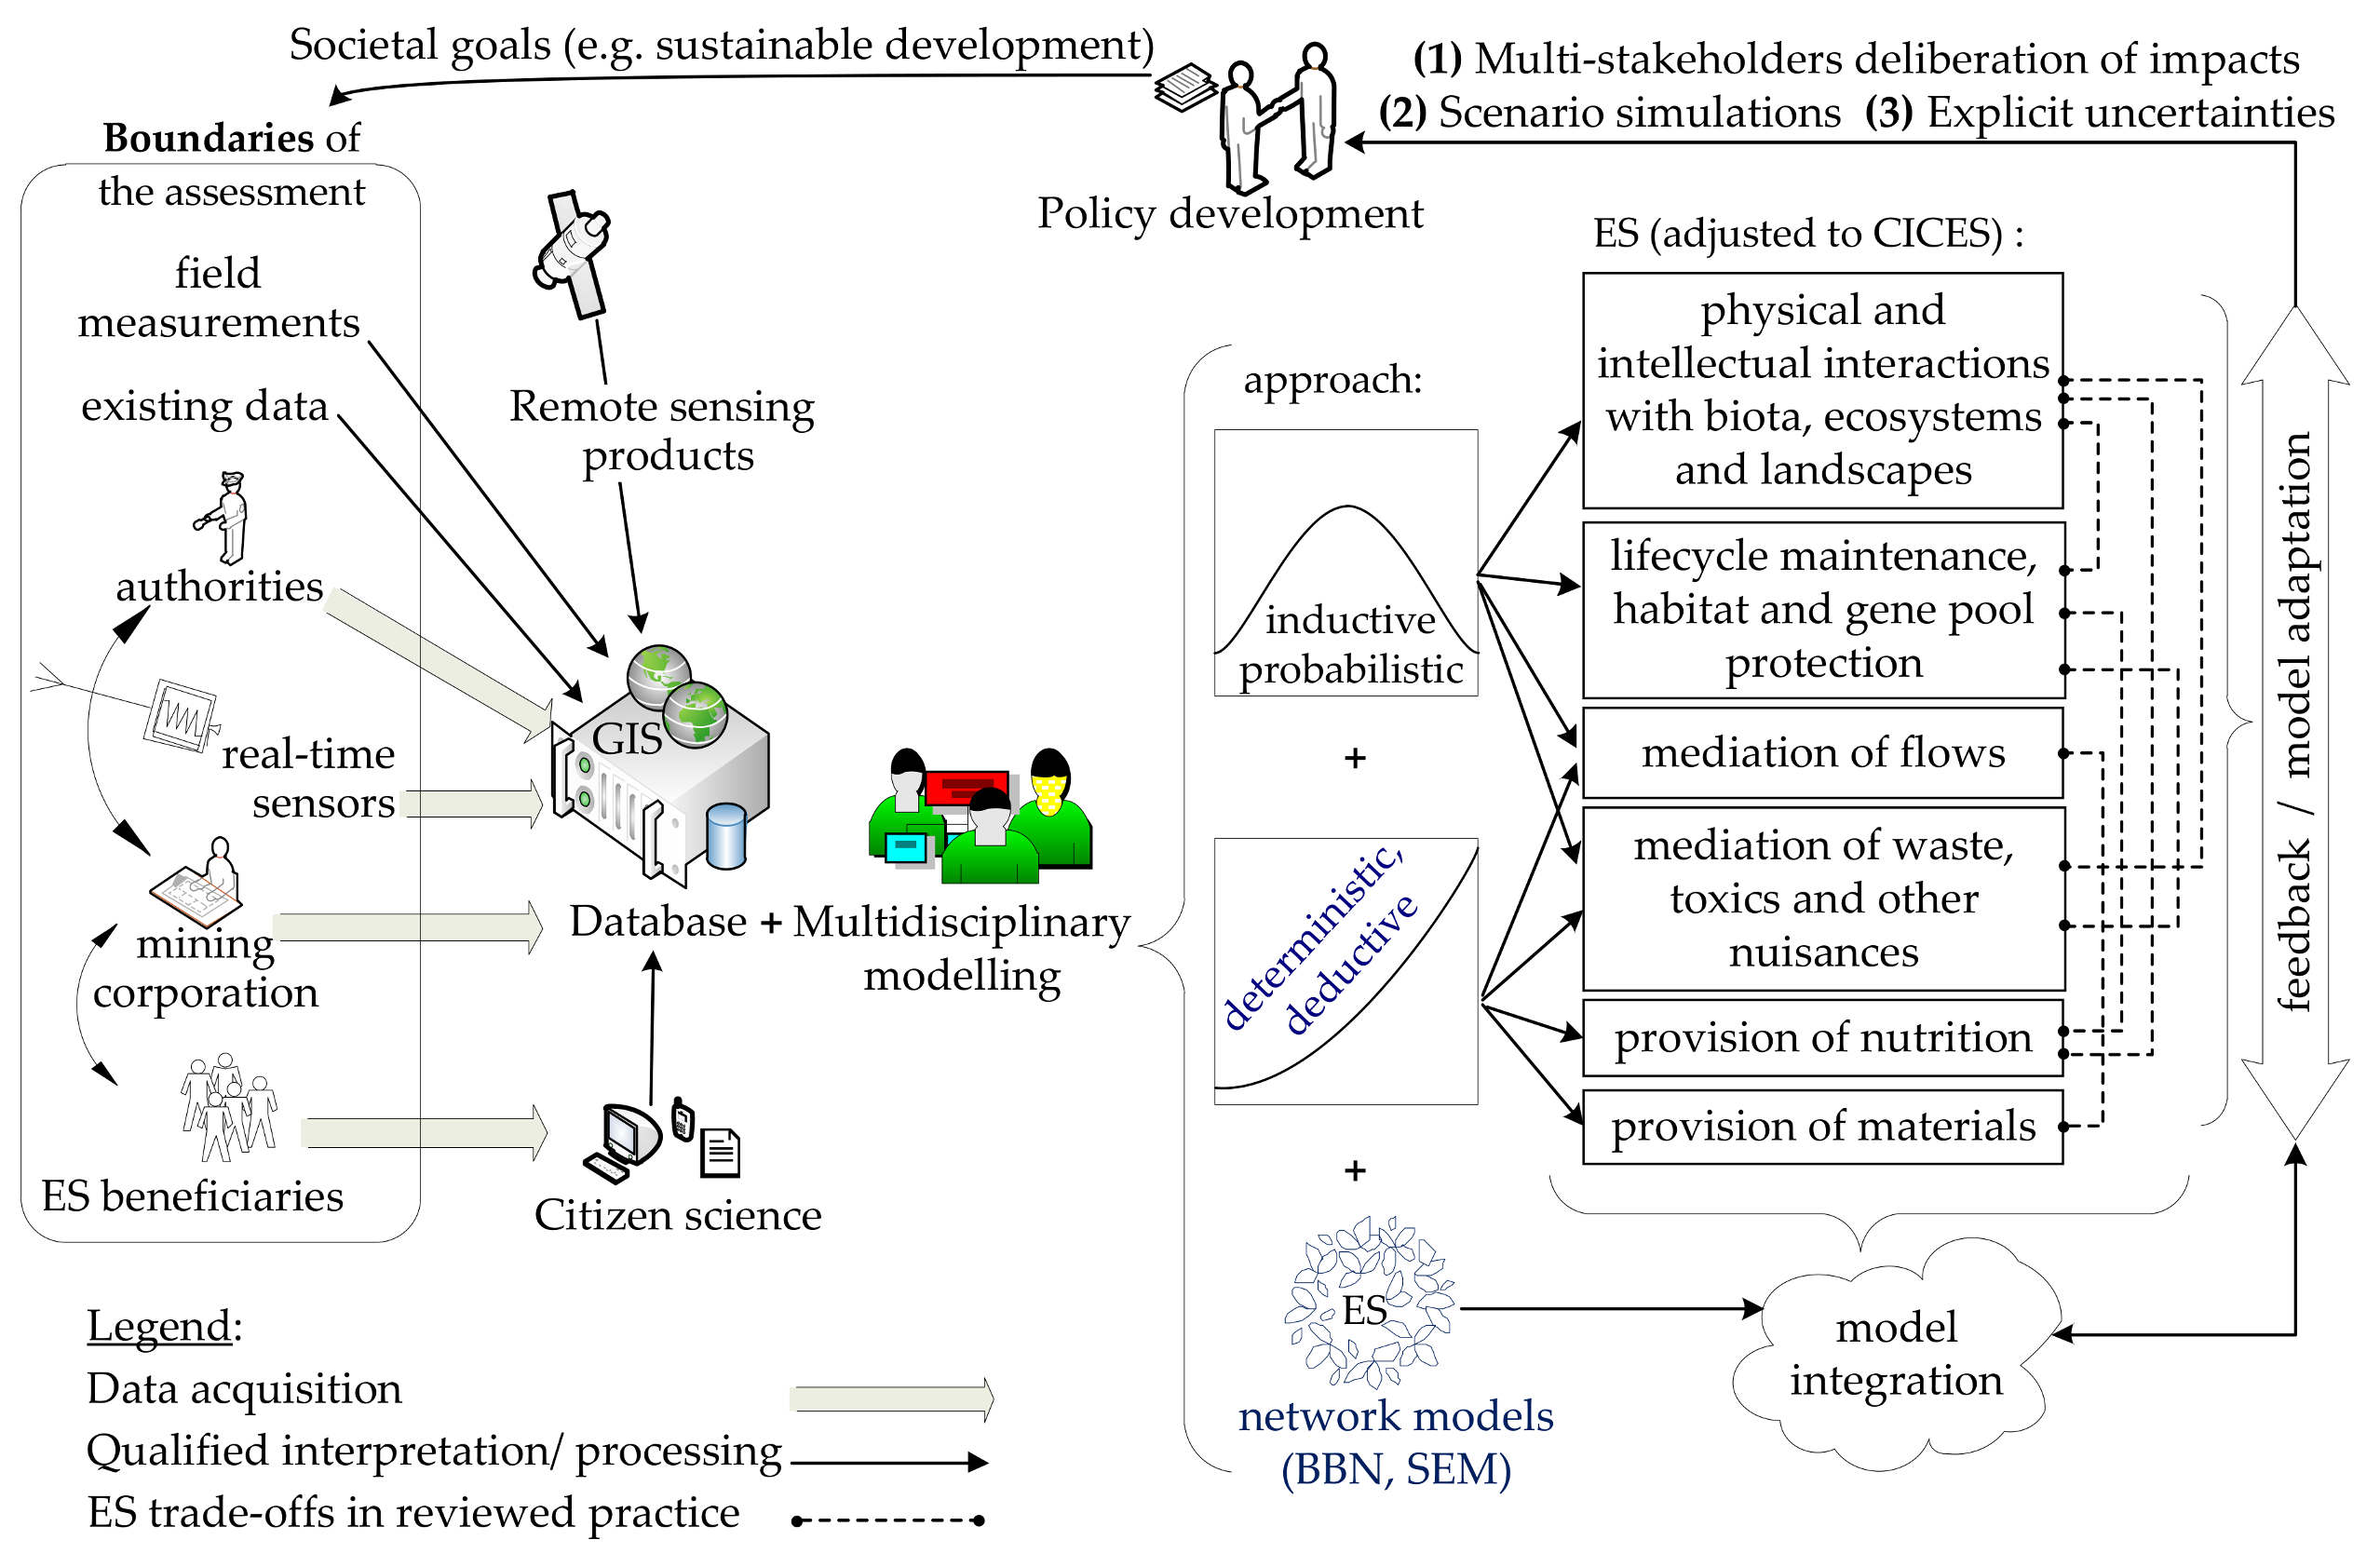
A framework for directing data science to environmental modelling for deliberation of mining impacts on freshwater ES is shown in Figure 4. The first step consists in defining clear boundary conditions motivated by sustainable societal goals, over economic preferences. Sources for data acquisition can then be selected, interpreted and stored in a database. Ideally, a combination of consistent field measurements, meta-data, public monitoring stations, mining corporation data and information from ES beneficiaries should be fed to the database. Next comes the endeavour of multiple specialists in making the most efficient use of the available data. Besides each ES having different model requirements, the holistic nature of the assessment should be driven by high model interaction and interconnectivity. A gap in reviewed practice was the inclusion of cause–effect network models like BBN or SEM, a proven tool for modelling the interaction of multiple components related to a service. These services must be compared for trade-off analyses. Notably, the integration of models is important for model adaptation in mining applications, providing feedback from model runs [59]. Finally, three conditions must be met for creating policy-relevant results: (1) The explicit deliberation of impacts from a multi-stakeholder perspective; (2) the simulation of hypothetical scenarios; and (3) the transparent communication of uncertainties in the assessment (Figure 4).
Environmental data needs cautious interpretation due to uncontrolled sources of biases. Likewise, monitoring of stakeholders’ perception of ES must account for potentially polarised opinions regarding mining impacts, as well as cultural features that might influence a response. The latter can also be captured spatially, since different groups of stakeholders can have different interaction with ecosystems. A revision of LULC classification by introducing indigenous knowledge and terminology for reclassification of cover and soil types can eventually bring clearer communication for scoping and scoring ES [131], because equity in the assessment implies consulting as many different groups’ stakeholders as possible [96]. In fact, different interests might relate to the potential ES gains, including new traditions as a result of landscape change, or tourism opportunities for ancient mining towns. Consideration of the historical context of landscape and social dynamics are also needed for better interpretation of ES monitoring results.
To reduce the high uncertainty due to unsteady mining operations, dynamics of human–environment interactions suggest adaptive modelling approaches. Combined assessment of trade-offs, scenarios and uncertainties are not developed in mining contexts yet. The use of such triad in a case study can provide more transparent insight into how successful mining restoration or resource management alternatives would be. Moreover, preservation of ES, avoidance of severe consequences on human well-being, and the restoration of damaged water resource, will strongly depend on the resilience and recovery potential of disturbed ecosystems, which is generally low in mined lands.
4.2. Process-Oriented Modelling
Statistical (i.e., data-driven) relationships have proven useful for knowledge discovery from datasets [132], providing empirical evidence on the potential success of a management decision. Such inductive-probabilistic approaches (i.e., based on site-specific observations) bring implicit knowledge with no major information on the mechanisms behind the relationship of interest. Deductive approaches, on the contrary, make use of background knowledge and expert rules to provide answers. Such theory-based approaches use mathematical relationships describing ‘how’ changes are produced in a system; i.e., reflecting the process and mechanisms behind a cause–effect relationship. Having process-mechanistic understanding, a set of variables can be used in equations for determining a desired outcome (i.e., deductive-deterministic approach). Process-based algorithms can also incorporate new changes affecting the process performance (e.g., like hypothetical scenarios of future climatic conditions), allowing the assessment of complex and dynamic systems [133].
In mining contexts, the coexistence of other land uses (e.g., agriculture, forestry or tourism) and global change increase the complexity of mining impacts on SES [59], but capturing the full range of processes from SES can be a tedious task. In 2002, the ‘GUMBO’ model for ESA, consisted of 234 state variables, 930 variables total, and 1715 parameters [103], and is being continuously developed for more processes and more complexity [134]. Such demanding algorithms might be ineffective at the local level if they cannot incorporate accurate and high-resolution data while accounting for local influences on ES [135].
Replacing process-based assessments is a non-optimal, but salient, solution. When secondary data is the only available information, water’s social and political dimensions can be used for ESA [136]. For instance, assessing water provision indirectly from crop production is possible, but not optimal for describing hydro-social water cycles. Secondary data may not provide understanding of processes behind landscape quality, but some specific processes and organisms can be scrutinized with respect to the degree that they contribute to the performance of certain services. However, arbitrary adjustments should be avoided [44]. The MIMES model [134] suggests these sequential phases for ESA: (1) ‘initial conception, including guiding principles, overarching framework, and methodologies’; and (2) ‘development of the theoretical approach for a specific case study to provide proof of concept’; and (3) ‘application to a real-world case study’. The first technical phase defines boundary conditions to ensure saliency and legitimacy of assessments, including selection of stakeholder-engaging frameworks. The second phase requires fundamental knowledge, guaranteeing the inclusion of biophysical realism.
Despite the existing consensus on basing ESA biophysically [102,137] before adding social and economic dimensions, assessments in mining contexts have not made use of mining-specific ecological knowledge developed elsewhere. For instance, Zipper et al. (2011) [41] compiled evidence on how forest reclamation, a good will approach, can result in competition for nutrients, water and sunlight. Brown et al. (2014) assessed long-term remediation of metals [138], denoting the potential of using ‘metal bioavailability’ as an indicator of ecosystem functions. The influence of mining pollution and land change has already been described for widely applied bioindicators, namely macroinvertebrates and plant assemblages [11,101], as well as macroinvertebrates’ functional traits [11]. Lastly, terminological divergence also hampers the focus on ecological processes. Different definitions for ‘ecosystem functions’ imply different understanding of the delivered processes, or service: is it describing interactions mainly? or the whole system? or its dependence on other elements? or the deliverance to humans [139]? Therefore, delimitation of the study objectives is crucial for the initial conception of models.
In view of the fact that probabilistic approaches are extensively used in ESA, particularly for integrating human feedbacks to ecological processes, the scientific community should endeavour to capture process mechanistic knowledge for ES production processes. Process-oriented algorithms to model soil loss, hydrological processes or carbon fluxes are successfully integrated in ESA for mining regions, whilst probabilistic models are hardly transferable. Therefore, for mining-ES models to be generalized, assessment should transcend from inductive calculations to more deductive, mechanistic algorithms that indicate the performance of an ES production function.
4.3. Monitoring Freshwater ES in Mining Contexts
Being SES-prone to continuous changes, the modelling process has to be treated as such [113]. Generating new knowledge and data for model improvement implies that the state of ES is measured consistently. While robust guidelines for selecting ES indicators exist in literature [49,140], particularities of the mining context should be considered. In addition, as mentioned in point 4.2, process-oriented modelling is likely to provide more plausible ES indications (e.g., monitoring processes like ‘aquifer recharge’ or ‘water retention’ for a quantitative assessment of water resources). Buytaert and Breuer (2013) [141] suggest that while there is much focus on water quantity assessment in mining countries, water quality assessments remain deficient, posing a ‘much more silent threat’. Pollutants’ concentration is also influenced by population growth, climatic conditions, seasonality, forestation and agricultural practices in mining regions. In Figure 3, we address ‘water quality’ as having a direct impact on the ecosystem services named ‘mediation of waste, toxics and other nuisances’ and those in the ‘lifecycle maintenance, habitat and gene pool protection’ group (Figure 3). Also, a decrease in water quality is likely to change the state of ‘aquatic communities [77]. The latter principle is widely applied in water quality monitoring, but its mainstreaming in mining-specific ESA would require the inclusion of existing knowledge about bioindicators in mining regions. For instance, it is demonstrated that mining impacts are captured if metals are measured directly in biota [101], or if benthic communities are assessed at the order level [142]. Although mechanisms for pollutant transport might not be captured, a rapid assessment is facilitated by monitoring these parameters.
4.4. Implications for Institutional Stakeholders
It is pertinent for governments and mining corporations to invest in impact assessment developments. The risk of inaction in this field represents potential future costs for the public sector. After the mining lease expires and corporate responsibility is minimized, the long-run consequences can hamper future citizen’s and rural well-being. Governments should set goals of EIA development with site-specific knowledge, and regulate the definition of management units, promote ES understanding and create, or adopt, modelling and management frameworks. Agri-environmental schemes, payments for ES (PES) (avoiding over-reliance on win-win solutions [143]), and other multi-compensation measures are promising, considering that societal goals are holistically taken into account [144].
5. Conclusions
Our review confirms a trend in time to account for more pluralistic valuation approaches in ESA for mining context. Current practice also denotes little biophysical realism in modelling approaches, and a preference for simplified algorithms. Regarding freshwater ES, there is a clear need to develop understanding of soil–water relationships in mining contexts, as well as for other water-related ES production processes. We also denoted that environmental management in mining contexts, based on ES, is mainly focused on ‘end-of-the-pipe’ treatments, while predicting impacts, planning and prevention measures would be more cost-effective. In general, models require more knowledge of mechanistic understanding of ES production process. The proposed framework (Figure 4) should focus on ensuring continuous data collection for an integrated assessment in which process-oriented modelling is a priority over probabilistic approaches for the production function calculation, and in which probabilistic models are limited for purposes where mechanistic understanding is missing or when interaction with non-experts is needed.
Acknowledgments
This research was funded by Cienciactiva, an initiative of CONCYTEC (grant contract No. 002-2016-FONDECYT, and by a VLIR-TEAM programme ZEIN2013PR395: ‘Impact on surface water resources and aquatic biodiversity by opencast mining activities in Cajamarca, Peru’.
Conflicts of Interest
The authors declare no conflict of interest.
Appendix A

Table A1.
Presence of policy-oriented aspects in models.
| Author (Year) | Water ES Model Foundation. | Final Output 1 | Public Participation | Simulation | Expert Knowledge | Trade-Off Assessment | Explicit Uncertainty |
|---|---|---|---|---|---|---|---|
| 1. Zhang et al. (2010) | LULC-based provision. | V | |||||
| 2. Bai et al. (2011) | Water productivity from statistics. | V+R | X | ||||
| 3. Li et al. (2011) | Water loss cost analysis. | V | |||||
| 4. Hogan et al. (2012) | LULC-based water quality. Validated models. | V | X | X | |||
| 5. Haase et al. (2012) | LULC-based cultural value regulation. | V | X | ||||
| 6. Larondelle et al. (2012) | Groundwater recharge model. | V | X | ||||
| 7. Boissiere et al. (2013) | Not directly assessed. Only rainfall. | K | X | ||||
| 8. Breffle et al. (2013) | Cultural water ES from rainfall. | K | X | X | |||
| 9. Evans et al. (2013) | Not directly assessed. | K | X | ||||
| 10. Bian and Lu (2013) | LULC-based. | V | |||||
| 11.Zhang et al. (2013) | LULC-based. | V | X | ||||
| 12. Woziwoda et al. (2014) | Not directly assessed. | R | X | ||||
| 13. Fu et al. (2015) | Water yield modelling. | V | X | ||||
| 14. Pandit et al. (2015) | Market price in a river stretch. | V | X | ||||
| 15. Fan and Ding (2015) | LULC-based. | V | X | X | |||
| 16. Mazzotta et al. (2015) | Fish habitat. Recreational fishing. | V+R | X | X | |||
| 17. Zhang et al. (2016) | LULC-based. Use of rainfall. | V+R | X | X | |||
| 18. Pullanikkatil et al. (2016) | LULC-based cultural value. | R | X | ||||
| 19. Blaen et al. (2016) | Not directly assessed. | V | X | X | |||
| 20. Fan et al. (2016) | LULC-based. Use of rainfall. | V | X | ||||
| 21. Molina et al. (2016) | Cultural value of photographs. | V | X | X | X | ||
| 22. Preece et al. (2016) | LULC-based. | V | X | X | |||
| 23. Duarte et al. (2016) | Not directly assessed. | V | X | X | X | ||
| 24. Wilker et al. (2016) | Not directly assessed, only scoped. | V | X | X | |||
| 25. Burges et al. (2016) | Proxies from field experiments. | V | X | ||||
| 26. Rosa et al. (2016) | Not directly assessed, only scoped. | R | X |
1 Level of assessment outcome: R = study delivers management responses or recommendations. V = study delivers valuation of ES. K = study delivers only qualitative knowledge about ES.
Table A2.
Quantitative results of the applied reviewing criteria.
| Criteria | Class | Amount | Ratio | Criteria | Class | Amount | Ratio |
|---|---|---|---|---|---|---|---|
| Mining focus | primary | 20  | 77% | Ecological functionality | null | 6  | 19% |
| secondary | 6  | 23% | low | 12  | 46% | ||
| Basis for ES valuation | LULC | 16  | 62% | mid | 6  | 19% | |
| cultural | 10  | 39% | high | 2  | 8% | ||
| ƒ(eco) # | 11  | 42% | Human–ecosystem integration | low | 2  | 8% | |
| +proxies * | 24  | 92% | mid | 16  | 62% | ||
| Main data sources | GIS | 16  | 62% | high | 8  | 30% | |
| Interviews | 13  | 50% | Model complexity | low | 7  | 27% | |
| field | 9  | 35% | mid | 10  | 39% | ||
| experiment | 2  | 8% | high | 9  | 35% | ||
| secondary data | 18  | 70% | ESA Output | value | 20  | 77% | |
| Indicator of water ES | area | 14  | 54% | response | 6  | 23% | |
| flow | 7  | 27% | only knowledge | 3  | 12% | ||
| quality | 3  | 12% | Scenario simulation | 7  | 27% | ||
| soil moisture | 2  | 8% | Trade-offs | 3  | 12% | ||
| Expert knowledge | 6  | 23% | Uncertainties | 6  | 23% | ||
* +proxies = non-land-use-based proxies. # ƒ(eco) = ecosystem functions.
References
- MEA. Ecosystems and Human Well-Being: Millennium Ecosystem Assessment; Island Press: Washington, DC, USA, 2005; Volume 5. [Google Scholar]
- Goethals, P.; Volk, M. Implementing sustainability in water management: Are we still dancing in the dark? Sustain. Water Qual. Ecol. 2016. [Google Scholar] [CrossRef]
- Hackbart, V.C.S.; de Lima, G.T.N.P.; dos Santos, R.F. Theory and practice of water ecosystem services valuation: Where are we going? Ecosyst. Serv. 2017, 23, 218–227. [Google Scholar] [CrossRef]
- Palmer, M.A.; Bernhardt, E.S.; Schlesinger, W.H.; Eshleman, K.N.; Foufoula-Georgiou, E.; Hendryx, M.S.; Lemly, A.D.; Likens, G.E.; Loucks, O.L.; Power, M.E.; et al. Mountaintop Mining Consequences. Science 2010, 327, 148–149. [Google Scholar] [CrossRef] [PubMed]
- ELAW. Guidebook for Evaluating Mining Project EIAs; Environmental Law Alliance Worldwide: Eugene, OR, USA, 2010. [Google Scholar]
- Chakraborti, D.; Rahman, M.M.; Murrill, M.; Das, R.; Patil, S.G.; Sarkar, A.; Dadapeer, H.J.; Yendigeri, S.; Ahmed, R.; Das, K.K. Environmental arsenic contamination and its health effects in a historic gold mining area of the Mangalur greenstone belt of Northeastern Karnataka, India. J. Hazard. Mater. 2013, 262, 1048–1055. [Google Scholar] [CrossRef] [PubMed]
- Gibb, H.; O’Leary, K.G. Mercury Exposure and Health Impacts among Individuals in the Artisanal and Small-Scale Gold Mining Community: A Comprehensive Review. Environ. Health Perspect. 2014, 122, 667–672. [Google Scholar] [CrossRef] [PubMed]
- Vela-Almeida, D.; Kuijk, F.; Wyseure, G.; Kosoy, N. Lessons from Yanacocha: Assessing mining impacts on hydrological systems and water distribution in the Cajamarca region, Peru. Water Int. 2016, 41, 426–446. [Google Scholar] [CrossRef]
- Ochieng, G.M.; Seanego, E.S.; Nkwonta, O.I. Impacts of mining on water resources in South Africa: A review. Sci. Res. Essays 2010, 5, 3351–3357. [Google Scholar]
- Byrne, P.; Wood, P.J.; Reid, I. The Impairment of River Systems by Metal Mine Contamination: A Review Including Remediation Options. Crit. Rev. Environ. Sci. Technol. 2012, 42, 2017–2077. [Google Scholar] [CrossRef]
- Dedieu, N.; Rhone, M.; Vigouroux, R.; Cereghino, R. Assessing the impact of gold mining in headwater streams of Eastern Amazonia using Ephemeroptera assemblages and biological traits. Ecol. Indic. 2015, 52, 332–340. [Google Scholar] [CrossRef]
- Graedel, T.E.; Allwood, J.; Birat, J.P.; Buchert, M.; Hageluken, C.; Reck, B.K.; Sibley, S.F.; Sonnemann, G. What Do We Know About Metal Recycling Rates? J. Ind. Ecol. 2011, 15, 355–366. [Google Scholar] [CrossRef]
- UNEP. Recycling Rates of Metals—A Status Report; International Resource Panel, Working Group on the Global Metal Flows, Ed.; UNEP: Paris, France, 2011. [Google Scholar]
- UNDP-WEF-CCSI-SDSN. Mapping Mining to the Sustainable Development Goals: An Atlas; United Nations Development Programme (UNDP), World Economic Forum (WEF), Columbia Center on Sustainable Investment (CCSI) and Sustainable Development Solutions Network (SDSN): New York, NY, USA, 2016. [Google Scholar]
- UNEP. Environmental Impact Assessment Training Resource Manual; Sadler, B., McCabe, M., Eds.; UNEP: Paris, France, 2002. [Google Scholar]
- Fonseca, A.; McAllister, M.L.; Fitzpatrick, P. Sustainability reporting among mining corporations: A constructive critique of the GRI approach. J. Clean. Prod. 2014, 84, 70–83. [Google Scholar] [CrossRef]
- Aguilar-Stoen, M.; Hirsch, C. Environmental Impact Assessments, local power and self-determination: The case of mining and hydropower development in Guatemala. Extr. Ind. Soc. Int. J. 2015, 2, 472–479. [Google Scholar] [CrossRef]
- Sandham, L.A.; Hoffmann, A.R.; Retief, E.P. Reflections on the quality of mining EIA reports in South Africa. J. S. Afr. Inst. Min. Metall. 2008, 108, 701–706. [Google Scholar]
- Jeronimo, R.P.; Rap, E.; Vos, J. The politics of Land Use Planning: Gold mining in Cajamarca, Peru. Land Use Policy 2015, 49, 104–117. [Google Scholar] [CrossRef]
- Azapagic, A. Developing a framework for sustainable development indicators for the mining and minerals industry. J. Clean. Prod. 2004, 12, 639–662. [Google Scholar] [CrossRef]
- Costanza, R.; dArge, R.; deGroot, R.; Farber, S.; Grasso, M.; Hannon, B.; Limburg, K.; Naeem, S.; ONeill, R.V.; Paruelo, J.; et al. The value of the world’s ecosystem services and natural capital. Nature 1997, 387, 253–260. [Google Scholar] [CrossRef]
- De Groot, R.S.; Wilson, M.A.; Boumans, R.M.J. A typology for the classification, description and valuation of ecosystem functions, goods and services. Ecol. Econ. 2002, 41, 393–408. [Google Scholar] [CrossRef]
- Daily, G.C.; Matson, P.A. Ecosystem services: From theory to implementation. Proc. Natl. Acad. Sci. USA 2008, 105, 9455–9456. [Google Scholar] [CrossRef] [PubMed]
- Geneletti, D. Ecosystem services in environmental impact assessment and strategic environmental assessment. Environ. Impact Assess. Rev. 2013, 40, 1–2. [Google Scholar] [CrossRef]
- Honrado, J.P.; Vieira, C.; Soares, C.; Monteiro, M.B.; Marcos, B.; Pereira, H.M.; Partidário, M.R. Can we infer about ecosystem services from EIA and SEA practice? A framework for analysis and examples from Portugal. Environ. Impact Assess. Rev. 2013, 40, 14–24. [Google Scholar] [CrossRef]
- Rosa, J.C.S.; Sanchez, L.E. Advances and challenges of incorporating ecosystem services into impact assessment. J. Environ. Manag. 2016, 180, 485–492. [Google Scholar] [CrossRef] [PubMed]
- Rega, C.; Spaziante, A. Linking ecosystem services to agri-environmental schemes through SEA: A case study from Northern Italy. Environ. Impact Assess. Rev. 2013, 40, 47–53. [Google Scholar] [CrossRef]
- Baker, J.; Sheate, W.R.; Phillips, P.; Eales, R. Ecosystem services in environmental assessment—Help or hindrance? Environ. Impact Assess. Rev. 2013, 40, 3–13. [Google Scholar] [CrossRef]
- Karjalainen, T.P.; Marttunen, M.; Sarkki, S.; Rytkonen, A.M. Integrating ecosystem services into environmental impact assessment: An analytic-deliberative approach. Environ. Impact Assess. Rev. 2013, 40, 54–64. [Google Scholar] [CrossRef]
- Martin, D.M.; Hermoso, V.; Pantus, F.; Olley, J.; Linke, S.; Poff, N.L. A proposed framework to systematically design and objectively evaluate non-dominated restoration tradeoffs for watershed planning and management. Ecol. Econ. 2016, 127, 146–155. [Google Scholar] [CrossRef]
- Gallart, F.; Llorens, P.; Latron, J.; Cid, N.; Rieradevall, M.; Prat, N. Validating alternative methodologies to estimate the regime of temporary rivers when flow data are unavailable. Sci. Total Environ. 2016, 565, 1001–1010. [Google Scholar] [CrossRef] [PubMed]
- Buytaert, W.; Dewulf, A.; De Bievre, B.; Clark, J.; Hannah, D.M. Citizen Science for Water Resources Management: Toward Polycentric Monitoring and Governance? J. Water Resour. Plan. Manag. 2016, 142. [Google Scholar] [CrossRef]
- Brauman, K.A.; Daily, G.C.; Duarte, T.K.; Mooney, H.A. The Nature and Value of Ecosystem Services: An Overview Highlighting Hydrologic Services. Annu. Rev. Environ. Resour. 2007, 32, 67–98. [Google Scholar] [CrossRef]
- Hallouin, T.; Bruen, M.; Christie, M.; Bullock, C.; Kelly-Quinn, M. Challenges in Using Hydrology and Water Quality Models for Assessing Freshwater Ecosystem Services: A Review. Geosciences 2018, 8, 45. [Google Scholar] [CrossRef]
- Duarte, G.T.; Ribeiro, M.C.; Paglia, A.P. Ecosystem Services Modeling as a Tool for Defining Priority Areas for Conservation. PLoS ONE 2016, 11, e0154573. [Google Scholar] [CrossRef] [PubMed]
- Zhang, J.J.; Fu, M.C.; Zeng, H.; Geng, Y.H.; Hassani, F.P. Variations in Ecosystem Service Values and Local Economy in Response to Land Use: A Case Study of Wu’an, China. L. Degrad. Dev. 2013, 24, 236–249. [Google Scholar] [CrossRef]
- Li, F.; Liu, X.; Zhao, D.; Wang, B.; Jin, J.; Hu, D. Evaluating and modeling ecosystem service loss of coal mining: A case study of Mentougou district of Beijing, China. Ecol. Complex. 2011, 8, 139–143. [Google Scholar] [CrossRef]
- Preece, L.D.; van Oosterzee, P.; Dungey, K.; Standley, P.M.; Preece, N.D. Ecosystem service valuation reinforces world class value of Cape York Peninsula’s ecosystems but environment and indigenous people lose out. Ecosyst. Serv. 2016, 18, 154–164. [Google Scholar] [CrossRef]
- Woziwoda, B.; Kopec, D. Afforestation or natural succession? Looking for the best way to manage abandoned cut-over peatlands for biodiversity conservation. Ecol. Eng. 2014, 63, 143–152. [Google Scholar] [CrossRef]
- Evans, D.M.; Zipper, C.E.; Burger, J.A.; Strahm, B.D.; Villamagna, A.M. Reforestation practice for enhancement of ecosystem services on a compacted surface mine: Path toward ecosystem recovery. Ecol. Eng. 2013, 51, 16–23. [Google Scholar] [CrossRef]
- Zipper, C.E.; Burger, J.A.; Skousen, J.G.; Angel, P.N.; Barton, C.D.; Davis, V.; Franklin, J.A. Restoring Forests and Associated Ecosystem Services on Appalachian Coal Surface Mines. Environ. Manag. 2011, 47, 751–765. [Google Scholar] [CrossRef] [PubMed]
- Lima, A.T.; Mitchell, K.; O’Connell, D.W.; Verhoeven, J.; Van Cappellen, P. The legacy of surface mining: Remediation, restoration, reclamation and rehabilitation. Environ. Sci. Policy 2016, 66, 227–233. [Google Scholar] [CrossRef]
- Lamarque, P.; Quétier, F.; Lavorel, S. The diversity of the ecosystem services concept and its implications for their assessment and management. C. R. Biol. 2011, 334, 441–449. [Google Scholar] [CrossRef] [PubMed]
- Volk, M. Modelling ecosystem services–Challenges and promising future directions. Sustain. Water Qual. Ecol. 2013, 1–2, 3–9. [Google Scholar] [CrossRef]
- Vorstius, A.C.; Spray, C.J. A comparison of ecosystem services mapping tools for their potential to support planning and decision-making on a local scale. Ecosyst. Serv. 2015, 15, 75–83. [Google Scholar] [CrossRef]
- Boerema, A.; Rebelo, A.J.; Bodi, M.B.; Esler, K.J.; Meire, P. Are ecosystem services adequately quantified? J. Appl. Ecol. 2017, 54, 358–370. [Google Scholar] [CrossRef]
- Oosterbroek, B.; de Kraker, J.; Huynen, M.M.T.E.; Martens, P. Assessing ecosystem impacts on health: A tool review. Ecosyst. Serv. 2016, 17, 237–254. [Google Scholar] [CrossRef]
- Carpenter, S.R.; Mooney, H.A.; Agard, J.; Capistrano, D.; DeFries, R.S.; Diaz, S.; Dietz, T.; Duraiappah, A.K.; Oteng-Yeboah, A.; Pereira, H.M.; et al. Science for managing ecosystem services: Beyond the Millennium Ecosystem Assessment. Proc. Natl. Acad. Sci. USA 2009, 106, 1305–1312. [Google Scholar] [CrossRef] [PubMed]
- UNEP-WCMC. Developing Ecosystem Service Indicators: Experiences and Lessons Learned from Sub-Global Assessments and Other Initiatives; Technical Series No. 58; Secretariat of the Convention on Biological Diversity: Montreal, QC, Canada, 2011. [Google Scholar]
- Landuyt, D.; Broekx, S.; Engelen, G.; Uljee, I.; Van der Meulen, M.; Goethals, P.L.M. The importance of uncertainties in scenario analyses—A study on future ecosystem service delivery in Flanders. Sci. Total Environ. 2016, 553, 504–518. [Google Scholar] [CrossRef] [PubMed]
- Hamel, P.; Bryant, B.P. Uncertainty assessment in ecosystem services analyses: Common challenges and practical responses. Glob. Environ. Chang. 2015, 24, 1–33. [Google Scholar] [CrossRef]
- Wolff, S.; Schulp, C.J.E.; Verburg, P.H. Mapping ecosystem services demand: A review of current research and future perspectives. Ecol. Indic. 2015, 55, 159–171. [Google Scholar] [CrossRef]
- Wei, H.; Fan, W.; Wang, X.; Lu, N.; Dong, X.; Zhao, Y.; Ya, X.; Zhao, Y. Integrating supply and social demand in ecosystem services assessment: A review. Ecosyst. Serv. 2017, 25, 15–27. [Google Scholar] [CrossRef]
- Francesconi, W.; Srinivasan, R.; Perez-Minana, E.; Willcock, S.P.; Quintero, M. Using the Soil and Water Assessment Tool (SWAT) to model ecosystem services: A systematic review. J. Hydrol. 2016, 535, 625–636. [Google Scholar] [CrossRef]
- Kelble, C.R.; Loomis, D.K.; Lovelace, S.; Nuttle, W.K.; Ortner, P.B.; Fletcher, P.; Cook, G.S.; Lorenz, J.J.; Boyer, J.N. The EBM-DPSER Conceptual Model: Integrating Ecosystem Services into the DPSIR Framework. PLoS ONE 2013, 8. [Google Scholar] [CrossRef] [PubMed] [Green Version]
- EEA Common International Classification of Ecosystem Services (CICES). Available online: www.cices.eu (accessed on 4 October 2017).
- Voinov, A.; Kolagani, N.; McCall, M.K.; Glynn, P.D.; Kragt, M.E.; Ostermann, F.O.; Pierce, S.A.; Ramu, P. Modelling with stakeholders—Next generation. Environ. Model. Softw. 2016, 77, 196–220. [Google Scholar] [CrossRef]
- Lee, H.; Lautenbach, S. A quantitative review of relationships between ecosystem services. Ecol. Indic. 2016, 66, 340–351. [Google Scholar] [CrossRef]
- Lechner, A.M.; McIntyre, N.; Witt, K.; Raymond, C.M.; Arnold, S.; Scott, M.; Rifkin, W. Challenges of integrated modelling in mining regions to address social, environmental and economic impacts. Environ. Model. Softw. 2017, 93, 268–281. [Google Scholar] [CrossRef]
- Burges, A.; Epelde, L.; Benito, G.; Artetxe, U.; Becerril, J.M.; Garbisu, C. Enhancement of ecosystem services during endophyte-assisted aided phytostabilization of metal contaminated mine soil. Sci. Total Environ. 2016, 562, 480–492. [Google Scholar] [CrossRef] [PubMed]
- Fan, Q.D.; Ding, S.Y. Response of ecosystem services to land use change in county scale of Fengqiu, Henan Province, China. Arab. J. Geosci. 2015, 8, 9015–9022. [Google Scholar] [CrossRef]
- Fan, Q.; Ding, S. Landscape pattern changes at a county scale: A case study in Fengqiu, Henan Province, China from 1990 to 2013. Catena 2016, 137, 152–160. [Google Scholar] [CrossRef]
- Pandit, A.; Ekka, A.; Sharma, A.P.; Bhattacharjya, B.K.; Katiha, P.K.; Biswas, D.K. Economic valuation of natural ecosystems—An empirical study in a stretch of Bramhaputra River in Assam, North-East India. Indian J. Fish. 2015, 62, 107–112. [Google Scholar]
- Boissiere, M.; Locatelli, B.; Sheil, D.; Padmanaba, M.; Sadjudin, E. Local Perceptions of Climate Variability and Change in Tropical Forests of Papua, Indonesia. Ecol. Soc. 2013, 18. [Google Scholar] [CrossRef]
- Fu, Q.; Li, B.; Yang, L.L.; Wu, Z.L.; Zhang, X.S. Ecosystem Services Evaluation and Its Spatial Characteristics in Central Asia’s Arid Regions: A Case Study in Altay Prefecture, China. Sustainability 2015, 7, 8335–8353. [Google Scholar] [CrossRef]
- Dudka, S.; Domy C, A. Environmental impacts of metal ore mining and processing: A review. J. Environ. Qual. 1997, 26, 590. [Google Scholar] [CrossRef]
- Pietron, J.; Chalov, S.R.; Chalova, A.S.; Alekseenko, A.V.; Jarsjö, J. Extreme spatial variability in riverine sediment load inputs due to soil loss in surface mining areas of the Lake Baikal basin. Catena 2017, 152, 82–93. [Google Scholar] [CrossRef]
- Dedieu, N.; Allard, L.; Vigouroux, R.; Brosse, S.; Céréghino, R. Physical habitat and water chemistry changes induced by logging and gold mining in French Guiana streams. Knowl. Manag. Aquat. Ecosyst. 2014, 2. [Google Scholar] [CrossRef]
- Rajaee, M.; Obiri, S.; Green, A.; Long, R.; Cobbina, S.J.; Nartey, V.; Buck, D.; Antwi, E.; Basu, N. Integrated Assessment of Artisanal and Small-Scale Gold Mining in Ghana-Part 2: Natural Sciences Review. Int. J. Environ. Res. Public Health 2015, 12, 8971–9011. [Google Scholar] [CrossRef] [PubMed]
- De Oliveira, J.A.P.; Ali, S.H. Gemstone mining as a development cluster: A study of Brazil’ s emerald mines. Resour. Policy 2011, 36, 132–141. [Google Scholar] [CrossRef]
- Tong, L.; Liu, L.; Yu, Q.; Liu, S. Tunneling in abandoned coal mine areas: Problems, impacts and protection measures. Tunn. Undergr. Sp. Technol. Inc. Trenchless Technol. Res. 2013, 38, 409–422. [Google Scholar] [CrossRef]
- Kefeni, K.K.; Msagati, T.A.M.; Mamba, B.B. Acid mine drainage: Prevention, treatment options, and resource recovery: A review. J. Clean. Prod. 2017, 151, 475–493. [Google Scholar] [CrossRef]
- DEA. Mining and Biodiversity Guideline: Mainstreaming Biodiversity into the Mining Sector; Typo Colour Specialists cc: Pretoria, South Africa, 2013; ISBN 9780621417470. [Google Scholar]
- Vela-Almeida, D.; Brooks, G.; Kosoy, N. Setting the limits to extraction: A biophysical approach to mining activities. Ecol. Econ. 2015, 119, 189–196. [Google Scholar] [CrossRef]
- Zhang, J.; Fu, M.; Tao, J.; Huang, Y.; Hassani, F.P.; Bai, Z. Response of ecological storage and conservation to land use transformation: A case study of a mining town in China. Ecol. Model. 2010, 221, 1427–1439. [Google Scholar] [CrossRef]
- Larondelle, N.; Haase, D. Valuing post-mining landscapes using an ecosystem services approach—An example from Germany. Ecol. Indic. 2012, 18, 567–574. [Google Scholar] [CrossRef]
- Mazzotta, M.; Wainger, L.; Sifleet, S.; Petty, J.T.; Rashleigh, B. Benefit transfer with limited data: An application to recreational fishing losses from surface mining. Ecol. Econ. 2015, 119, 384–398. [Google Scholar] [CrossRef]
- Bai, Y.L.; Wang, R.S.; Jin, J.S. Water eco-service assessment and compensation in a coal mining region—A case study in the Mentougou District in Beijing. Ecol. Complex. 2011, 8, 144–152. [Google Scholar] [CrossRef]
- Hogan, D.M.; Labiosa, W.; Pearlstine, L.; Hallac, D.; Strong, D.; Hearn, P.; Bernknopf, R. Estimating the Cumulative Ecological Effect of Local Scale Landscape Changes in South Florida. Environ. Manag. 2012, 49, 502–515. [Google Scholar] [CrossRef] [PubMed]
- Wilker, J.; Rusche, K.; Benning, A.; MacDonald, M.A.; Blaen, P. Applying ecosystem benefit valuation to inform quarry restoration planning. Ecosyst. Serv. 2016, 20, 44–55. [Google Scholar] [CrossRef]
- Eigenbrod, F.; Armsworth, P.R.; Anderson, B.J.; Heinemeyer, A.; Gillings, S.; Roy, D.B.; Thomas, C.D.; Gaston, K.J. The impact of proxy-based methods on mapping the distribution of ecosystem services. J. Appl. Ecol. 2010, 47, 377–385. [Google Scholar] [CrossRef]
- Pinto, R.; De Jonge, V.N.; Marques, J.C. Linking biodiversity indicators, ecosystem functioning, provision of services and human well-being in estuarine systems: Application of a conceptual framework. Ecol. Indic. 2014, 36, 644–655. [Google Scholar] [CrossRef]
- Jacob, C.; Vaissiere, A.-C.; Bas, A.; Calvet, C. Investigating the inclusion of ecosystem services in biodiversity offsetting. Ecosyst. Serv. 2016, 21, 92–102. [Google Scholar] [CrossRef]
- Haase, D.; Schwarz, N.; Strohbach, M.; Kroll, F.; Seppelt, R. Synergies, trade-offs, and losses of ecosystem services in urban regions: An integrated multiscale framework applied to the leipzig-halle region, Germany. Ecol. Soc. 2012, 17. [Google Scholar] [CrossRef]
- Molina, J.R.; y Silva, F.R.; Herrera, M.Á. Integrating economic landscape valuation into Mediterranean territorial planning. Environ. Sci. Policy 2016, 56, 120–128. [Google Scholar] [CrossRef]
- Blaen, P.; MacDonald, M.; Bradbury, R. Ecosystem services provided by a former gravel extraction site in the uk under two contrasting restoration states. Conserv. Soc. 2016, 14, 48–56. [Google Scholar] [CrossRef]
- Pullanikkatil, D.; Palamuleni, L.G.; Ruhiiga, T.M. Land use/land cover change and implications for ecosystems services in the Likangala River Catchment, Malawi. Phys. Chem. Earth 2016, 93, 96–103. [Google Scholar] [CrossRef]
- Breffle, W.S.; Muralidharan, D.; Donovan, R.P.; Liu, F.; Mukherjee, A.; Jin, Y. Socioeconomic evaluation of the impact of natural resource stressors on human-use services in the Great Lakes environment: A Lake Michigan case study. Resour. Policy 2012, 38, 152–161. [Google Scholar] [CrossRef]
- Barbosa, C.C.D.; Atkinson, P.M.; Dearing, J.A. Remote sensing of ecosystem services: A systematic review. Ecol. Indic. 2015, 52, 430–443. [Google Scholar] [CrossRef]
- Schulp, C.J.; Burkhard, B.; Maes, J.; Van Vliet, J.; Verburg, P.H. Uncertainties in ecosystem service maps: A comparison on the European scale. PLoS ONE 2014, 9. [Google Scholar] [CrossRef] [PubMed] [Green Version]
- Nelson, E.J.; Daily, G.C. Modelling ecosystem services in terrestrial systems. F1000 Biol. Rep. 2010, 6, 1–6. [Google Scholar] [CrossRef] [PubMed]
- Cardinale, B.J.; Duffy, J.E.; Gonzalez, A.; Hooper, D.U.; Perrings, C.; Venail, P.; Narwani, A.; Mace, G.M.; Tilman, D.; Wardle, A.D.; et al. Biodiversity loss and its impact on humanity. Nature 2012, 489, 326. [Google Scholar] [CrossRef]
- Graves, R.A.; Pearson, S.M.; Turner, M.G. Species richness alone does not predict cultural ecosystem service value. Proc. Natl. Acad. Sci. USA 2017, 114, 201701370. [Google Scholar] [CrossRef] [PubMed]
- Spangenberg, J.H.; Settele, J. Precisely incorrect? Monetising the value of ecosystem services. Ecol. Complex. 2010, 7, 327–337. [Google Scholar] [CrossRef]
- Tesfatsion, L.; Rehmann, C.R.; Cardoso, D.S.; Jie, Y.; Gutowski, W.J. An agent-based platform for the study of watersheds as coupled natural and human systems. Environ. Model. Softw. 2017, 89, 40–60. [Google Scholar] [CrossRef]
- Hansen, S.H.; Pedersen, L.C.; Vilsgaard, K.D.; Elbæk Nielsen, I.; Hansen, S.F. Environmental and Ethical Aspects of Sustainable Mining in Greenland. J. Earth Sci. Eng. 2013, 3, 213. [Google Scholar]
- Buytaert, W.; Zulkafli, Z.; Grainger, S.; Acosta, L.; Alemie, T.C.; Bastiaensen, J.; De Bièvre, B.; Bhusal, J.; Clark, J.; Dewulf, A.; et al. Citizen science in hydrology and water resources: Opportunities for knowledge generation, ecosystem service management, and sustainable development. Front. Earth Sci. 2014, 2. [Google Scholar] [CrossRef]
- Bian, Z.; Lu, Q. Ecological effects analysis of land use change in coal mining area based on ecosystem service valuing: A case study in Jiawang. Environ. Earth Sci. 2013, 68, 1619–1630. [Google Scholar] [CrossRef]
- Grizzetti, B.; Lanzanova, D.; Liquete, C.; Reynaud, A.; Cardoso, A.C. Assessing water ecosystem services for water resource management. Environ. Sci. Policy 2016, 61, 194–203. [Google Scholar] [CrossRef]
- Muller, F.; Burkhard, B. The indicator side of ecosystem services. Ecosyst. Serv. 2012, 1, 26–30. [Google Scholar] [CrossRef]
- Tarras-Wahlberg, N.H.; Flachier, A.; Lane, S.N.; Sangfors, O. Environmental impacts and metal exposure of aquatic ecosystems in rivers contaminated by small scale gold mining: The Puyango River basin, southern Ecuador. Sci. Total Environ. 2001, 278, 239–261. [Google Scholar] [CrossRef]
- Bohan, D.A.; Landuyt, D.; Ma, A.; Macfadyen, S.; Martinet, V.; Massol, F.; McInerny, G.; Montoya, J.M.; Mulder, C.; Pascual, U.; et al. Networking Our Way to Better Ecosystem Service Provision. Trends Ecol. Evol. 2016, 31, 105–115. [Google Scholar] [CrossRef] [Green Version]
- Boumans, R.; Costanza, R.; Farley, J.; Wilson, M.A.; Portela, R.; Rotmans, J.; Villa, F.; Grasso, M. Modeling the dynamics of the integrated earth system and the value of global ecosystem services using the GUMBO model. Ecol. Econ. 2002, 41, 529–560. [Google Scholar] [CrossRef]
- Grainger, S.; Mao, F.; Buytaert, W. Environmental data visualisation for non-scientific contexts: Literature review and design framework. Environ. Model. Softw. 2016, 85, 299–318. [Google Scholar] [CrossRef]
- Zhang, L.; Zhang, S.; Huang, Y.; Cao, M.; Huang, Y.; Zhang, H. Exploring an ecologically sustainable scheme for landscape restoration of abandoned mine land: Scenario-based simulation integrated linear programming and CLUE-S model. Int. J. Environ. Res. Public Health 2016, 13. [Google Scholar] [CrossRef] [PubMed]
- Slocombe, D. Lessons from experience with ecosystem-based management. Landsc. Urban Plan. 1998. [Google Scholar] [CrossRef]
- Norman, L.M.; Villarreal, M.L.; Niraula, R.; Meixner, T.; Frisvold, G.; Labiosa, W. Framing scenarios of binational water policy with a tool to visualize, quantify and valuate changes in ecosystem services. Water 2013, 5, 852–874. [Google Scholar] [CrossRef]
- Lautenbach, S.; Volk, M.; Gruber, B.; Dormann, C.F.; Strauch, M.; Seppelt, R. Quantifying Ecosystem Service Trade-offs. In Proceedings of the 2010 International Congress on Environmental Modelling and Software Modelling for Environment’s Sake, Fifth Biennial Meeting, Ottawa, ON, Canada, 5–8 July 2010. [Google Scholar]
- Carpentier, S.; Filotas, E.; Handa, I.T.; Messier, C. Trade-offs between timber production, carbon stocking and habitat quality when managing woodlots for multiple ecosystem services. Environ. Conserv. 2016, 1–10. [Google Scholar] [CrossRef]
- Peh, K.S.H.; Balmford, A.; Bradbury, R.B.; Brown, C.; Butchart, S.H.M.; Hughes, F.M.R.; Stattersfield, A.; Thomas, D.H.L.; Walpole, M.; Bayliss, J.; et al. TESSA: A toolkit for rapid assessment of ecosystem services at sites of biodiversity conservation importance. Ecosyst. Serv. 2013, 5, E51–E57. [Google Scholar] [CrossRef]
- Nikolaou, I.E.; Evangelinos, K.I. A SWOT analysis of environmental management practices in Greek Mining and Mineral Industry. Resour. Policy 2010, 35, 226–234. [Google Scholar] [CrossRef]
- Wilson, M.L.; Renne, E.; Roncoli, C.; Agyei-Baffour, P.; Tenkorang, E.Y. Integrated Assessment of Artisanal and Small-Scale Gold Mining in Ghana—Part 3: Social Sciences and Economics. Int. J. Environ. Res. Public Health 2015, 12, 8133–8156. [Google Scholar] [CrossRef] [PubMed]
- Voinov, A.; Seppelt, R.; Reis, S.; Nabel, J.E.M.S.; Shokravi, S. Values in socio-environmental modelling: Persuasion for action or excuse for inaction. Environ. Model. Softw. 2014, 53, 207–212. [Google Scholar] [CrossRef] [Green Version]
- Borja, A.; Galparsoro, I.; Solaun, O.; Muxika, I.; Tello, E.M.; Uriarte, A.; Valencia, V. The European Water Framework Directive and the DPSIR, a methodological approach to assess the risk of failing to achieve good ecological status. Estuar. Coast. Shelf Sci. 2006, 66, 84–96. [Google Scholar] [CrossRef]
- Song, X.Q.; Frostell, B. The DPSIR Framework and a Pressure-Oriented Water Quality Monitoring Approach to Ecological River Restoration. Water 2012, 4, 670–682. [Google Scholar] [CrossRef]
- Gari, S.R.; Newton, A.; Icely, J.D. A review of the application and evolution of the DPSIR framework with an emphasis on coastal social-ecological systems. Ocean Coast. Manag. 2015, 103, 63–77. [Google Scholar] [CrossRef] [Green Version]
- Swenson, J.J.; Carter, C.E.; Domec, J.C.; Delgado, C.I. Gold Mining in the Peruvian Amazon: Global Prices, Deforestation, and Mercury Imports. PLoS ONE 2011, 6. [Google Scholar] [CrossRef] [PubMed] [Green Version]
- Simmons, J.A.; Currie, W.S.; Eshleman, K.N.; Kuers, K.; Monteleone, S.; Negley, T.L.; Pohlad, B.R.; Thomas, C.L. Forest to reclaimed mine land use change leads to altered ecosystem structure and function. Ecol. Appl. 2008, 18, 104–118. [Google Scholar] [CrossRef] [PubMed]
- Garris, H.W.; Baldwin, S.A.; Van Hamme, J.D.; Gardner, W.C.; Fraser, L.H. Genomics to assist mine reclamation: A review. Restor. Ecol. 2016, 24, 165–173. [Google Scholar] [CrossRef]
- Adem Esmail, B.; Geneletti, D. Design and impact assessment of watershed investments: An approach based on ecosystem services and boundary work. Environ. Impact Assess. Rev. 2017, 62, 1–13. [Google Scholar] [CrossRef]
- Al-Hobaib, A.S.; Al-Jaseem, K.Q.; Baioumy, H.M.; Ahmed, A.H. Environmental impact assessment inside and around Mahd Adh Dhahab gold mine, Saudi Arabia. Arab. J. Geosci. 2012, 5, 985–997. [Google Scholar] [CrossRef]
- Heneberg, P. Burrowing bird’s decline driven by EIA over-use. Resour. Policy 2013, 38, 542–548. [Google Scholar] [CrossRef]
- Posner, S.M.; McKenzie, E.; Ricketts, T.H. Policy impacts of ecosystem services knowledge. Proc. Natl. Acad. Sci. USA 2016, 113, 1760–1765. [Google Scholar] [CrossRef] [PubMed]
- Richardson, L.; Loomis, J.; Kroeger, T.; Casey, F. The role of bene fi t transfer in ecosystem service valuation. Ecol. Econ. 2015, 115, 51–58. [Google Scholar] [CrossRef]
- Denis, G.; Claverie, A.; Pasco, X.; Darnis, J.; De Maupeou, B.; Lafaye, M.; Morel, E. Acta Astronautica Towards disruptions in Earth observation? New Earth Observation systems and markets evolution: Possible scenarios and impacts ☆ ground Sampling Distance. Acta Astronaut. 2017, 137, 415–433. [Google Scholar] [CrossRef]
- Felipe-Lucia, M.R.; Martin-Lopez, B.; Lavorel, S.; Berraquero-Diaz, L.; Escalera-Reyes, J.; Comin, F.A. Ecosystem Services Flows: Why Stakeholders’ Power Relationships Matter. PLoS ONE 2015, 10. [Google Scholar] [CrossRef] [PubMed]
- Landuyt, D.; Broekx, S.; D’hondt, R.; Engelen, G.; Aertsens, J.; Goethals, P.L.M. A review of Bayesian belief networks in ecosystem service modelling. Environ. Model. Softw. 2013, 46, 1–11. [Google Scholar] [CrossRef]
- Fan, Y.; Chen, J.; Shirkey, G.; John, R.; Wu, S.R.; Park, H.; Shao, C. Applications of structural equation modeling (SEM) in ecological studies: An updated review. Ecol. Process. 2016, 5. [Google Scholar] [CrossRef]
- Gobeyn, S.; Volk, M.; Dominguez-granda, L.; Goethals, P.L.M. Environmental Modelling & Software Input variable selection with a simple genetic algorithm for conceptual species distribution models: A case study of river pollution in Ecuador. Environ. Model. Softw. 2017, 92, 269–316. [Google Scholar] [CrossRef]
- Volk, M.; Lautenbach, S.; Van Delden, H.; Newham, L.T.H.; Seppelt, R. How can we make progress with decision support systems in landscape and river basin management? lessons learned from a comparative analysis of four different decision support systems. Environ. Manag. 2010, 46, 834–849. [Google Scholar] [CrossRef] [PubMed]
- Morel, J.L.; Chenu, C.; Lorenz, K. Ecosystem services provided by soils of urban, industrial, traffic, mining, and military areas (SUITMAs). J. Soils Sediments 2014, 15, 1659–1666. [Google Scholar] [CrossRef]
- Nanni, M.; Raffaet, A. Deductive and inductive reasoning on spatio-temporal data. Lect. Notes Comput. Sci. 2005, 3392, 98–115. [Google Scholar] [CrossRef]
- Landuyt, D.; Perring, M.P.; Seidl, R.; Taubert, F.; Verbeeck, H.; Verheyen, K. Modelling understorey dynamics in temperate forests under global change–Challenges and perspectives. Perspect. Plant Ecol. Evol. Syst. 2018, 31, 44–54. [Google Scholar] [CrossRef] [PubMed]
- Boumans, R.; Roman, J.; Altman, I.; Kaufman, L. The multiscale integrated model of ecosystem services (MIMES): Simulating the interactions of coupled human and natural systems. Ecosyst. Serv. 2015, 12, 30–41. [Google Scholar] [CrossRef]
- Bagstad, K.J.; Semmens, D.J.; Waage, S.; Winthrop, R. A comparative assessment of decision-support tools for ecosystem services quantification and valuation. Ecosyst. Serv. 2013, 5, E27–E39. [Google Scholar] [CrossRef]
- Linton, J.; Budds, J. The hydrosocial cycle: Defining and mobilizing a relational-dialectical approach to water. Geoforum 2014, 57, 170–180. [Google Scholar] [CrossRef]
- Seppelt, R.; Dormann, C.F.; Eppink, F.V.; Lautenbach, S.; Schmidt, S. A quantitative review of ecosystem service studies: Approaches, shortcomings and the road ahead. J. Appl. Ecol. 2011, 48, 630–636. [Google Scholar] [CrossRef]
- Brown, S.; Mahoney, M.; Sprenger, M. Science of the Total Environment A comparison of the ef fi cacy and ecosystem impact of residual-based and topsoil-based amendments for restoring historic mine tailings in the Tri-State mining district. Sci. Total Environ. 2014, 485–486, 624–632. [Google Scholar] [CrossRef] [PubMed]
- Jax, K. Function and “functioning” in ecology: What does it mean? Oikos 2005, 111, 641–648. [Google Scholar] [CrossRef]
- Maes, J.; Liquete, C.; Teller, A.; Erhard, M.; Luisa, M.; Barredo, J.I.; Grizzetti, B.; Cardoso, A.; Somma, F.; Petersen, J.; et al. An indicator framework for assessing ecosystem services in support of the EU Biodiversity Strategy to 2020. Ecosyst. Serv. 2016, 17, 14–23. [Google Scholar] [CrossRef]
- Buytaert, W.; Breuer, L. Water resources in South America: Sources and supply, pollutants and perspectives. Underst. Freshw. Qual. Probl. Chang. World 2013, 361, 106–113. [Google Scholar]
- Wright, I.A.; Ryan, M.M. Impact of mining and industrial pollution on stream macroinvertebrates: Importance of taxonomic resolution, water geochemistry and EPT indices for impact detection. Hydrobiologia 2016, 772, 103–115. [Google Scholar] [CrossRef]
- Muradian, R.; Arsel, M.; Pellegrini, L.; Adaman, F.; Aguilar, B.; Agarwal, B.; Corbera, E.; De Blas, D.E.; Leroy, P.; May, P.; et al. Payments for ecosystem services and the fatal attraction of win-win solutions. Conserv. Lett. 2013, 6, 274–279. [Google Scholar] [CrossRef]
- Tscharntke, T.; Klein, A.M.; Kruess, A.; Steffan-Dewenter, I.; Thies, C. Landscape perspectives on agricultural intensification and biodiversity—Ecosystem service management. Ecol. Lett. 2005, 8, 857–874. [Google Scholar] [CrossRef]
Figure 1.
Trends in data foundations for assessing ES in mining contexts.

Figure 2.
Yearly distribution of Web of Science articles assessing ES in mining regions (n = 26). 50% of selected articles used a participatory approach, and only 20% provided management recommendations. No articles fitting our scope were found for the 2000s decade.
Figure 2.
Yearly distribution of Web of Science articles assessing ES in mining regions (n = 26). 50% of selected articles used a participatory approach, and only 20% provided management recommendations. No articles fitting our scope were found for the 2000s decade.

Figure 3.
Summary of main conceptual elements used for assessing freshwater ES in mining contexts, structured in a driver-pressure-state-ES-response (DPSER) framework. Arrows represent cause–effect links, and the interfaces i-1, i-2 and i-3 represent the ‘selection of data and models’ interface, the ‘ES production function assumption’ interface and the ‘response justification’ interface, respectively.

Figure 4.
Data collection and processing for holistic modelling of water ES in mining regions. (1), (2) and (3) represent the minimum requirements for a model to be policy-relevant. CICES: Common International Classification of ES; BBN: Bayesian belief networks; SEM: structural equation modelling.
Figure 4.
Data collection and processing for holistic modelling of water ES in mining regions. (1), (2) and (3) represent the minimum requirements for a model to be policy-relevant. CICES: Common International Classification of ES; BBN: Bayesian belief networks; SEM: structural equation modelling.

Table 1.
Criteria for reviewing ecosystem services (ES) assessments applied to mining contexts.
| Criteria |
|
| Mining focus |
|
| Basis for ES valuation |
|
| Data sources |
|
| Indicator of water biophysical state |
|
| Ecological functionality 1 |
|
| Human–ecosystem integration |
|
| Model complexity |
|
| ESA output |
|
| Policy-oriented aspects in models: (1) scenario simulation; (2) trade-offs analysis; (3) uncertainty assessment; and (4) stakeholder participation. | |
1 Natural processes (e.g., water purification or carbon uptake) having service potential. 2 Includes studies using value coefficients for LULC areas without field verification.
Table 2.
ES studies of different complexity (number of parameters) and ecological functionality levels. Models integrating human and ecosystem features are in bold. Uncertainty-explicit models are underlined.
Table 2.
ES studies of different complexity (number of parameters) and ecological functionality levels. Models integrating human and ecosystem features are in bold. Uncertainty-explicit models are underlined.
| Ecological Functionality | High Complexity | Medium Complexity | Low Complexity | |
|---|---|---|---|---|
| High ecological functionality |  | Burges et al. (2013) | Larondelle et al. (2012) | |
| Medium ecological functionality |  | Li et al. (2011) Hogan et al. (2012) Evans et al. (2013) | Haase et al. (2012) Bai et al. (2011) | Wilker et al. (2016) |
| Low ecological functionality |  | Zhang et al. (2010) Duarte et al. (2016) Zhang et al. (2016) Mazzotta et al. (2015) Fu et al. (2015) | Molina et al. (2016) Blaen et al. (2016) Bian et al. (2013) | Pullanikkatil et al. (2016) Pandit et al. (2015) Boissiere et al. (2013) Woziwoda et al. (2014) |
| Null ecological functionality |  | Rosa et al. (2016) Preece et al. (2016) Fan et al. (2016) Zhang et al. (2013) | Fan et al. (2015) Breffle et al. (2013) |
© 2018 by the authors. Licensee MDPI, Basel, Switzerland. This article is an open access article distributed under the terms and conditions of the Creative Commons Attribution (CC BY) license (http://creativecommons.org/licenses/by/4.0/).
Share and Cite
MDPI and ACS Style
Mercado-Garcia, D.; Wyseure, G.; Goethals, P. Freshwater Ecosystem Services in Mining Regions: Modelling Options for Policy Development Support. Water 2018, 10, 531. https://doi.org/10.3390/w10040531
AMA Style
Mercado-Garcia D, Wyseure G, Goethals P. Freshwater Ecosystem Services in Mining Regions: Modelling Options for Policy Development Support. Water. 2018; 10(4):531. https://doi.org/10.3390/w10040531
Chicago/Turabian StyleMercado-Garcia, Daniel, Guido Wyseure, and Peter Goethals. 2018. "Freshwater Ecosystem Services in Mining Regions: Modelling Options for Policy Development Support" Water 10, no. 4: 531. https://doi.org/10.3390/w10040531
Note that from the first issue of 2016, this journal uses article numbers instead of page numbers. See further details here.