Assessing the Influence of the Three Gorges Dam on Hydrological Drought Using GRACE Data

1
School of Geodesy and Geomatics, Wuhan University, Wuhan 430079, China
2
College of Marine Science and Technology, China University of Geosciences, Wuhan 430074, China
3
Faculty of Science, University of Alberta, Edmonton, AB T6G 2R3, Canada
*
Author to whom correspondence should be addressed.
Water 2018, 10(5), 669; https://doi.org/10.3390/w10050669
Submission received: 17 April 2018
/
Revised: 19 May 2018
/
Accepted: 19 May 2018
/
Published: 22 May 2018
(This article belongs to the Special Issue Climate Variability and Climate Change Impacts on Land Surface, Hydrological Processes and Water Management)
Abstract
:With worldwide economic and social development, more dams are being constructed to meet the increasing demand for hydropower, which may considerably influence hydrological drought. Here, an index named the “Dam Influence Index” (DII) is proposed to assess the influence of the Three Gorges Dam (TGD) on hydrological drought in the Yangtze River Basin (YRB) in China. First, the total terrestrial water storage (TTWS) is derived from Gravity Recovery and Climate Experiment data. Then, the natural-driven terrestrial water storage (NTWS) is predicted from the soil moisture, precipitation, and temperature data based on an artificial neural network model. Finally, the DII is derived using the empirical (Kaplan-Meier) cumulative distribution function of the differences between the TTWS and the NTWS. The DIIs of the three sub-basins in the YRB were 1.38, −4.66, and −7.32 between 2003 and 2008, which indicated an increase in TTWS in the upper sub-basin and a reduction in the middle and lower sub-basins. According to the results, we concluded that impoundments of the TGD between 2003 and 2008 slightly alleviated the hydrological drought in the upper sub-basin and significantly aggravated the hydrological drought in the middle and lower sub-basins, which is consistent with the Palmer Drought Severity Index. This study provides a new perspective for estimating the effects of large-scale human activities on hydrological drought and a scientific decision-making basis for the managing water resources over the operation of the TGD.
1. Introduction
By implementing an operational definition of drought, three main physical drought types have been established: Meteorological, agricultural, and hydrological [1,2,3]. Hydrological drought is caused by the shortage of surface water and groundwater [4,5], affecting human society and economic development. The severe hydrological droughts in the Yangtze River Basin (YRB) during the summer of 2006 and the spring of 2011 [6,7] caused significant economic losses to the local people.
In 1993, the Chinese government decided to construct the Three Gorges Dam (TGD) in order to mitigate the effects of global climate change including floods and to make full use of the water resources for hydroelectric power generation [8,9,10,11]. The TGD began operation in 2003, and after three major impoundments, construction was completed in 2009 [12]. With the construction and operation of the TGD, YRB hydrological drought has been intensively affected by human activities [6], and the reservoir operations may seriously affect the ecological balance of the downstream environments [13].
Dai et al. [6], Zhang et al. [7], Li et al. [14], Lai et al. [15], and Liu et al. [16] analyzed the effects of the TGD on water levels in the middle and lower reaches of the Yangtze River using observational data from hydrological stations and the TGD impounding data based on many mathematical models [17]. The results of their studies indicated that the construction and operation of the TGD had a non-negligible impact on the water level changes of the Yangtze River. The influence of the TGD on the hydrological drought in the YRB has been investigated using surface water level data from in-situ hydrological stations, and it was found to not only be affected by the shortage of surface water but also by the groundwater changes [4,5]. Moreover, the short-term variation in the total terrestrial water storage (TTWS) was found to be mainly caused by changes in groundwater and surface water [18].
Since the Gravity Recovery and Climate Experiment (GRACE) mission was successfully launched in March 2002 [19], GRACE has been widely used to estimate hydrological drought. Yaraw et al. [20], Chen et al. [21], and Frappart et al. [22] estimated hydrological drought events based on GRACE data. Thomas et al. [23] proposed a method to quantify hydrological drought events using GRACE satellite gravity data. This method detects the beginning, end, duration, recovery, and severity of hydrological drought events. Chao et al. [24] proposed a new GRACE-based index called the “non-seasonal storage deficit” to quantify the hydrological drought characteristics in Southwestern China. Therefore, the GRACE-based TTWS can accurately estimate the influence of the TGD on hydrological drought in the YRB.
Here, the TTWS in the upper, middle, and lower sub-basins of the YRB were calculated using GRACE data. Then, the naturally driven terrestrial water storage (NTWS) in the three sub-basins (upper, middle, and lower sub-basins of the YRB) were estimated from the soil moisture, precipitation, and temperature data based on an artificial neural network (ANN) model. Additionally, an index named the “Dam Influence Index” (DII), which reflects the effects of large-scale dam impoundments on the TTWS, was created by using the NTWS and the TTWS between 2003 and 2008. Finally, the effects of TGD impoundments on the hydrological drought between 2003 and 2008 in the YRB were estimated.
2. Study Area
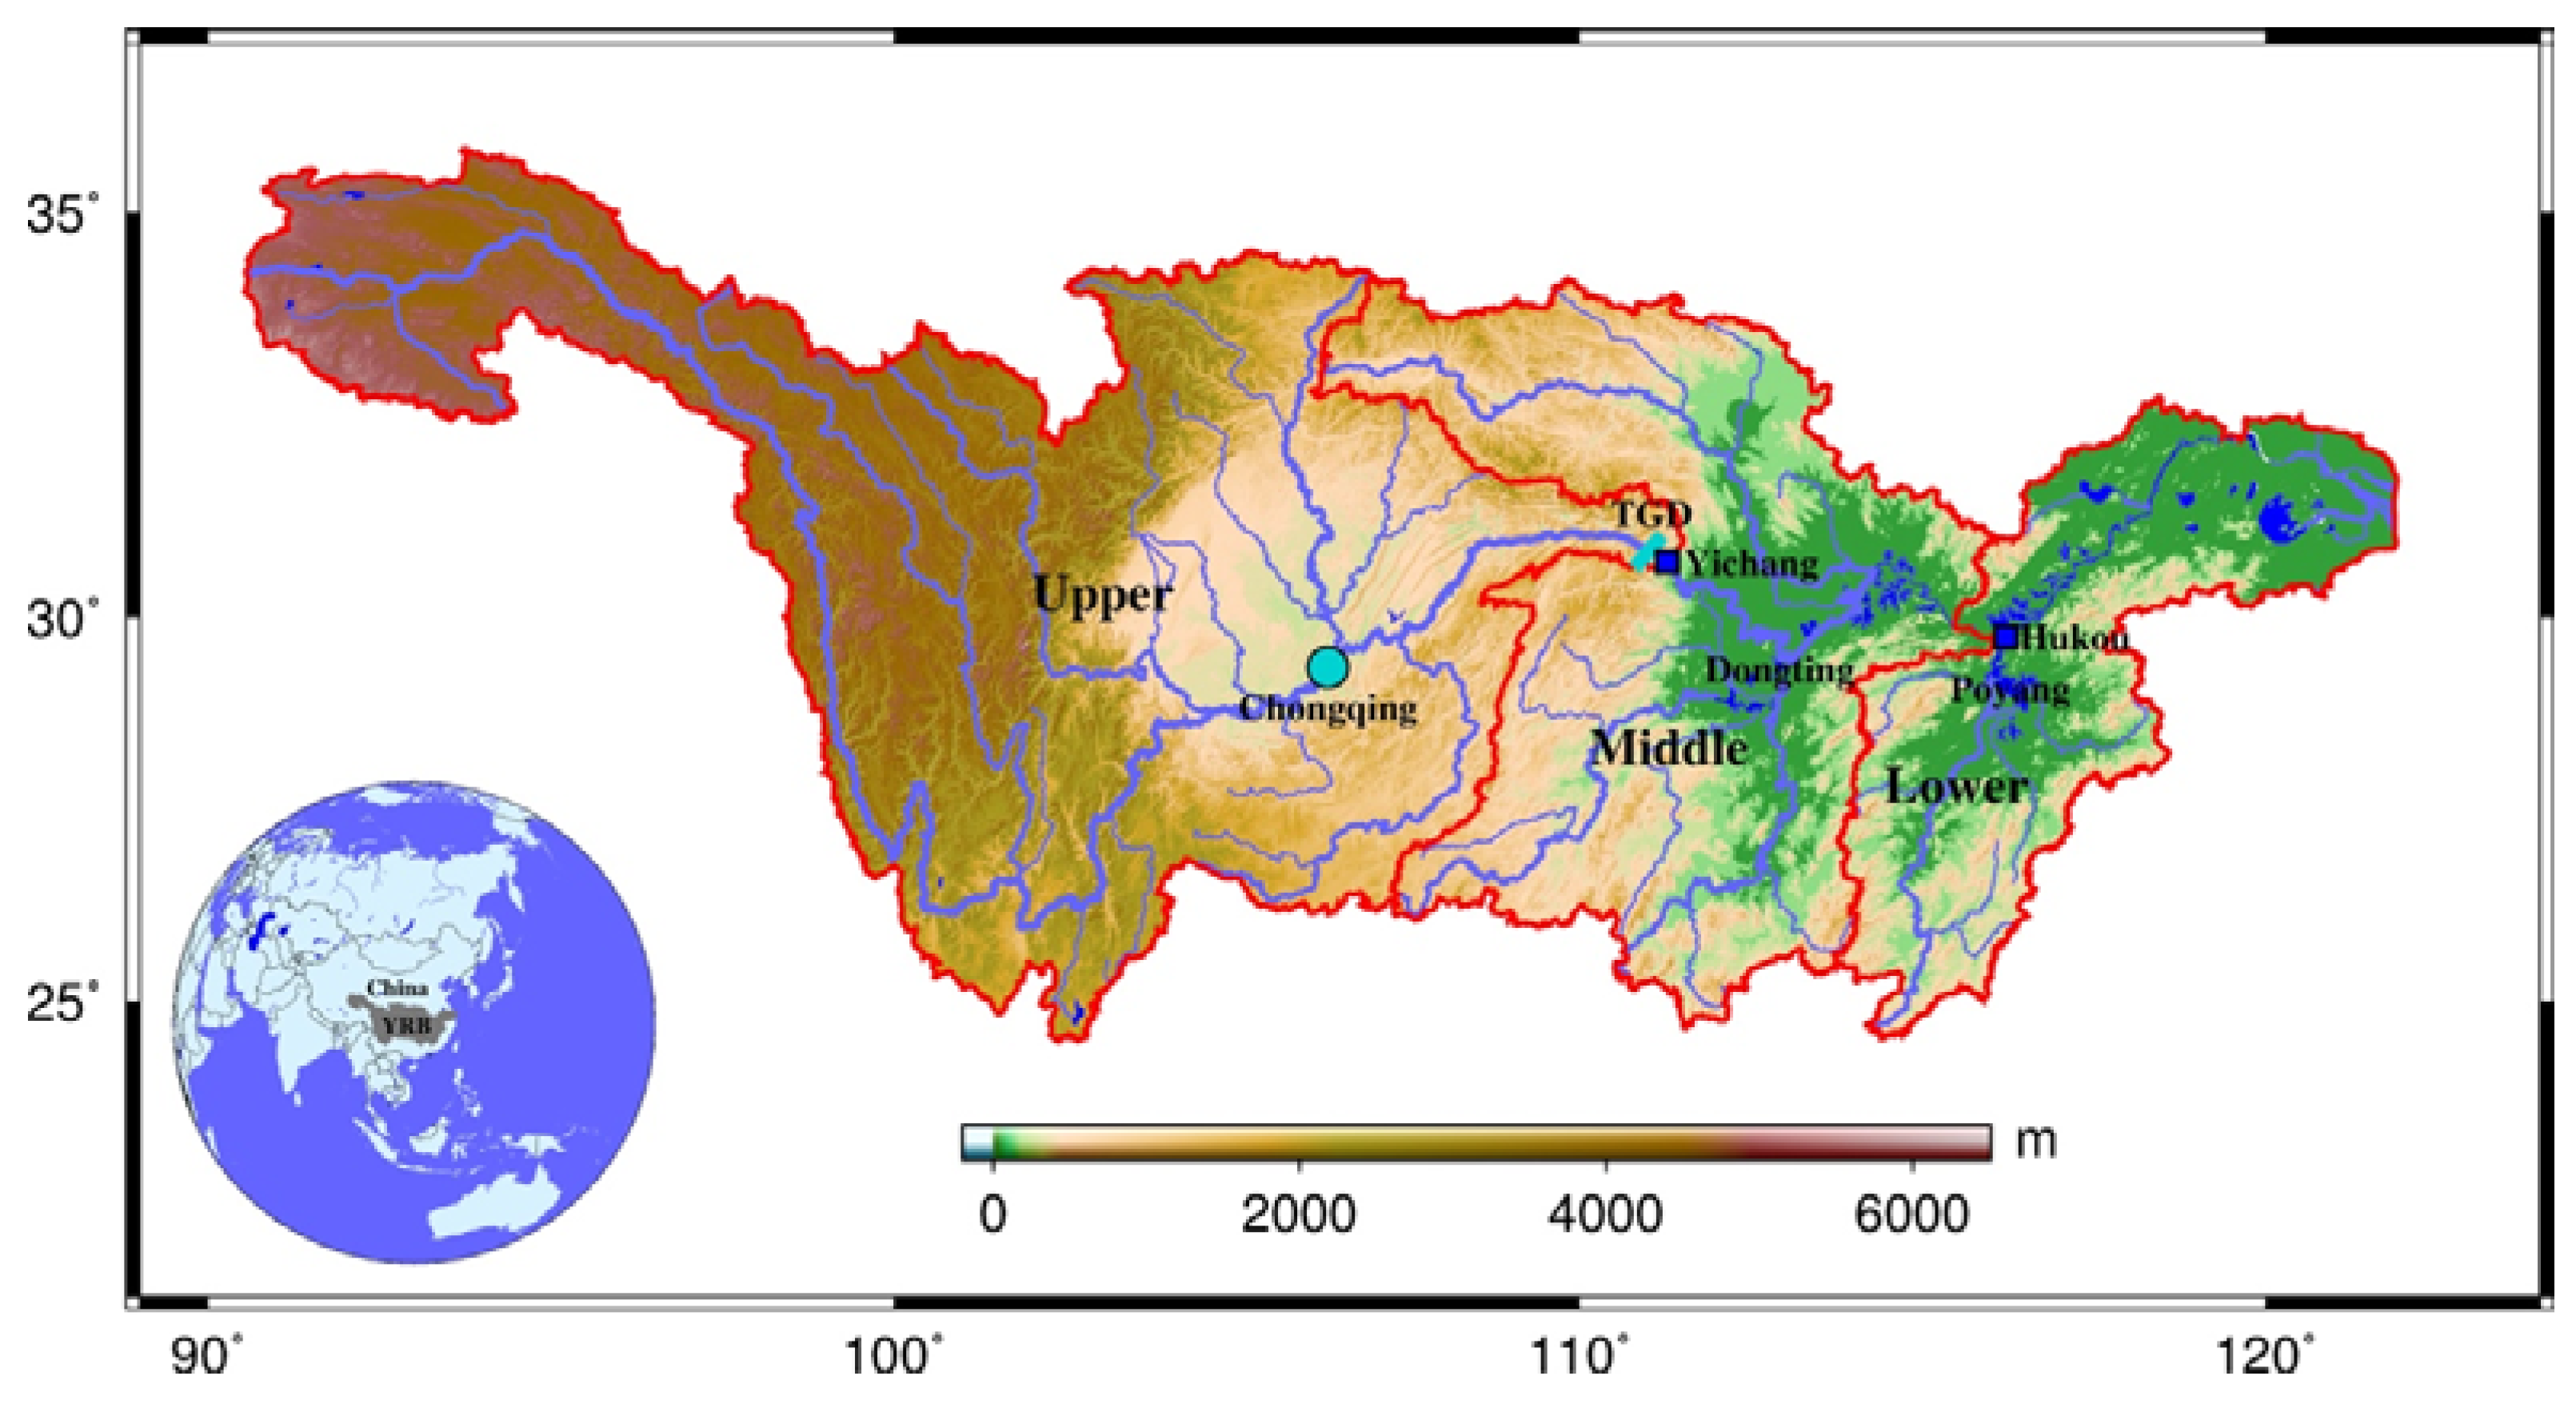
The world’s third largest river, the Yangtze River, with a total length of 6300 km, flows across 11 provinces in China and finally flows into the East China Sea. The YRB [25], with an area of 1.8 million km2, which accounts for approximately 18.8% of China’s territory, is divided into upper, middle, and lower sub-basins by the Yichang and Hukou hydrological stations [26,27,28]. The region above the Yichang hydrological station is the upper sub-basin of the YRB, and the world’s largest dam, the TGD, is located in Yichang, approximately 100 km away from the Yichang hydrological station. The region below the Hukou hydrological station is the lower sub-basin and the region between Yichang and Hukou hydrological station is the middle sub-basin of the YRB. The upper, middle, and lower sub-basins areas are 98, 51, and 29 km2, respectively. The major surface bodies of the middle and lower sub-basins are Dongting Lake in the central YRB and Poyang Lake near the Hukou hydrological station (Figure 1).
The Yangtze River, between the TGD and Chongqing, with a length of 663 km and an area of 1084 km2, composes the Three Gorges reservoirs (TGR) (Figure 1), which has a total water storage capacity of 39.3 km3 [16]. In this study, the effects of the TGD on each sub-basin of the YRB will be estimated based on GRACE data from April 2002 to July 2015.
3. Data and Methods
3.1. GRACE
The GRACE monthly time-variable gravity field models from the Center for Space Research (CSR) between April 2002 and July 2015 were used to infer the terrestrial water storage in the YRB after reducing the effects of the atmosphere, tide, and solid tide. Moreover, the monthly time-variable gravity field model with the maximum degree and order of the spherical harmonic coefficients was 60. To eliminate the influence of the geocentric motions on the time-variable gravity field model, the first-order coefficient was estimated from Swenson et al. [29]. To improve the accuracy of the second order of the spherical harmonic coefficient, the term of the GRACE time-variable gravity field models was replaced by the satellite laser ranging (SLR) observation data [30]. The glacial isostatic adjustment (GIA) was removed by using the ICE-5G (VM2) model (Peltier, W.R, Toronto, ON, Canada) [31,32]. The north-south strips and high-degree noises [33,34,35] in the TTWS estimated by the GRACE monthly time-variable gravity field models were removed by de-striping [35] and 300-km Gaussian filtering [33]. Although noise was removed by two-step filtering, the true signal was also attenuated [36]. However, the GRACE signal attenuation due to filtering can be recovered by a scale factor k [37,38,39,40]. Here, we used the Global Land Data Assimilation System (GLDAS) and the same method used by Landerer and Swenson [40] to restore the signal, which included attenuation and leakage.
3.2. GLDAS and TRMM
The Global Land Data Assimilation System (GLDAS) [41] model is a hydrological model that contains soil moisture, surface temperature, accumulated snow, water/energy flux, and other hydrological components on land between 60° S and 90° N. The uncertainty of GLDAS model vary in different regions. According to Wang et al. [42], GLDAS precipitation and air temperature data match the ground observations well in most areas of China, and the GLDAS TWS changes and GRACE TWS changes are well correlated in wet eastern China (including the YRB), which demonstrating that the precipitation, temperature, and TWS changes in the YRB from the GLDAS-NOAH model (L4 Monthly 1.0 × 1.0 degree, NASA, Washington, DC, USA) are reliable. In this study, the GLDAS-NOAH 10 M series model from National Aeronautical and Spatial Administration (NASA) from April 2002 to July 2015 with a spatial resolution of 1 × 1° was selected to calculate the average soil moisture and temperature of the YRB.
Furthermore, the scale factor k was calculated using the GLDAS hydrological model following the same method used by Landerer and Swenson. [40], which is summarized as follows: (1) the total water storage of the GLDAS model, named GLDAS TWS (GTWS), is extracted; (2) the GTWS extracted in the first step is converted into a spherical harmonic coefficient with a degree of 60; (3) similar to the GRACE data, de-striping (P5M8) and 300-km Gaussian filtering are applied to the GLDAS spherical harmonic coefficients; and (4) the filtered GTWS time series of a basin is calculated using the filtered GLDAS spherical harmonic coefficients, and the scale factor k is estimated using the following equation [40]:
where is the true GTWS time series and is the filtered GTWS time series. The parameter that minimizes is the scale factor needed in this study, and the TTWS is recovered by multiplying the filtered TTWS time series by the estimated scale factor [40].
The Tropical Rainfall Measuring Mission (TRMM) satellite [43] from NASA and the National Space Development Agency (NSDA) provide global precipitation data between 50° S and 50° N. In this study, the third-grade monthly precipitation data (3B43), which merged the Global Precipitation Climatology Centre (GPCC) rain gauge data and other satellite precipitation data from April 2002 to July 2015 with a spatial resolution of 0.25 × 0.25°, and a temporal resolution of one month was used to estimate the precipitation of the YRB.
3.3. ANN Approach
The ANN approach was proposed to extend the GRACE TTWS time series beyond the GRACE observation period using a set of training samples based on the ANN model [44]. The reliability of the ANN model depends on the correlation between the predictors and the target variable of the training samples: The stronger the correlation, the higher the accuracy of the ANN model. Huang et al. [45] found that a strong correlation between soil moisture and TTWS, and the GRACE TTWS time series has been extended beyond the GRACE observation period based on the soil moisture, precipitation, temperature data and the ANN model [46,47,48].
The mathematical ANN model is as follows [44]:
where is the input data (predictors), is the output data (target variable), is the process noise, and f is the function mapping of the input and output data. A more detailed description of the ANN model can be found in the study of Long et al. [44]. After obtaining the function mappings from the training samples, Equation (2) was used to extrapolate and predict the target variable (NTWS) using the predictors (soil moisture, precipitation, and temperature). The accuracy of the ANN model was evaluated based on three criteria: Nash–Sutcliff efficiency (NSE), the coefficient of determination (R2), and mean absolute error (MAE) [44]:
where y is the predictions of the target data based on ANN model, o is the true value of the target data, and n is the number of training samples. As the values of NSE and R2 increase and the value of MAE decreases, the accuracy of the ANN model increases.
3.4. DII Based on TTWS and NTWS
After obtaining the basin-mean NTWS time series in the upper, middle, and lower sub-basins of the YRB based on the ANN model, the differences of the basin-mean TTWS and the basin-mean NTWS time series of the three sub-basins was calculated with:
where and are the number of TWS observations. The NTWS is defined so that it cannot be affected by the TGD, and the inconsistency of the TTWS and the NTWS is mainly due to the TGD impoundments. The DII for a specific region (YRB) was calculated by the following equation:
where is the empirical (Kaplan-Meier) cumulative distribution function (ECDF) of from June 2003 to December 2008. The first formula in Equation (7) is the integration of minus in the positive interval, and the second formula is the integration of minus in the negative interval. Taking Equation (6) into account, a smaller value of the first formula in Equation (7) and a larger value of the second formula indicate a more severe hydrological drought caused by the TGD impoundments.
DII is an index developed in this study to evaluate anomalies of the TTWS due to the TGD impoundments. High and low DII values represent high and low drought conditions, respectively. For instance, a positive DII value indicates an alleviation of hydrological drought, whereas a negative value represents an aggravation.
4. Results
4.1. Recovered TTWS in the YRB
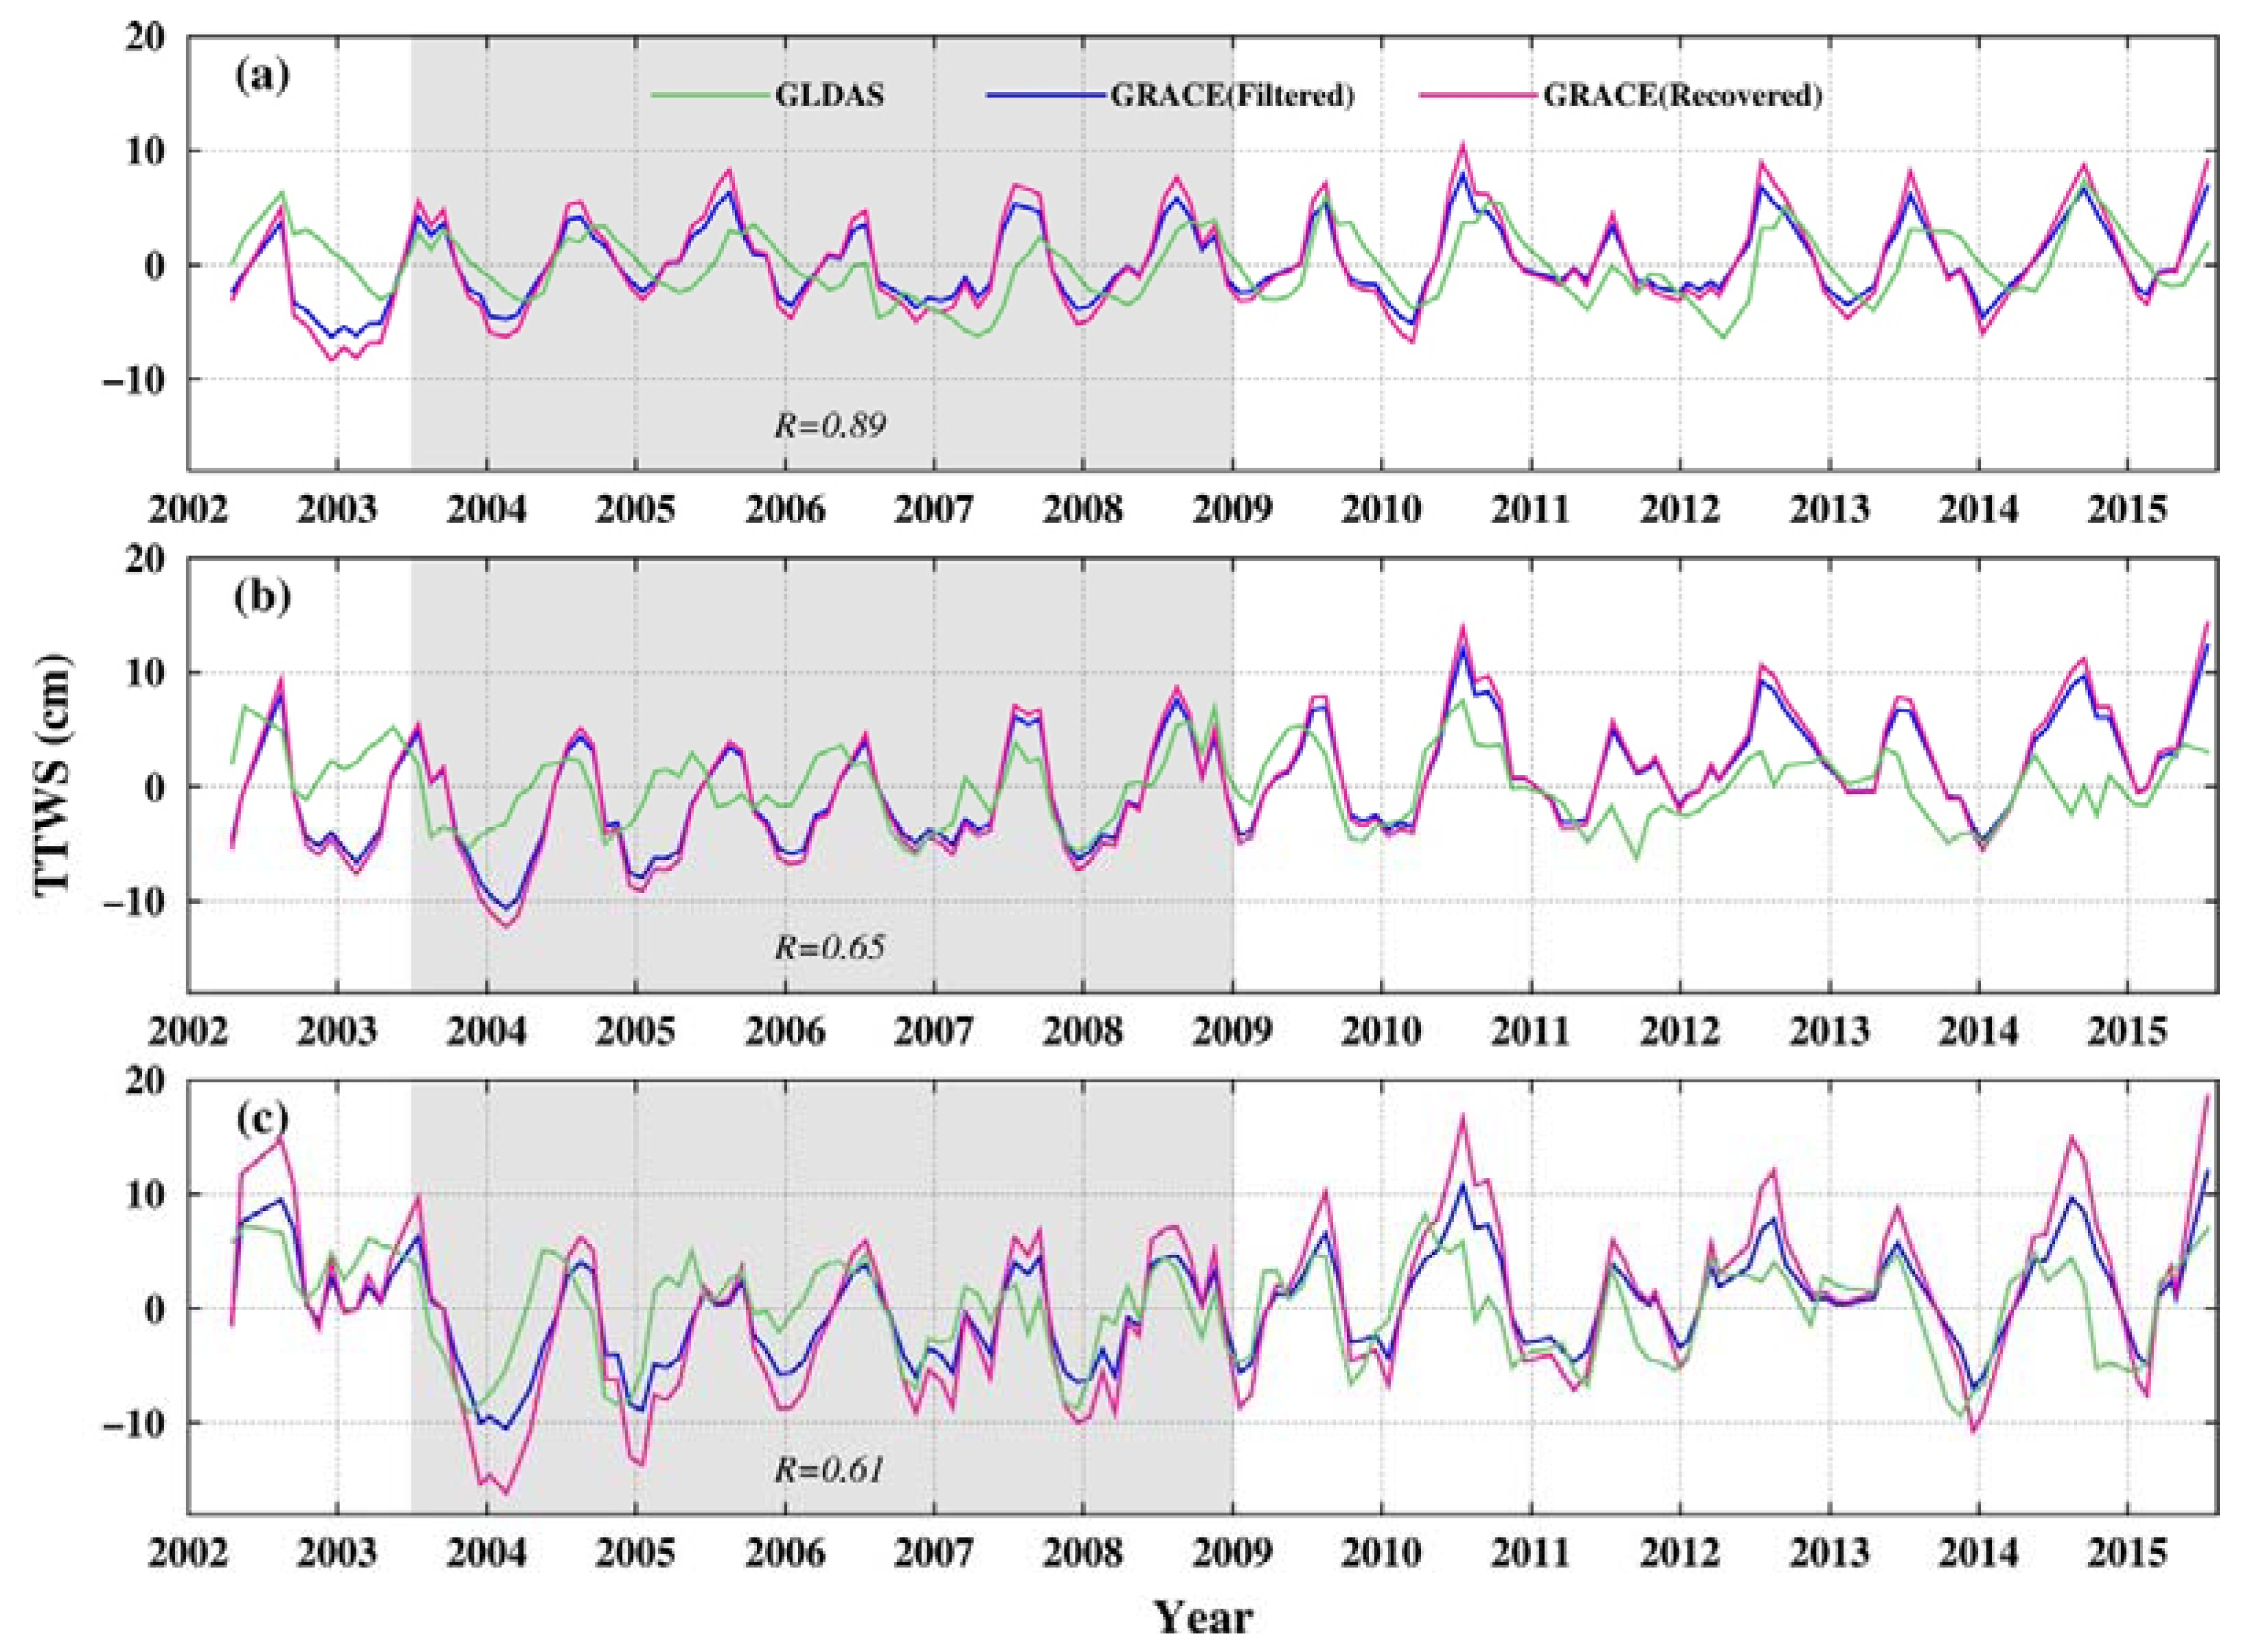
The scale factors, calculated by using the basin-mean GLDAS TWS time series based on Equation (1), of the upper, middle, and lower sub-basins of the YRB were 1.32, 1.15, and 1.54, respectively [40]. Then, the TTWS of the three sub-basins were recovered by multiplying the filtered TTWS time series by the scale factors (Figure 2). Moreover, the GRACE measurement error and the leakage error of the recovered TTWS were estimated based on the method used by Wahr et al. [49] and Landerer and Swenson [40], respectively (Table 1). Figure 2 shows the filtered and recovered TTWS time series estimated using the GRACE data. For verification, the GLDAS TWS time series in the three sub-basins are also shown in this figure. The correlation coefficients (R) between the GLDAS TWS and the recovered TTWS time series during the TGD impoundment period from June 2003 to December 2008 were 0.89, 0.61, and 0.65 in the upper, middle, and lower sub-basins, respectively, indicating that the recovered TTWS is more consistent with the GLDAS TWS in the upper sub-basin than in the middle and lower sub-basins.
4.2. NTWS in the YRB
Zhang et al. [47] extended the TTWS of the YRB (2002–2012) to a longer time series (1979–2012) based on the ANN model. According to their study, the TTWS time series in the middle and lower sub-basins of the YRB between 2003 and 2008 was significantly lower than in other years, and the TTWS returned to a normal level in 2009. There are two interpretations for this phenomenon: (1) A natural drought due to precipitation and evaporation anomalies occurred between 2003 and 2008, and (2) during this period, significant human activities, such as the TGD impoundment, aggravated the hydrological drought in the middle and lower sub-basins of the YRB.
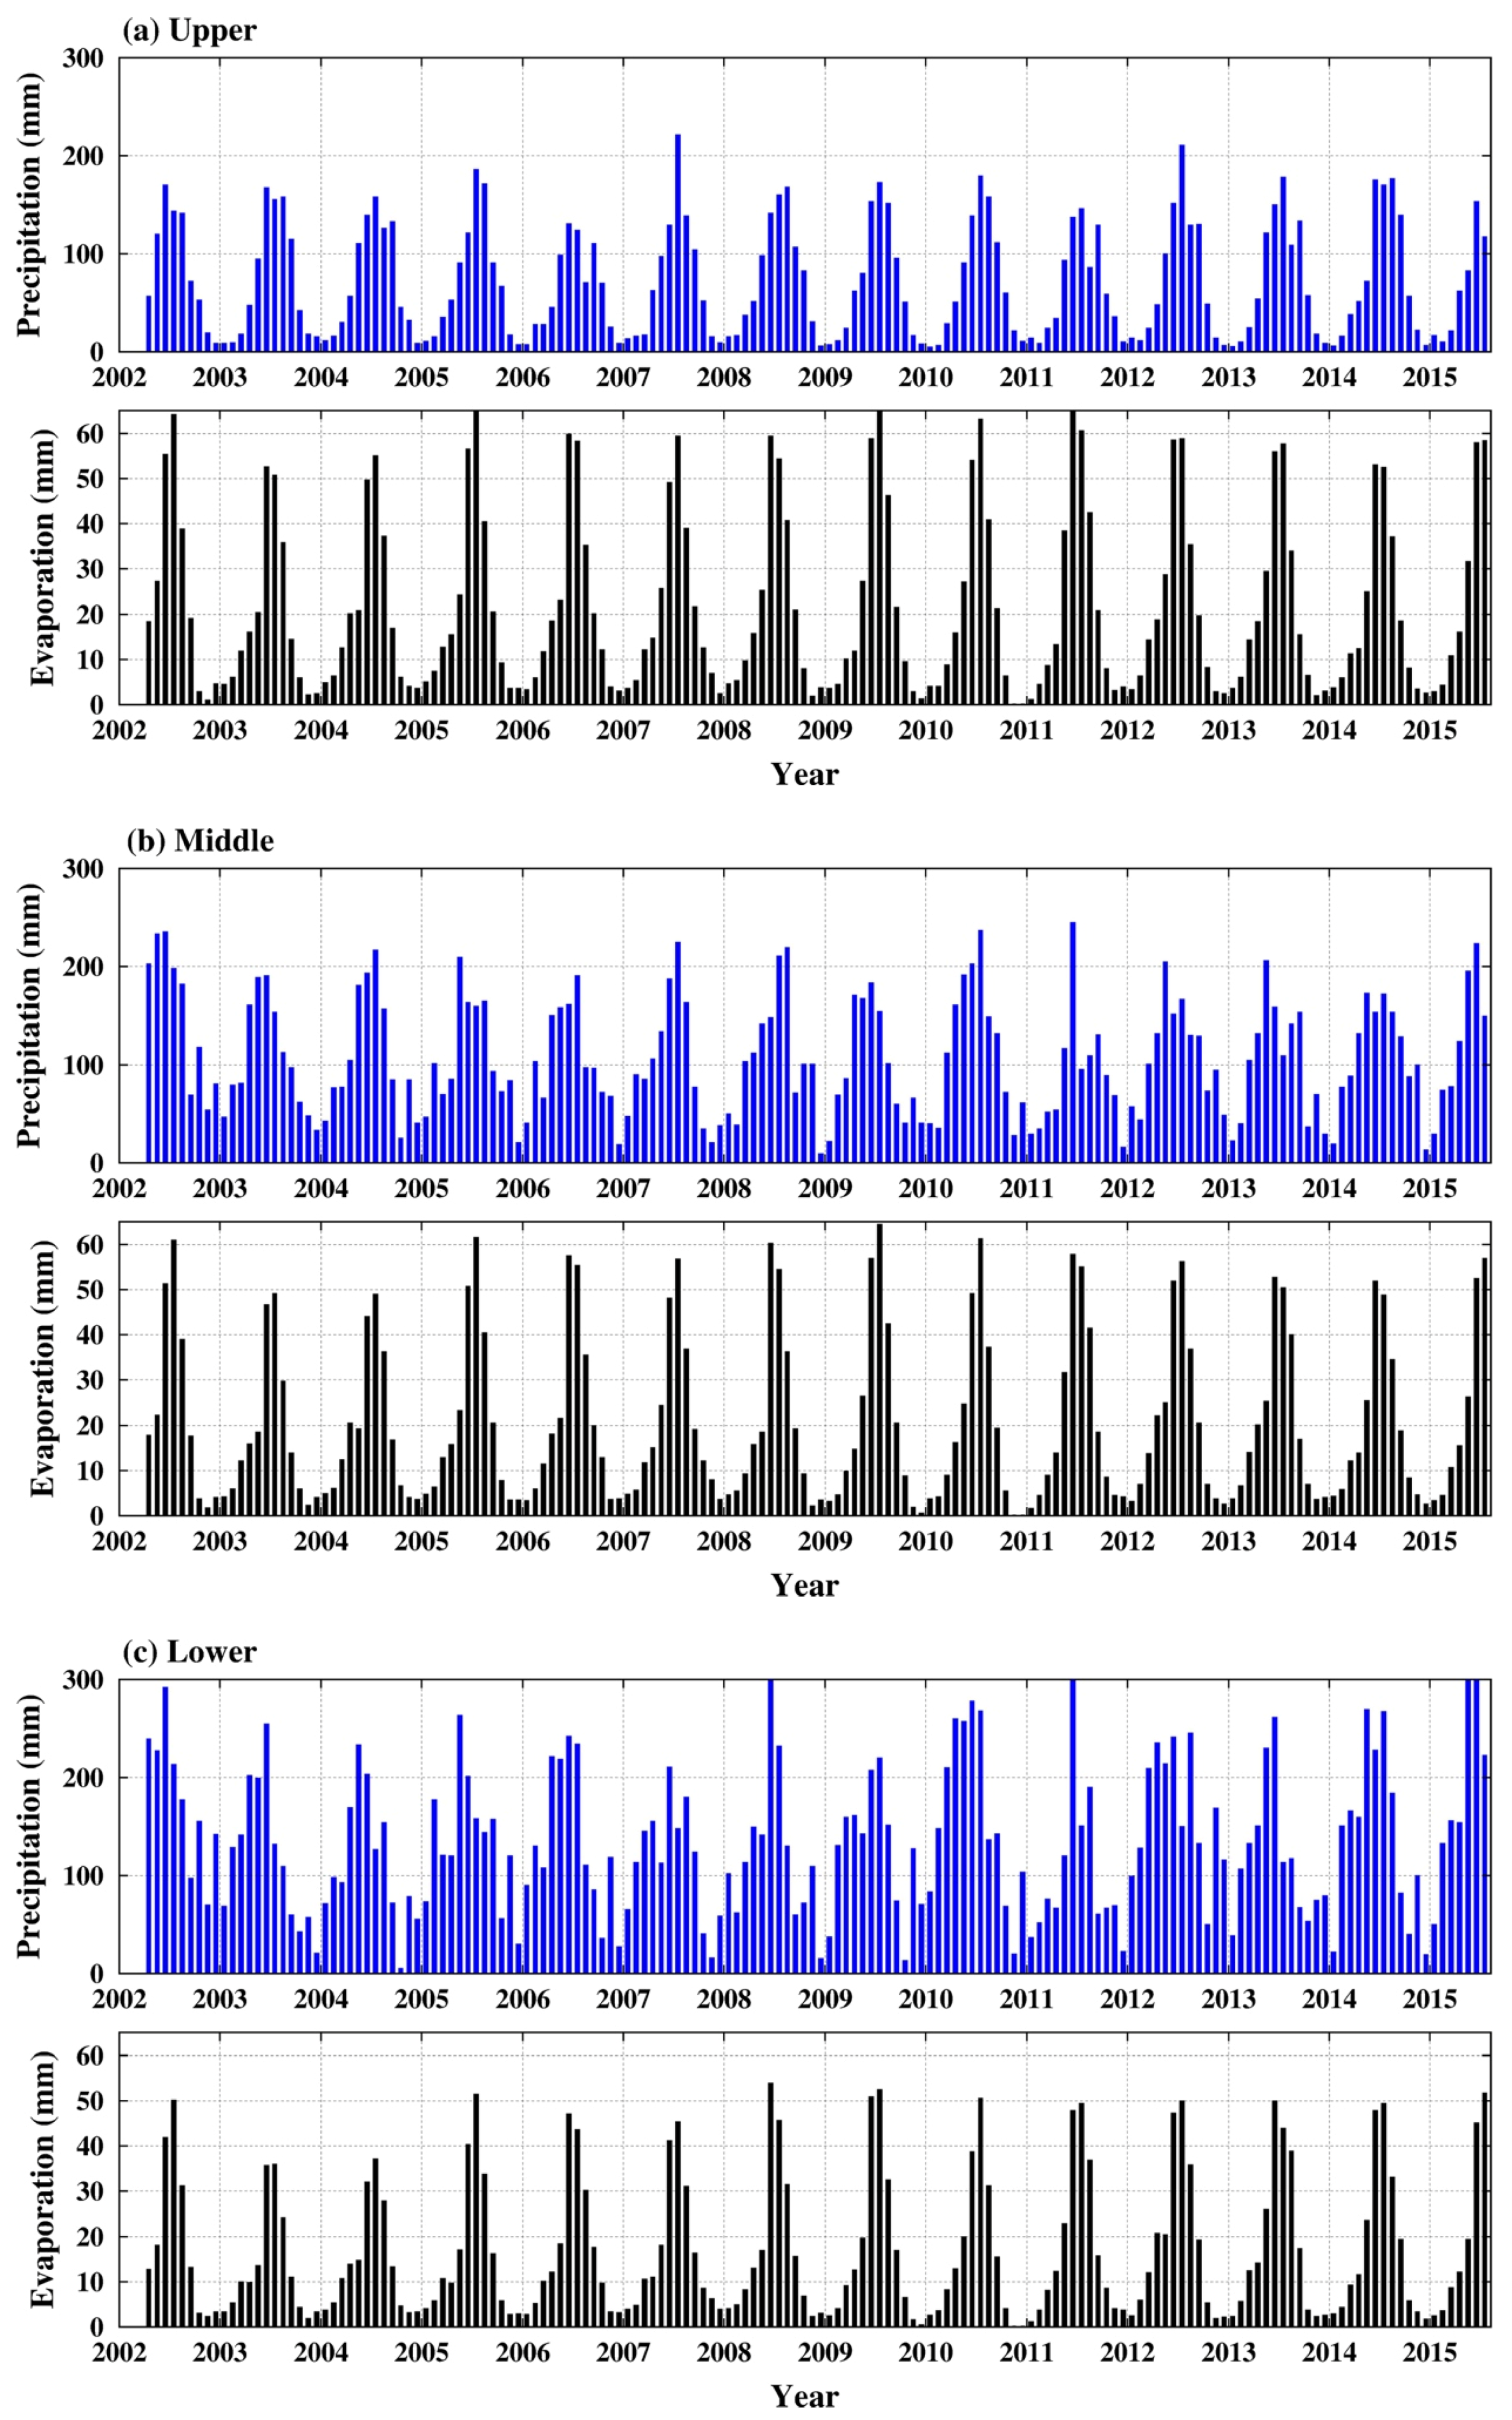
Figure 3 shows the time series of precipitation and evaporation obtained from TRMM and GLDAS, respectively, in the upper, middle, and lower sub-basins of the YRB from April 2002 to July 2015.
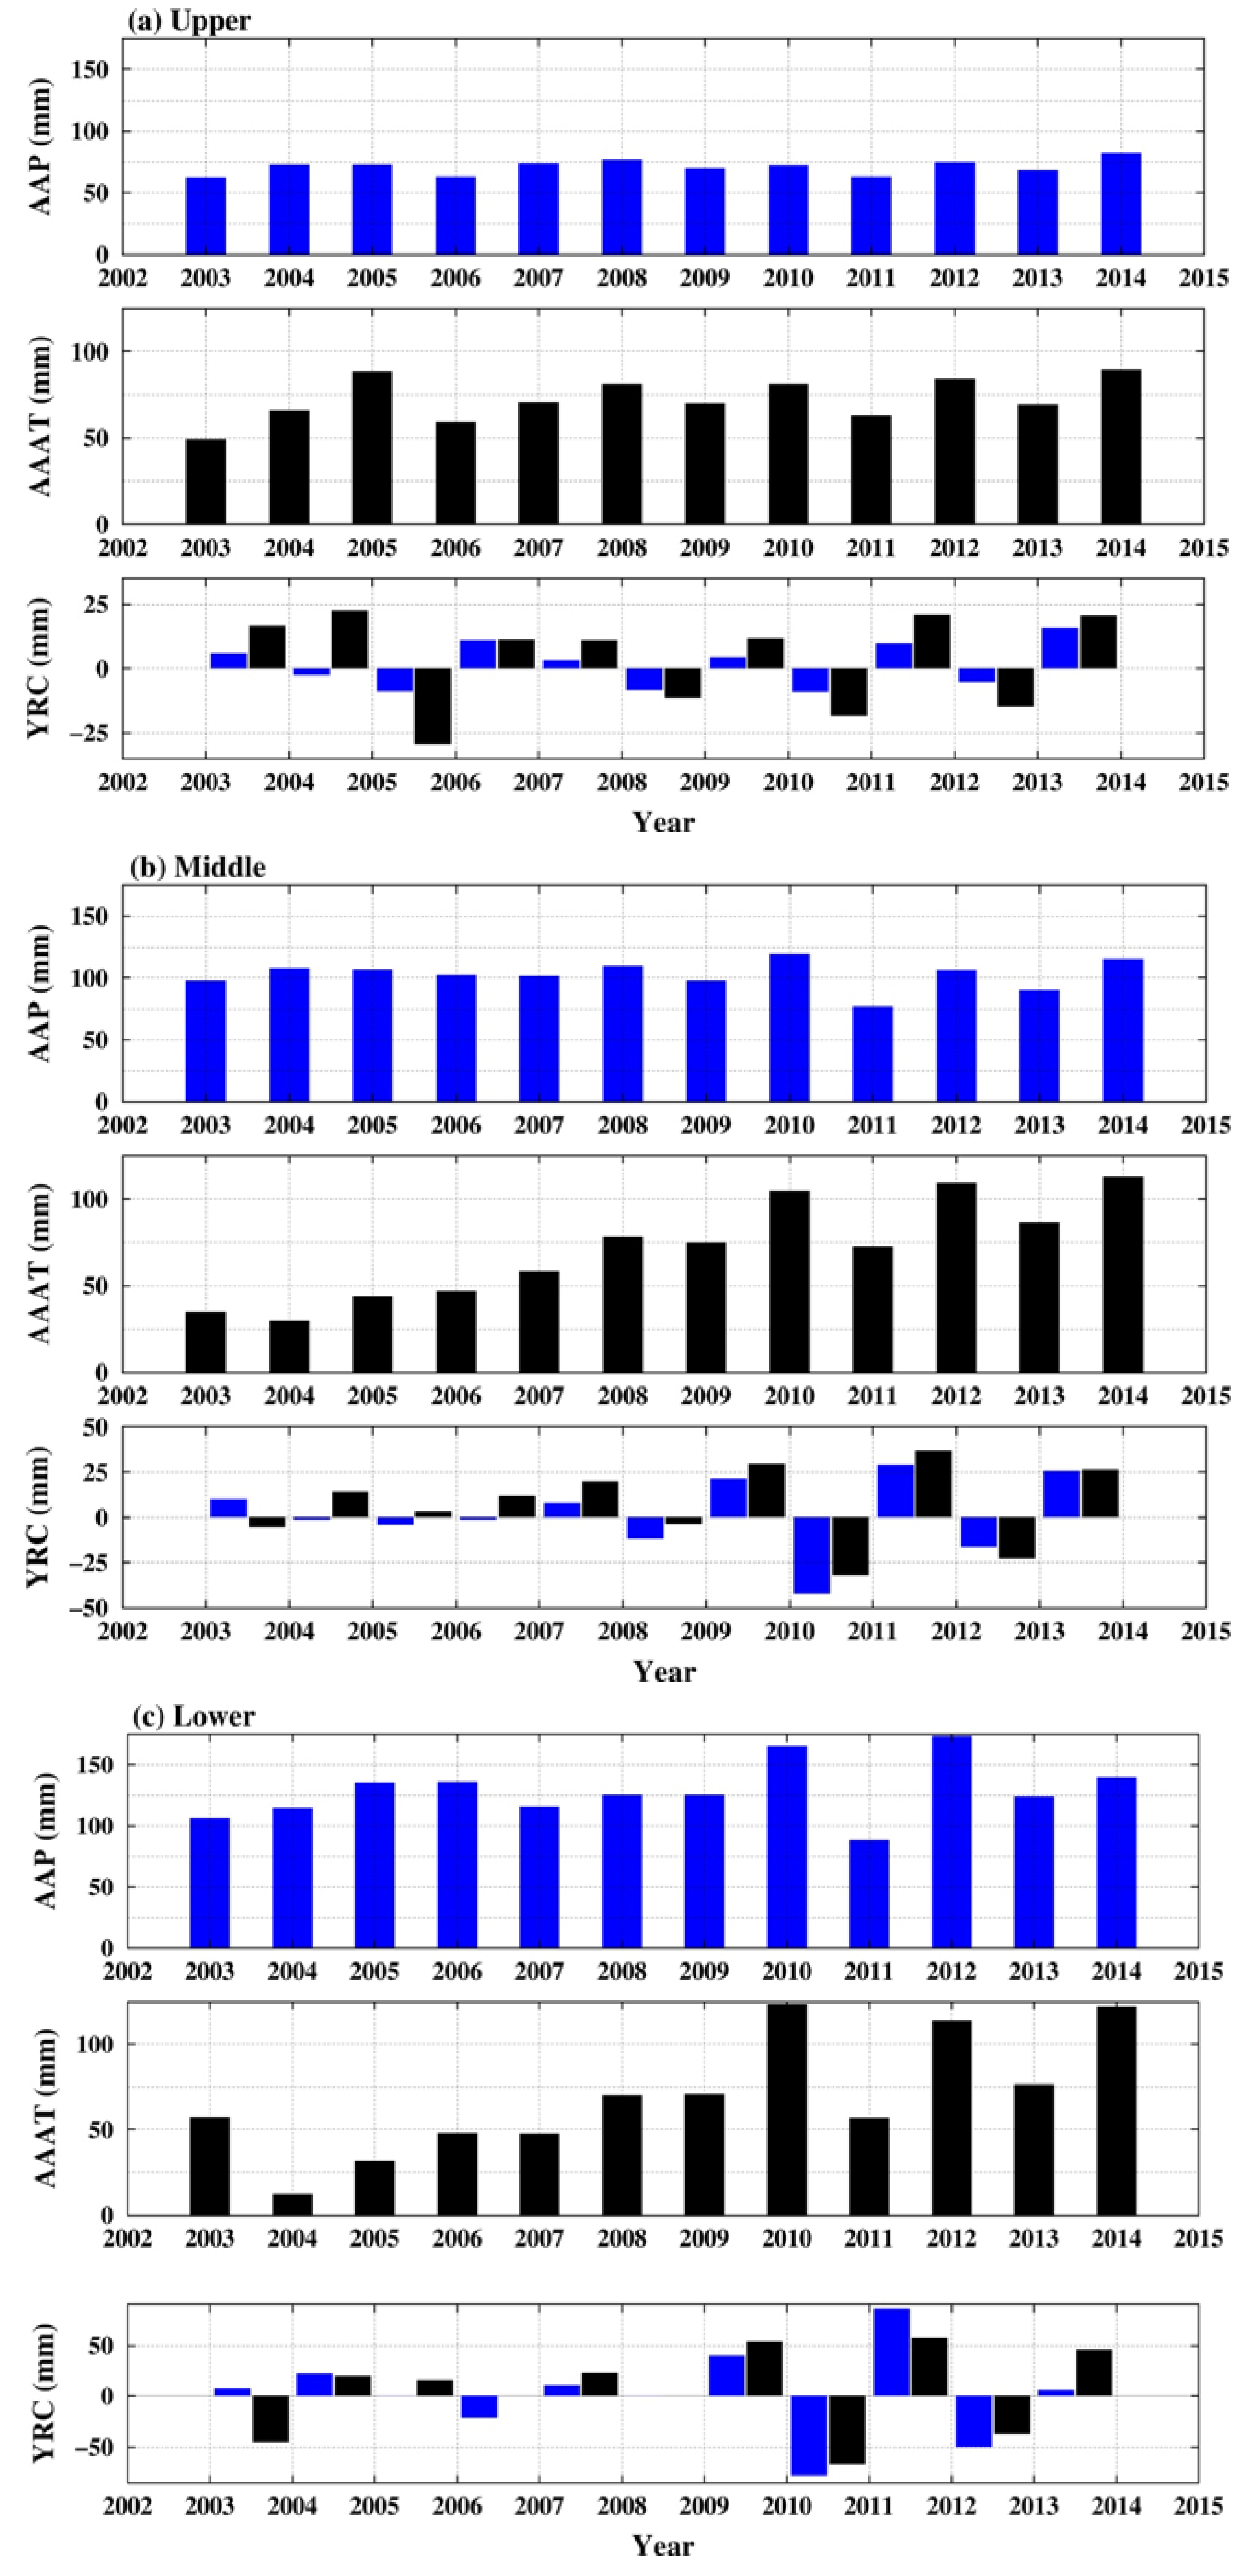
The precipitation and evaporation in the YBR were regular from 2003 to 2008. Hence, the possibility of natural drought was excluded. Because changes in the TTWS and droughts are closely related to that of precipitation without significant human activity [50,51], the Annual Average Precipitation (AAP) and Annual Average TTWS (AAT) in the YRB were calculated to determine whether TTWS in the YRB were influenced by non-natural factors. For a more intuitive comparison, the AAT values of the three sub-basins were adjusted by adding a constant, to ensure all Adjusted AAT (AAAT) values were positive (Figure 4), and the yearly relative change (YRC) of the AAP and AAAT were calculated as described in Ahmadalipour et al. [52]. The gap in the YRC between AAP and AAAT in the upper sub-basin from 2003 to 2005 is significant, and the gap gradually narrowed between 2006 and 2008 (Figure 4a). The inconsistency between AAP and AAAT YRCs in the middle and lower sub-basins from 2003 to 2008 was obvious (Figure 4b,c), and the AAP and AAAT in the three regions were highly consistent after 2009. The results demonstrate that the TTWS in the YRB from 2003 to 2008 was significantly affected by human activities and returned to normal in 2009.
The TGD began to operate in 2003 and achieved full capacity in 2009 after three major impoundments. The major impoundments of the TGD between 2003 and 2008 are listed in Table 2 [12,14], and the water level of the TGR changed from 66 to 172.3 m after the three major impoundments, which were the main human activities that may have significantly affected the TTWS and hydrological drought in the YRB. After construction was completed in 2009, the TGD impounded water from September to October and then discharged it from April to May every year. In this period, the operation of the TGD was geared toward adjusting floods and droughts in the middle and lower sub-basins of the YRB, and there were no significant water level changes in the TGR [12]. Thus, the operation of the TGD had little influence on the change in the TTWS in the YRB after 2009, as shown in Figure 4.
To estimate the effects of the three major TGD impoundments on the TTWS and hydrological drought in the YRB between 2003 and 2008, the TTWS time series from 2009 to 2015 unaffected by the TGD was extended to a longer time series (2002–2015) using natural data (soil moisture, precipitation, and surface temperature) based on the ANN approach [43]. The predicted TTWS time series is a NTWS time series that is unaffected by the TGD.
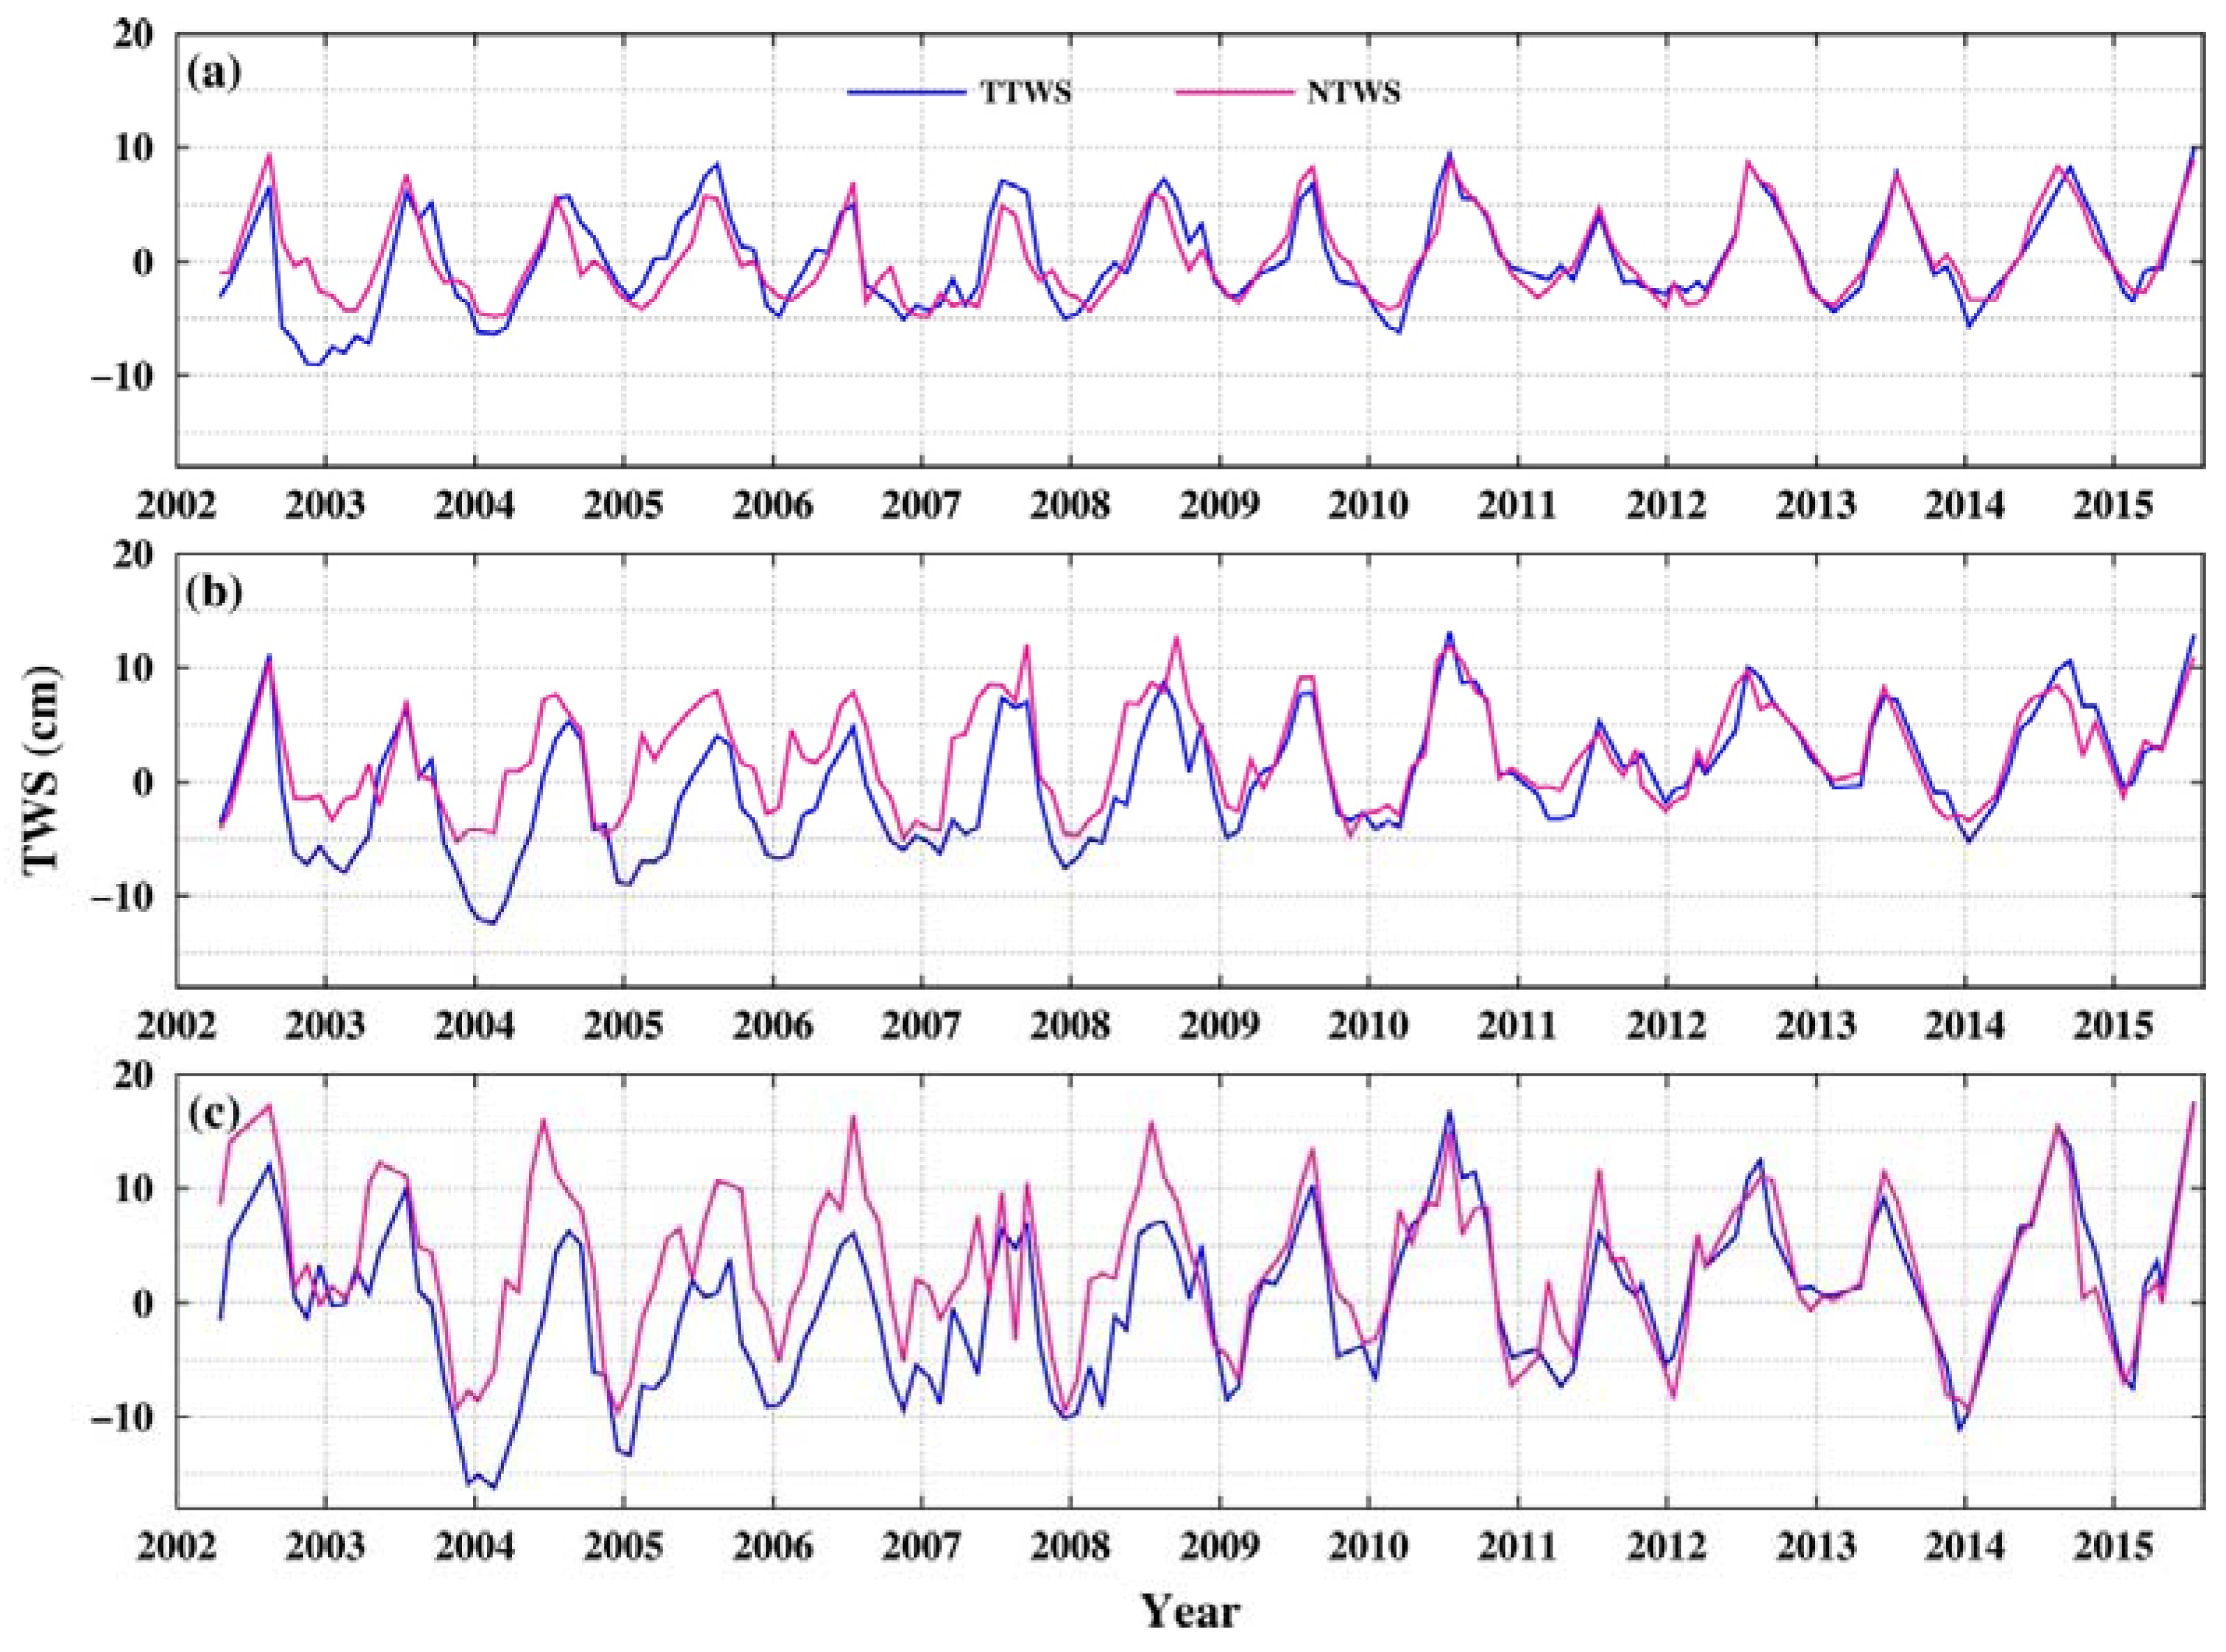
Figure 5 shows the TTWS time series and the NTWS time series predicted by the ANN approach. The predicted NTWS time series in the upper sub-basin had the highest accuracy among the three basins (Table 3). Compared with the area of the three regions and the accuracy of the ANN model, the accuracy of the ANN model is related to the area of the basin. The larger the area of the basin, the higher the accuracy of the ANN model. This is consistent with the result of Zhang et al. [47]. The NSE and R2 of the three sub-basins were greater than found by Zhang et al. [47]. They used the GRACE data (2003–2015) affected by the TGD in training the ANN model, which reduced the correlation between inputs and target data, whereas we used the “normal” GRACE data (2009–2015), which revealed results that are more accurate.
In this study, the GRACE TWS time series from 2009 to 2015 was defined not affected by the TGD construction and was used as a true value to text the accuracy of the NTWS based on Equations (3)–(5) (Table 3). However, the GRACE TWS contains measurement and the leakage error (Table 1). Therefore, the uncertainty (Table 3) of the NTWS was calculated by:
where is the uncertainty of the NTWS; and represent the measurement and leakage error of the GRACE TWS respectively.
The change in the TTWS is mainly caused by changes in soil moisture, groundwater, and surface water (Swenson and Wahr [34]); however, only groundwater may change rapidly with surface water in the short term [18]. Therefore, the inconsistency between the two (NTWS and TTWS) time series in the YRB is mainly due to the changes in groundwater and surface water.
4.3. DII of the YRB
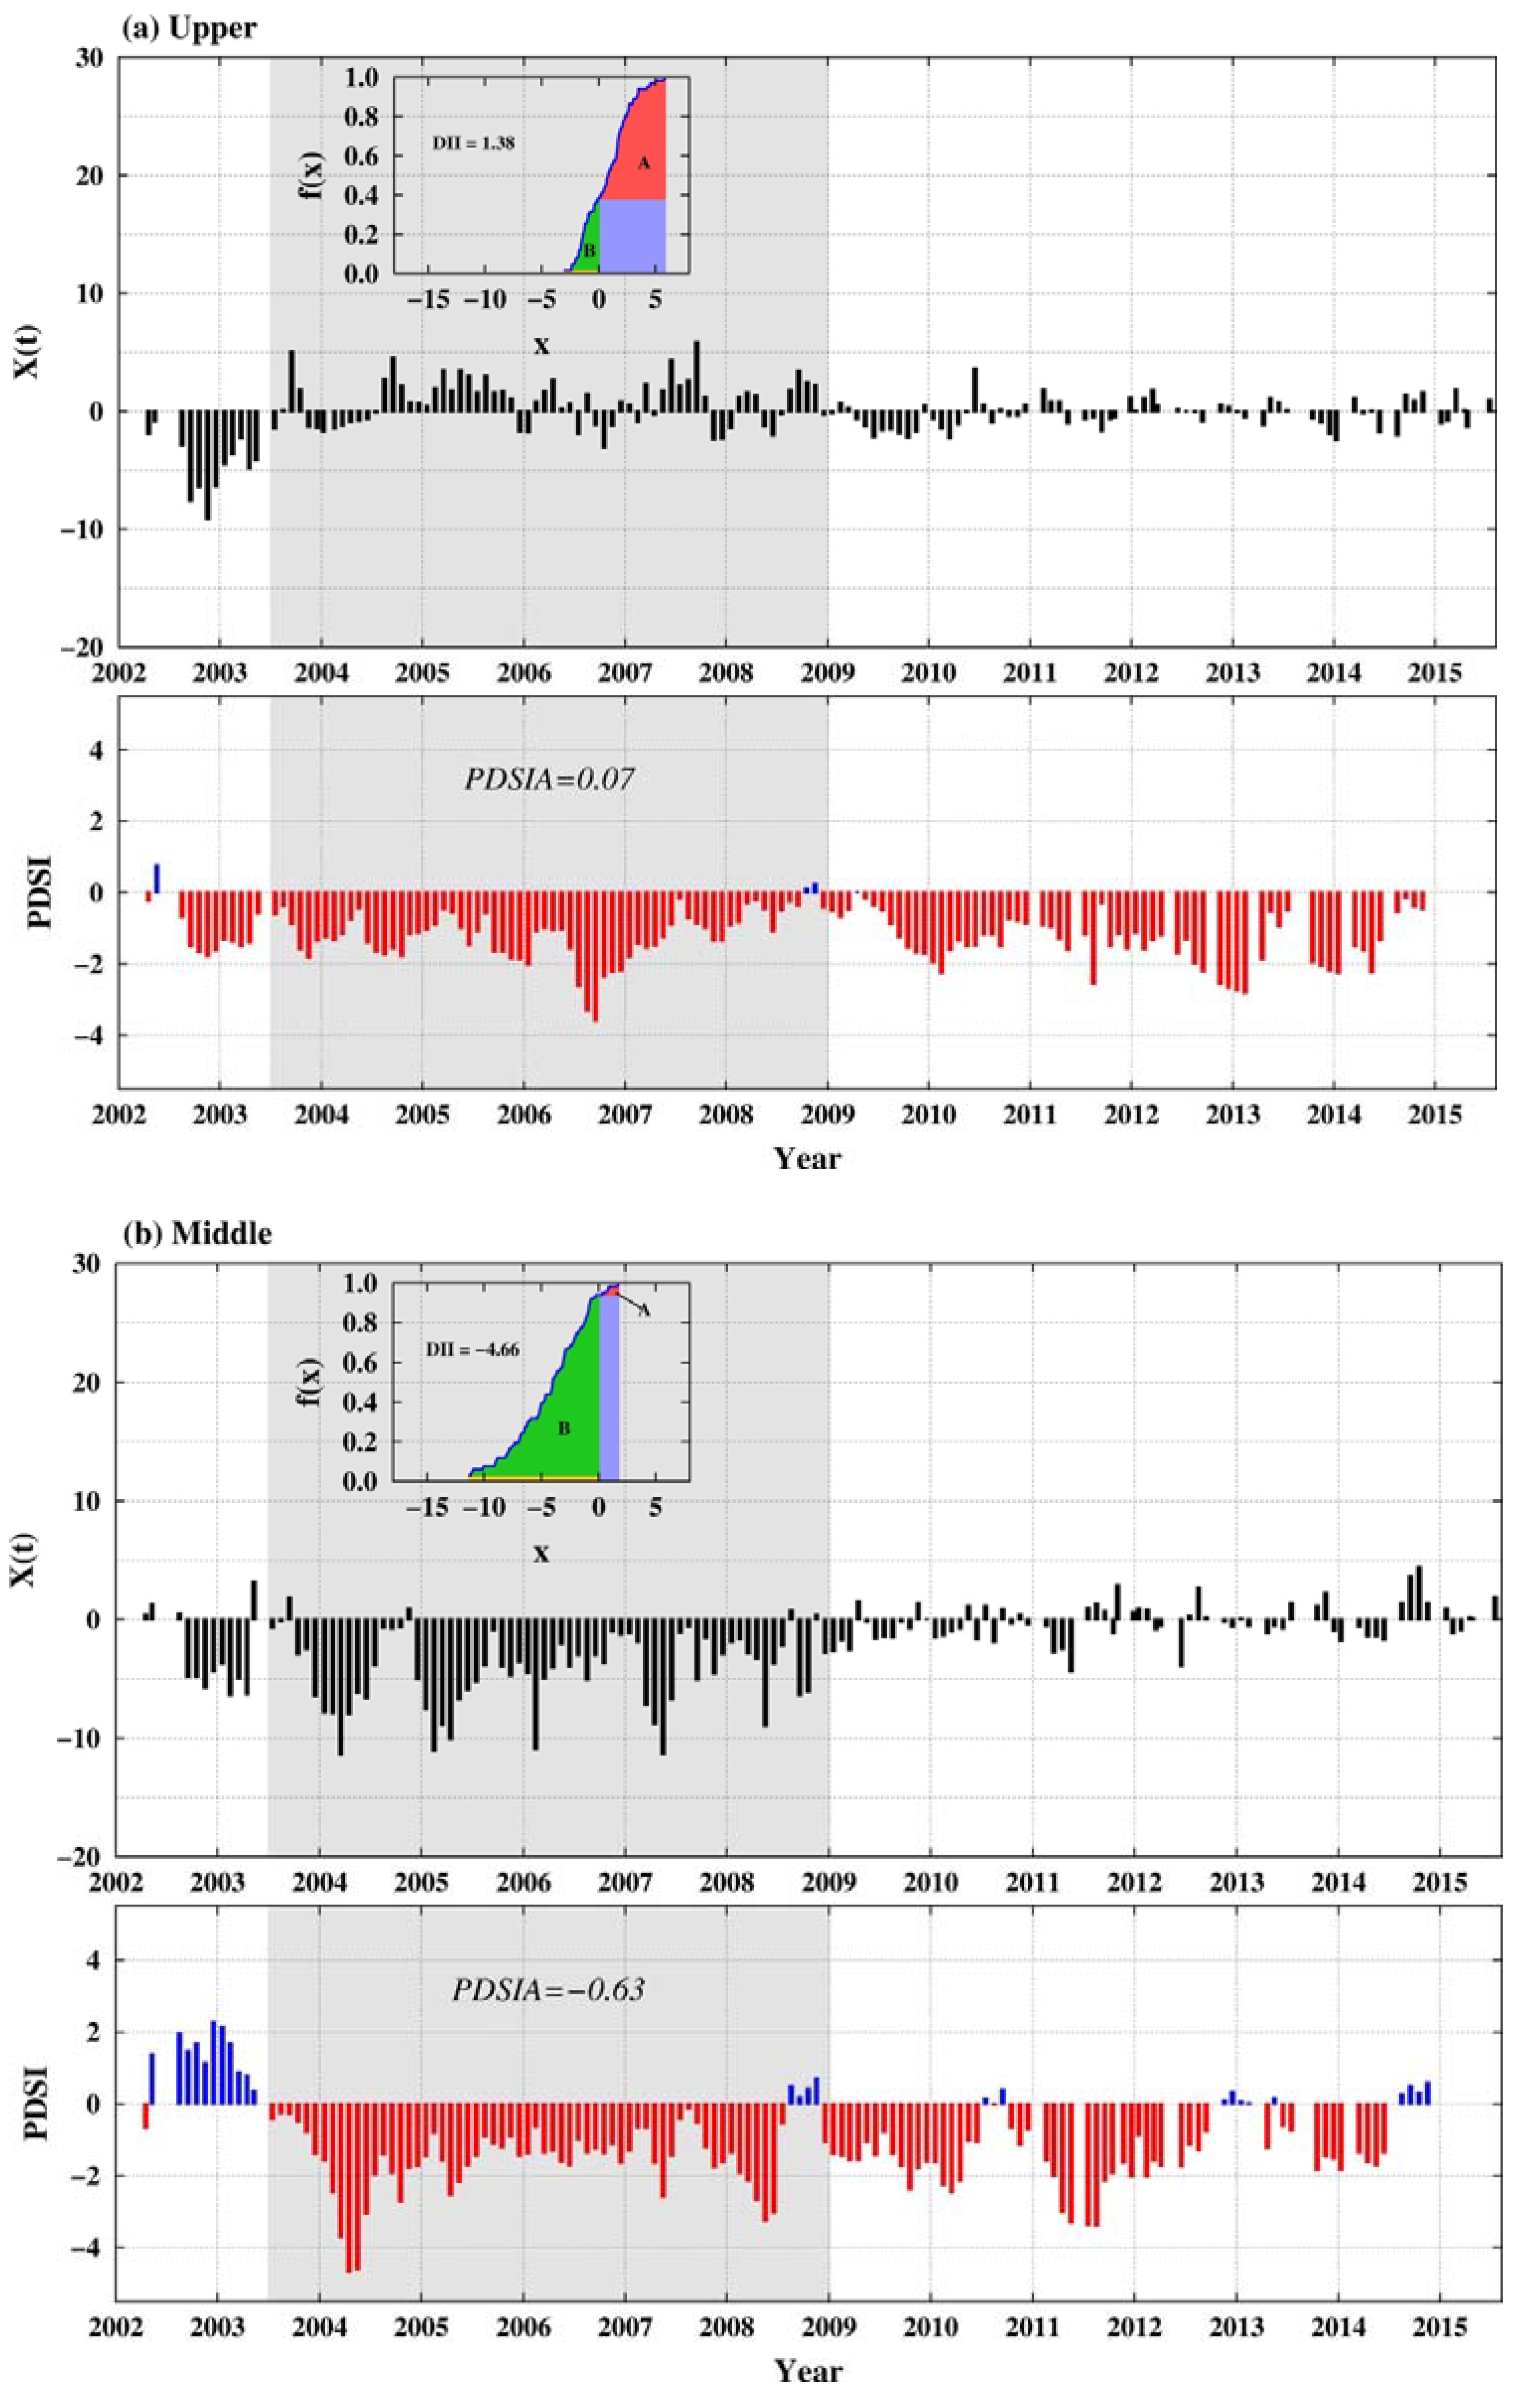
After obtaining the TTWS and the NTWS, the differences of the two time series from April 2002 to July 2015 were derived using Equation (6). The DIIs of the YRB between June 2003 and December 2008 were calculated based on Equation (7). To provide a decent validation for the DII, the Palmer Drought Severity Index (PDSI; Dai et al. [53]) of the YRB from April 2002 to December 2014 [54] was obtained (Figure 6). For comparison, the PDSI anomaly (PDSIA) in the YRB between June 2003 and December 2008 were estimated using the following equation:
where is the average PDSI during the TGD impoundment period between June 2003 and December 2008, and is the average PDSI of this period, calculated respectively by:
where t0 is April 2002, t1 is June 2003, t2 is December 2008, t3 is December 2014, and n1 and n2 are sum of the PDSIs in the two periods.
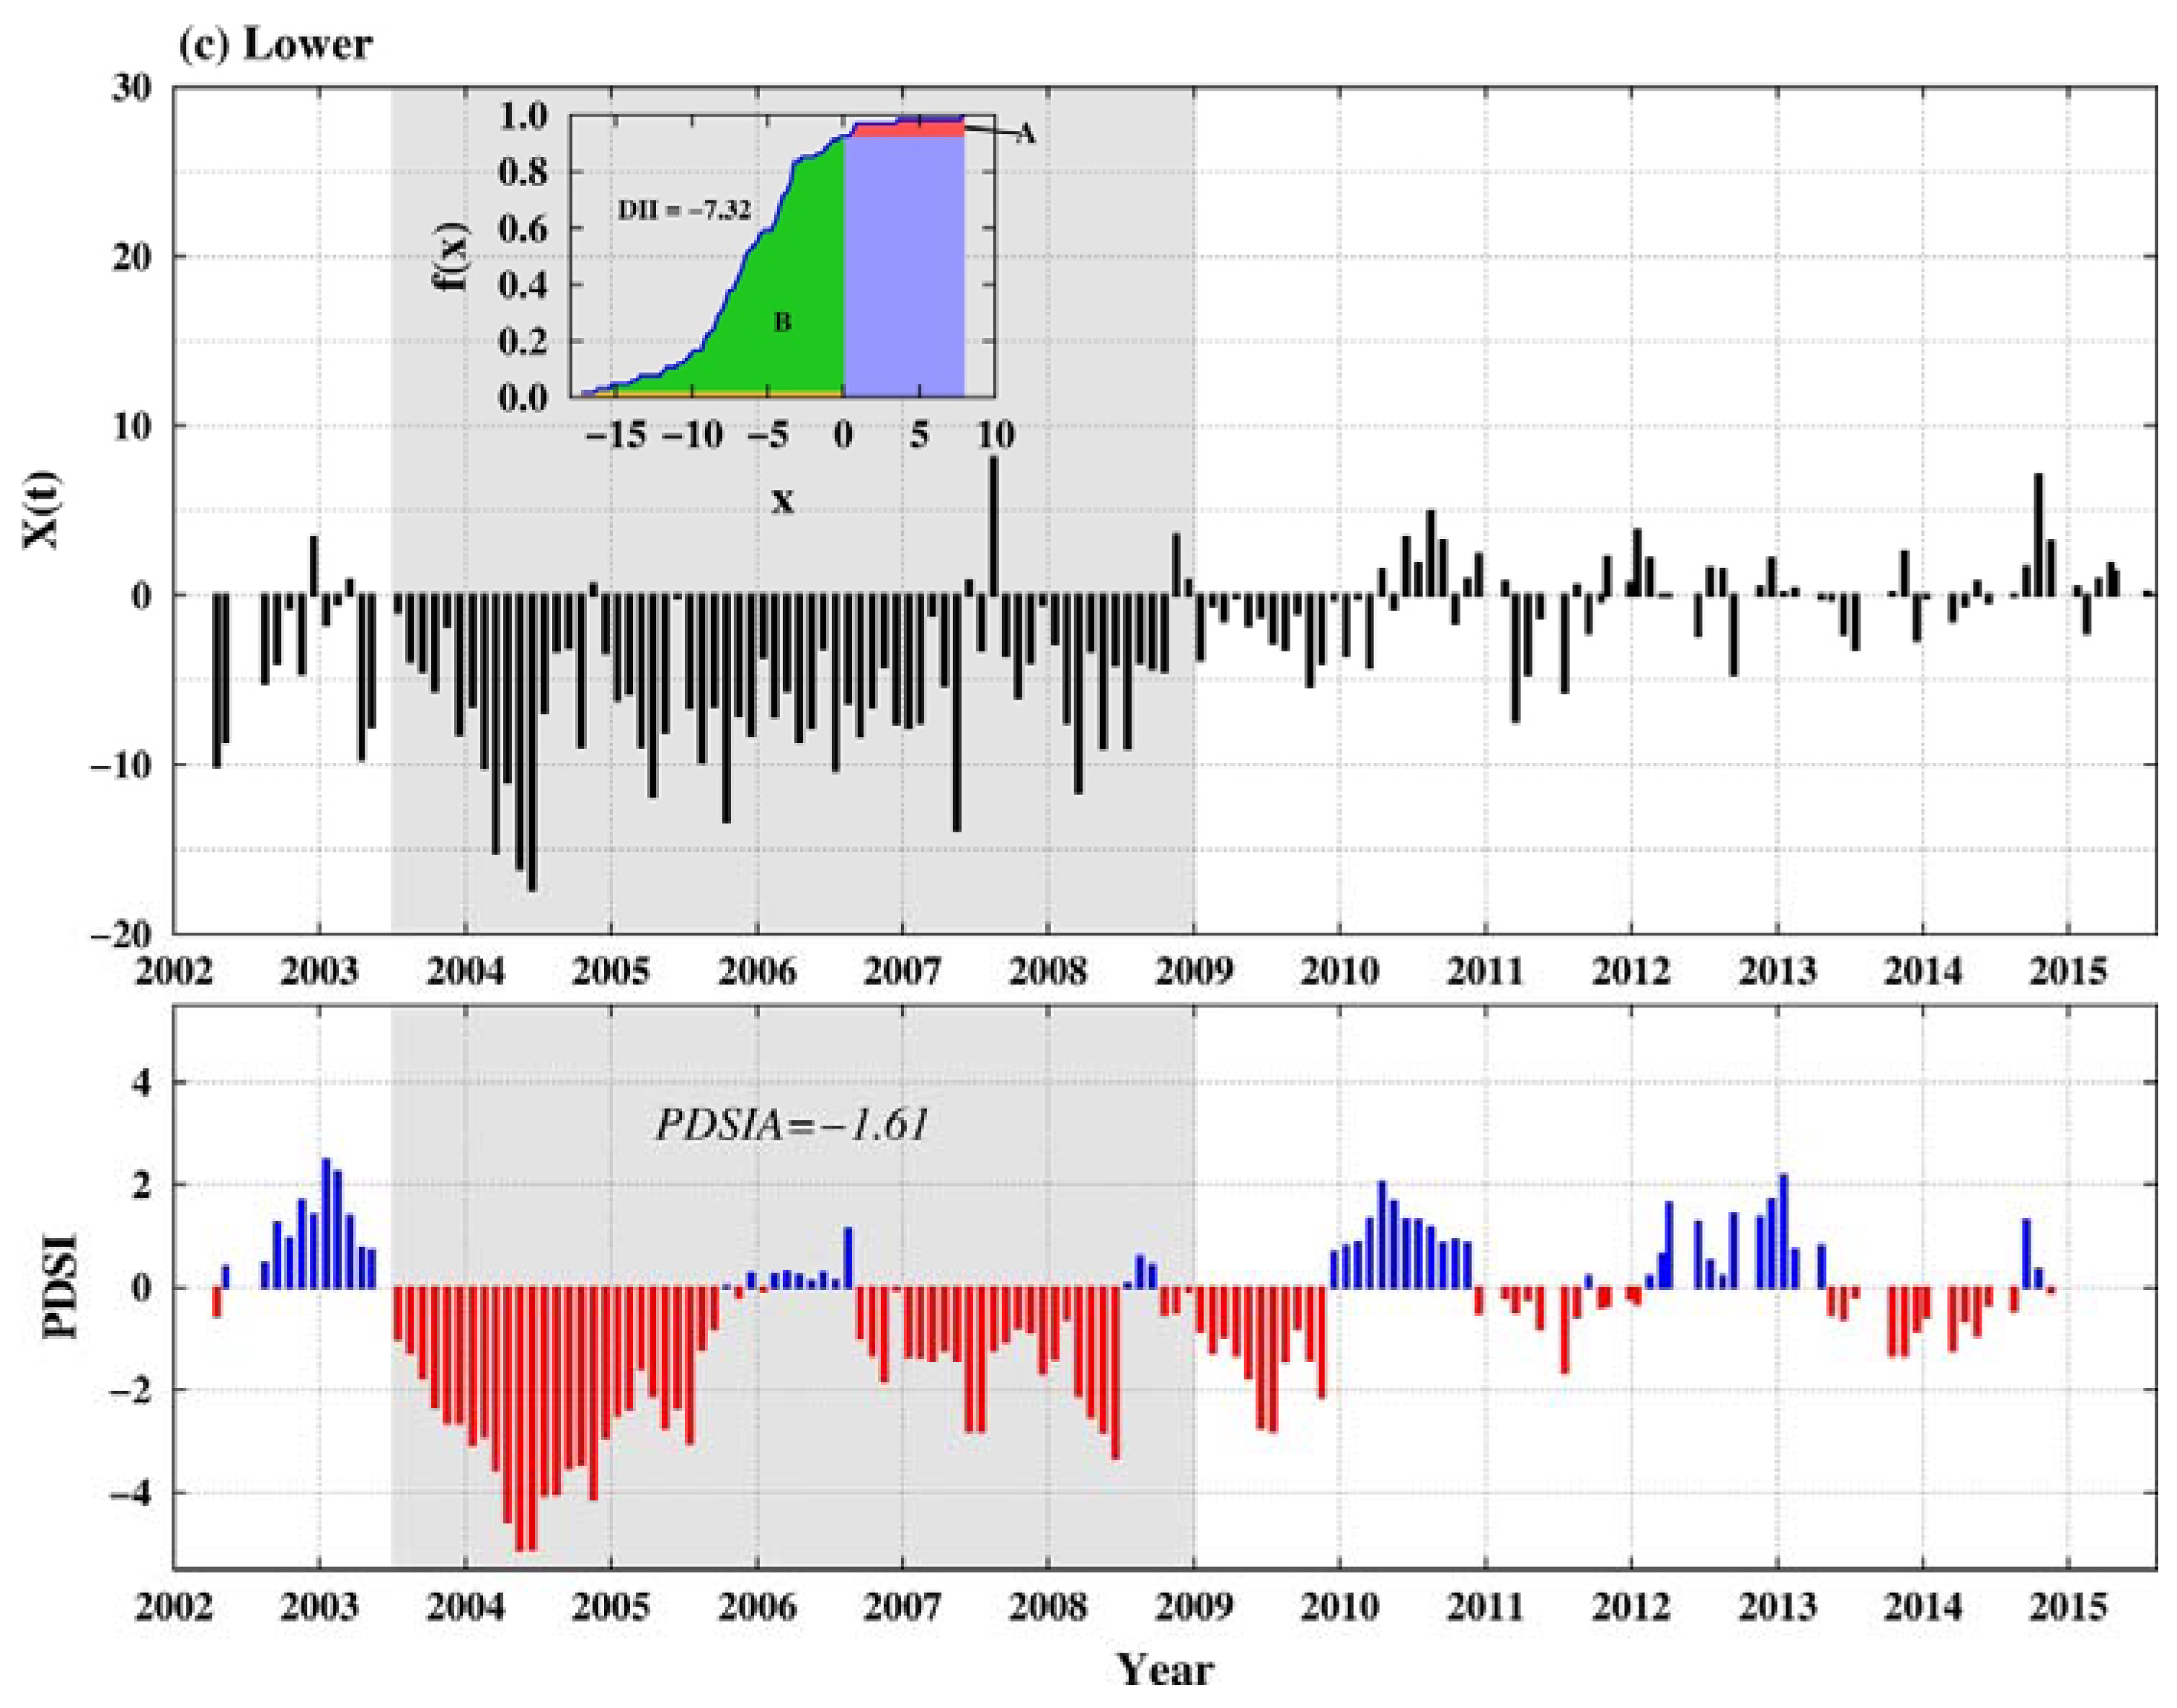
The DIIs of the upper, middle and lower sub-basins of the YRB between June 2003 and December 2008 were 1.38, −4.66, and −7.32, respectively (Figure 6). During this period, the DIIs in the middle and lower sub-basins of the YRB were far below zero, demonstrating that the impoundment of the TGD significantly reduced the TTWS in the middle and lower sub-basins. In the upper sub-basin, the DII was 1.38, which is an increase in TTWS.
The PDSIAs of the upper, middle and lower sub-basins of the YRB between June 2003 and December 2008 were 0.07, −0.63, and −1.61 (Figure 6), indicating that the PDSI slightly increased in the upper sub-basin and was greatly reduced in the middle and lower sub-basins during the TGD impoundment period, which is consistent to the DIIs of the three regions.
4.4. Characterization of the Hydrological Drought Events
According to Thomas et al. [23], the hydrological drought signals are calculated by removing the annual and seasonal cycles from the TTWS and the NTWS time series. Any instance in which the negative residuals (hydrological drought signals) last three or more consecutive months is designated a hydrological drought “event”. The severity of a drought event is calculated using the following equation [23]:
where M(t) and D(t) are the average water storage deficit and the duration of the hydrological drought event, respectively [23].
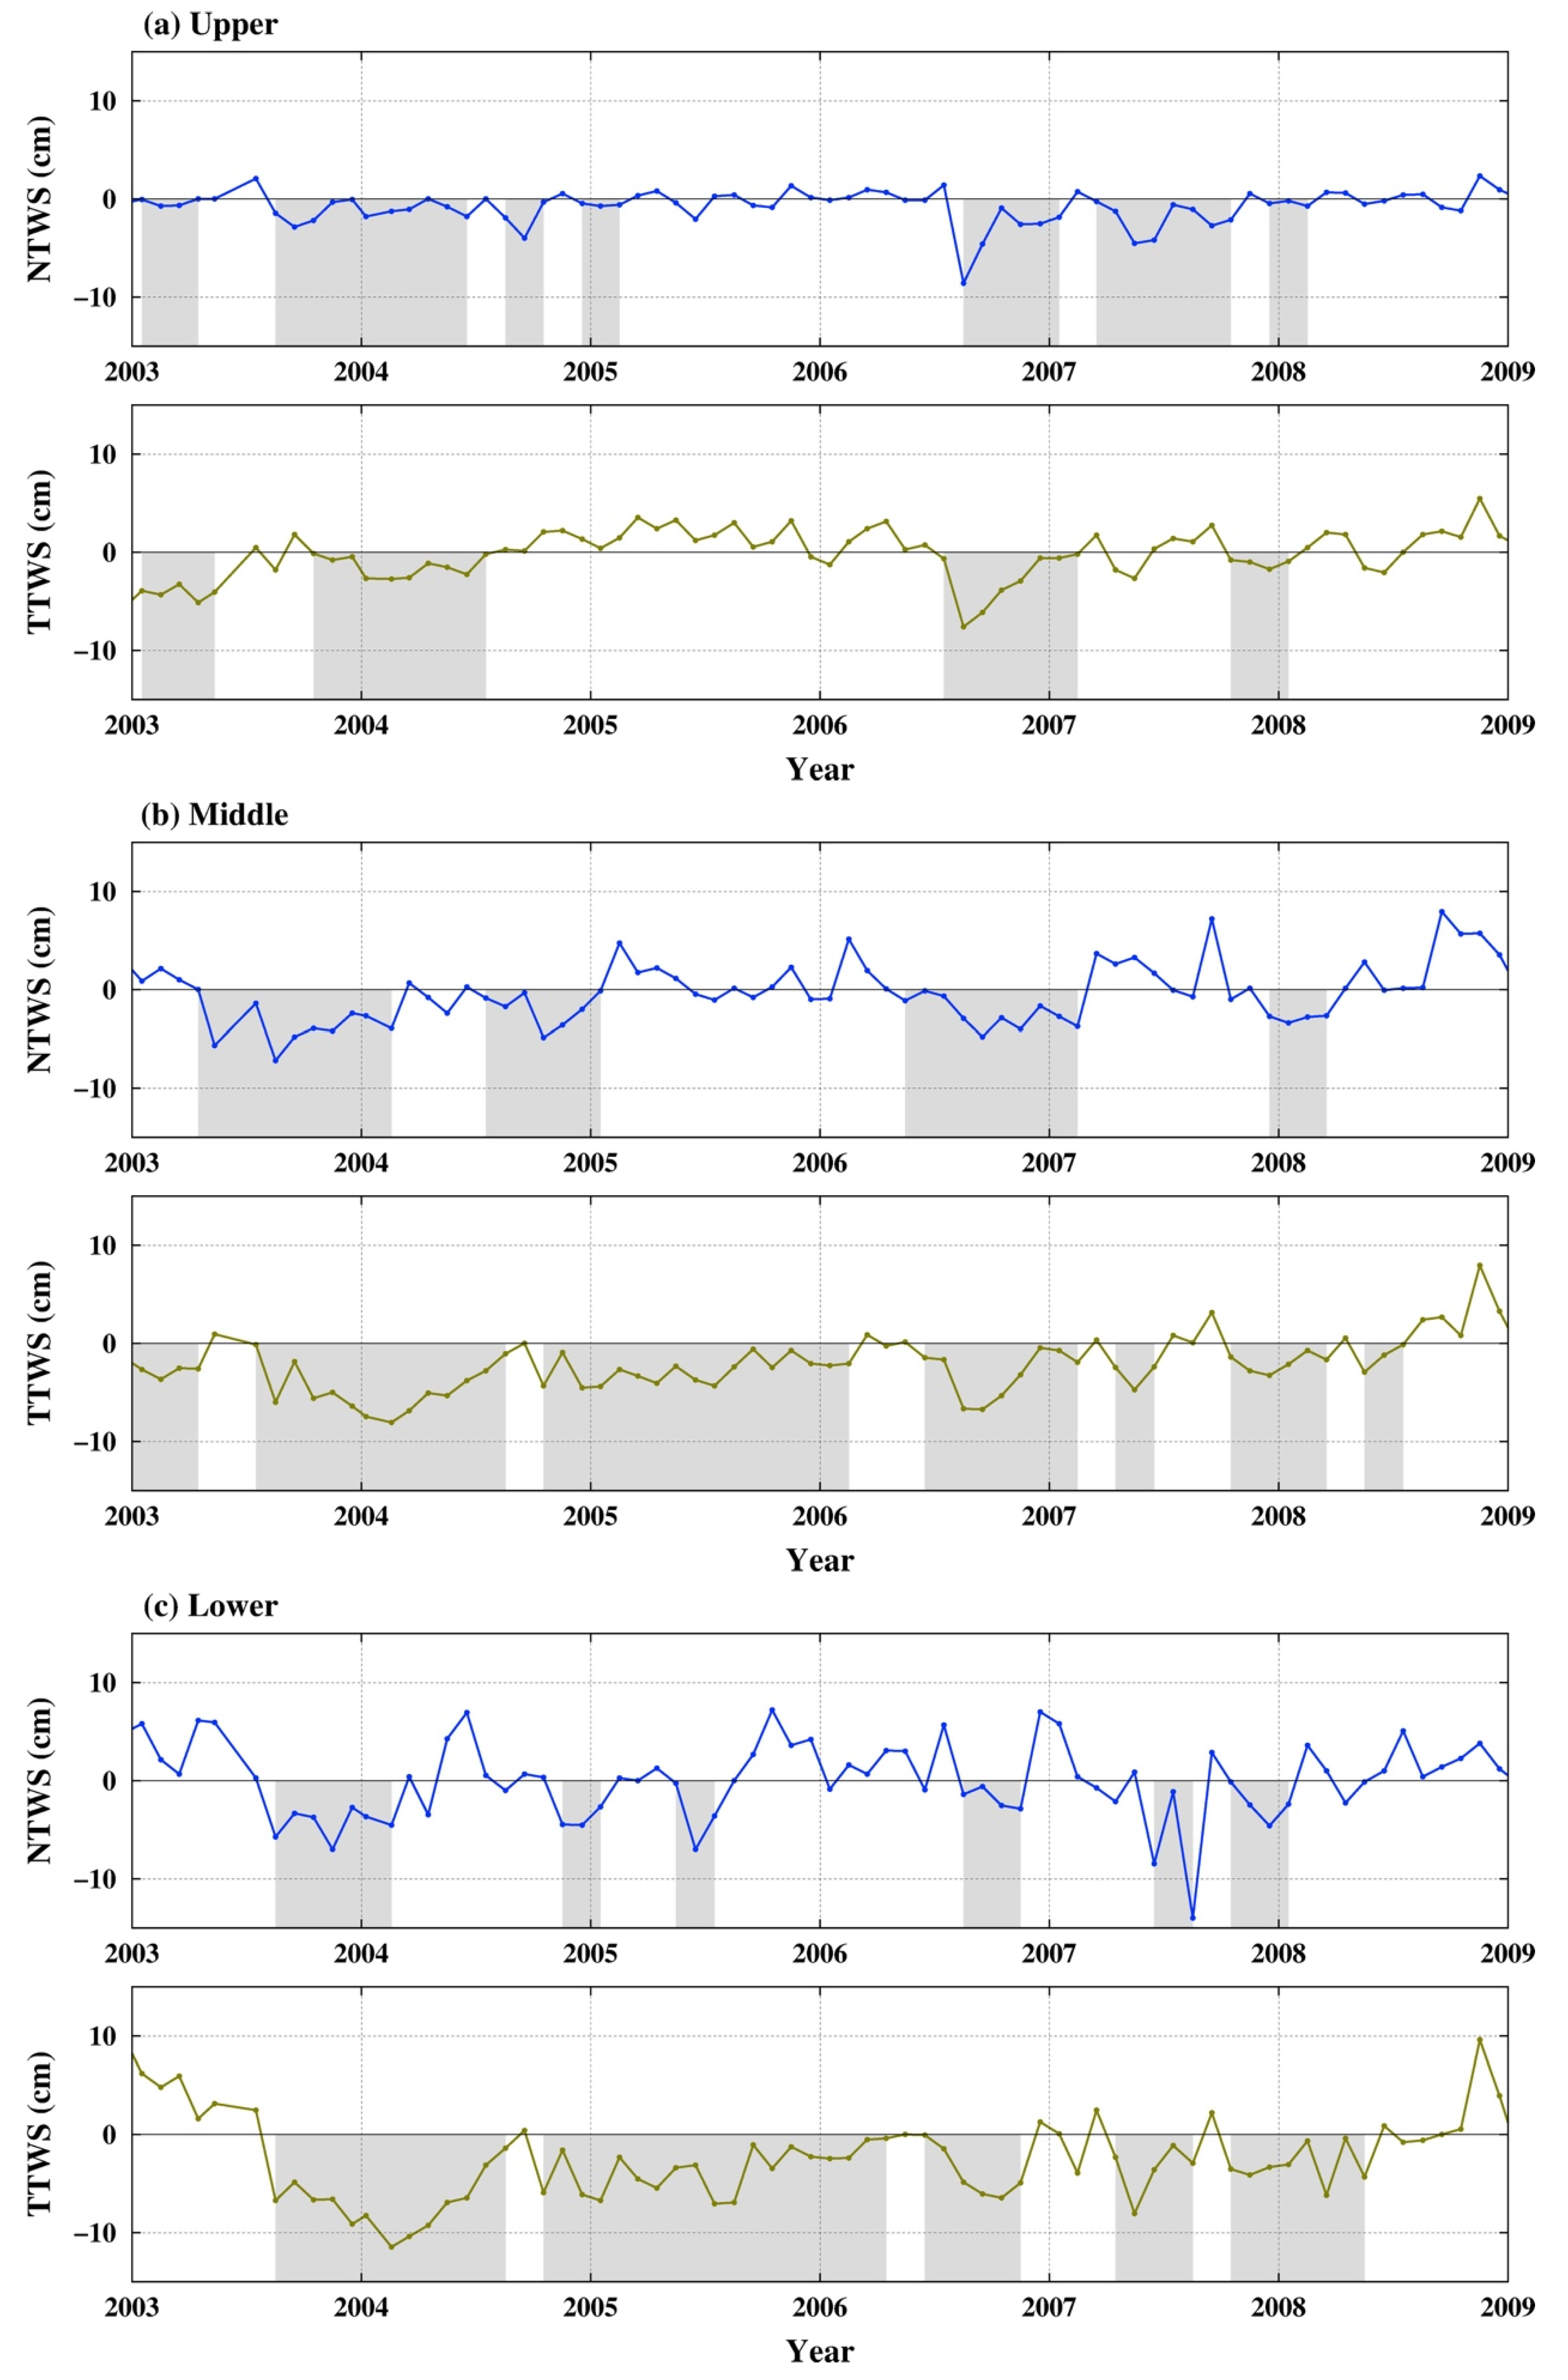
Figure 7 shows the hydrological drought signals from the NTWS and TTWS time series in the three sub-basins obtained using the method described in Thomas et al. [23]. Table 4 lists the frequency, duration, and severity of the hydrological drought events shown by the dark area in Figure 7 in the three sub-basins of the YRB calculated by the NTWS and the TTWS time series from 2003 to 2008. The total duration of hydrological drought in the upper sub-basin was reduced by 12 months, whereas the total duration in the middle and lower sub-basins increased by 25 and 27 months, respectively. The total severity of the hydrological drought in the upper sub-basin decreased by 3.49 km3/month, and the total severity increased by 473.16 and 381.24 km3/month in the middle and lower sub-basins, respectively. The results indicated that the impoundments of the TGD between 2003 and 2008 slightly alleviated the hydrological drought in the upper sub-basin of the YRB but significantly aggravated hydrological drought in the middle and lower sub-basins, which coincides with the DIIs and the PDSIAs.
5. Conclusions
The effects of the TGD impoundments on the YRB hydrological drought from 2003 to 2008 were evaluated based on the GRACE time-variable gravity field data. An ANN model was used to predict the NTWS of the YRB based on soil moisture, precipitation, and temperature data. From 2003 to 2008, the NTWS time series in the upper sub-basin was in good agreement with the TTWS time series, whereas the time series did not relate well to the middle and lower sub-basins, demonstrating the considerable effect of the TGD impoundments on the TTWS in the middle and lower sub-basins.
The DIIs that reflect the influence of the TGD on the TTWS in the three sub-basins were calculated based on the NTWS and the TTWS. The DIIs between June 2003 and December 2008 in the upper, middle, and lower sub-basins of the YRB were 1.38, −4.66, and −7.32, respectively. These results indicated that the three major TGD impoundments increased the TTWS in the upper sub-basin and reduced the TTWS in the middle and lower sub-basins. For verification, the PDSIA of the YRB during the TGD impoundments period between June 2003 and December 2008 were calculated. The PDSIAs in the upper, middle, and lower sub-basins of the YRB were 0.07, −0.63, and −1.61, respectively, which was consistent to the DIIs in the same regions.
The influence of the TGD impoundments on hydrological drought in the YRB from 2003 to 2008 was estimated based on the method used by Thomas et al. [23]. The total duration of hydrological drought events in the upper sub-basin decreased by 12 months, whereas in the middle and lower sub-basins, the drought duration increased by 25 and 27 months, respectively. The total drought severity was reduced by 3.49 km3/month in the upper sub-basin and increased by 473.16 and 381.24 km3/month in the middle and lower sub-basins during 2003–2008, respectively, thereby indicating that the TGD impoundments between 2003 and 2008 had little influence on the upper sub-basin but significantly aggravated hydrological drought in the middle and lower sub-basins. These results coincide with the results estimated by the DIIs and PDSIAs.
Author Contributions
N.C. initiated this study. F.L., Z.W., and N.C. carried out the data analyses and wrote the first draft; F.L. finalized the data interpretations and the draft; Q.S. helped with some of the plots and data analyses.
Funding
This study is supported by the NSFC (China), under Grants 41704011, 41674015, 41274032, 41474018, 41774019, and 41429401, By the China Postdoctoral Science Foundation funded project (2017M622451), by the National 973 Project of China, under Grants 2013CB733301 and 2013CB733302, by the Basic Research Foundation 16-01-01 of the Key Laboratory of Geospace Environment and Geodesy of Ministry of Education, Wuhan University, and by the Open Research Fund Program of the State Key Laboratory of Geodesy and Earth's Dynamics (Grant no. SKLGED2017-2-2-E).
Acknowledgments
The authors thank the following data providers for making the data available: GRACE-CSR, GRGS; GLDAS and TRMM.
Conflicts of Interest
The authors declare no conflict of interest.
References
- Wilhite, D.A.; Glantz, M.H. Understanding the drought phenomenon: The role of definitions. Water Int. 1985, 10, 111–120. [Google Scholar] [CrossRef]
- Keyantash, J.; Dracup, J.A. The Quantification of Drought: An Evaluation of Drought Indices. Bull. Am. Meteorol. Soc. 2002, 83, 1167–1180. [Google Scholar] [CrossRef]
- Leblanc, M.J.; Tregoning, P.; Ramillien, G.; Tweed, S.O.; Fakes, A. Basin-scale, integrated observations of the early 21st century multiyear drought in Southeast Australia. Water Resour. Res. 2009, 45, 546–550. [Google Scholar] [CrossRef]
- Hisdal, H.; Tallaksen, L.M. Estimation of regional meteorological and hydrological drought characteristics: A case study for Denmark. J. Hydrol. 2003, 281, 230–247. [Google Scholar] [CrossRef]
- Akyuz, D.E.; Bayazit, M.; Onoz, B. Markov Chain Models for Hydrological Drought Characteristics. J. Hydrometeorol. 2012, 13, 298–309. [Google Scholar] [CrossRef]
- Dai, Z.; Du, J.; Li, J.; Li, W.; Chen, J. Runoff characteristics of the Changjiang River during 2006: Effect of extreme drought and the impounding of the Three Gorges Dam. Geophys. Res. Lett. 2008, 35, 521–539. [Google Scholar] [CrossRef]
- Zhang, Q.; Li, L.; Wang, Y.G.; Werner, A.D.; Xin, P.; Jiang, T.; Barry, D.A. Has the Three-Gorges Dam made the Poyang Lake wetlands wetter and drier? Geophys. Res. Lett. 2012, 39, L20402.1–L20402.7. [Google Scholar] [CrossRef]
- Graf, W.L. Dam Nation: A Geographic Census of American Dams and Their Large-Scale Hydrologic Impacts. Water Resour. Res. 1999, 35, 1305–1311. [Google Scholar] [CrossRef]
- Kittinger, J.N.; Coontz, K.M.; Yuan, Z.; Han, D.; Zhao, X.; Wilcox, B.A. Toward holistic evaluation and assessment: Linking ecosystems and human well-being for the Three Gorges Dam. EcoHealth 2009, 6, 601–613. [Google Scholar] [CrossRef] [PubMed]
- Mccartney, M. Living with dams: Managing the environmental impacts. Water Policy 2009, 11, 121–139. [Google Scholar] [CrossRef]
- Bai, Y.; Xie, J.; Wang, X.; Li, C. Model fusion approach for monthly reservoir inflow forecasting. J. Hydroinform. 2016, 18, 634–650. [Google Scholar] [CrossRef]
- Lai, X.; Liang, Q.; Huang, Q.; Jiang, J.; Lu, X.X. Numerical evaluation of flow regime changes induced by the Three Gorges Dam in the Middle Yangtze. Hydrol. Res. 2016, 47, 149–160. [Google Scholar] [CrossRef]
- Li, R.; Chen, Q.; Ye, F. Modelling the impacts of reservoir operations on the downstream riparian vegetation and fish habitats in the Lijiang River. J. Hydroinform. 2011, 13, 229–244. [Google Scholar] [CrossRef]
- Li, S.; Xiong, L.; Dong, L.; Zhang, J. Effects of the Three Gorges Reservoir on the hydrological droughts at the downstream Yichang station during 2003–2011. Hydrol. Process. 2013, 27, 3981–3993. [Google Scholar] [CrossRef]
- Lai, X.; Jiang, J.; Yang, G.; Lu, X.X. Should the Three Gorges Dam be blamed for the extremely low water levels in the middle–lower Yangtze River? Hydrol. Process. 2014, 28, 150–160. [Google Scholar] [CrossRef]
- Liu, Y.; Wu, G.; Guo, R.; Wan, R. Changing landscapes by damming: The Three Gorges Dam causes downstream lake shrinkage and severe droughts. Landsc. Ecol. 2016, 31, 1883–1890. [Google Scholar] [CrossRef]
- Lai, X.; Jiang, J.; Liang, Q.; Huang, Q. Large-scale hydrodynamic modeling of the middle Yangtze River Basin with complex river–lake interactions. J. Hydrol. 2013, 492, 228–243. [Google Scholar] [CrossRef]
- Cai, X.; Feng, L.; Wang, Y.; Chen, X. Influence of the Three Gorges Project on the Water Resource Components of Poyang Lake Watershed: Observations from TRMM and GRACE. Adv. Meteorol. 2015, 1–7. [Google Scholar] [CrossRef]
- Tapley, B.D.; Bettadpur, S.; Watkins, M.; Reigber, C. The gravity recovery and climate experiment mission overview and early results. Geophys. Res. Lett. 2004, 31, L09607. [Google Scholar] [CrossRef]
- Yirdaw, S.Z.; Snelgrove, K.R.; Agboma, C.O. GRACE satellite observations of terrestrial moisture changes for drought characterization in the Canadian Prairie. J. Hydrol. 2008, 356, 84–92. [Google Scholar] [CrossRef]
- Chen, J.L.; Wilson, C.R.; Tapley, B.D.; Yang, Z.L.; Niu, G.Y. 2005 drought event in the Amazon River basin as measured by GRACE and estimated by climate models. J. Geophys. Res. Atmos. 2009, 114, B05404. [Google Scholar] [CrossRef]
- Frappart, F.; Papa, F.; da Silva, J.S.; Ramillien, G.; Prigent, C.; Seyler, F.; Calmant, S. Surface freshwater storage and dynamics in the Amazon basin during the 2005 exceptional drought. Environ. Res. Lett. 2012, 7, 44010–44017. [Google Scholar] [CrossRef] [Green Version]
- Thomas, A.C.; Reager, J.T.; Famiglietti, J.S.; Rodell, M. A GRACE-based water storage deficit approach for hydrological drought characterization. Geophys. Res. Lett. 2014, 41, 1537–1545. [Google Scholar] [CrossRef]
- Chao, N.; Wang, Z.; Jiang, W.; Chao, D. A quantitative approach for hydrological drought characterization in Southwestern China using GRACE. Hydrogeol. J. 2016, 24, 1–11. [Google Scholar] [CrossRef]
- Gong, L.; Xu, C.Y.; Chen, D.; Halldin, S.; Chen, Y.D. Sensitivity of the Penman–Monteith reference evapotranspiration to key climatic variables in the Changjiang (Yangtze River) Basin. J. Hydrol. 2006, 329, 620–629. [Google Scholar] [CrossRef]
- Hu, X.; Chen, J.; Zhou, Y.; Huang, C.; Liao, X. Seasonal water storage change of the Yangtze River Basin detected by GRACE. Sci. China Earth Sci. 2006, 49, 483–491. [Google Scholar] [CrossRef]
- Long, D.; Yang, Y.; Wada, Y.; Hong, Y.; Liang, W.; Chen, Y.; Yong, B.; Hou, Z.; Wei, J.; Chen, L. Deriving scaling factors using a global hydrological model to restore GRACE total water storage changes for China’s Yangtze River Basin. Remote Sens. Environ. 2015, 168, 177–193. [Google Scholar] [CrossRef]
- Zhang, Z.; Chao, B.F.; Chen, J.; Wilson, C.R. Terrestrial water storage anomalies of Yangtze River Basin droughts observed by GRACE and connections with ENSO. Glob. Planet. Chang. 2015, 126, 35–45. [Google Scholar] [CrossRef]
- Swenson, S.; Chambers, D.; Wahr, J. Estimating geocenter variations from a combination of GRACE and ocean model output. J. Geophys. Res. 2008, 113, B08410. [Google Scholar] [CrossRef]
- Cheng, M.; Ries, J.C.; Tapley, B.D. Variations of the Earth’s figure axis from satellite laser ranging and GRACE. J. Geophys. Res. Solid Earth 2011, 116. [Google Scholar] [CrossRef]
- Peltier, W.R. global glacial isostasy and the surface of the ice-age earth: The ICE-5G (VM2) model and GRACE. Annu. Rev. Earth Planet. Sci. 2004, 20, 111–149. [Google Scholar] [CrossRef]
- Wahr, A.; Zhong, S. Computations of the viscoelastic response of a 3-D compressible Earth to surface loading: An application to Glacial Isostatic Adjustment in Antarctica and Canada. Geophys. J. Int. 2013, 192, 557–572. [Google Scholar] [CrossRef]
- Wahr, J.; Molenaar, M.; Bryan, F. Time variability of the Earth’s gravity field: Hydrological and oceanic effects and their possible detection using GRACE. J. Geophys. Res. Solid Earth 1998, 103, 30205–30230. [Google Scholar] [CrossRef]
- Swenson, S.; Wahr, J.; Milly, P.C.D. Estimated accuracies of regional water storage variations inferred from the Gravity Recovery and Climate Experiment (GRACE). Water Resour. Res. 2003, 39, 375–384. [Google Scholar] [CrossRef]
- Swenson, S.; Wahr, J. Post-processing removal of correlated errors in GRACE data. Geophys. Res. Lett. 2006, 33, 2006. [Google Scholar] [CrossRef]
- Swenson, S.C.; Wahr, J.M. Estimating signal loss in regularized GRACE gravity field solutions. Geophys. J. Int. 2011, 185, 693–702. [Google Scholar] [CrossRef]
- Swenson, S.; Wahr, J. Multi-sensor analysis of water storage variations in the Caspian Sea. Geophys. Res. Lett. 2007, 34, L16401. [Google Scholar] [CrossRef]
- Rodell, M.; Famiglietti, J.S.; Chen, J.; Seneviratne, S.I.; Viterbo, P.; Holl, S.; Wilson, C.R. Basin scale estimates of evapotranspiration using GRACE and other observations. Geophys. Res. Lett. 2004, 31, 183–213. [Google Scholar] [CrossRef]
- Klees, R.; Zapreeva, E.A.; Winsemius, H.C.; Savenije, H.H.G. The bias in GRACE estimates of continental water storage variations. Hydrol. Earth Syst. Sci. 2007, 11, 1227–1241. [Google Scholar] [CrossRef]
- Landerer, F.W.; Swenson, S.C. Accuracy of scaled GRACE terrestrial water storage estimates. Water Resour. Res. 2012, 48. [Google Scholar] [CrossRef]
- Rodell, M. The global land data assimilation system. Bull. Am. Meteorol. Soc. 2004, 85, 381–394. [Google Scholar] [CrossRef]
- Wang, W.; Cui, W.; Wang, X.; Chen, X. Evaluation of GLDAS-1 and GLDAS-2 forcing data and Noah model simulations over China at monthly scale. J. Hydrometeorol. 2016, 17, 2815–2833. [Google Scholar] [CrossRef]
- Huffman, G.J.; Adler, R.F.; Bolvin, D.T.; Gu, G. Improving the global precipitation record: GPCP Version 2.1. Geophys. Res. Lett. 2009, 36, 153–159. [Google Scholar] [CrossRef]
- Long, D.; Shen, Y.; Sun, A.; Hong, Y.; Longuevergne, L.; Yang, Y.; Longuevergne, L.; Yang, Y.; Li, B.; Chen, L. Drought and flood monitoring for a large karst plateau in Southwest China using extended GRACE data. Remote Sens. Environ. 2014, 155, 145–160. [Google Scholar] [CrossRef]
- Huang, Y.; Salama, M.S.; Krol, M.S.; van der Velde, R.; Hoekstra, A.Y.; Zhou, Y.; Su, Z. Analysis of long-term terrestrial water storage variations in the Yangtze River basin. Hydrol. Earth Syst. Sci. Discuss. 2012, 9, 11487–11520. [Google Scholar] [CrossRef]
- Sun, Y. Predicting groundwater level changes using GRACE data. Water Resour. Res. 2013, 49, 5900–5912. [Google Scholar] [CrossRef]
- Zhang, D.; Zhang, Q.; Werner, A.D.; Liu, X. GRACE-Based Hydrological Drought Evaluation of the Yangtze River Basin, China. J. Hydrometeorol. 2016, 17, 811–828. [Google Scholar] [CrossRef]
- Huang, Y.; Salama, M.S.; Krol, M.S.; Su, Z.; Hoekstra, A.Y.; Zeng, Y.; Zhou, Y. Estimation of human-induced changes in terrestrial water storage through integration of GRACE satellite detection and hydrological modeling: A case study of the Yangtze River Basin. Water Resour. Res. 2015, 51, 8494–8516. [Google Scholar] [CrossRef]
- Wahr, J.; Swenson, S.; Velicogna, I. Accuracy of GRACE mass estimates. Geophys. Res. Lett. 2006, 33, 178–196. [Google Scholar] [CrossRef]
- Hossein, S.Z.; Han, M.S.; Gyewoon, C. Evaluation of Regional Droughts Using Monthly Gridded Precipitation for Korea. J. Hydroinform. 2012, 14, 1036–1050. [Google Scholar] [CrossRef]
- Zhang, N.; Xia, Z.; Zhang, S.; Jiang, H. Temporal and spatial characteristics of precipitation and droughts in the upper reaches of the Yangtze River basin (China) in recent five decades. J. Hydroinform. 2012, 14, 221–235. [Google Scholar] [CrossRef]
- Ahmadalipour, A.; Rana, A.; Moradkhani, H.; Sharma, A. Multi-criteria evaluation of CMIP5 GCMs for climate change impact analysis. Theor. Appl. Climatol. 2015, 1–17. [Google Scholar] [CrossRef]
- Dai, A.; Trenberth, K.E.; Qian, T. A Global Dataset of Palmer Drought Severity Index for 1870–2002: Relationship with soil moisture and effects of surface warming. J. Hydrometeorol. 2004, 5, 1117–1130. [Google Scholar] [CrossRef]
- Dai, A. Drought under global warming: A review. Wiley Interdiscip. Rev. Clim. Chang. 2011, 2, 45–65. [Google Scholar] [CrossRef]
Figure 1.
Map of the upper, middle, and lower sub-basins and the mainstream and tributaries of Yangtze River Basin (YRB).
Figure 1.
Map of the upper, middle, and lower sub-basins and the mainstream and tributaries of Yangtze River Basin (YRB).

Figure 2.
The Global Land Data Assimilation System (GLDAS) terrestrial water storage (TWS), filtered total terrestrial water storage (TTWS), and recovered TTWS time series in the (a) upper, (b) middle, and (c) lower sub-basins of the Yangtze River Basin (YRB). The green, blue, and red lines represent the GLDAS TWS, filtered TTWS, and recovered TTWS time series, respectively. The correlation coefficient (R) between the GLDAS TWS and recovered GRACE TTWS time series during the Three Gorges Dam (TGD) impoundment period are also shown.

Figure 3.
Time series of precipitation and evaporation in the (a) upper; (b) middle; and (c) lower sub-basins of the YRB from April 2002 to July 2015.
Figure 3.
Time series of precipitation and evaporation in the (a) upper; (b) middle; and (c) lower sub-basins of the YRB from April 2002 to July 2015.

Figure 4.
Annual Average Precipitation (AAP), Adjusted Annual Average TTWS (AAAT), and yearly relative change (YRC) of the AAP and AAAT in the (a) upper; (b) middle; and (c) lower sub-basins of the YRB from 2003 to 2014.
Figure 4.
Annual Average Precipitation (AAP), Adjusted Annual Average TTWS (AAAT), and yearly relative change (YRC) of the AAP and AAAT in the (a) upper; (b) middle; and (c) lower sub-basins of the YRB from 2003 to 2014.

Figure 5.
The natural-driven terrestrial water storage (NTWS) and TTWS time series in the (a) upper; (b) middle; and (c) lower sub-basins of the YRB. The red line and the blue lines represent the NTWS and TTWS time series, respectively. Notably, NTWS is predicted by natural data including precipitation, temperature, and soil moisture based on an artificial neural network (ANN) model and TTWS was calculated using GRACE data.

Figure 6.
Differences x(t) between TTWS and NTWS (black cylinders) from April 2002 to July 2015 and the Palmer Drought Severity Index (PDSI) (blue and red cylinders) between April 2002 and December 2014 in the (a) upper, (b) middle, and (c) lower sub-basins of the YRB. The blue line in the top window represents the empirical cumulative distribution function (ECDF) of x(t) between June 2003 and December 2008. The Dam Influence Indexes (DIIs) relative to the PDSIAs in the three regions between June 2003 and December 2008 are also shown. Note: DIIs were calculated by subtracting the area of the green block from the red block (i.e., DII = A(area) − B(area)), and PDSIAs were calculated using Equation (9).


Figure 7.
Hydrological drought signals from 2003 to 2008 in the (a) upper; (b) middle; and (c) lower sub-basins. The hydrological drought signals were obtained by removing the annual and seasonal cycles from the TTWS and the NTWS time series. The blue and green lines represent hydrological drought signals from the NTWS and TTWS time series, respectively, and the dark areas indicate hydrological drought events.


Table 1.
Measurement and leakage errors of the total terrestrial water storage (TTWS) in the upper, middle and lower sub-basins of the YRB.
Table 1.
Measurement and leakage errors of the total terrestrial water storage (TTWS) in the upper, middle and lower sub-basins of the YRB.
| Sub-Basin | Upper (cm) | Middle (cm) | Lower (cm) |
|---|---|---|---|
| Measurement error | 1.66 | 2.28 | 2.94 |
| Leakage error | 2.03 | 2.77 | 2.69 |
Table 2.
Three major impoundments of the TGD between 2003 and 2008.
| Date | Start Level (m) | End Level (m) | Change (m) |
|---|---|---|---|
| June 2003 | 66.0 | 135.0 | 69.0 |
| October 2006 | 135.0 | 156.0 | 21.0 |
| November 2008 | 145.0 | 172.3 | 27.3 |
Table 3.
The area and the accuracy of the predicted NTWS in the three sub-basins of the YRB.
| Sub-Basin | Area (km2) | NSE | R2 | MAE (cm) | Uncertainty (cm) |
|---|---|---|---|---|---|
| Upper | 983,118 | 0.92 | 0.96 | 0.93 | 2.78 |
| Middle | 512,733 | 0.87 | 0.93 | 1.29 | 3.76 |
| Lower | 288,205 | 0.85 | 0.92 | 1.89 | 4.41 |
Table 4.
The frequency, duration, and severity of hydrological drought in the upper, middle, and lower sub-basins of the YRB from 2003 to 2008 based on the NTWS and the TTWS.
Table 4.
The frequency, duration, and severity of hydrological drought in the upper, middle, and lower sub-basins of the YRB from 2003 to 2008 based on the NTWS and the TTWS.
| Sub-Basin | Data | Time Span of Each Event | Duration (Months) | Severity (km3 Months) | No. of Total Months | Total Severity (km3 Months) |
|---|---|---|---|---|---|---|
| Upper Area: 983,118 km2 | NTWS | Jan. 2003 to Apr. 2003 | 4 | −134.39 | 38 | −616.21 |
| Aug. 2003 to Jun. 2004 | 11 | −62.14 | ||||
| Aug. 2004 to Oct. 2004 | 3 | −17.61 | ||||
| Dec. 2004 to Feb. 2005 | 3 | −207.58 | ||||
| Aug. 2006 to Jan. 2007 | 6 | −165.79 | ||||
| Mar. 2007 to Oct. 2007 | 8 | −14.07 | ||||
| Dec. 2007 to Feb. 2008 | 3 | −134.39 | ||||
| TTWS | Jan. 2003 to May 2003 | 5 | −203.39 | 26 | −612.88 | |
| Oct. 2003 to Jul. 2004 | 10 | −142.92 | ||||
| Jul. 2006 to Feb. 2007 | 8 | −222.61 | ||||
| Oct. 2007 to Jan. 2008 | 4 | −43.80 | ||||
| Middle Area: 512,733 km2 | NTWS | Apr. 2003 to Feb. 2004 | 11 | −185.43 | 32 | −440.97 |
| Jul. 2004 to Jan. 2005 | 7 | −69.22 | ||||
| May 2006 to Feb. 2007 | 10 | −126.87 | ||||
| Dec. 2007 to Mar. 2008 | 4 | −59.45 | ||||
| TTWS | Jan. 2003 to Apr. 2003 | 4 | −58.92 | 57 | −914.13 | |
| Jun. 2003 to Aug. 2004 | 15 | −335.13 | ||||
| Oct. 2004 to Feb. 2006 | 17 | −242.72 | ||||
| Jun. 2006 to Feb. 2007 | 9 | −145.17 | ||||
| Apr. 2007 to Jun. 2007 | 3 | −49.41 | ||||
| Oct. 2007 to Mar. 2008 | 6 | −60.99 | ||||
| May 2008 to Jul. 2008 | 3 | −21.78 | ||||
| Lower Area: 288,205 km2 | NTWS | Aug. 2003 to Feb. 2004 | 7 | −88.60 | 24 | −270.40 |
| Nov. 2004 to Jan. 2005 | 3 | −33.66 | ||||
| May 2005 to Jul. 2005 | 3 | −31.30 | ||||
| Aug. 2006 to Nov. 2006 | 4 | −21.41 | ||||
| Jun. 2007 to Aug. 2007 | 3 | −67.86 | ||||
| Oct. 2007 to Jan. 2008 | 4 | −27.58 | ||||
| TTWS | Aug. 2003 to Aug. 2004 | 13 | −263.31 | 51 | −651.64 | |
| Oct. 2004 to Apr. 2006 | 19 | −193.32 | ||||
| Jun. 2006 to Nov. 2006 | 6 | −68.57 | ||||
| Apr. 2007 to Aug. 2007 | 5 | −52.27 | ||||
| Oct. 2007 to May 2008 | 8 | −74.17 |
© 2018 by the authors. Licensee MDPI, Basel, Switzerland. This article is an open access article distributed under the terms and conditions of the Creative Commons Attribution (CC BY) license (http://creativecommons.org/licenses/by/4.0/).
Share and Cite
MDPI and ACS Style
Li, F.; Wang, Z.; Chao, N.; Song, Q. Assessing the Influence of the Three Gorges Dam on Hydrological Drought Using GRACE Data. Water 2018, 10, 669. https://doi.org/10.3390/w10050669
AMA Style
Li F, Wang Z, Chao N, Song Q. Assessing the Influence of the Three Gorges Dam on Hydrological Drought Using GRACE Data. Water. 2018; 10(5):669. https://doi.org/10.3390/w10050669
Chicago/Turabian StyleLi, Fupeng, Zhengtao Wang, Nengfang Chao, and Qingyi Song. 2018. "Assessing the Influence of the Three Gorges Dam on Hydrological Drought Using GRACE Data" Water 10, no. 5: 669. https://doi.org/10.3390/w10050669
Note that from the first issue of 2016, this journal uses article numbers instead of page numbers. See further details here.