Concentrations, Distribution, and Ecological Risk Assessment of Heavy Metals in Daya Bay, China
by
 ,
,
Huijuan Tang
1,2, 
Zhixin Ke
3,
Muting Yan
1,2,
Wenjing Wang
1,2,
Huayue Nie
1,2,
Boxing Li
1,2,
Jingping Zhang
3,
Xiangrong Xu
3 and
Jun Wang
1,2,* 1
Joint Laboratory of Guangdong Province and Hong Kong Region on Marine Bioresource Conservation and Exploitation, South China Agricultural University, Guangzhou 510642, China
2
College of Marine Sciences, South China Agricultural University, Guangzhou 510642, China
3
Key Laboratory of Tropical Marine Bioresources and Ecology, South China Sea Institute of Oceanology, Chinese Academy of Sciences, Guangzhou 510301, China
*
Author to whom correspondence should be addressed.
Water 2018, 10(6), 780; https://doi.org/10.3390/w10060780
Submission received: 17 May 2018
/
Revised: 7 June 2018
/
Accepted: 8 June 2018
/
Published: 13 June 2018
(This article belongs to the Section Water Quality and Contamination)
Abstract
:Surface sediment samples were collected from 19 sites throughout Daya Bay, China to study the concentrations, spatial distributions, potential ecological risk, and possible sources of heavy, including metals copper (Cu), zinc (Zn), arsenic (As), cadmium (Cd), nickel (Ni), lead (Pb), mercury (Hg), and chromium (Cr). The mean concentrations of the eight heavy metals were 24, 109, 6.5, 0.09, 35.3, 26.8, 0.07, and 109 µg g−1, respectively. The concentrations of most heavy metals were within range of those recorded in previous years. The spatial distribution pattern of most heavy metals were similar, with lowest values recorded along the southeast coast and the open sea area; the highest values were recorded in the northern Daya Bay, especially the northwest. Cu, Zn, As, Cd, Pb, and Hg were classified as Class I, and Ni and Cr were classified as Class II according to the Sediment Quality Guidelines (SQGs) of China. The potential ecological risk (Eif) indices of Cu, Zn, As, Pb, Ni, and Cr specify that these metals pose low risk to the ecosystem of the Bay, whereas Cd and Hg pose a very high risk in some sites. The geoaccumulation indices (Igeo) of Cu, Zn, As, Ni, and Cr specify weak or no pollution in Daya Bay, whereas those of Pb, Cd, and Hg in some sites indicate moderate or even high pollution. Spatial distribution, carbon/nitrogen analysis, Pearson correlation, and principal components analysis indicated that Cu, Zn, As, Pb, Ni, Cr, total organic carbon (TOC), and total nitrogen (TN) originated from the same sources. Ballast water or sewage from the cargo ships that park at the harbors or anchor in the Bay were the important sources for Cu, Zn, As, Pb, Ni, Cr, TOC, and TN. Other anthropogenic sources, such as agricultural runoff and aquaculture, might also be responsible, whereas Hg and Cd originated from other point sources.
1. Introduction
Heavy metal contamination in coastal areas has attracted attention due to metal toxicity, bioaccumulation, and persistence [1,2]. Heavy metals include mercury (Hg), cadmium (Cd), arsenic (As), lead (Pb), and chromium (Cr), which are not required for normal human metabolic activity. These metals can accumulate in aquatic organisms, which may subsequently negatively impact human health through bioaccumulation in the food chain [3,4]. Heavy metals also include essential elements, such as copper (Cu), zinc (Zn), and nickel (Ni), which can cause toxic effects due to excessive intake [3,5]. Heavy metals are the most persistent pollutants because do not decompose under natural conditions [6].
Estuary and coastal bays are centers for population and economic activities [7]. Heavy metals are continuously introduced to these areas from natural sources, such as weathering and decomposition of parent rock and ores [8], and anthropogenic sources including mining, fossil fuel combustion, vehicle exhaust, sewage discharges, industrial activities, and agricultural and aquaculture chemicals [9,10]. When metals enter the marine environment, they settle easily and be incorporated into the sediment through complex physical and chemical processes but can re-enter the water column through desorption and other secondary pollution mechanisms [11,12,13,14]. Total concentrations and spatial distribution of heavy metals in sediments provide essential information on the overall pollution status, which is important for pollution control strategies [7,15,16].
Located in the central of Guangdong Province and surrounded by the most developed cities (Shenzhen City and Huizhou City), Daya Bay is one of the most ecologically and economically important areas in South China. The bay is composed of various ecological habitats [17] and functions as a natural fishery conservation zone [18]. The Daya Bay Nuclear Power Station (NPS) and Ling’ao NPS started service in 1994 and 2002, respectively. Both power stations reside on the western coast of Daya Bay. Petrochemical and stevedoring industries, and plastic and printing factories have quickly developed since the mid-1990s. As a cage culture area, aquaculture has also rapidly expanded from 440 ha in 1988 to 13,298 ha in 2005. The corresponding fish farming has increased from 100 t to 58,573 t [19]. As a result, the aquatic environment of the bay has degraded and harmful algal blooms (HAB) have been occurring frequently. The Daya Bay sediment contamination with heavy has also received considerable attention [15,20,21,22,23,24]. However, as human activities intensified, the geochemical characteristics of the surface sediments may vary annually [21,22]. Regular and continuous research on heavy metal distribution and sources to the sediment contamination in Daya Bay is necessary to estimate the anthropogenic influence and prevent further pollution.
Potential ecological risk indices and the geoaccumulation index (Igeo) have been widely and efficiently used to assess the heavy metal pollution status of sediment/soil [8,25]. Zhang et al. [7] found a high total content and geoaccumulation index of Cd, Zn, and Cu, which were the primary metals in the Peal River sediments. Wen et al. [26] found that the soils in the Yellow River Delta of China showed moderately to strongly contaminated levels based on the geoaccumulation index of As and Cd.
The objectives of this study were to determine total concentrations and spatial distributions of eight heavy metals, Cu, Zn, As, Cd, Pb, Ni, Hg, and Cr, in Daya Bay sediments, to assess pollution status, and to determine possible sources of the metals.
2. Materials and Methods
2.1. Study Sites
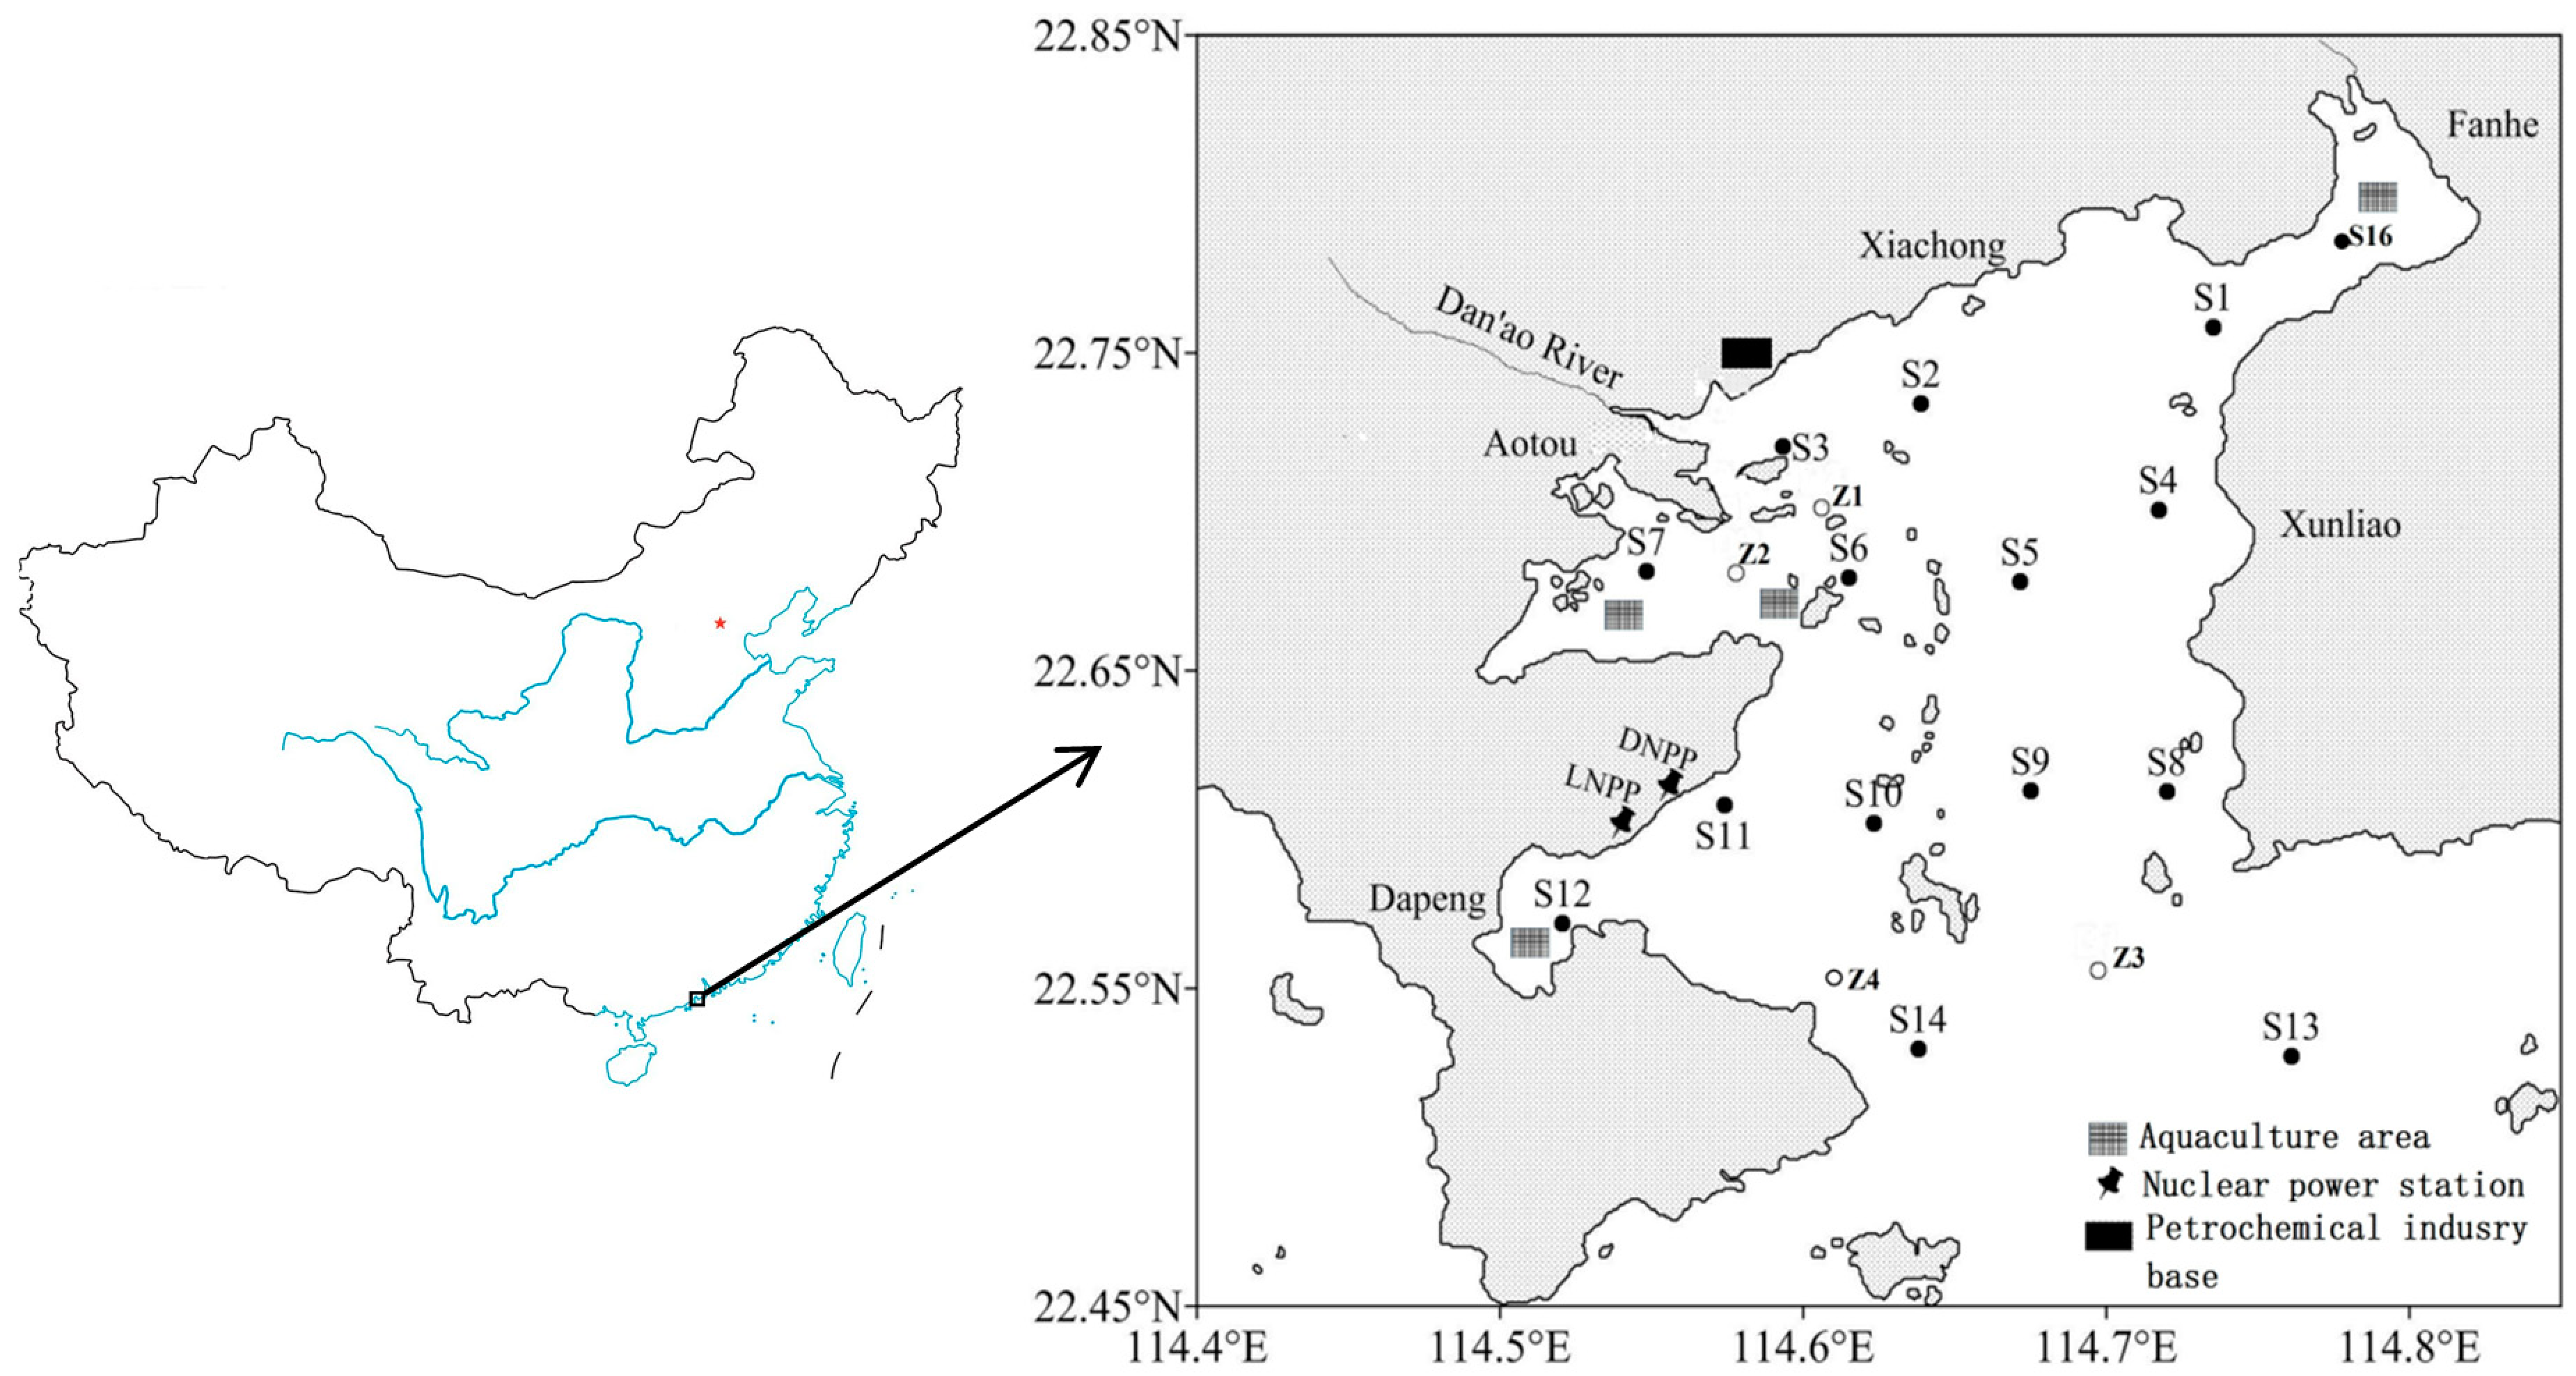
Daya Bay (Figure 1) is a semi-enclosed bay along the South China Sea. With an area of 600 km2, a width of about 15 km, and a length of 30 km (north to south) [27], Daya Bay has three important sub-basins: Yaling Bay, where the Aotou Harbor, Huizhou Port, and cage aquaculture area are located in the northwest region of the Bay; Fanhe Harbor, mainly home to shellfish aquaculture, located in the northeast of the Bay; and Dapeng Cove in the southwest, where the two nuclear power stations are located with nearby cage aquaculture. A large petrochemical industry base is situated along the north coast of the bay. With no large river discharge, the water in Daya Bay is mainly sourced from the South China Sea.
2.2. Sample Collection and Analysis
Sediment samples were collected from 19 sites (Figure 1) in Daya Bay with a stainless box grab sampler in April 2017. Bottom salinity was measured in situ using a YSI 6600 multi-probe sensor (Yellow Springs Instrument Co., Yellow Springs, OH, USA). Redox potential (Eh) was measured through an Orion platinum redox electrode (Thermo Fisher Scientific, Waltham, MA, USA) within the top 5 cm of a sediment sample. Undisturbed surface sediment (top 5 cm layer) was sampled using a plastic spoon, and the samples were then placed in previously acid-rinsed polypropylene tubes. When transferred to the laboratory, the samples were freeze-dried, sieved through a 60-mesh nylon sieve (equivalent to pore diameter of about 245 µm), and digested according to method introduced by Liu et al. [28]. For the analysis of heavy metals, each sample was weighed accurately for 0.10–0.15 g and placed into Teflon digestion tubes, followed by digestion with nitric acid, hydrochloric acid, and hydrofluoric acid in a microwave digestion system (Milestone ETHOS ONE, Milan, Italy). Cu, Zn, and Cr were analyzed using an atomic absorption spectrophotometer (AAS), whereas the other metals were analyzed by Thermo Inductively Coupled Plasma Atomic Emission Spectrometry (ICP-AFS). Total organic carbon (TOC) and total nitrogen (TN) were analyzed with an element analyzer (CarloErba, Italy). Prior to TOC analysis, 1 g of each sub-sample was acidified by 10% HCl for 3 h to remove inorganic carbon [29]. The atomic ratio of TOC to TN (C/N) was also calculated.
For quality control, standard reference materials (Guang Dong marine sediment GSS-24, from the National Institute of Standards Materials Research Center, China) were used. Two standard reference materials and a blank were processed and analyzed according to the same procedure as the samples. Each sample and the standard reference were analyzed twice to obtain analytical precision and accuracy. Relative standard deviations (RSD) of the two consecutive measurements of the standard reference and the two parallel samples ranged from 90 to 110%. The minimum detection limits of Cu, Zn, As, Cd, Ni, Pb, Hg, and Cr were 1, 0.5, 0.0005, 0.0001, 5, 0.05, 0.0002, and 0.0002 µg g−1, respectively.
2.3. Assessment of Ecological Risks and Contamination
In the present study, the ecological risk index (RI) was used to assess the potential ecological risk of the eight heavy metals. The value of RI was calculated by the following equation [30]:
where , Cisurface, and Cireference are the accumulative coefficient, measured value, and background value of a certain heavy metal, respectively. The background concentrations of Cu, Zn, As, Pb, Cd, Ni, Hg, and Cr in the Chinese shallow sea sediments were 15, 65, 7.7, 20, 0.065, 24, 0.02, and 60 µg g−1, respectively, and were used in this formula [31]:
where Eif represents the potential risk that indicates the potential hazard of an individual heavy metal on the environment and humans, and Tif is the toxicity of an individual heavy metal. Hakanson [30] recommended Tif limits for Cu, Zn, As, Pb, Cd, Ni, Hg, and Cr were 5, 1, 10, 5, 30, 5, 40, and 2, of which Hg has the highest and Zn the lowest toxicity. The integrated potential ecological risk (RI) of heavy metal was calculated by the following equation:
According to the value of Eif, Hakanson [30] classified the potential risk into five categories: low risk (<40), moderate risk (40–80), considerable risk (80–160), high risk (160–320), and very high risk (≥320). According to the value of RI, the pollution status is classified into four categories: low risk (<150), moderate risk (150–300), considerable risk (300–600), and very high risk (≥600).
2.4. Geoaccumulation Index
The geoaccumulation index (Igeo) has been widely applied in environmental sciences to assess the degree of heavy metal pollution in sediments [13,15,32]. The Igeo values are defined by the following formula:
where Ci and Cireference represent the measured value and geological background value of metal i, respectively. The constant term 1.5 is used to eliminate possible variations in the background values due to lithogenic effects [32]. The Igeo values of each heavy metal are classified into seven grades: unpolluted (≤0), weakly polluted (0–1), moderately polluted (1–2), moderately to heavily polluted (2–3), heavily polluted (3–4), heavily to extremely polluted (4–5), and extremely polluted (>5).
2.5. Statistical Analysis
The normality of the data was evaluated by Shapiro-Wilk statistical tests. When the data for sediments showed normal distributions at the p < 0.05 level, Pearson correlation (PC) were used to identify the correlation among the salinity, Eh, TOC, TN, and the eight heavy metals. Principle component analysis (PCA) was used to quantify if the heavy metals, TOC and TN shared the same sources and to identify source contributions [33]. IBM SPSS Statistics 22 software was used in all statistical analyses.
3. Results and Discussion
3.1. Mean Concentrations and Comparisons
The mean (ranges) of sediment concentrations (µg g−1) were 24.1 (12.2–43.4) for Cu, 108.9 (71.8–138.5) for Zn, 6.5 (3.8–9.4) for As, 35.3 (22.5–64.2) for Pb, 0.09 (0.05–0.2) for Cd, 26.8 (16.1–33.6) for Ni, 0.07 (0.01–0.43) for Hg, and 108.7 (71.3–138.0) for Cr in the surface sediments from the 19 sampling sites in Daya Bay (Table 1). We compared the mean concentrations with those of other important bays in China. When compared with the Pearl River estuary [34], Quanzhou Bay [35], and Shantou Bay [36], the mean concentrations of Cu, Zn, Pb, Cd, and As in Daya Bay were 1.5–7.7 times lower. Compared with Saya Bay [37], Laizhou Bay [7], and Yellow Sea [38], the mean concentration of Cu, Zn, Pb, and Cr in Daya Bay sediments were 1.5–2 times higher, and that of Cd was 1–2.2 times lower. Compared with Beibu Bay [15], Daya Bay sediment had lower Cu and Cd concentrations and much higher Zn, Pb, and Cr concentrations. Daya Bay sediments had the highest Cr content and relatively lower As and Cd contents than most bays listed in Table 1. The mean contents of Cu, Zn, As, Pb, Ni, Cd, Hg, and Cr in Daya Bay were approximately 1.6, 1.7, 0.8, 1.8, 1.3, 1.1, 2.6, and 1.8 times higher than their corresponding background values [31].
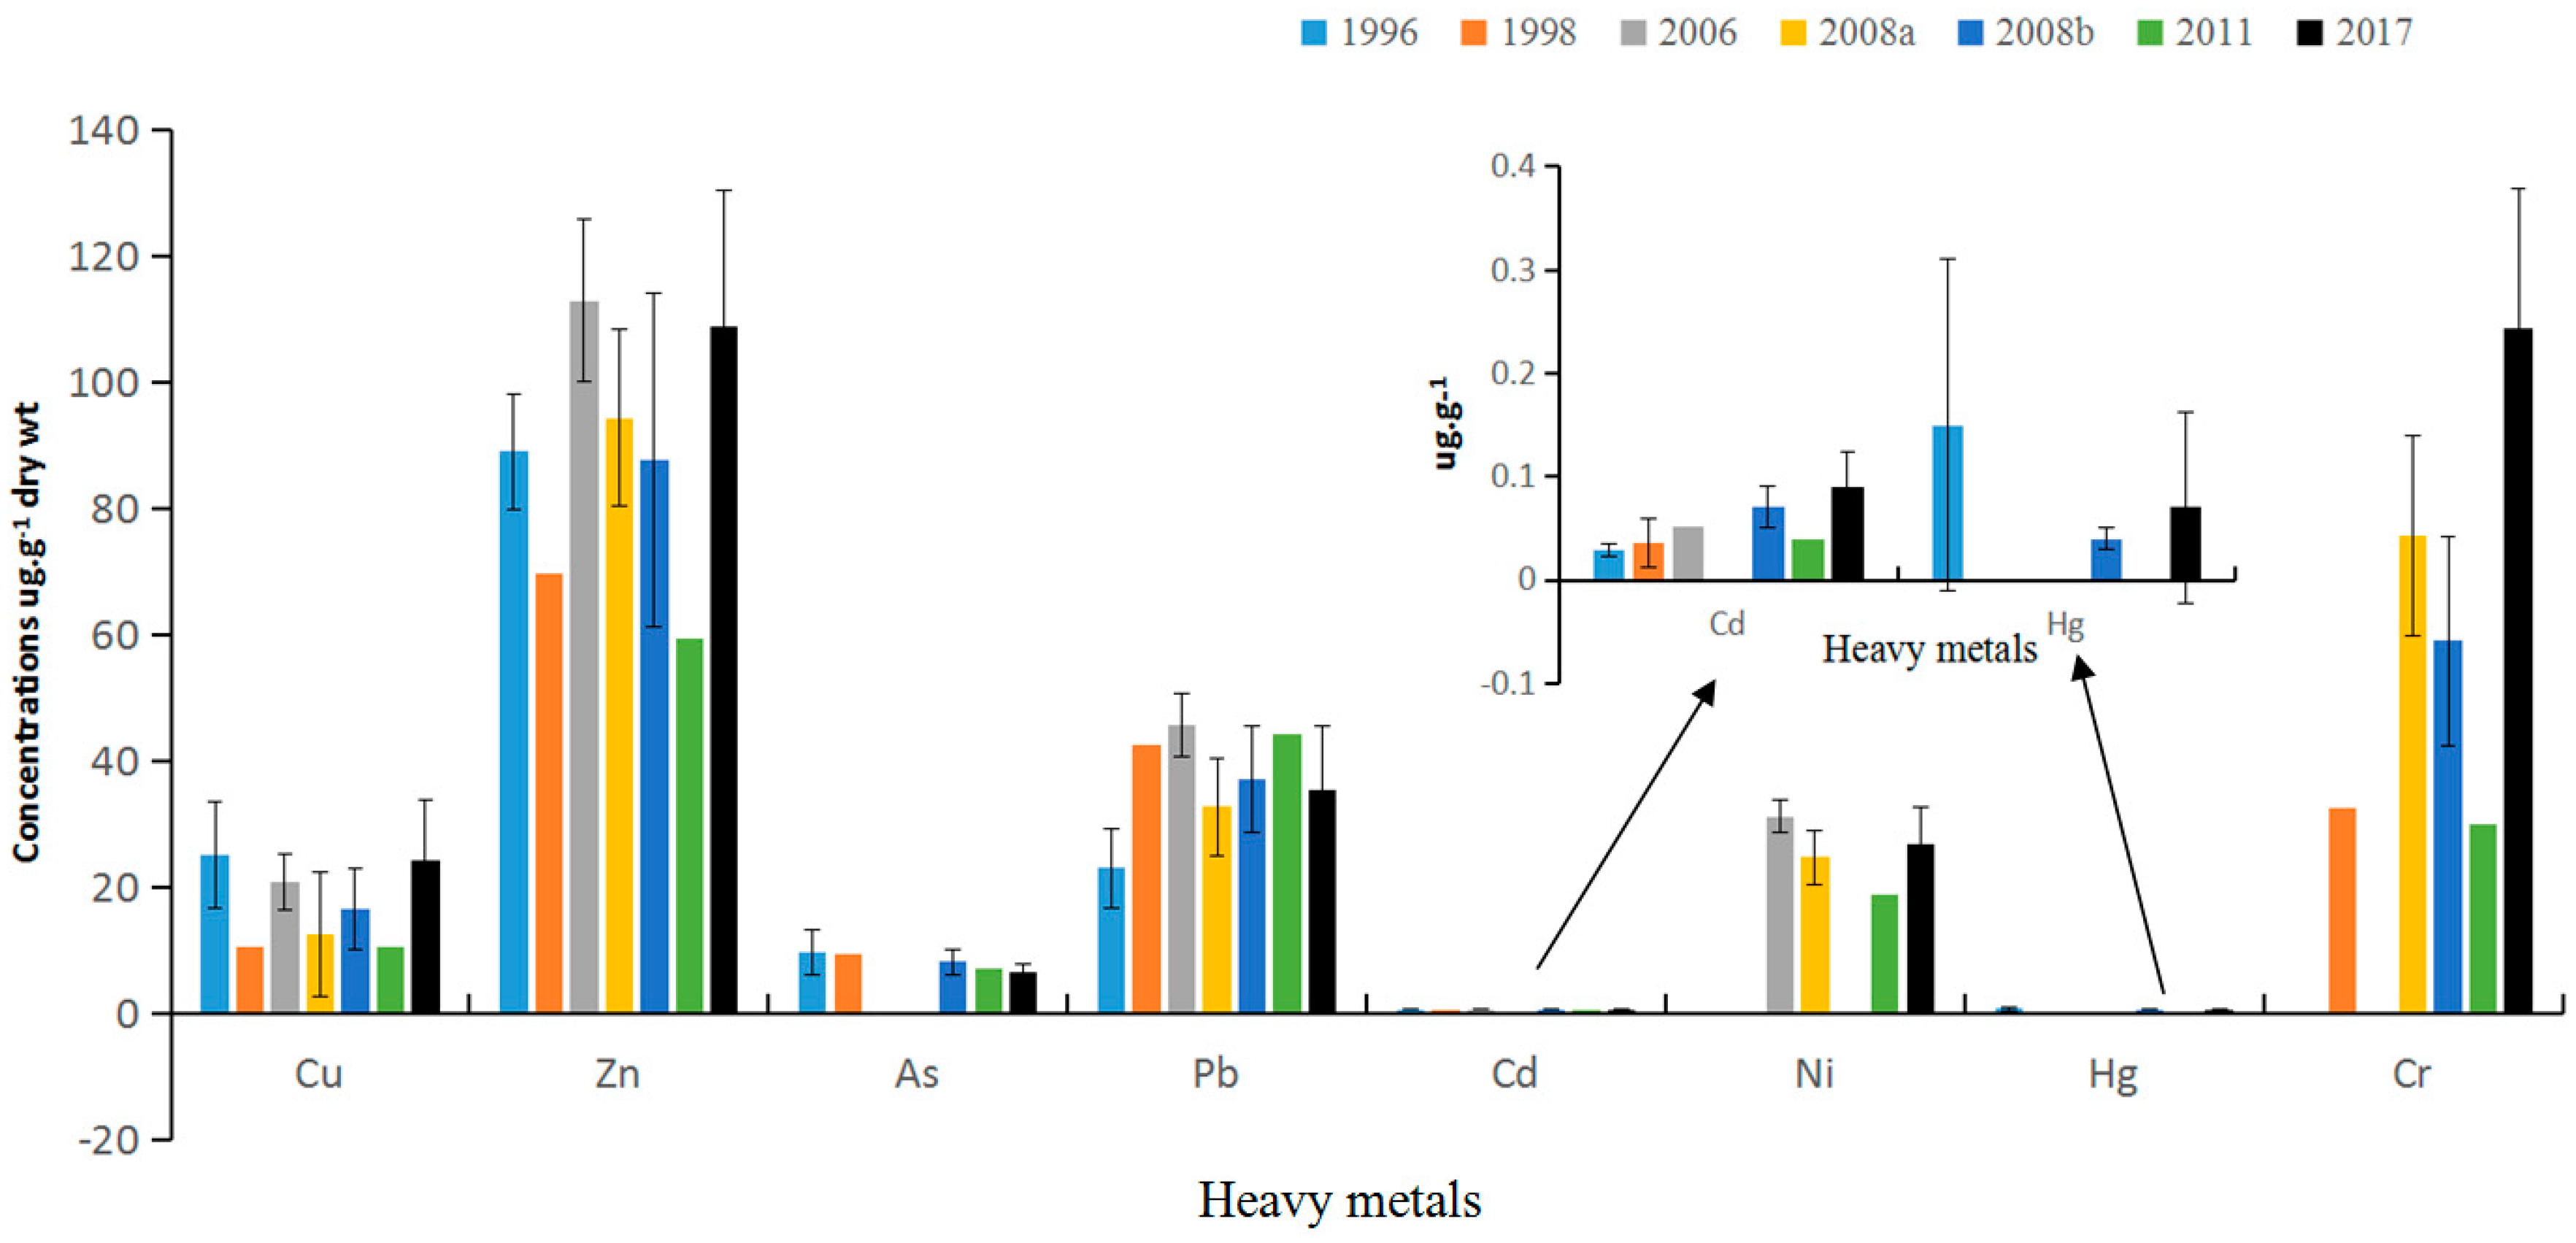
Heavy metal concentrations from the present study were also compared with those of previous studies in Daya Bay surface sediments (Figure 2). Although the mean concentration of Cd in the present study was rather low when compared with both other bays and the background value, the concentration has been increasing slowly since the 1990s. The mean concentration of Cr was higher than any of the previous years. Mean concentrations of most metals are comparable to those since the 1990, with no obvious decreasing or increasing trend. Well water circulation and quick water exchange time (90 days) of Daya Bay with the South China Sea indicates the diffusion ease of pollutants, which may stabilize the surface sediment heavy metal concentrations [35,41]. However, from a long term viewpoint, sediment metal levels in Daya Bay increased significantly in the past 100 years using 210Pb chronologies [21].
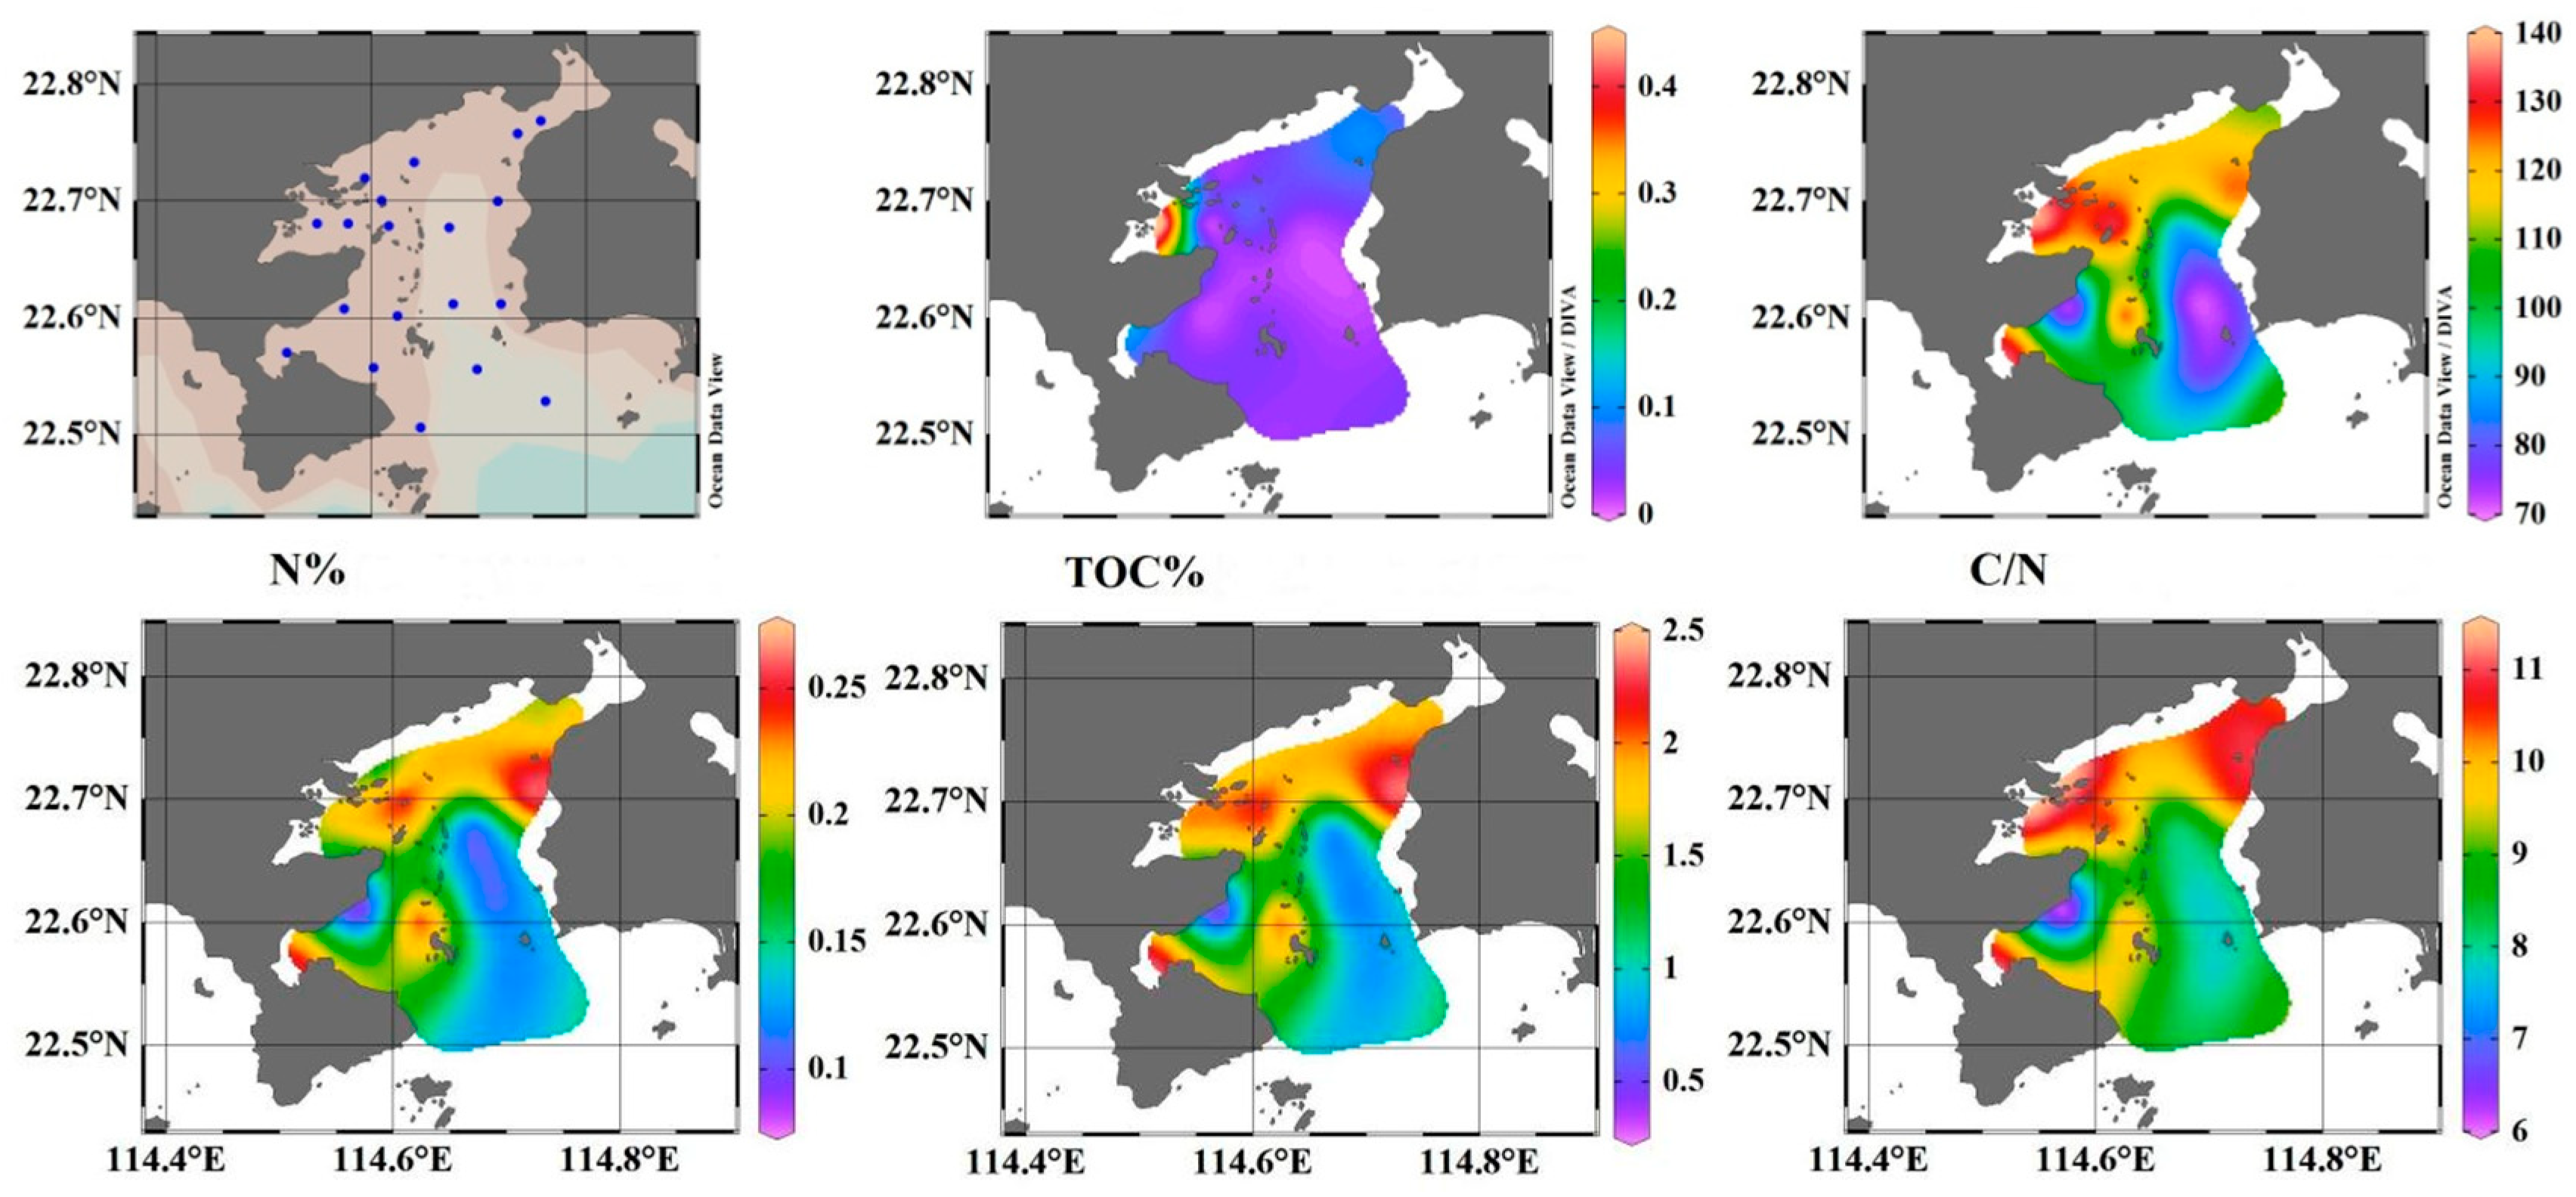
The spatial distribution of sediment heavy metals concentrations, TOC, TN, content, and C/N in the study area showed considerable variation (Figure 3). Generally, heavy metal concentrations were the lowest in the southeast coastal area and the vast are open to the South China Sea. Cd and Hg showed almost the same spatial distribution with extremely high values near Aotou Harbor (station S7), which is a very busy harbor with cage aquaculture. The distribution of Cu, Zn, Ni, and Cr displayed a similar pattern with the highest values in the north, especially in the northwest of Daya Bay. Additionally, very high values of Ni, Cr, Zn, and Cu were also recorded in the station near the central island (S10) where a cargo ship anchorage, which mainly involves the transportation of petrochemicals, is located. Ballast water or sewage from the cargo ship probably resulted in the much higher contents of the four metals than its surrounding sediments. A study by Nosrati-Ghods et al. [42] found that values of Cr (2.1 mg L−1) and Ni (0.029 mg L−1) in ballast water were higher than in seawater. Research by Feng et al [43] also found increased contents of Zn, Cu, Pb, Cr, and As in ballast tank sediments. High contents of Cu and Cr, and the highest value of Pb were also recorded in Dapeng cove (S12) with the presence of cage aquaculture. The highest As value was recorded in Fanhe Harbor (S16), which is surrounded by land-based aquaculture with intertidal shellfish aquaculture nearby [23,44]. The two nuclear power stations may not affect the heavy metal content in the surface sediment, since all the heavy metal contents nearby were rather low. The spatial distribution of TOC, TN content, and C/N displayed a similar pattern to Cu, Zn, Ni, and Cr, with the highest values occurring in the three sub-basins. High contents of TOC and TN were also recorded at central island (S10), suggesting ballast water or sewage from the cargo ship were also sources of TOC and TN.
3.2. Ecological Risk Assessment
The Sediment Quality Guidelines (SQGs) of China [43] are commonly used to assess the sediment quality in China. Based on Cu, Pb, Zn, Cr, and Cd contents, sediment quality is classified into three functional classes: Class I (sediment quality suitable for nature reserve, mariculture, and etc.), Class II (sediment quality suitable for industry and tourism), and Class III (sediment quality suitable only for harbor) [39]. The mean contents of heavy metals in the area were below the threshold values for Class I, except for Cr, which was 25% higher than the threshold value. In some stations, the contents of Cu, Pb, and Hg were higher than the threshold values for Class I. Though experiencing intense human activities, most sediments in the studied area were clean enough according to the SQGs of China.
Effects Range-Low (ERL) and Effects Range-Median (ERM) are effects-based SQGs, which are derived from the U.S. National Oceanic and Atmospheric Administration (NOAA) [40]. ERL is a threshold below which adverse biological effects rarely occur, whereas ERM is used to identify the concentration above which adverse biological effects are more frequent. The present data (Table 1) show that the mean ERM was never exceeded in the studied areas, whereas the ERL for averaged Ni and Cr was exceeded, which indicates no adverse biological effects are being caused by most of the heavy metals, except for moderate effects caused by Ni and Cr.
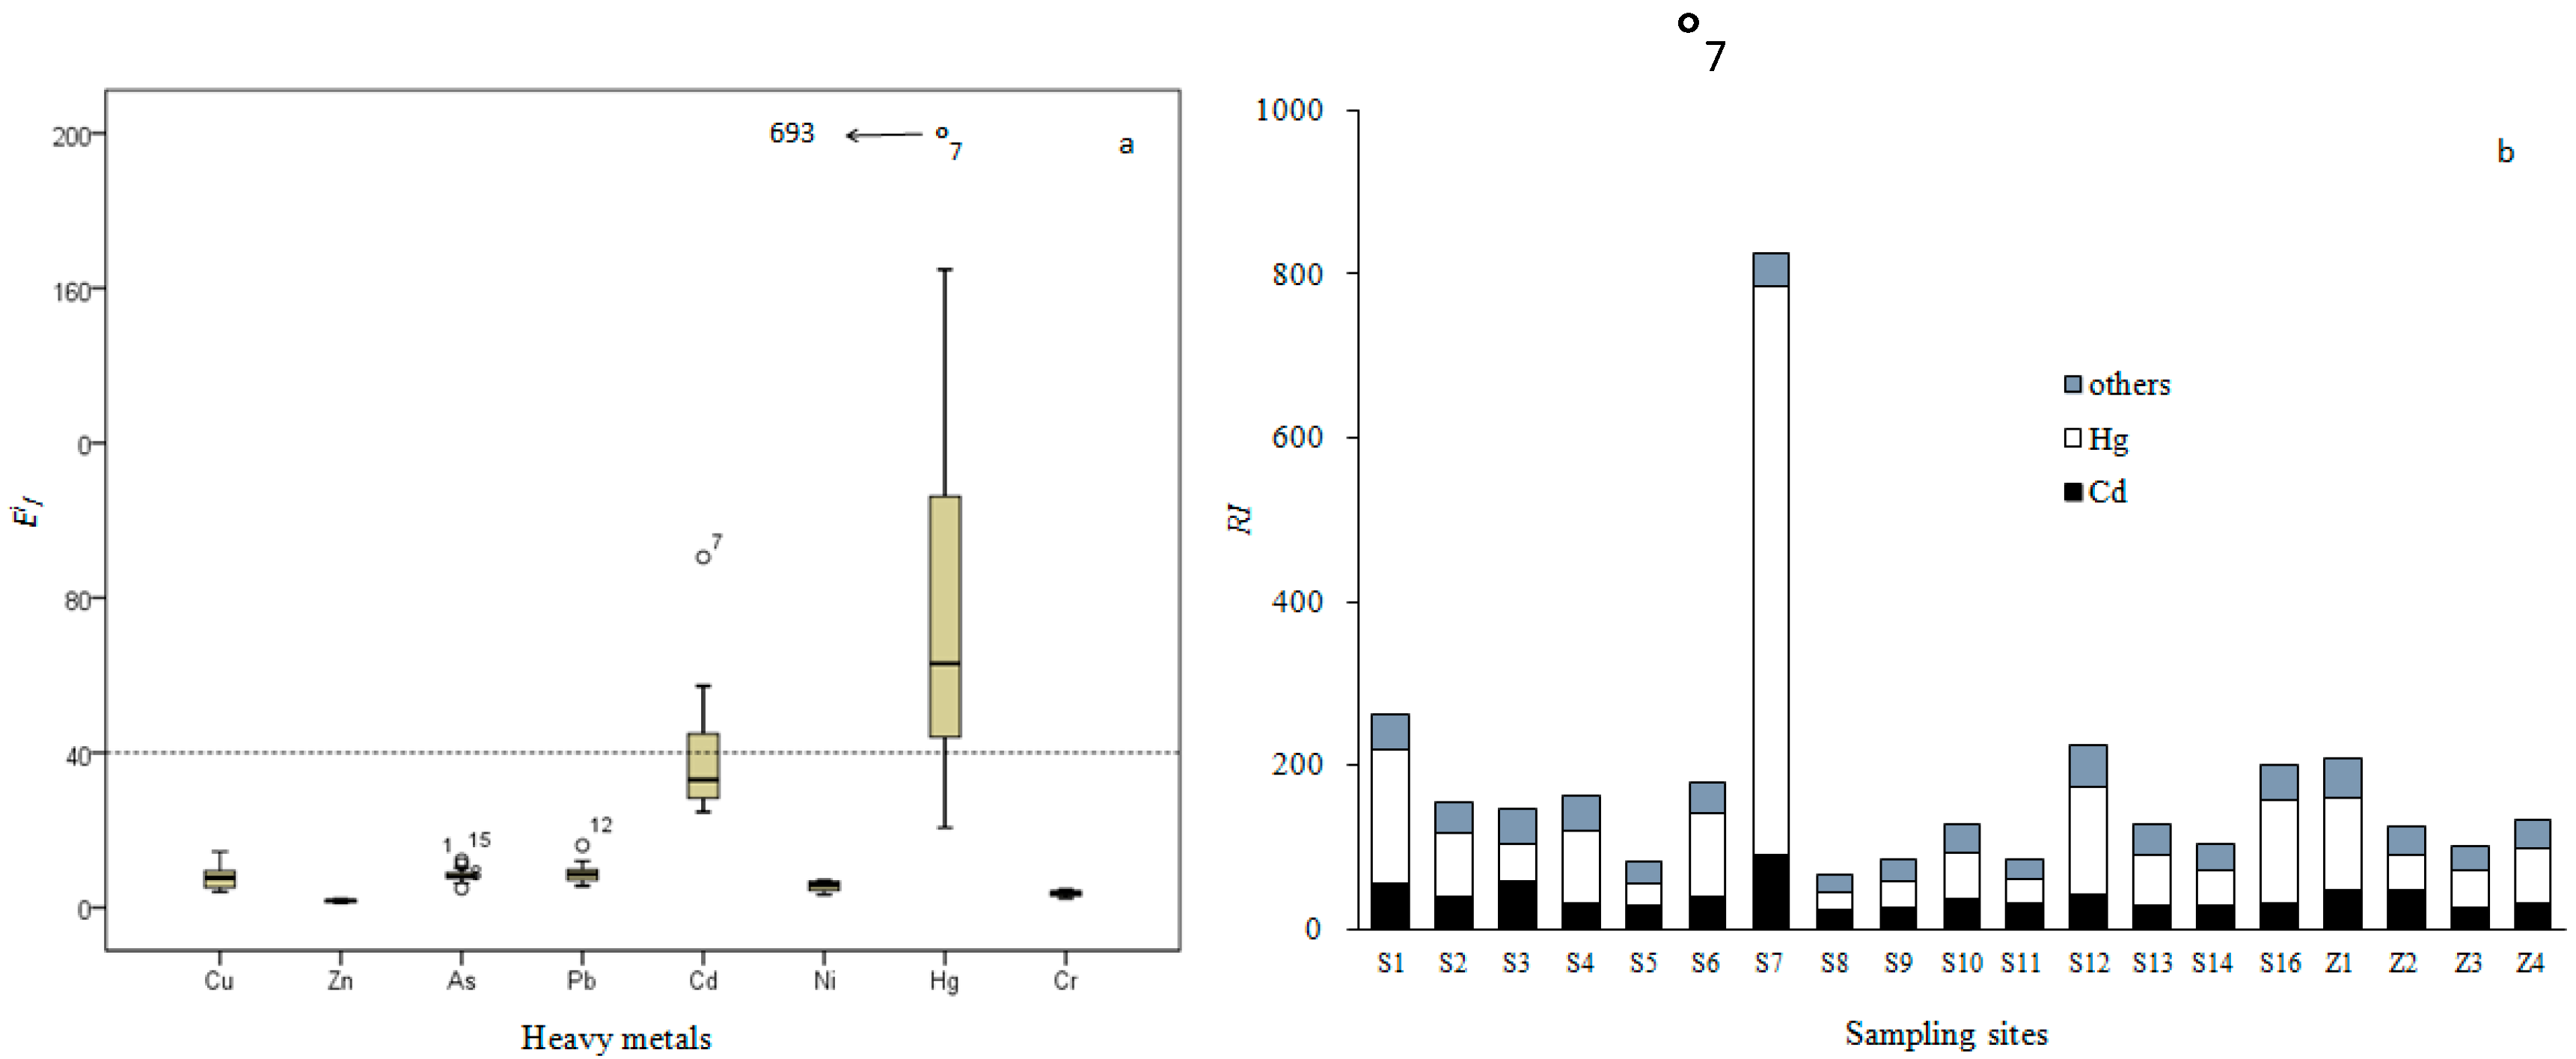
Figure 4a displays the potential ecological risk indices for single heavy metals in the surface sediments of Daya Bay. According to the single-factor categorizes, Cu, Zn, As, Pb, Ni, and Cr pose low risk to the ecosystem of the Bay. However, due to the extremely high content of Hg and Cd at S7 (Aotou Harbor) and their high toxicity, the potential ecological risk indices of Hg and Cd reached 693 and 90, respectively. Some point sources, such as the large number of cargo ships docked at the port, were probably responsible for the high contents of Hg and Cd. Figure 4b presents the integrated potential ecological risk (RI) for all the sampling stations. Hg and Cd contributed more than 60% of the RI. Station S7 showed the highest value, over 600, indicating very high risk. Most stations located north and west of the bay (S1, S2, S4, S6, S12, S16, and Z1) were classified as moderate risk, whereas the others were low risk. The present results suggest that although that most heavy metals in most areas showed low to moderate risk, contamination of Hg and Cd in Aotou Harbor was high.
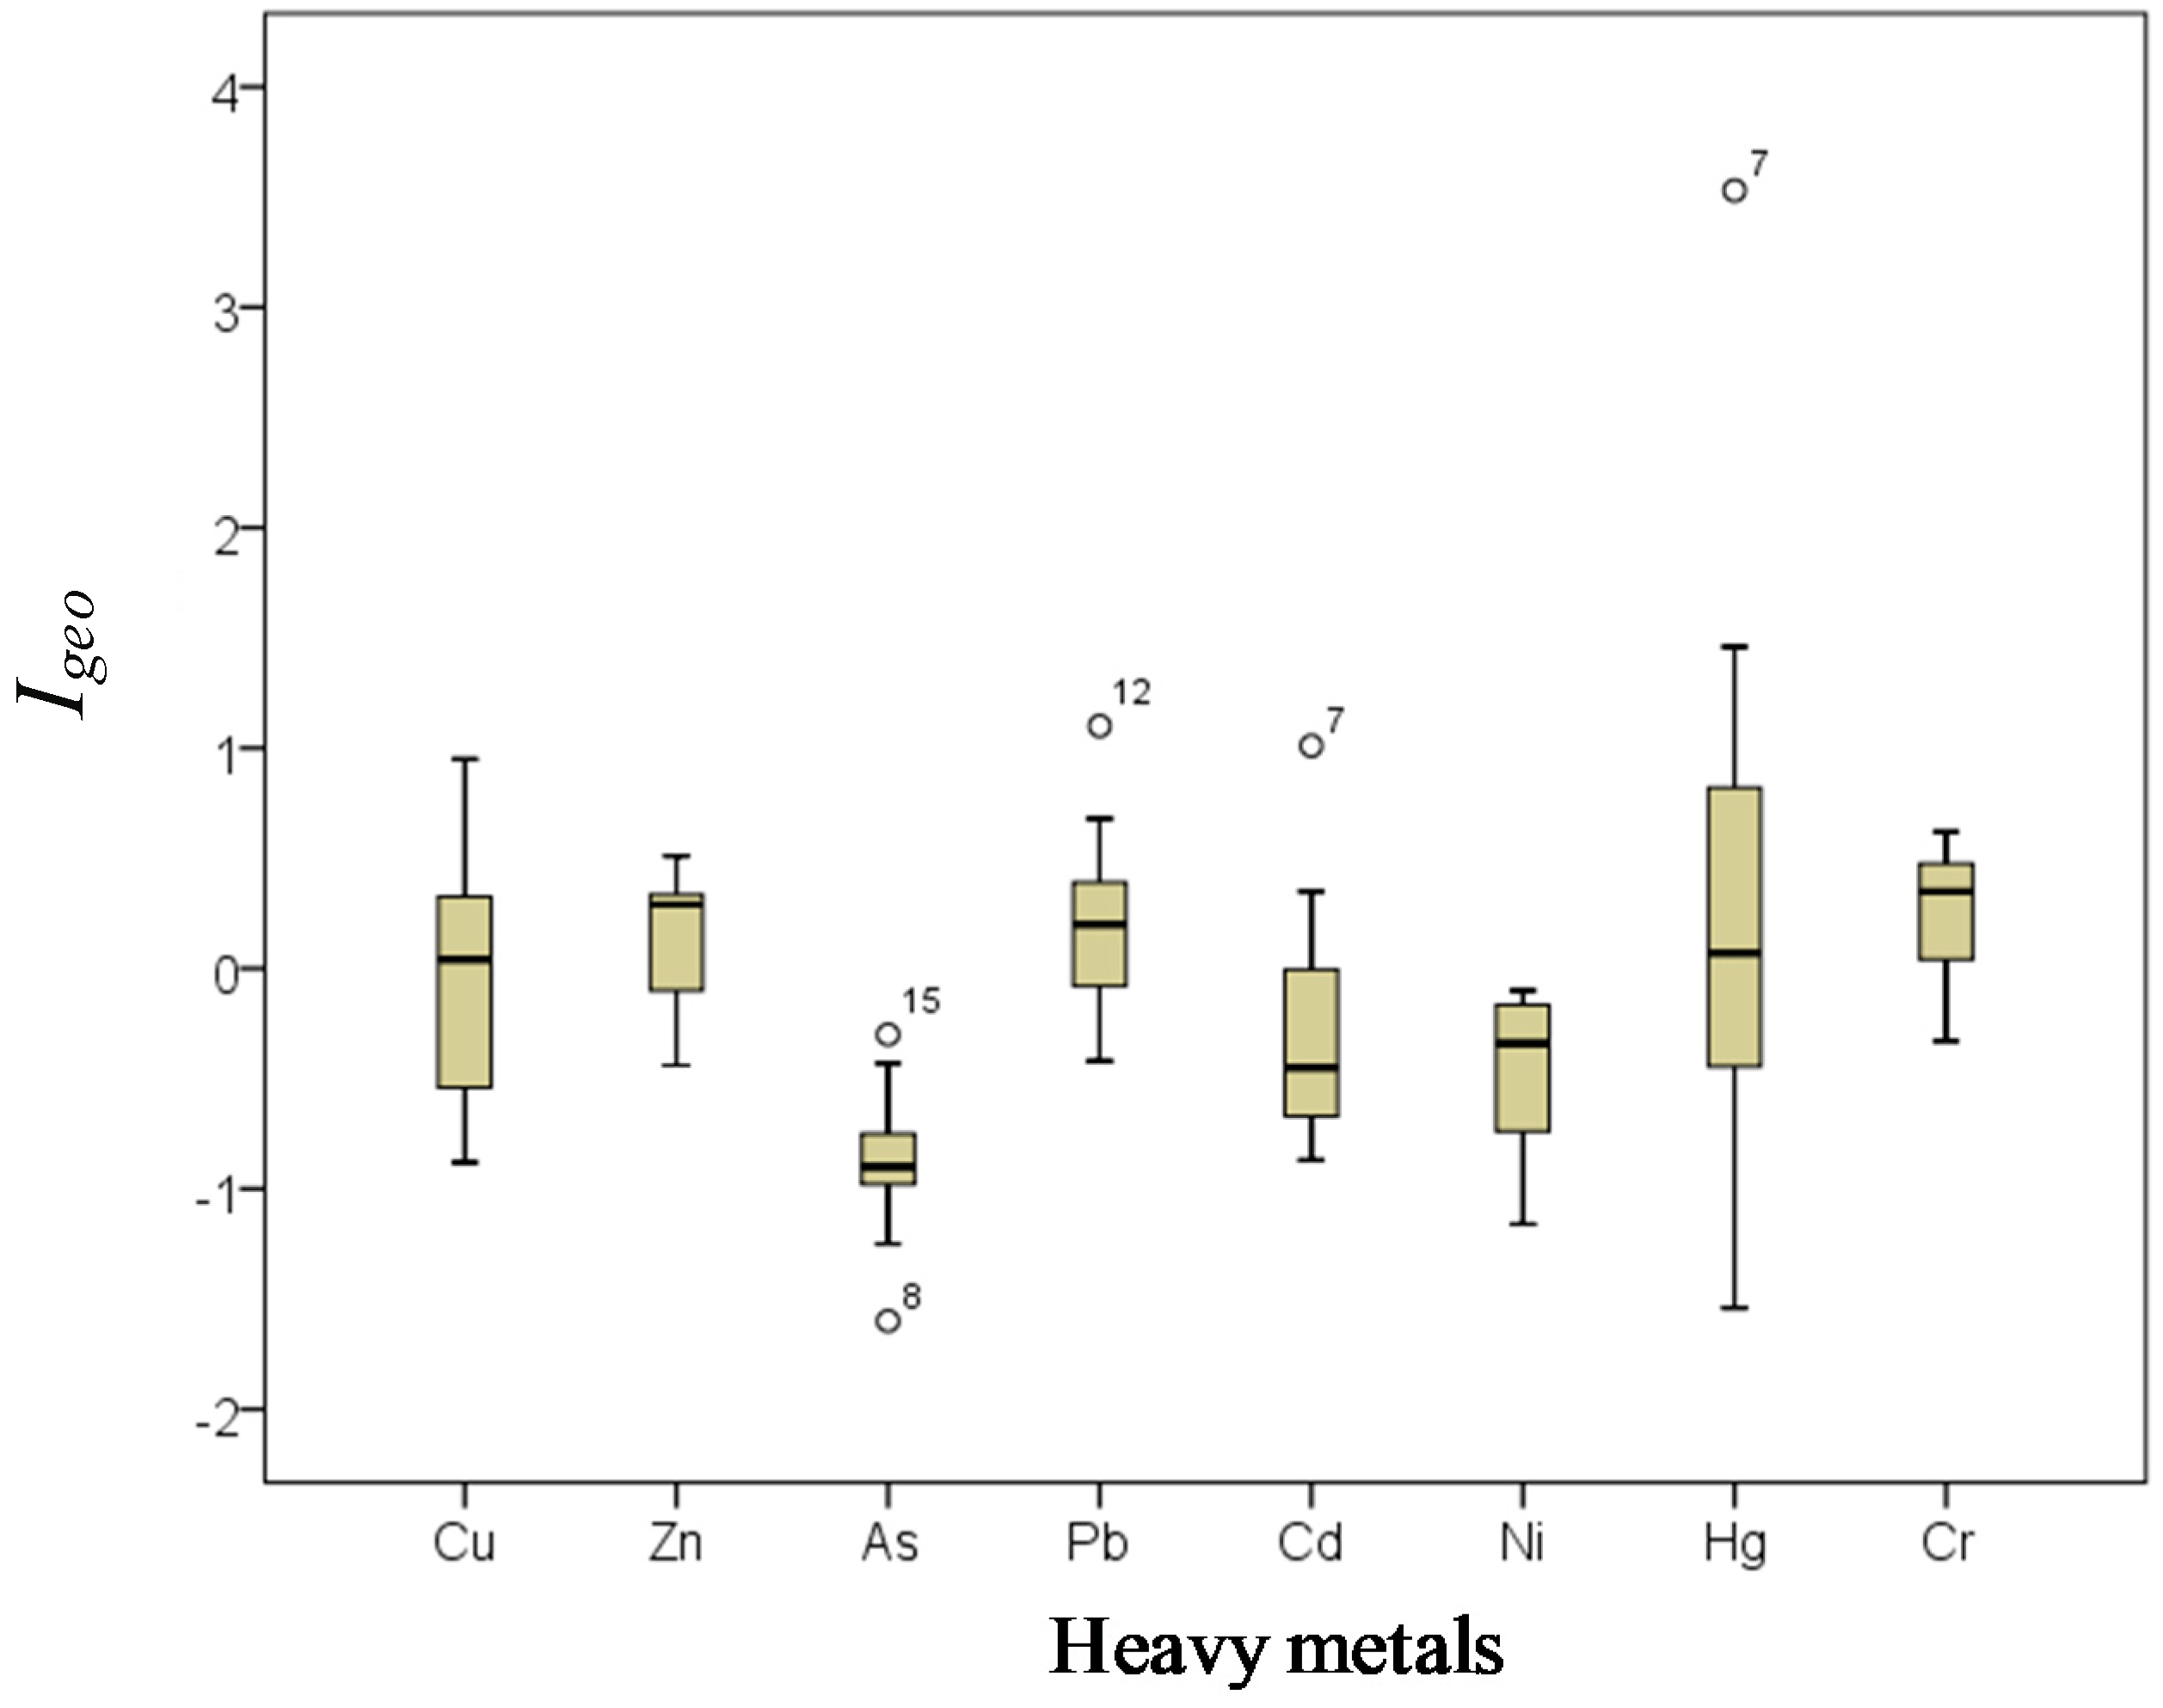
The Igeo values of the heavy metals in this study are presented in Figure 5. According to Müller’s classification, the Igeo values for As and Ni were below zero, suggesting non-pollution of Daya Bay by the two metals. Igeo values for Cu, Zn, and Cr ranged between −1 and 1, suggesting no to weak pollution by the three metals. For Pb, Cd, and Hg, some stations (station S12 for Pb, Station S7 for Cd and Hg) showed moderate or even high pollution, which was consistent with the results provided by the potential ecological risk indices.
3.3. Sources Identification
A significant negative correlation was observed between bottom salinity and TN, TOC, and the heavy metals except for Hg (p < 0.05) (Table 2), suggesting that salinity was an important controlling factor affecting the sediment heavy metal abundance [45]. Research has indicated that increased salinity could increase the mobility of As and Cd [4,46], thus decreasing heavy metal accumulation in the sediment. A significant negative correlation between Eh and heavy metals (including Cu, Zn, Cd, Ni, Hg, and Cr), TN, and TOC was established (p < 0.05). Popenda [47] and Kelderman et al. [48] found that an increase in redox potential (Eh) led to sediment release of heavy metals. This may indicate higher Eh is associated with lower heavy metal content, which is consistent with the results of this research.
TOC was highly positively correlated with TN (r = 0.99, p < 0.01) (Table 2). Except for Hg and Cd, concentrations of the other six metals were also positively correlated with TOC and TN (p < 0.05). The results indicated that these six metal contaminants, especially Cu, Zn, Ni, Cr, and Pb, are strongly associated with organic matter, as reported in many other studies [15,29,49]. Of the eight heavy metals, Hg was only correlated significantly with Cd (p < 0.01), suggesting that Hg might have the same sources as Cd, which were quite different with other metals. Pb was significantly correlated with the other five metals (p > 0.05), was correlated with Zn and Pb at the 0.01 level, and weakly correlated with Ni at the 0.05 level.
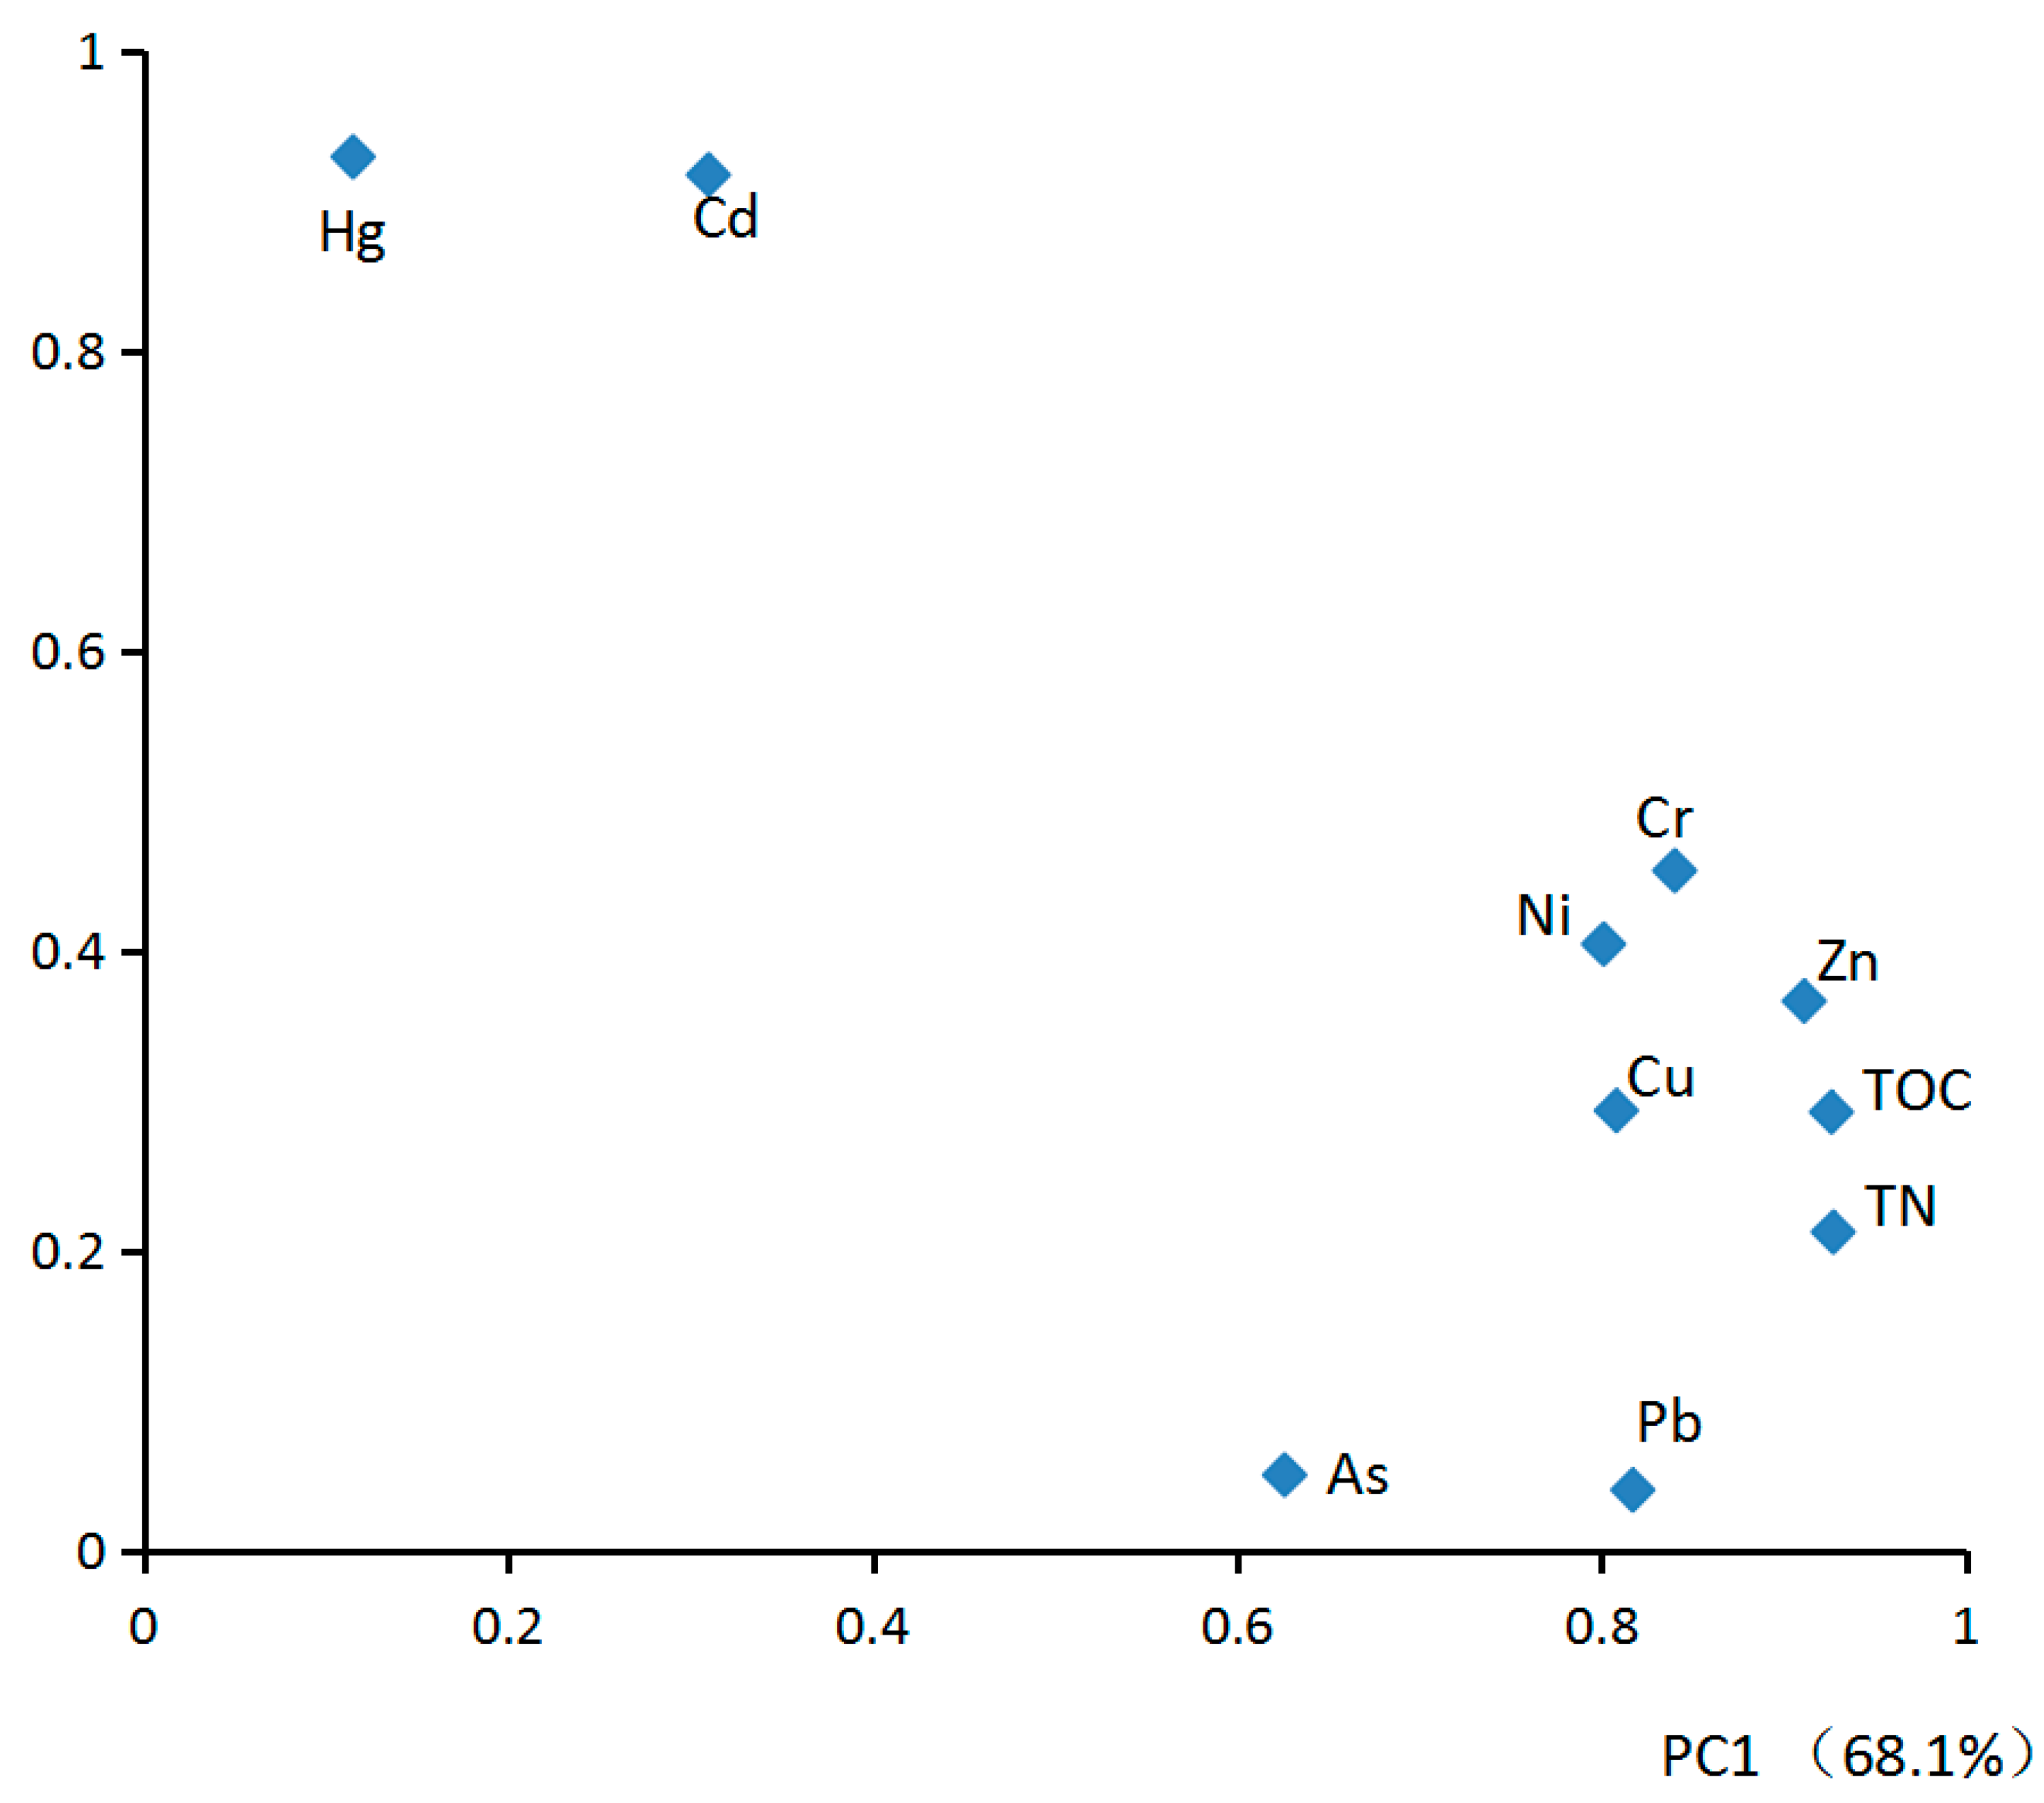
PCA (principle component analysis) is widely used to verify and quantify pollution sources of heavy metals [8,9,50]. In the present study, Kaiser-Meyere-Olkin and Bartlett’s results were 0.756 and 254 (df = 45, p < 0.001), respectively, indicating that PCA can be used to reduce dimensionality. Figure 6 shows the results of factor analysis. Two main components with an eigenvalue greater than one were determined, explaining 81.3% of the total variance.
The heavy metals, TOC, and TN could be divided into two groups (Figure 6): Cu, Zn, Ni, Cr, Pb, As, TOC, and TN were highly correlated with the first component, explaining 68.1% of the total variance with high loading (≥0.82) of Cu, Zn, Ni, Cr, Pb, TOC, and TN. Middle loading of As (0.63). Cd, and Hg, far from the other heavy metals in the plot, were highly correlated with the second component, explaining 13.2% of the total variance with loading over 0.92. All analyses of PCA, PC, and spatial distributions indicated that Cu, Zn, Ni, Cr, Pb, As, TOC, and TN share the same sources, whereas Cd and Hg have different sources. As noted above, ballast water or sewage from the cargo ships that park in the harbors or anchor for petrochemical transportation are some of the most important sources related to the high contents of Cu, Zn, Ni, Cr, TOC, and TN. PC analysis showed that most of the heavy metal was highly associated with organic matter. Generally, the C/N of sediment organic matter from terrestrial sources is equal or above 20, while that from marine origins typically varies between five and eight [51,52,53]. Therefore, a higher C/N usually indicates a higher proportion of organic matter originating from terrigenous sources. In the present study, C/N varied between 6.0 and 11, with the highest C/N in the sediments of the three sub-basins. This indicates that the highest terrestrial inputs of organic matter, from areas including agricultural runoff, domestic waste discharge, and aquaculture feeds or chemicals, increased the content of TOC and TN and could also act as sources of heavy metals. However, more detail research is needed to asses these sources. Considering the high potential ecological risk indices (Figure 4) and Igeo values (Figure 5) of Hg and Cd, Hg and Cd may be also influenced by anthropogenic inputs that are different from the sources of Cu, Zn, Ni, Cr, Pb, As, TOC, and TN. The extremely high values of Hg and Cd were found in Aotou Harbor, which indicates the possible existence of some point sources related to the harbor or aquaculture.
4. Conclusions
Heavy metals (Cu, Zn, As, Cd, Ni, Pb, Hg, and Cr) in surface sediment samples from 19 stations spread throughout Daya Bay were investigated. The mean concentrations of the heavy metals were within a similar range as data from the previous years, except Cd concentration has increased slowly since 1996. Heavy metal concentrations were generally lowest in the southeast coastal area and the vast area open to the South China Sea, and highest in the northern Daya Bay, and especially the northwest. Except for Ni and Cr, the mean heavy metal concentration was classified as Class I grade according to the SQGs of China and below ERL (NOAA), respectively. The potential ecological risk indices of Cu, Zn, As, Pb, Ni, and Cr mean these metals pose a low risk to the ecosystem of the bay, whereas Cd and Hg pose a very high risk at some stations. The geoaccumulation index (Igeo) of Cu, Zn, As, Ni, and Cr indicated no or weak pollution in the bay, whereas that of Pb, Cd, and Hg in some stations indicate moderate or even strong pollution. Spatial distribution, C/N analysis, PC analysis, and PCA all suggested that Cu, Zn, As, Pb, Ni, Cr, TOC, and TN originate from the same sources, including cargo ships used for petrochemical transportation and possibly from other anthropogenic sources, such as aquaculture. Hg and Cd may originate from some point sources. The present research indicated that the content and distribution of heavy metals in Daya Bay was mostly affected by human activities. Further research on the interaction of heavy metals and antibiotics must be completed. This study also suggests that efficient measures should be applied to identify and reduce Cd and Hg pollution in Aotou Harbor.
Author Contributions
Data curation, Z.K. and X.X.; Formal analysis, B.L.; Methodology, M.Y. and J.Z.; Software, W.W. and H.N.; Supervision, J.W.; Writing—original draft, H.T.
Acknowledgments
This work was supported in part by the National Nature Science Foundation of China (31670458 and 41706186) and High Level Talents Program of South China Agricultural University (0A293–8000/217047 and K17021).
Conflicts of Interest
The authors declare no conflict of interest.
References
- Gu, Y.G.; Huang, H.H.; Lin, Q. Concentrations and human health implications of heavy metals in wild aquatic organisms captured from the core area of Daya Bay’s Fishery Resource Reserve, South China Sea. Environ. Toxicol. Pharmacol. 2016, 45, 90–94. [Google Scholar] [CrossRef] [PubMed]
- Huang, F.; Xu, Y.; Tan, Z.; Wu, Z.; Xu, H.; Shen, L.; Xu, X.; Han, Q.; Guo, H.; Hu, Z. Assessment of pollutions and identification of sources of heavy metals in sediments from west coast of Shenzhen, China. Environ. Sci. Pollut. Res. 2018, 25, 3647–3656. [Google Scholar] [CrossRef] [PubMed]
- Tuzen, M. Toxic and essential trace elemental contents in fish species from the Black Sea Turkey. Food Chem. Toxicol. 2009, 47, 1785–1790. [Google Scholar] [CrossRef] [PubMed]
- Zhang, W.; Guo, Z.; Song, D.; Du, S.; Zhang, L. Arsenic speciation in wild marine organisms and a health risk assessment in a subtropical bay of China. Sci. Total Environ. 2018, 626, 621–629. [Google Scholar] [CrossRef] [PubMed]
- Gu, Y.G.; Lin, Q.; Wang, X.H.; Du, F.Y.; Yu, Z.L.; Huang, H.H. Heavy metal concentrations in wild fishes captured from the South China Sea and associated health risks. Mar. Pollut. Bull. 2015, 96, 508–512. [Google Scholar] [CrossRef] [PubMed] [Green Version]
- Zheng, S.; Wang, P.; Wang, C.; Hou, J.; Qian, J. Distribution of metals in water and suspended particulate matter during thr resuspension processes in Taihu Lake sediment, China. Quat. Int. 2013, 286, 94–102. [Google Scholar] [CrossRef]
- Zhang, P.; Hu, R.; Zhu, L.; Wang, P.; Yin, D.; Zhang, L. Distributions and contamination assessment of heavy metals in the surface sediments of western Laizhou Bay: Implications for the sources and influencing factors. Mar. Pollut. Bull. 2017, 119, 429–438. [Google Scholar] [CrossRef] [PubMed]
- Makokha, V.A.; Qi, Y.; Shen, Y.; Wang, J. Concentrations, Distribution, and Ecological Risk Assessment of Heavy Metals in the East Dongting and Honghu Lake, China. Expo Health 2016, 8, 31–41. [Google Scholar] [CrossRef]
- Liu, M.X.; Yang, Y.Y.; Yun, X.Y.; Zhang, M.M.; Wang, J. Distribution and ecological assessment of heavy metals in surface sediments of the East Lake, China. Ecotoxicology 2014, 23, 92–101. [Google Scholar] [CrossRef] [PubMed]
- Li, G.H.; Cao, Z.M.; Lan, D.Z.; Xu, J.; Wang, S.S.; Yin, W.H. Spatial variations in grain size distribution and selected metal contents in the Xiamen Bay, China. Environ. Geol. 2007, 52, 1559–1567. [Google Scholar] [CrossRef]
- Matthiessen, P.; Law, R.J. Contaminants and their effects on estuarine and coastal organisms in the United Kingdom in the late twentieth century. Environ. Pollut. 2002, 120, 739–757. [Google Scholar] [CrossRef]
- Hill, N.A.; Simpson, S.L.; Johnston, E.L. Beyond the bed: Effects of metal contamination on recruitment to bedded sediments and overlying substrata. Environ. Pollut. 2013, 173, 182–191. [Google Scholar] [CrossRef] [PubMed]
- Gao, X.; Zhou, F.; Chen, C.A.; Xing, Q. Trace metals in the suspended particulate matter of the Yellow River (Huanghe) estuary: Concentrations, potential mobility, contamination assessment and the fluxes into the Bohai Sea. Cont. Shelf Res. 2015, 104, 25–36. [Google Scholar] [CrossRef]
- Zhang, L.; Ye, X.; Feng, H.; Jing, Y.; Ouyang, T.; Yu, X.; Liang, R.; Gao, C.; Chen, W. Heavy metal contamination in western Xiamen Bay sediments and its vicinity, China. Mar. Pollut. Bull. 2007, 54, 974–982. [Google Scholar] [CrossRef] [PubMed]
- Dou, Y.; Li, J.; Zhao, J.; Hu, B.; Yang, S. Distribution, enrichment and source of heavy metals in surface sediments of the eastern Beibu Bay, South China Sea. Mar. Pollut. Bull. 2013, 67, 137–145. [Google Scholar] [CrossRef] [PubMed]
- Vetrimurugan, E.; Shruti, V.C.; Jonathan, M.P.; Roy, P.D.; Rawlins, B.K.; Rivera-Rivera, D.M. Metals and their ecological impact on beach sediments near the marine protected sites of Sodwana Bay and St. Lucia, South Africa. Mar. Pollut. Bull. 2018, 127, 568–575. [Google Scholar] [CrossRef] [PubMed]
- Wang, Y.S.; Lou, Z.P.; Sun, C.C.; Sun, S. Ecological environment changes in Daya Bay, China, from 1982 to 2004. Mar. Pollut. Bull. 2008, 56, 1871–1879. [Google Scholar] [CrossRef] [PubMed] [Green Version]
- Wang, X.H.; Du, F.Y.; Qiu, Y.S.; Li, C.H.; Sun, D.R.; Jia, X.P. Variations of fish species diversity, faunal assemblage, and abundances in Daya Bay in 1980–2007. Chin. J. Appl. Ecol. 2010, 21, 2403–2410. (In Chinese) [Google Scholar]
- Wu, M.L.; Wang, Y.S.; Sun, C.C.; Wang, H.L.; Dong, J.D.; Han, S.H. Identification of anthropogenic effects and seasonality on water quality in Daya Bay, South China Sea. J. Environ. Manag. 2009, 90, 3082–3090. [Google Scholar] [CrossRef] [PubMed] [Green Version]
- Qiu, Y.; Wang, Z. An assessment of potential ecological risk of heavy metals in culture water area of Daya Bay. Trophic Oceanogr. 1997, 19, 49–53. [Google Scholar]
- Du, J.; Mu, H.; Song, H.; Yan, S.; Gu, Y.; Zhang, J. 100 years of sediment history of heavy metals in Daya Bay, China. Water Air Soil Pollut. 2008, 190, 343–351. [Google Scholar] [CrossRef]
- Gao, X.; Chen, S.; Long, A. Composition and sources of organic matter and its solvent extractable components in surface sediments of a bay under serious anthropogenic influences: Daya Bay, China. Mar. Pollut. Bull. 2008, 56, 1066–1075. [Google Scholar] [CrossRef] [PubMed] [Green Version]
- Yu, X.J.; Yan, Y.; Wang, W.X. The distribution and speciation of trace metals in surface sediments from the Pearl River Estuary and the Daya Bay, Southern China. Mar. Pollut. Bull. 2010, 60, 1364–1371. [Google Scholar] [CrossRef] [PubMed] [Green Version]
- Yang, J.; Cao, L.L.; Wang, J.H.; Liu, C.L.; Huang, C.G.; Cai, W.X.; Fang, H.D.; Peng, X.J. Speciation of Metals and Assessment of Contamination in Surface Sediments from Daya Bay, South China Sea. Sustainability 2014, 6, 9096–9113. [Google Scholar] [CrossRef] [Green Version]
- Bai, J.; Jia, J.; Zhang, G.; Zhao, Q.; Lu, Q.; Cui, B.; Liu, X. Spatial and temporal dynamics of heavy metal pollution and source identification in sediment cores from the short-term flooding riparian wetlands in a Chinese delta. Environ. Pollut. 2016, 219, 379–388. [Google Scholar] [CrossRef] [PubMed]
- Wen, X.; Wang, Q.; Zhang, G.; Bai, J.; Wang, W.; Zhang, S. Assessment of heavy metals contamination in soil profiles of roadside Suaeda salsa wetlands in the Yellow River Delta, China. Phys. Chem. Earth Parts A/B/C 2017, 97, 71–76. [Google Scholar] [CrossRef]
- Wang, Y.S.; Lou, Z.P.; Sun, C.C.; Wu, M.L.; Han, S.H. Multivariate statistical analysis of water quality and phytoplankton characteristics in Daya Bay, China, from 1999 to 2002. Oeanologia 2006, 48, 193–211. [Google Scholar]
- Liu, M.X.; Yang, Y.Y.; Yun, X.Y.; Zhang, M.M.; Wang, J. Concentrations, distribution, sources, and ecological risk assessment of heavy metals in agricultural topsoil of the Three Gorges Dam region, China. Environ. Monit. Assess. 2005, 187, 147–153. [Google Scholar] [CrossRef] [PubMed]
- Li, G.; Hu, B.; Bi, J.; Leng, Q.; Xiao, C.; Yang, Z. Heavy metals distribution and contamination in surface sediments of the coastal Shandong Peninsula (Yellow Sea). Mar. Pollut. Bull. 2013, 76, 420–426. [Google Scholar] [CrossRef] [PubMed]
- Hakanson, L. An ecological risk index for aquatic pollution control, a sedimentological approach. Water Res. 1980, 14, 975–1001. [Google Scholar] [CrossRef]
- Zhao, Y.; Yan, M. Geochemistry of Shallow Sea Sediment in China; Science Publisher: Beijing, China, 1994. (In Chinese) [Google Scholar]
- Müller, G. Die Schwermetallbelastung der sediments des Neckars und seiner Nebenflusse: Eine Bestandsaufnahme. Chemiker-Zeitung 1981, 5, 157–164. [Google Scholar]
- Zhou, F.; Guo, H.; Liu, L. Quantitative identification and source apportionment of anthropogenic heavy metals in marine sediment of Hong Kong. Environ. Geol. 2007, 53, 295–305. [Google Scholar] [CrossRef]
- Zhao, G.; Ye, S.; Yuan, H.; Ding, X.; Wang, J. Surface sediment properties and heavy metal pollution assessment in the Pearl River Estuary, China. Environ. Sci. Pollut. Res. 2017, 24, 2966–2979. [Google Scholar] [CrossRef] [PubMed]
- Yu, R.; Yuan, X.; Zhao, Y.; Hu, G.; Tu, X. Heavy metal pollution in intertidal sediments from Quanzhou Bay, China. J. Environ. Sci. 2008, 20, 664–669. [Google Scholar] [CrossRef]
- Qiao, Y.M.; Yang, Y.; Gu, J.G.; Zhao, J.G. Distribution and geochemical speciation of heavy metals in sediments from coastal area suffered rapid urbanization, a case study of Shantou Bay, China. Mar. Pollut. Bull. 2013, 68, 140–146. [Google Scholar] [CrossRef] [PubMed]
- Qiu, Y.W.; Yu, K.F. Accumulation of heavy metals in sediment of mangrove wetland from Hainan Island. J. Trophic Oceangr. 2011, 30, 102–108. [Google Scholar]
- Xiao, C.; Jian, H.; Chen, L.; Liu, C.; Gao, H.; Zhang, C.; Liang, S.; Li, Y. Toxic metal pollution in the Yellow Sea and Bohai Sea, China: Distribution, controlling factors and potential risk. Mar. Pollut. Bull. 2017, 119, 381–389. [Google Scholar] [CrossRef] [PubMed]
- State Environmental Protection Administration of China (SEPA). Marine Sediment Quality (GB 18668-2002); Standards Press of China: Beijing, China, 2002. (In Chinese) [Google Scholar]
- Long, E.R.; Macdonald, D.D.; Smit, S.L.; Calder, F.D. Incidence of adverse biological effects within ranges of chemical concentrations in marine and estuaryne sediments. Environ. Manag. 1995, 19, 81–97. [Google Scholar] [CrossRef]
- Chen, W.; Zhou, J.; Li, Y. Tendency and Causes Analysis of Marine Water Quality of Daya Bay. Environ. Sci. Technol. 2010, 33, 28–32. [Google Scholar]
- Nosrati-Ghods, N.; Ghadiri, M.; Fruh, W.G. Management and environmental risk study of the physicochemical parameters of ballast water. Mar. Pollut. Bull. 2017, 114, 428–438. [Google Scholar] [CrossRef] [PubMed]
- Feng, D.L.; Chen, X.F.; Tian, W.; Qian, Q.; Shen, H.; Liao, D.X.; Lv, B.Y. Pollution characteristics and ecological risk of heavy metals in ballast tank sediment. Environ. Sci. Pollut. Res. 2017, 24, 3951–3958. [Google Scholar] [CrossRef] [PubMed]
- Jian, Z. Study on Organic Pollutants Sources and their Distribution Characteristics in Daya Bay Waters. Master’s Thesis, Ocean University of China, Qingdao, China, 2005. (In Chinese). [Google Scholar]
- Duc, T.A.; Loi, V.D.; Thao, T.T. Partition of heavy metals in a tropical river system impacted by municipal waste. Environ. Monit. Assess. 2013, 185, 1907–1925. [Google Scholar] [CrossRef] [PubMed]
- Laing, G.D.; Vos, R.D.; Vandecasteele, B.; Lesage, E.; Tack, F.M.G.; Verloo, M.G. Effect of salinity on heavy metal mobility and availability in intertidal sediments of the Scheldt estuary. Estuar. Coast. Shelf Sci. 2008, 77, 589–602. [Google Scholar] [CrossRef]
- Popenda, A. Effect of redox potential on heavy metals and as behavior in dredged sediments. Desalination Water Treat. 2014, 52, 3918–3927. [Google Scholar] [CrossRef]
- Kelderman, P.; Osman, A.A. Effect of redox potential on heavy metal binding forms in polluted canal sediments in Delft (The Netherlands). Water Res. 2007, 41, 4251–4261. [Google Scholar] [CrossRef] [PubMed]
- Xiao, R.; Bai, J.; Huang, L.; Zhang, H.; Cui, B.; Liu, X. Distribution and pollution, toxicity and risk assessment of heavy metals in sediments from urban and rural rivers of the Pearl River delta in southern China. Ecotoxicology 2013, 22, 1564–1575. [Google Scholar] [CrossRef] [PubMed]
- Marcin, S.; Mariusz, S. Application of multivariate statistical approach to identifytrace elements sources in surface waters: A case study of Kowalskie and Stare Miasto reservoirs, Poland. Environ. Monit. Assess. 2017, 189, 364. [Google Scholar]
- Emerson, S.; Hedges, J.I. Processes controlling the organic carbon content of open ocean sediments. Paleoceanography 1998, 3, 621–634. [Google Scholar] [CrossRef]
- Gao, X.; Yang, Y.; Wang, C. Geochemistry of organic carbon and nitrogen in surface sediments of coastal Bohai Bay inferred from their ratios and stable isotopic signatures. Mar. Pollut. Bull. 2012, 64, 1148–1155. [Google Scholar] [CrossRef] [PubMed] [Green Version]
- Ke, Z.; Tan, Y.; Huang, L.; Zhao, C.; Jiang, X. Spatial distributions of δ13C, δ15N and C/N ratios in suspended particulate organic matter of a bay under serious anthropogenic influences: Daya Bay, China. Mar. Pollut. Bull. 2017, 114, 183–191. [Google Scholar] [CrossRef] [PubMed]
Figure 1.
Sampling sites in Daya Bay.

Figure 2.
Comparison of mean concentrations of heavy metal in the present study in 2017 with those of previous years. Data of 1996, 1998, 2006, 2008a, 2008b, 2011 were referenced from [15,20,21,22,23,24], respectively.

Figure 3.
Spatial distributions of heavy metals concentrations, total organic content (TOC), total nitrogen (TN), and carbon-nitrogen ratio (C/N) in the sediment of Daya Bay, China.
Figure 3.
Spatial distributions of heavy metals concentrations, total organic content (TOC), total nitrogen (TN), and carbon-nitrogen ratio (C/N) in the sediment of Daya Bay, China.
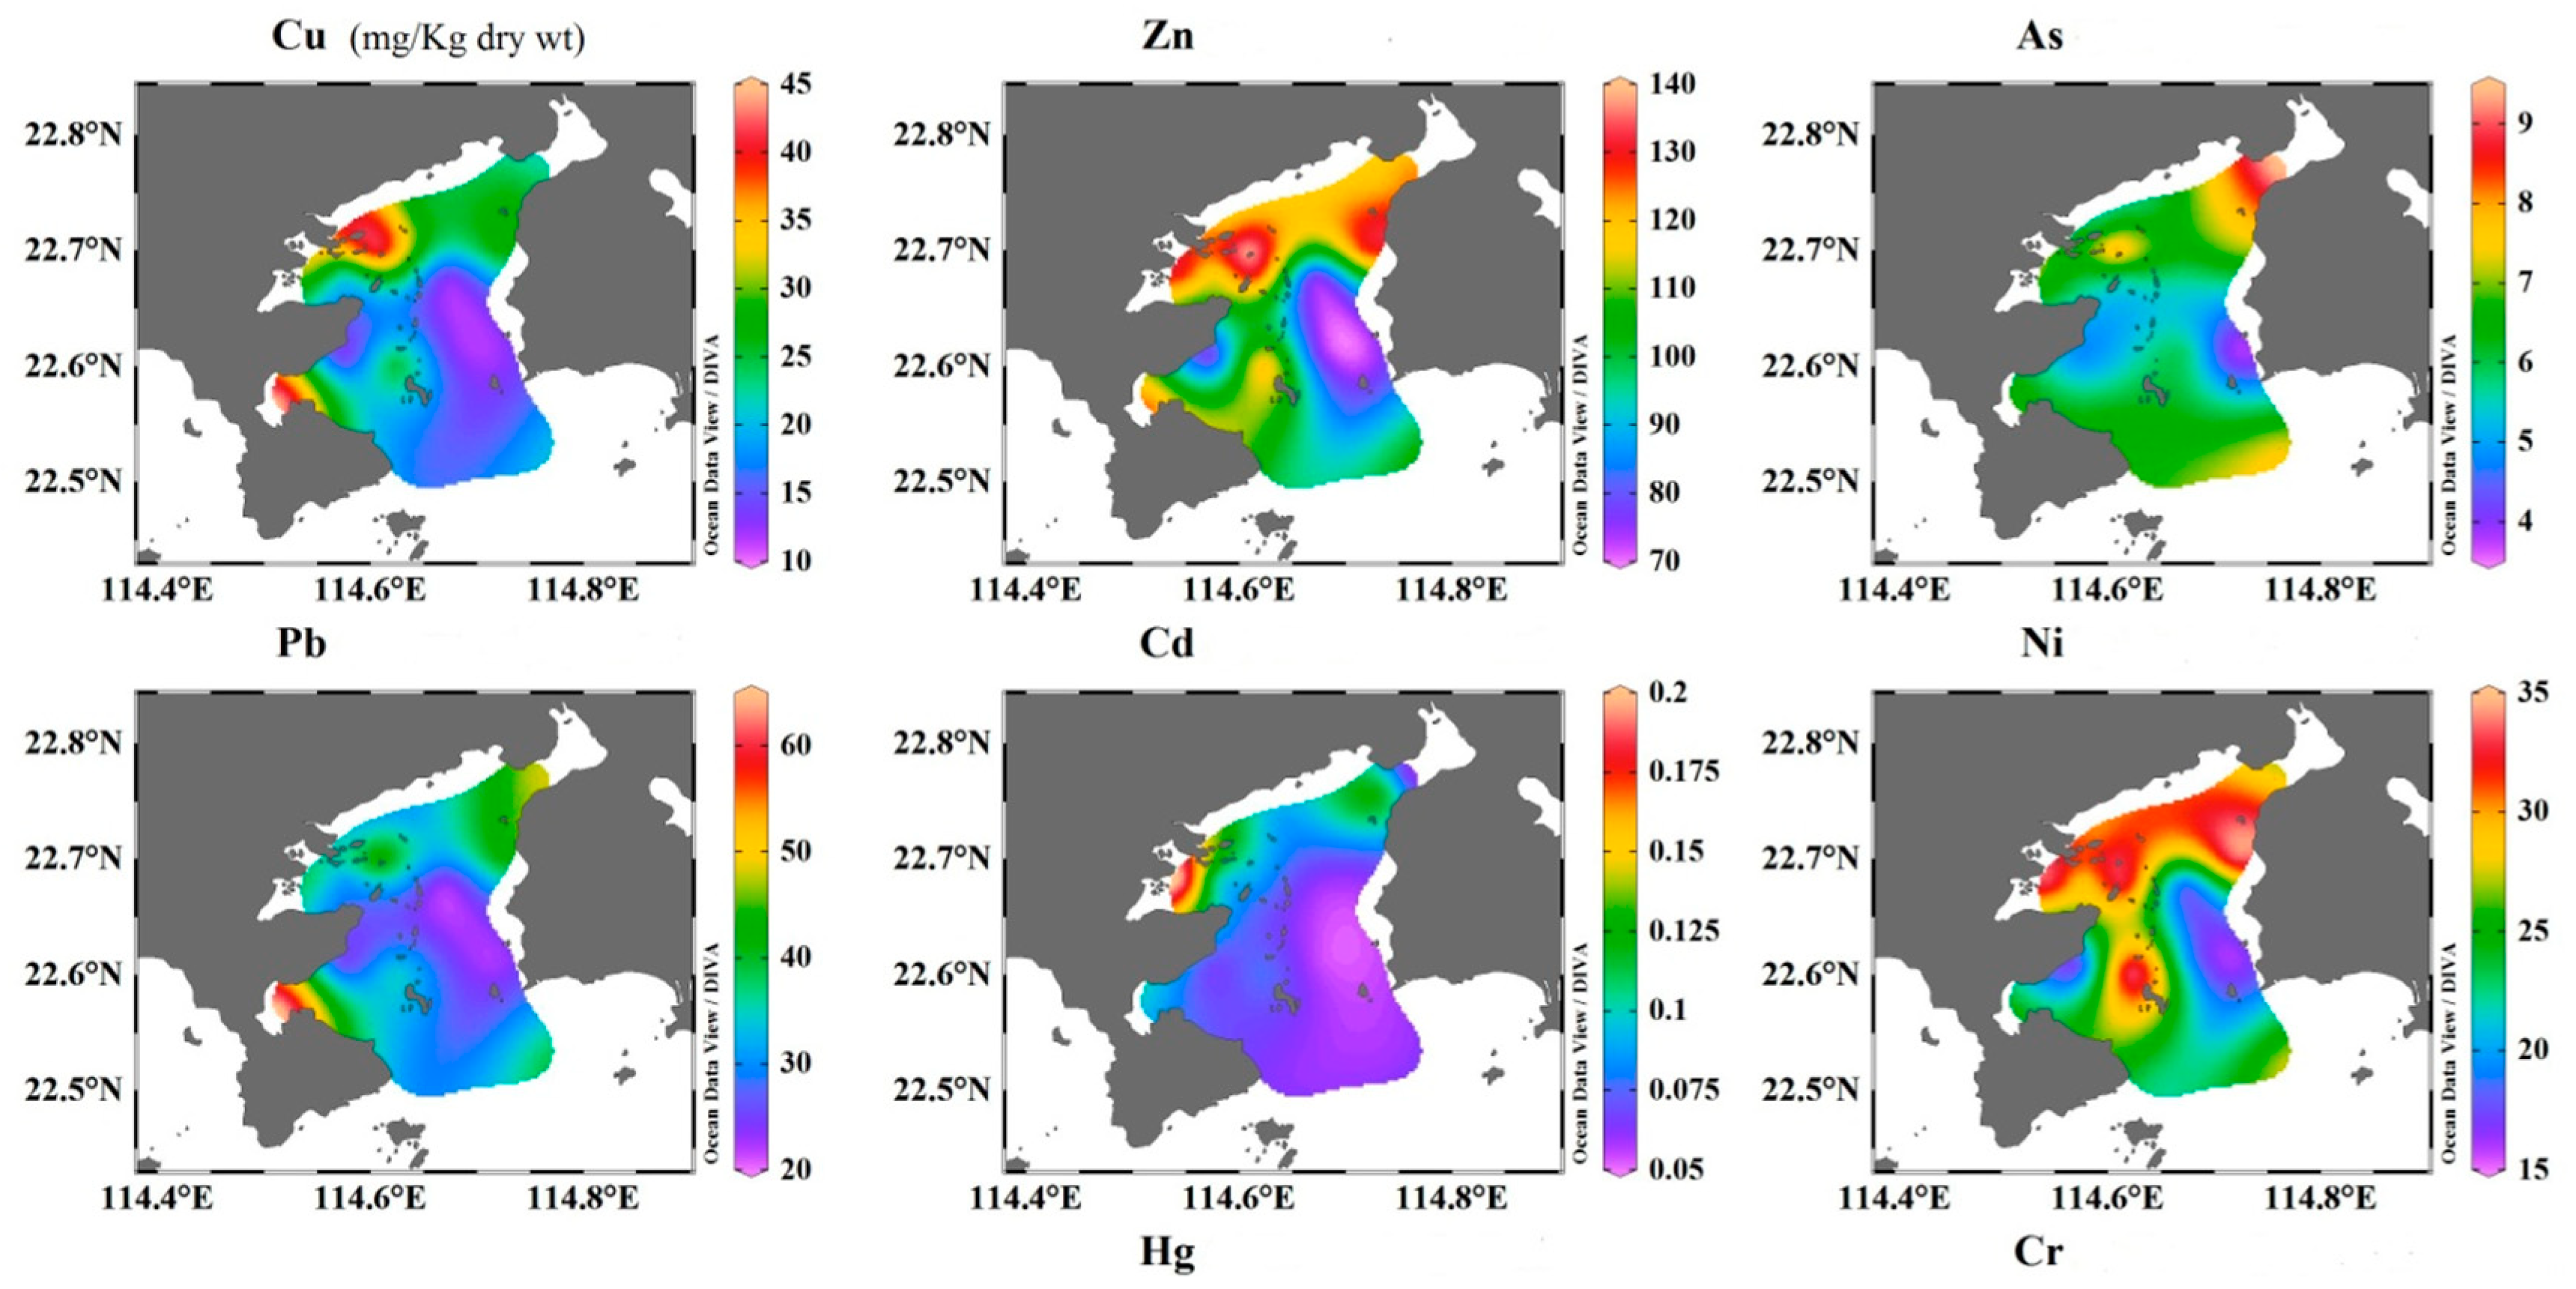

Figure 4.
(a) Potential risk (Eif) of single metal and (b) integrated potential risk (RI) of different sampling sites in sediments of Daya Bay.
Figure 4.
(a) Potential risk (Eif) of single metal and (b) integrated potential risk (RI) of different sampling sites in sediments of Daya Bay.

Figure 5.
Geo-accumulation index (Igeo) of heavy metals in the surface sediments of Daya Bay.

Figure 6.
Principal component loading of heavy metals, TOC, and TN.

Table 1.
Comparison of mean concentrations of heavy metals in the surface sediments of Daya Bay and other coastal areas, sediment quality guidelines (SQGs) of China, and effects-based SQGs of USA.
Table 1.
Comparison of mean concentrations of heavy metals in the surface sediments of Daya Bay and other coastal areas, sediment quality guidelines (SQGs) of China, and effects-based SQGs of USA.
| Standard | Location | Concentration (µg g−1 dry wt) | ||||||||
|---|---|---|---|---|---|---|---|---|---|---|
| Cu | Zn | As | Pb | Cd | Ni | Hg | Cr | Reference | ||
| Daya Bay, China, mean (SD) | 24.1 (9.7) | 108.9 (21.5) | 6.5 (1.3) | 35.3 (10.1) | 0.09 (0.03) | 26.8 (6.0) | 0.07 (0.1) | 108.7 (21.9) | This study | |
| Daya Bay, China, range | 12.2–43.4 | 71.8–138.5 | 3.8–9.4 | 22.5–64.2 | 0.05–0.2 | 16.1–33.6 | 0.01–0.43 | 71.3–138.0 | ||
| Pearl River Estuary, China | 46.8 | 143.1 | 22 | 50 | 0.46 | NA a | 0.13 | 78.4 | [34] | |
| Shantou Bay, China | 48.5 | 153.3 | 51.6 | 0.67 | 22.95 | NA | 53.6 | [36] | ||
| Quanzhou Bay, China | 71.4 | 179.6 | 21.7 | 67.7 | 0.69 | NA | NA | 82 | [35] | |
| Sanya Bay, China | 9.5 | 53.1 | 7.1 | 17.5 | 0.13 | NA | NA | 12.4 | [37] | |
| Weste Laizhou Bay, China | 6.89 | NA | 4.84 | 14.01 | 0.08 | NA | NA | 17.1 | [7] | |
| Yellow Sea, China | 19.8 | 67.1 | 7.2 | 16.3 | 0.26 | 25.7 | 0.2 | 45.4 | [38] | |
| Beibu Bay, China | 58.3 | 67.3 | 9.53 | 28 | 0.16 | NA | 0.06 | 53.6 | [15] | |
| Background in Daya Bay | 15 | 65 | 7.7 | 20 | 0.065 | 24 | 0.025 | 60 | [31] | |
| GB 18668-2002 | Class I b | 35 | 150 | 20 | 60 | 0.5 | 0.2 | 80 | [39] | |
| Class I b | 100 | 350 | 65 | 130 | 1.5 | 0.5 | 150 | |||
| Class III b | 200 | 600 | 93 | 250 | 5 | 1 | 270 | |||
| Effects-based SQGs | ERL c | 34 | 150 | 8.2 | 47 | 1.2 | 21 | 0.15 | 81 | [40] |
| ERM c | 270 | 410 | 70 | 218 | 9.6 | 52 | 0.71 | 370 | ||
Data in brackets were standard deviation (SD) of the concentrations. a NA indicates no data available. b Values are the upper limit for the grades. c ERL, Effects Range-Low, threshold below which adverse effects on biota are rarely observed; ERM, Effects Range-Median, threshold above which adverse effects on biota are frequently observed.
Table 2.
Pearson correlation (PC) coefficient matrix of heavy metals, salinity, redo potential (Eh), total nitrogen (TN), and total organic content (TOC) in the surface sediments of Daya Bay.
Table 2.
Pearson correlation (PC) coefficient matrix of heavy metals, salinity, redo potential (Eh), total nitrogen (TN), and total organic content (TOC) in the surface sediments of Daya Bay.
| Items | Salinity | Eh | TOC % | TN % | Cu | Zn | As | Pb | Cd | Ni | Hg | Cr |
|---|---|---|---|---|---|---|---|---|---|---|---|---|
| Salinity | 1 | |||||||||||
| Eh | −0.35 | 1 | ||||||||||
| TOC % | −0.72 ** | −0.55 ** | 1 | |||||||||
| TN % | −0.67 ** | −0.57 ** | 0.99 ** | 1 | ||||||||
| Cu | −0.64 ** | −0.47 * | 0.81 ** | 0.77 ** | 1 | |||||||
| Zn | −0.69 ** | −0.61 ** | 0.95 ** | 0.93 ** | 0.82 ** | 1 | ||||||
| As | −0.49 * | −0.16 | 0.48 * | 0.44 | 0.36 | 0.58 ** | 1 | |||||
| Pb | −0.56 ** | −0.26 | 0.71 ** | 0.69 ** | 0.73 ** | 0.68 ** | 0.65 ** | 1 | ||||
| Cd | −0.55 ** | −0.77 ** | 0.54 ** | 0.45 | 0.58 ** | 0.61 ** | 0.25 | 0.316 | 1 | |||
| Ni | −0.58 ** | −0.66 ** | 0.88 ** | 0.86 ** | 0.67 ** | 0.931 ** | 0.50 * | 0.46 * | 0.58 ** | 1 | ||
| Hg | −0.41 | −0.72 ** | 0.35 | 0.28 | 0.30 | 0.42 | 0.27 | 0.27 | 0.84 ** | 0.40 | 1 | |
| Cr | −0.65 ** | −0.62 ** | 0.93 ** | 0.9 ** | 0.80 ** | 0.94 ** | 0.42 | 0.63 ** | 0.66 ** | 0.89 ** | 0.47 * | 1 |
* Significant correlation at p < 0.05. ** Significant correlation at p < 0.01.
© 2018 by the authors. Licensee MDPI, Basel, Switzerland. This article is an open access article distributed under the terms and conditions of the Creative Commons Attribution (CC BY) license (http://creativecommons.org/licenses/by/4.0/).
Share and Cite
MDPI and ACS Style
Tang, H.; Ke, Z.; Yan, M.; Wang, W.; Nie, H.; Li, B.; Zhang, J.; Xu, X.; Wang, J. Concentrations, Distribution, and Ecological Risk Assessment of Heavy Metals in Daya Bay, China. Water 2018, 10, 780. https://doi.org/10.3390/w10060780
AMA Style
Tang H, Ke Z, Yan M, Wang W, Nie H, Li B, Zhang J, Xu X, Wang J. Concentrations, Distribution, and Ecological Risk Assessment of Heavy Metals in Daya Bay, China. Water. 2018; 10(6):780. https://doi.org/10.3390/w10060780
Chicago/Turabian StyleTang, Huijuan, Zhixin Ke, Muting Yan, Wenjing Wang, Huayue Nie, Boxing Li, Jingping Zhang, Xiangrong Xu, and Jun Wang. 2018. "Concentrations, Distribution, and Ecological Risk Assessment of Heavy Metals in Daya Bay, China" Water 10, no. 6: 780. https://doi.org/10.3390/w10060780
Note that from the first issue of 2016, this journal uses article numbers instead of page numbers. See further details here.