Seven-Year Running Effect Evaluation and Fate Analysis of Rain Gardens in Xi’an, Northwest China

State Key Laboratory of Eco-hydraulics in Northwest Arid Region of China, Xi’an University of Technology, Xi’an 710048, China
*
Author to whom correspondence should be addressed.
Water 2018, 10(7), 944; https://doi.org/10.3390/w10070944
Submission received: 10 June 2018
/
Revised: 28 June 2018
/
Accepted: 10 July 2018
/
Published: 16 July 2018
(This article belongs to the Section Urban Water Management)
Abstract
:Rain gardens have recently been studied as important low-impact development (LID) facilities that play a critical role in runoff volume reduction and pollutant purification. Approximately 16–40 rainfall events were monitored from March 2011 to October 2017 in order to determine the running effect of three rain gardens with respect to runoff volume reduction and pollutant purification. In particular, running fate analysis of rain gardens is the key focus in this study. Combined analyses revealed three key points. Firstly, performance assessment demonstrated that rain gardens effectively cut inflow volumes through the filter media; when the confluence area ratio was 6:1–20:1 (confluence ratio = roof area or road/garden area) and the rainfall was approximately 2.8–39.9 mm, the runoff volume reduction rate ranged from 9.8% to 100.0%. However, the average annual runoff reduction rate presented an initially increasing and then gradually decreasing trend with monitoring time. Secondly, according to water quality data in 54 rainfall events, the annual average concentration removal rate of NH4+-N was relatively good, but generally decreased with monitoring time. The concentration removal rate of NO3−-N and total phosphorus (TP) is unstable; however, the removal rate of total suspended solids (TSS) is better than that of total nitrogen (TN). Combined with runoff reduction, the pollutant load reduction by rain gardens is greater than 50%, although this decreases with increasing monitoring time. Thirdly, through the study of 7-year running effect on runoff reduction and pollutant purification, the “three-stage purification (TSP) concept” (periods of purification growth, stability, and attenuation) with respect to pollutant load reduction processes was finally proposed, and a curve chart was drawn for pollutant load reduction and rain garden operating fate (the “P–F” curve chart).
1. Introduction
Rain gardens (also known as biofilter or bioretention systems) have recently been studied as important low-impact development (LID) facilities. Their unique underlying surfaces (permeable filler media) play a critical role in runoff volume reduction and pollutant purification [1,2], which can promote favourable hydrologic cycles by improving the capacity for infiltration, storage, purification, and discharge of rainfall [3]. Rain gardens, as a type of sponge, have gradually become a priority in urban construction.
The advantages of simple operation and management as well as the ecological benefits and landscape effects of rainwater gardens have attracted increasing attention from the industry in recent years. Accordingly, the amount of research on rainwater gardens has gradually grown [4,5]. Studies on rain gardens have different areas of focus. Firstly, there is the hydrological effect. This effect is usually studied by constructing research models. Through simulation of hydrological processes such as storage, infiltration, and evaporation using the storm water management model (SWMM model) (among others), the effect of LID measures on runoff, peak flow, and runoff pollution control can be obtained easily [6,7]. Secondly, there is pollutant purification. There are various studies on this aspect. Nitrogen in rainfall runoff can be effectively removed by optimizing the structure of rain gardens, increasing the height of flooded areas, or by improving denitrification conditions [8,9,10]. The removal effect of ammonium or particulate phosphorus can be improved by adding modified filter media to enhance the matrix adsorption or microorganism degradation capability of rain gardens [11]. Thirdly, there is research on filter media in rain gardens. Some studies have found that rain gardens generally have a relatively unique underlying surface (i.e., water permeable filler media), and they can retain runoff volume, delay flood peak flow, or provide a cushion for rainfall runoff [12,13].Thus, the media type of the rain garden has an important influence on its purification effect [14]. Fourthly, some research focuses on plant selection in rain gardens. Studies have shown that rain gardens mainly rely on the combined action of filter media and plants to remove pollutants and reduce rainfall runoff; therefore, the selection of suitable plants is an important factor influencing the function of rainwater gardens [15,16]. Fifthly, there is applied research on rainwater gardens. There is much literature on storm-water reduction and pollutant purification by rain gardens. Autixier [17] found that of the total impervious area within the basin directly connected to the sewer system, a maximum of 21% could be alternately directed towards rain gardens. The runoff reductions for the entire catchment ranged from 12.7% to19.4% depending on the event considered. Other researchers showed the created biphasic rain gardens were highly effective in removing nitrate (~91%), phosphate (~99%), atrazine (~90%), dicamba (~92%), glyphosate(~99%), and 2,4-dichlorophenoxy(~90%) under high levels of pollution loading with simulated runoff events [18]. However, studies on the running effect of runoff volume reduction and pollutant purification over several years in rain gardens is relatively scarce [19]. When the pollutant purification rate of plant absorption and microbial degradation is lower than the filter adsorption rate in rain gardens, the amount of pollutants absorbed in the filter will gradually increase, which will result in an overall yearly decrease in the purification potential of the filter. Rain gardens lose their purification capability when the filter media reaches a saturation point of pollutant adsorption, and thus reach the end of their lifetime [20]. At present, running fate analysis of rain gardens has yet to be reported.
More information on field tests of rain gardens over several years of performance is needed to provide a better fundamental understanding of runoff volume reduction and pollutant purification, and to determine the running fate of rain gardens. This information can lead to enhanced urban storm-water and pollutant management through improved rain garden design. With this consideration, the objectives of this study are to: (1) determine the variation laws of inflow, outflow, and overflow of three rain gardens with increasing monitoring time; (2) quantify the concentration of NH4+-N, NO3−-N, total nitrogen (TN), total phosphorus (TP) and total suspended solids (TSS) flow into/out of rain gardens from March 2011 to October 2017; and (3)analyse the running fate of rain gardens (running fate in the article refers to the lifespan of rain garden, the variation of runoff volume reduction, and the pollutant purification effect with the monitoring time as the indicator). Conclusions from related research can provide important theoretical support for further study of LID facilities.
2. Materials and Methods
2.1. Description of the Case Study Site and Introduction of Rain Gardens
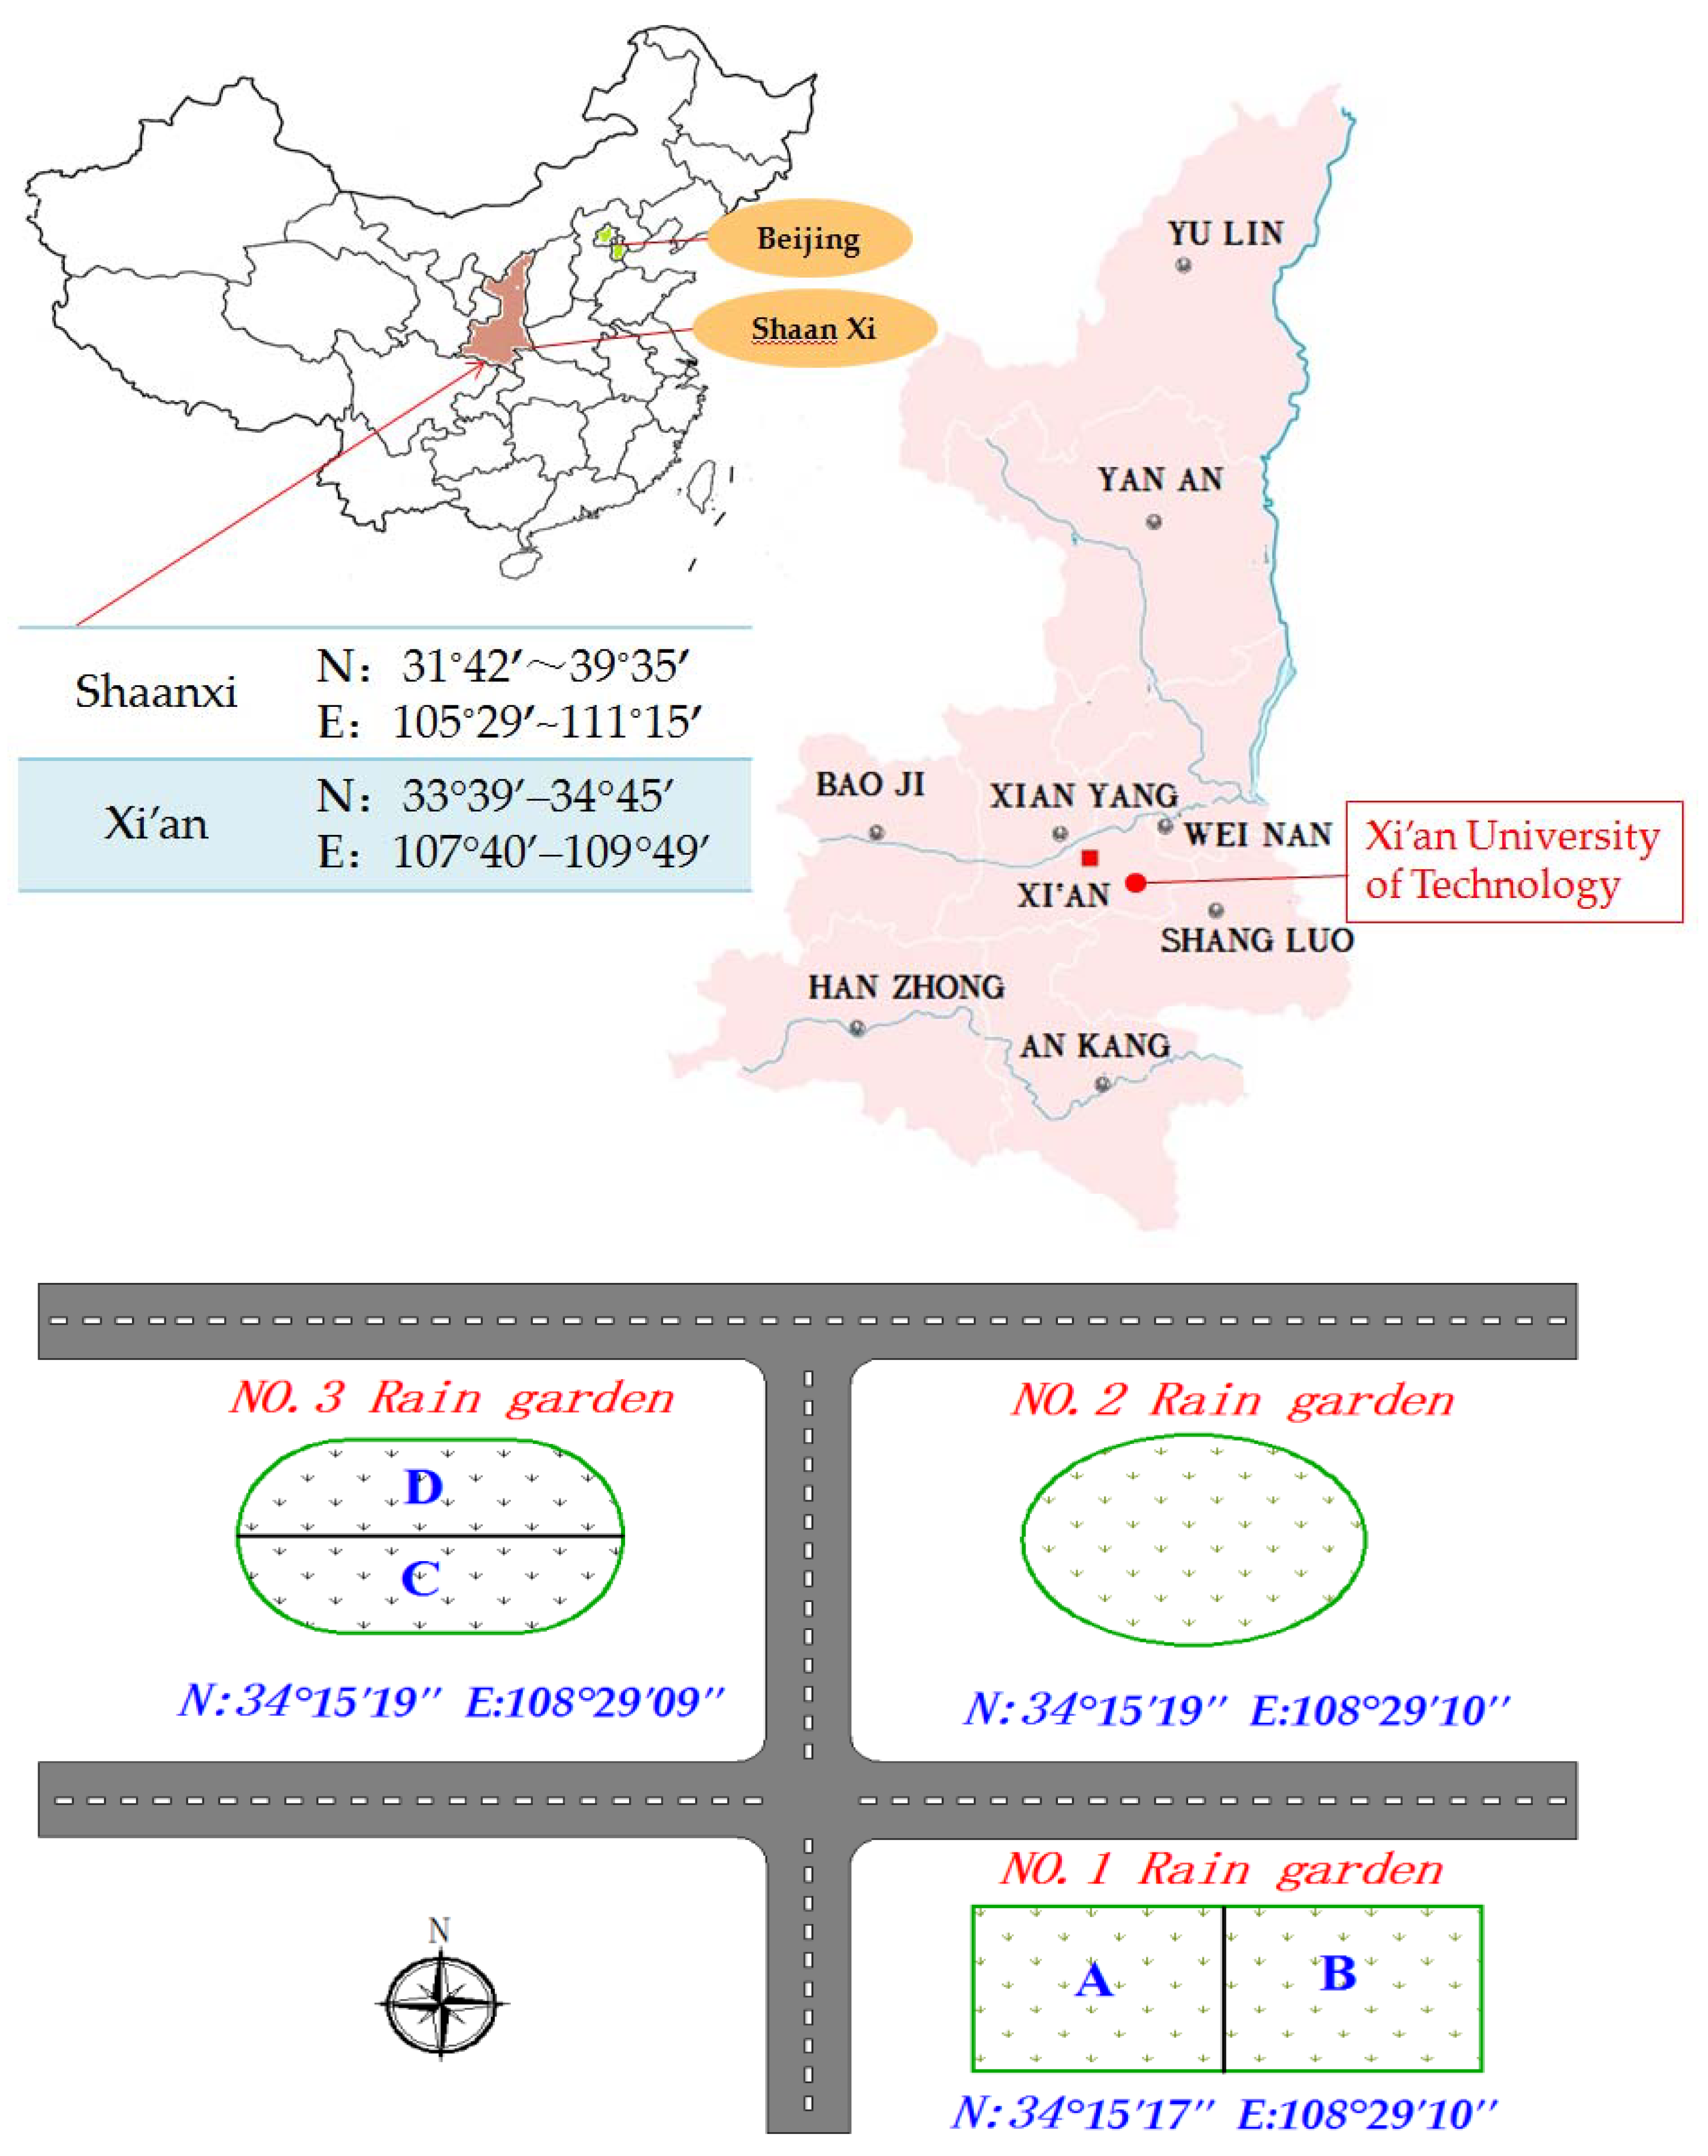
The rain gardens in this study are located on the campus of Xi’an University of Technology in Xi’an, Shaanxi Provence, China. The city of Xi’an is in Northwest China (E107°40′–109°49′ and N33°39′–34°45’) which has a temperate continental climate. The annual average temperature in Xi’an is 13 °C, the average annual rainfall is 551 mm, and the average annual evaporation is 990 mm [21]. More than 80% of rainfall occurs in the months of May to October. The city is situated on widely distributed loess soil that generally has deep profile of more than 50 m. The soil bulk density is generally 1.35 g/cm3, comprising 9% clay, 80% silt, and 10% sand. The reported infiltration rate of the loess soil varies from 0.4 m/d to 2 m/d and higher. Over-pumping of groundwater in Xi’an has caused great depression of ground water table depth in the city range. The treatment of storm-water runoff with rain gardens has great potential to encourage focused recharge in Xi’an, considering the moderate rainfall, a deep soil profile, and a low water table. This study involves three rain gardens.
2.1.1. Rain Garden No. 1
Rain garden No. 1 accepts rainfall from a building roof built in 2010 [22]. It includes two parts, namely, A and B, as illustrated in Figure 1. The confluence area of rain garden No. 1 is 144 m2. Thunbergiaalata was planted in the rain garden. The bottom of rain garden No. 1 was laid with waterproof geomembrane, placed with perforated Polyvinyl Chloride (PVC) tube drainage (d =110 mm), wrapped in permeable geotextile, and covered with a layer of gravel. Inflow and outflow of the rain garden was measured with pressure transducers mounted on V-notch weirs of 30° installed at the inlet and outlet of the rain garden. Runoff volume reduction and pollutant purification are the major indexes for evaluation of the running effect.
2.1.2. Rain Garden No. 2
Rain garden No. 2 was built in 2011 and filled with loess soil with an area of 30.24 m2. Tageteserecta L. and Hedera nepalensis var. sinensis (Tobl.) Rehd were planted in the rain garden. The confluence area of rain garden No. 2 was 604.7 m2. Inflow of the rain garden was measured with pressure transducers mounted on V-notch weirs of 45° installed at the inlet of the rain garden, and overflow was measured with draft mounted on V-notch weirs of 30°. Runoff enters rain garden No. 2 (without outflow) and infiltrates to recharge the groundwater directly. Runoff volume reduction is the major index to evaluate the running effect.
2.1.3. Rain Garden No. 3
Rain garden No. 3 was built in 2012. The flapper in the middle is used to divide rain garden No. 3 into the two sub-sections of C and D, as shown in Figure 2 and Figure 3. Rain garden No. 3C is waterproof, with a perforated tube mounted on the V-notch weirs of 30° at the bottom, whereas rain garden No. 3D is permeable without outflow. Inflows of rain garden No. 3C and D were measured with pressure transducers mounted on V-notch weirs of 30° installed at the inlet. It has the same plants as rain garden No. 2.
2.1.4. Test Process
Inflow and outflow were recorded during the period of rainfall, and water samples were collected immediately. The samples were stored in a refrigerator at −4°C, and analysis was completed within 5 days. NH4+-N and NO3−-N were measured by continuous flowing analysis (SKALAR, Breda, The Netherlands); TN and TP were measured by ultraviolet spectrophotometer (DR5000, Hach Company, Loveland, CO, USA); and the weighing method was used to measure TSS. SigmaPlot10.0 (developed by Systat software company, Point Richmond, CA, USA; the supplier is Beijing ND Times Technology Co., Ltd., Beijing, China) and SPSS 20.0 (developed by Stanford University, Stanford, CA, USA) were used for data analysis. The test process is shown in Table 2.
2.2. Methods
2.2.1. Evaluation Methodologyof Runoff Reduction
The difference of inflow and outflow reflects the interception potential of runoff volume reduction by the filter media for rain gardens No. 1 and 3. The running effect of filter media can be evaluated through the indicator of runoff volume and flood peak flow reduction rate. The inflow and outflow/overflow of the three rain gardens at a certain moment can be calculated as per Formula (1) [23], and the inflow and outflow/overflow volume are calculated as per Formula (2), shown as follows:
where Qi is the instantaneous flow of inflow and outflow/overflow, m3/s; Vin/out/over is the inflow and outflow/overflow volume, L; h is the depth of inflow and outflow/overflow before the V-notch weirs, m; θ is the angle of the V-notch weirs; µ is the flow coefficient, 0.6; g is the gravitation acceleration, 9.808 m/s2; and ∆ti is the duration time, in min [24,25].
The runoff reduction rate (Rv) is calculated as follows:
where Rv is the runoff volume reduction rate, in %; and Vin/out/over is the inflow and outflow/overflow volume, in m3.
2.2.2. Evaluation Methodologyof Pollutant Purification
Pollutant reduction can be evaluated through the indicator of the concentration removal rate (Rc) and pollutant load reduction rate (RL), as follows:
where Rc is the pollutant concentration removal rate, in %; RL is the pollutant load reduction rate, in %; Vin/out is the inflow and outflow volume, in m3; Cin/out is the inflow and outflow concentration in a single rainfall event, mg/L; and Tin/out is the inflow and outflow pollutant load, in mg.
All the methods and materials used for the article are shown in Figure 4.
3. Results and Analysis
3.1. Running Effect Evaluation
3.1.1. Runoff Reduction Evaluation
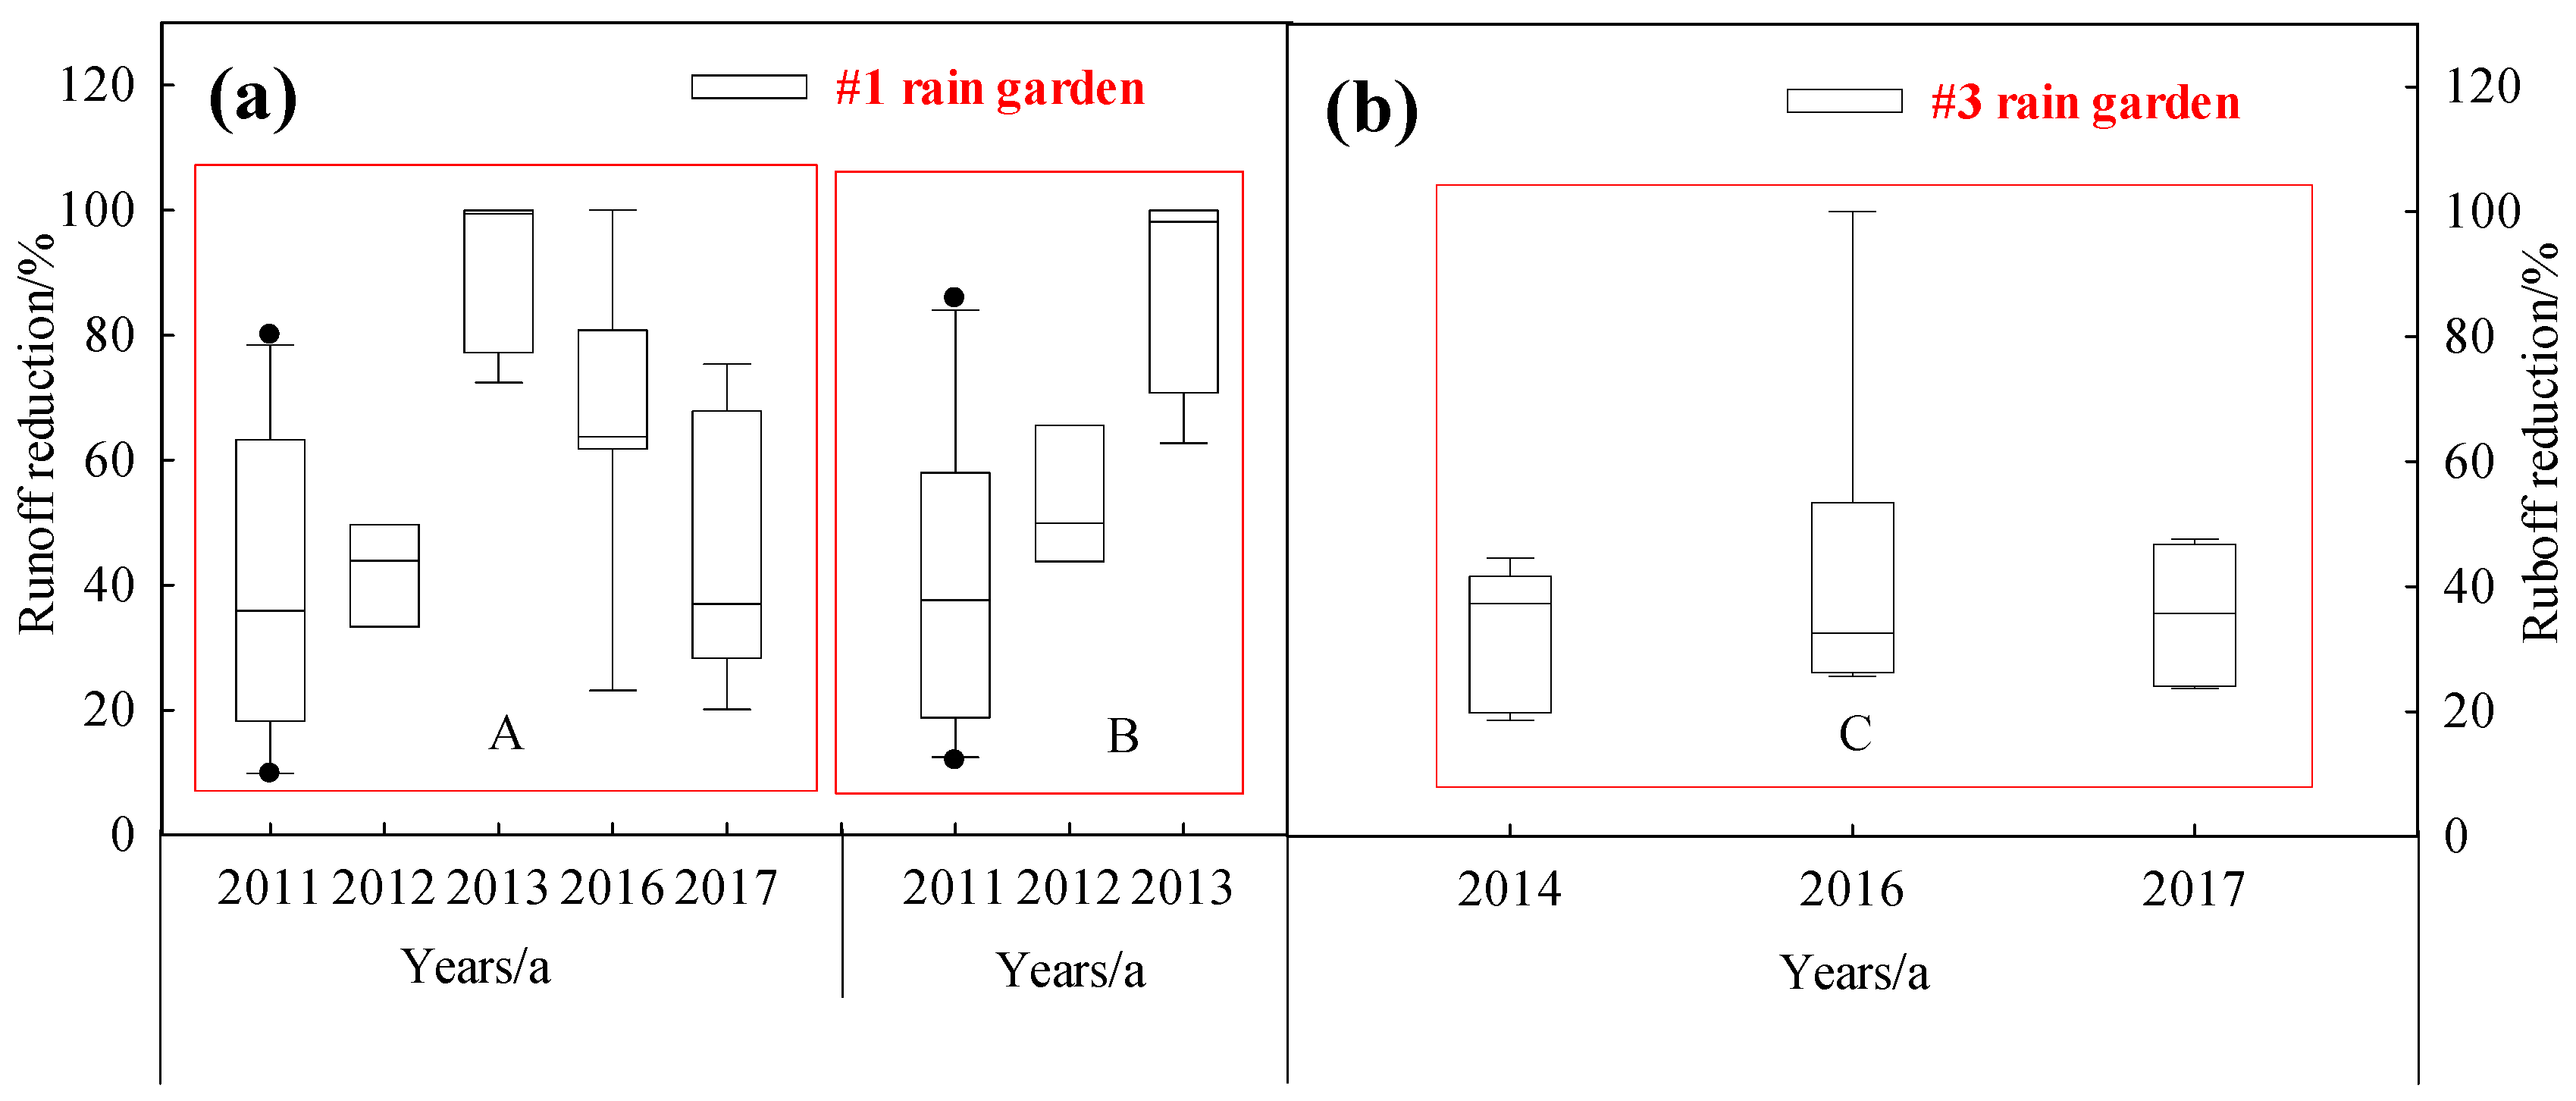
Thirty-six rainfall events were monitored to evaluate the effect runoff volume reduction of rain garden No. 1A during the period from March 2011 to October 2017. The runoff volume reduction of rain garden No. 1A generally ranged from 9.80% to 100.0%, with an average of 60.0% (Figure 5a), and the flood peak flow reduction rate varied from 20.3% to 100.0%, with an average of 62.5%. The average runoff reduction rates in 2011, 2012, 2013, 2016, and 2017 were 36.8%, 42.3%, 90.4%, 66.2%, and 43.7% respectively, which presented an initially increasing and then gradually decreasing trend with increasing monitoring time. Twenty-three rainfall events from rain garden No. 1B were monitored during the period from March 2011 to September 2013. The runoff volume reduction of rain garden No.1B generally ranged from 11.9% to 100.0%, with an average of 61.1% (Figure 5a), and the flood peak flow reduction rate varied from 11.2% to 100.0%, with an average of 70.8%. The reduction effect of runoff volume and the flood peak flow was even evident at the small or medium rainfall events for rain garden No. 1. Thus, rain gardens can be efficiently utilized in areas where heavy rain fails to dominate during the rainfall period. Therefore, the storage capacity of rain gardens can be fully utilized to reduce flooding in residential areas or for commercial application in an environmentally friendly manner. Small or medium rainfall events account for over 60% of the total rainfall events in Xi’an according to statistical results over the past 70 years [25]; hence, rain gardens can be efficiently used to reduce the total runoff volume.
Forty rainfall events were monitored to evaluate the runoff reduction effect of rain garden No. 2 during the period from July 2011 to October 2017, and only five rainfall events appeared to have an overflow with a short time. The rainfall was approximately 2.8–39.9 mm during the period of monitoring. No overflow was observed in 2011 and 2012, and the runoff reduction rate reached 100.0%. Meanwhile, all rainfall runoff entered the rain garden No. 2, directly infiltrating to recharge groundwater resources. Three overflow events occurred in 2013 but only once in 2014, and twice in 2016 and 2017. The annual runoff volume reduction rates in 2013, 2014, 2016, and 2017 were 96.8%, 98.9%, 95.3%, and 96.2%, respectively, and the average runoff reduction rate during the period of monitoring was 97.8%.
Sixteen rainfall events were monitored to evaluate the runoff reduction effect of rain garden No. 3C during the period from May 2014 to October 2017, as shown in Figure 5b. The runoff reduction generally ranged from 20.89% to 44.62%, except for one event in 26 September 2016, in which no outflow was observed (rainfall was 2.8 mm). The annual average runoff reductions were 32.04%, 42.52%, and 35.49% in 2014, 2016, and 2017, respectively. Moreover, no overflow occurred during the monitoring period (16 rainfall events) for rain garden No. 3D, and the runoff volume and flood peak flow reduction rate reached 100%.
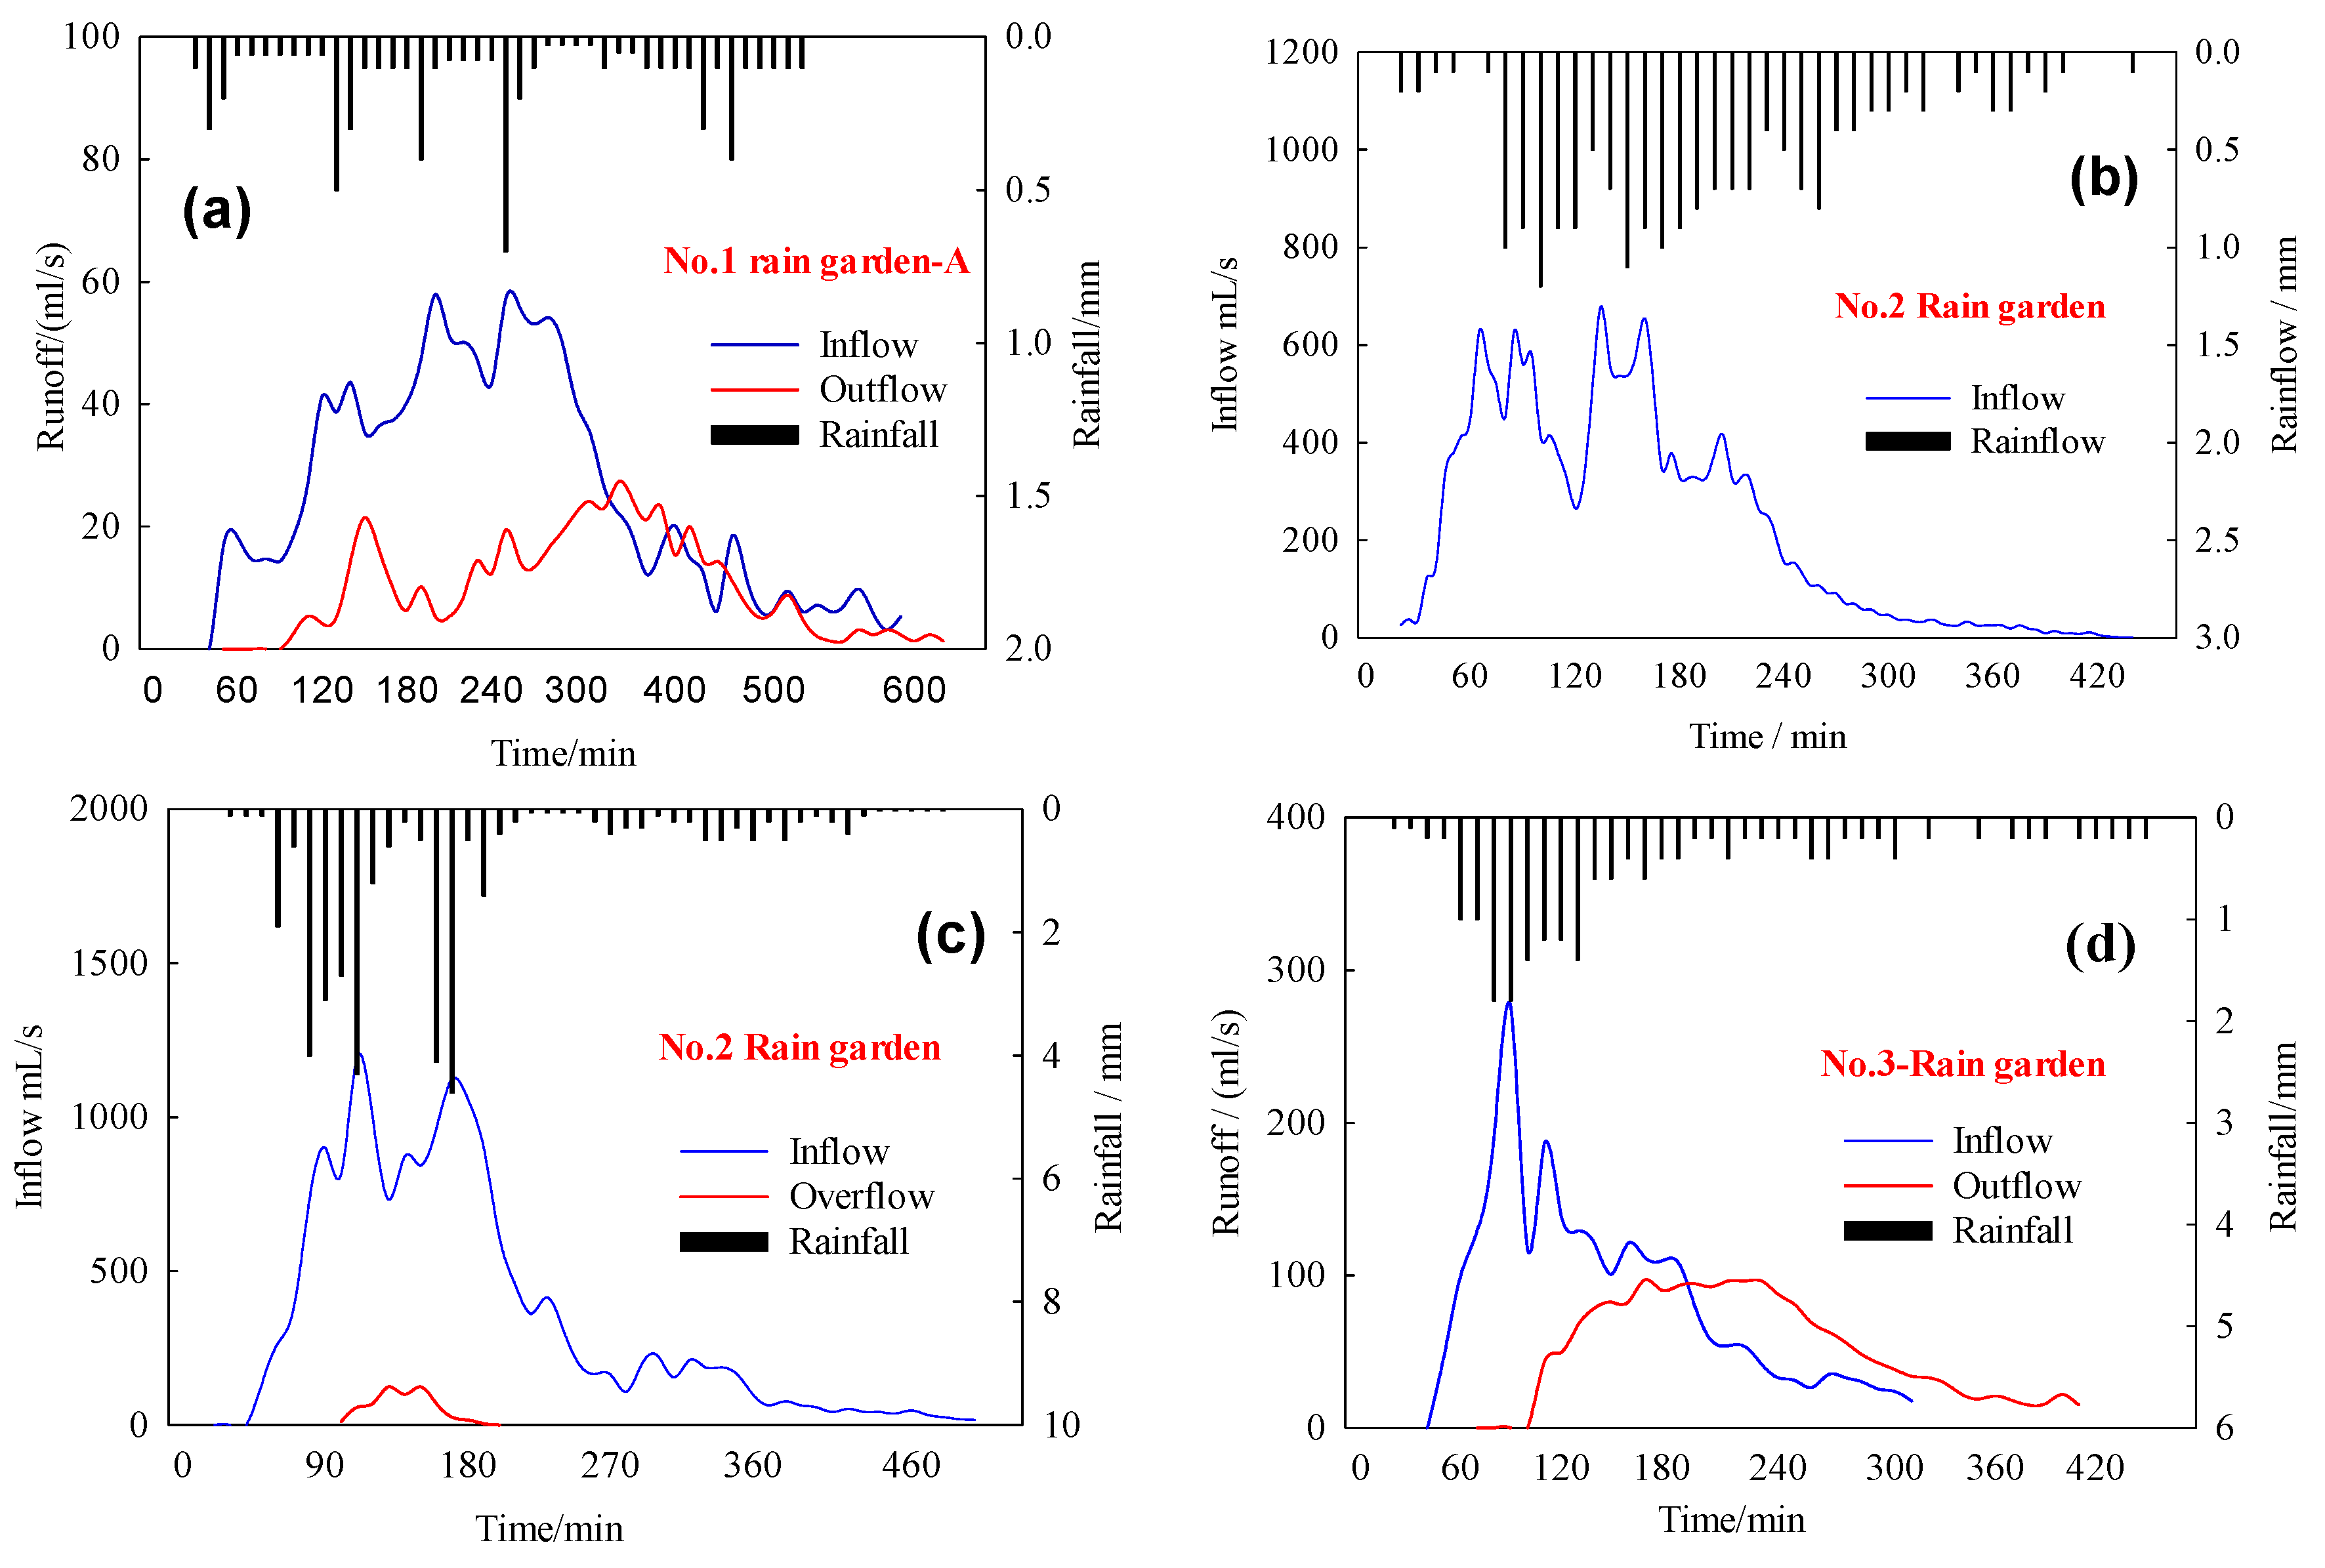
The typical rainfall–runoff process is shown in Figure 4. The outflow was invariably delayed in the inflow for rain gardens No. 1 and 3, and the flood peak flow of the outflow was significantly lower than the inflow, as shown in Figure 6a,d. The inflow and overflow process of rain garden No. 2 is shown in Figure 6b,c. The rainfall on 7 August 2017 was 36.1 mm, and the inflow was 16.73 m3; however, the overflow was 0.60 m3. A high runoff reduction rate was obtained at 96.3%.
3.1.2. Pollutant Purification Evaluation
Thirty-one rainfall events in rain garden No. 1 A and 23 rainfall events in rain garden No. 3C were monitored to evaluate the pollutant removal effect during the period from March 2011 to October 2017, as shown in Table 3. The pollutant concentration removal rates of NH4+-N, NO3−-N, TN, TP, and TSS in rain gardenNo.1 A were 40.84–94.22%, −583.50–58.65%, −119.30–85.06%, −467.40–48.89%, and −18.60–100.0%, and for rain garden No. 3C these values were 14.60–153.80%, −348.02–87.30, −18.80–75.76%, −46.40–101.10%, −121.35–85.23%, respectively. The concentration removal rate of NH4+-N by two rain gardens was relatively good, although it decreased with increasing monitoring time. The annual removal rates of NH4+-N by rain garden No. 1A were 79.81%, 72.67%, 74.18%±28.84%, and 57.43% ± 22.41% in 2011, 2013, 2016, and 2017, and for rain garden No. 3C these values were 50.02%, 45.78% ± 32.15%, and 41.95% ± 28.14% in 2013, 2016, and 2017, respectively. The results highlight the limitations of NH4+-N adsorption by filter media in rain gardens with increasing monitoring time. The concentration removal of NO3−-N and TP was unstable, and most values were negative. However, the removal effect of TSS is better than that of TN.
3.2. Fate Analysis of Rain Gardens
3.2.1. Fate Analysis of Runoff Reduction
Runoff volume reduction has a close relationship with the soil infiltration properties in rain gardens. Interconnected soil holes, called soil pores have great water conductivity and infiltration potential, can perform well in runoff dredging, and directly result in the most rainfall runoff recharge or recharge groundwater. However, long-term acceptance of rainfall runoff easily results in great inflow, and the presence of simultaneous water pressure and soil natural sedimentation closes the soil pore gradually, thereby leading to soil clogging and weakening of water conductivity. Soil clogging in rain gardens reduces runoff reduction, which will inevitably shorten the operating life span of rain gardens.
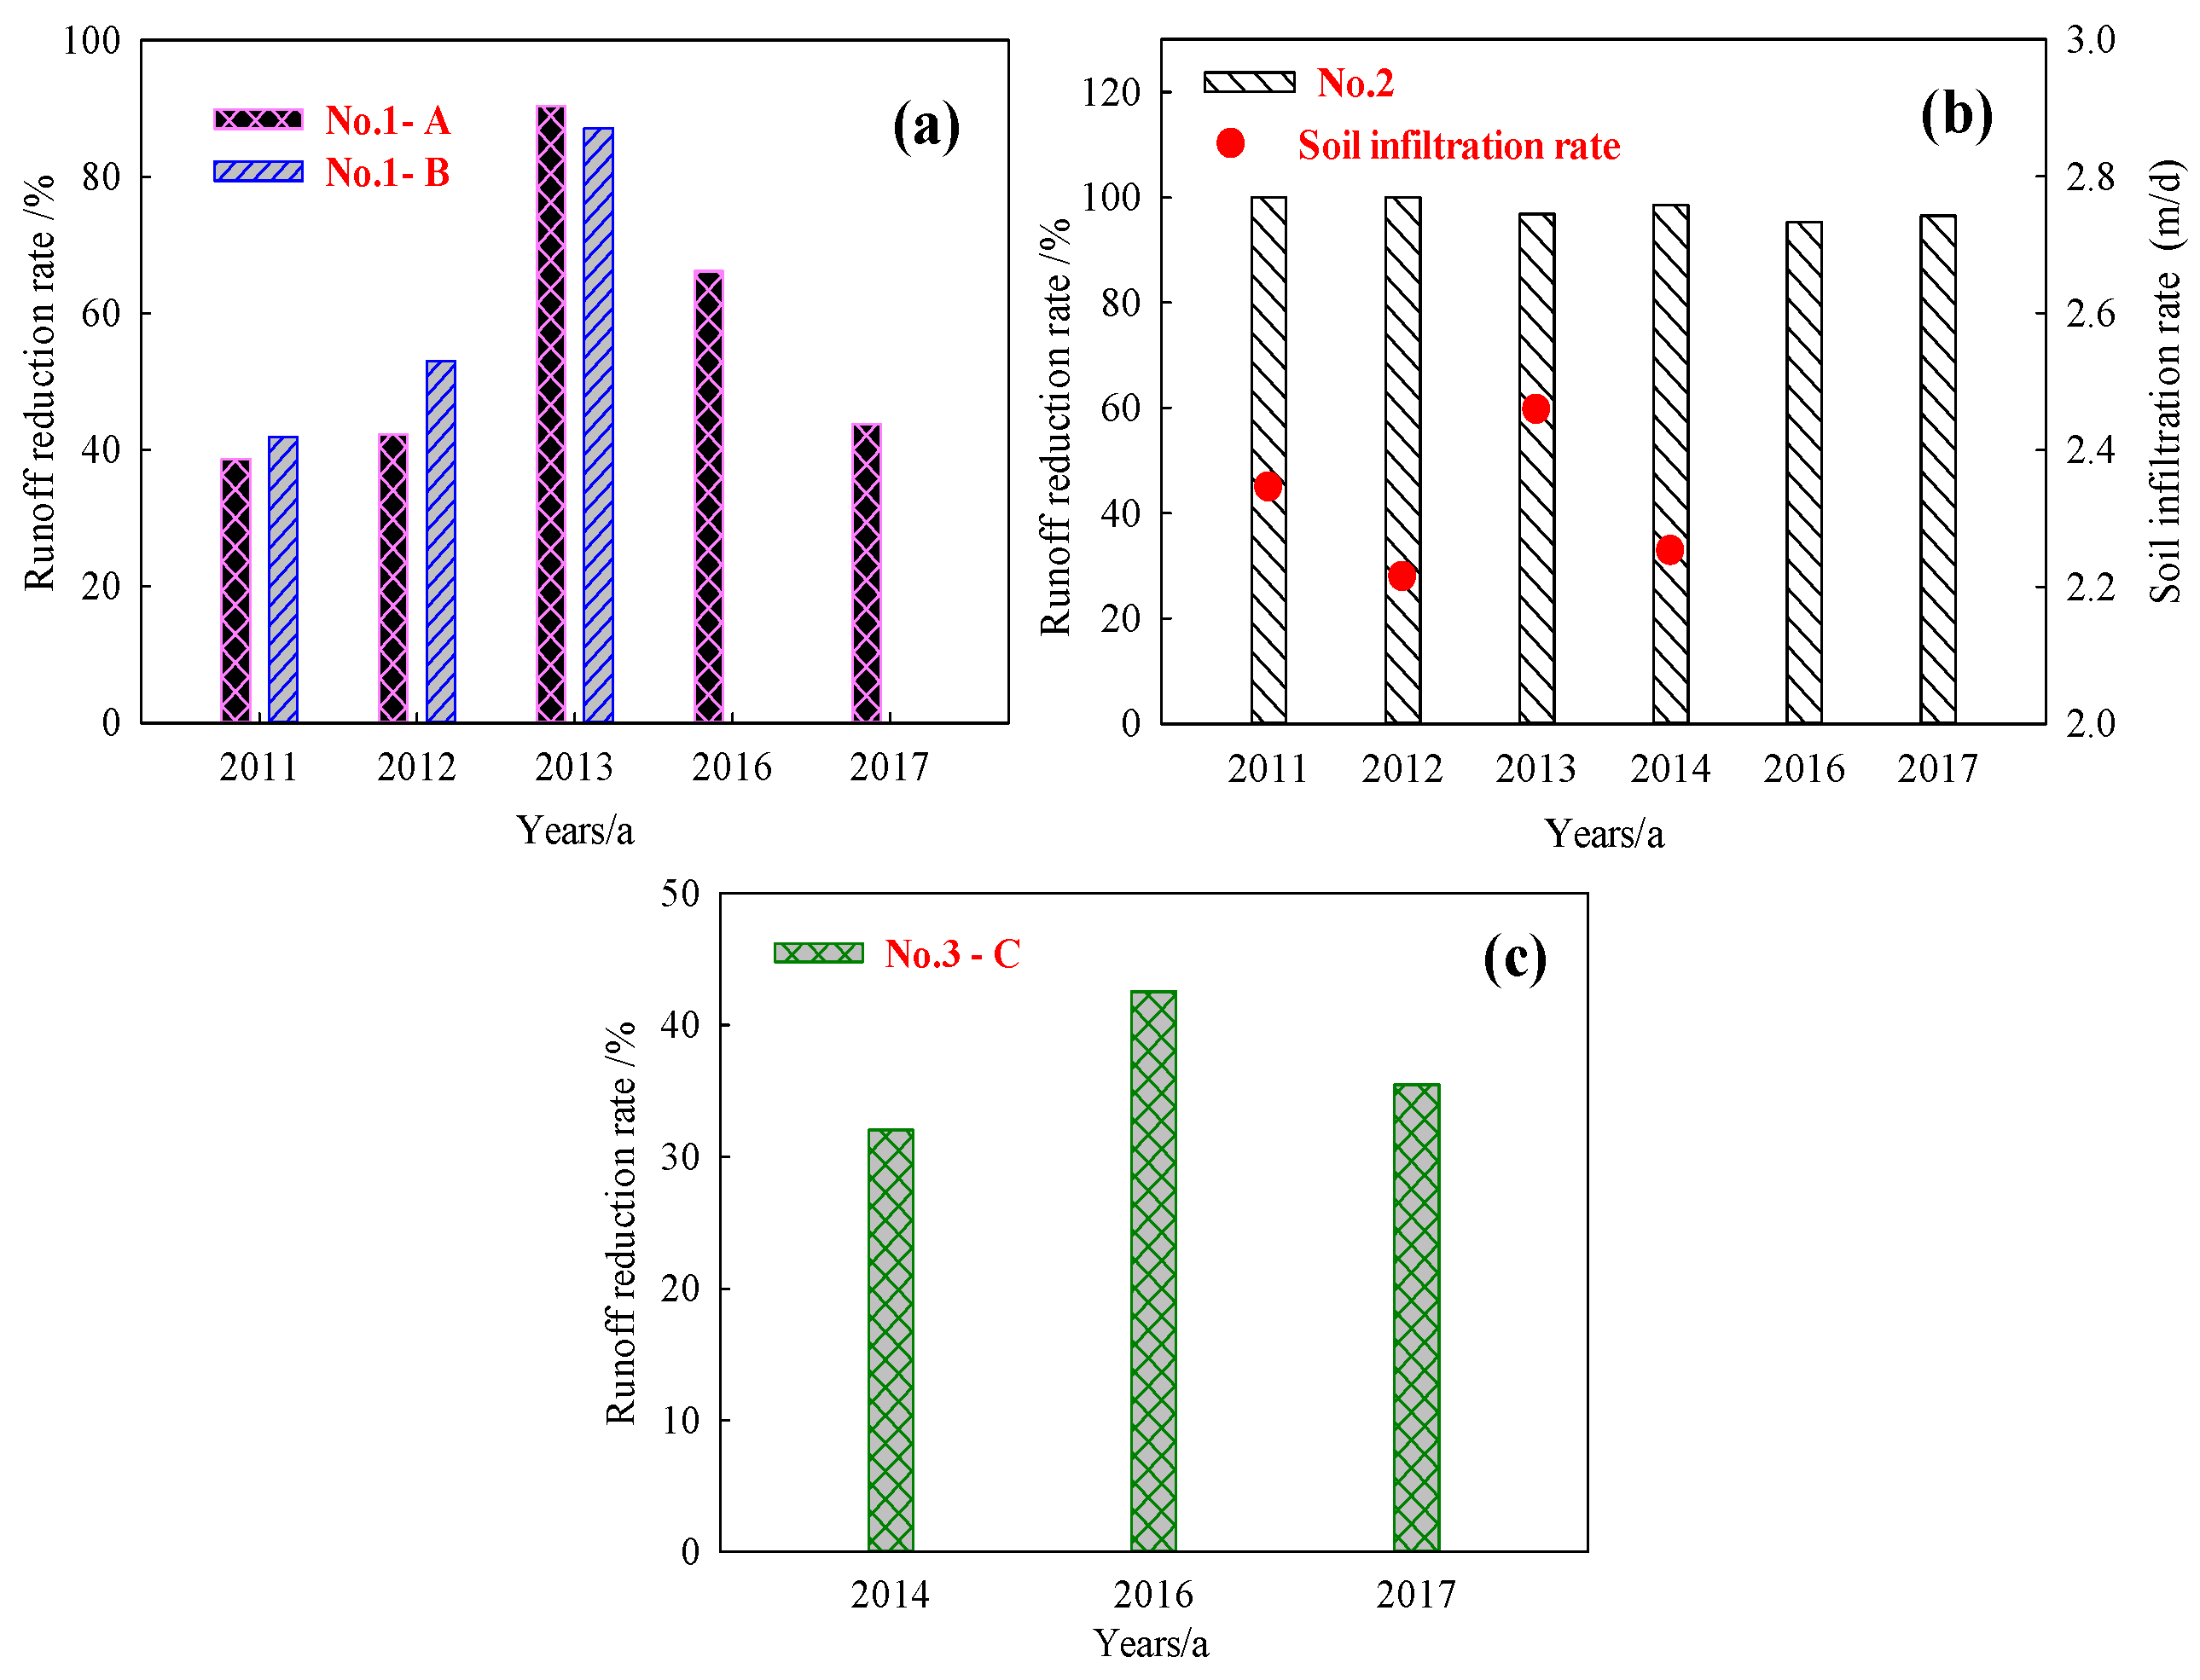
The annual average runoff volume reduction of rain garden No. 1A (Figure 7a) exhibits an initially increasing and then gradually decreasing trend with increasing monitoring time. The first 3 years after the construction of rain garden No. 1 A showed a runoff reduction growth period with a great annual average runoff reduction rate; however, this garden entered a stable runoff reduction period with a constant reduction rate from 2016 onwards. Rain garden No. 3C (Figure 7c) had a thin planting soil layer with a low runoff reduction rate; however, the runoff reduction rate had an initially increasing and then decreasing trend from 2014 to 2017. Unfortunately, the study of rain garden No. 3 was conducted late, with less monitoring data obtained; thus, continued monitoring should be performed in the future to study the changes in terms of the runoff reduction rate with longer monitoring times.
Rain garden No. 2 has a high runoff reduction rate without impermeable layer (Figure 7b). Previous research showed that permeable rain gardens with 20–30 cm aquifers could accumulate runoff at least 20 times the confluence area itself [28]. Rain garden No. 2 has a great annual runoff reduction rate, with little overflow compared with the annual total inflow, and most of the rainfall runoff directly infiltrated and subsequently recharged groundwater resources. However, the average annual runoff reduction decreased with the monitoring time, which was correlated with the soil pore and infiltration rate. The soil infiltration rate of rain garden No. 2 in 2011 was 2.346 m/d, and 2.215, 2.459, 2.253 m/d from 2012 to 2014, respectively, showing a decreasing trend except for in 2013. Soil clogging under water pressure or soil natural sedimentation results in the lower annual runoff reduction rate afterward in rain garden No. 2.
3.2.2. Fate Analysis of Pollutant Purification
Most particulate pollutants are intercepted by vegetation or filter media of the rain gardens when rainfall runoff inflows, whereas dissolved pollutants are removed effectively through filter medium adsorption; this process reduces the pollutant concentration of outflow. Adsorption will prioritize pollutant removal during the rainfall process, and the different rain garden filter media have different pollutant adsorption potentials [29,30]. Dissolved pollutants are generally difficult to remove in great quantities in short periods of time. Thus, these pollutants often temporarily remain in rain gardens together with runoff accumulation, and then they can be removed by plant absorption and microbial degradation, or they can be changed through physical, chemical, or biological reactions after the rainfall. Generally speaking, 70–80% of the pollutant load reduction occurs through filter medium adsorption in rain gardens, and only 20–30% is completed by plant absorption and microbial degradation [31,32]. In a certain effective confluence area, if the rain garden has long-term acceptance of rainfall runoff and when the plant absorption rate of runoff pollutants (including microbial degradation rate) is lower than the filter medium adsorption rate in the dry period after rainfall, then the pollutants absorbed in the filter media will increase each year, which will result in the gradual reduction of the purification potential of rain gardens. That is to say, the absorption capacity of filter media becomes close to saturation, and a large portion of pollutant adsorption capabilities of filter media in rain gardens is lost; thus, rain garden reaches the end of its lifespan.
Pollutant purification of three rain gardens can be researched through the load reduction of NH4+-N, TN, and TP from rain garden No. 1A, which ran for 7 years as shown in Figure 8. The load reduction of NH4+-N from 2011 to 2013 was over 95%, and more than 85% for TN and TP. This result indicates that rain garden No. 1A was in a purification growth period with great pollutant purification effect at that time. Unfortunately, the pollutant load reduction decreased with the operating time, and combined with runoff reduction this resulted in load reduction rates of NH4+–N, TN, and TP that ranged from 50% to 80% in 2016 and 2017.This finding indicates that the purification performance of rain garden No. 1A was in a stable period. The result is basically in line with the collusion of the lifetime of constructed wetland [33]. When the accumulation of phosphorus reaches saturated adsorption in constructed wetland, it no longer removes phosphorus. Inversely, phosphorus adsorbed on filter media will be released with the operation of the constructed wetland. The constructed wetland thus becomes a source of phosphorus release, indicating the end of its service life; thus, replacement of the filter media should be considered.
3.3. The “Three-Stage Purification (TSP) Concept” of Rain Gardens
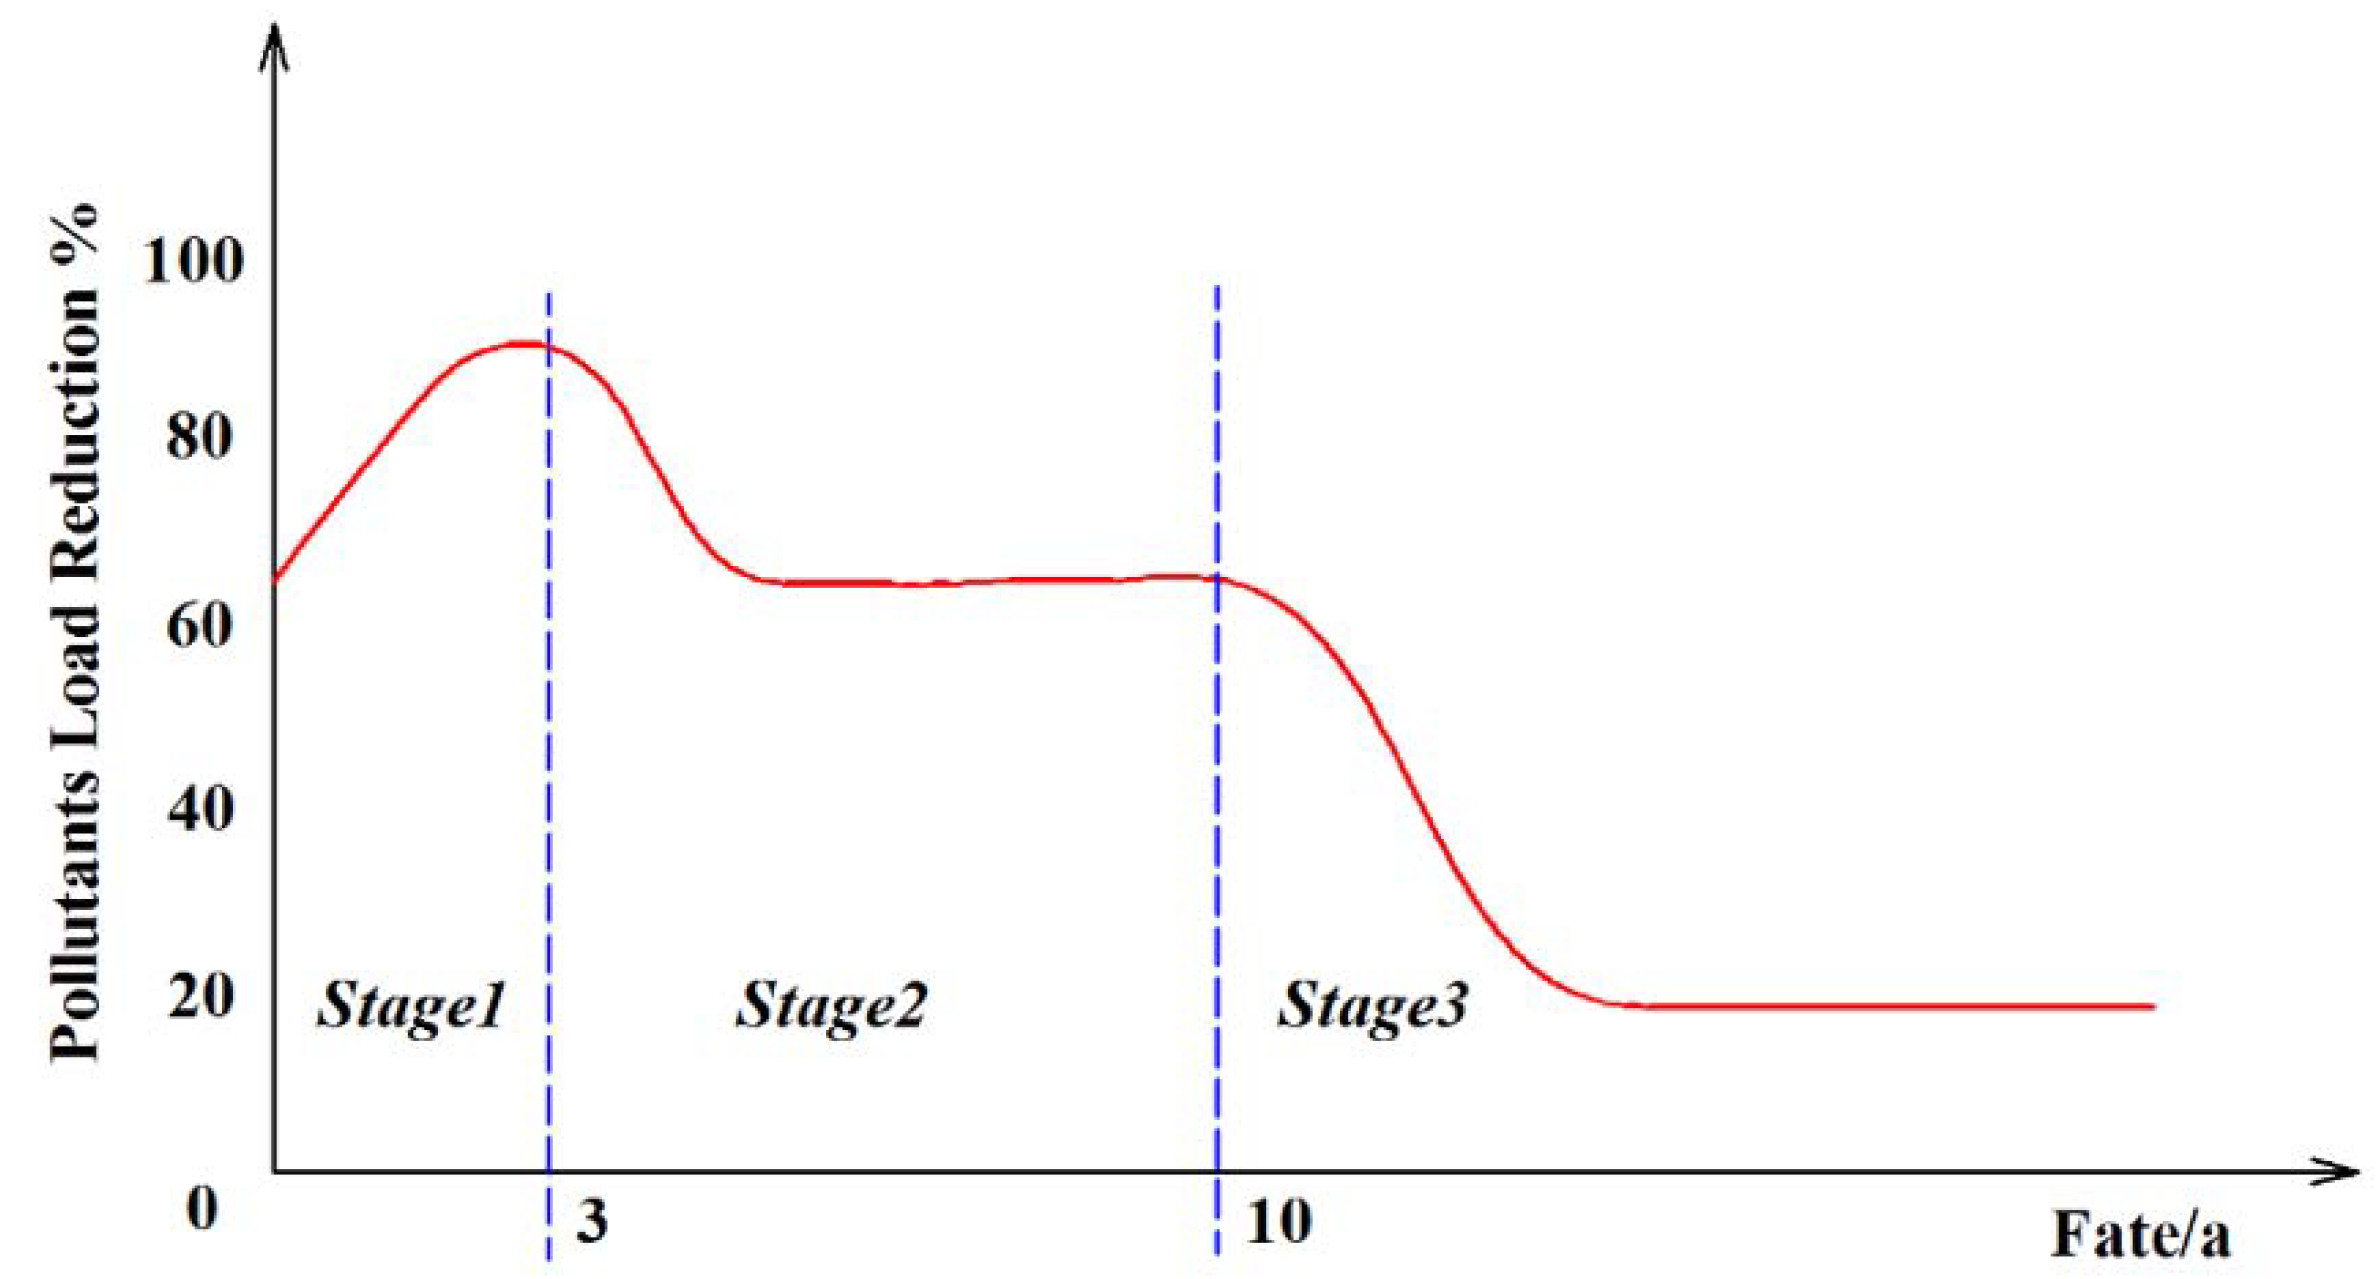
As important LID facilities, rain gardens play a critical role in runoff volume reduction and pollutant purification. Through comprehensive study and analysis the purification potential of three rain gardens, we propose the TSP concept for the pollutant load reduction process by rain gardens; that is, for periods of the purification growth, stability, and attenuation. We also draw a pollutant load reduction–rain garden running fate (“P–F”) curve, as shown in Figure 9. Rain gardens (with small plants and a single soil microbial community at this time) usually have strong pollutant adsorption capacity within 1–3 years after complication, and the plant absorption rate or microbial degradation rate of pollutants is lower than the filter medium adsorption rate. Rain gardens with great reduction of pollutant load are in a purification growth period, and are “young rain gardens” in this period. However, the capability of plant absorption or microbial degradation of pollutants will streng then with the growing plants and expanding soil microbial community in the next 5–8 years. Moreover, the filter medium adsorption and plant assimilation of pollutants, including microbial degradation, will reach a dynamic balance; thus, rain gardens with a constant reduction rate of pollutant load are in a stable period of purification, and are “middle-aged rain gardens” at this time. Moreover, filter medium absorption capacity of pollutants is close to saturation without purification capability 10–15 years later and mainly relies on plant absorption or microbial degradation to remove pollutants at this time. Thus, rain gardens with low pollutant load reduction rate are in the attenuation period, and can be defined as “elder rain gardens”. Rain gardens are considered to have reached the end of their lifetime at this point, and filter replacement or the construction of new rain gardens would be wise courses of action.
4. Discussion
Runoff volume reduction and pollutant purification are the important functions of rain gardens, but the density of filler media increases and the pollutant accumulates gradually with the running of the rain garden. When its water conductivity is weakened and the infiltration rate is small, the media is easily blocked. When filter medium absorption capacity of pollutants is close to saturation, the purification rate decreases slowly. Thus, the rain garden’s life span ends and replacement of the filter media should be considered.
However the lifespan of rain gardens is affected by many factors, such as filter medium and its particle size, plants, effective confluence area, type of runoff pollutant, inflow water quantity, and management level, etc. These factors directly influence the water infiltration and pollutant purification capacity of rainwater garden. Runoff volume reduction and pollutant purification were monitored for seven years under a certain filler medium and confluence area ratio to explore the rain garden running fate in this study, which can be used as a reference for the rain garden design. The result is basically in line with conclusion of the lifetime of constructed wetland, and a similar water purification mechanism was observed in constructed wetland. Thus, the conclusion of the filter media lifespan in constructed wetland can be used for analysing the running fate in rain gardens. The removal rate of phosphorus by zeolite was reduced after 1~2 years in constructed wetland in Australia [34].The initial removal rate of phosphorus was over 90% in constructed wetland in America, but it was reduced after 4~5 years [35]; Considering the impact of the filter media and plants on service life, the lifespan of constructed wetland planted Reed was 8117.92 days (approximately 22.42 years), but it was 8117.50 days when planted Iris wilsonii (about 22.42 years) [20]. The service life of constructed wetland filled the water treatment residue (WTR) was 4~17 years when it was used to treat domestic sewage [36]. The lifetime of various substrates for P sorption estimated by Langmuir P sorption was different in constructed wetland, with lifetime of red mudof up to 3010 months in a full-scale system, while that of granular ceramsite was only 6 months [37]. In addition, the reference service life of constructed wetland was about 15 years, as given by the International Water Association (IWA) [38]. Unfortunately, no consideration was given to the effect of the inflow pollutant type (the content of unfiltered substances) and inflow volume on the rain garden running fate [39]. Meanwhile, the impact of runoff pollutants on soil substrate and the accumulation process of pollutants in the rain garden were not studied. Subsequent studies could be performed in this area.
5. Conclusions
Through 7-year field monitoring of runoff reduction, pollutant purification, and fate analysis in three rain gardens, the following conclusions were derived:
- (1)
- The runoff reduction rate ranged from 9.8% to 100.0% and the peak flow reduction rate ranged from 38.3% to 100.0% in waterproof rain gardens when the confluence area was kept at the proportion of 6:1–20:1.The annual average runoff reduction rate showed an initially increasing and then decreasing trend with increasing monitoring time. However, the runoff reduction rate was relatively good for permeable rain gardens for the first several years under the condition that the proportion was kept from 15:1 to 20:1 and the aquifer layer varied from 20 cm to 50 cm. Nevertheless, soil clogging resulted in a decreasing runoff reduction rate afterward.
- (2)
- According to water quality data in 54 rainfall events, the annual average concentration removal rate of NH4+-N by rain garden was relatively good, but decreased with longer monitoring time. The concentration removal rate was unstable for NO3−-N and TP, and most values were negative. However, the annual average concentration removal rate was better for TSS than for TN. Combining the runoff reduction, the NH4+-N, TN, and TP load reductions by the rain garden were all greater than 50% but decreased with increasing monitoring time.
- (3)
- Through the study of a 7-year running effect on runoff reduction and pollutant purification, the running fate of rain gardens was analysed in terms of runoff reduction and pollutant purification. Finally, we proposed the TSP concept with respect to the growth, stability, and attenuation periods of purification, and drew the P–F curve chart.
Author Contributions
C.G. and J.L. designed the research scheme, calculated the results, and wrote the manuscript; H.L. improved the results analysis; B.Z. M.M., and F.L. collected part of the data in the manuscript.
Acknowledgments
This research was financially supported by the Natural Science Foundation of Shaanxi Province (2015JZ013); the Key Research and Development Project of Shaanxi Province (2017ZDXM-SF-073) and the National Natural Science Foundation of China (No. 51479162).
Conflicts of Interest
The authors declare no conflict of interest.
References
- Davis, A.P. Green engineering principles promote low-impact development. Environ. Sci. Technol. 2005, 39, 338–344. [Google Scholar] [CrossRef]
- Chaffin, B.C.; Shuster, W.D.; Garmestani, A.S.; Furio, B.; Albro, S.L.; Gardiner, M.; Spring, M.; Green, O.O. A tale of two rain gardens: Barriers and bridges to adaptive management of urban stormwater in Cleveland, Ohio. J. Environ. Manag. 2016, 183, 431–441. [Google Scholar] [CrossRef] [PubMed]
- Zhang, B.; Xie, G.; Zhang, C.; Zhang, J. The economic benefits of rainwater-runoff reduction by urban green spaces: A case study in Beijing, China. J. Environ. Manag. 2012, 100, 65–71. [Google Scholar] [CrossRef] [PubMed]
- Lindblom, E.; Ahlman, S.; Mikkelsen, P.S. Uncertainty-based calibration and prediction with a stormwater surface accumulation-wash off model based on coverage of sampled Zn, Cu, Pb and Cd field data. Water Res. 2011, 45, 3823–3835. [Google Scholar] [CrossRef] [PubMed]
- Gregoire, B.G.; Clausen, J.C. Effect of a modular extensive green roof on storm water runoff and water quality. Ecol. Eng. 2011, 37, 963–969. [Google Scholar] [CrossRef]
- Sang, G.Q.; Cao, S.L.; Wei, Z.B. Research and Application of the Combined of SWMM and Tank Model. Appl. Mech. Mater. 2012, 166–169, 593–599. [Google Scholar] [CrossRef]
- Rosa, D.J.; Clausen, J.C.; Dietz, M.E. Calibration and Verification of SWMM for Low Impact Development. J. Am. Water Resour. Assoc. 2015, 51, 746–757. [Google Scholar] [CrossRef]
- Mullane, J.M.; Flury, M.; Iqbal, H.; Freeze, P.M.; Hinman, C.; Cogger, C.G.; Shi, Z. Intermittent rainstorms cause pulses of nitrogen, phosphorus, and copper in leachate from compost in bioretention systems. Sci. Total Environ. 2015, 537, 294–303. [Google Scholar] [CrossRef] [PubMed] [Green Version]
- Zhi, W.; Yuan, L.; Ji, G.D.; He, C.G. Enhanced long-Term nitrogen removal and its quantitative molecular mechanism in Tidal flow constructed wetlands. Environ. Sci. Technol. 2015, 49, 4475–4483. [Google Scholar]
- Iqbal, H.; Garcia-Perez, M.; Flury, M. Effect of biochar on leaching of organic carbon, nitrogen, and phosphorus from compost in bioretention systems. Sci. Total Environ. 2015, 521–522, 37–45. [Google Scholar] [CrossRef] [PubMed]
- Li, L.Z.; He, C.G.; Ji, G.D.; Zhi, W.; Sheng, L.X. Nitrogen removal pathways in a tidal flow constructed wetland under flooded time constraints. Ecol. Eng. 2015, 81, 266–271. [Google Scholar] [CrossRef]
- Liu, J.Y.; Davis, A.P. Phosphorus speciation and treatment using enhanced phosphorus removal bioretention. Environ. Sci. Technol. 2014, 48, 607–614. [Google Scholar] [CrossRef] [PubMed]
- Walsh, T.C.; Pomeroy, C.A.; Burian, S.J. Hydrologic modeling analysis of a passive, residential rainwater harvesting program in an urbanized, semi-arid watershed. J. Hydrol. 2014, 508, 240–253. [Google Scholar] [CrossRef]
- Palmer, E.T.; Poor, C.J.; Hinman, C.; Stark, J.D. Nitrate and phosphate removal through enhanced bioretention media: Mesocosm study. Water Environ. Res. 2013, 85, 823–832. [Google Scholar] [CrossRef] [PubMed]
- Lewis, J.F.; Hatt, B.E.; Deletic, A.; Fletcher, T.D. The impact of vegetation on the hydraulic conductivity of storm water biofiltration systems. In Proceedings of the International Conference on Urban Drainage, Edinburgh, UK, 31 August–5 September 2008; pp. 1–10. [Google Scholar]
- Wang, B.; Yue, M.A.; Peng, X. Research on the evaluation system of woody landscape plants maintenance. Agric. Biotechnol. 2018, 2, 40–46. [Google Scholar]
- Autixier, L.; Mailhot, A.; Bolduc, S.; Madoux-Humery, A.S.; Galarneau, M.; Prévost, M.; Dorner, S. Evaluating rain gardens as a method to reduce the impact of sewer overflows in sources of drinking water. Sci. Total Environ. 2014, 499, 238–247. [Google Scholar] [CrossRef] [PubMed]
- Yang, H.; Dick, W.A.; Mccoy, E.L.; Phelan, P.L.; Grewal, P.S. Field evaluation of a new biphasic rain garden for stormwater flow management and pollutant removal. Ecol. Eng. 2013, 54, 22–31. [Google Scholar] [CrossRef]
- Li, L.Q.; Davis, A.P. Urban Storm-water Runoff Nitrogen Composition and Fate in Bioretention Systems. Environ. Sci. Technol. 2014, 48, 3403–3410. [Google Scholar] [CrossRef] [PubMed]
- Xu, D.F.; Li, Y.X.; Fang, H.; Zhao, X.L. Effects of Physiological Character of Four Wetland Plants on Design of the Constructed Wetland Bed. J. Agro-Environ. Sci. 2009, 28, 587–591. [Google Scholar]
- Jia, Z.; Tang, S.; Luo, W.; Li, S.; Zhou, M. Small scale green infrastructure design to meet different urban hydrological criteria. J. Environ. Manag. 2016, 171, 92–100. [Google Scholar] [CrossRef] [PubMed]
- Tang, S.C. The Effect of Small Scale Green Infrastructure on Stormwater Runoff Control in the Sponge City Construction; Xi’an University of Technology: Xi’an, China, 2016. [Google Scholar]
- Zhang, Z.C.; Xiao, H.W.; Mao, Z.M. Theory and Method of Open Channel Flow Measurement; Shaanxi People’s Publishing: Xi’an, China, 2004; pp. 41–43. [Google Scholar]
- Zeleňáková, M.; Diaconu, D.C.; Haarstad, K. Urban Water Retention Measures. Proc. Eng. 2017, 190, 419–426. [Google Scholar] [CrossRef]
- Zelenakova, M.; Alkhalaf, I.; Harbulakova, V.O. Applying of Dimensional Analysis in Rainwater Management Systems Design; CRC Press: Boca Raton, FL, USA, 2016; pp. 443–448. [Google Scholar]
- Hu, S.Q. Research on the Rain Garden Affecting on Hydrology and Water Quality of City Roofing Rainwater Runoff; Xi’an University of Technology: Xi’an, China, 2014. [Google Scholar]
- Zhao, M.M. Effects of Rain Gardens Concentrated Infiltration on Groundwater; Xi’an University of Technology: Xi’an, China, 2015. [Google Scholar]
- Liu, W.; Chen, W.P.; Peng, C. Influences of setting sizes and combination of green infrastructures on community’s stormwater runoff reduction. Ecol. Model. 2014, 318, 236–244. [Google Scholar] [CrossRef]
- Chandrasena, G.I.; Pham, T.; Payne, E.G.; Deletic, A.; McCarthy, D.T. E. coli removal in laboratory scale storm-water biofilters: Influence of vegetation and submerged zones. J. Hydrol. 2014, 519, 814–822. [Google Scholar] [CrossRef]
- Zhu, Z.Y.; Zhang, M.C.; Liu, F.Q.; Shuang, C.D.; Zhu, C.Q.; Zhang, Y.H.; Li, A.M. Effect of polymeric matrix on the adsorption of reactive dye by anion-exchange resins. J. Taiwan Inst. Chem. Eng. 2016, 62, 98–103. [Google Scholar] [CrossRef]
- Li, J.; Liang, Z.; Gao, Z.; Li, Y. Experiment and simulation of the purification effects of multi-level series constructed wetlands on urban surface runoff. Ecol. Eng. 2016, 91, 74–84. [Google Scholar] [CrossRef]
- Li, J.K.; Davis, A.P. A unified look at phosphorus treatment using bioretention. Water Res. 2016, 90, 141–155. [Google Scholar] [CrossRef] [PubMed]
- LeFevre, G.H.; Hozalski, R.M.; Novak, P.J. The role of biodegradation in limiting the accumulation of petroleum hydrocarbons in raingarden soils. Water Res. 2012, 46, 6753–6762. [Google Scholar] [CrossRef] [PubMed]
- Mann, R.A. Phosphorus adsorption and desorption characteristics of constructed wetland gravels and steelworks by products. Aust. J. Soil Res. 1997, 35, 375–384. [Google Scholar] [CrossRef]
- Kadlec, R.H.; Knight, R.L. Treatment Wetlands; Lewis Publishers: Chelsea, MI, USA, 1996. [Google Scholar]
- Zhao, X.H.; Zhao, Y.Q.; Yang, Y.Z.; Akintunde, B.; Hu, Y.S.; Lordwin, K. Several Key Issues to Consider in Using Alum Sludge as Substrate in Constructed Wetland. China Water Wastewater 2015, 31, 131–136. [Google Scholar]
- Liao, J.L.; Su, Y.; Xu, D.F.; Feng, Z.W.; Li, H.; Han, F.; Chen, H.Y. Substrate Screening and Application in Constructed Wetland Ecological Engineering System. Environ. Sci. Technol. 2008, 31, 125–128. [Google Scholar]
- Kadlec, R.H.; Knight, R.L.; Vymazal, J. IWA Scientific and Technical Report; IWA Publishing: London, UK, 2000. [Google Scholar]
- Ye, J.F.; Xu, Z.X.; Li, H.Z. Clogging Mechanism in Vertical-Flow Constructed Wetland: Clogging Cause and Accumulation Distribution Characteristics. Environ. Sci. 2008, 29, 1508–1512. [Google Scholar]
Figure 1.
Location of the experimental rain gardens.

Figure 2.
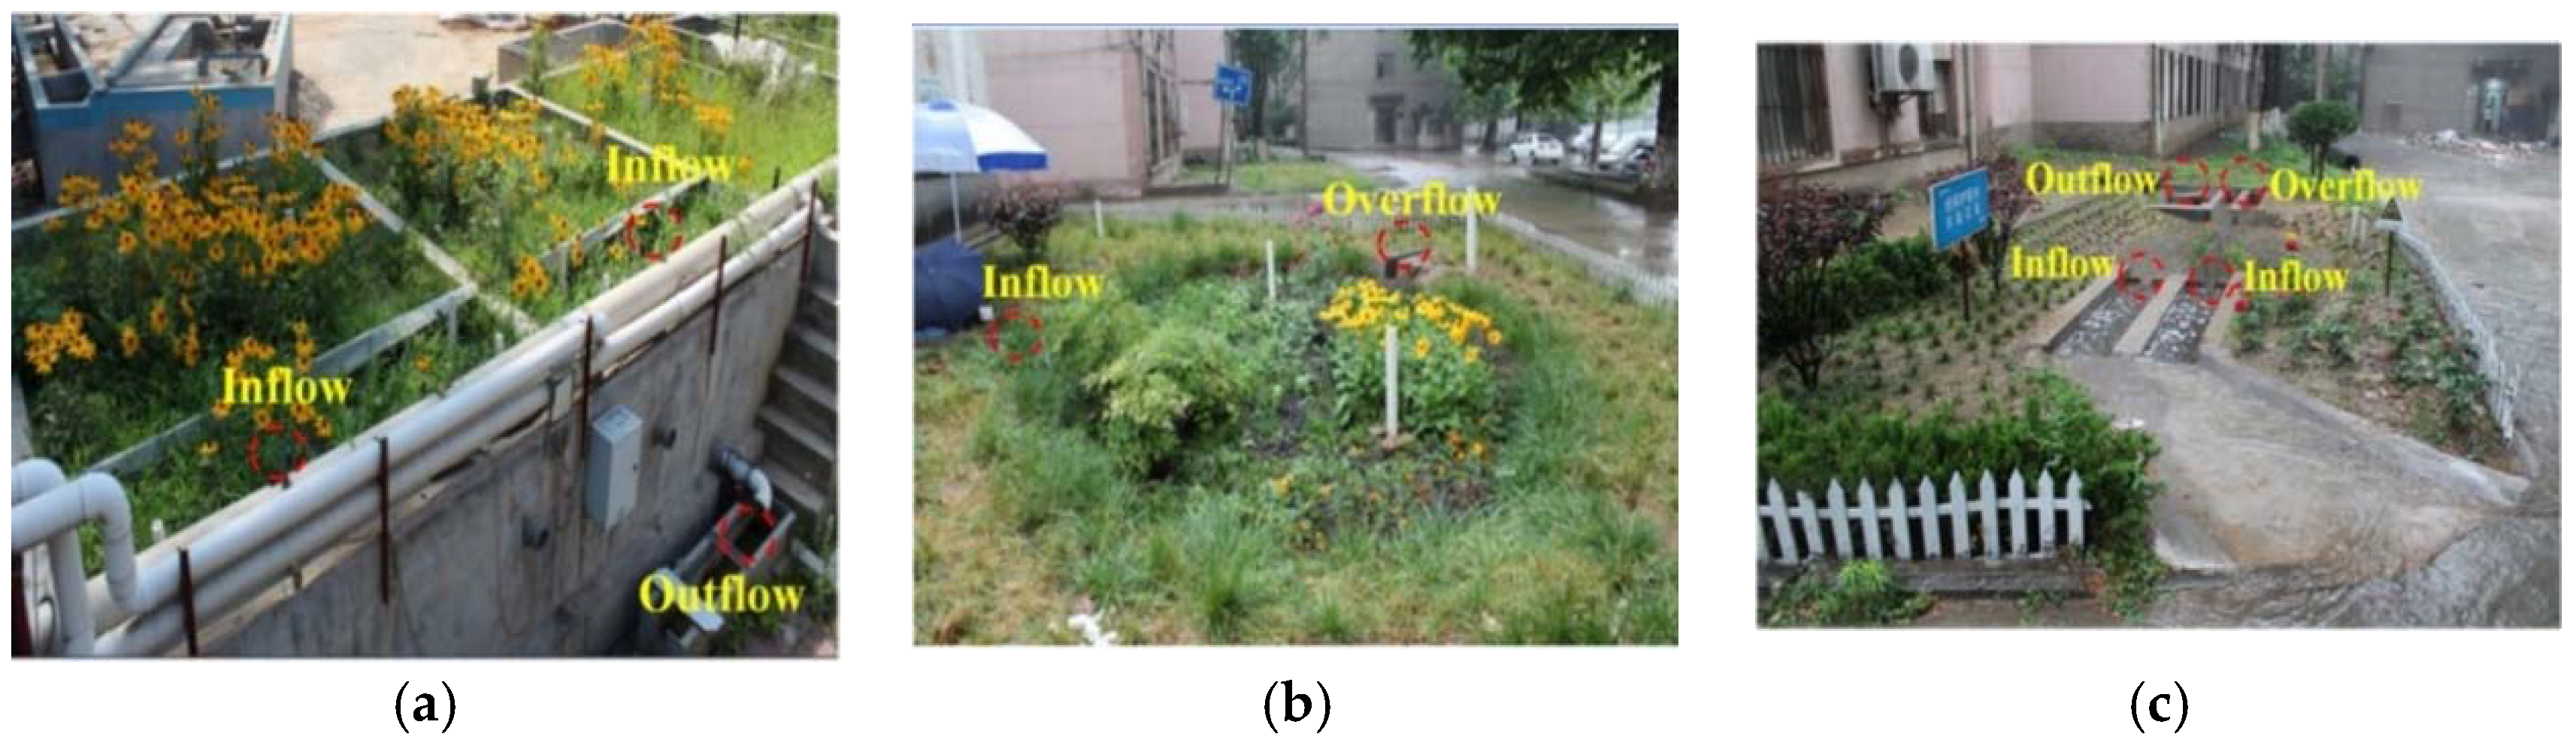
Scene drawingof three rain gardens at Xi’an University of Technology. Note: Inflow refers to the site of runoff from road or roof flows into rain gardens; Outflow refers to the site of runoff discharged from the rain gardens; Overflow refers to the site of runoff failed to permeate overflow into municipal pipe. (a) Rain garden No. 1; (b) Rain garden No. 2; (c) Rain garden No. 3.
Figure 2.
Scene drawingof three rain gardens at Xi’an University of Technology. Note: Inflow refers to the site of runoff from road or roof flows into rain gardens; Outflow refers to the site of runoff discharged from the rain gardens; Overflow refers to the site of runoff failed to permeate overflow into municipal pipe. (a) Rain garden No. 1; (b) Rain garden No. 2; (c) Rain garden No. 3.

Figure 3.
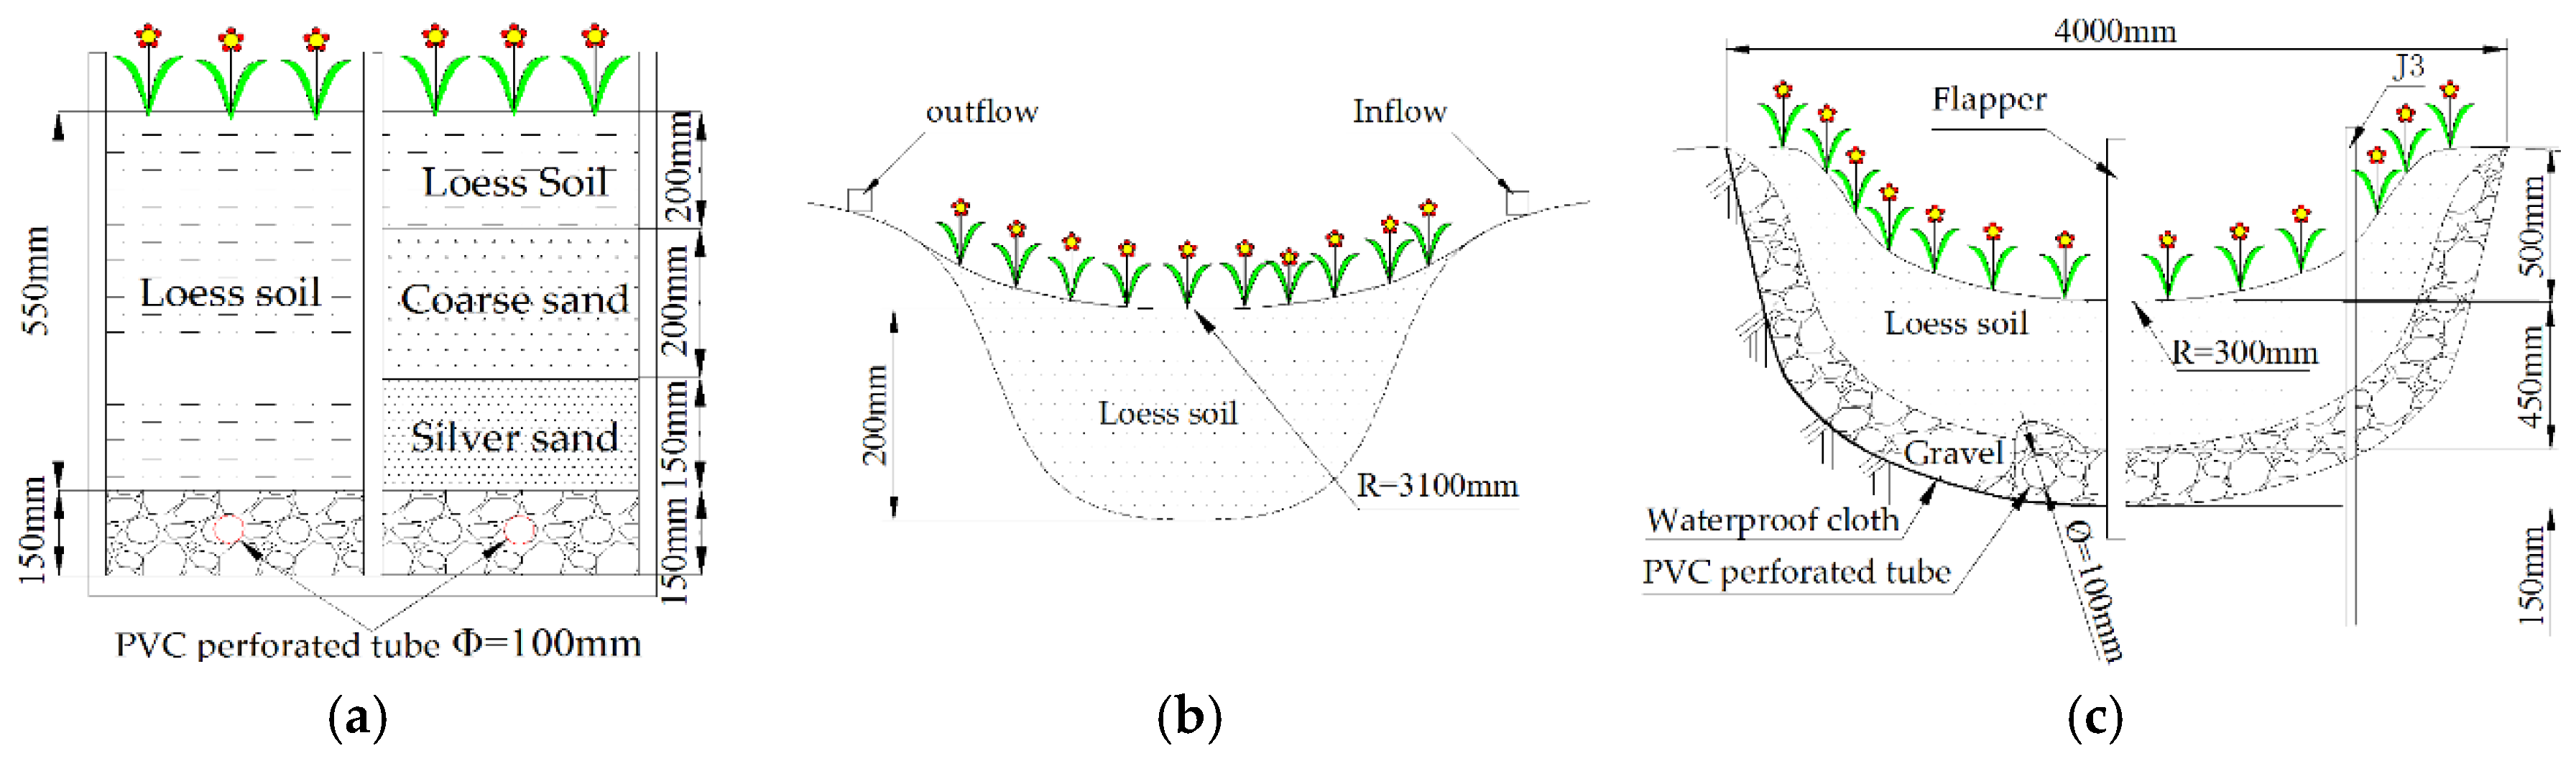
Rain garden structure. Note: Rain garden No. 1 is composed of two parts with different filter media and is used to monitor the inflow, outflow, and the pollutant concentration; rain garden No. 2 is a permeable rain garden without outflow and is used to monitor the inflow and overflow; rain garden No. 3 is divided into two sub-sections and is used to compare the runoff volume reduction and pollutant purification effect with different structures. (a) Rain garden No. 1; (b) Rain garden No. 2; (c) Rain garden No. 3.
Figure 3.
Rain garden structure. Note: Rain garden No. 1 is composed of two parts with different filter media and is used to monitor the inflow, outflow, and the pollutant concentration; rain garden No. 2 is a permeable rain garden without outflow and is used to monitor the inflow and overflow; rain garden No. 3 is divided into two sub-sections and is used to compare the runoff volume reduction and pollutant purification effect with different structures. (a) Rain garden No. 1; (b) Rain garden No. 2; (c) Rain garden No. 3.

Figure 4.
Flowchart. Note: Runoff volumes of inflow, outflow and overflow are monitored for the rainfall event. Runoff reduction rate (Rv) is calculated at the following time; water samples of inflow, outflow, and overflow are collected for the rainfall event to detect the concentration of runoff pollutants, and concentration removal rate (Rc) and pollutant load reduction rate (RL) are calculated in the following time.

Figure 5.
Runoff reduction effect of rain gardens No. 1 and 3. Note: (a) The annual average runoff reduction rate in rain garden No. 1A and B from 2011 to 2017; (b) The annual average runoff reduction rate in rain garden No. 3C from 2014 to 2017.
Figure 5.
Runoff reduction effect of rain gardens No. 1 and 3. Note: (a) The annual average runoff reduction rate in rain garden No. 1A and B from 2011 to 2017; (b) The annual average runoff reduction rate in rain garden No. 3C from 2014 to 2017.

Figure 6.
Typical rainfall–runoff processes. Note: Inflow refers to the volume of runoff from road or roof flows into rain gardens; Outflow refers to the volume of runoff discharges from the rain gardens; Overflow refers to the volume of runoff failed to permeate overflows into municipal pipe. (a) Runoff processes in rain garden No. 1A on 28 August 2017; (b) Runoff processes in rain garden No. 2 on 22 May 2017; (c) Overflow processes in rain garden No. 3 on 7 August 2017; (d) Runoff processes in rain garden No. 3 on 9 September 2017.

Figure 7.
Runoff reduction of three rain gardens. (a) The annual average runoff reduction rate in rain garden No. 1A and B from 2011 to 2017; (b) The annual average runoff reduction rate and soil infiltration rate in rain garden No. 2 from 2011 to 2017; (c) The annual average runoff reduction rate in rain garden No. 3C from 2014 to 2017.

Figure 8.
Pollutant load reduction with monitoring time. Note: Combined with runoff reduction, the annual average load reduction rate of NH4+–N, TN and TP in rain garden No. 1A from 2011 to 2017.
Figure 8.
Pollutant load reduction with monitoring time. Note: Combined with runoff reduction, the annual average load reduction rate of NH4+–N, TN and TP in rain garden No. 1A from 2011 to 2017.

Figure 9.
Thepollutant load reduction–rain garden running fate curve. Note: Stage 1 refers to the period of pollutant purification growth; Stage 2 refers to the period of pollutant purification stability; Stage3 refers to the period of pollutant purification attenuation.
Figure 9.
Thepollutant load reduction–rain garden running fate curve. Note: Stage 1 refers to the period of pollutant purification growth; Stage 2 refers to the period of pollutant purification stability; Stage3 refers to the period of pollutant purification attenuation.


Table 1.
The overall situation of rain garden.
| Rain Gardens | Size | Bottom Treatment | Filters and Thickness | Confluence Area Ratio | Underlying Surface | ||
|---|---|---|---|---|---|---|---|
| No. 1 | A | Length × Width × Height = 4 m × 3 m × 0.9 m | Waterproof | Aquifer layer | 20 m | 6:1 | Roof |
| Loess soil | 55 cm | ||||||
| Gravel | 15 cm | ||||||
| B | Length × Width × Height = 4 m × 3 m × 0.9 m | Waterproof | Aquifer layer | 20 cm | |||
| Loess soil | 20 cm | ||||||
| Coarse sand | 20 cm | ||||||
| Silver sand | 15 cm | ||||||
| Gravel | 15 cm | ||||||
| No. 2 | Long axis × Short axis × Depth = 7 m × 5.5 m × 0.35 m | Permeable | Aquifer layer | 20 cm | 20:1 | Roof | |
| Loess soil | 20 cm | ||||||
| No. 3 | C | Long axis × Short axis × Depth = 6 m × 2 m × 1.1 m | Waterproof | Aquifer layer | 50 cm | 15:1 | Roof and concrete pavement |
| Loess soil | 45 cm | ||||||
| Gravel | 15 cm | ||||||
| D | Long axis × Short axis × Depth = 6 m × 2 m × 1.1 m | Permeable | Aquifer layer | 50 cm | |||
| Loess soil | 60 cm | ||||||
Table 2.
Process of the test.
| Rain Gardens | Monitoring Period | Monitoring Times | Rainfall/mm |
|---|---|---|---|
| No. 1 | 20 March 2011~17 September 2011 | 11 | 2.8~37.6 |
| 29 June 2012~10 September2012 | 3 | 15.0~27.0 | |
| 17 May 2013~23 September2013 | 9 | 5.6~33.2 | |
| 22 May 2016~26 September2016 | 7 | 2.8~39.9 | |
| 22 May 2017~11 October 2017 | 6 | 2.4~41.2 | |
| No. 2 | 5 July 2011~11 September 2011 | 9 | 2.8~37.6 |
| 29 June 2012~10 September 2012 | 6 | 15.0~27.0 | |
| 8 May 2013~28 August 2013 | 8 | 1.8~33.2 | |
| 18 April 2014~30 August2014 | 5 | 9.1~44.6 | |
| 22 May 2016~26 September 2016 | 7 | 2.8~39.9 | |
| 22 May 2017~11 October 2017 | 5 | 2.4~41.2 | |
| No. 3 | 4 July 2013~23 September 2013 | 7 | 1.8~33.2 |
| 18 April 2014~30 August 2014 | 5 | 9.1~44.6 | |
| 22 May 2016~26 September 2016 | 6 | 2.8~39.9 | |
| 22 May 2017~11 October 2017 | 5 | 2.4~41.2 |
Table 3.
Effect of runoff pollutant removal rate.
| Rain Garden | Date | Times | Items | NH4+–N/% | NO3–N/% | TN/% | TP/% | TSS/% |
|---|---|---|---|---|---|---|---|---|
| No. 1A | 20 March 2011–31 August 2012 [26] | 13 | Range | 52.57–94.22 | −583.50–58.65 | −119.30–85.06 | −28.0–48.89 | 1.14–70.20 |
| Average | 79.81 | −40.57 | 40.48 | 21.20 | 26.24 | |||
| 17 May–8 August, 2013 [27] | 6 | Range | 63.61–84.15 | −61.80–32.50 | 36.50–69.30 | −467.40–24.0 | −18.6–100.0 | |
| Average | 72.67 | −13.8 | 50.90 | −133.70 | 62.2 | |||
| 22 May–26 September2016 | 6 | Range | 16.65–96.83 | −46.36–81.43 | 21.15–53.14 | −9.88–44.00 | 28.64–94.92 | |
| Average | 74.18 ± 28.84 | −7.17 ± 48.87 | 33.31 ± 11.66 | −18.16 ± 18.97 | 66.16 ± 25.41 | |||
| 22 May–11 October 2017 | 6 | Range | 40.84~88.30 | −361.93–54.48 | −29.00–59.22 | −36.36–47.58 | 0.40–59.40 | |
| Average | 57.43 ± 22.41 | −119.50 ± 175.39 | 38.21 ± 34.36 | −4.91 ± 33.65 | 27.87 ± 31.22 | |||
| No. 3C | 4 July–23 September2013 [26] | 7 | Range | 29.48~71.00 | −348.02–−21.94 | −18.80–28.50 | — | 11.30–77.50 |
| Average | 50.02 | −139.58 | −2.70 | 6.30 | 45.80 | |||
| 18 April–30 August 2014 [27] | 5 | Range | 14.60–153.80 | −56.20–87.30 | 2.40–75.76 | −46.40–101.10 | −121.35–85.32 | |
| Average | — | — | — | — | 60.61 | |||
| 22 May–26 September2016 | 6 | Range | 28.96–94.08 | −36.14–37.43 | 15.75–56.32 | −22.35–43.22 | 22.14–78.43 | |
| Average | 45.78 ± 32.15 | −2.89 ± 25.64 | 22.48 ± 22.49 | −11.19 ± 40.46 | 58.75 ± 38.48 | |||
| 22 May–11 October 2017 | 5 | Range | 20.56–74.92 | −262.18–3.61 | −9.35–49.98 | −17.77–22.00 | −62.39–66.04 | |
| Average | 41.95 ± 28.14 | −87.80 ± 105.28 | 23.31 ± 22.73 | 7.74 ± 15.18 | 11.13 ± 53.81 |
© 2018 by the authors. Licensee MDPI, Basel, Switzerland. This article is an open access article distributed under the terms and conditions of the Creative Commons Attribution (CC BY) license (http://creativecommons.org/licenses/by/4.0/).
Share and Cite
MDPI and ACS Style
Guo, C.; Li, J.; Li, H.; Zhang, B.; Ma, M.; Li, F. Seven-Year Running Effect Evaluation and Fate Analysis of Rain Gardens in Xi’an, Northwest China. Water 2018, 10, 944. https://doi.org/10.3390/w10070944
AMA Style
Guo C, Li J, Li H, Zhang B, Ma M, Li F. Seven-Year Running Effect Evaluation and Fate Analysis of Rain Gardens in Xi’an, Northwest China. Water. 2018; 10(7):944. https://doi.org/10.3390/w10070944
Chicago/Turabian StyleGuo, Chao, Jiake Li, Huaien Li, Bei Zhang, Menghua Ma, and Fan Li. 2018. "Seven-Year Running Effect Evaluation and Fate Analysis of Rain Gardens in Xi’an, Northwest China" Water 10, no. 7: 944. https://doi.org/10.3390/w10070944
Note that from the first issue of 2016, this journal uses article numbers instead of page numbers. See further details here.