Assessing the Contribution of Demographic Growth, Climate Change, and the Refugee Crisis on Seawater Intrusion in the Tripoli Aquifer


1
LaMA-LB (Laboratoire de Mathématique et Application), Université Libanaise, Tripoli P.O. Box 37, Lebanon
2
CESBIO (Centre d’Etudes Spatiales de la Biosphère), Université de Toulouse, CNRS, CNES, IRD, 31401 Toulouse, France
*
Author to whom correspondence should be addressed.
Water 2018, 10(8), 973; https://doi.org/10.3390/w10080973
Submission received: 5 June 2018
/
Revised: 13 July 2018
/
Accepted: 19 July 2018
/
Published: 25 July 2018
(This article belongs to the Special Issue Seawater Intrusion: Simulation and Control)
Abstract
:As a major hotspot of climate change, Lebanon suffers from a water resources crisis enhanced by the increase of anthropogenic activities. In this paper, the impacts of climate change and of the Syrian refugee crisis are combined with the impact of demographic growth to assess their aggregated impact on seawater intrusion in the Tripoli aquifer. A hydrogeological model is used to assess the seawater intrusion evolution for the next 25 years with respect to three phenomena: seawater rise, variation of incoming freshwater flux, and the change of the extraction rate of the pumping wells. Our study shows that the freshwater/seawater interface will move forward inland about 103 m in the next 25 years, leading to the salinization of the aquifer at the position of the pumping wells. Only about 1% of the advancement of the interface is associated with seawater rise; the remaining contributions are 79% from climate change and 20% from demographic growth. Adding the impact of migration reduces the contribution of climate change from 79% to 52%. The results suggest that the remediation solutions and recommendations should take into account the long-term impacts of climate change and the impact of population migration.
1. Introduction
Groundwater is the main freshwater resource component available over the globe. The pressure on this freshwater resource increases in coastal areas that are highly populated [1]. Coastal aquifers are subject to an aggravation in the seawater intrusion phenomenon due to the overexploitation of groundwater. Groundwater abstraction accounts for almost 42% of total water abstractions. The overexploitation of groundwater aquifers leads to dramatic impacts, such as the occurrence of seawater intrusion. These impacts have already been observed in Europe, particularly in the Mediterranean coastal areas [2]. Many theoretical and practical studies have assessed the impact of climate change on the seawater intrusion. According to Ferguson and Gleeson [3], the coastal aquifers are more sensitive to groundwater extraction than to predicted sea level rise. This is in alignment with the study by Chang et al. [4], in which the minor impact of sea level rise has been shown and interpreted. Two coastal aquifers, in Egypt and in India were considered by Sherif and Singh [5] as they investigated the impact of climate change on seawater intrusion. Two scenarios of sea level rise and another one of excessive pump mimicking climate change were considered. More recently, Kerrou et al. [6] investigated and predicted the situation of seawater intrusion in the Korba aquifer in Tunisia up to 2048, taking into consideration the various sources of uncertainty and two real climate scenarios. They recommended a re-allocation of the groundwater extraction to ensure the complete recovery of the central depression to cope with the predicted climate change and its impact on the water table. Guyennon et al. [7] provided a comparison of the effectiveness of increasing the surface water storage capacity and managed aquifer recharge in a region in Southern Italy under the RCP 4.5 and the RCP 8.5 IPCC scenarios. The study concluded that a managed aquifer recharge scenario is a suitable adaptation strategy to face the predicted climate change.
Many studies have addressed the issue of seawater intrusion in Lebanon for several decades (see [8] and the references therein). Locally, Moujabber et al. [9] studied the Choueifat–Rmeyle area in Lebanon, indicating that seawater intrusion is leading to intolerable levels of water and soil salinity, inadequate for the cultivation of many crops. The impact of the salinization of water resources on the quality of the distributed water in Beirut City (Ras Beirut) was studied in [10]. An investigation of the salinization of pumped water in the Tripoli-Lebanon aquifer through observations of pumped water salinity was conducted in [11].
In this work, we investigate the impact of global changes (climate change and anthropogenic activities) in the Tripoli aquifer up to 2033, considering several scenarios of climate change and demographic growth rates. The mathematical model used was described in [12]. It is based on the two-dimensional (2D) sharp interface approach [13,14]. A sensitivity study has been done considering three parameters of the model affected by climate change: the sea level rise, the pumping rate, and the decrease of recharge. The impact of each parameter is assessed separately, and the combined impact of all parameters is shown. The forecasted values of these parameters are based on United Nations reports [15] and local reports [16].
In the following sections, the datasets and methods are described. The study area is presented, followed by the mathematical model and the means to apply the sea level rise, inflow flux change, and water extraction variation. Then, the results are presented. A sensitivity analysis explaining the impact of boundary conditions related to the phenomena of interest is given. The impact of sea level rise, precipitation change, demographic change, and the refugee crisis are converted into impact on seawater intrusion using the sensitivity analysis results. Finally, conclusions and recommendations are presented.
2. Materials and Methods
2.1. The Tripoli Aquifer Characterization
The Tripoli aquifer is situated in northern Lebanon and covers about 400 km2. It is delimited by the Abou Ali and Abou Halqa Rivers’ watershed. The aquifer is bounded by the Mediterranean Sea and the Mountain of Bcharré from the west and the east, respectively, and by the Mountains of Qalhat and Torbol from the south and the north, respectively (Figure 1).
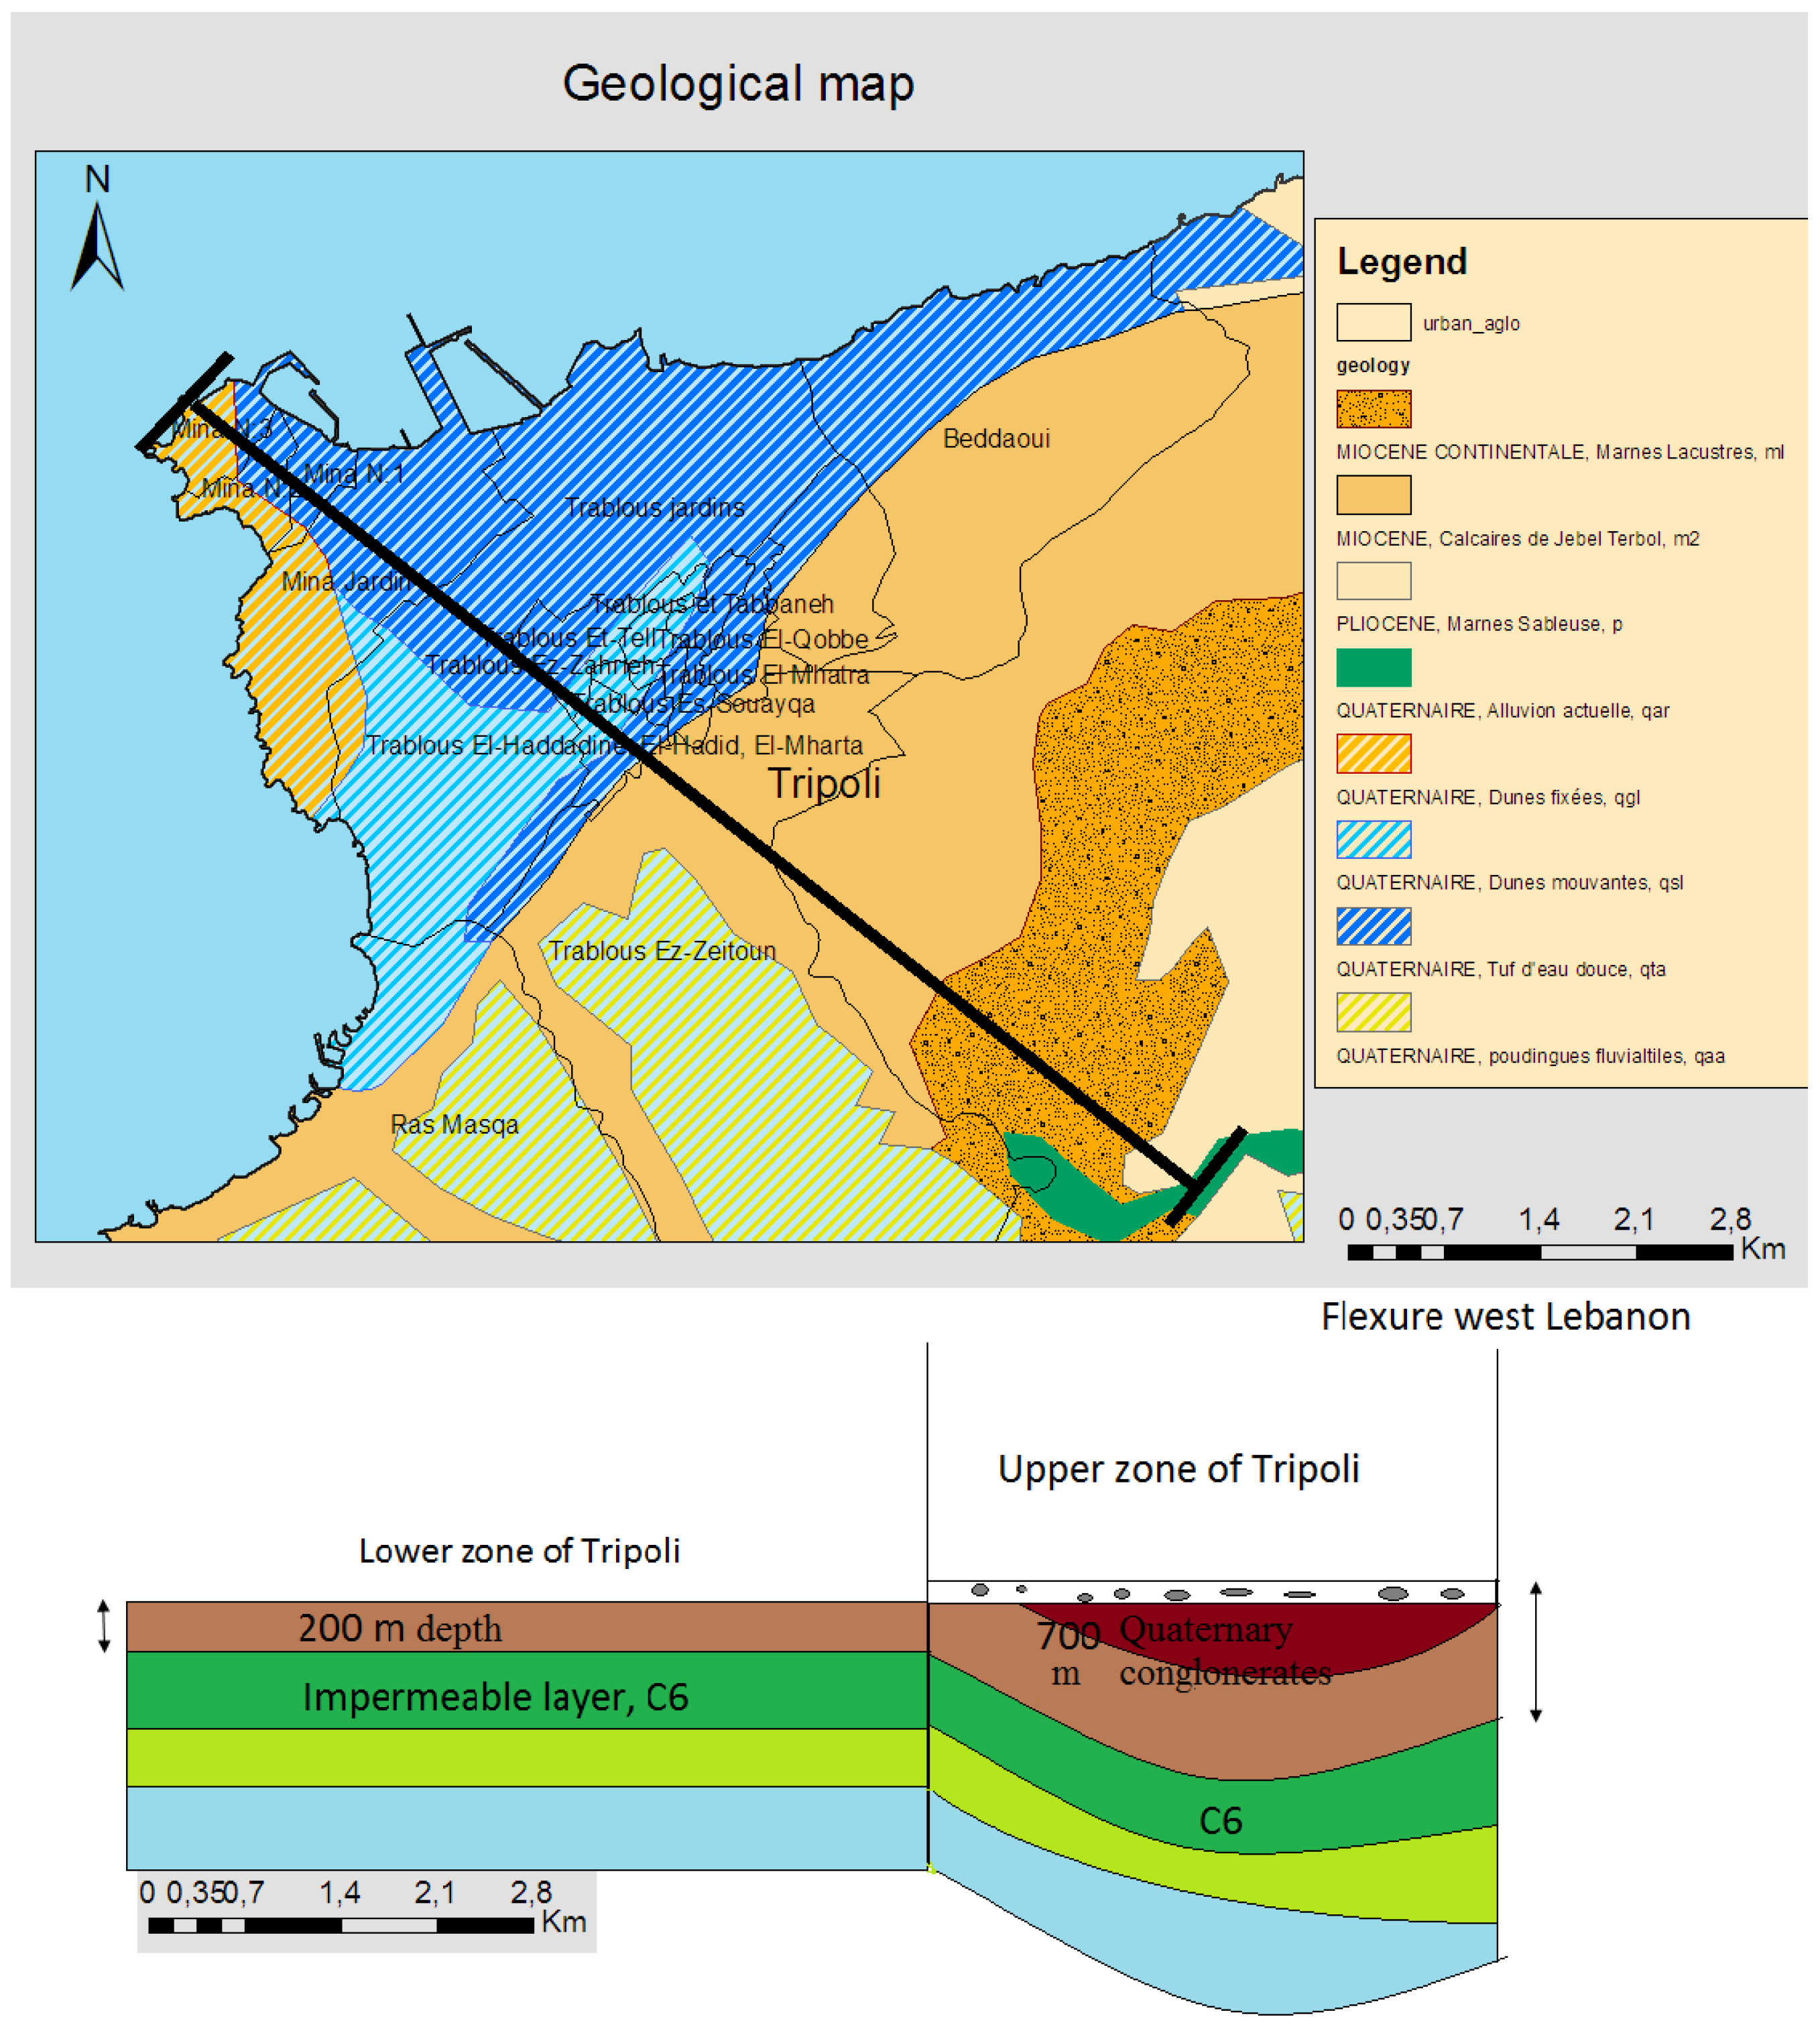
The lower zone of Tripoli city is only considered in this study with an area of 18 km2. This zone lies on a horizontal substratum formed by marl and marl limestone, as shown in Figure 2.
The aquifer is a multilayered marly sand geological formation [17]. These layers were mainly formed in the Neogene and Quaternary periods [18]. The thickness of the layers above the impermeable layer is about 200 m [17]. The main source of freshwater in the study area is the groundwater. Based on the work of Halwani et al. [11], there are more than 500 private wells and five major public wells in the region. The number of inhabitants in the considered zone of Tripoli was about 82,000 in 2008 [16], with an average consumption of 250 liters per capita per day [11]. The main recharge of groundwater originates from rainfall and snow melt from the Bcharré region. Climate projections predict a decrease of 20% of these resources by 2050 [15]. The infiltration of rainfall in the study area is negligible in this highly urban area. The measurements of salinity in the wells done by Halwani et al. [11] showed that a considerable number of wells are salinized because of over–pumping during the summer season.
A balanced water budget shows a deficit of about 5 M m3 per year. The annual recharge is about 71 M m3 per year, while the discharge is about 75.9 M m3 per year [11]. 60% of the freshwater need is covered by groundwater sources. The electrical conductivity measured in several wells shows the scale of the salinization in the studied zone [11,12].
2.2. Mathematical and Numerical Model
Two mathematical approaches are generally used to model the seawater intrusion. The first one assumes that the freshwater and the seawater are immiscible and that there is a sharp interface between the two liquids [13]. The second one is based on the principle of hydrodynamic dispersion in porous media, where a transition zone exists between fresh and sea water [19]. Here, we use a mathematical model based on the 2D sharp interface approach [13,14] in homogeneous medium. In the work of Kalaoun et al. [12], the mathematical and numerical model of the seawater intrusion in the Tripoli aquifer was described supposing the steady state and an unconfined aquifer. The mathematical model was based on the sharp interface approach. In this approach [13,14], the model is obtained using Darcy’s law combined with the mass conservation law in freshwater and seawater zones. A system of Equations (1) and (2) derives from this combination. Equation (1) governs the flow in the freshwater zone, and Equation (2) governs the movement of water in the seawater zone as follows:
where φf and φs represent the specific yield for the freshwater and saltwater zones, h is the hydraulic head, g the depth of the freshwater/seawater interface, b is the substratum level, t represents the time, S and Ss represent respectively the freshwater and seawater source term, ε0 is a ratio of mass densities of two fluids, and K is the hydraulic conductivity of the porous media (see for instance [20,21,22]). In [12], the assumptions of the steady state and hydro-static state of the sea, and the constant level of the substratum, have been used to simplify Equations (1) and (2) to Equation (3) with one unknown variable as follows:
where S is the freshwater extraction rate. It can be computed by multiplying the extraction coefficient λ by the area of pumping zone and the following:
where h0 represents the sea level supposed constant.
Equation (3) has been linearized, and the model has been validated against an analytical solution and measurements in tens of wells in the domain [12]. The hydraulic conductivity is estimated at 1.388 × 10⁻⁵ m∙s−1 based on previous geological and hydrogeological studies [17].
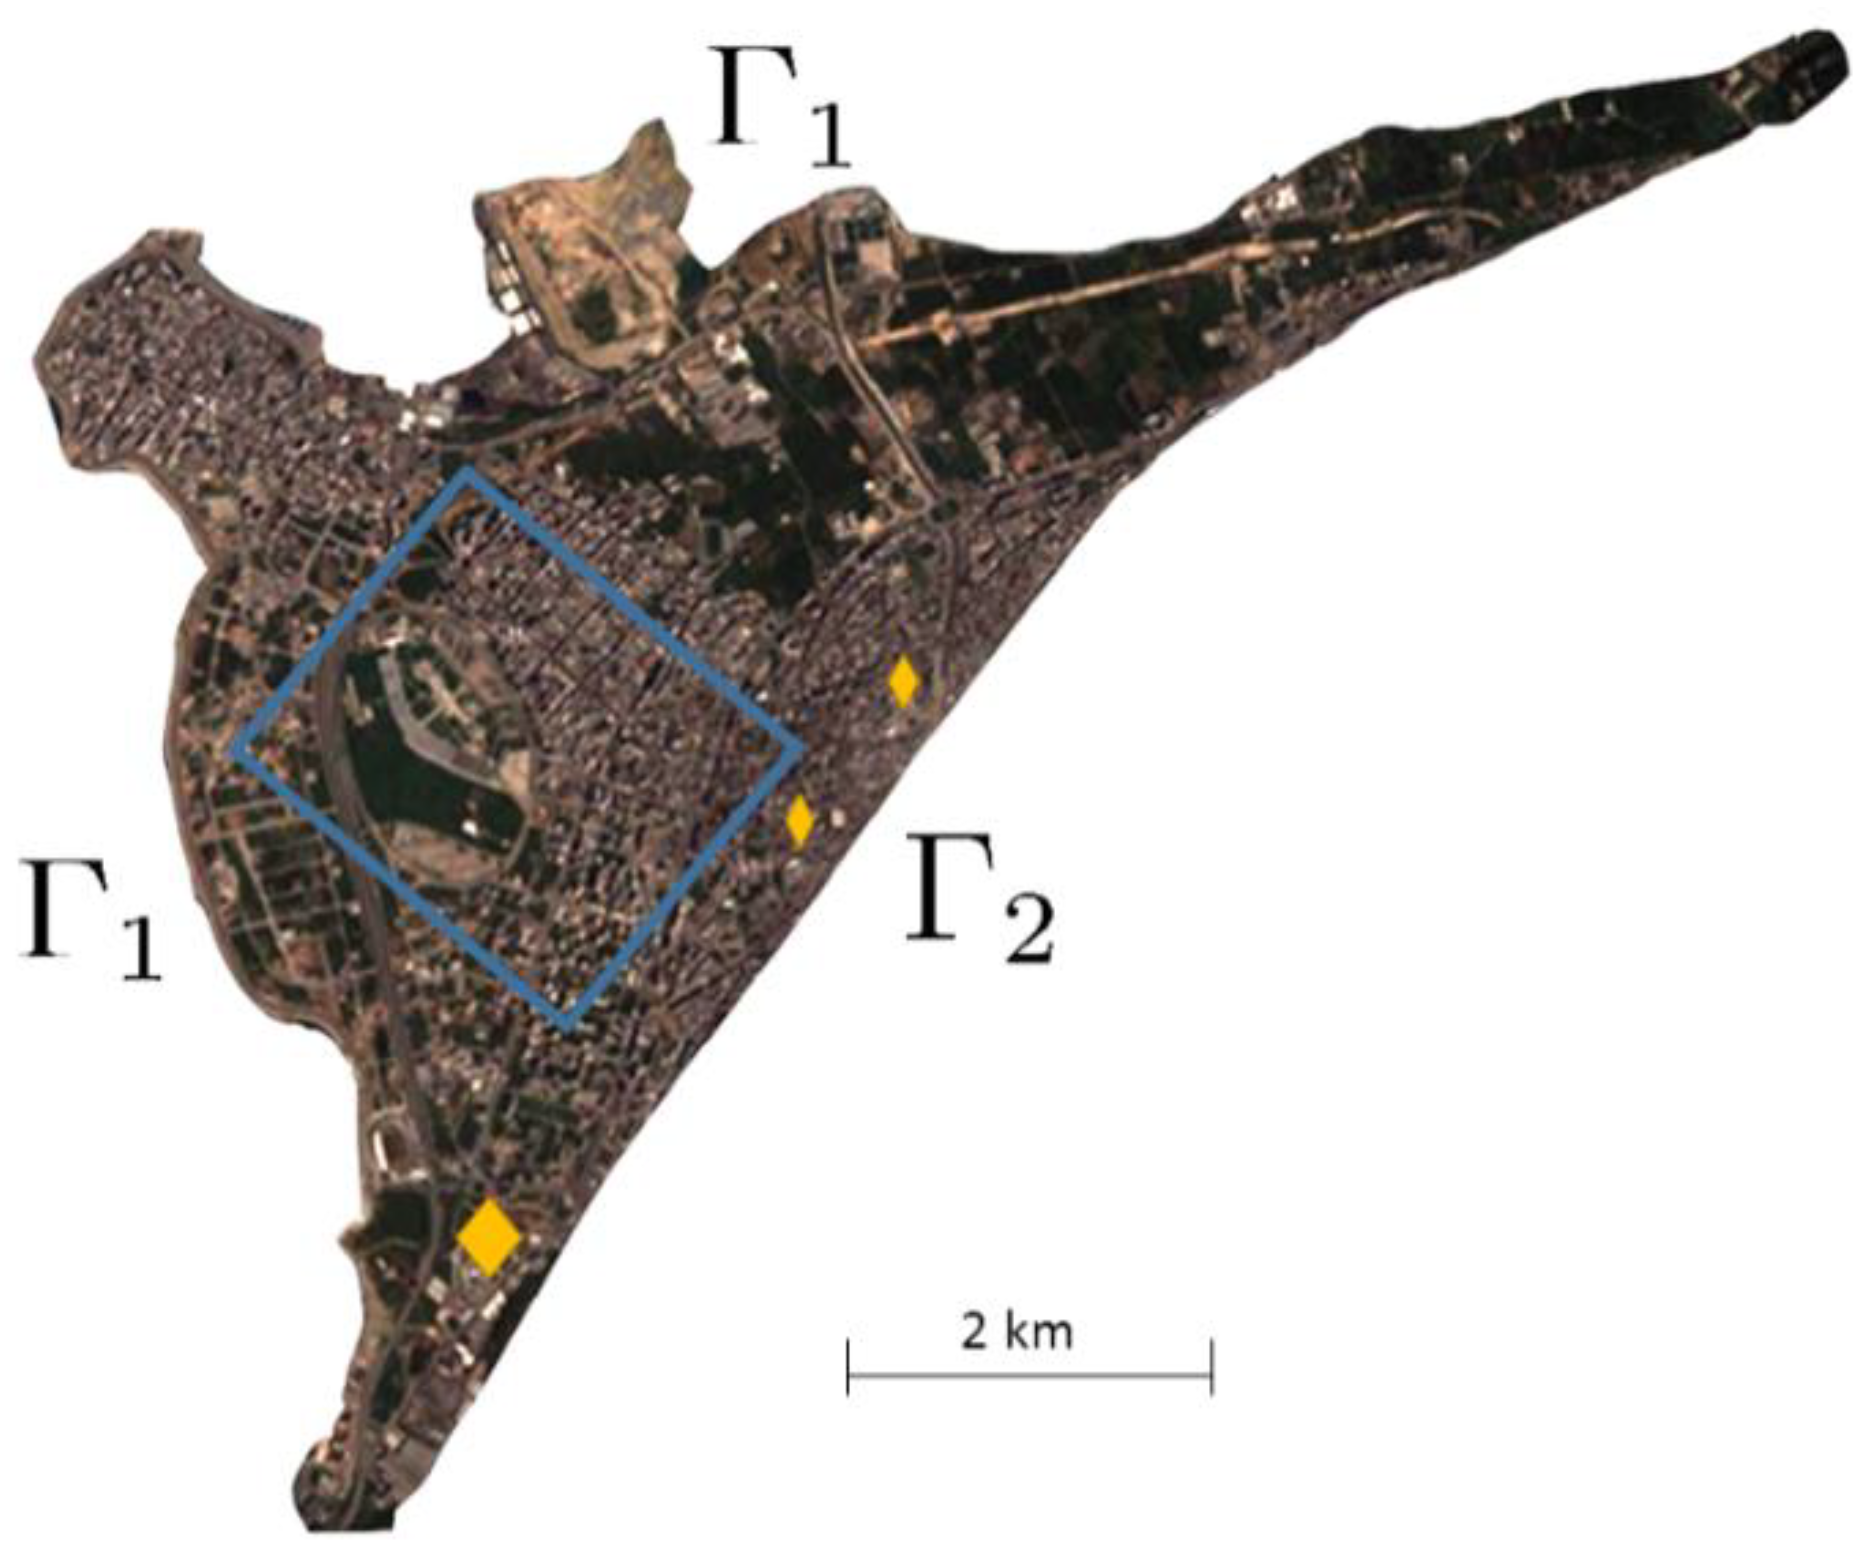
The study zone, the lower zone of Tripoli as shown in Figure 3, is limited by the shore (Г1) and by a fracture separating the lower zone and the upper zone of the city (Г2). In Figure 3, the blue square represents the area where the private wells are strongly spread. The yellow marks represent the position of the public wells. The biggest yellow mark represents the position of the four wells in Bahsas in the south of the aquifer, and the two others represent respectively the El-jisr and Malouleh wells.
Concerning the conditions on the boundaries, Equation (3) was used on border (Г1), where h = h0, and then u = 0. On border (Г2), a flux of freshwater entering the domain is considered. This flux has been calibrated in [12] for the year 2008 by 26.0235 m3∙m−2∙s−1. Because infiltration is neglect in this study, the source term S, represents only the quantity of freshwater extracted from the aquifer. Each pumping zone in the domain (Si), has been modeled by multiplying its area (Ai) by its extraction coefficient (λi). Thus, public wells were modeled by a disk, and the private wells region was modeled by a mean pumping rate over the whole region. Consequently, the equation governing the seawater intrusion in the Tripoli aquifer can be written as follows [12]:
where Ω represents the whole domain. A high-resolution sub-metric 2D mesh is generated and imported into Freefem++ [23] to compute u, and therefore h and g, in 2008.
2.3. Global Change Processes and Model Configuration
Considering that the area of interest is highly urbanized with very little impervious areas, the effect of evapotranspiration is not taken into consideration. Only the impacts of direct parameters are assessed in this paper: the sea level rise h0, the freshwater flux entering into the domain ψ, and the pumping rate via the extraction coefficient λ. The quantification of the impacts has been done in two steps. First, a sensitivity analysis is performed in order to evaluate the impact of the variation of each affected parameter (sea level, groundwater recharge, and extraction rate). Second, these parameters are expressed into boundary conditions variation and translated through the sensitivity analysis into seawater intrusion impact. The projections are done by changing only one parameter and fixing the others and then by combining all the parameters to predict the position of the seawater/freshwater interface in 2033, using the principal of superposition similar to the analytical approaches in [24].
The impacted parameters are the following:
- The sea level: The sea level has been estimated to raise, on average, by 10–20 cm in the last century [5]. Based on [25], the decrease in atmospheric pressure is the main reason for sea level rise. The snow and ice melt, and the temperature elevation will impact the studied zone. The sensitivity study was implemented for four levels of sea rise: (a) 50 cm, (b) 100 cm, (c) 150 cm, and (d) 200 cm. This change affects the parameter h0 in the model. By changing this parameter in Equation (5), the impact of the sea level rise is considered. The impact on the shoreline is not considered here.
- The groundwater recharge: The groundwater recharge is also subject to climate change. The impact of climate change on the groundwater recharge has been assessed in [15]. The forecasts show a huge global variability in the groundwater recharge. For example, the recharge is expected to increase in some regions in the north of Brazil to about 70% from 2008 to 2050. On the other hand, the recharge is expected to decrease to about 30% in the north of China for the same period. This variability will induce floods in some regions while causing coastal aquifers salinization in others. The aquifer recharge is expressed via the incoming flux from precipitation and snow melt. Because the incoming flux can increase in some years and decrease in other depending on the quantity of snow melt in each year, the change of the incoming flux is calculated by multiplying it by a coefficient of 0.8 up to 1.2 with a step of 0.05.
- The extraction rate: According to the United Nations Environment program (UNEP), 75% of the global population will be living in coastal areas by 2020. This will increase the need for freshwater in these zones, and because the main portion of the available freshwater is underground water, the extraction rate will increase in coming years. The extraction rates depend on the economic activities in the area. In the case of the Tripoli aquifer, the main use is domestic. As presented in the site description, a rate of 250 liters/capita/day for all combined activities is considered.
2.4. Evaluation Criterion
The thickness of the Tripoli aquifer is about 200 m, and the substratum is chosen as the reference level. The position of the 100 m level set of the seawater/freshwater interface g has been chosen as a criterion for the evolution of seawater intrusion. Indeed, all wells in the study area have a depth lower than this value. The variation of the distance to the coast along this reference value is considered as part of the uncertainty in the results.
3. Results
3.1. Sensitivity Analysis
3.1.1. Impact of Sea Level Rise
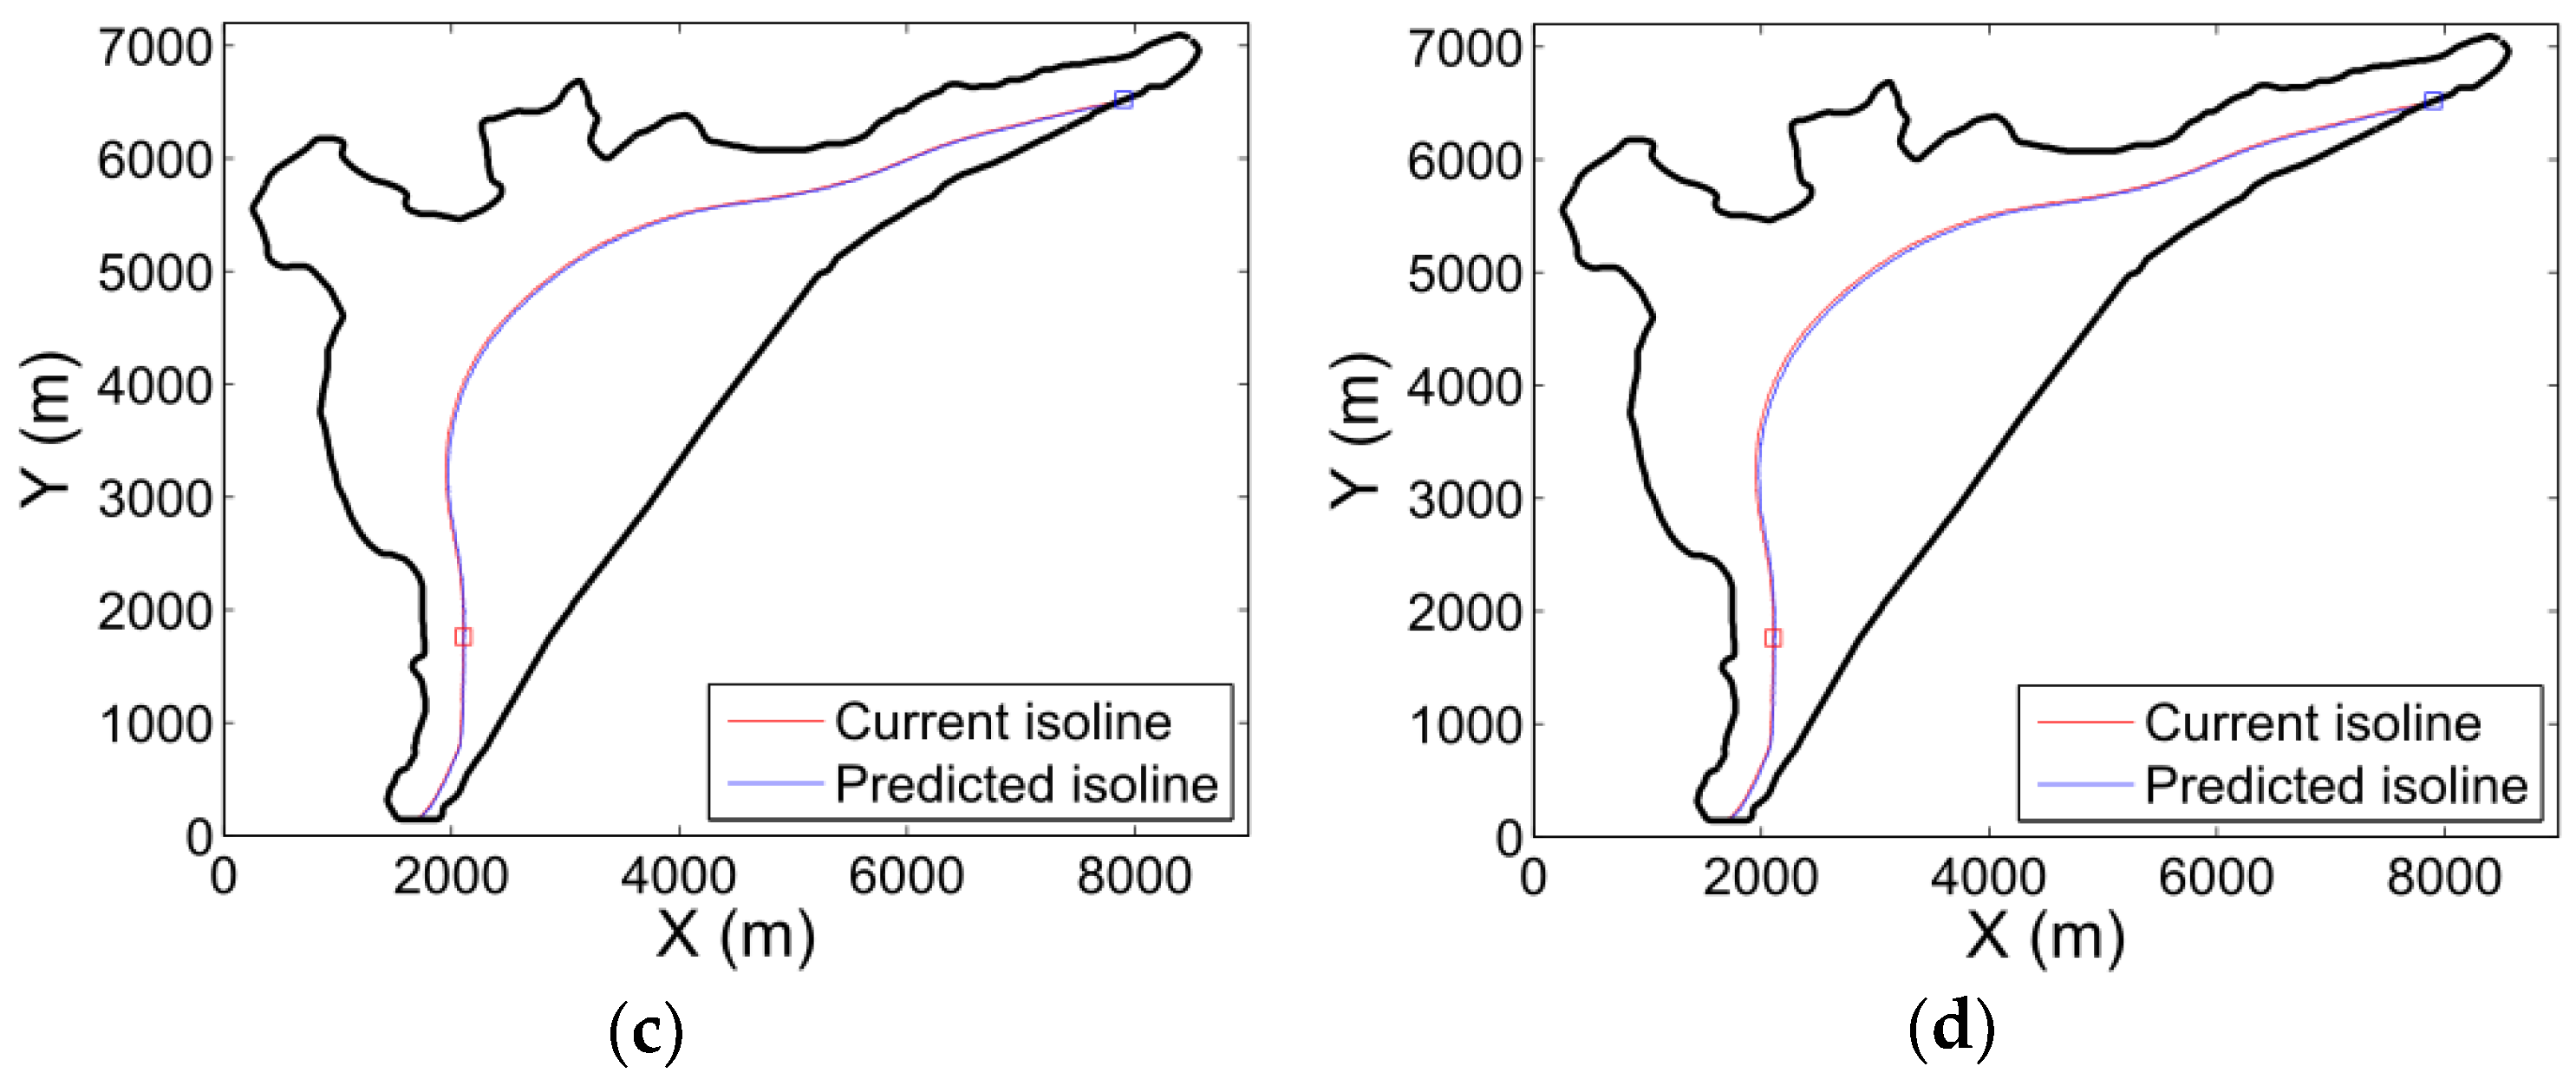
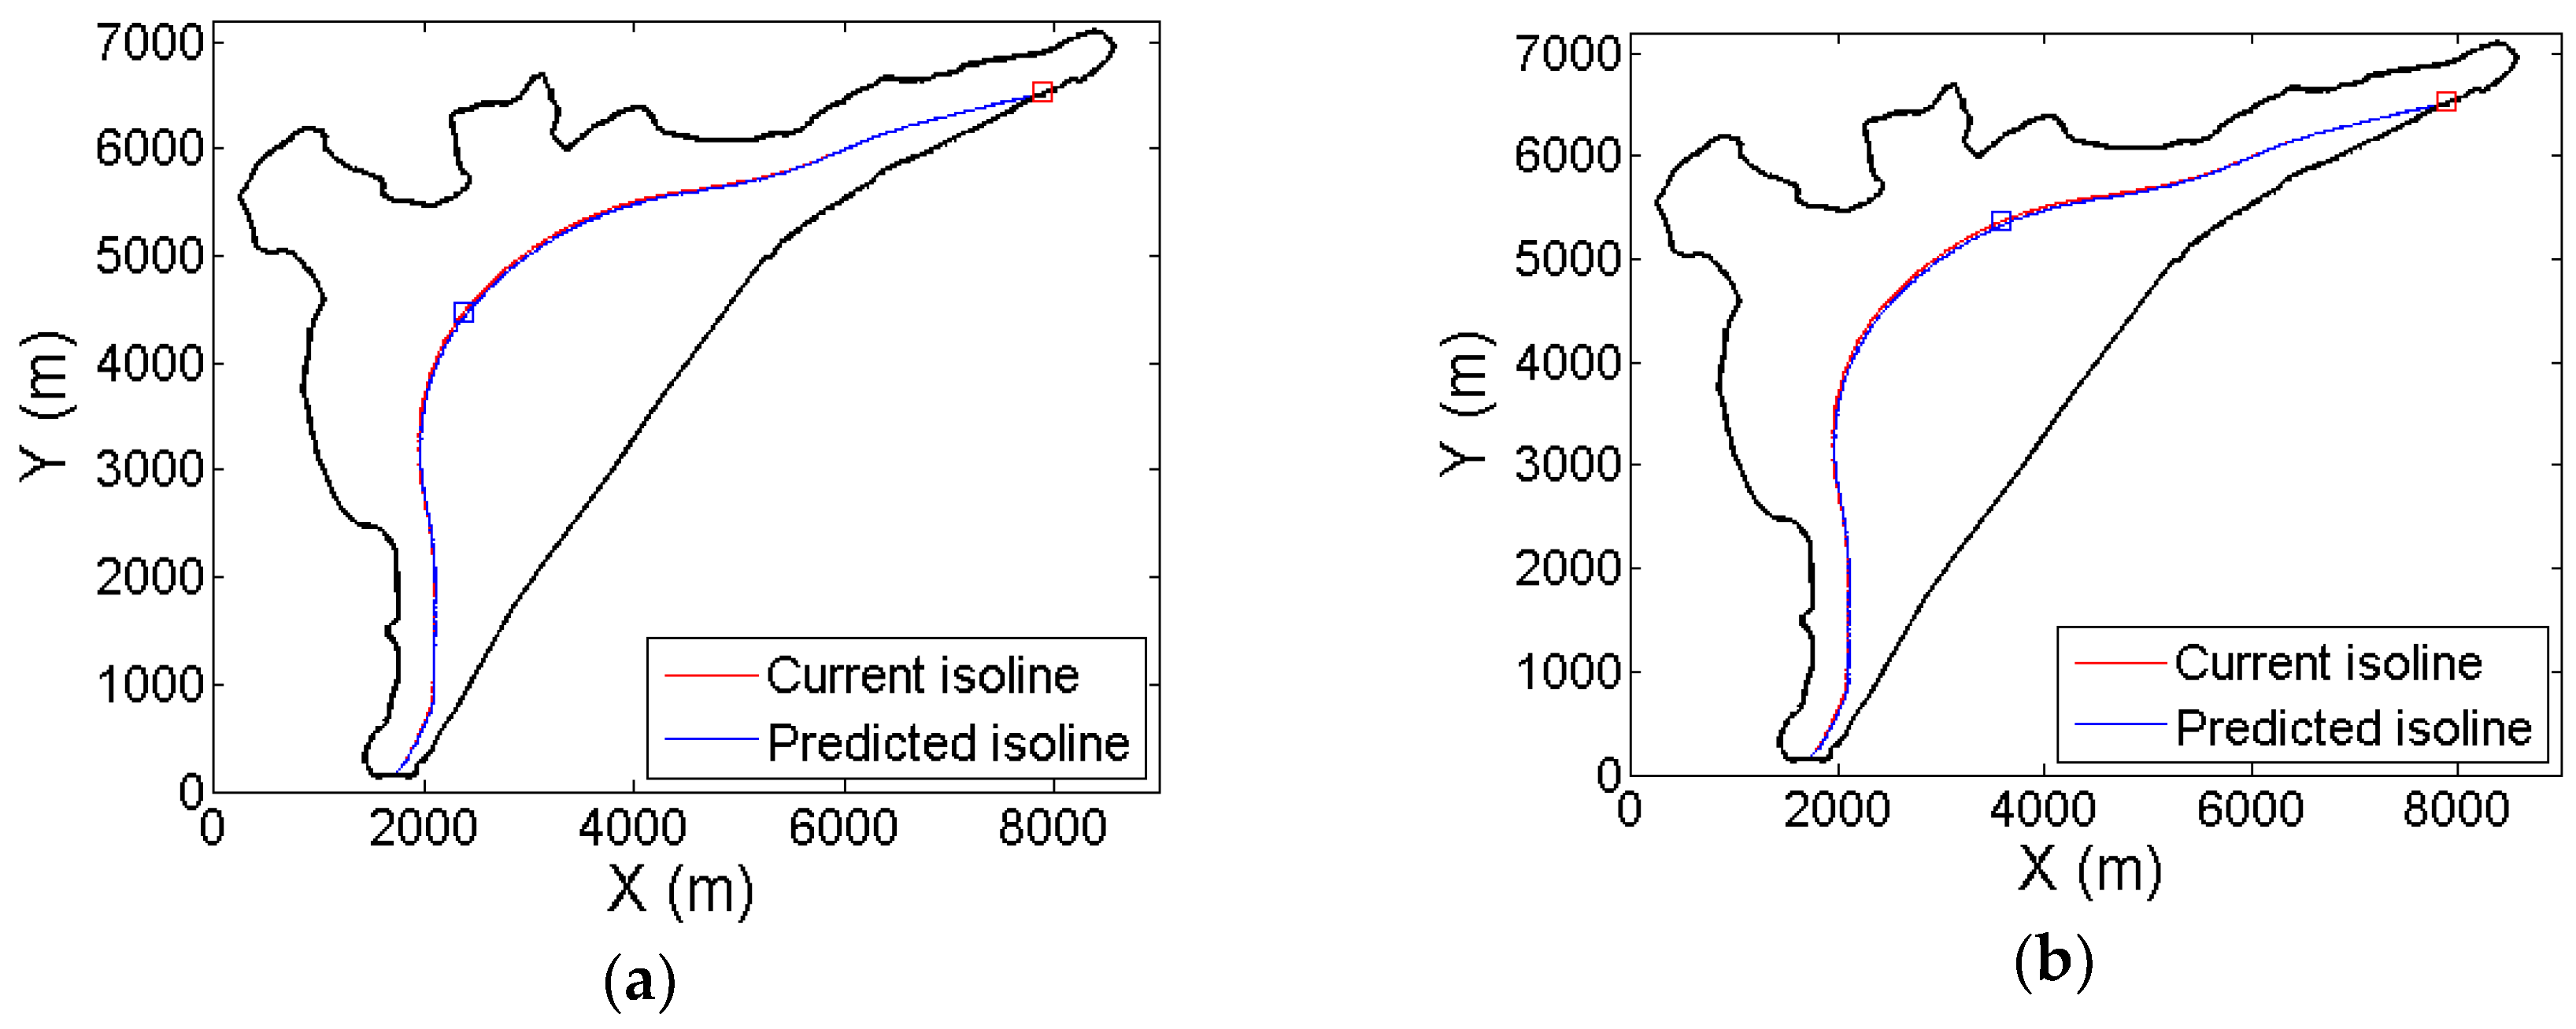
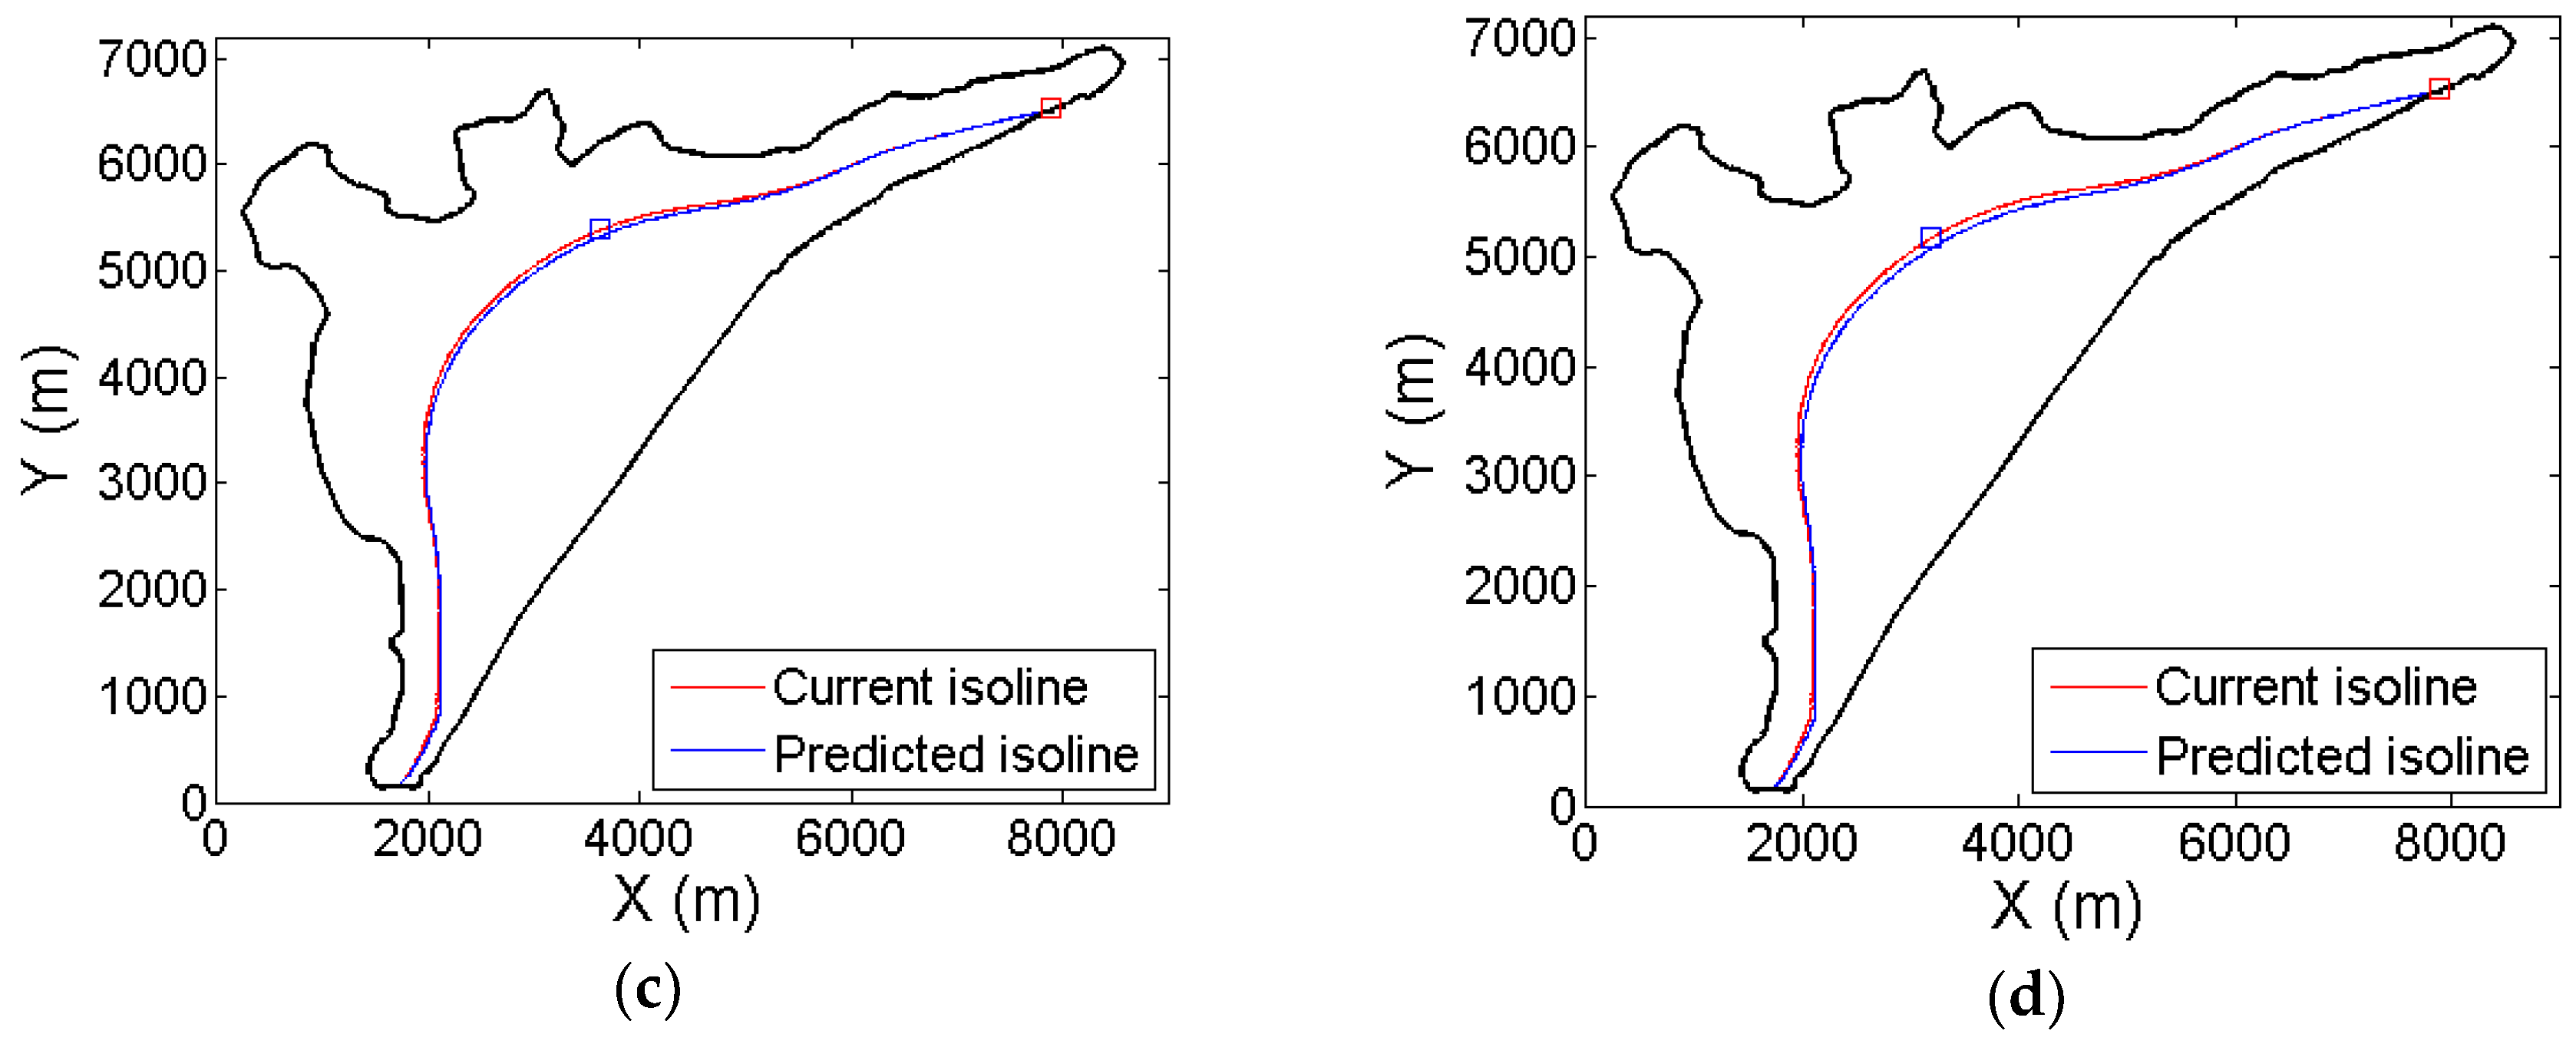
Figure 4 shows the impact of sea level rise on the 100 m level set of the seawater/freshwater interface for different sea levels. The squares in red and in blue show the positions of maximal and minimal advancement, respectively.
Table 1 shows the minimal and maximal advancement of the interface for the different sea levels.
The advancement on land of the interface g caused by the sea rise moves from a minimum of 1.3 m and a maximum of 28 m in the first scenario (50 cm rise) to a minimum of 5.3 m and a maximum of 98 m in the fourth scenario (200 cm rise). The squares in red and in blue represent the positions of the minimum and maximum advancement, respectively. The sea level rise has a minor impact on seawater intrusion, which is consistent with the literature [3].
3.1.2. Impact of Inflow Freshwater Flux
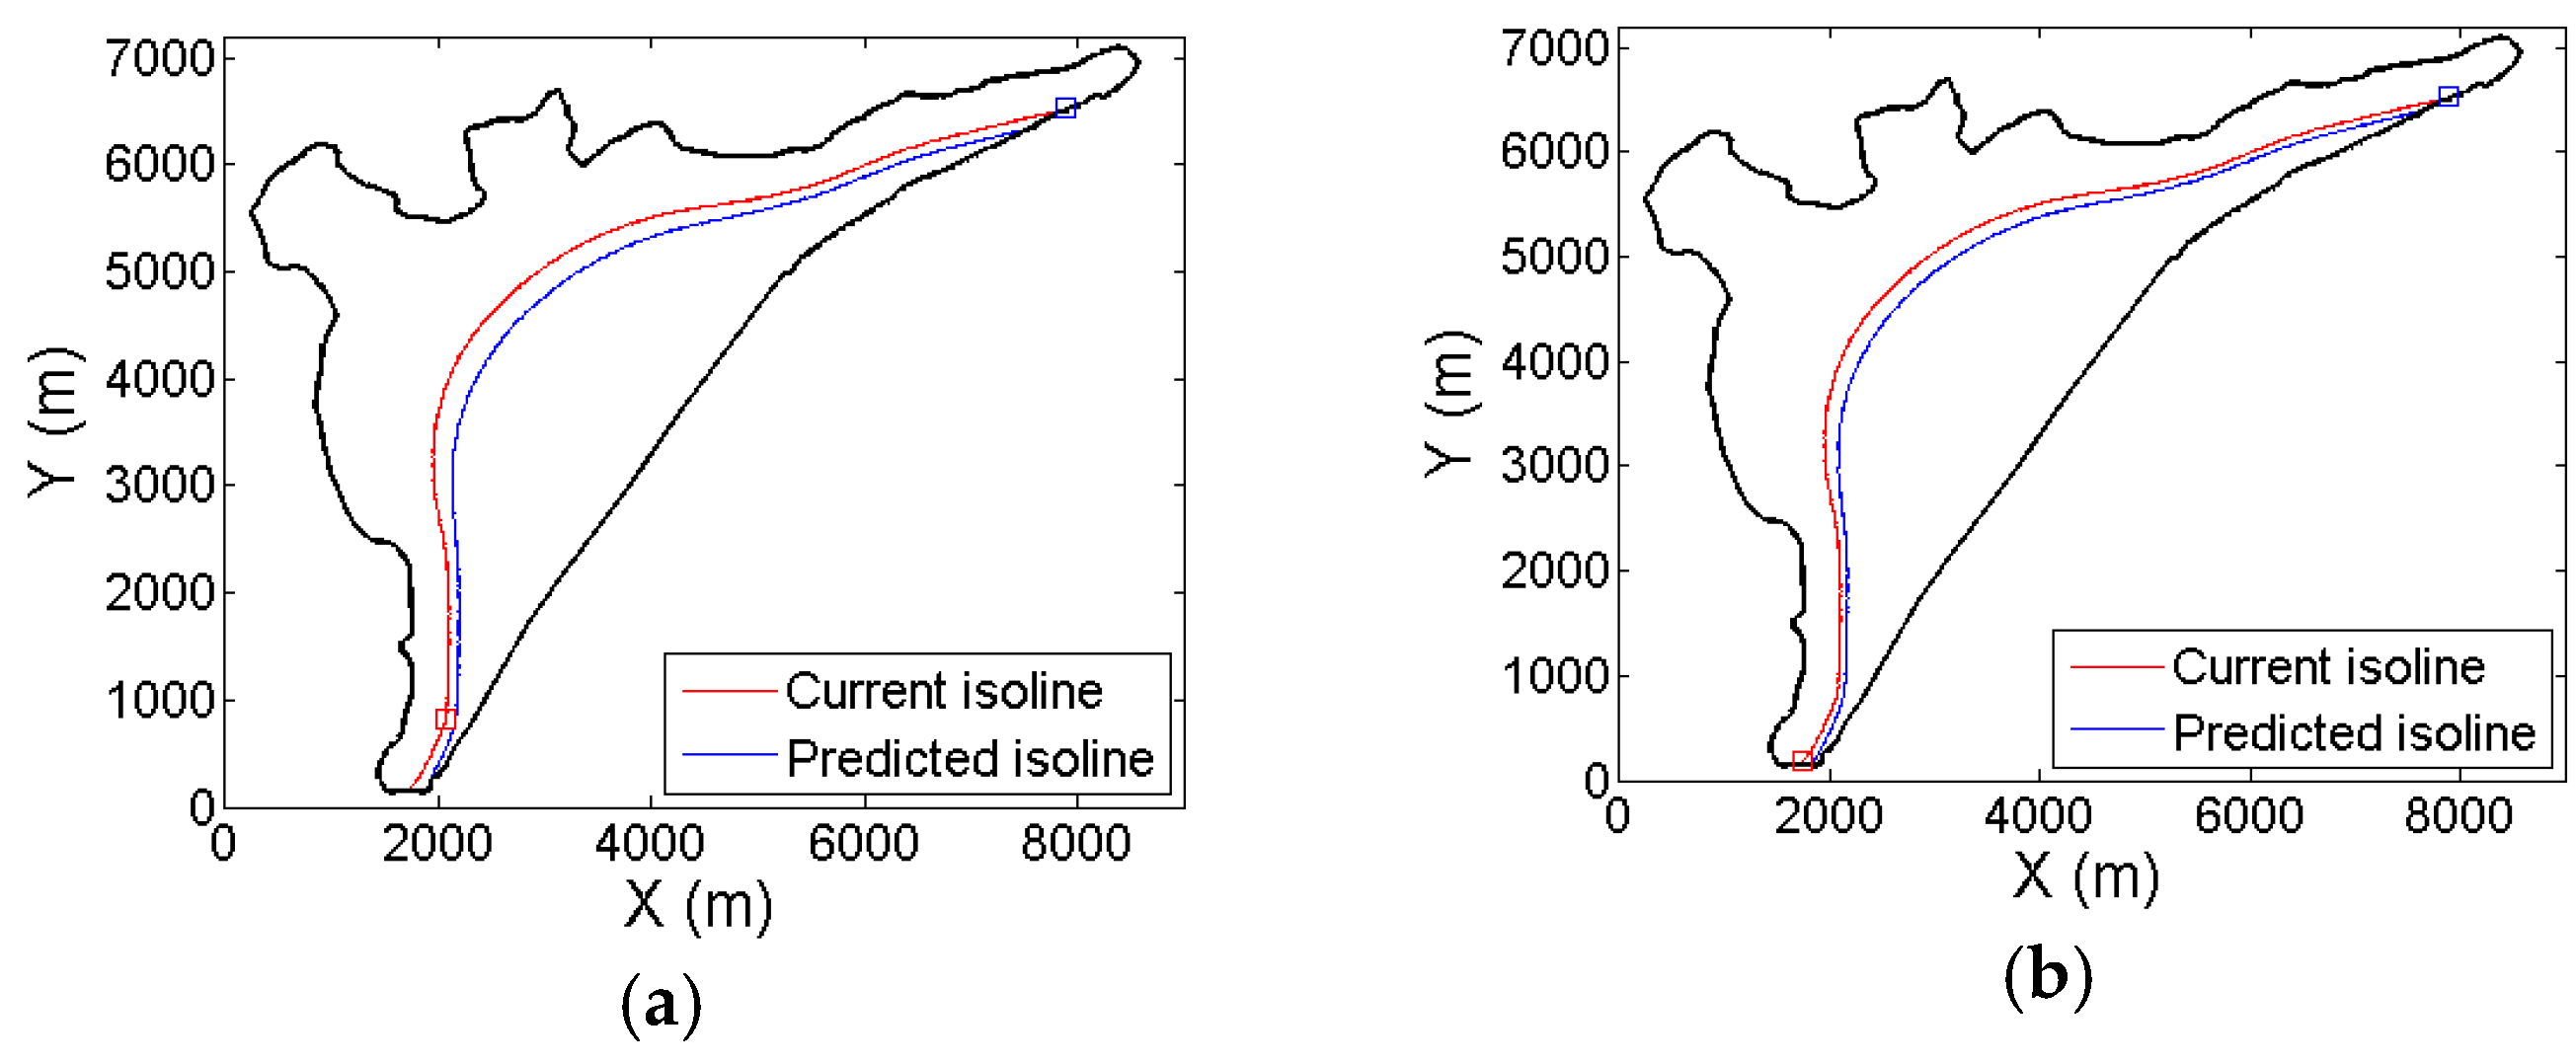
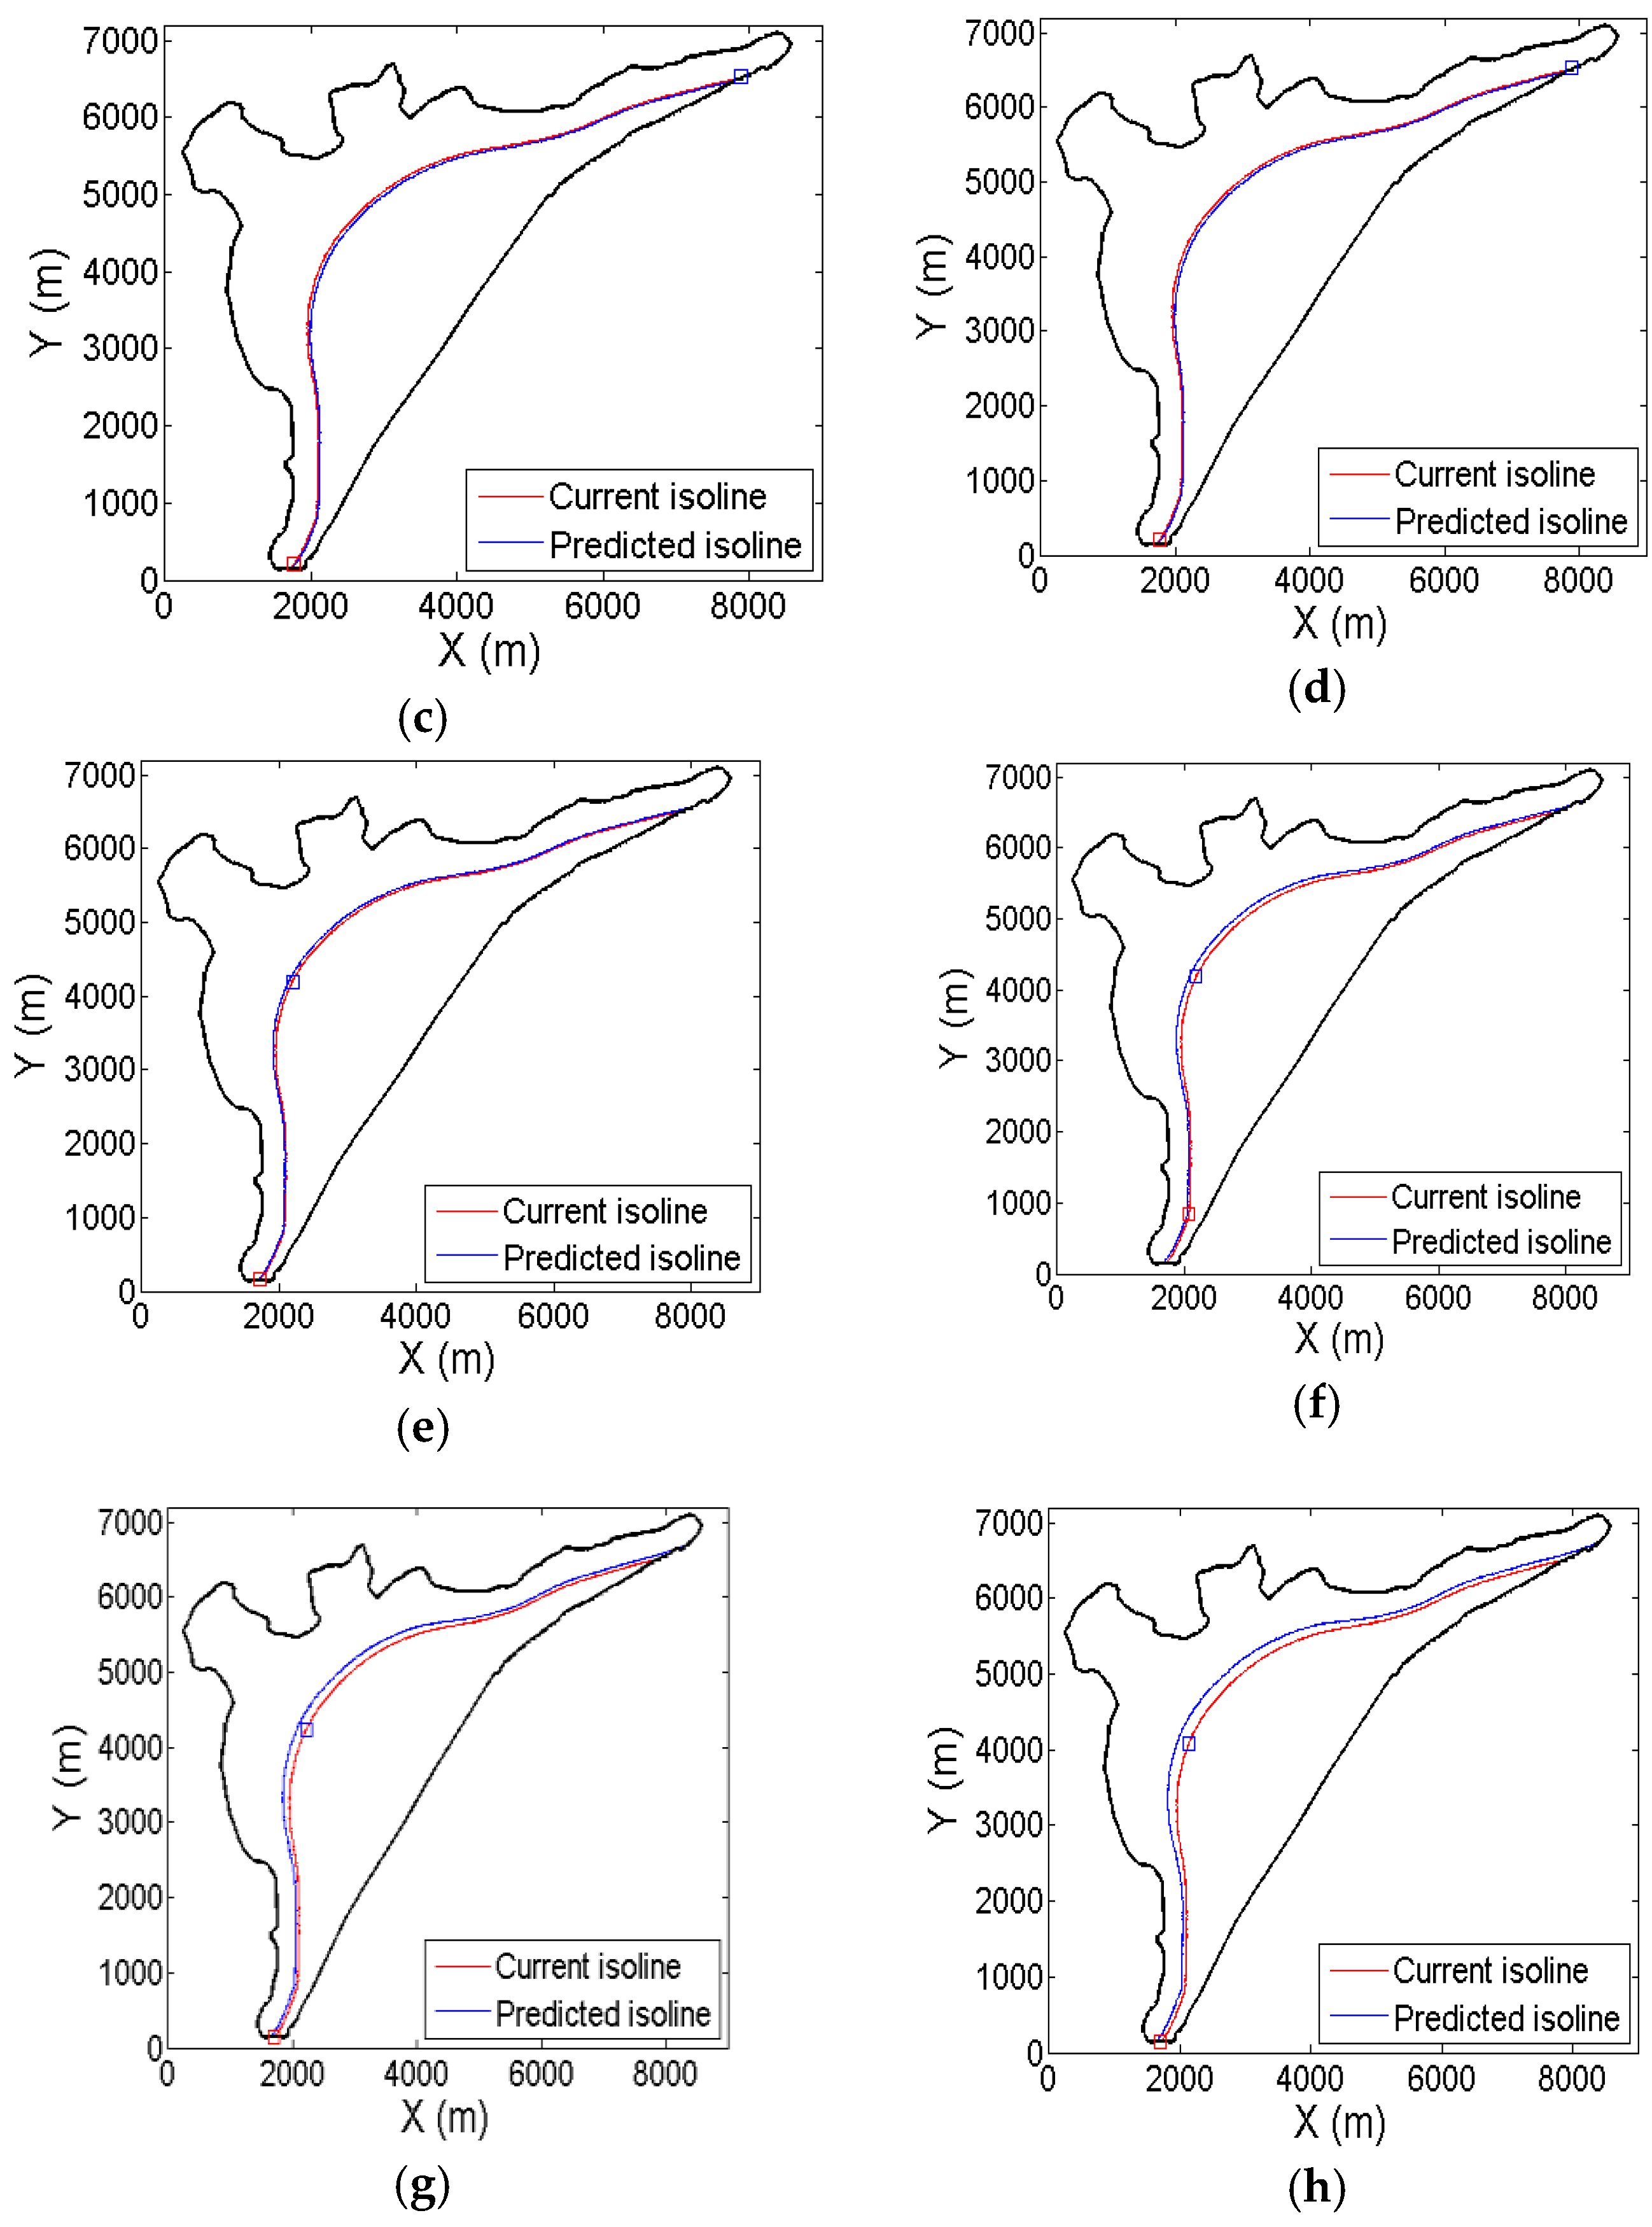
The flux of freshwater entering into the aquifer of Tripoli depends on the quantity of precipitation and snow melt every year. Figure 5 shows the sensitivity of the seawater intrusion with respect to the flux of freshwater ψ. Reducing ψ, the flux of fresh entering water, by 20% implies the advancement of the interface g about 1 km into the zone; while increasing it by 20% will move it back about 325 meters in a given position in the domain.
The squares in red and in blue show the positions of maximal and minimal position variation, respectively. Table 2 shows the minimum and maximum variation of the interface position g.
The numerical results in Table 2 show that the increase or the decrease of the same rate of recharge inflow do not have the same impact on the interface position. While decreasing 20% of the freshwater inflow recharge moves the position of the interface 230 m forward, the same rate of increasing moves the interface backward only 160 m from the same position.
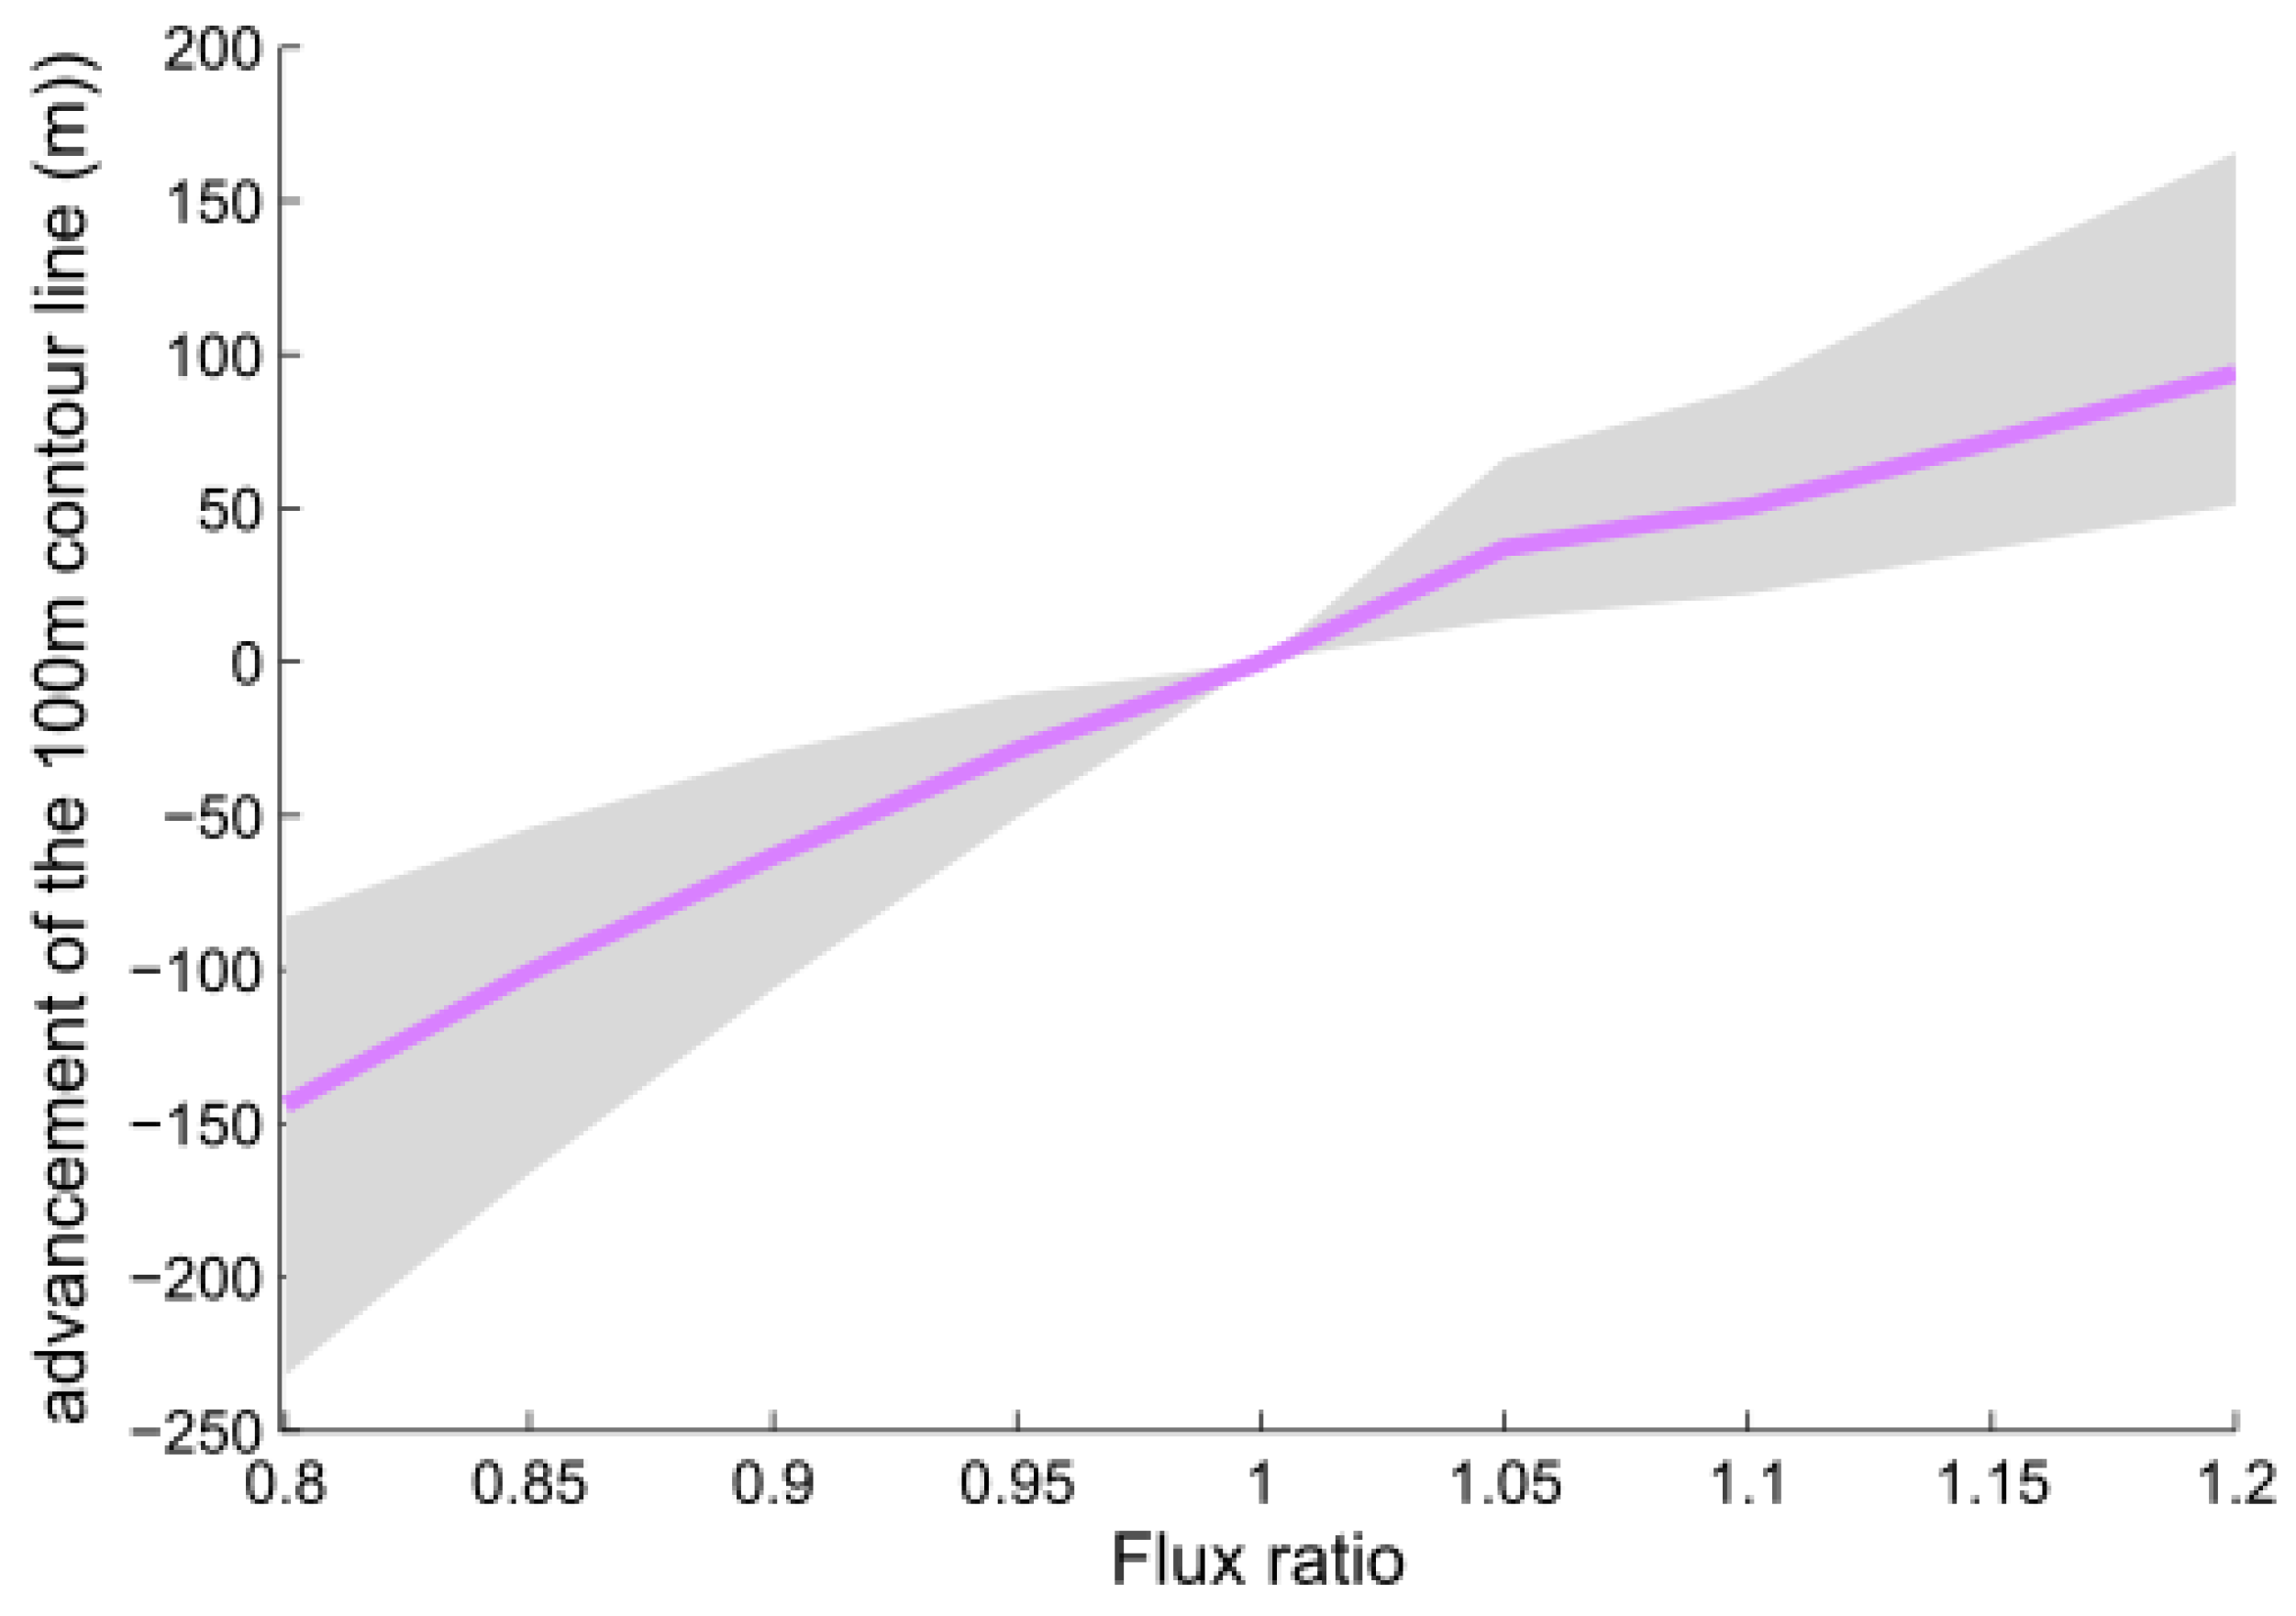
An interpolation of discrete values has been done to show the position of the interface with respect to a continuous variation of flux. Figure 6 shows the variation of the interface g position with respect to the flux rate; the purple line shows the median of the variation.
3.1.3. Impact of the Extraction Rate
Due to economic activity and demographic growth, the demand for water is an increasing function of time. The demographic growth is aggravated in the case of the Tripoli aquifer by the recent migration waves from the wars in neighboring countries. In order to assess its impact on the 100 m level set of the freshwater/seawater interface, the quantity of extracted water is doubled up in four stages. The extraction coefficient λ has been multiplied by the coefficients: 1.25, 1.5, 1.75, and 2.
Figure 7 shows the impact of the variation of coefficient of extraction λ on the 100 m level set of the seawater/freshwater interface. The squares in red and in blue show the positions of maximal and minimal advancement, respectively.
Table 3 shows the advancement on land of the seawater/freshwater interface in meters after the multiplication of the coefficient of extraction by 1.25, 1.5, 1.75, and 2.
Doubling the extracted quantity of freshwater will cause a median advancement of 35 m.
3.2. Impact of Future Scenarios
Climate change was integrated in the seawater intrusion model in order to assess its impact on the situation of the Tripoli aquifer over the next 25 years. The impact of the sea level rise, climate change, and demographic growth is assessed separately, and then, the impact of the combined processes is given.
3.2.1. Impact of Projected Sea Level Rise
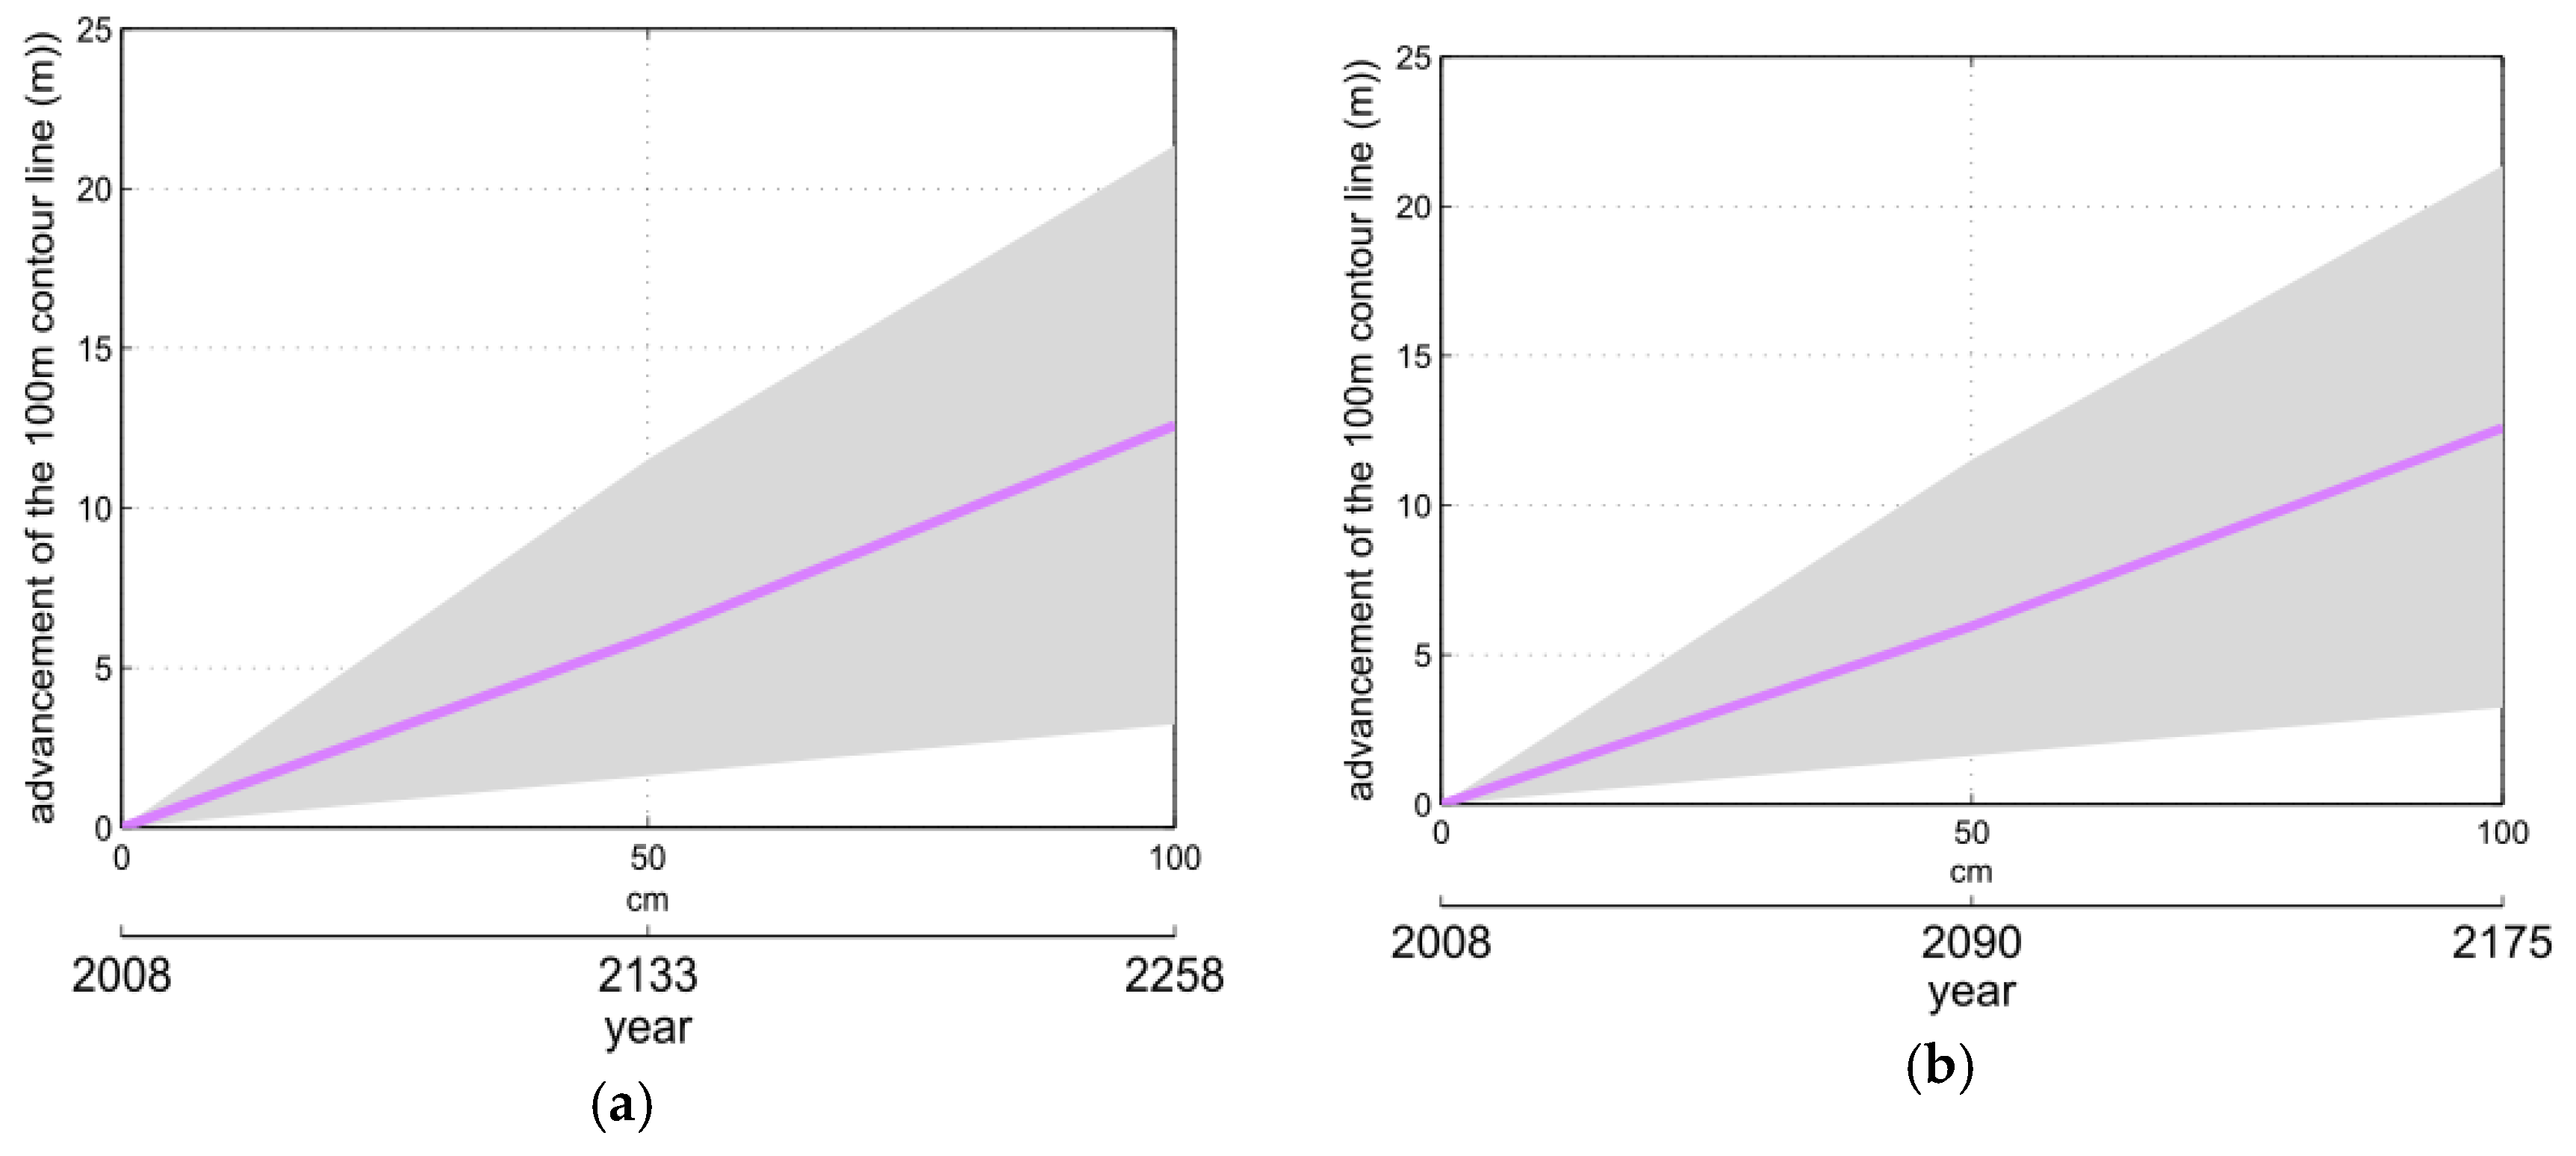
The mean sea level rise is estimated to be an increase of +3.3 mm/year [26], after a period of decrease of this rate due to short-term climate change. More recent evaluations [27] have confirmed these values. The Mediterranean Sea near the Lebanese coast will rise to a higher rate in this century. We considered two extreme scenarios. The first one assumes a rise of 4 mm per year, while the second assumes a rise of 6 mm per year. Figure 8 shows the range of advancement inland of the position of the seawater/freshwater interface in meters with respect to sea level rise and years in each scenario. The purple line shows the median advance. The simulation results extend up to two centuries. The values for the next century are quite low: 5–6 m with an uncertainty of 10 m.
3.2.2. Impact of Climate Trends on Recharge
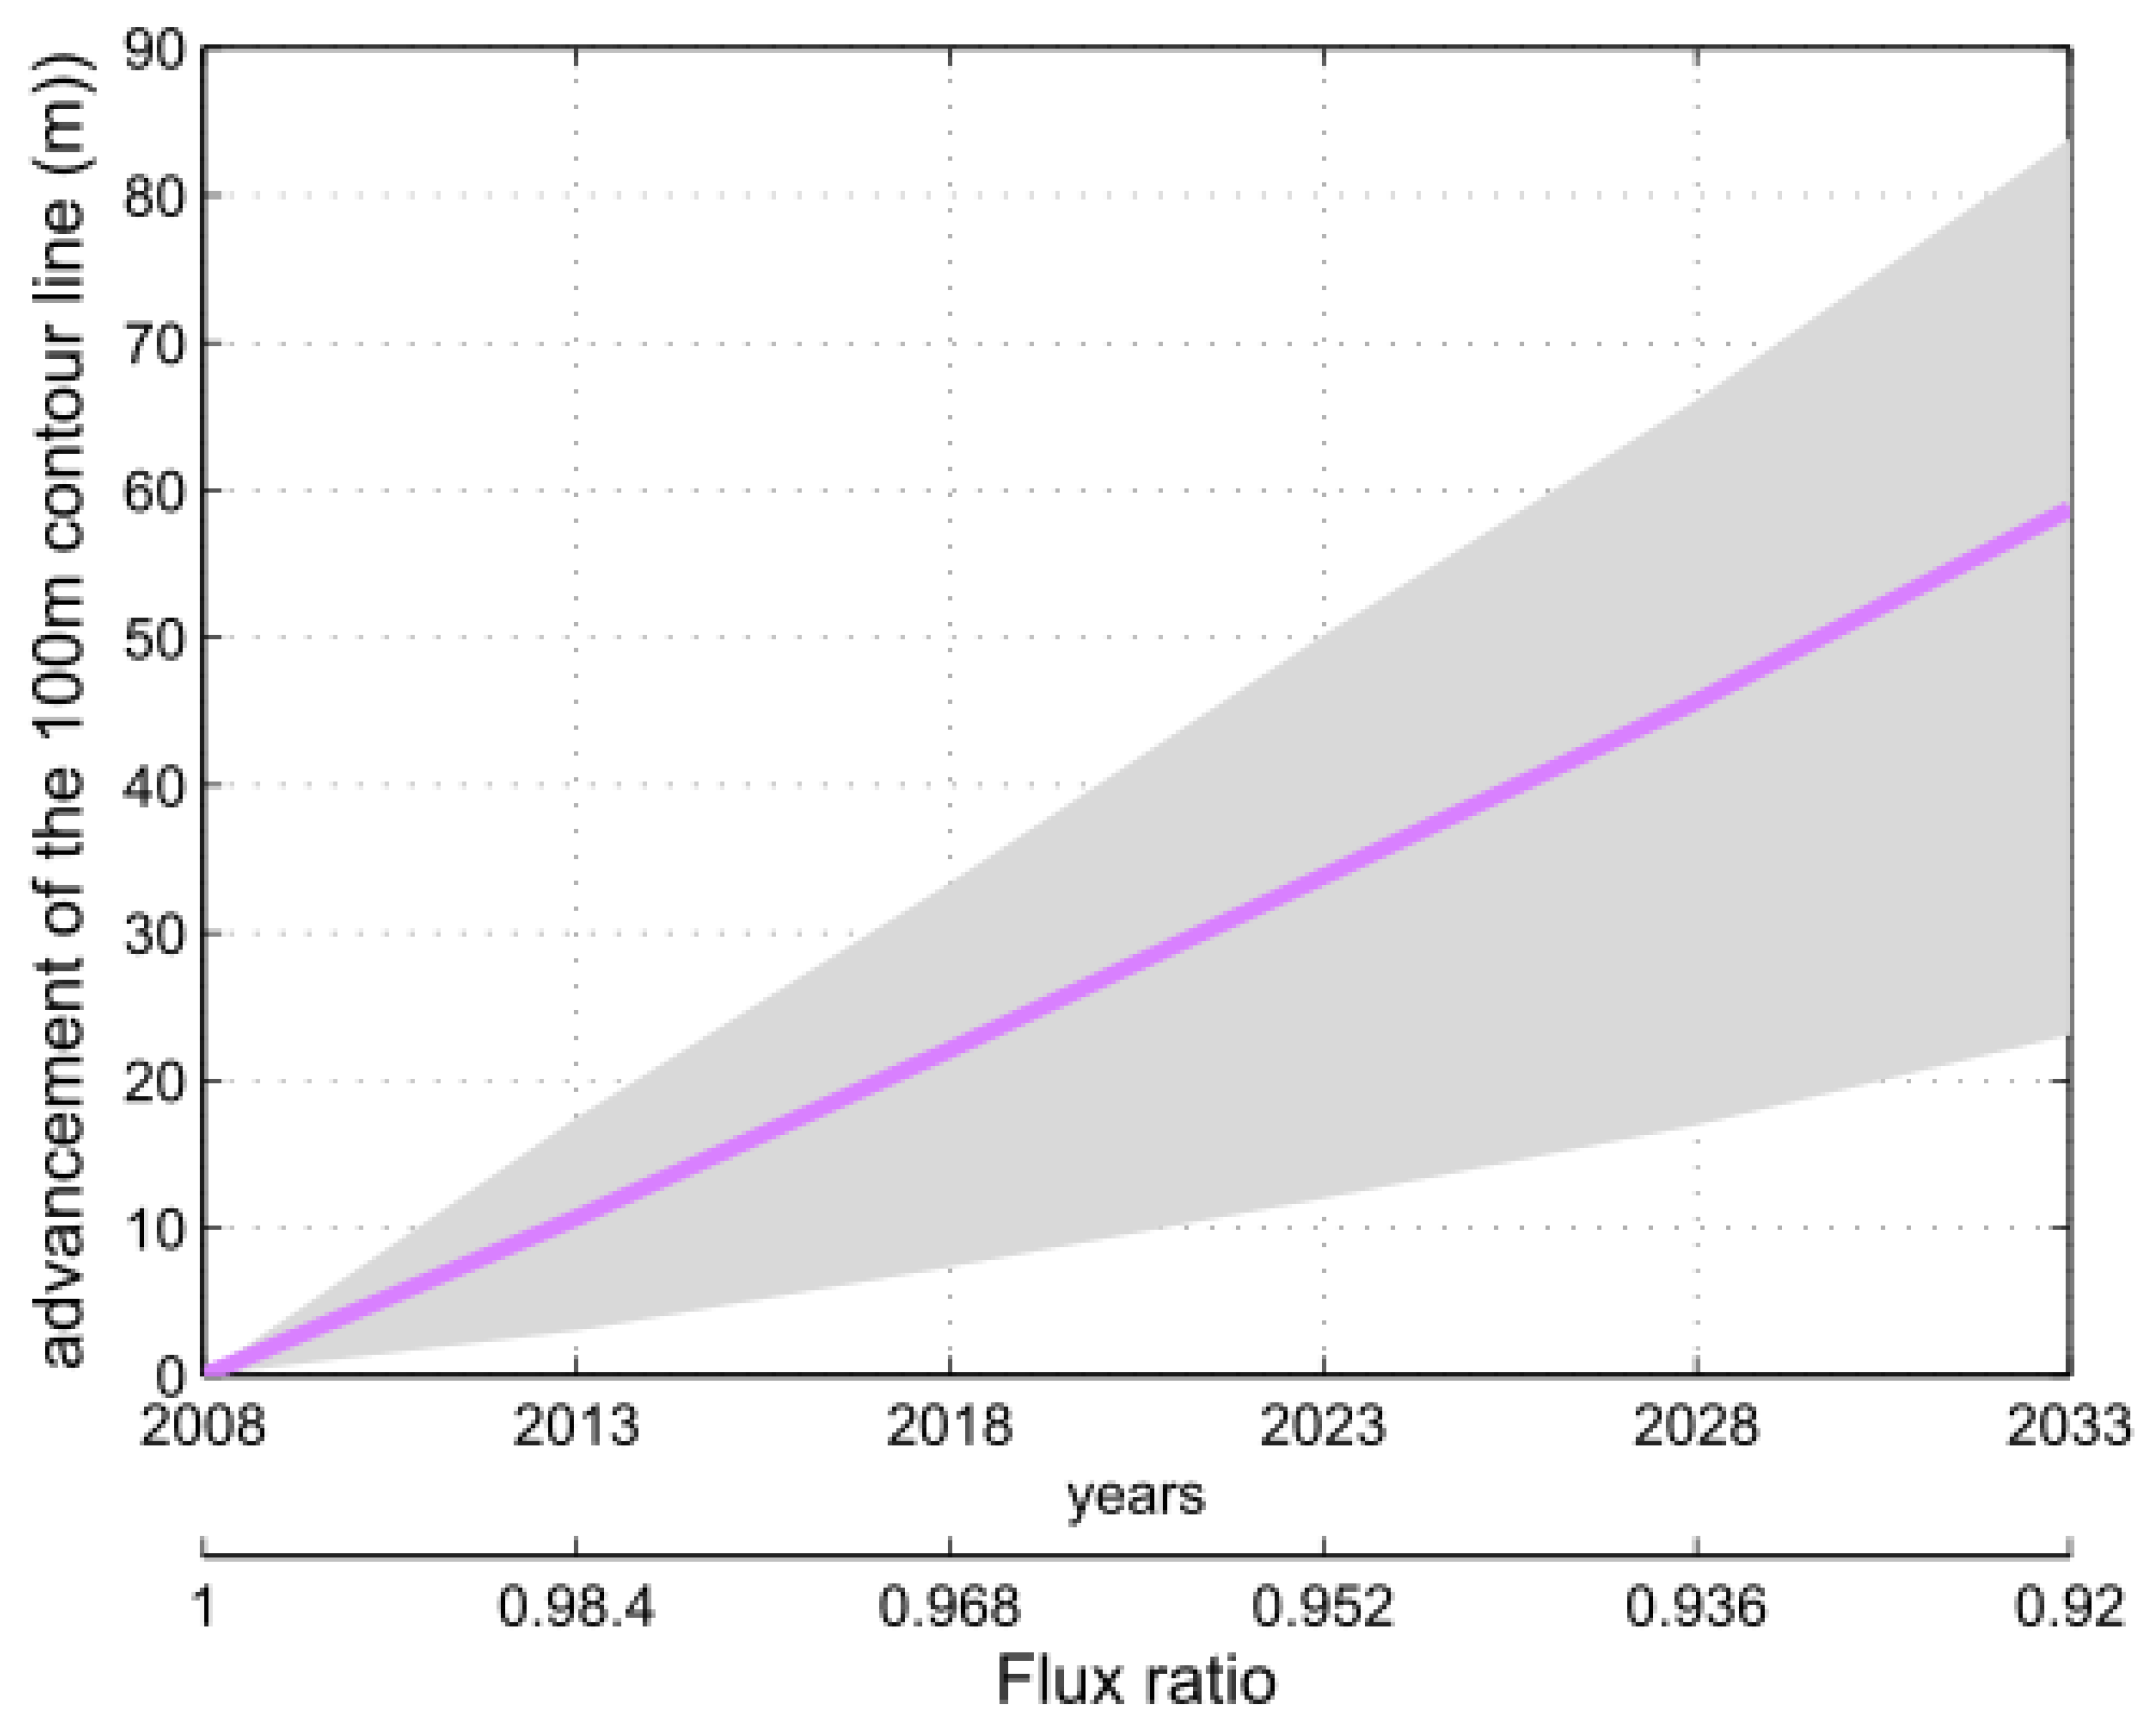
Precipitations and snowfall over the Lebanese mountains constitute the main source of freshwater to the Tripoli aquifer. The climate trends will impact the seawater intrusion. Following the projections from IPCC WGII AR5 [28], the precipitation is expected to decrease by about 20% from 1990 to 2050 in the study zone. This value is taken as a reference for the climate projection. A linear regression is used to estimate the yearly recharge decrease in the study area. We consider that the inflow flux will be decreasing proportionally to the change in climate change. From the previous statement, the flux of freshwater entering into the domain, Ψ, is decreased by 1.6% every 5 years. Figure 9 shows the impact of the recharge, decreasing the range of advancement inland of the seawater/freshwater interface in meters with respect to flux ratio and years. The purple line shows the median advancement. As expected, the results show advancement inland of the seawater interface, leading to increased salinization of the aquifer. A high variability of 100% is also obtained.
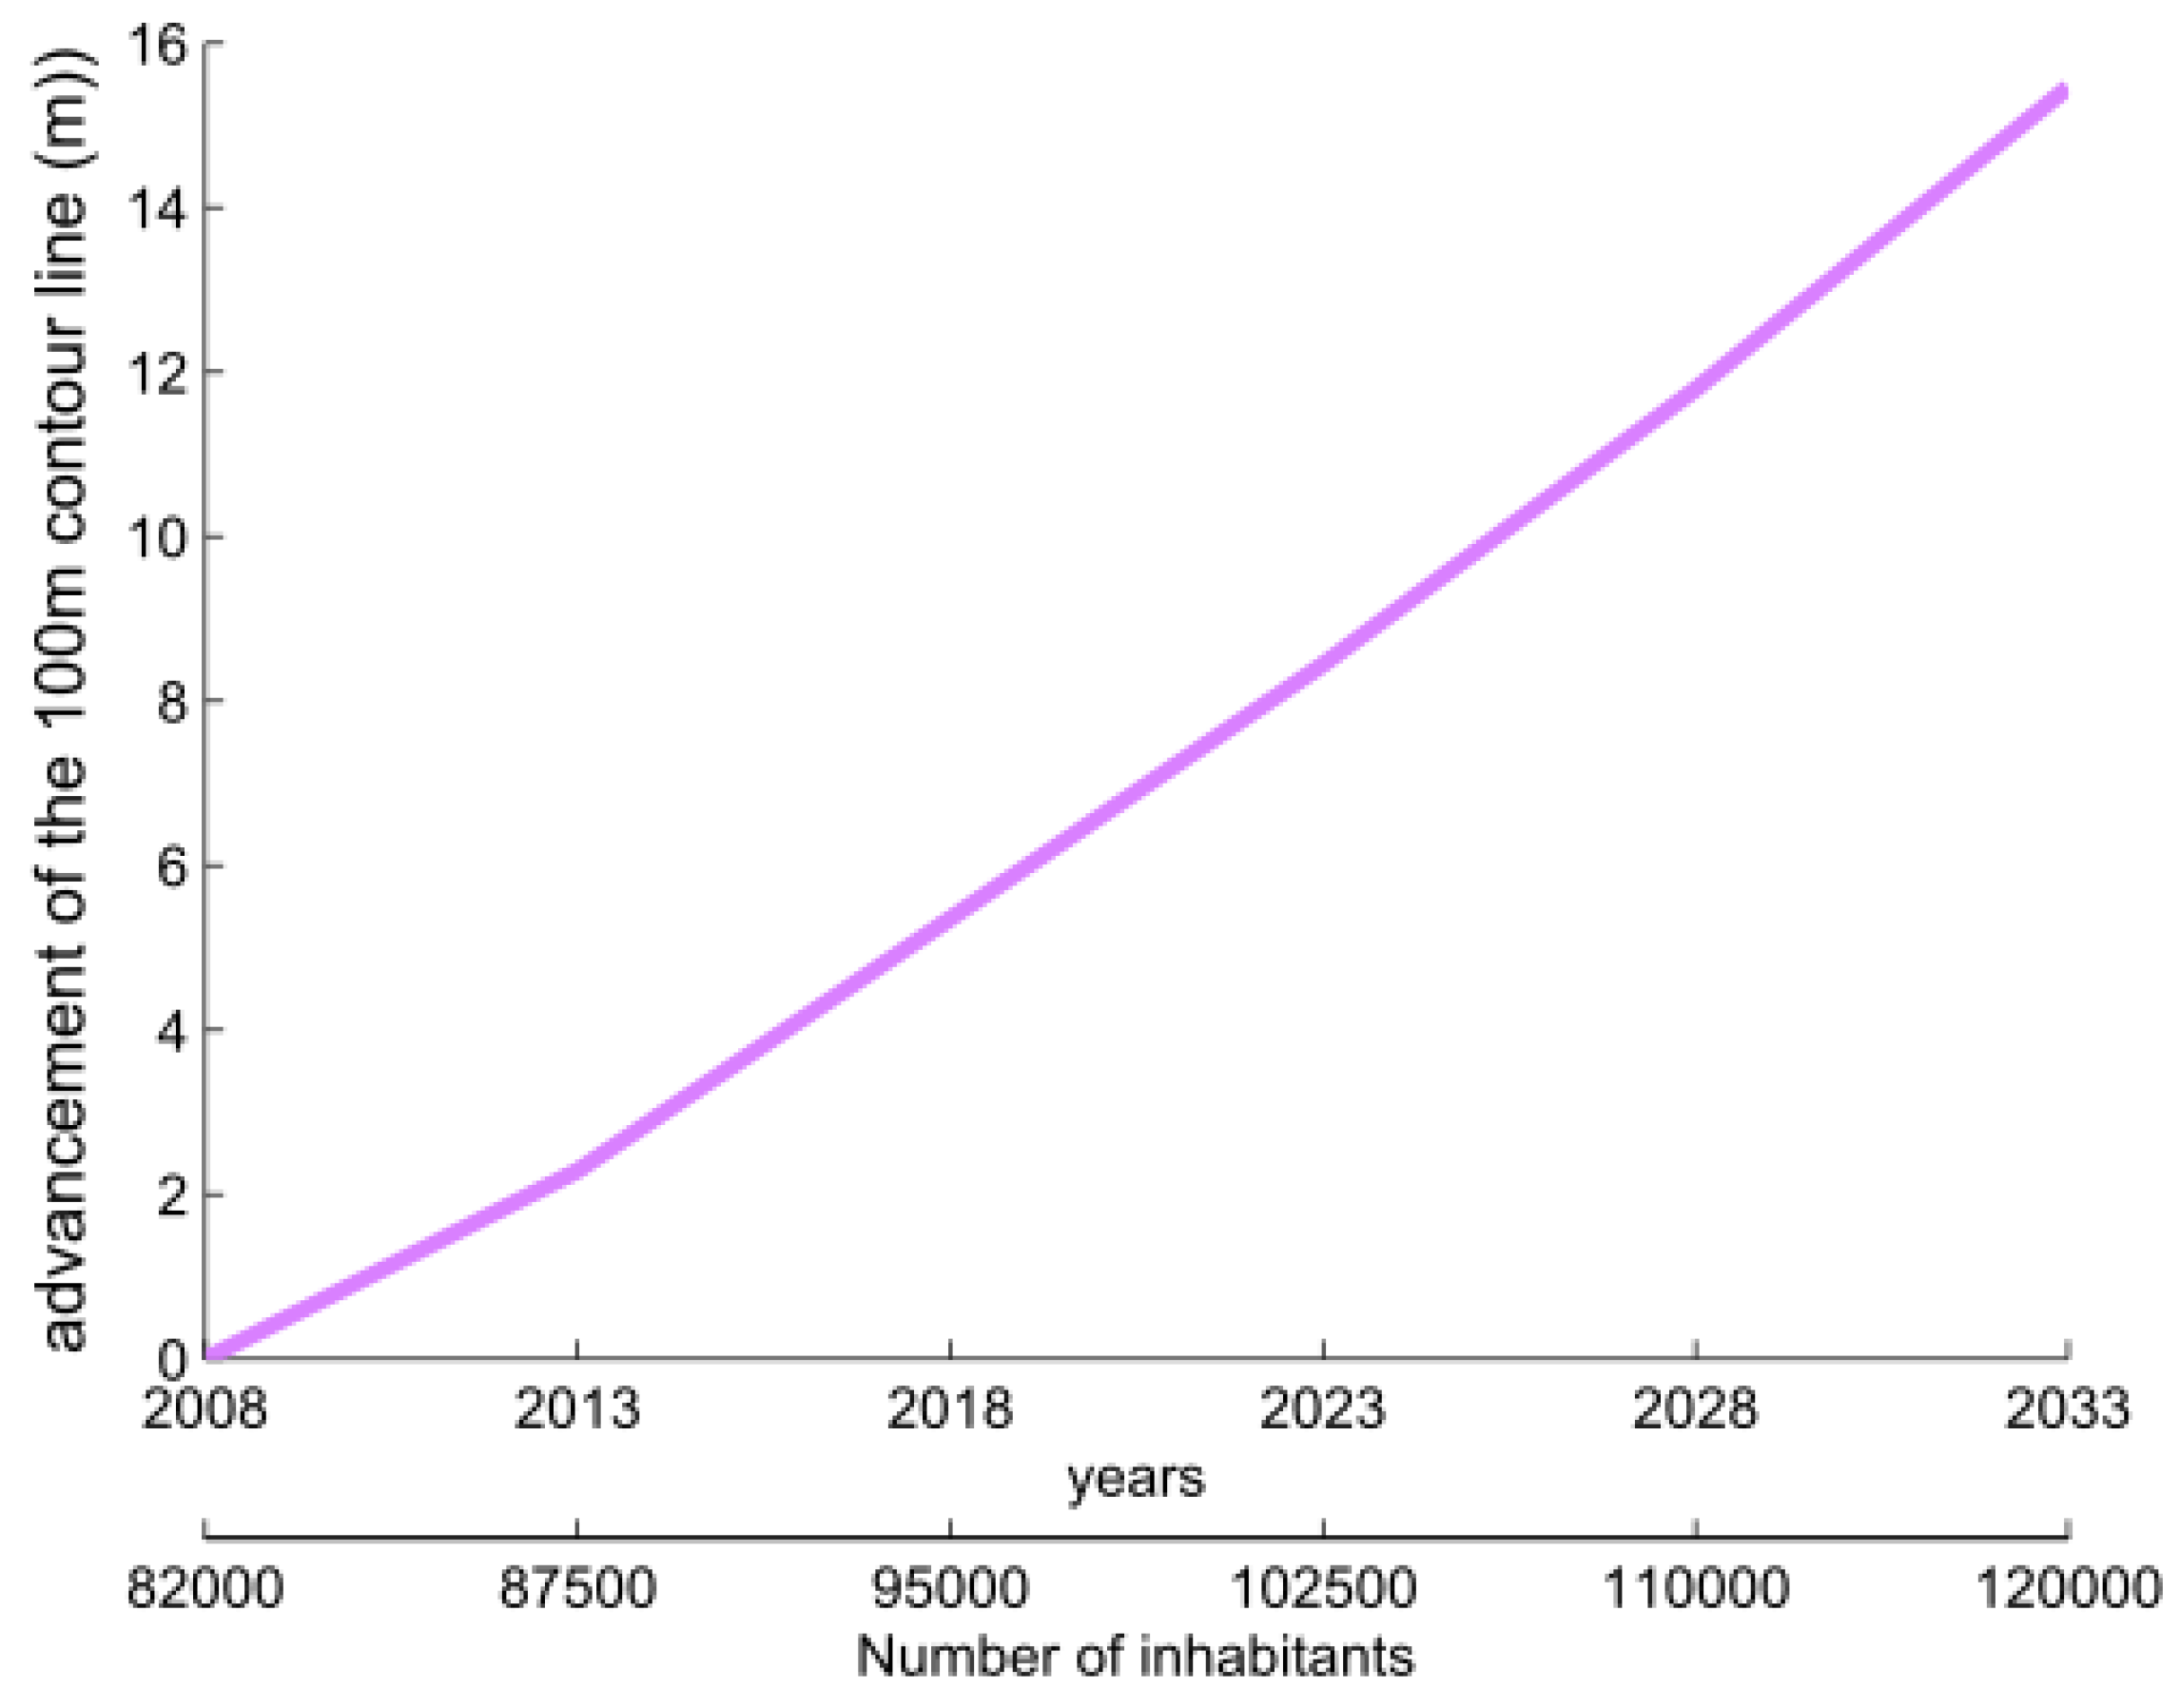
3.2.3. Impact of Demographic Growth
In 2008, there were 82,000 inhabitants in the study zone benefiting from the groundwater. The ministry of social affairs in Lebanon estimates the demographic growth rate to be 1.6% per year. This change has an impact on the coefficient extraction (λ). In order to assess the impact of this parameter over the next 25 years, each value of λi has been multiplied by a coefficient corresponding to the population growth. In [12], the difference between the current interface g and the predicted one was shown. In this study, the impact of the demographic rate on the 100 m contour line of g has been assessed.
Figure 10 shows the median advancement inland of the seawater/freshwater interface in meters with respect to the number of inhabitants and years. The median predicted advancement caused by the impact of the demographic growth rate of the Lebanese population is 22 m.
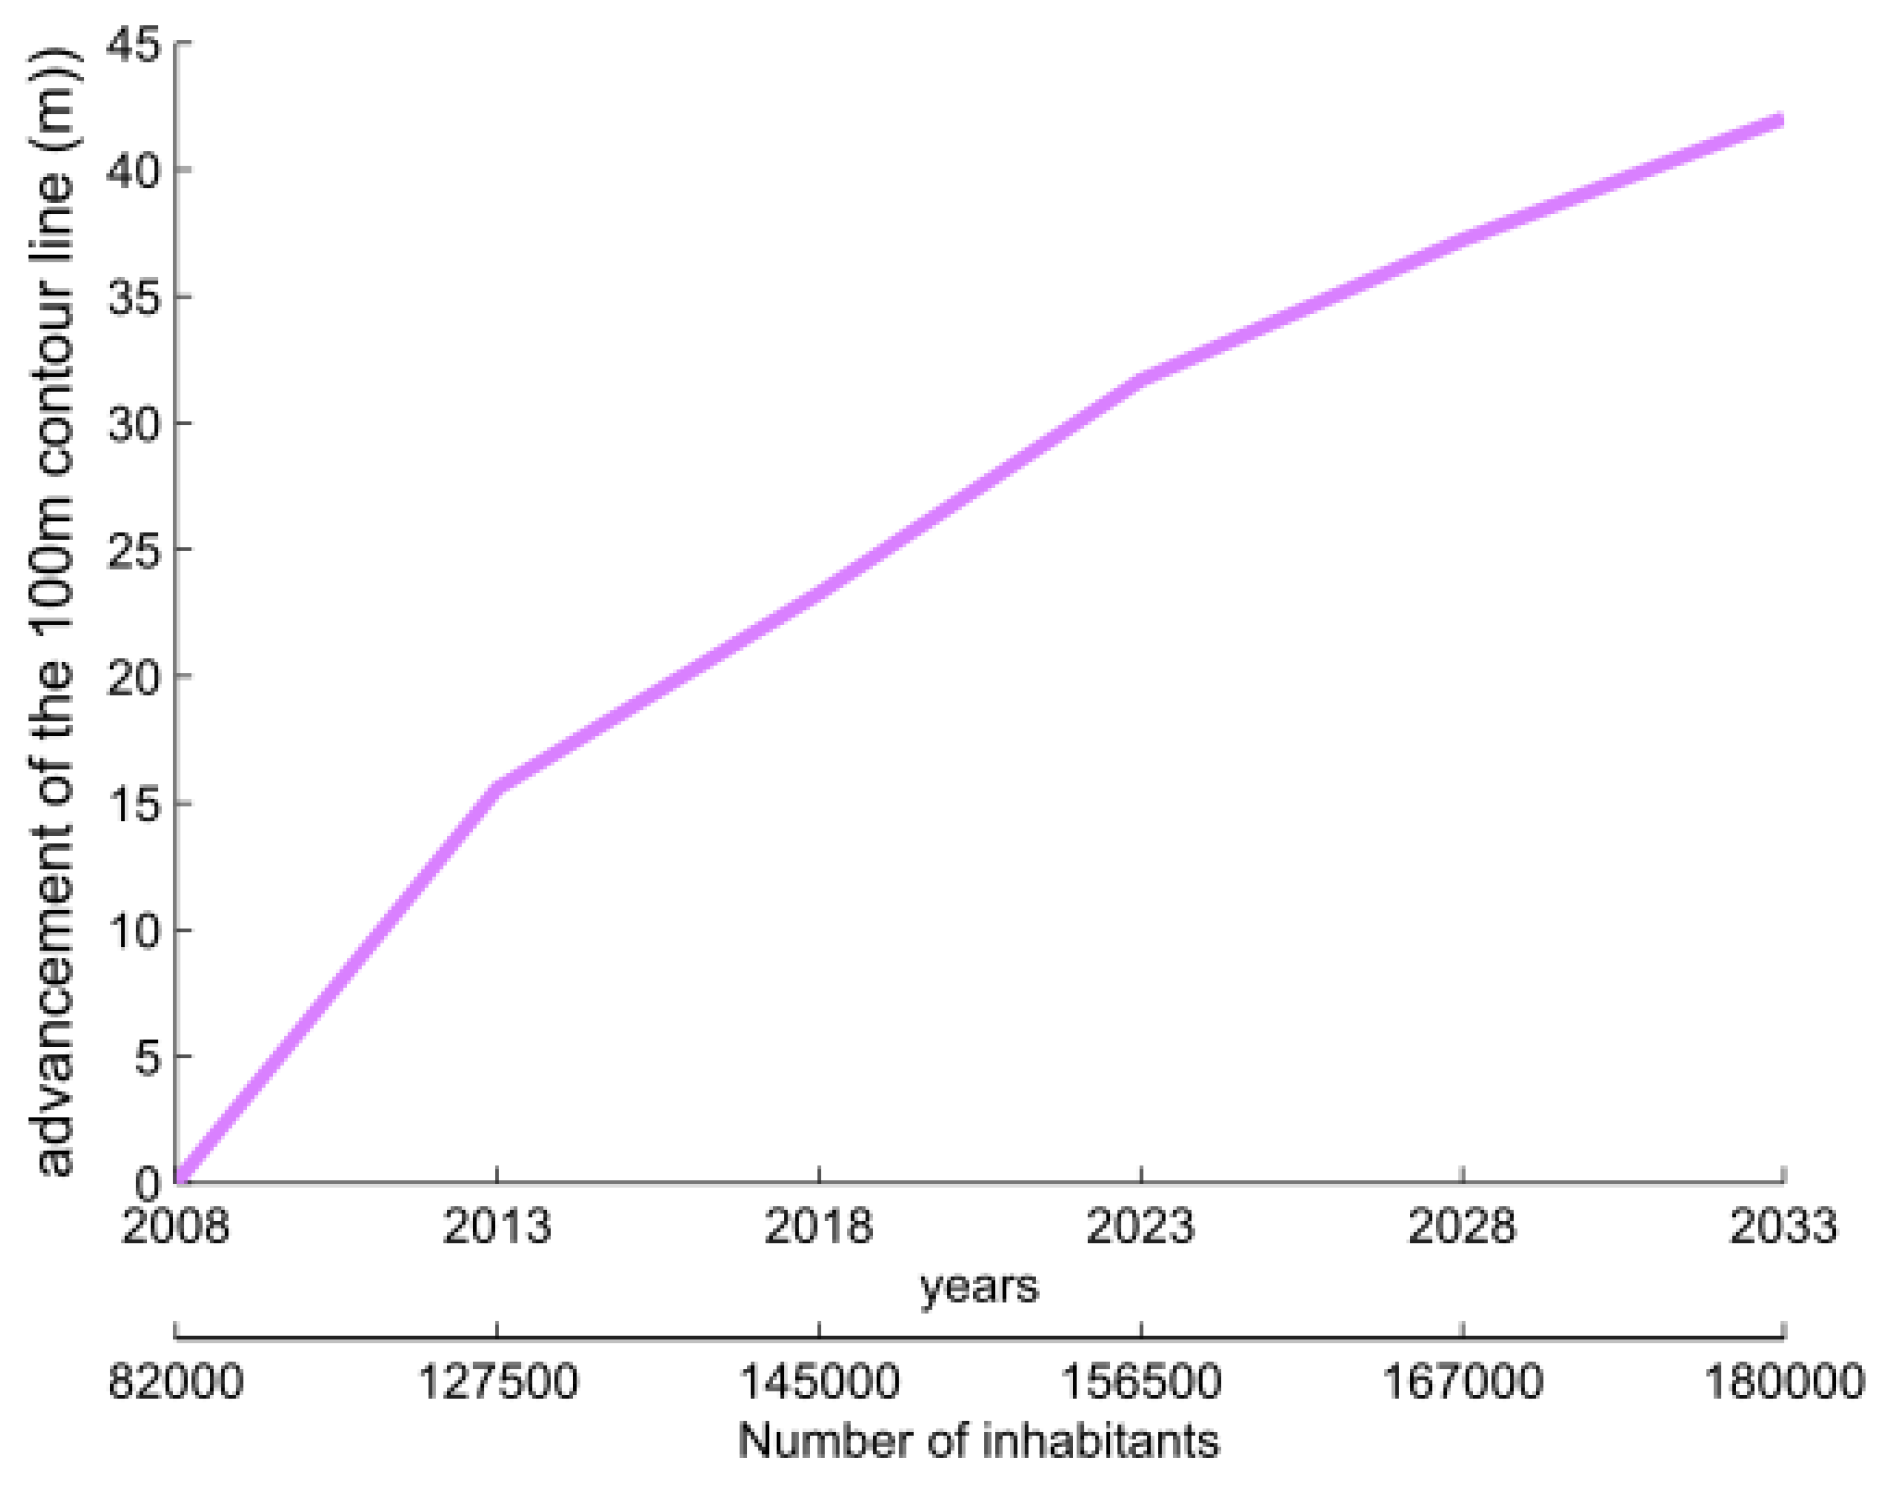
3.2.4. Impact of Syrian Refugee Crisis
Geopolitical instabilities and war in neighboring Syrian have led to a massive population migration across the Mediterranean area and mainly towards Lebanon. Tripoli has been greatly concerned by this migration. Based on the UNHCR (United Nations High Commissioner for Refugees) reports, there are about one million registered Syrian refugees in Lebanon. These reports show that the number of refugees living in the study zone increased from 40,000 in 2013 to 50,000 in 2018. The population growth increases the demand on freshwater and aggravates the situation of seawater intrusion. Table 4 shows the number of inhabitants with respect to years.
An assessment of the impact of this additional number of inhabitants, supposing that they will stay in Lebanon until 2033 with the same rate of consumption of freshwater (250 liters per capita per day) and the same rate of demographic growth, has been done. Figure 11 shows the impact of the Syrian refugees on the median advancement inland of the seawater/freshwater interface in meters with respect to the number of inhabitants and years.
In order to assess the impact of the immigration crisis on the seawater intrusion in the Tripoli aquifer, a comparison between the maximal and median advancement on land of the seawater intrusion in the case of the presence and absence of Syrian refugees is shown in Table 5. The median advancement will change from 2.5 m to 16 m if no migration patterns were considered from 2013 to 2033, while the interface moves from 19 m to 43 m by considering the migration patterns. Concerning the maximal advancement, it is estimated around 14–41 m if we do not consider the migration patterns and from 50 m to 102 m if we consider them. As a conclusion, the migration patterns will double the advancement of the seawater/freshwater interface.
3.3. Contribution of Each Projection to Global Change
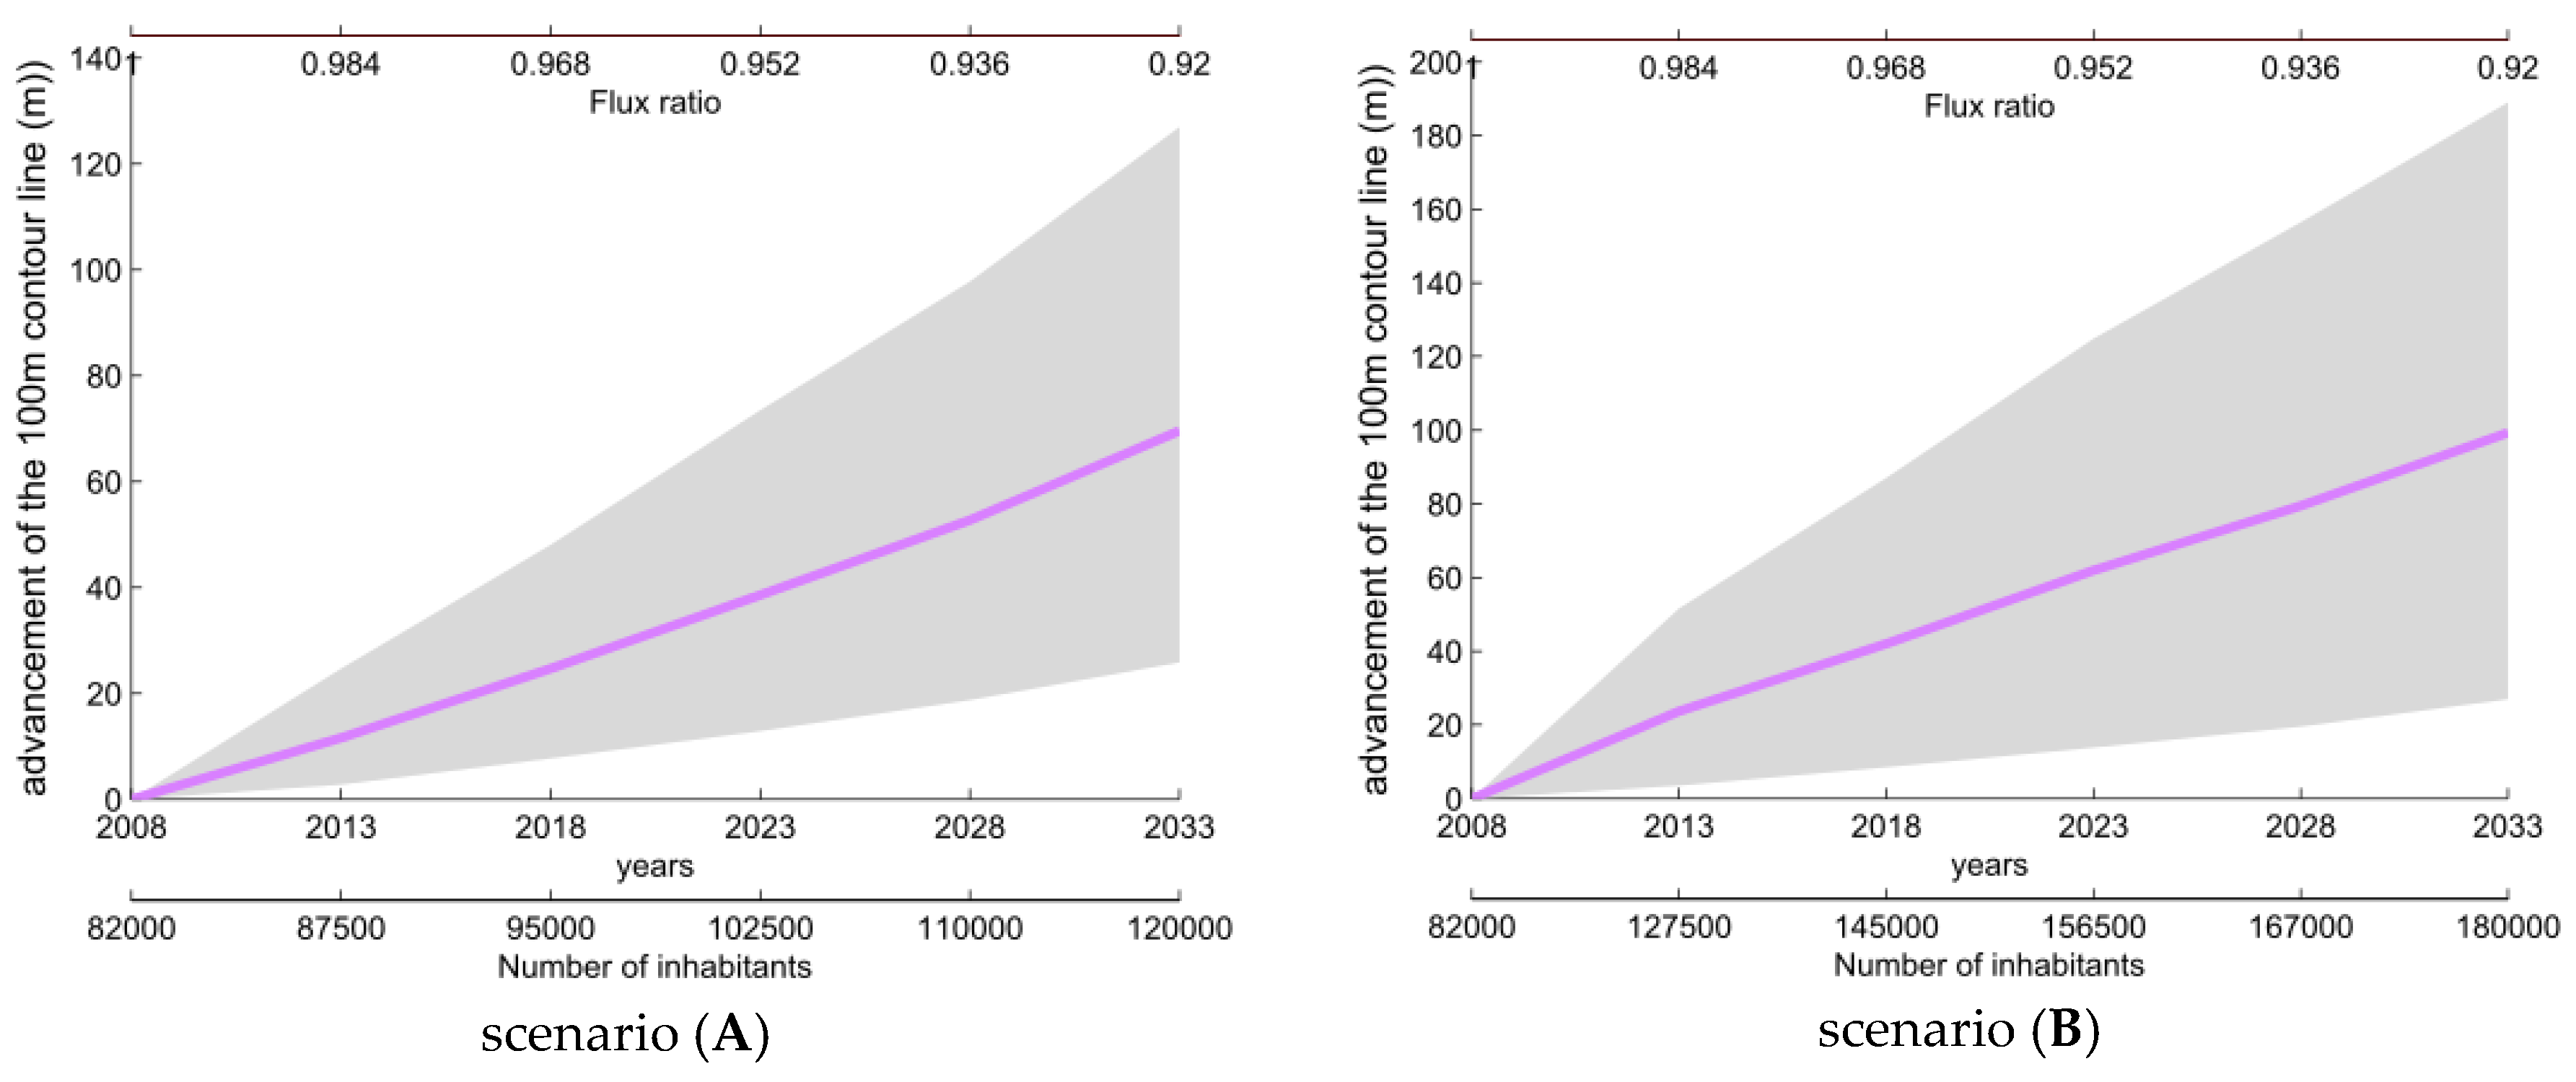
Actually, all parameters impact the seawater interface displacement in the same direction, hence the importance of combining the impact of parameters in order to evaluate the situation of the Tripoli aquifer in 2033. Both scenarios of the number of inhabitants have been considered. In scenario A, we consider that the Syrian refugees go back to their country, and in scenario B, we consider that they will stay in Lebanon until 2033. Figure 12 shows the advancement inland of the 100 m level set of the interface g in meters with respect to the number of inhabitants, years, and flux ratio for both scenarios.
Table 6 shows that climate change has the highest proportion of advancement in scenario (A), while Table 7 shows that the freshwater extraction and climate change have approximately the same proportion in the coming years. The Syrian refugee will cause an additional advancement of about 35 m in the 15 years to come.
4. Discussion
The purple line in Figure 12 shows that in 2033, the median advancement of the interface g is 70.75 m in scenario (A) and 102.75 m in scenario (B). The impact of sea level rise is negligible (1%). A minor effect of the sea rise in a non-confined aquifer if the hydraulic gradient is greater than 0.001 has been shown in [3]. UNDP (United Nations Development Programme) measurements [29] showed that the minimum hydraulic gradient in the lower zone of Tripoli is 1.8 × 10⁻³ m/m. In another context, Chun et al. [30] concluded that the freshwater rate and the sea level rise should be considered for the accurate assessment of climate change impacts in a Korean coastal groundwater system. A suggestion that the impact of climate change on seawater intrusion is found to be sensitive to the boundary conditions of the investigated system is given in [31]. They concluded that the impact of the recharge was more important, but areas inside the aquifer were more impacted by sea level rise. This suggests that, depending on the aquifer configuration, the results can change, and in some cases, coastal erosion and flooding should be considered. In our case, the contribution of climate change to the seawater intrusion in terms of the recharge was about 76% at the horizon of year 2033. It decreases to 57% by the horizon of 2033 when considering the impact of permanent migration patterns. Consequently, the impact of the extraction rate is 20% with no migration and 60% if we take into account the refugees’ migration in 2013. The future predictions suggest an aggravation of the seawater intrusion with all scenarios. A high uncertainty is provided with the predictions. Also, the choice of the 100 m level set is conservative here. Actually, while a 103 m advancement of the seawater/freshwater interface corresponding to the 0.5 concentration level is predicted, the contour of the useable water concentration <0.1 is expected to be much more advanced because of the mechanical dispersion in porous media. So, the future predictions are alarming considering the availability of this resource. An over exploitation of groundwater with high salinity levels can lead to major health concerns, such as the rise of hypertension cases as depicted in [32] in a study of seawater intrusion in Bangladesh. Considering that the Lebanese population suffers already from high levels of cardiac and hypertension diseases, salinization of the groundwater can be considered as a national health concern [33]. Moreover, considering the deteriorated state of the water networks in major cities in Lebanon, as in Ras–Beirut Lebanon [10], the use of private wells is widespread even though they are impacted by seawater intrusion.
5. Conclusions
This study investigated how global change affects the situation of seawater intrusion in Tripoli city. The methodology used in [12] that considers the impact of demographic growth is extended to take into account the impact of climate change in terms of sea level rise and recharge and also the impact of migration patterns. The IPCC RC4 predictions were used by integrating the predicted change of precipitations and sea level rise in the seawater intrusion modeling. The impact of migration flow was taken into consideration for the extraction rate. The impact of each parameter was modeled separately from 2008 to 2033, and then, the combination of all parameters was calculated in order to predict the situation in the Tripoli aquifer in the same period. Two scenarios related to the number of inhabitants have been considered. An advancement inland of the seawater/freshwater interface to about 71 m in scenario (A) and 103 m in scenario (B) is predicted. This advancement will touch mainly the highly populated zone in the aquifer, which threatens the groundwater in the whole domain. The contribution of each process to the seawater intrusion phenomena was computed. The results show that the contribution of sea rise is negligible (<1%), if we consider that the shoreline is stabilized. The contribution of climate change impact (76%) is higher than the contribution of demographic growth (22%) if no immigration patterns are considered. Adding the immigration patterns, the contributions are as follows: 57% for climate change and 42% for demographic growth and immigration patterns. In a previous study, [12] concluded that the recommendation of the Ministry of Energy and Water resources in Lebanon of 120 liters per capita, is a reasonable baseline solution for the mitigation of seawater intrusion in the Tripoli aquifer. The results here suggest that the situation will be worsened by migration patterns. In fact, the current study is the first to provide a holistic view of the anthropogenic and climatic changes that impact seawater intrusion in Lebanon, by including the impact of demographic growth, migration due to conflicts, and long-term climatic changes. It suggests that the previous assessment of seawater intrusion studies should also consider the short-term impact of geopolitical crises. It emphasizes the fact that the impact of anthropogenic effects due to crisis in many areas across the world should be taken into consideration with long-term climatic trends. Several studies have addressed the issues of seawater intrusion in Lebanon; however, it can be concluded that considering the importance of this resource, the national observatories should include consistent observations of coastal groundwater quality to support future studies. These studies can then assess advanced remediation solutions at national scale beyond the control of water use that was recommended by the Ministry of Environment.
Author Contributions
Conceptualization, O.K., M.J. and A.A.B.; Methodology, O.K., M.J. and A.A.B.; Formal Analysis, O.K., M.J. and A.A.B.; Writing-Original Draft Preparation, O.K., M.J. and A.A.B.; Writing-Review & Editing, O.K., M.J. and A.A.B.
Funding
This research was mainly funded by the Lebanese University, LaMA-LB.
Acknowledgments
The co-authors would like to acknowledge the IRD (Institut de Recherche pour le Development) and the Mixt International Laboratory O–LIFE for their support of this project.
Conflicts of Interest
The authors declare no conflict of interest.
References
- Rodell, M.; Famiglietti, J.S.; Wiese, D.N.; Reager, J.T.; Beaudoing, H.K.; Landerer, F.W.; Lo, M.H. Emerging trends in global freshwater availability. Nature 2018. [Google Scholar] [CrossRef] [PubMed]
- European Environment Agency. Water Resources in Europe in the Context of Vulnerability: EEA 2012 State of Water Assessment; EEA Report No. 11/2012; European Environment Agency: Copenhagen, Denmark, 2012. [Google Scholar]
- Ferguson, G.; Gleeson, T. Vulnerability of coastal aquifers to groundwater use and climate change. Nat. Clim. Chang. 2012, 2, 342–345. [Google Scholar] [CrossRef]
- Chang, S.W.; Clement, T.P.; Simpson, M.J.; Lee, K.K. Does sea-level rise have an impact on saltwater intrusion? Adv. Water Resour. 2011, 34, 1283–1291. [Google Scholar] [CrossRef] [Green Version]
- Sherif, M.M.; Singh, V.P. Effect of climate change on sea water intrusion in coastal aquifers. Hydrol. Process. 1999, 13, 1277–1287. [Google Scholar] [CrossRef]
- Kerrou, J.; Renard, P.; Cornaton, F.; Perrochet, P. Stochastic forecasts of seawater intrusion towards sustainable groundwater management: Application to the Korba aquifer (Tunisia). Hydrogeol. J. 2013, 21, 425–440. [Google Scholar] [CrossRef]
- Guyennon, N.; Salerno, F.; Portoghese, I.; Romano, E. Climate change adaptation in a Mediterranean semi-arid catchment: Testing managed aquifer recharge and increased surface reservoir capacity. Water 2017, 9, 689. [Google Scholar] [CrossRef]
- Lababidi, H.; Shatila, A.; Acra, A. The progressive salination of groundwater in Beirut, Lebanon. Int. J. Environ. Stud. 1987, 30, 203–208. [Google Scholar] [CrossRef]
- Moujabber, M.E.; Samra, B.B.; Darwish, T.; Atallah, T. Comparison of Different Indicators for Groundwater Contamination by Seawater Intrusion on the Lebanese Coast. Water Resour. Manag. 2006, 20, 161–180. [Google Scholar] [CrossRef]
- Korfali, S.I.; Jurdi, M. Assessment of domestic water quality: Case study, Beirut, Lebanon. Environ. Monit. Assess. 2007, 135, 241–251. [Google Scholar] [CrossRef] [PubMed]
- Halwani, J.; Omar, W.; Alkadi, F. Intrusion Saline à Tripoli; Internal Report; Lebanese University: Tripoli, Lebanon, 2010. [Google Scholar]
- Kalaoun, O.; Al Bitar, A.; Gastellu-Etchegorry, J.P.; Jazar, M. Impact of Demographic Growth on Seawater Intrusion: Case of the Tripoli Aquifer, Lebanon. Water 2016, 8, 104. [Google Scholar] [CrossRef]
- Bear, J. Hydraulics of Groundwater; Mc Grraw-Hill: Mineola, NY, USA, 1979. [Google Scholar]
- Jazar, M.; Monneau, R. Derivation of seawater intrusion models by formal asymptotics. SIAM J. Appl. Math. 2014, 74, 1152–1173. [Google Scholar] [CrossRef]
- Bates, B.; Kundzewicz, Z.W.; Wu, S.; Palutikof, J. Climate Change and Water; Intergovernmental Panel on Climate Chang (IPCC): Geneva, Switzerland, 2008. [Google Scholar]
- Haramadiyan, D. Report to the Municipality of Tripoli; Tripoli Municipality: Tripoli, Lebanon, 2004. [Google Scholar]
- Amin, I.E. Groundwater mining in the Tripoli area, Lebanon. In Proceedings of the Denver Annual Meeting, Denver, CO, USA, 27–30 October 2002. [Google Scholar]
- Khair, K.; Khawlie, M.; Haddad, F.; Barazangi, M.; Seber, D.; Chaimov, T. Bouguer gravity and crustal structure of the Dead Sea transform fault and adjacent mountain belts in Lebanon. Geology 1993, 21, 739–742. [Google Scholar] [Green Version]
- Diersch, H.J.; Kolditz, O. Variable-density flow and transport in porous media: Approaches and challenges. Adv. Water Resour. 2002, 25, 899–944. [Google Scholar] [CrossRef]
- Najib, K.; Rosier, C. On the global existence for a degenerate elliptic-parabolic seawater intrusion problem. Math. Comput. Simul. 2011, 81, 2282–2295. [Google Scholar] [CrossRef]
- Choquet, C.; Diédhiou, M.M.; Rosier, C. Mathematical analysis of a sharp–diffuse interfaces model for seawater intrusion. J. Differ. Equat. 2015, 259, 3803–3824. [Google Scholar] [CrossRef]
- Alkhayal, J.; Issa, S.; Jazar, M.; Monneau, R. Existence result for degenerate cross-diffusion system with application to seawater intrusion. ESAIM COCV 2017. [Google Scholar] [CrossRef]
- Hecht, F. New development in FreeFem++. J. Numer. Math. 2012, 20, 251–265. [Google Scholar] [CrossRef]
- Bakker, M.; Strack, O. Analytic elements for multi aquifer flow. J. Hydrol. 2003, 271, 119–129. [Google Scholar] [CrossRef]
- Theon, J.S. Global warming and environmental changes on the surface of the earth. In Proceedings of the Memorial Seminar of the Silver Jubilee on the Occasion of the XXV IAHR Biennial Congress, Tokyo, Japan, 30 August–9 September 1993. [Google Scholar]
- Cazenave, A.; Dieng, H.B.; Meyssignac, B.; von Schuckmann, K.; Decharme, B.; Berthier, E. The rate of sea-level rise. Nat. Clim. Chang. 2014, 4, 358–361. [Google Scholar] [CrossRef]
- Dieng, H.B.; Cazenave, A.; Meyssignac, B.; Ablain, M. New estimate of the current rate of sea level rise from a sea level budget approach. Geophys. Res. Lett. 2017, 44, 3744–3751. [Google Scholar] [CrossRef]
- Field, C.B.; Barros, V.R.; Mach, K.; Mastrandrea, M. Climate Change 2014: Impacts, Adaptation, and Vulnerability, 1; Cambridge University Press: Cambridge, UK; New York, NY, USA, 2014. [Google Scholar]
- Khayat, Z. Assessment of the National Groundwater Resources of Lebanon; Implemented by Joint–Venture ELARD BURGEAP–IGIP and Ribeka on Behalf of the UNDP; Ministry of Energy and Water: Beirut, Lebanon, 2014.
- Chun, J.A.; Lim, C.; Kim, D.; Kim, J.S. Assessing Impacts of Climate Change and Sea-Level Rise on Seawater Intrusion in a Coastal Aquifer. Water 2018, 10, 357. [Google Scholar] [CrossRef]
- Rasmussen, P.; Sonnenborg, T.O.; Goncear, G.; Hinsby, K. Assessing impacts of climate change, sea level rise, and drainage canals on saltwater intrusion to coastal aquifer. Hydrol. Earth Syst. Sci. 2013, 17, 421–443. [Google Scholar] [CrossRef]
- Vineis, P.; Chan, Q.; Khan, A. Climate change impacts on water salinity and health. J. Epidemiol. Glob. Health 2011, 1, 5–10. [Google Scholar] [CrossRef] [PubMed]
- Tohme, R.A.; Jurjus, A.R.; Estephan, A. The prevalence of hypertension and its association with other cardiovascular disease risk factors in a representative sample of the Lebanese population. J. Hum. Hypertens. 2005, 19, 861. [Google Scholar] [CrossRef] [PubMed]
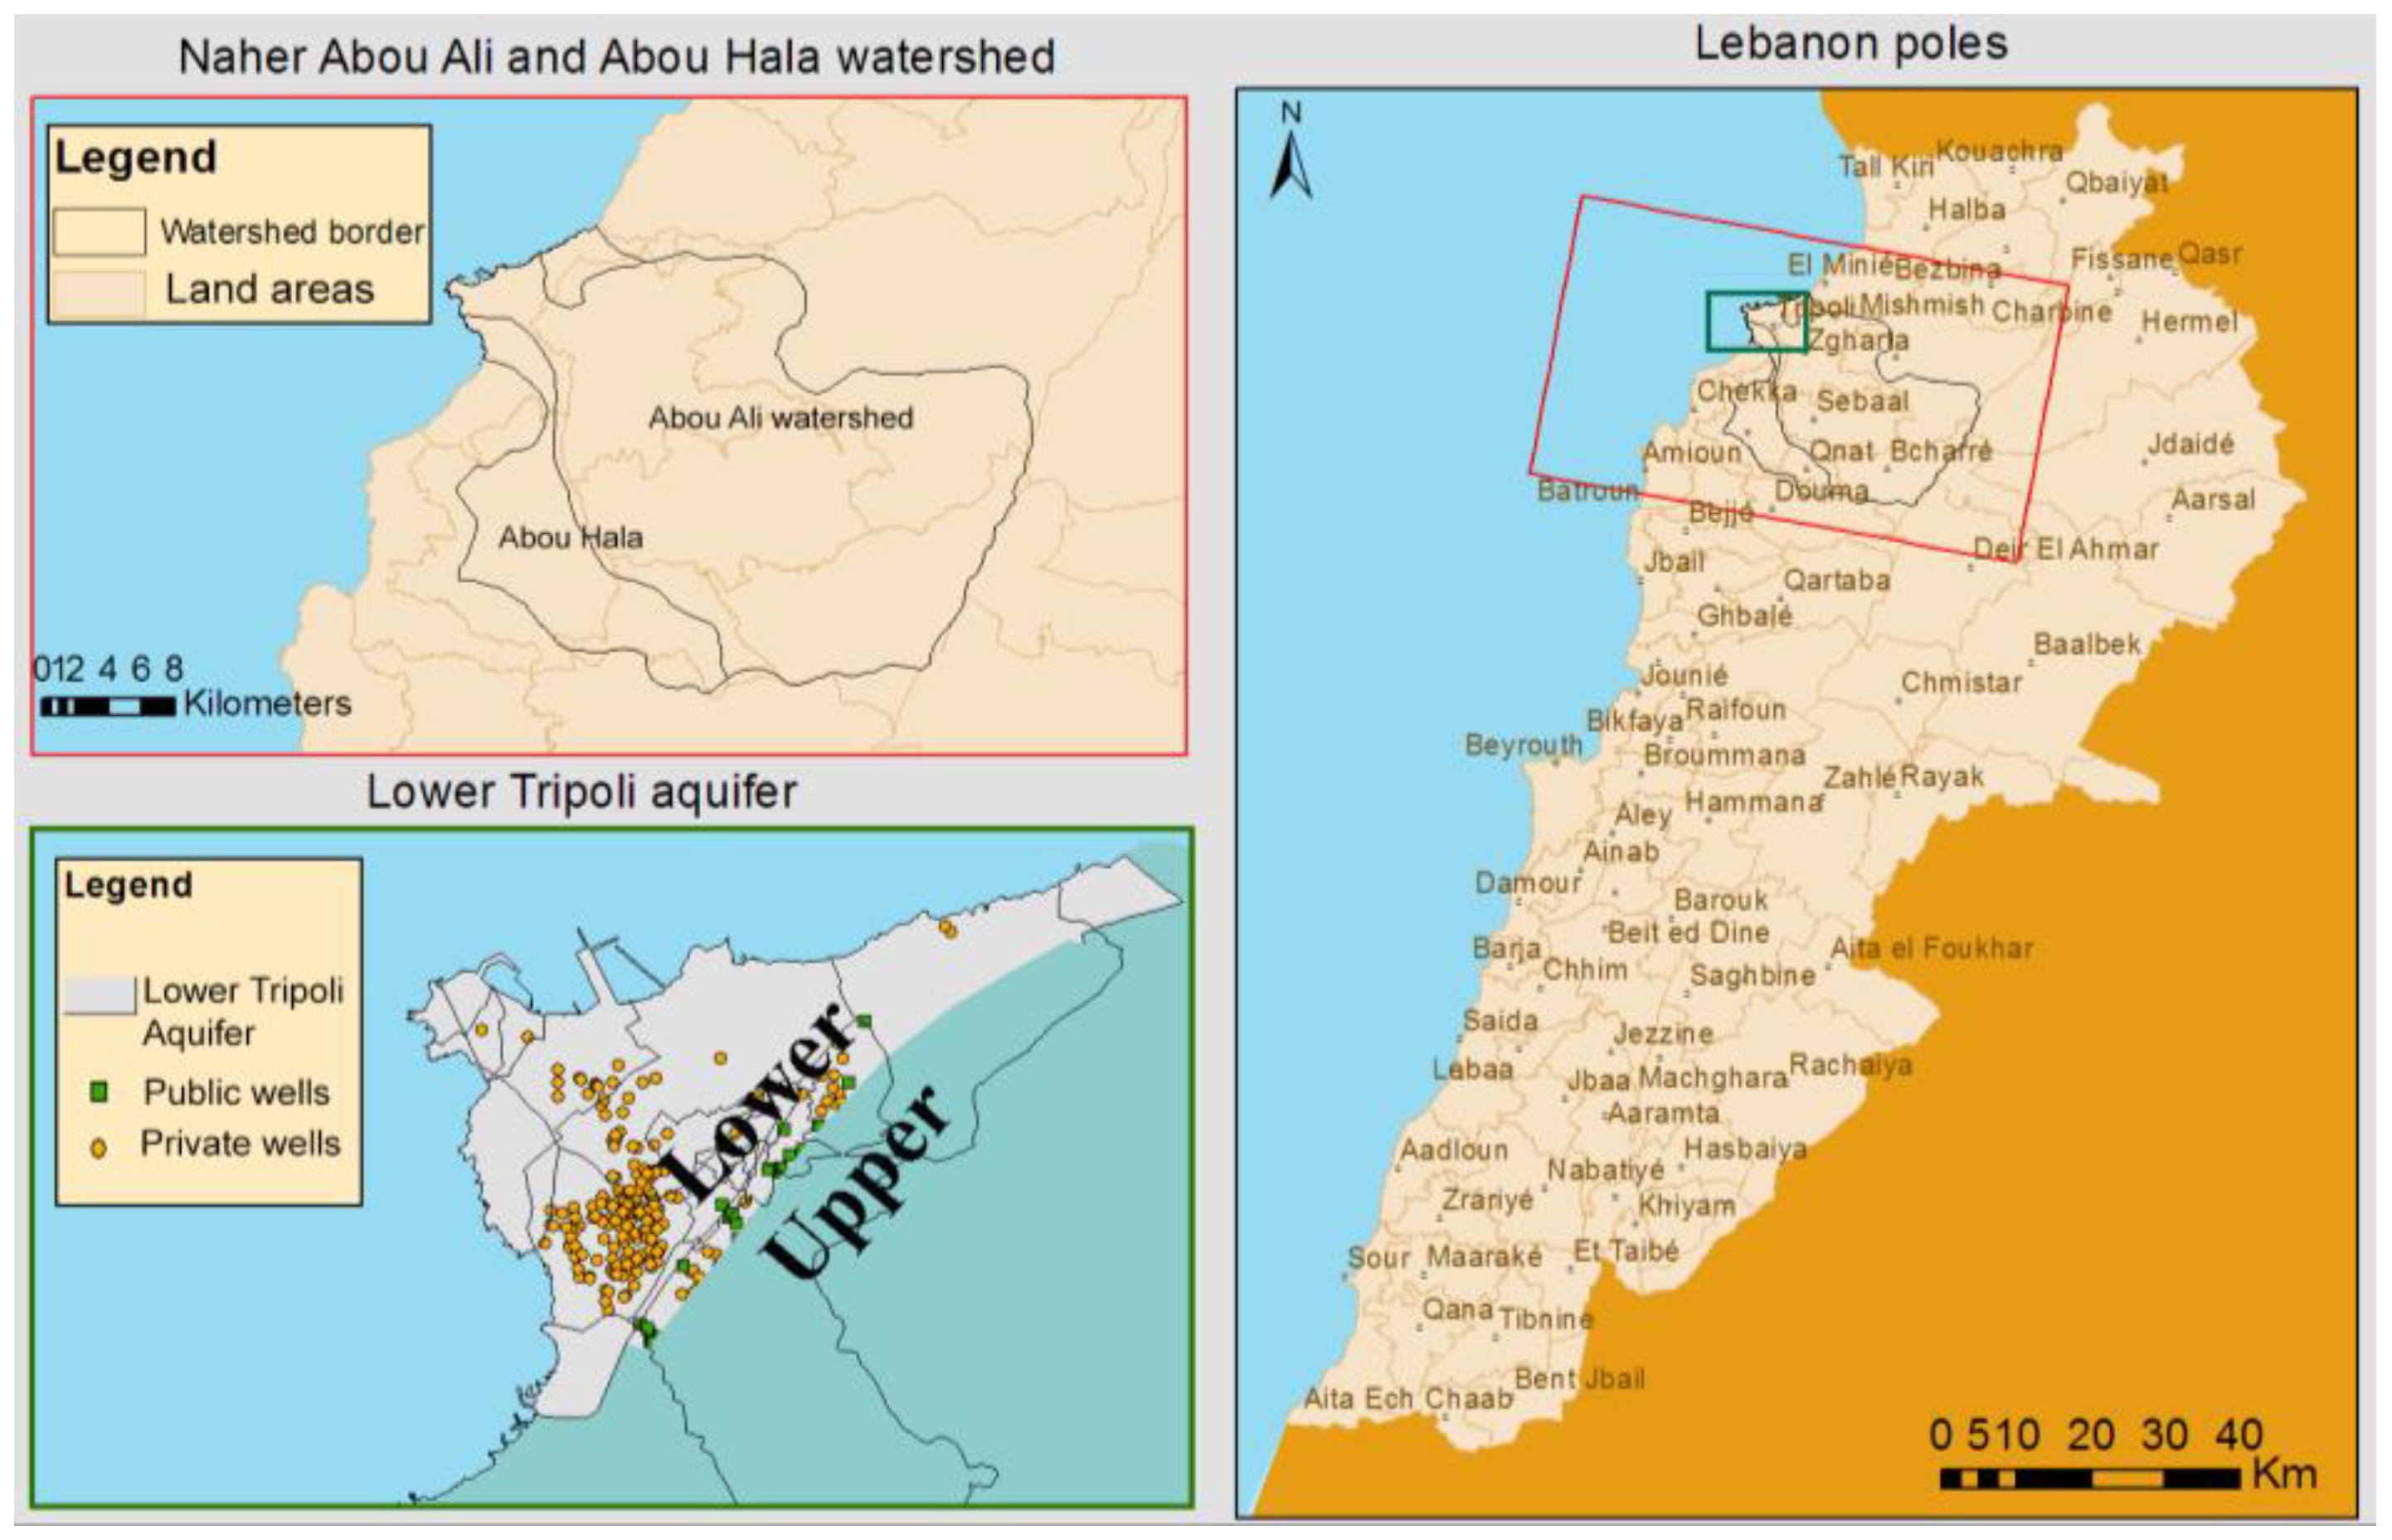
Figure 1.
Location map of rivers, watersheds, study area, and well positions, after Kalaoun et al. (2016) [12].
Figure 1.
Location map of rivers, watersheds, study area, and well positions, after Kalaoun et al. (2016) [12].

Figure 2.
Geological map and stratigraphy of Tripoli, after Kalaoun et al. (2016) [12].
Figure 2.
Geological map and stratigraphy of Tripoli, after Kalaoun et al. (2016) [12].

Figure 3.
The lower zone of Tripoli city with the location of the pumping zone.

Figure 4.
Advancement of the 100 meter level set of the seawater/freshwater interface for different sea level rises: (a) 50 cm; (b) 100 cm; (c) 150 cm; and (d) 200 cm.
Figure 4.
Advancement of the 100 meter level set of the seawater/freshwater interface for different sea level rises: (a) 50 cm; (b) 100 cm; (c) 150 cm; and (d) 200 cm.
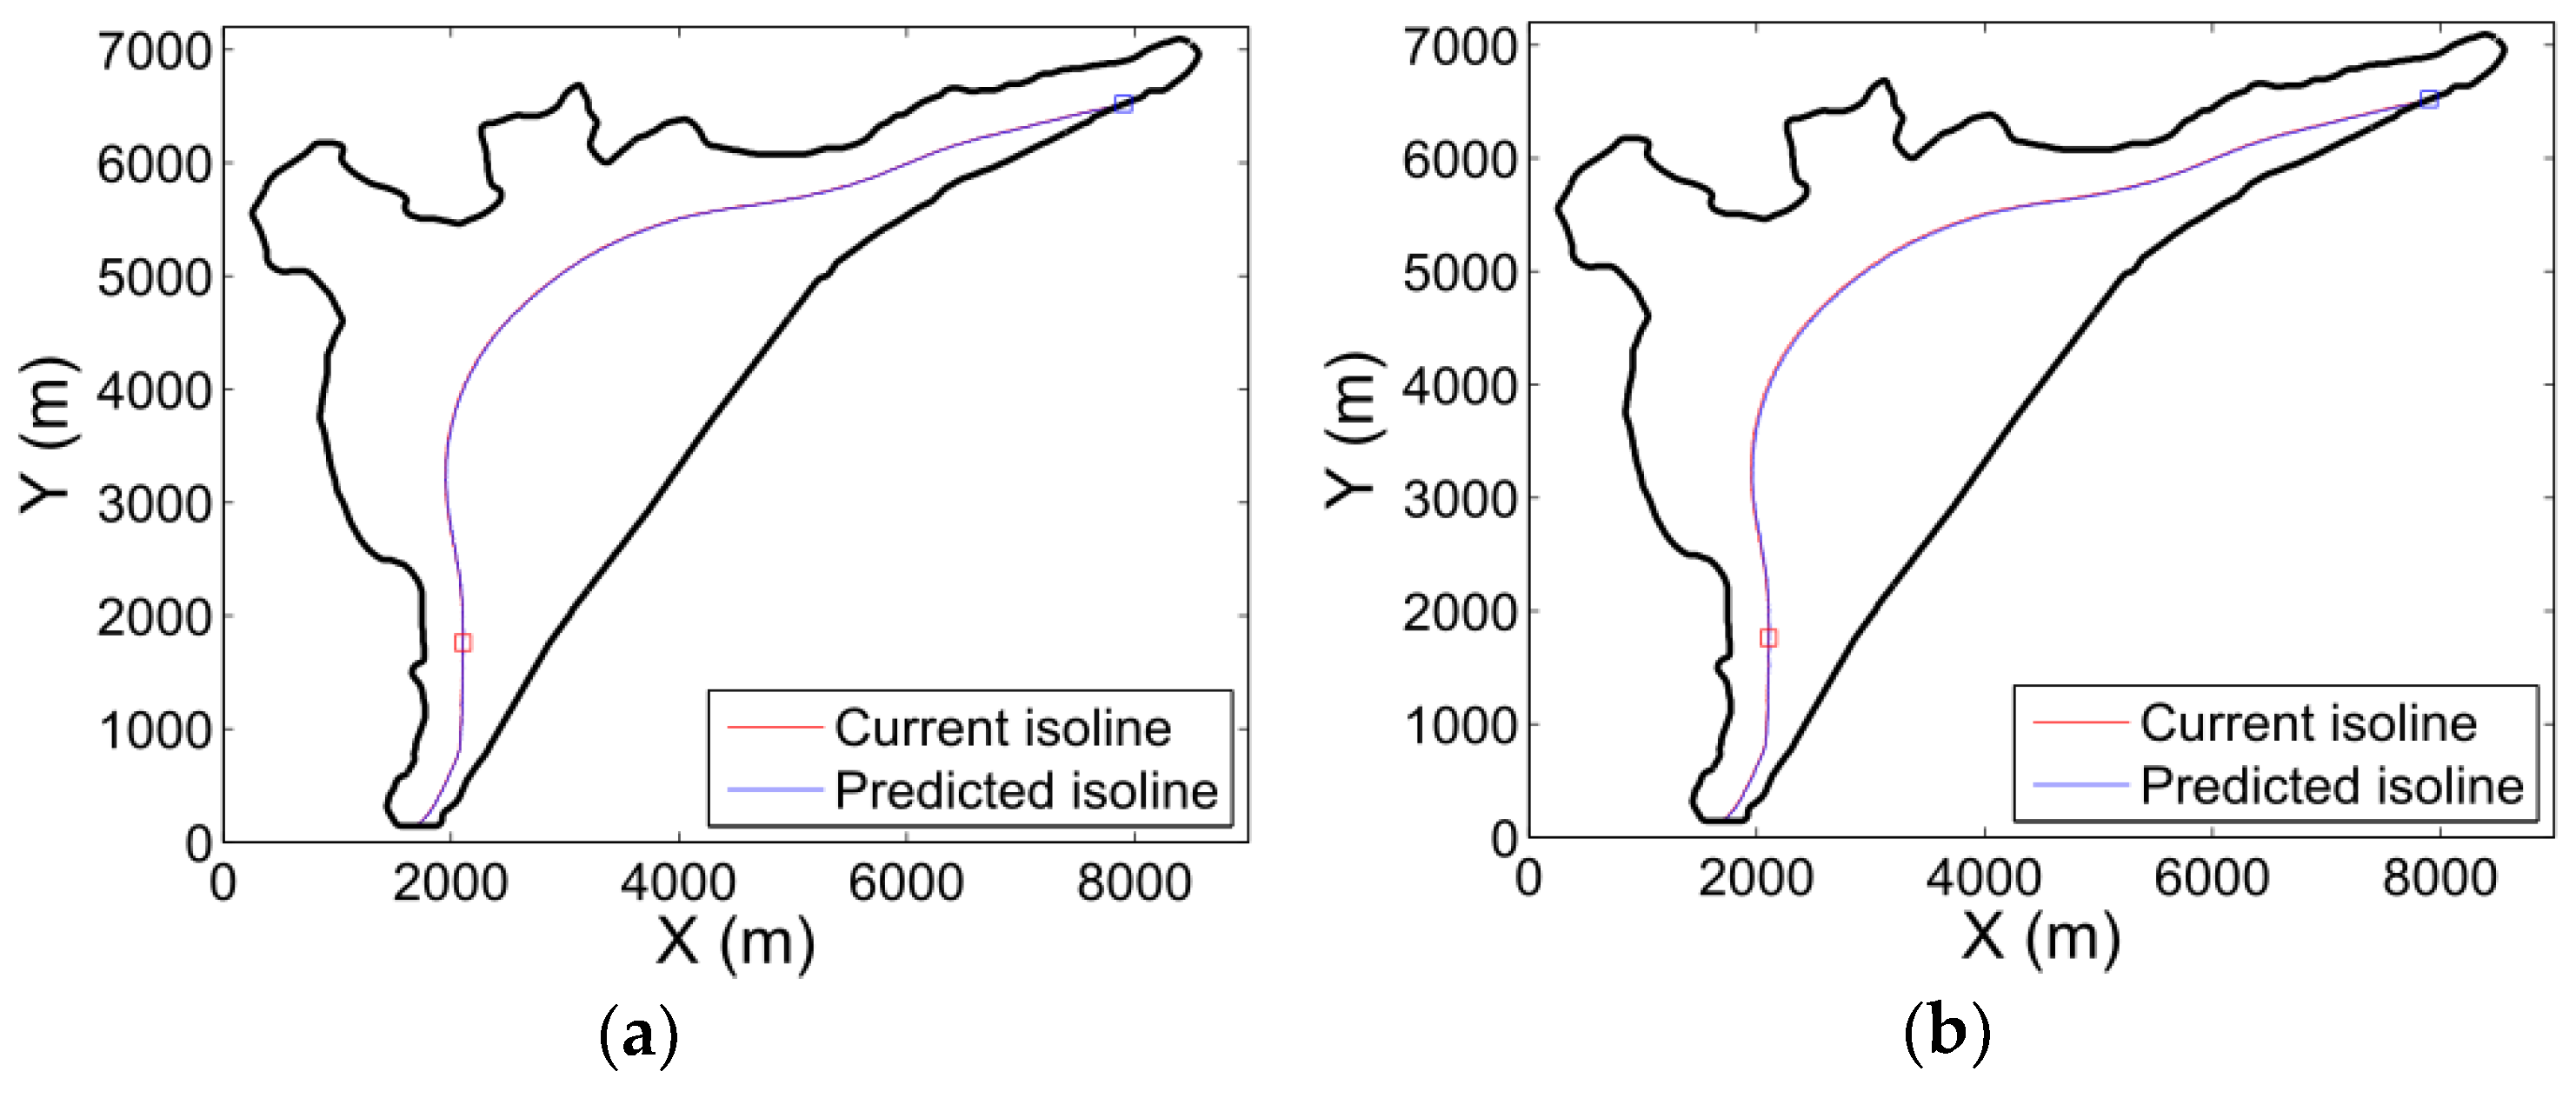

Figure 5.
Position of the 100 m level set of the seawater/freshwater interface for different values of flux: (a) 20% reduction; (b) 15% reduction; (c) 10% reduction; (d) 5% reduction; (e) 5% increase; (f) 10% increase; (g) 15% increase; and (h) 20% increase.
Figure 5.
Position of the 100 m level set of the seawater/freshwater interface for different values of flux: (a) 20% reduction; (b) 15% reduction; (c) 10% reduction; (d) 5% reduction; (e) 5% increase; (f) 10% increase; (g) 15% increase; and (h) 20% increase.


Figure 6.
Seawater/freshwater interface position with respect to rate of flux.

Figure 7.
Position of the 100 meter level set of the seawater/freshwater interface using a multiplication coefficient for the extraction of (a) 1.25; (b) 1.5; (c) 1.75; and (d) 2.
Figure 7.
Position of the 100 meter level set of the seawater/freshwater interface using a multiplication coefficient for the extraction of (a) 1.25; (b) 1.5; (c) 1.75; and (d) 2.


Figure 8.
Advancement inland of the 100 m contour line of the seawater/freshwater interface with respect to sea level rise and years: (a) 4 mm per year; (b) 6 mm per year.
Figure 8.
Advancement inland of the 100 m contour line of the seawater/freshwater interface with respect to sea level rise and years: (a) 4 mm per year; (b) 6 mm per year.

Figure 9.
Advancement inland of the 100 m contour line of the seawater/freshwater interface with respect to flux ratio and years.
Figure 9.
Advancement inland of the 100 m contour line of the seawater/freshwater interface with respect to flux ratio and years.

Figure 10.
Advancement inland of the 100 m contour line of the seawater/freshwater interface with respect to the number of inhabitants and years.
Figure 10.
Advancement inland of the 100 m contour line of the seawater/freshwater interface with respect to the number of inhabitants and years.

Figure 11.
Advancement inland of the 100 m contour line of the seawater/freshwater interface with respect to the number of Lebanese and Syrian inhabitants and years.
Figure 11.
Advancement inland of the 100 m contour line of the seawater/freshwater interface with respect to the number of Lebanese and Syrian inhabitants and years.

Figure 12.
Advancement inland of the 100 m contour line of the seawater/freshwater interface with respect to flux ratio, years, and number of inhabitants in scenarios (A) and (B).
Figure 12.
Advancement inland of the 100 m contour line of the seawater/freshwater interface with respect to flux ratio, years, and number of inhabitants in scenarios (A) and (B).


Table 1.
Advancement inland of the seawater/freshwater interface (m) with respect to sea level rise.
Table 1.
Advancement inland of the seawater/freshwater interface (m) with respect to sea level rise.
| Sea Level Rise (cm) | Minimal Advance (m) | Maximal Advance (m) |
|---|---|---|
| 50 | 1.3 | 28 |
| 100 | 2.8 | 44.8 |
| 150 | 4.2 | 76.4 |
| 200 | 5.3 | 98 |
Table 2.
Advancement inland of the seawater/freshwater interface (m) with respect to the rate change of flux.
Table 2.
Advancement inland of the seawater/freshwater interface (m) with respect to the rate change of flux.
| Rate Change of Flux | Minimal Advance (m) | Maximal Advance (m) |
|---|---|---|
| −20% | 80 | 230 |
| −15% | 50 | 165 |
| −10% | 29 | 105 |
| −5% | 9 | 50 |
| +5% | 15 | 65 |
| +10% | 20 | 90 |
| +15% | 36 | 130 |
| +20% | 50 | 160 |
Table 3.
Median advancement inland of the interface with variable incoming flux.
| Multiplicative Coefficient | Median Advancement (m) |
|---|---|
| 1.25 | 13 |
| 1.5 | 17 |
| 1.75 | 26 |
| 2 | 35 |
Table 4.
Projection of the number of inhabitants in the area of interest without and with the consideration of migration movements.
Table 4.
Projection of the number of inhabitants in the area of interest without and with the consideration of migration movements.
| Year | Number of Inhabitants without Considering the Migration | Number of İnhabitants Considering the Migration |
|---|---|---|
| 2013 | 87,500 | 127,500 |
| 2018 | 95,000 | 145,000 |
| 2023 | 102,500 | 156,500 |
| 2028 | 110,000 | 167,000 |
| 2033 | 120,000 | 180,000 |
Table 5.
Impact of migration patterns on the maximal and median advancement on land of the seawater/freshwater interface.
Table 5.
Impact of migration patterns on the maximal and median advancement on land of the seawater/freshwater interface.
| Year | Without Refugees | With Refugees | ||
|---|---|---|---|---|
| Maximal Advance | Median Advance | Maximal Advance | Median Advance | |
| 2013 | 14 | 2.5 | 50 | 15 |
| 2018 | 20 | 5.5 | 64 | 24 |
| 2023 | 26 | 8.5 | 75 | 32 |
| 2028 | 32 | 12 | 87 | 37 |
| 2033 | 41 | 16 | 102 | 43 |
Table 6.
Proportion of impact for each parameter in scenario (A).
| Year | Sea Rise | Change of Inflow | Extraction Rate | Total | |||
|---|---|---|---|---|---|---|---|
| m | % | m | % | m | % | m | |
| 2013 | 0.10 | 0.7% | 10 | 79.3% | 2.50 | 19.8% | 12.60 |
| 2018 | 0.25 | 0.9% | 22 | 79.2% | 5.50 | 19.8% | 27.75 |
| 2023 | 0.45 | 1.1% | 31 | 77.5% | 8.50 | 21.2% | 39.95 |
| 2028 | 0.63 | 1.1% | 43 | 77.2% | 12.00 | 21.5% | 55.63 |
| 2033 | 0.75 | 1% | 54 | 76.3% | 16.00 | 22.6% | 70.75 |
Table 7.
Proportion of impact for each parameter in scenario (B).
| Year | Sea Rise | Change of Inflow | Extraction Rate | Total | |||
|---|---|---|---|---|---|---|---|
| m | % | m | % | m | % | m | |
| 2013 | 0.10 | 0.3% | 10.00 | 39.8% | 15.00 | 59.7% | 25.10 |
| 2018 | 0.25 | 0.5% | 22.00 | 48.6% | 24.00 | 53% | 46.25 |
| 2023 | 0.45 | 0.7% | 31.00 | 48.8% | 32.00 | 50.4% | 63.45 |
| 2028 | 0.63 | 0.7% | 43.00 | 52% | 37.00 | 44.7% | 80.63 |
| 2033 | 0.75 | 0.7% | 59.00 | 57% | 43.00 | 42.1% | 102.75 |
© 2018 by the authors. Licensee MDPI, Basel, Switzerland. This article is an open access article distributed under the terms and conditions of the Creative Commons Attribution (CC BY) license (http://creativecommons.org/licenses/by/4.0/).
Share and Cite
MDPI and ACS Style
Kalaoun, O.; Jazar, M.; Al Bitar, A. Assessing the Contribution of Demographic Growth, Climate Change, and the Refugee Crisis on Seawater Intrusion in the Tripoli Aquifer. Water 2018, 10, 973. https://doi.org/10.3390/w10080973
AMA Style
Kalaoun O, Jazar M, Al Bitar A. Assessing the Contribution of Demographic Growth, Climate Change, and the Refugee Crisis on Seawater Intrusion in the Tripoli Aquifer. Water. 2018; 10(8):973. https://doi.org/10.3390/w10080973
Chicago/Turabian StyleKalaoun, Omar, Mustapha Jazar, and Ahmad Al Bitar. 2018. "Assessing the Contribution of Demographic Growth, Climate Change, and the Refugee Crisis on Seawater Intrusion in the Tripoli Aquifer" Water 10, no. 8: 973. https://doi.org/10.3390/w10080973
Note that from the first issue of 2016, this journal uses article numbers instead of page numbers. See further details here.