Article

Evaluation of the Effect of Wind Velocity and Soil Moisture Condition on Soil Erosion in Andosol Agricultural Fields (Model Experiment)

Department of Environmental Sciences, Faculty of Agriculture, Saga University, Saga 8408502, Japan
*
Author to whom correspondence should be addressed.
Water 2019, 11(1), 98; https://doi.org/10.3390/w11010098
Submission received: 8 December 2018 / Revised: 29 December 2018 / Accepted: 31 December 2018 / Published: 8 January 2019
(This article belongs to the Section Hydrology)

Abstract

:
Soil erosion by the wind is an important phenomenon in drastic soil degradation. In Japan, andosol agricultural field is eroded by the wind and agricultural productivity is significantly affected. The aim of this study was to evaluate the effect of wind velocity and soil moisture condition on the soil erosion in andosol agricultural fields. Also, we determined the timing and amount of irrigation water needed to prevent soil erosion by the wind with respect to the wind and soil moisture conditions. A numerical model to simulate airflow in bare andosol field was developed using a continuity equation and Navier Stokes equations. Wind tunnel experiments which described a bare andosol field were performed to measure the degree of soil erosion for four levels of soil moisture condition and five wind velocities. Using the measured amount of soil transferred by wind, the erodibility parameter in Bagnold’s method that quantifies soil erosion was estimated inversely for four soil moisture values. The amounts of soil erosion calculated using this parameter were in good agreement with the measured amounts. These results indicate that the soil moisture and wind conditions under which soil erosion occurs can be determined and the amount of soil erosion can be predicted. Using these conditions and the erodibility parameter, the amount of irrigation needed for the prevention of soil erosion was quantified and the effect of irrigation on soil erosion was evaluated.

1. Introduction

Soil degradation is a very serious environmental problem [1,2]. The United Nations Environment Programme reported that the main cause of soil degradation is erosion by wind and water, which has damaged two billion hectares of agricultural fields [3].
Soil erosion by the wind is an important phenomenon in drastic soil degradation and it exacerbates desertification [4]. The mechanism of soil erosion by the wind has been researched with respect to desertification control in arid or semi-arid areas. Bagnold [5,6] studied the motion of sand transferred by wind and developed a method to quantify the transferred amount using friction velocity. Kawamura [7] modified Bagnold’s method and introduced the concept of critical friction velocity, which is the threshold for soil erosion. Also, wind tunnel experiment has been used as an effective method to clarify the soil erosion processes by wind [8,9,10]. Using these methods, numerical models have been developed for predicting soil erosion by the wind on a relatively large scale [11,12,13,14].
The above-mentioned methods were developed for sandy and large-scale soil erosion by the wind in arid or semi-arid areas. However, the soil erosion by the wind also inflicts serious damage to agricultural fields located in relatively humid areas, such as Japan, because of the loss of fertile soil, seeds, and nursery plants [15,16]. About 50% of Japanese agricultural fields are classified as andosol and the base materials of andosol are volcanic ash and humus [17]. Andosol have high clay content, well-developed aggregate structures, high soil water retention, and high hydraulic conductivity, and are very fertile [18,19,20]. However, the dry density and the resistance to the soil erosion are quite low [21]. Various methods to protect andosol agricultural fields from the soil erosion by the wind include windbreak hedges and nets, ground cover plants, and mulching [15,16,22,23,24,25]. Because these methods are expensive, irrigation has been introduced to control soil moisture and prevent soil erosion by the wind [26]. Kawata and Tsuchiya [27] evaluated the effect of soil moisture condition on sand movement and showed that controlling the moisture condition of the soil is important in the prevention of soil erosion by the wind. The effect of the soil moisture condition on erodibility was clarified by a wind tunnel experiment [28] and the soil erosion threshold parameters, including soil moisture condition and wind velocity in sandy soil were clarified by wind tunnel experiment [29]. These studies showed that controlling the soil moisture condition is effective in preventing soil erosion by the wind in sandy fields; however, research on the prevention of erosion of soil with high clay content, including andosol, has not yet been performed and an optimal irrigation regime to prevent the soil erosion by the wind in andosol agricultural fields has not been developed.
The aim of this study was to evaluate the effect of wind velocity and soil moisture condition on soil erosion by the wind in andosol agricultural fields. Also, we determined the timing and amount of irrigation needed to prevent soil erosion by the wind with respect to the wind and soil moisture conditions. A numerical model to simulate airflow in bare andosol field was developed using a continuity equation and Navier Stokes equations. This method is effective for clarifying the micro-scale advection in the irrigated-soil surface and airflow distribution in the agricultural field considering the crop canopy [30,31]. Wind tunnel experiments which described a bare andosol field were performed to measure the amount of soil erosion for four levels of soil moisture condition and five wind velocities to determine erodibility parameter. Using the erodibility parameter, scenario analyses were performed to quantify the amount of irrigation needed for the prevention of soil erosion and evaluate the effect of irrigation on soil erosion.

2. Methodology

2.1. Numerical Model to Simulate Airflow over a Bare Soil Field

Airflow over a bare soil field can be described by the following continuity equation and Navier-Stokes equations:
u x + v z = 0
u t + u u x + v u z = 1 ρ p x + x ( K a u x ) + z ( K a u z )
v t + u v x + v v z = 1 ρ p z + x ( K a v x ) + z ( K a v z )
where u and v are the wind velocities in the horizontal and vertical directions (m s−1), respectively, ρ is the air density (=1.293 kg m−3), p is the air pressure (g m−1 s−2), Ka is the eddy diffusion coefficient (m2 s−1), t is time (s), x is the fetch (m), and z is the height (m). To solve Equations (2) and (3), the Marker And Cell (MAC) method [32] was used on the staggered mesh shown in Figure 1. Equation (2) can be approximated by Equation (4) using the MAC method for node [(i + ½)h, kh]:
u i + 1 2 , k , l + 1 = u i + 1 2 , k , l + Δ t L i + 1 2 , k , l Δ t h ( P i + 1 , k , l P i , k , l )
where h is the interval of staggered mesh shown in Figure 1, i and k are the node numbers of the wind velocities in the horizontal and vertical directions, respectively, and l is the node number of time.
Similarly, Equation (3) can be approximated as Equation (5) for node [ih, (k + ½)h)]:
v i , k + 1 2 , l + 1 = v i , k + 1 2 , l + Δ t M i , k + 1 2 , l Δ t h ( P i , k + 1 , l P i , k , l )
where P = p/ρ. L i + 1 2 , k , l and M i , k + 1 2 , l are defined as follows:
L i + 1 2 , k , l = 1 h { ( u i + 1 2 , k , l + u i + 3 2 , k , l 2 ) 2 ( u i 1 2 , k , l + u i + 1 2 , k , l 2 ) 2 } 1 h ( u i + 1 2 , k , l + u i + 1 2 , k + 1 , l 2 · v i , k + 1 2 , l + v i + 1 , k + 1 2 , l 2 u i + 1 2 , k , l + u i + 1 2 , k 1 , l 2 · v i , k 1 2 , l + v i + 1 , k 1 2 , l 2 ) + 1 h ( K a   i + 1 , k , l u i + 3 2 , k , l u i + 1 2 , k , l h K a   i , k , l u i + 1 2 , k , l u i 1 2 , k , l h ) + 1 h ( K a   i , k + 1 , l + K a   i + 1 , k + 1 , l + K a   i + 1 , k , l + K a   i , k , l 4 · u i + 1 2 , k + 1 , l u i + 1 2 , k , l h K a   i , k , l + K a   i + 1 , k , l + K a   i + 1 , k 1 , l + K a   i , k 1 , l 4 · u i + 1 2 , k , l u i + 1 2 , k 1 , l h )
M i + 1 2 , k , l = 1 h ( u i + 1 2 , k , l + u i + 1 2 , k + 1 , l 2 · v i , k + 1 2 , l + v i + 1 , k + 1 2 , l 2 u i 1 2 , k + 1 , l + u i 1 2 , k , l 2 · v i 1 , k + 1 2 , l + v i , k + 1 2 , l 2 ) 1 h { ( v i , k + 1 2 , l + v i , k + 3 2 , l 2 ) 2 ( v i , k + 1 2 , l + v i , k 1 2 , l 2 ) 2 } + 1 h ( K a   i , k + 1 , l + K a   i + 1 , k + 1 , l + K a   i + 1 , k , l + K a   i , k , l 4 · v i + 1 , k + 1 2 , l v i , k + 1 2 , l h K a   i 1 , k + 1 , l + K a   i , k + 1 , l + K a   i , k , l + K a   i 1 , k , l 4 · v i , k + 1 2 , l v i 1 , k + 1 2 , l h ) + 1 h ( K a   i , k + 1 , l v i , k + 3 2 , l v i , k + 1 2 , l h K a   i , k , l v i , k + 1 2 , l v i , k 1 2 , l h )
Because the continuity equation, Equation (1), holds when t = (l + 1)Δt, the following equation can be introduced:
1 h ( u i + 1 2 , k , l + 1 u i 1 2 , k , l + 1 + v i , k + 1 2 , l + 1 v i , k 1 2 , l + 1 ) = 0
Substituting Equations (4) and (5) into Equation (8) yields the following equation:
1 h [ { u i + 1 2 , k , l + Δ t L i + 1 2 , k , l Δ t h ( P i + 1 , k , l P i , k , l ) } { u i 1 2 , k , l + Δ t L i 1 2 , k , l Δ t h ( P i , k , l P i 1 , k , l ) } + { v i , k + 1 2 , l + Δ t M i , k + 1 2 , l Δ t h ( P i , k + 1 , l P i , k , l ) } { v i , k 1 2 , l + Δ t M i , k 1 2 , l Δ t h ( P i , k , l P i , k 1 , l ) } ] = 0
From Equation (9) we get
P i , k , l + 1 = 1 4 ( P i + 1 , k , l + P i 1 , k , l + P i , k + 1 , l + P i , k 1 , l h 2 R i , k , l )
Ri,k,l in Equation (10) is defined as follows:
R i , k , l = D i , k , l Δ t + 1 h ( L i + 1 2 , k , l L i 1 2 , k , l + M i , k + 1 2 , l M i , k 1 2 , l )
Di,k,l is defined as follows:
D i , k , l = u x + v z = 1 h ( u i + 1 2 , k , l u i 1 2 , k , l + v i , k + 1 2 , l v i , k 1 2 , l )
The Successive Over-Relaxation (SOR) method [33] can be used to estimate P using the wind velocity field when t = nΔt.

2.2. Eddy Diffusion Coefficient

The Eddy coefficient that appears in Equations (2) and (3) can be estimated as
K a = λ 2 | u z |
The parameter λ, can be represented as the following equations using Karman constant κ.
λ = κz

2.3. Boundary Condition

To set the boundary conditions for the wind velocity on the soil surface, we need to provide the wind velocity and pressure at virtual node A (Figure 2). The wind velocity in the vertical direction is 0 at the soil surface. We assumed that the wind velocity in the vertical direction at node C’ was the same at node C. The wind velocity in the horizontal direction at node A was set the same as that at node B but in the opposite direction. Substituting these data into Equation (3) yields PA at node A:
P A = P B 2 K a v C h

2.4. Quantification of Soil Erosion by the Wind

The amount of soil particles transferred by wind, q (g m−1 s−1), can be quantified as [1]
q = b ρ g u * 3
where b is the soil erodibility determined by the soil surface condition, g is gravitational acceleration (9.81 m s−2), and u* is the friction velocity (m s−1), which can be estimated using the wind velocity obtained by solving Equations (1)–(3) and the following equation:
u * = υ d | u | d z u | u |
where υ is the kinematic viscosity of air (m2 s−1).
Figure 3 describes the definition of q in Equation (16). The amount of soil particles transferred by wind was defined as the total soil mass blown across the line AB perpendicular to the wind direction in per unit and second [1]. The amount of soil erosion by the wind can be estimated as q using the horizontal wind velocity at the vicinity of the soil surface which is calculated from Equations (1)–(3).

3. Wind Tunnel Experiment

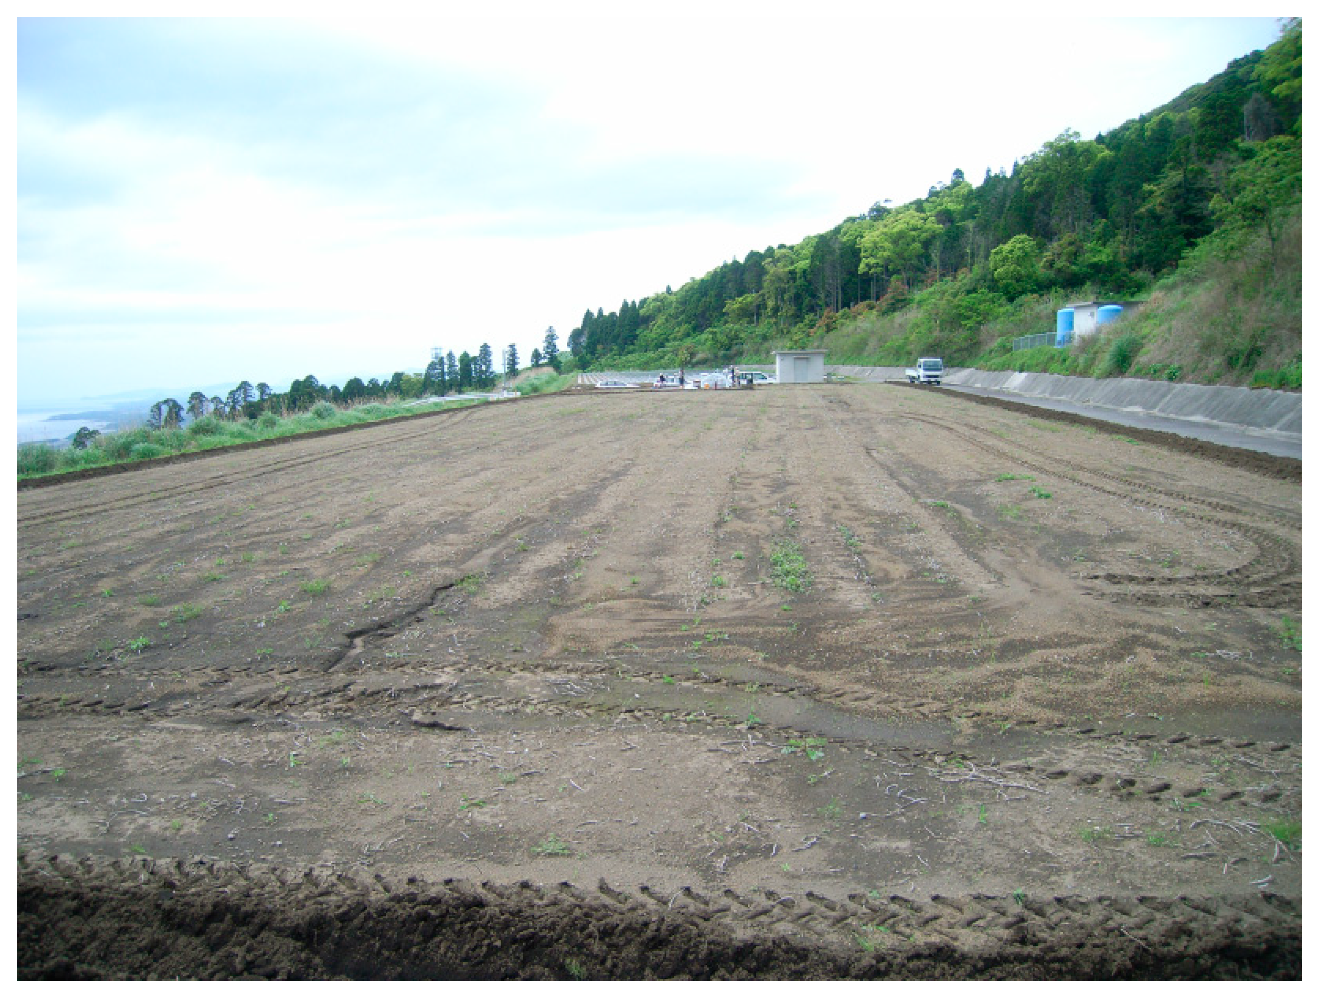
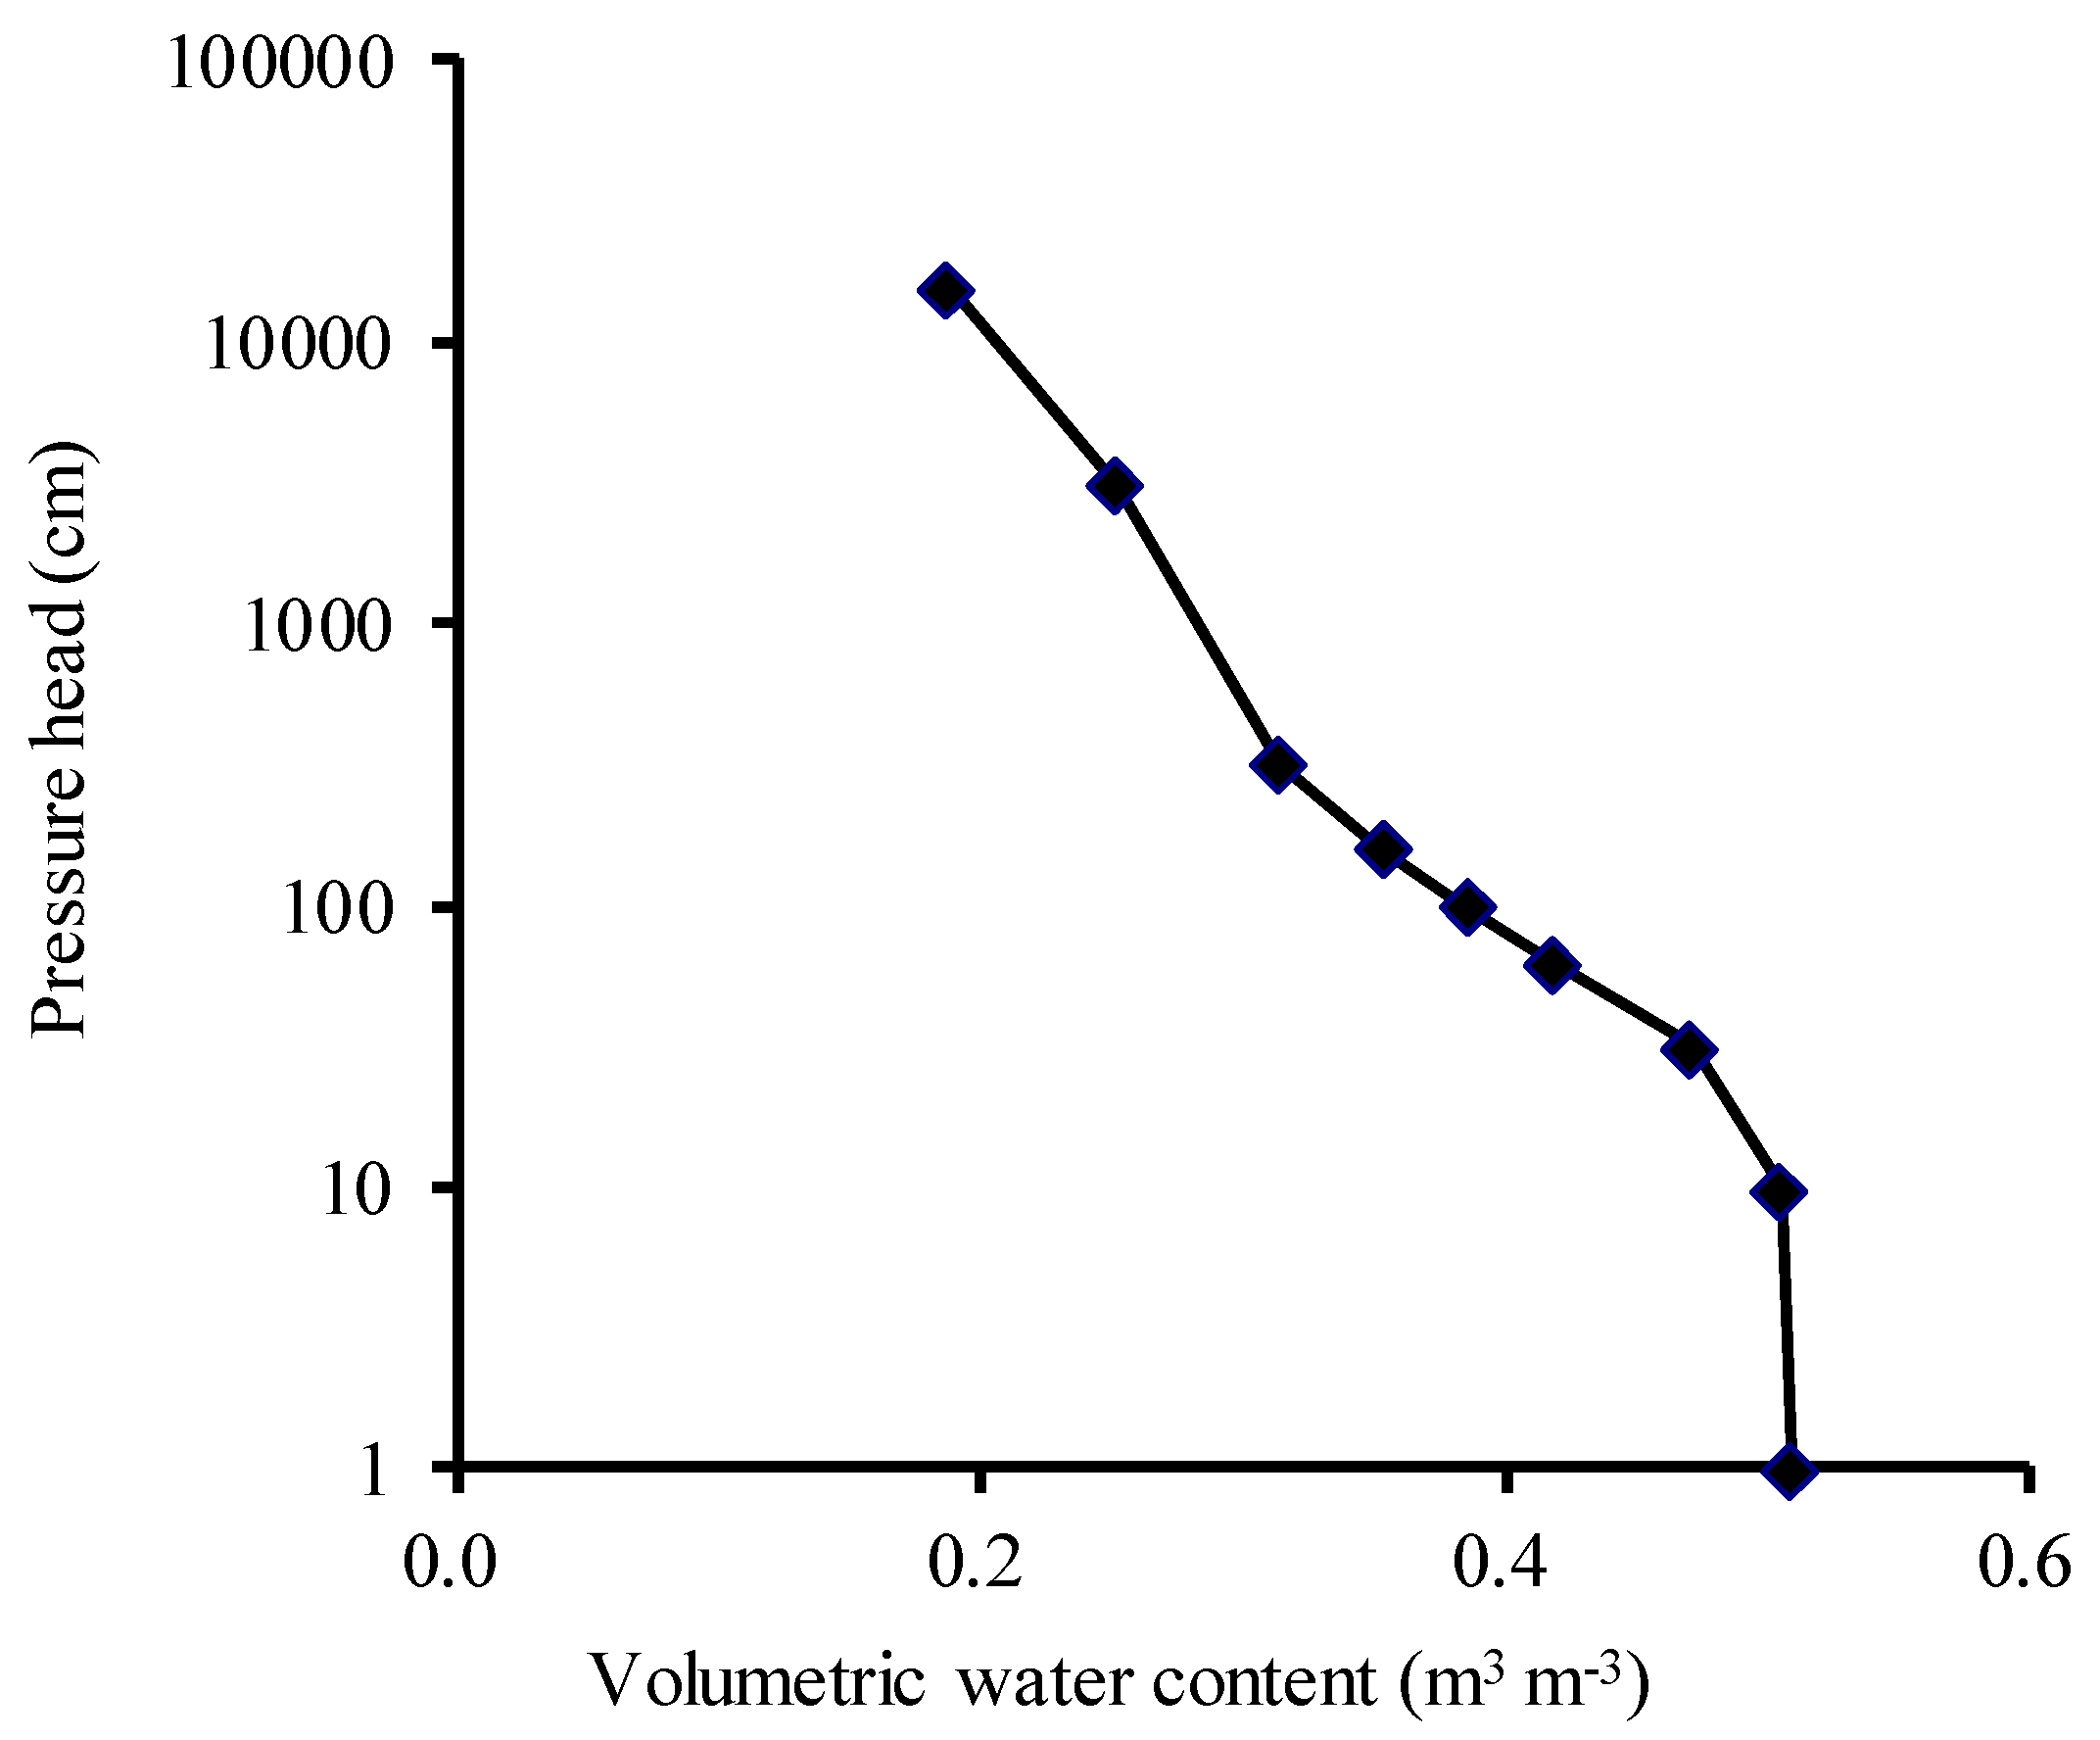
To estimate the parameter b in Equation (16), we performed a wind tunnel experiment. A schematic of the wind tunnel is shown in Figure 4. There is a suction fan at the end of the wind tunnel. In the wind tunnel, we reproduced a bare andosol field (N 32°14′, E 130°30′) as shown in Figure 5 which was located in Kagoshima Prefecture, southwest of Japan. This field was located on a windy and hillside of a mountain and had a great risk of the soil erosion by the wind. Potato was cultivated in this field from February to May and the field surface was bare in the other period. Average peak wind gust speed from 2008 to 2017 which was measured in the nearest meteorological station (N 31°16′, E 130°18′) was about 20.1 m s−1 [34]. The wind velocity was relatively high from December to April in this area except during typhoons [34]. The peak wind gust speed of >13.9 m s−1 (High wind in Beaufort scale) was recorded in 98 days in 2017 [34]. We sampled distributed surface soil in this field and performed the soil particle analysis (pipet method) and dry density measurement. A test of the soil water retention curve (Figure 6) in the drying process by suction plate method and centrifuging method was performed using the undistributed soil sample of 100 cm3. Distributed and undistributed soil samplings were performed at three kitty-cornered points of the field. The rates of clay, silt and sand were 23.7%, 3.5% and 72.8%, respectively. The dry density of the soil under natural conditions was 0.99 g cm−3. The volumetric water content of the air-dried soil was 0.026 m3 m−3. We filled rectangular tanks (0.15 m × 0.14 m × 0.09 m) with air-dried andosol sample at the dry density of 0.99 g cm−3 and arranged 99 tanks with andosol soil tightly in the wind tunnel as shown in Figure 7. During the experiment, the wind flowed at constant velocities of 2.0, 4.0, 6.0, 8.0, and 9.5 m s−1 at a height of 0.4 m for 1 h, respectively. Soil erosion was measured using a particle counter (PS2, Shinei Technology Co., Ltd., Kobe, Hyogo, Japan) and custom-built soil sampling devices made of 40-denier net and 60-mm-diameter, 100-mm-long vinyl chloride pipe. The particle counter was set at a height of 0.1 m and the sampling devices were placed downstream at heights of 0.10, 0.25, and 0.40 m. The experiments were performed at four values of volumetric water content: 0.026, 0.100, 0.170, and 0.250 m3 m−3 (2.6, 10.0, 17.0, and 25.0%). At first, we performed the measurement at the volumetric water content of 0.026 m3 m−3 and we added the water and mixed the water to soil sample evenly to make the soil water condition of 0.100, 0.170, and 0.250 m3 m−3, respectively. As shown in Figure 6, the volumetric water content of 0.250 m3 m−3 is approximately the same as the depletion of moisture content for optimum growth (pressure head of about 3 × 103 cm). The average amount of soil erosion was measured by weighing the soil captured in the three sampling nets after three repetitions of experiment.

4. Results and Discussion

4.1. Relationship between Soil Moisture Condition, wind Velocity, and Amount of Soil Erosion

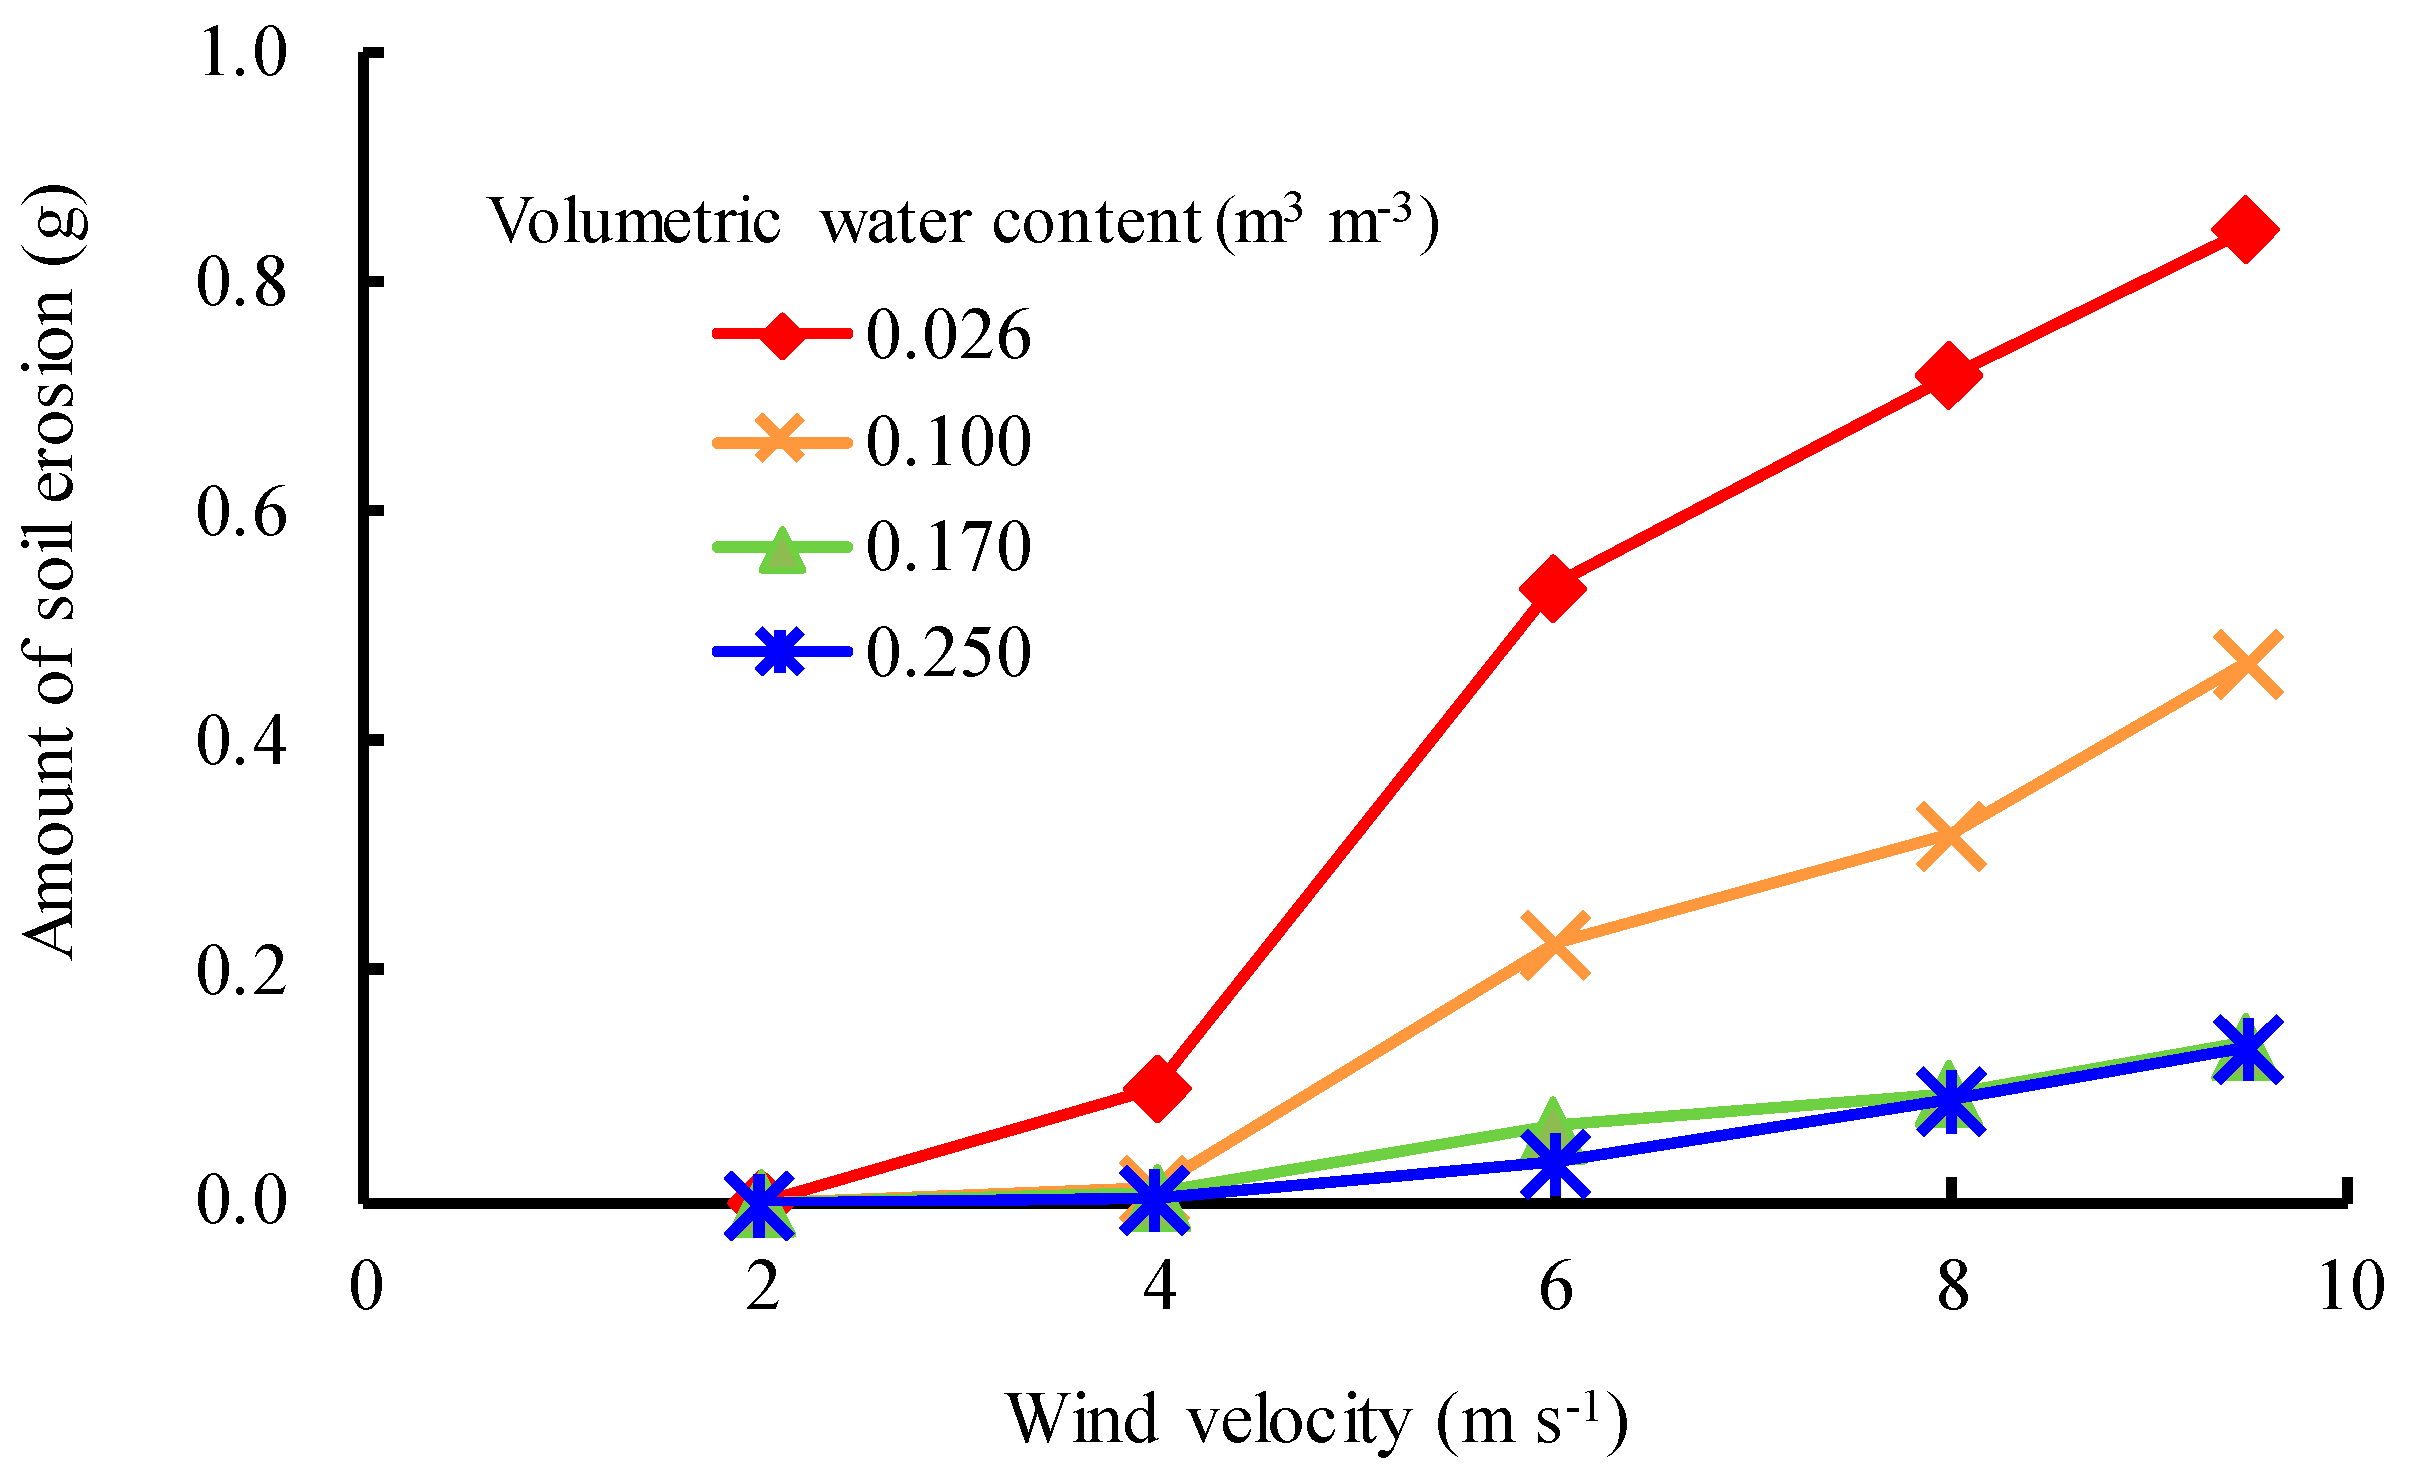
Figure 8 shows the relationships between volumetric water content, wind velocity, and the amount of soil erosion measured by the sampling nets. The relationship between the wind velocity and the amount of soil erosion shows that there was no soil erosion when the wind velocity was 2.0 m s−1. The amount of soil erosion increased gradually with the wind velocity, with a significant rate of increase between 4.0 and 6.0 m s−1 for all soil moisture conditions. Wind velocity of 6.0 m s−1 at a height of 0.4 m corresponds to a velocity of 14 m s−1 at a height of 10 m. Soil erosion was significant when the soil moisture content was 0.026 m3 m−3 (air-dried sample). The amount of soil erosion decreased with the increase in the soil moisture content. Soil transfer by wind was inhibited when the volumetric water content reached 0.170 m3 m−3.

4.2. Parameter Estimation for Quantification of Soil Erosion

The accuracy of this simulation model was verified the using the simulated and measured soil moisture conditions [31]. The friction velocity was estimated using the simulated wind velocity in the horizontal direction from Equations (1)–(3) and used to quantified the soil erosion amount by Equation (16). The parameter b in Equation (16), soil erodibility, was estimated inversely using the amount of soil erosion due to wind shown in Figure 8 and the estimated amount of soil erosion by Equation (16). Table 1 presents the results of the inverse estimation of b. Using the values in Table 1, the amount of soil erosion was estimated for the four levels of soil moisture condition. Figure 9 compares the amounts of soil erosion estimated using b from Table 1 and the measured amounts for four wind velocities. Root mean square errors (RMSE) determined using the measured and estimated data under four wind velocities shown in Figure 9 were 0.0001, 0.0007, 0.0005, and 0.0007, respectively. The results show that the estimated amounts of soil erosion at the four levels of soil moisture condition were in good agreement with the measured amounts for four wind velocities and that parameter b is effective for predicting the amount of soil erosion due to wind.

4.3. Quantification of Timing and Amount of Irrigation Water to Prevent the Soil Erosion

As shown in Figure 8, the soil erosion was significant when the wind velocity was over 6.0 m s−1 and the volumetric water content was <0.170 m3 m−3. At the Japanese meteorological observatory, the wind velocity is generally measured at an altitude of 10 m. Wind velocity of 6.0 m s−1 at a height of 0.4 m corresponds to 14 m s−1 at 10 m using logarithmic law for wind velocity. The threshold of wind velocity that caused significant soil erosion was this value and it could be an indicator for initiating irrigation to prevent soil erosion.
Scenario analyses were performed to estimate the amount of irrigation water needed to increase the volumetric water content from 0.026 and 0.100 m3 m−3 to 0.170 m3 m−3 for the prevention of soil erosion and the inhibitive effect of irrigation on soil erosion was evaluated as shown in Table 2. Using parameter b shown in Table 1, the soil erosion amounts for 1 hour in the study site (Figure 5) was estimated with the wind velocity of 6.0, 8.0 and 9.5 m s−1, respectively, when the wind direction was perpendicular to the long side (100 m) of the study field shown in Figure 5. The volumetric water content increased from 0.026 to 0.100 m3 m−3 and the amount of soil transferred by the wind was reduced almost by half when 3 mm of irrigation was applied. With an additional 3 mm of irrigation, the volumetric water content increased to 0.170 m3 m−3 and the amount of soil transferred by the wind was greatly reduced compared with the amount when the volumetric water content was 0.026 and 0.100 m3 m−3. The difference between the amounts of soil erosion for 0.170 and 0.250 m3 m−3 is relatively small. These results indicate that the optimal volumetric water content to prevent soil erosion is 0.170 m3 m−3.
Arimori et al. estimated that the irrigation amount to prevent the soil erosion by the wind is 2–10 mm using water budget model [26] and the irrigation amount estimated in this study were smaller. The result indicated that the method introduced here is effective to quantify and save the irrigation water for prevention of soil erosion by the wind.
Arimori et al. reported that soil moisture content and the wind velocity when the soil erosion by the wind occurred were evaluated as <28% and >8 m s−1, respectively by field measurement in an andosol field [35]. The volumetric water contents of 0.026, 0.100, 0.170 and 0.25 m3 m−3 which were adopted as the experimental conditions in this study corresponds to soil moisture content of 2.6, 9.9, 16.8, 24.8%, respectively. As shown in Figure 9 and Table 2, the thresholds of soil moisture content and wind velocity for soil erosion by the wind can be specified as 16.8% (volumetric water content = 0.170 m3 m−3) and 14 m s−1 (at the height of 10 m), respectively. The method introduced in this study enables precise determination of these thresholds and optimization of soil moisture management to prevent the soil erosion by the wind.
Bergametti et al. reported that the soil erosion by the wind was reduced by a rain event at a sand agricultural field in Niger [36]. They clarified that the soil transport was reduced especially during the first 10–15 min following the beginning of the rain event, and almost no significant sand transport occurred after 30 min. They also showed that this inhibition effect lasted no longer than 12 h after the end of the rain event (cumulative rainfall of 20 mm). Optimal irrigation amount for prevention of the soil erosion by the wind could be estimated in our study, however, optimal irrigation duration also should be determined to enhance the irrigation effect on soil erosion prevention. Also the irrigation effect on the prevention of the soil erosion by the wind should be clarified taking into account the temporal changes of soil moisture conditions after irrigation.

5. Conclusions

To evaluate the effect of wind velocity and soil moisture condition on soil erosion by the wind in andosol agricultural fields, we developed a numerical model that simulates airflow in bare soil fields. We then performed a wind tunnel experiment using a replica bare soil field to measure the amount of soil erosion under four levels of soil moisture condition and five wind velocities. The experimental results indicated that soil erosion is significant when the wind velocity at a height of 0.4 m is over 6.0 m s−1 (which corresponds to 14 m s−1 at a height of 10.0 m) and the volumetric water content decreases to <0.170 m3 m−3. Using the measured amount of soil transferred by wind the parameter b in Bagnold’s method that quantifies soil erosion was estimated inversely for four soil moisture values. The amounts of soil erosion calculated using this parameter was in good agreement with the measured amounts. These results indicate that the conditions under which soil erosion occurs can be determined and the amount of soil erosion can be predicted. Using these conditions and the erodibility parameter, the amount of irrigation needed for the prevention of soil erosion was quantified and the effect of irrigation on soil erosion was evaluated. The results of this study can be used to predict the occurrence of soil erosion and to optimize the irrigation used to prevent soil erosion.

Author Contributions

The methodology for the experiments was a joint effort of K.Y. and M.A. K.Y. and M.A. were responsible for carrying out the experiments and analyzing the experiment data. K.Y. developed the numerical model. K.Y. wrote the first draft of the paper, and M.A. contributed to reviewing and editing the manuscript.

Funding

This research received no external funding.

Acknowledgments

We want to thank project staffs of Kyushu Regional Agricultural Administration Office of Ministry of Agriculture, Forestry and Fisheries of Japan for their technical support for this work. We also thank the editors and three anonymous reviewers for their constructive suggestions and comments for improvement of the paper.

Conflicts of Interest

The authors declare no conflict of interest.

References

  1. Brown, L.R. World population growth, soil erosion, and food security. Science 1981, 214, 995–1002. [Google Scholar] [CrossRef] [PubMed]
  2. Lal, R.; Hall, G.F.; Miller, F.P. Soil degradation: I. Basic processes. Land Degrad. Dev. 1989, 1, 51–69. [Google Scholar] [CrossRef]
  3. Oldeman, L.R.; Hakkeling, R.T.A.; Sombroeck, W.G. World Map of the Status of Human-Induced Soil Degradation: An Explanatory Note. 1990; ISRIC report; ISRIC: Wageningen, The Netherlands, 1991. [Google Scholar]
  4. Belnap, J. Surface disturbances: Their role in accelerating desertification. Environ. Monit. Assess. 1995, 37, 39–57. [Google Scholar] [CrossRef] [PubMed]
  5. Bagnold, R.A. The movement of desert sand. Proc. R. Soc. Lon. Ser-A 1936, 157, 594–620. [Google Scholar] [CrossRef]
  6. Bagnold, R.A. The size-grading of sand by wind. Proc. R. Soc. Lon. Ser-A 1937, 163, 250–264. [Google Scholar]
  7. Kawamura, R. Study on sand movement by wind. Rep. Inst. Sci. Tech. Univ. Tokyo 1951, 5, 95–112, (In Japanese with English abstract). [Google Scholar]
  8. Wang, L.; Shi, Z.H.; Wu, G.L.; Fang, N.F. Freeze/thaw and soil moisture effects on wind erosion. Geomorphology 2014, 207, 141–148. [Google Scholar] [CrossRef]
  9. Marzen, M.; Iserloh, T.; De Lima, J.L.M.P.; Ries, J.B. The effect of rain, wind-driven rain and wind on particle transport under controlled laboratory conditions. Catena 2016, 145, 47–55. [Google Scholar] [CrossRef]
  10. Cheng, H.; Zhang, K.; Liu, C.; Zou, X.; Kang, L.; Chen, T.; He, W.; Fang, Y. Wind tunnel study of airflow recovery on the lee side of single plants. Agr. Forest Meteorol. 2018, 263, 362–372. [Google Scholar] [CrossRef]
  11. Shao, Y.; Raypach, M.R.; Leys, J.F. A model for predicting aeolian sand drift and dust entrainment on scales from paddock to region. Aus. J. Soil Res. 1996, 34, 309–342. [Google Scholar] [CrossRef]
  12. Kuznetsov, M.S.; Abdulkhanova, D.R. Soil loss tolerance in the central chernozemic region of the European part of Russia. Eurasian Soil Sci. 2013, 46, 802–809. [Google Scholar] [CrossRef]
  13. Lisetskii, F.; Stolba, V.F.; Marininа, O. Indicators of agricultural soil genesis under varying conditions of land use, Steppe Crimea. Geoderma 2015, 239, 304–316. [Google Scholar] [CrossRef] [Green Version]
  14. Meng, Z.; Dang, X.; Gao, Y.; Ren, X.; Ding, Y.; Wang, M. Interactive effects of wind speed, vegetation coverage and soil moisture in controlling wind erosion in a temperate desert steppe, Inner Mongolia of China. J. Arid Land 2018, 10, 534–547. [Google Scholar] [CrossRef]
  15. Takahashi, S.; Tanaka, Y. Studies on the wind erosion control by spraying bentonite milk in the Abashiri District. J. Agric. Eng. Soc. Jpn. 1991, 59, 157–162. (In Japanese) [Google Scholar]
  16. Shingyoji, T.; Watanabe, H. Studies on wind erosion in upland fields in Chiba Prefecture 1. The influence of field length and tillage methods to wind erosion in Andosol area. Bull. Chiba-Ken Agr. Exp. Stn. 1988, 29, 105–114, (In Japanese with English summary). [Google Scholar]
  17. Watanabe, M. Grazing as a cultural impact on soil formation of andosols. Ann. Ochanomizu Geogr. Soc. 1990, 31, 16–23. (In Japanese) [Google Scholar]
  18. Kuroda, M.; Kunieda, T. Unsaturated hydraulic conductivity of the Kuroboku soil and its measurement. J. Jpn. Soc. Soil Phys. 1983, 48, 17–25, (In Japanese with English summary). [Google Scholar]
  19. Maeda, T.; Soma, K.; Ikehata, K. Thermal properties greatly related to water retention of Kuroboku Soils (Organo-volcanic Ash Soils). Trans. Jpn. Soc. Irrig. Drain. Rural Eng. 1983, 103, 13–20, (In Japanese with English abstract). [Google Scholar]
  20. Hasegawa, S. Field capacity of volcanic ash soil—The real conditions. J. Jpn. Soc. Soil Phys. 2000, 83, 41–46, (In Japanese with English abstract). [Google Scholar]
  21. Narioka, H.; Komamura, M. Macropore properties of andosols in the Kanto loam formation by physical analysis of soil structure and drainability. Trans. Jpn. Soc. Irrig. Drain. Reclam. Eng. 2000, 210, 735–743, (In Japanese with English abstract). [Google Scholar]
  22. Tsuji, O.; Matsuda, Y.; Tsuchiya, F. Effect of the windbreak nets on micrometeorological improvement in crop fields. Res. Bull. Obihiro Univ. I 1988, 16, 51–58, (In Japanese with English summary). [Google Scholar]
  23. Komatsuzaki, M.; Suzuki, K. Influence of cover crop seeding date and their amounts on mitigation of wind erosion. Jpn. J. Farm Work Res. 2009, 44, 189–199, (In Japanese with English summary). [Google Scholar] [CrossRef]
  24. Hoshikawa, K.; Suzuki, J.; Yoshimura, S. A study of wind erosion in an agricultural area of the southwestern Matsumoto Basin. J. Jpn. Soc. Irrig. Drain. Rural Eng. 2012, 80, 349–352. (In Japanese) [Google Scholar]
  25. Suzuki, J.; Osawa, K.; Matsuoka, N. Characteristics and restraint measures of the wind erosion in Kanto-Koshin district. J. Agri. Eng. Soc. Jpn. 2017, 85, 649–654. (In Japanese) [Google Scholar]
  26. Arimori, M.; Endo, Y.; Kobayashi, T. Study on the optimal irrigation method for wind erosion prevention by the simulation. Trans. Jpn. Soc. Irrig. Drain. Rural Eng. 2009, 77, 475–481, (In Japanese with English abstract). [Google Scholar]
  27. Kawata, Y.; Tsuchiya, Y. Influence of water content on the threshold of sand movement and the rate of sand transport in blown sand. Proc. Jpn. Soc. Civil Eng. 1976, 249, 95–100. (In Japanese) [Google Scholar] [CrossRef]
  28. Chen, W.; Dong, Z.; Li, Z.; Yang, Z. Wind tunnel test of the influence of moisture on the erodibility of loessial sandy loam soils by wind. J. Arid Environ. 1996, 34, 391–402. [Google Scholar] [CrossRef]
  29. Fécan, F.; Marticorena, B.; Bergametti, G. Parametrization of the increase of the aeolian erosion threshold wind friction velocity due to soil moisture for arid and semi-arid areas. Ann. Geophys. 1999, 17, 149–157. [Google Scholar] [CrossRef]
  30. Yuge, K.; Haraguchi, T.; Nakano, Y.; Kuroda, M.; Anan, M. Quantification of soil surface evaporation under micro-scale advection in drip-irrigated fields. Paddy Water Environ. 2005, 3, 5–12. [Google Scholar] [CrossRef]
  31. Yuge, K.; Anan, M.; Shinogi, Y. Effects of the micro-scale advection on the soil water movement in micro-irrigated fields. Irrig. Sci. 2014, 32, 159–167. [Google Scholar] [CrossRef]
  32. McKee, S.; Tomé, M.F.; Ferreira, V.G.; Cuminato, J.A.; Castelo, A.; Sousa, F.S.; Mangiavacchi, N. The MAC method. Comput. Fluids 2008, 37, 907–930. [Google Scholar] [CrossRef]
  33. Young, D.M. Iterative Solution of Large Linear Systems; Academic Press: New York, NY, USA, 1971; ISBN 9781-4832-74133. [Google Scholar]
  34. Japan Meteorological Agency. Weather, Climate & Earthquake Information. Available online: http://www.jma.go.jp/jma/en/menu.html (accessed on 23 December 2018).
  35. Arimori, M.; Endo, Y.; Kobayashi, T. Effect of wind and soil moisture on the wind-drift caused by wind erosion: The case of volcanic ash soil fields in Okunakayama Highland, Iwate prefecture. Trans. Jpn. Soc. Irrig. Drain. Rural Eng. 2009, 77, 129–136, (In Japanese with English abstract). [Google Scholar]
  36. Bergametti, G.; Rajot, J.L.; Pierre, C.; Bouet, C.; Marticorena, B. How long does precipitation inhibit wind erosion in the Sahel? Geophys. Res. Lett. 2016, 43, 6643–6649. [Google Scholar] [CrossRef]
Figure 1. Schematic of the staggered mesh.
Water 11 00098 g001
Figure 2. Boundary conditions of wind velocity and pressure fields.
Water 11 00098 g002
Figure 3. Definition of wind erosion amount q in Equation (16).
Water 11 00098 g003
Figure 4. Schematic of the wind tunnel.
Water 11 00098 g004
Figure 5. Condition of bare andosol field.
Water 11 00098 g005
Figure 6. Soil water retention curve of andosol which was used in the wind tunnel experiment.
Water 11 00098 g006
Figure 7. Installation condition of measurement devices and andosol sample in the wind tunnel experiment.
Water 11 00098 g007
Figure 8. Relationships between volumetric water content, wind velocity, and amount of soil erosion.
Water 11 00098 g008
Figure 9. Comparison of estimated and measured amounts of soil erosion. (a) 4.0 m s−1, (b) 6.0 m s−1, (c) 8.0 m s−1, (d) 9.5 m s−1
Water 11 00098 g009
Table 1. Inversely estimated parameter b.
Volumetric Water Content
(m3 m−3)
Parameter b
0.0260.0352
0.1000.0140
0.1700.0042
0.2500.0030
Table 2. Irrigation water amount for the prevention of soil erosion with respect to soil moisture and wind conditions.
Volumetric Water Content (m3 m−3)Irrigation Water Amount (mm)Hourly Amount of Soil Erosion (kg h−1)
u = 6.0 (m s−1)u = 8.0 (m s−1)u = 9.5 (m s−1)
0.026 0.5881.1931.927
Water 11 00098 i001 3.2
0.1000.2340.4740.765
Water 11 00098 i001 2.6
0.1700.0690.1410.227
Water 11 00098 i001 2.6
0.2500.0510.1030.167