Hydrodynamic Features of an Undular Bore Traveling on a 1:20 Sloping Beach
Abstract
:1. Introduction
2. Experimental Set-Ups and Instrumentations
3. Preliminary Tests
4. Free Surface Elevation and Velocity Field/Profile of Bore
4.1. Free Surface Elevations over Horizontal Bottom and Sloping Beach
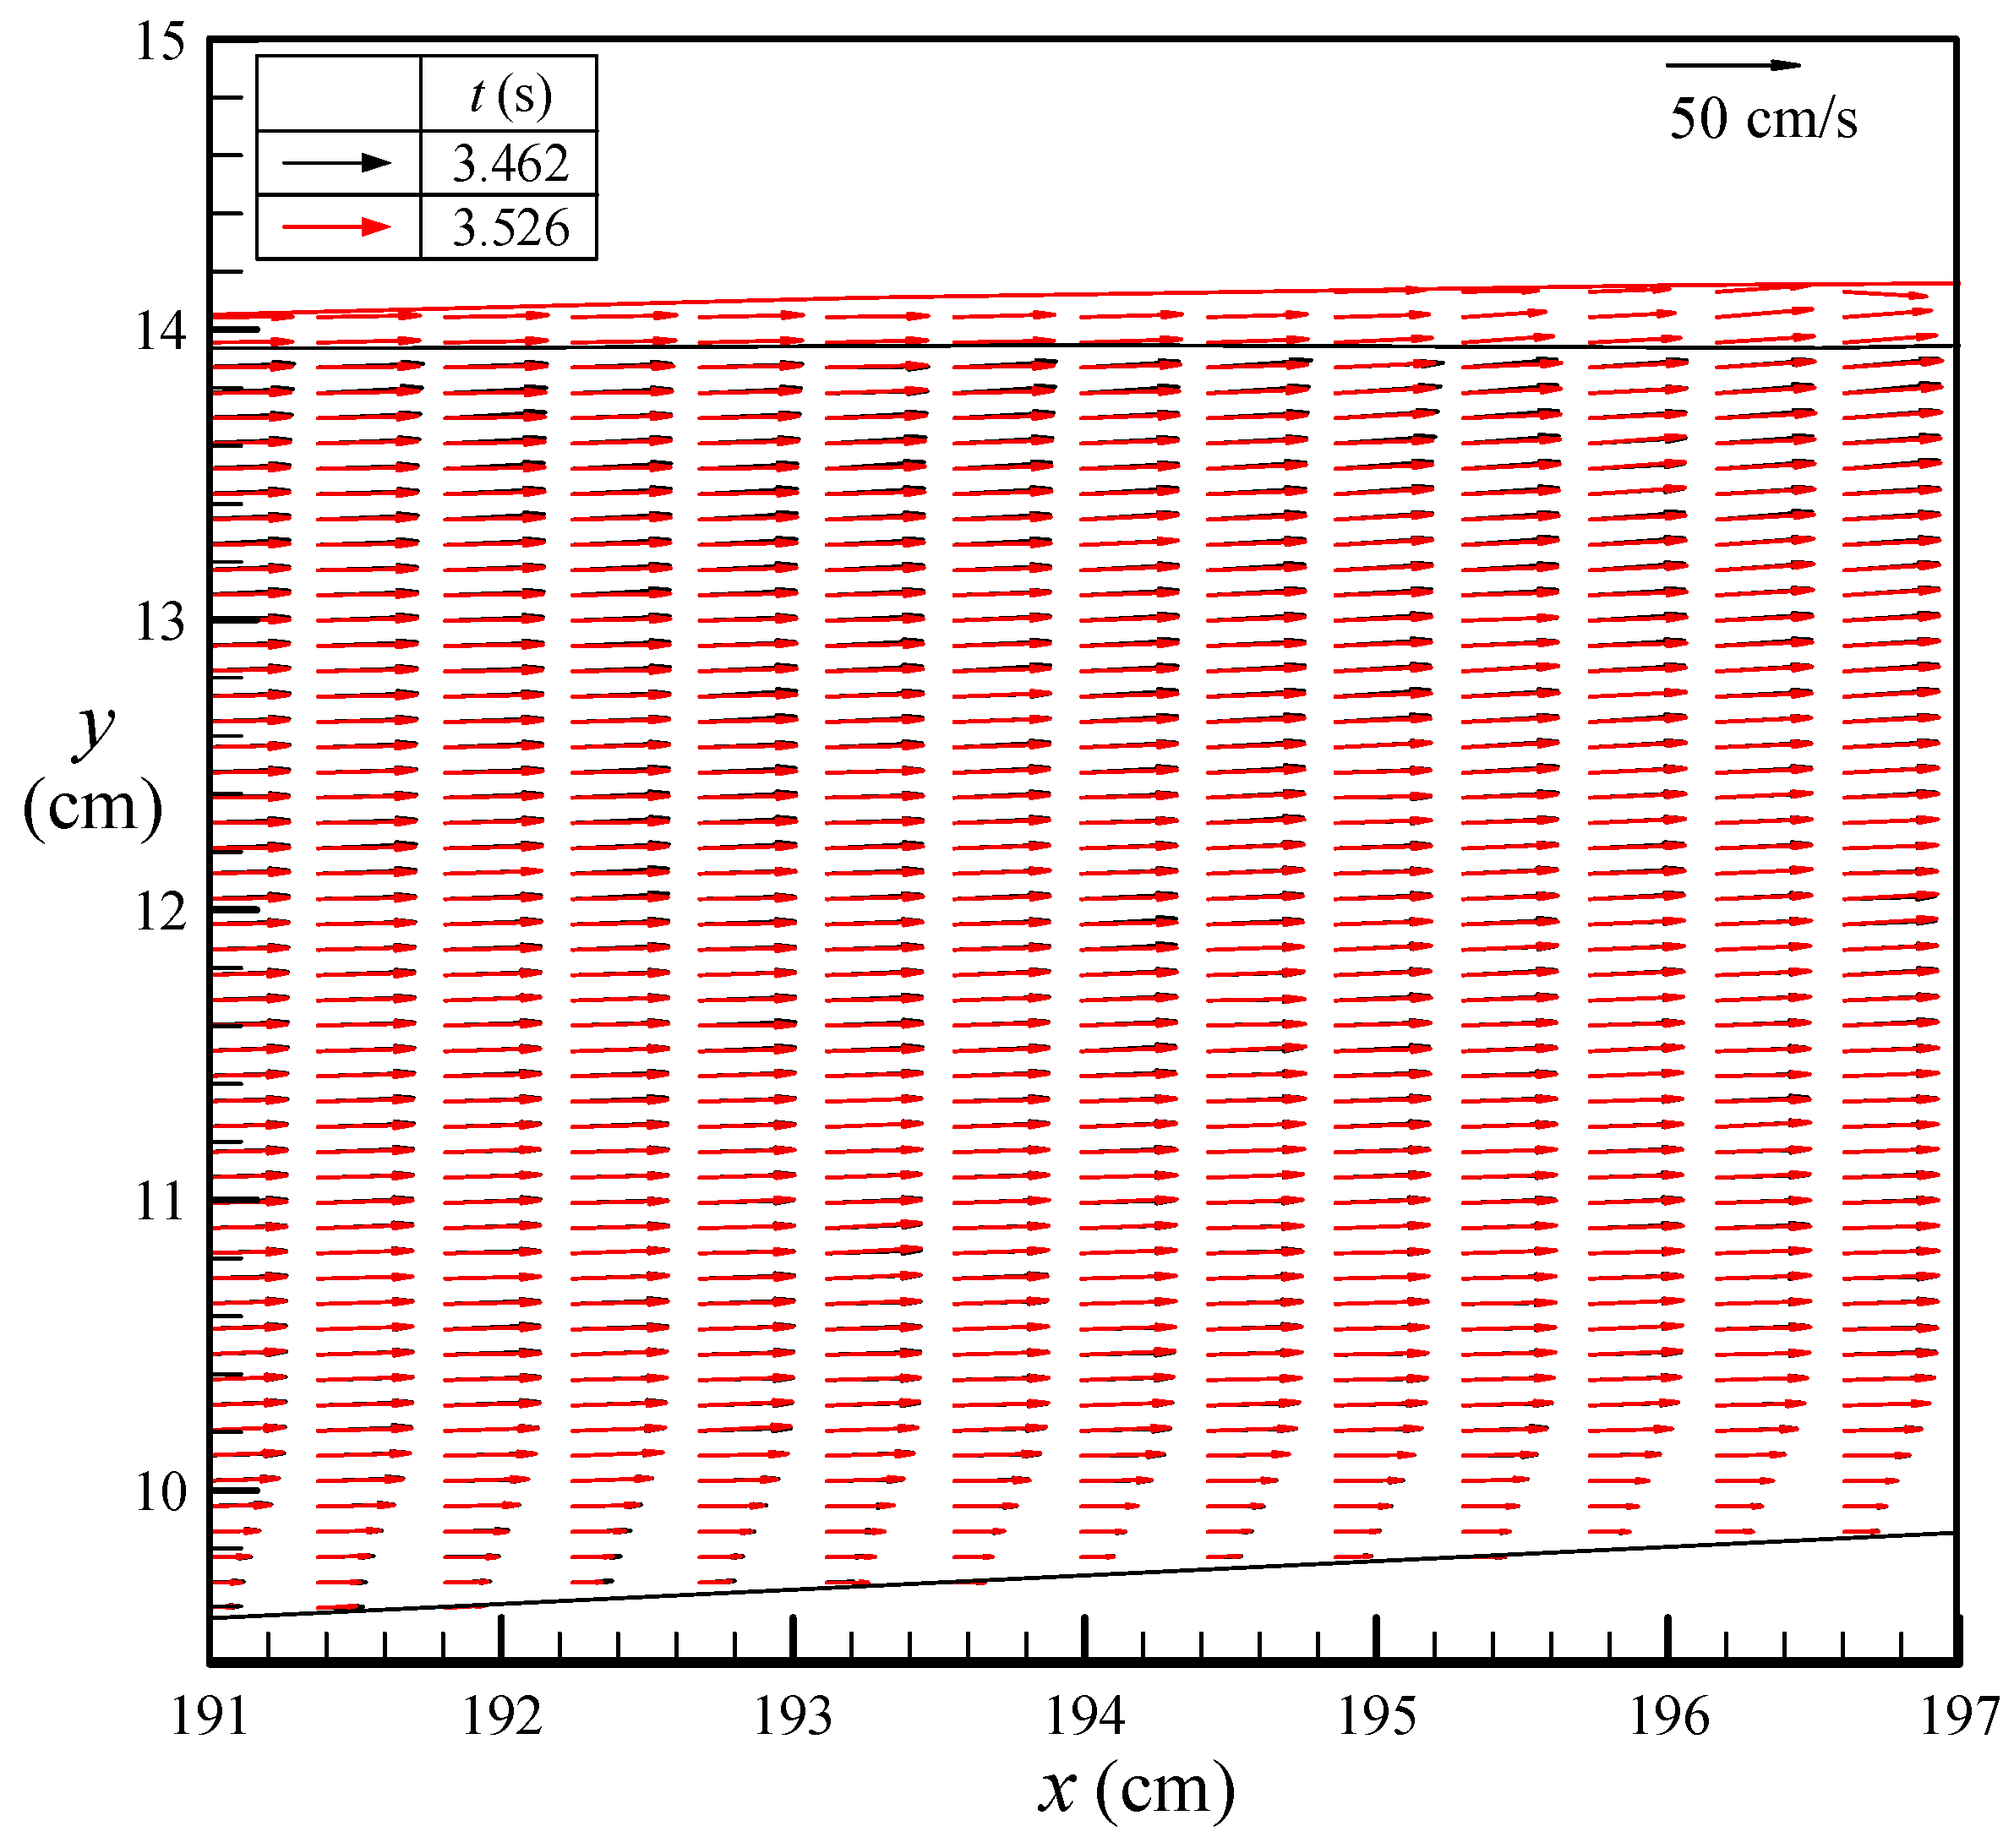
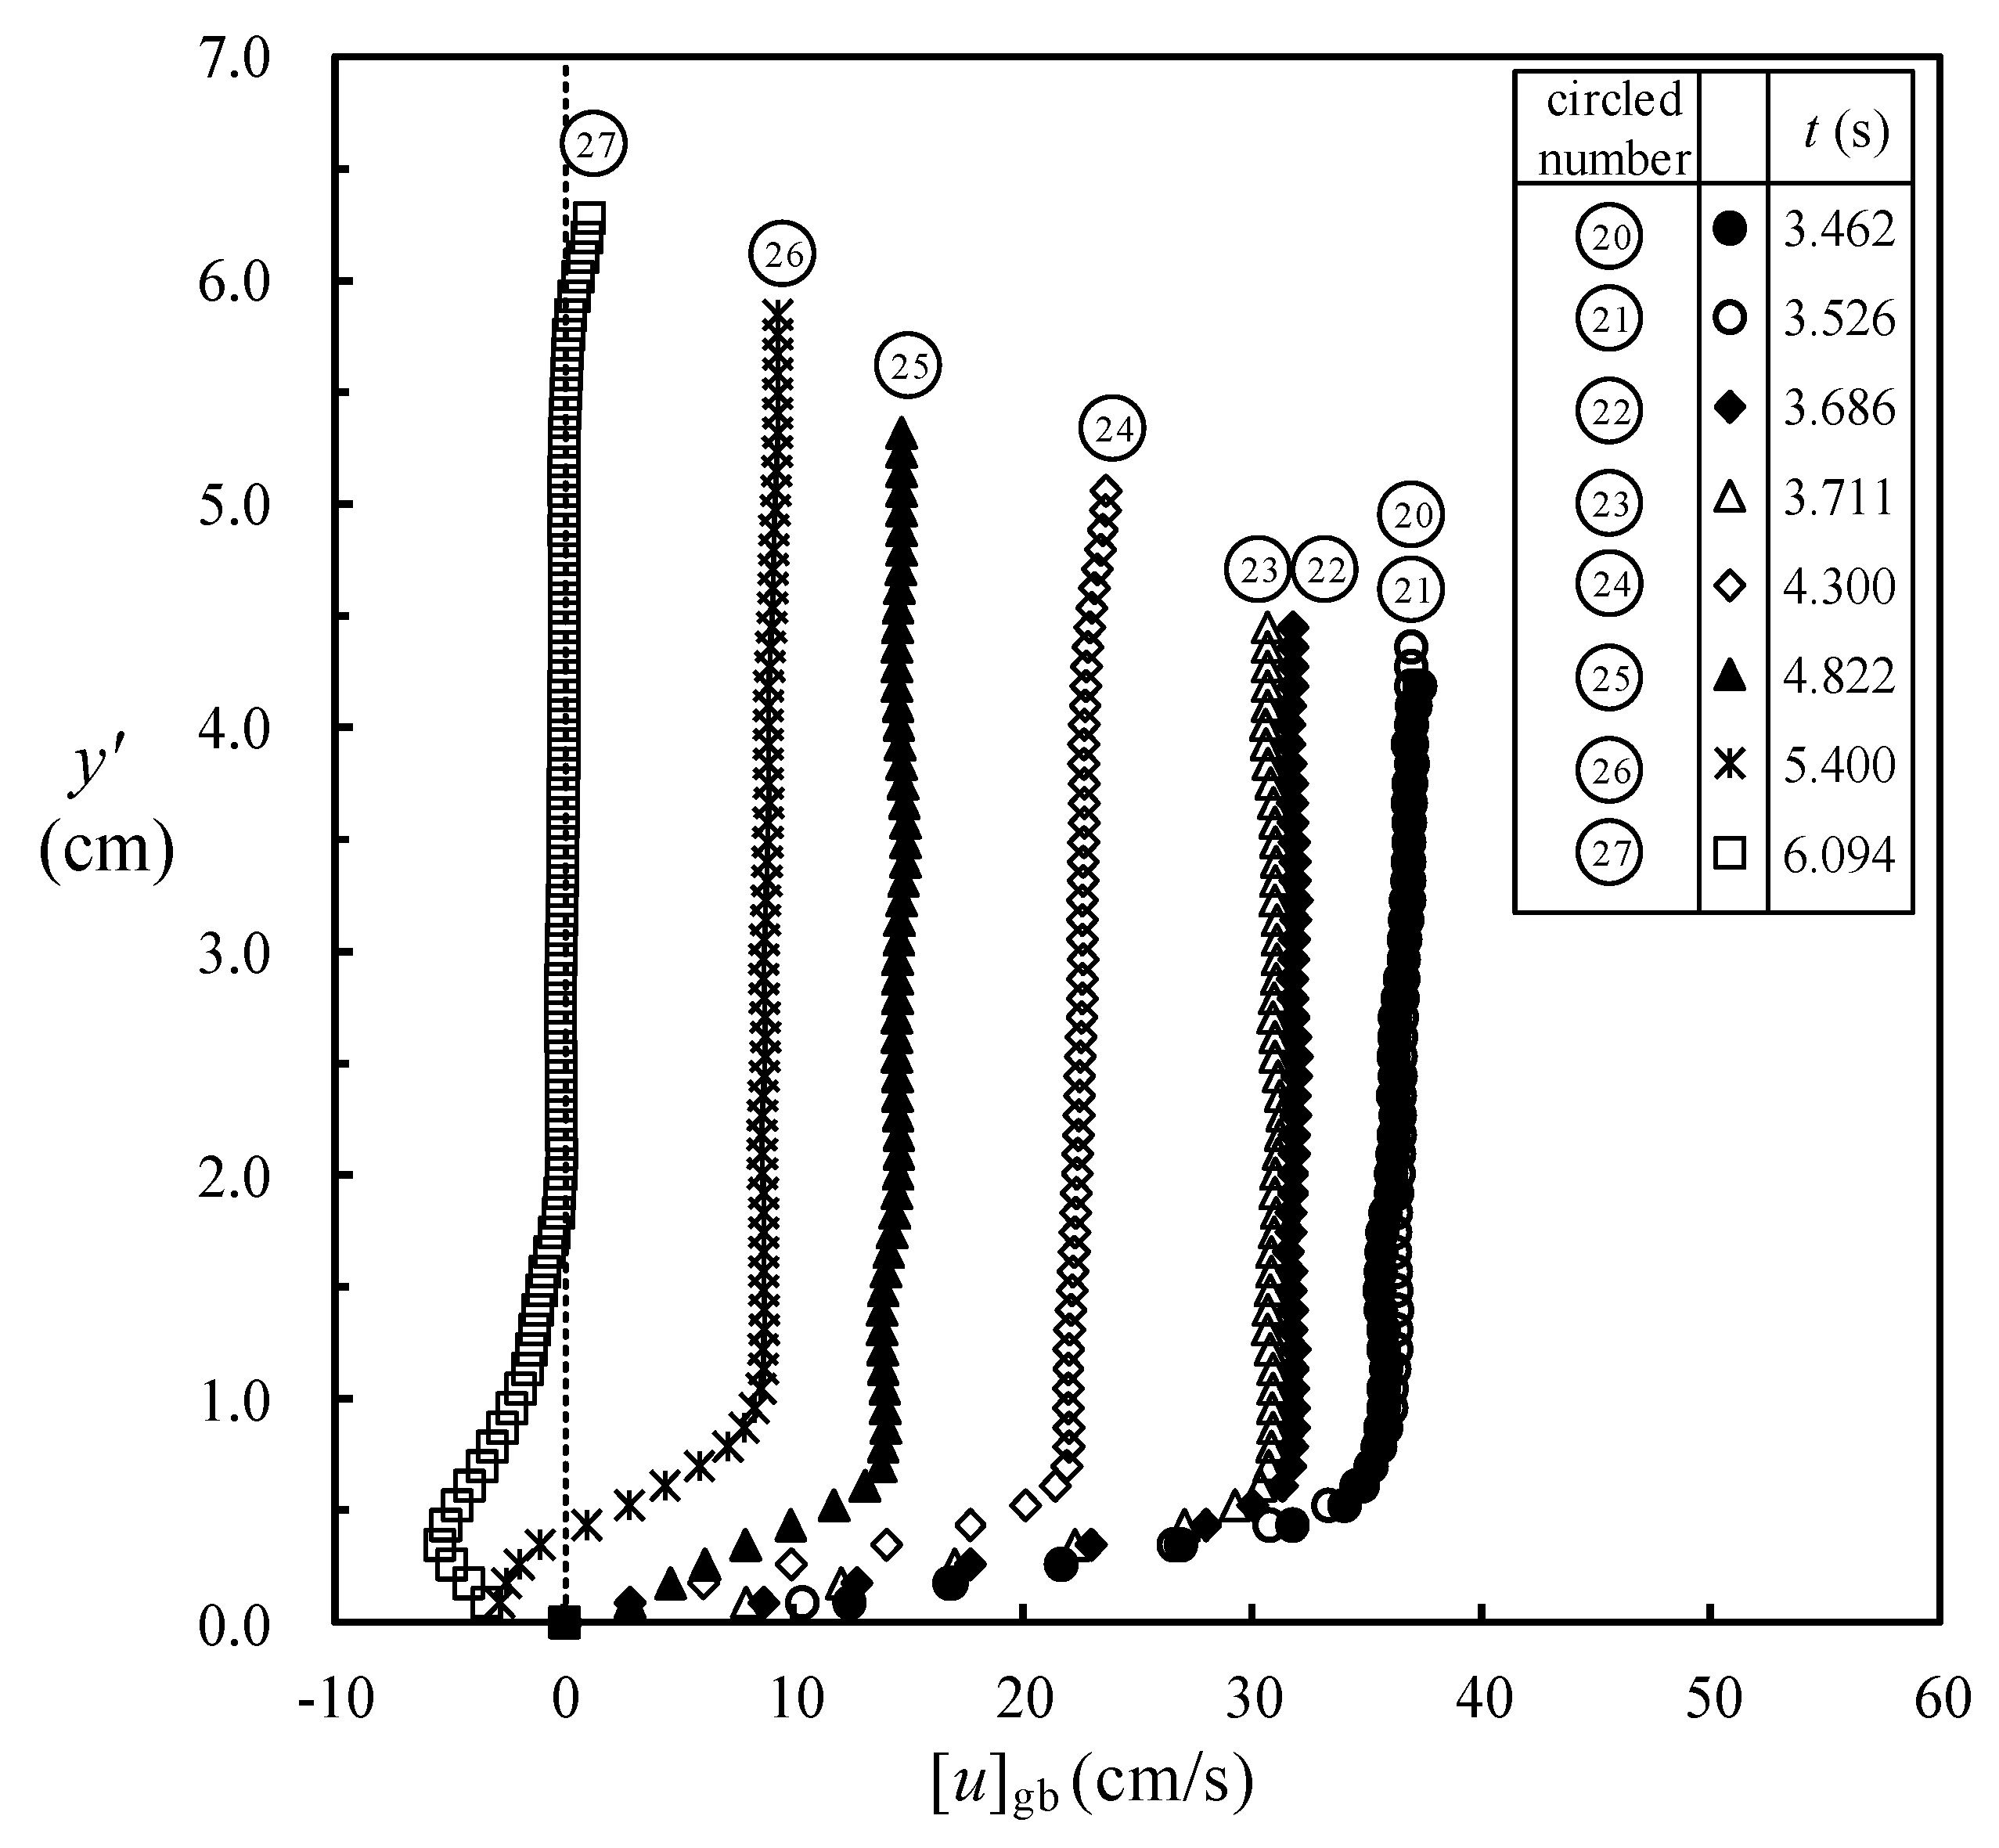
4.2. Velocity Fields/Profiles during Run-Up Motion for 2.0 s ≤ t ≤ 3.462 s at SMS
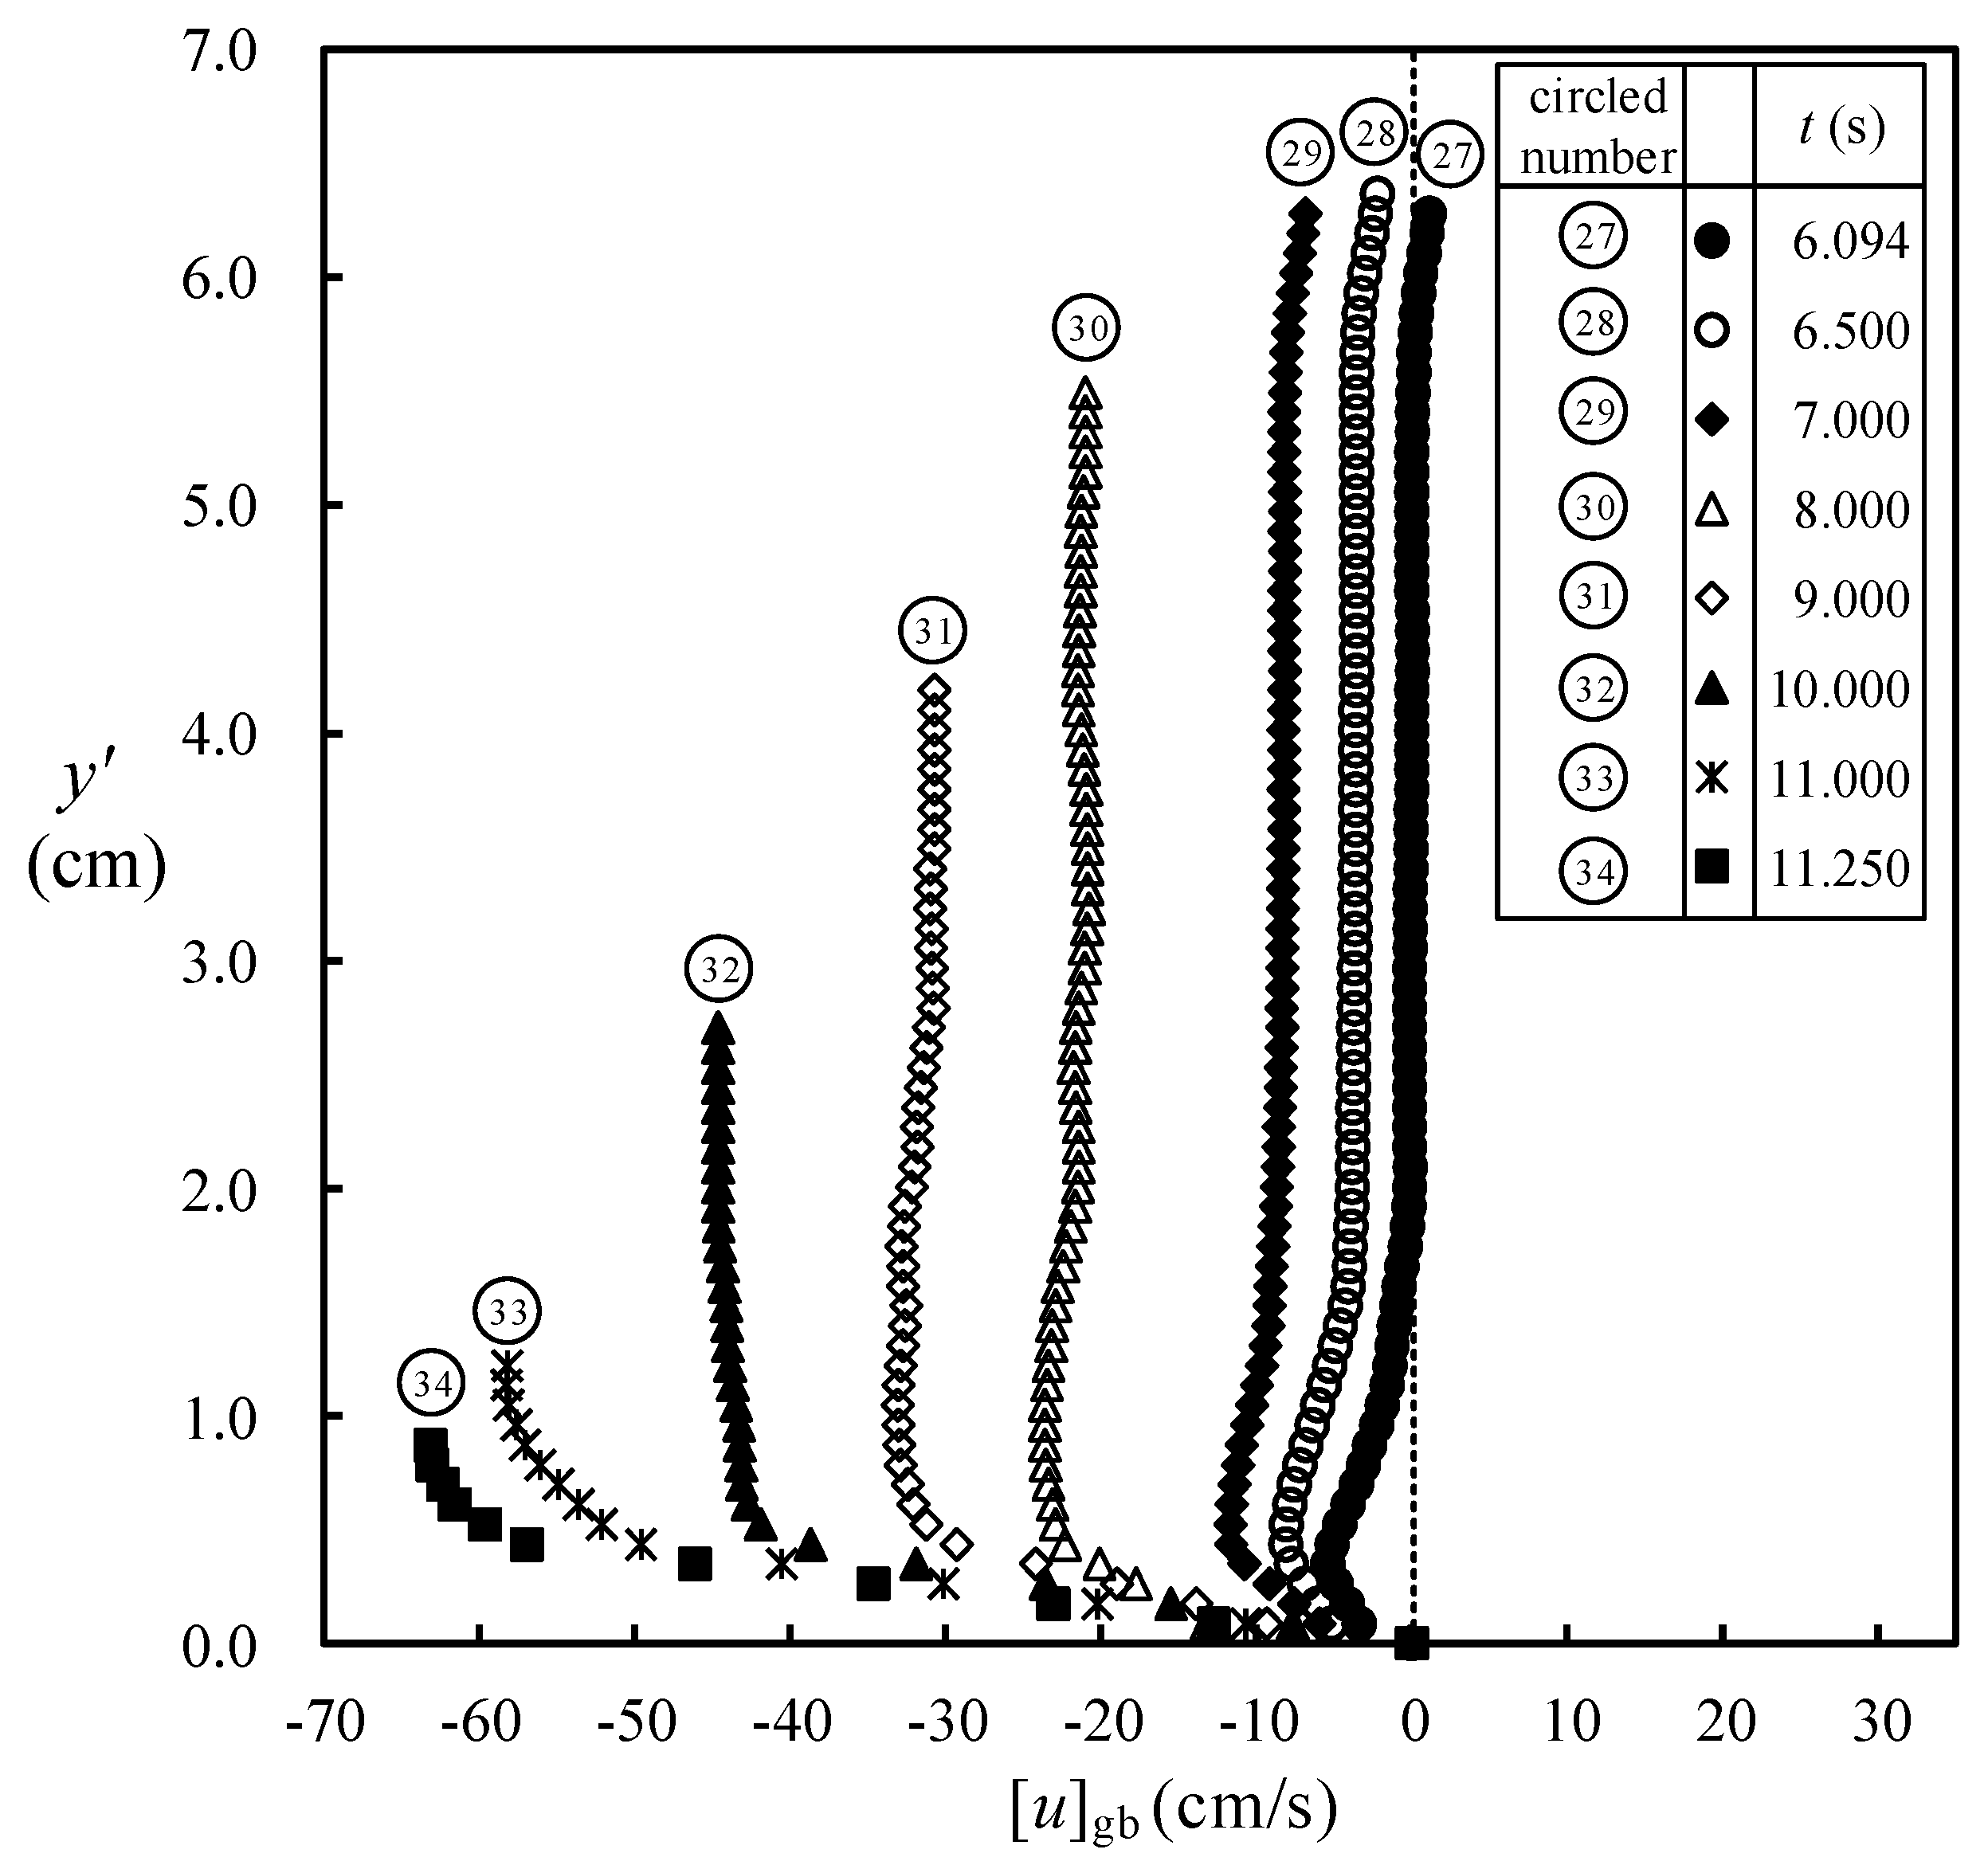
4.3. Velocity Fields/Profiles during Run-Down Motion for 6.094 s ≤ t < 12.00 at SMS
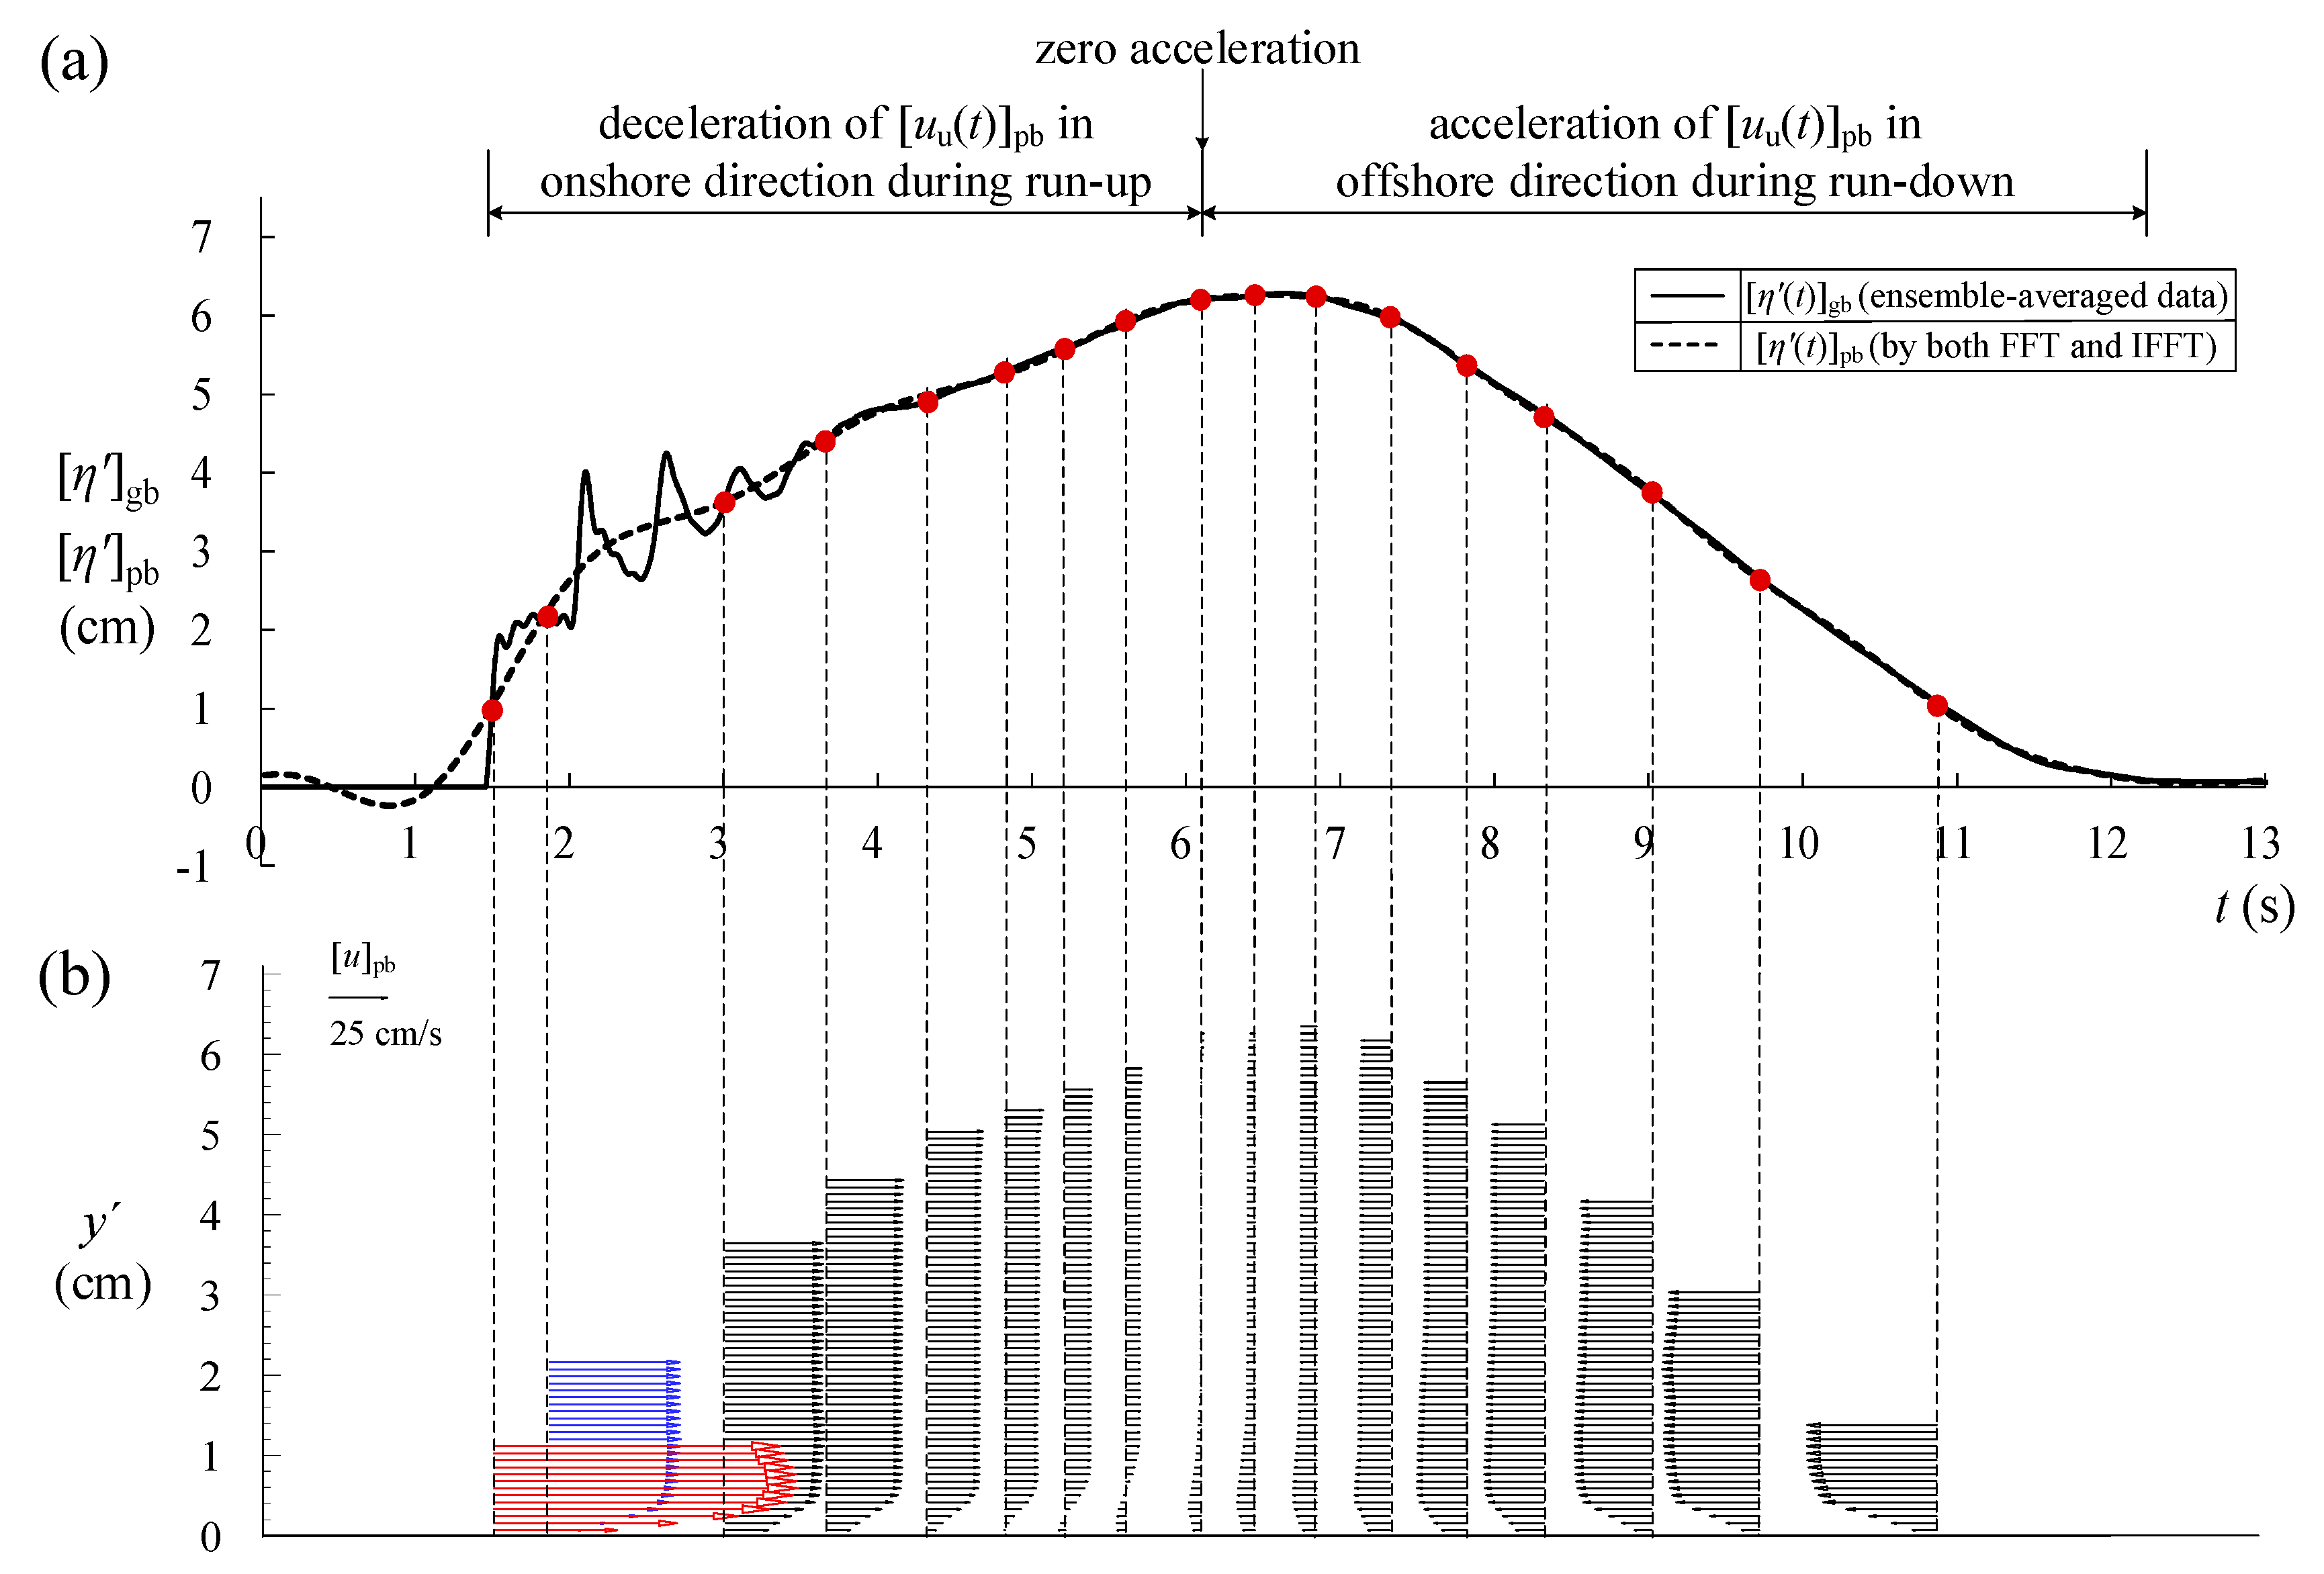
4.4. Uniform Horizontal Velocity of Pure Bore at SMS for 2.00 s ≤ t < 12.00 s
5. Calculation Method for Accelerations and Pressure Gradient in Horizontal Direction
5.1. Definitions Based on Navier–Stokes Equation
= −(1/ρ)[∂p(x, y, t)/∂x]gb = −[P(x, y, t)]gb,
| {[∂u(t)/∂t]gb}pda + {[u(t) × ∂u(t)/∂x]gb}pda + {[v(t) × ∂u(t)/∂y]gb}pda | (5) |
| = {[Al(t)]gb}pda + {[Ac1(t)]gb}pda + {[Ac2(t)]gb}pda | |
| = {[Al(t)]gb}pda + {[Ac(t)]gb}pda | |
| = {[At(t)]gb}pda | |
| = −{[(1/ρ)∂p(t)/∂x]gb}pda | |
| = −{[P(t)]gb}pda |
5.2. Calculation Example for Local Acceleration
5.3. Calculation Example for 1st Convective Acceleration at SMS
5.4. Calculation Example for 2nd Convective and Total Accelerations and Pressure Gradient at SMS
6. Results and Discussions
6.1. Local Acceleration of Pure Bore at SMS
6.2. Local Acceleration of Generated Bore at SMS
6.2.1. Influence of 2nd Leading Wave
6.2.2. Influences of 3rd and 4th Leading Waves
6.2.3. No Influence of Leading Wave for 36.144 ≤ t* < 125.284
= −0.0222 × exp[−0.0137(t* − 15.243)] for 36.144 ≤ t* ≤ 63.623.
6.3. Convective Acceleration of Generated Bore at SMS
6.3.1. Influence of 2nd Leading Wave
6.3.2. Influences of 3rd and 4th Leading Waves
6.3.3. No Influence of Leading Wave for 36.144 ≤ t* < 125.284
6.4. Pressure Gradient of Generated Bore at SMS
6.4.1. Influence of Leading Waves
6.4.2. No Influence of Leading Wave
| {[P*(t*)]gb}pda = [P*(t*)]pb | (12) |
| = −[Al*(t*)]pb= −[∂uu*(t*)/∂t*]pb | |
| = 0.0222 × exp[−0.0137(t* − 15.243)] for 36.144 ≤ t* ≤ 63.623. |
| {[P*(t*)]gb}pda = [P*(t*)]pb | (13) |
| = −[Al*(t*)]pb = −[∂uu*(t*)/∂t*]pb | |
| = 0.0115 for 63.623 ≤ t* < 125.284, |
6.5. Systematic Summary of Procedure for Exploring Features of Accelerations and Pressure Gradient
7. Concluding Remarks
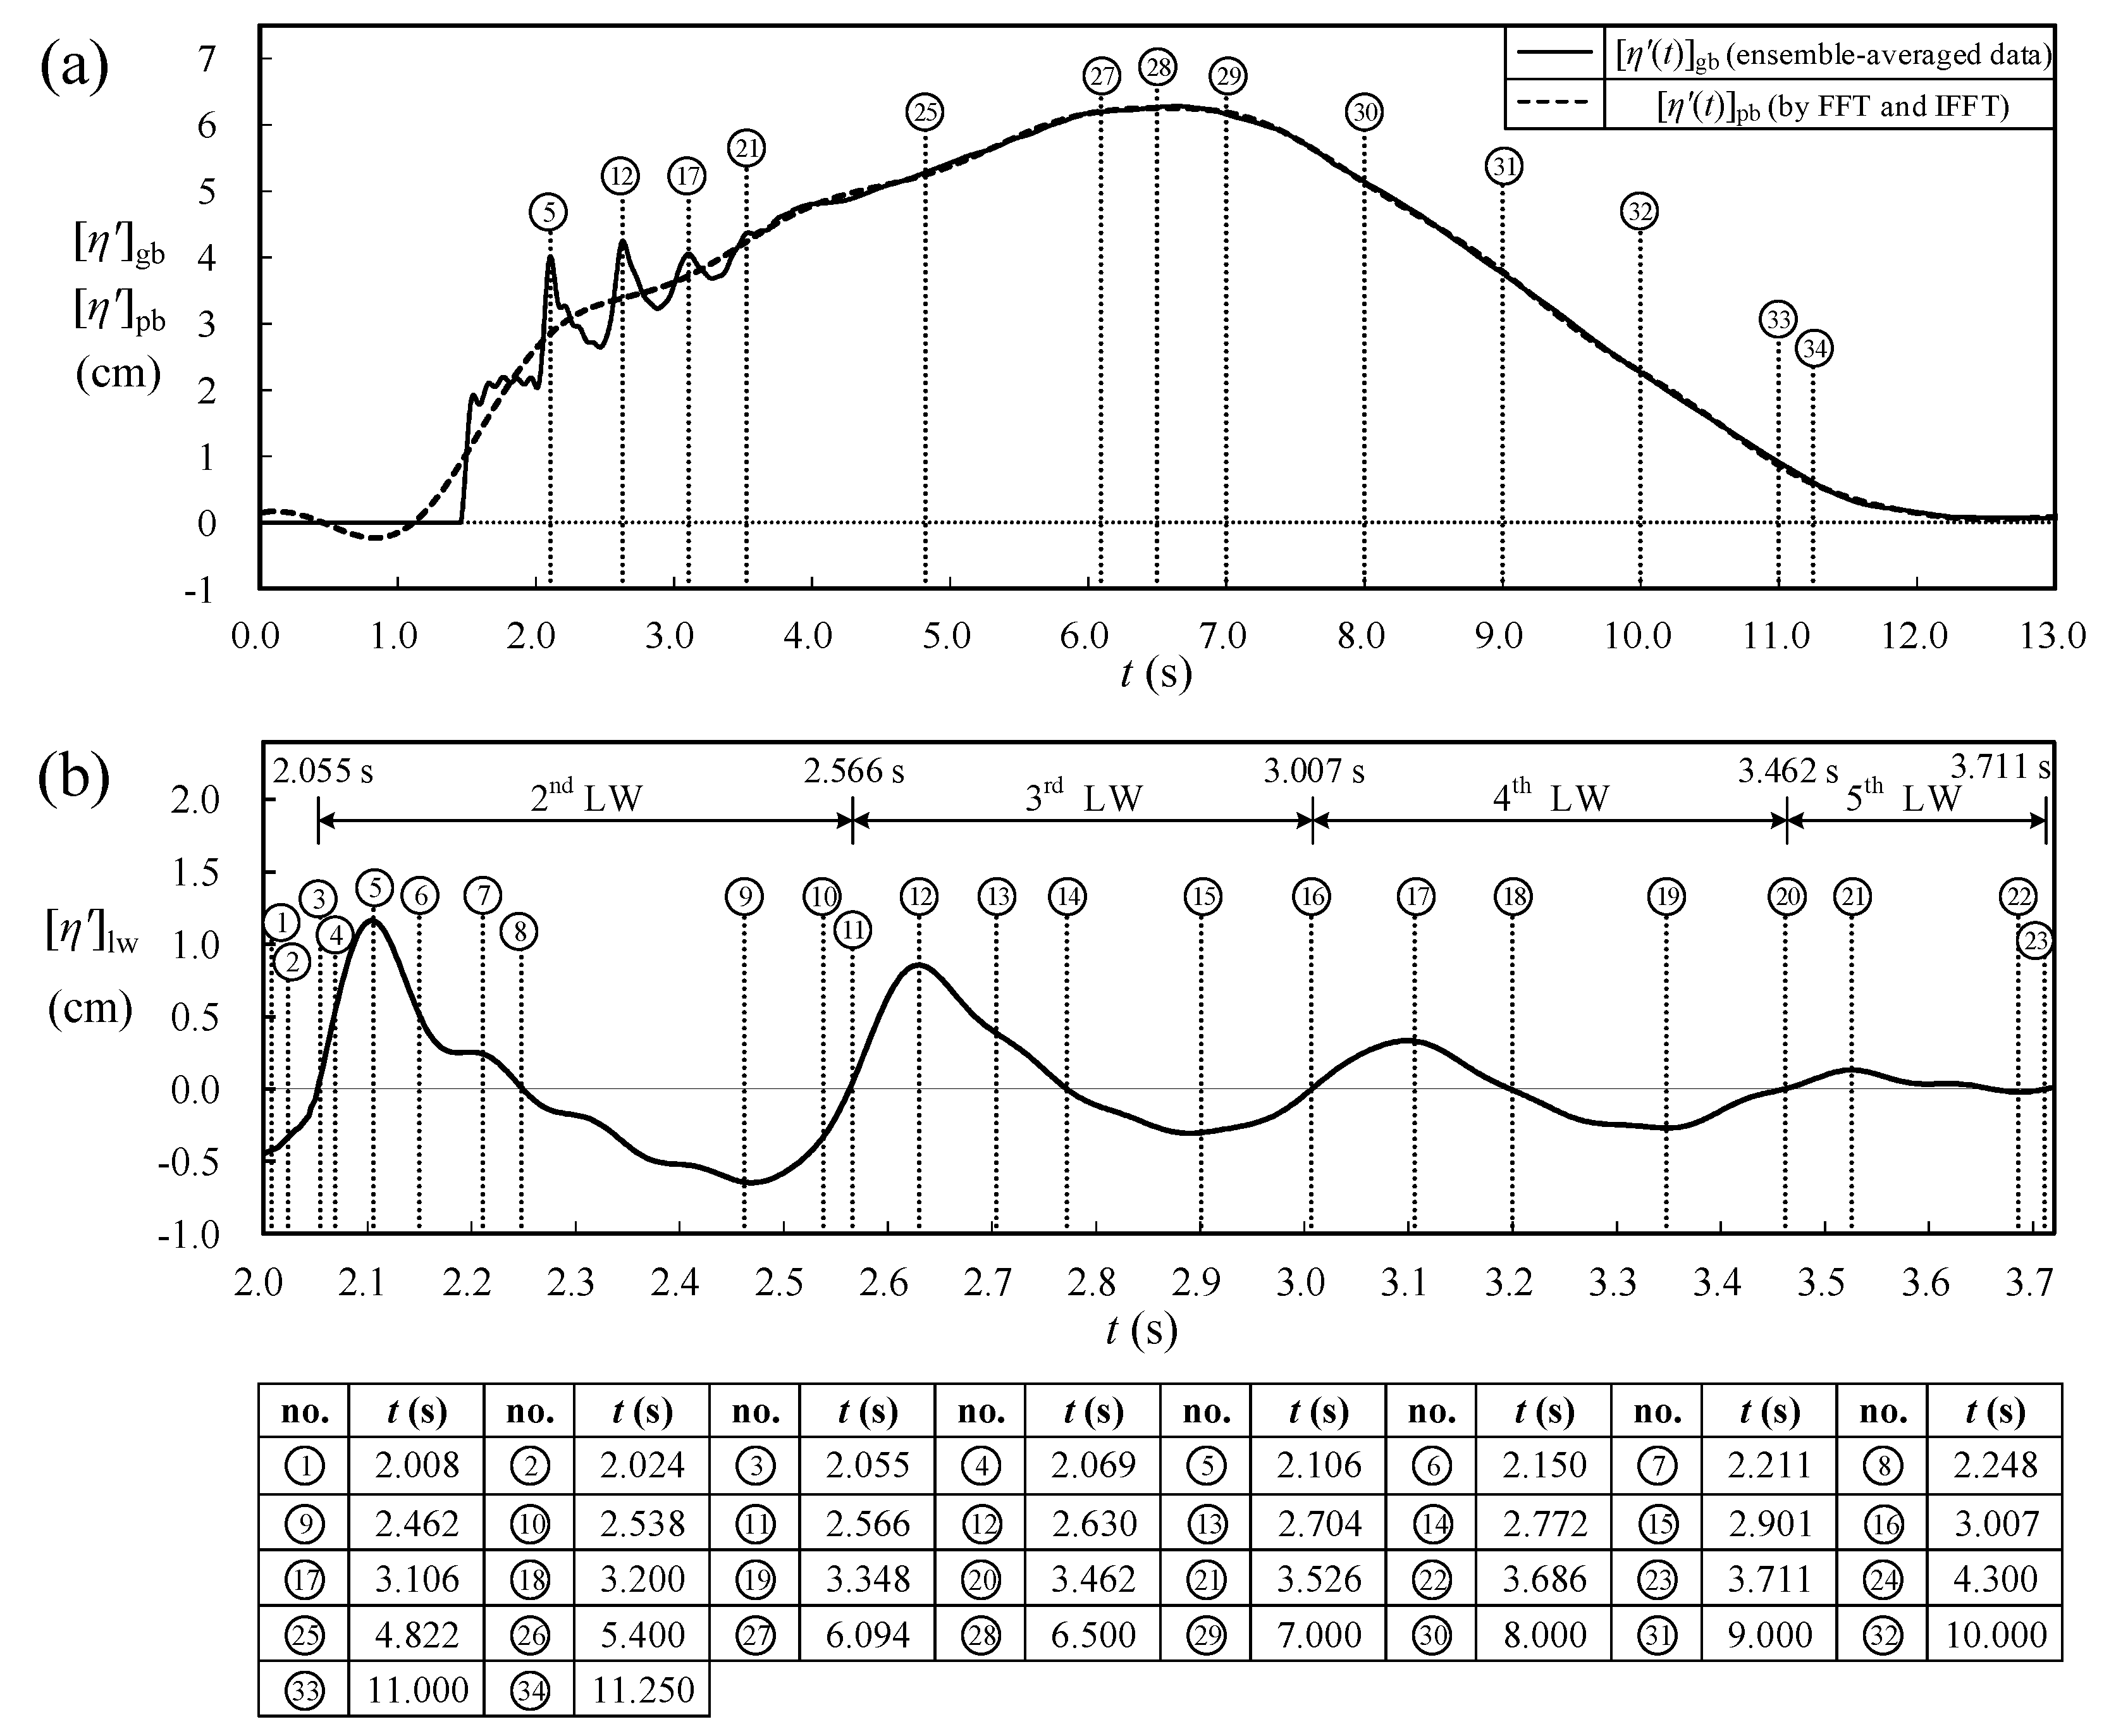
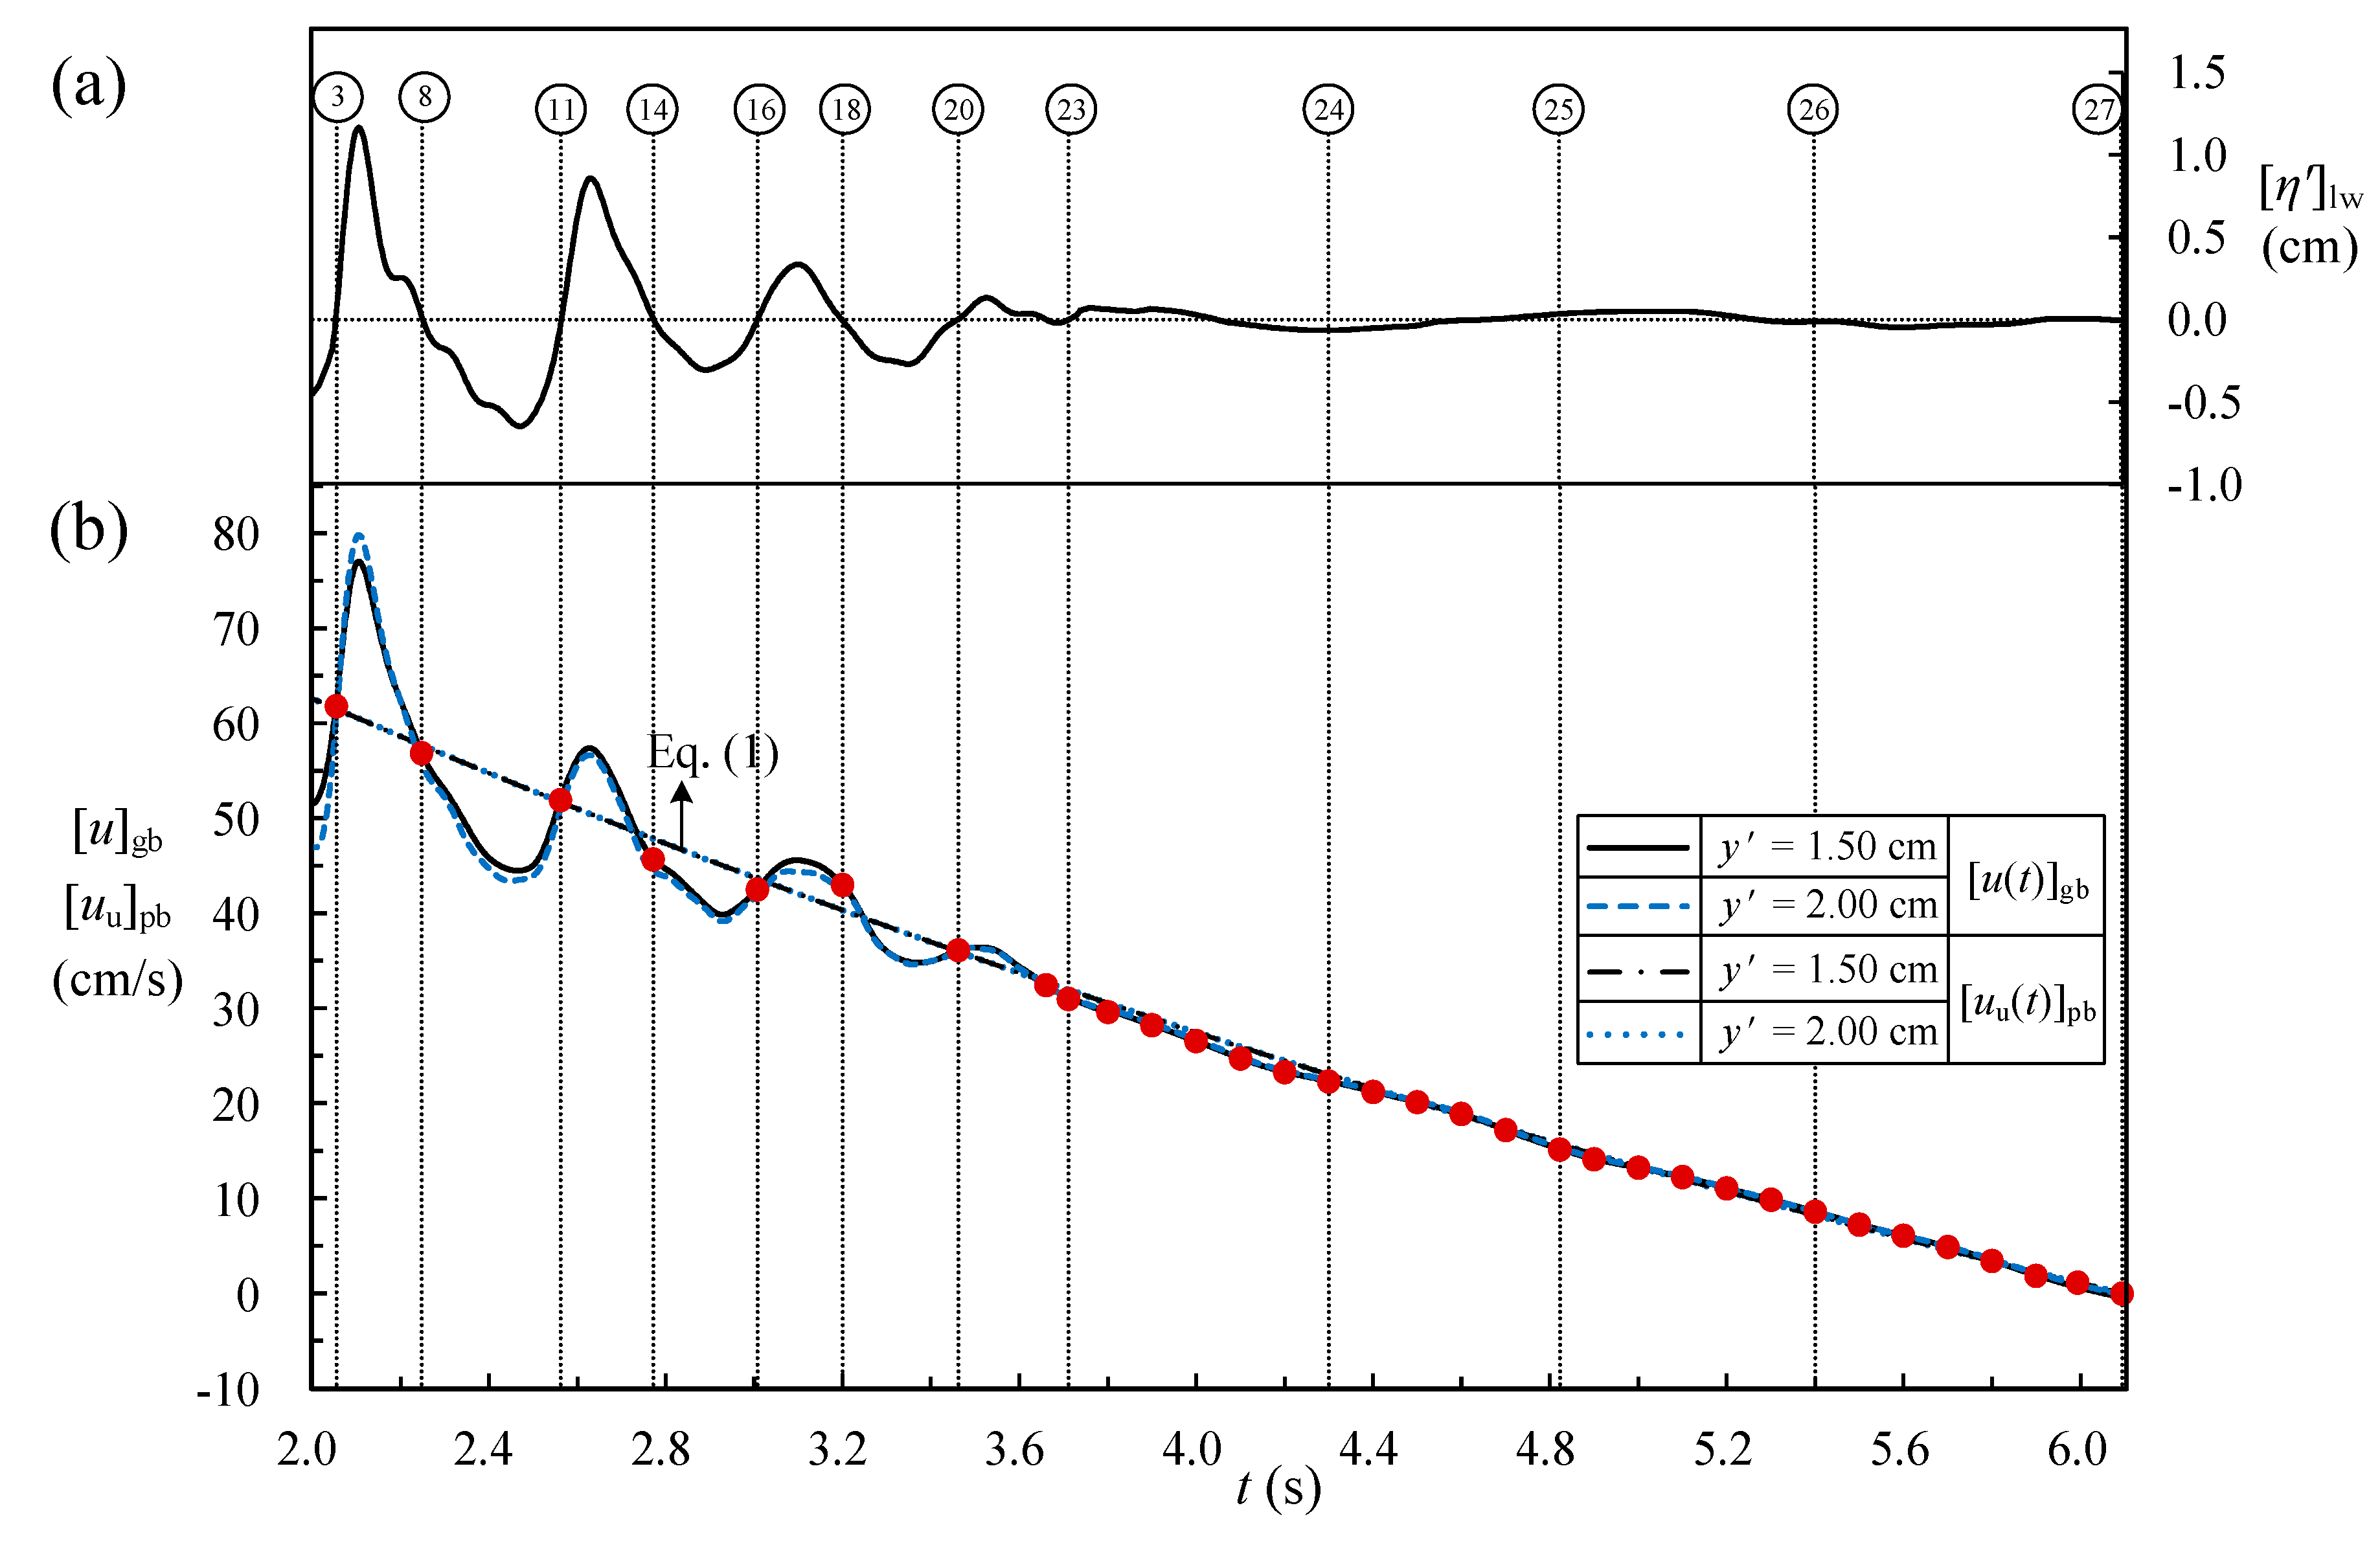
- The 1st leading wave breaks at x* = xbp1/h0 = 11.3 for t* = 8.728, leading to the dissipation of energy due to lifting motion of air bubbles under a bubbly turbulent flow. Under such a situation, rise in the free surface elevation of the 1st leading wave no longer exists. Instead, a plateau-shaped free surface with some small-scale wavy oscillations in the time series of [η′*(t*)]gb is observed for 16.182 < t* < 21.455 prior to arrival of the 2nd leading wave at the SMS for x* = 21.56.
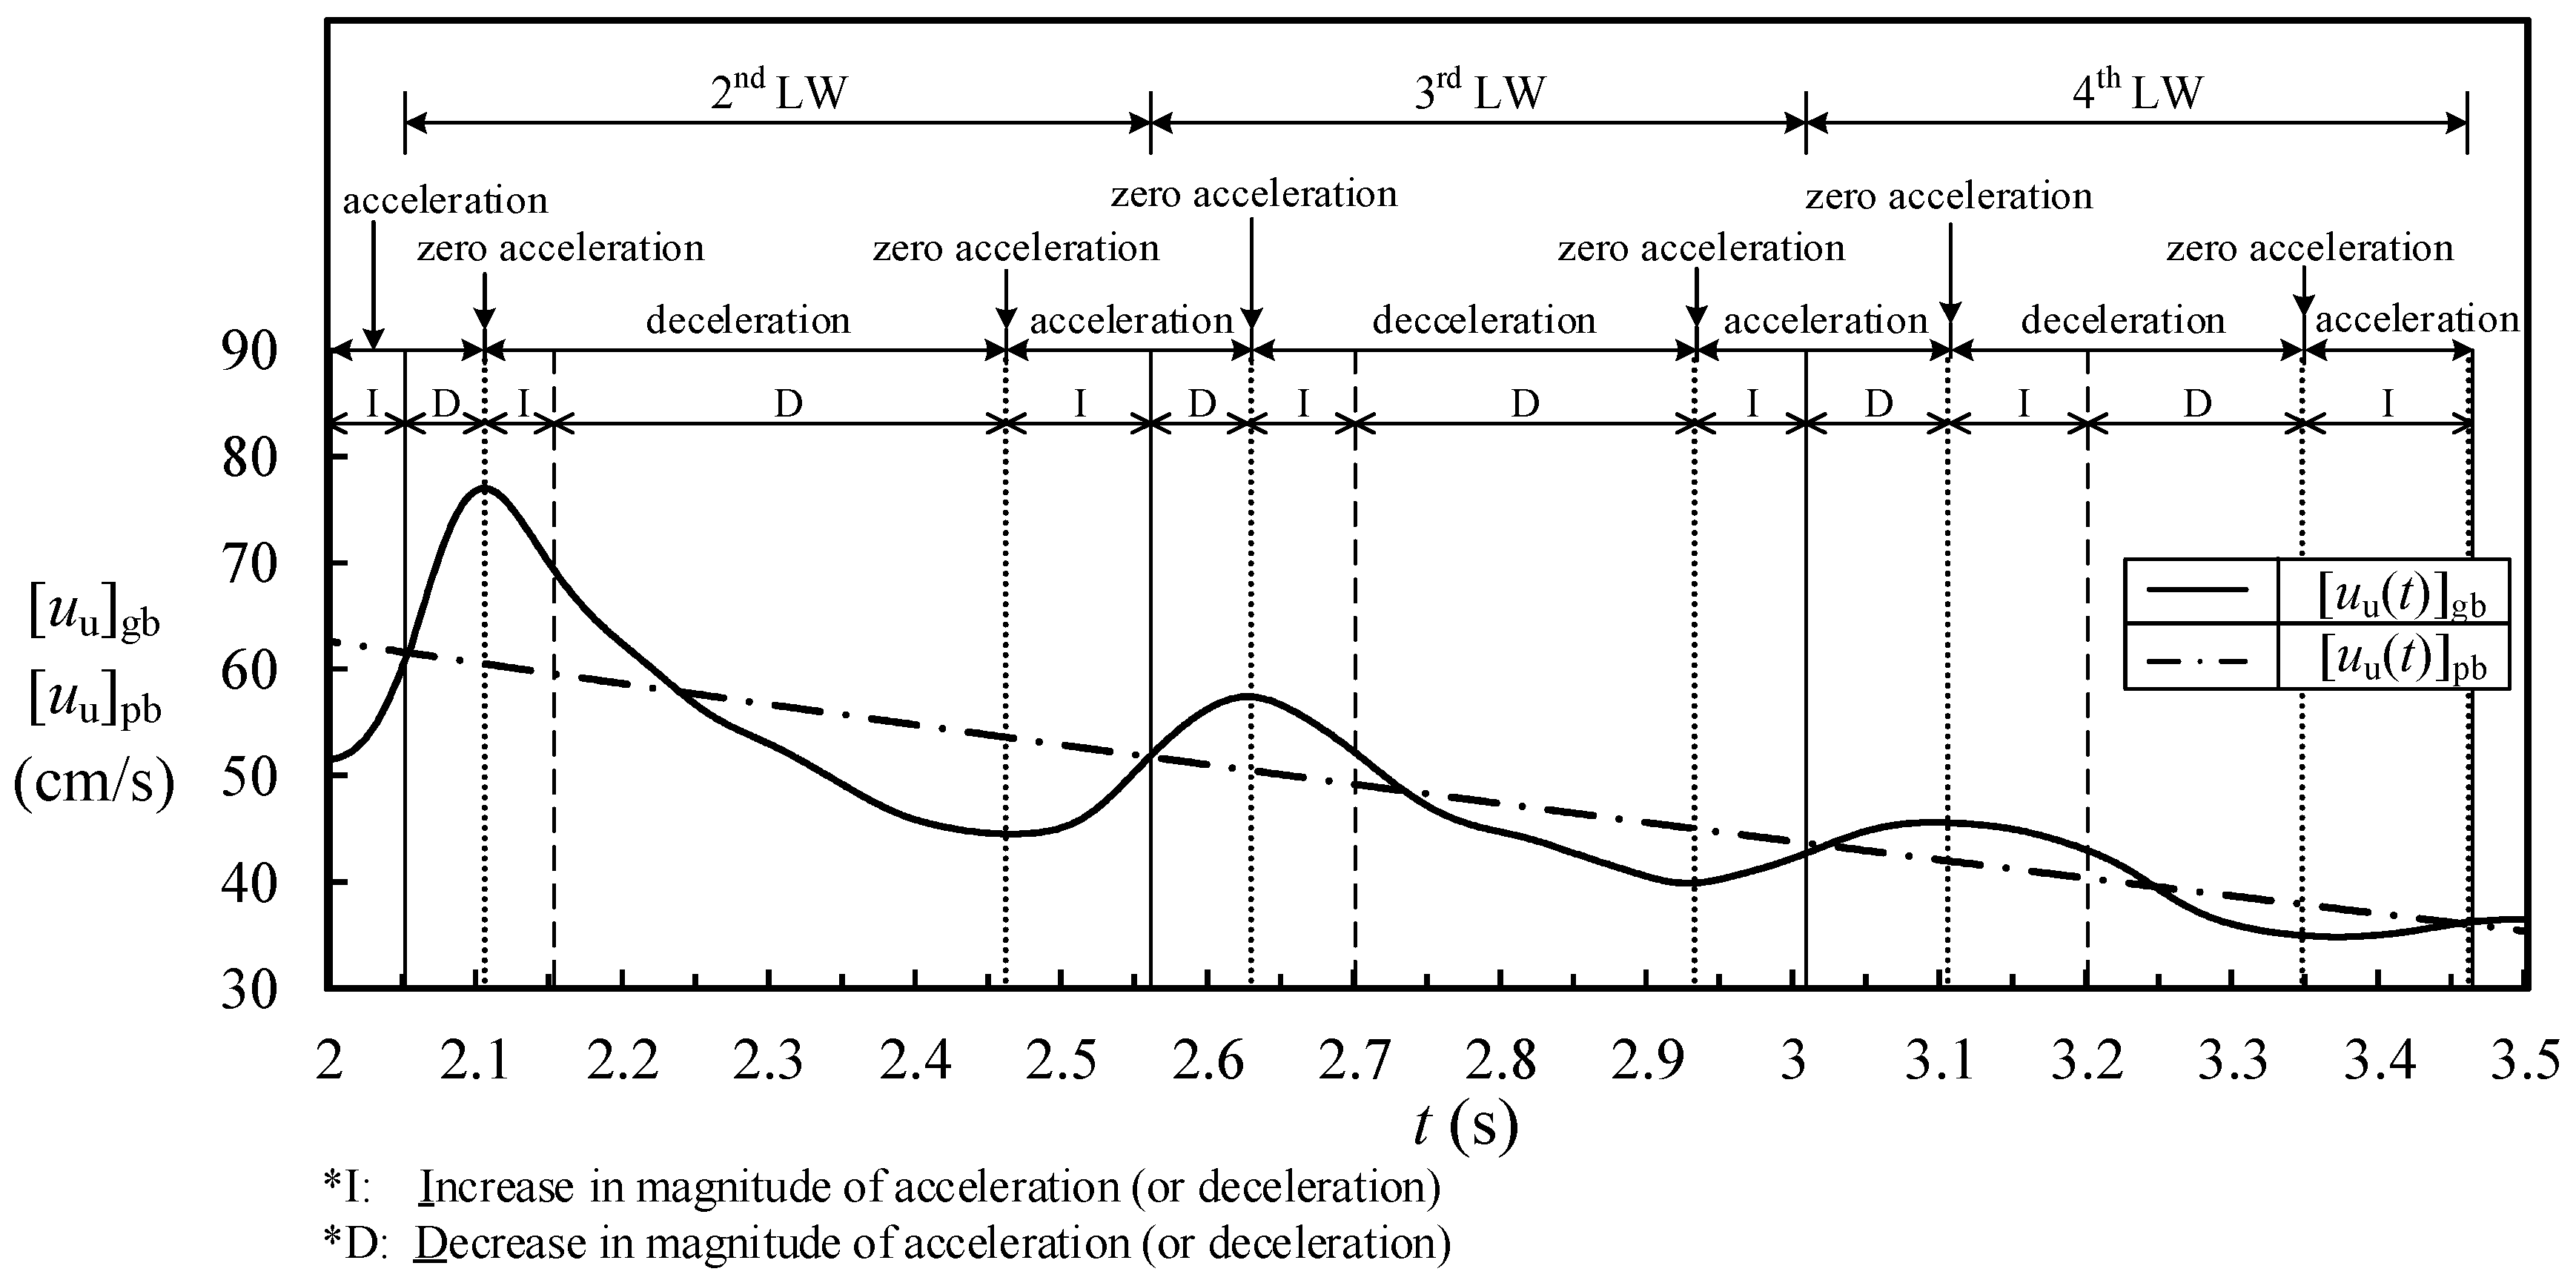
- During the run-up for 20.881 ≤ t* ≤ 63.623, variations of [uu*(t*)]pb and [Al*(t*)]pb with t* for the pure bore are presented by Equations (6) and (8), respectively. The trends exhibit the successive decrease in the non-dimensional (onshore) uniform horizontal velocity and continuous deceleration of the pure bore in the onshore direction. However, the pure bore accompanied by the leading waves is decelerated/accelerated spatially and accelerated/decelerated temporally in the onshore direction during the rising/descending free surface of the nth (with n = 2–4) leading wave. This demonstrates the effect of pre-passing/post-passing of the leading wave crest on the velocity distribution of generated bore. On the other hand, during the run-down for 63.623 ≤ t* < 125.2843, variations of [uu*(t*)]pb and [Al*(t*)]pb with t* are expressed by Equations (7) and (9), respectively. Both trends highlight the magnitude of the non-dimensional (offshore) uniform horizontal velocity increasing linearly and the non-dimensional local acceleration being constant (0.0115 in the offshore direction) with increasing non-dimensional time.
- In the course of the first rising stage of the 2nd leading wave, the values of {[Al*(t*)]gb}pda are all positive with increasing/decreasing trend for 21.455 ≤ t* ≤ 21.601/21.601 ≤ t* < 21.987, respectively. A positive maximum of 0.5403 takes place at t* = 21.601 soon after the zero-up-crossing phase and 0 at t* = 21.987 for the crest level of the 2nd leading wave. This evidence reveals continuous acceleration of the external stream of the generated bore in the onshore direction.
- During the descending stage of the 2nd leading wave for 21.987 ≤ t* ≤ 22.447 and 22.447 ≤ t* ≤ 25.704, the values of {[Al*(t*)]gb}pda are all negative with the increasing and decreasing magnitudes, respectively. A negative maximum of −0.2329 appears at t* = 22.447 after the crest phase and 0 at t* = 25.704 for the trough phase. This situation results in the external stream being decelerated temporally. Further with the second rising stage of the 2nd leading wave for 25.704 ≤ t* ≤ 26.790, {[Al*(t*)]gb}pda increases positively from 0 at t* = 25.704 for the trough phase, to 0.1544 at t* = 26.790 for the ending/zero-up-crossing phase of the 2nd/3rd leading wave. This trend demonstrates the effect of the second rising in the free surface on increasing the values of both {[Al*(t*)]gb}pda and [uu*(t*)]gb of the external stream of the generated bore.
- With passing of the 3rd and 4th leading waves, respectively, for 26.790 ≤ t* ≤ 31.394 and 31.394 ≤ t* ≤ 36.144, the variation feature in {[Al*(t*)]gb}pda is fairly similar to that for the 2nd leading wave but with decreasing magnitudes in the positive and negative extrema of {[Al*(t*)]gb}pda. Moreover, the contributions from the kth leading wave (with k ≥ 5) are much smaller and their influences can be neglected. Afterwards, the non-dimensional local acceleration of the external stream of the generated bore can be regarded as being nearly contributed only by the pure bore, i.e., {[Al*(t*)]gb}pda ≈ {[Al*(t*)]pb}pda = [Al*(t*)]pb for t* > 36.144.
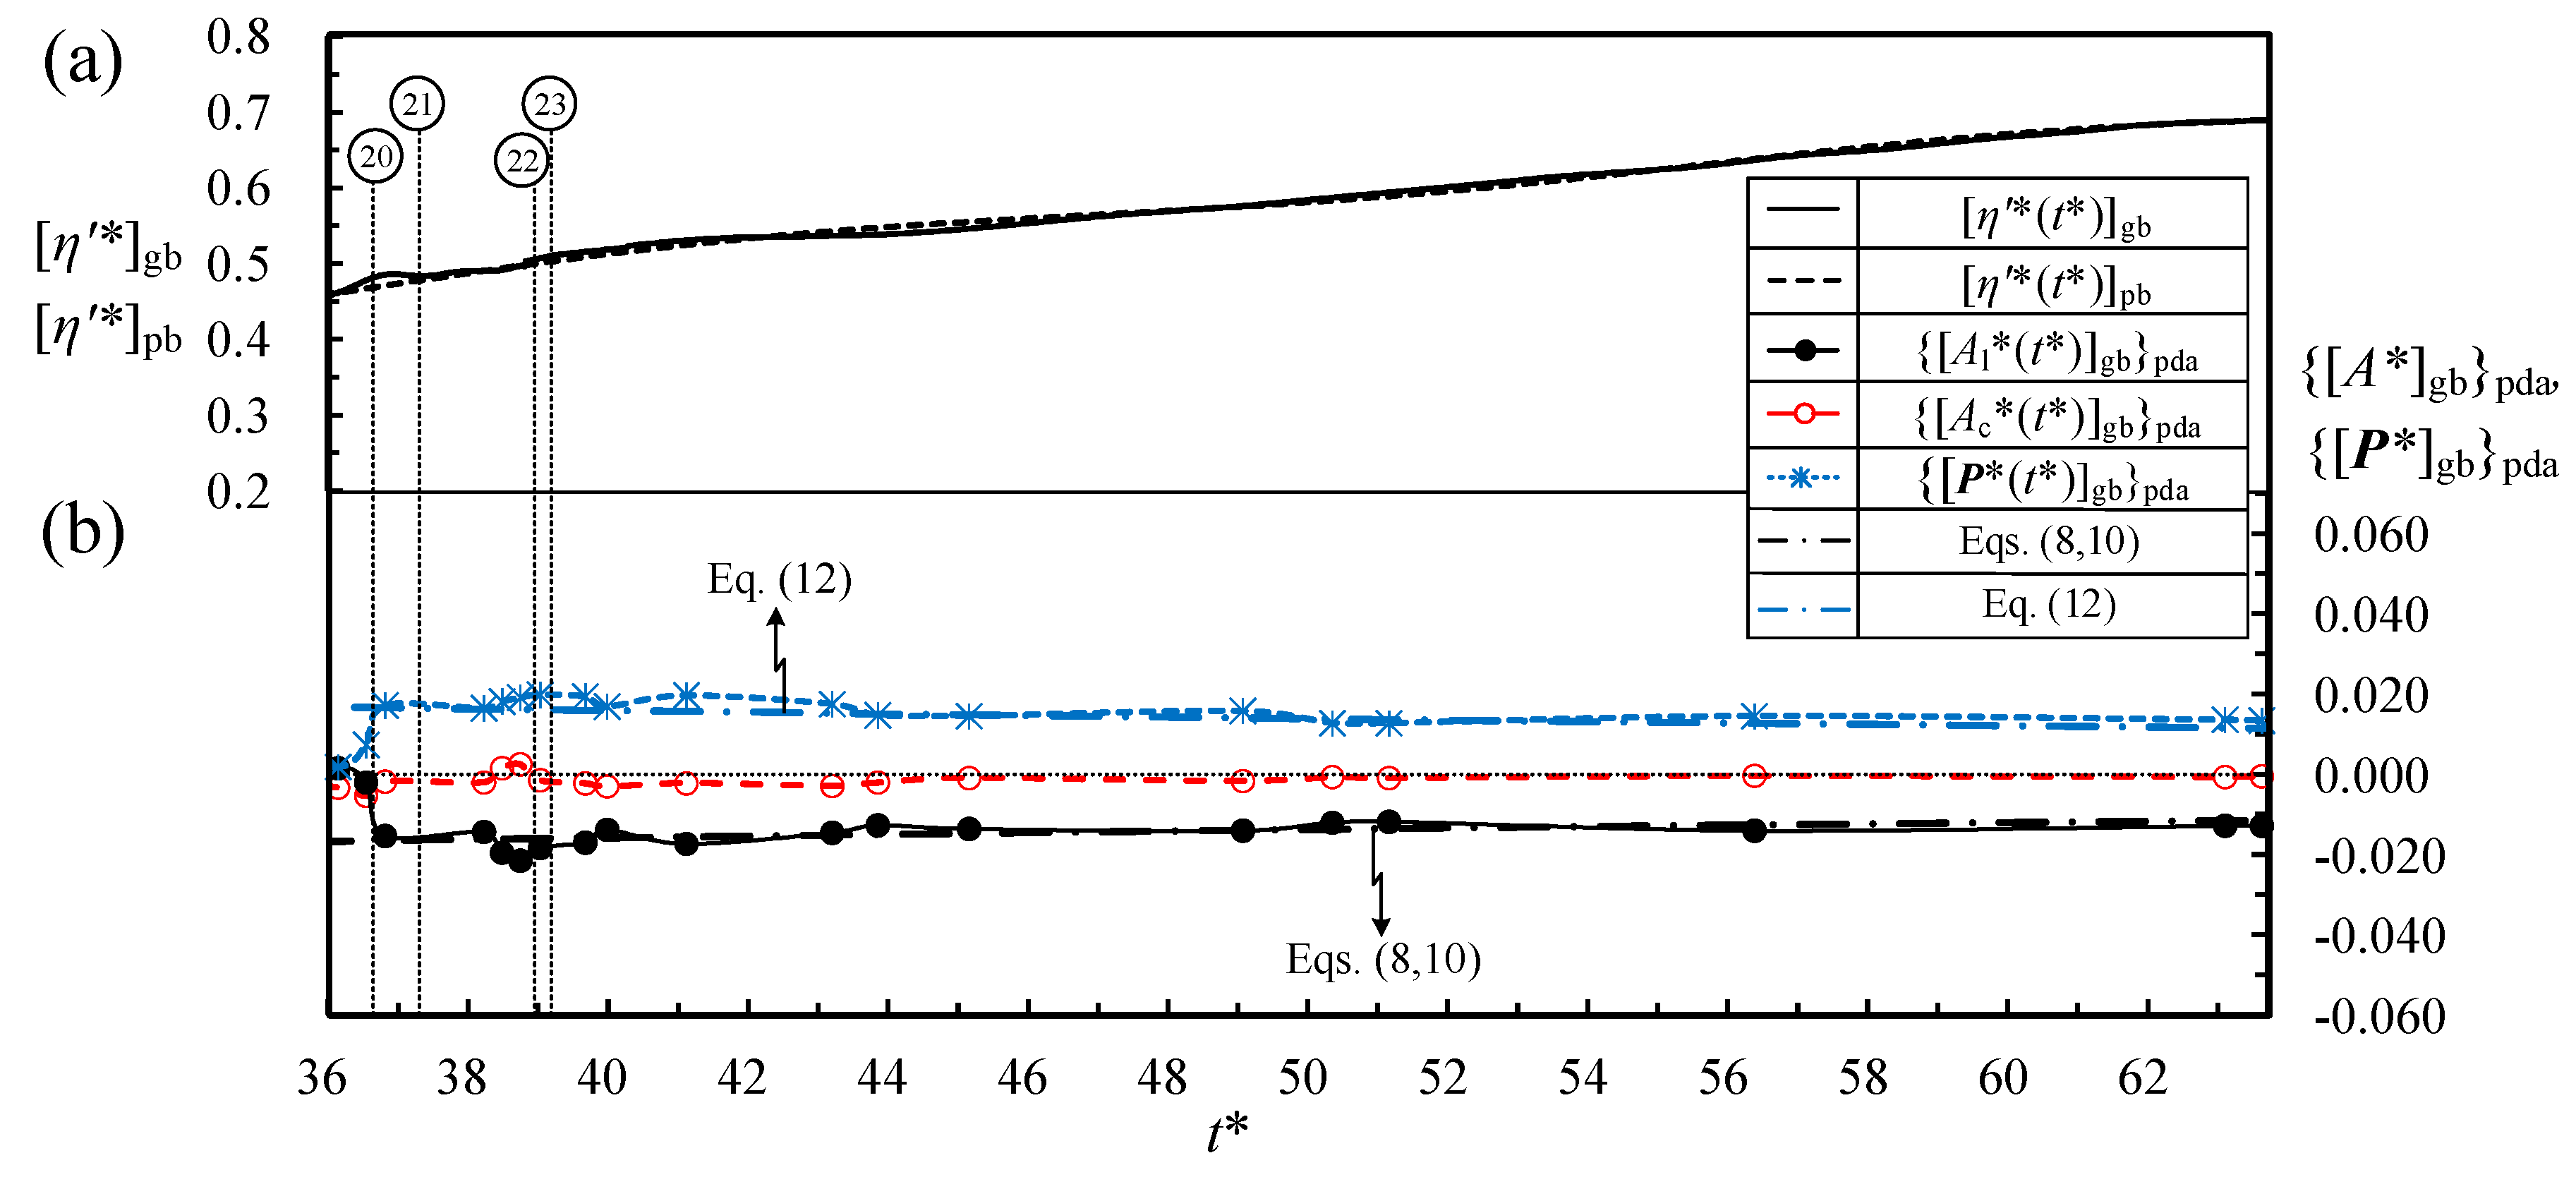
- Furthermore, for the run-up with 36.144 < t* ≤ 63.623, {[Al*(t*)]gb}pda is approximately equal to [Al*(t*)]pb (i.e., Equation (8)), clearly justifying deceleration of the generated (or pure) bore with temporally exponential decay trend in the onshore direction. Moreover, during the run-down for 63.623 ≤ t* < 125.284, {[Al*(t*)]gb}pda amounts to [Al*(t*)]pb = −0.0115 (i.e., Equation (9)), revealing a constant acceleration of the pure bore in the offshore direction and increase of the offshore uniform horizontal velocity with time.
- The non-dimensional (onshore) uniform horizontal velocity, contributed by the “pure bore” during the run-up, is always decelerated due to the negative value of the non-dimensional local acceleration shoreward before arrival of the free-surface peak level of the pure bore at t* = 63.623. However, due to passing of the nth leading wave for 21.455 ≤ t* ≤ 36.144, the non-dimensional onshore uniform horizontal velocity of the “generated bore” exhibits drastic variation in flow acceleration and deceleration in the horizontal direction. The most striking influence of the velocity shift on the non-dimensional local acceleration of the generated bore is evidenced at the phase soon after the zero-up-crossing level of the 2nd leading wave. Namely, at t* = 21.601, {[Al*]gb}pda of the generated bore is equal to 0.5403, far larger than that ({[Al*]pb}pda = [Al*]pb = −0.0204) of the pure bore. Similar qualitative features are also experienced for the 3rd and 4th leading waves but with evident decreasing magnitudes.
- During the first rising stage of the 2nd leading wave 21.455 ≤ t* ≤ 21.987, the value of {[Ac*(t*)]gb}pda varies from −0.2200 via −0.3686 (negative maximum), −0.1704 to 0.0043 respectively at t* = 21.455 (for zero-up-crossing phase), 21.601 (soon after the zero-up-crossing phase), 21.841 to 21.987 (for the crest phase). For the entire descending stage for 21.987 ≤ t* ≤ 25.704, {[Ac*(t*)]gb}pda ranges from 0.0043, via 0.1119 (positive maximum), to 0 at t* = 21.987, 22.447 to 25.704 for the trough level. Moreover, during the second rising stage, the value of{[Ac*(t*)]gb}pda varies from 0, via −0.0271 for t* = 26.247, down to −0.0686 for t* = 26.790. Pre-passing and post-passing of the 2nd leading-wave crest renders {[Ac*(t*)]gb}pda to be negative and positive, respectively. Similar features are also observed for the 3rd and 4th leading waves but with decreasing magnitudes. However, the contribution from the kth leading wave (with k ≥ 5) to {[Ac*(t*)]gb}pda is much smaller and their effects can be neglected. Afterwards, the non-dimensional convective acceleration can be regarded as being mostly contributed by the external stream of the pure bore for t* > 36.144. Due to very minor effect or lacking of the leading waves as well as the non-dimensional uniform horizontal velocity of pure bore being constant in the y* direction ([∂uu*(t*)/∂y*]pb = 0), the values of {[Ac*(t*)]gb}pda are eventually found to be around ±O(10−3) for 36.144 < t* < 125.284. The values are far smaller than the positive maximum of the non-dimensional local acceleration of the 2nd leading wave ({[Al*(t*)]gb}pda = 0.5403 at t* = 21.601) and thus their influences are ignored.
- Additionally, for the first rising stage of the 2nd leading wave with 21.455 < t* < 21.987, the values of {[P*]gb}pda and {[Al*]gb}pda are all negative and positive, with their extrema of −0.1717 and 0.5403 occurring at t* = 21.601. This reveals that the external stream is accelerated both spatially and temporally in the onshore direction under the favorable pressure gradient due to pre-passing of the crest for the 2nd leading wave. At t* = 21.987 for the crest phase, the values of {[P*]gb}pda, {[Al*]gb}pda and {[Ac*]gb}pda are very close to 0. This feature highlights the external stream is instantaneously almost under zero pressure gradient.
- During the descending stage of the 2nd leading wave for 21.987 < t* < 25.704, the values of {[P*]gb}pda and {[Al*]gb}pda are all positive and negative, respectively, along with the positive and negative extrema of 0.1189 and −0.2329 occurring at t* = 22.447. The trend justifies that the external stream is decelerated both spatially and temporally in the onshore direction under adverse pressure gradient due to post-passing of the 2nd leading wave crest for 21.987 < t* < 25.704. Exactly at the trough level for t* = 25.704, the values of {[P*]gb}pda, {[Al*]gb}pda and {[Ac*]gb}pda are equal or very close to 0. The fact indicates that the generated bore is instantaneously nearly under zero pressure gradient, together with the non-dimensional local and convective accelerations equal to 0 at t* = 25.704 for the trough phase.
- Further, during the second rising stage of the 2nd leading wave for 25.704 < t* < 26.790, the value of {[P*]gb}pda decreases from nearly 0 to the local negative maximum of −0.0857, together with increase in the positive value of {[Al*]gb}pda. Therefore, the external stream of generated bore subject to the favorable pressure gradient is accelerated spatially and temporally. A similar feature of the temporal variation in {[P*]gb}pda occurs for the 3rd and 4th leading waves but all with decreasing magnitudes for 26.790 ≤ t* ≤ 36.144. Additionally, the remaining kth leading wave (with k ≥ 5) plays little role on the non-dimensional convective acceleration for t* > 36.144, thus the influence can be neglected.
- In addition, for the run-up with 36.144 ≤ t* ≤ 63.623, the variation of {[P*]gb}pda with t* indicates that deceleration of the external stream of the generated (or pure) bore keeps undergoing shoreward under the adverse pressure gradient with decreasing magnitude as expressed by Equation (12). However, during the run-down for 63.623 ≤ t* < 125.284, {[P*]gb}pda is equal to 0.0115 in the onshore direction, i.e., −{[P*]gb}pda = −0.0115 (Equation (13)), being negative in the offshore direction. This result demonstrates that the external stream of the generated bore (or pure bore) is accelerated in the offshore direction with a non-dimensional acceleration of 0.0115 and under a non-dimensional favorable pressure gradient of −0.0115.
Author Contributions
Funding
Acknowledgments
Conflicts of Interest
Nomenclature
| Term | Definition |
| Ac | (=Ac1 + Ac2), convective acceleration (LT−2) |
| Ac1 | (=u∂u/∂x), 1st convective acceleration (LT−2) |
| Ac2 | (=v∂u/∂y), 2nd convective acceleration (LT−2) |
| Al | (=∂u/∂t), local acceleration (LT−2) |
| At | (=Al + Ac1 + Ac2), total acceleration (LT−2) |
| Dr | relative deviation (-) |
| f | frequency (T−1) |
| ffd | frequency demarcation (T−1) |
| Fr0 | (=Ubf/(gh0)1/2), Froude number (-) |
| g | gravity acceleration (LT−2) |
| h0 | downstream still water depth (L) |
| h1 | upstream still water depth (L) |
| hp | potential associated with gravitational force (L) |
| k | (with k ≥ 5), order of leading wave (-) |
| n | (=1–4), order of leading wave (-) |
| p | pressure (ML−1T−2) |
| P | (=(1/ρ)∂p/∂x), pressure gradient divided by density (LT−2) |
| S0 | slope of sloping beach (-) |
| t | time defined relative position of crest of 1st leading wave from toe of sloping beach (T) |
| t′ | time defined with respect to gate opening initially (T) |
| ts | specified time (T) |
| u | ensemble-averaged horizontal velocity (LT−1) |
| Ubf | bore front velocity (LT−1) |
| uu | uniform horizontal velocity in external stream (LT−1) |
| v | ensemble-averaged vertical velocity (LT−1) |
| x | horizontal onshore distance with x = 0 located at toe of sloping beach (L) |
| xbpn | breaking point of nth leading wave in x direction (n = 1–4) (L) |
| xRmax | position of maximum run-up height at x direction (L) |
| xSMS | (=194.0 cm), position of specified measuring section in x direction (L) |
| xsws | (=180.0 cm), position of still-water-shoreline in x direction (L) |
| y | vertical upward distance measured from horizontal bottom (L) |
| y′ | (=y − x/20), a translated ordinate used to mark height above beach surface (L) |
| Δt | time interval (T) |
| Δtframing | time elapse between two consecutive images taken by high-speed camera at specified framing rate (T) |
| Δx | spatial interval (L) |
| µ | dynamic viscosity (ML−1T−1) |
| ρ | fluid density (ML−3) |
| η | free surface elevation with reference to h0 (L) |
| η´ | free surface elevation with reference to beach surface (L) |
| ηfb | freeboard of free surface elevation (L) |
| (…)* | variable in dimensionless form |
| (…)max | maximum value of a physical quantity |
| […]gb | physical quantity of generated bore |
| […]lw | physical quantity of leading wave |
| […]pb | physical quantity of pure bore |
| {…}pda | partially depth-averaged value of physical quantity |
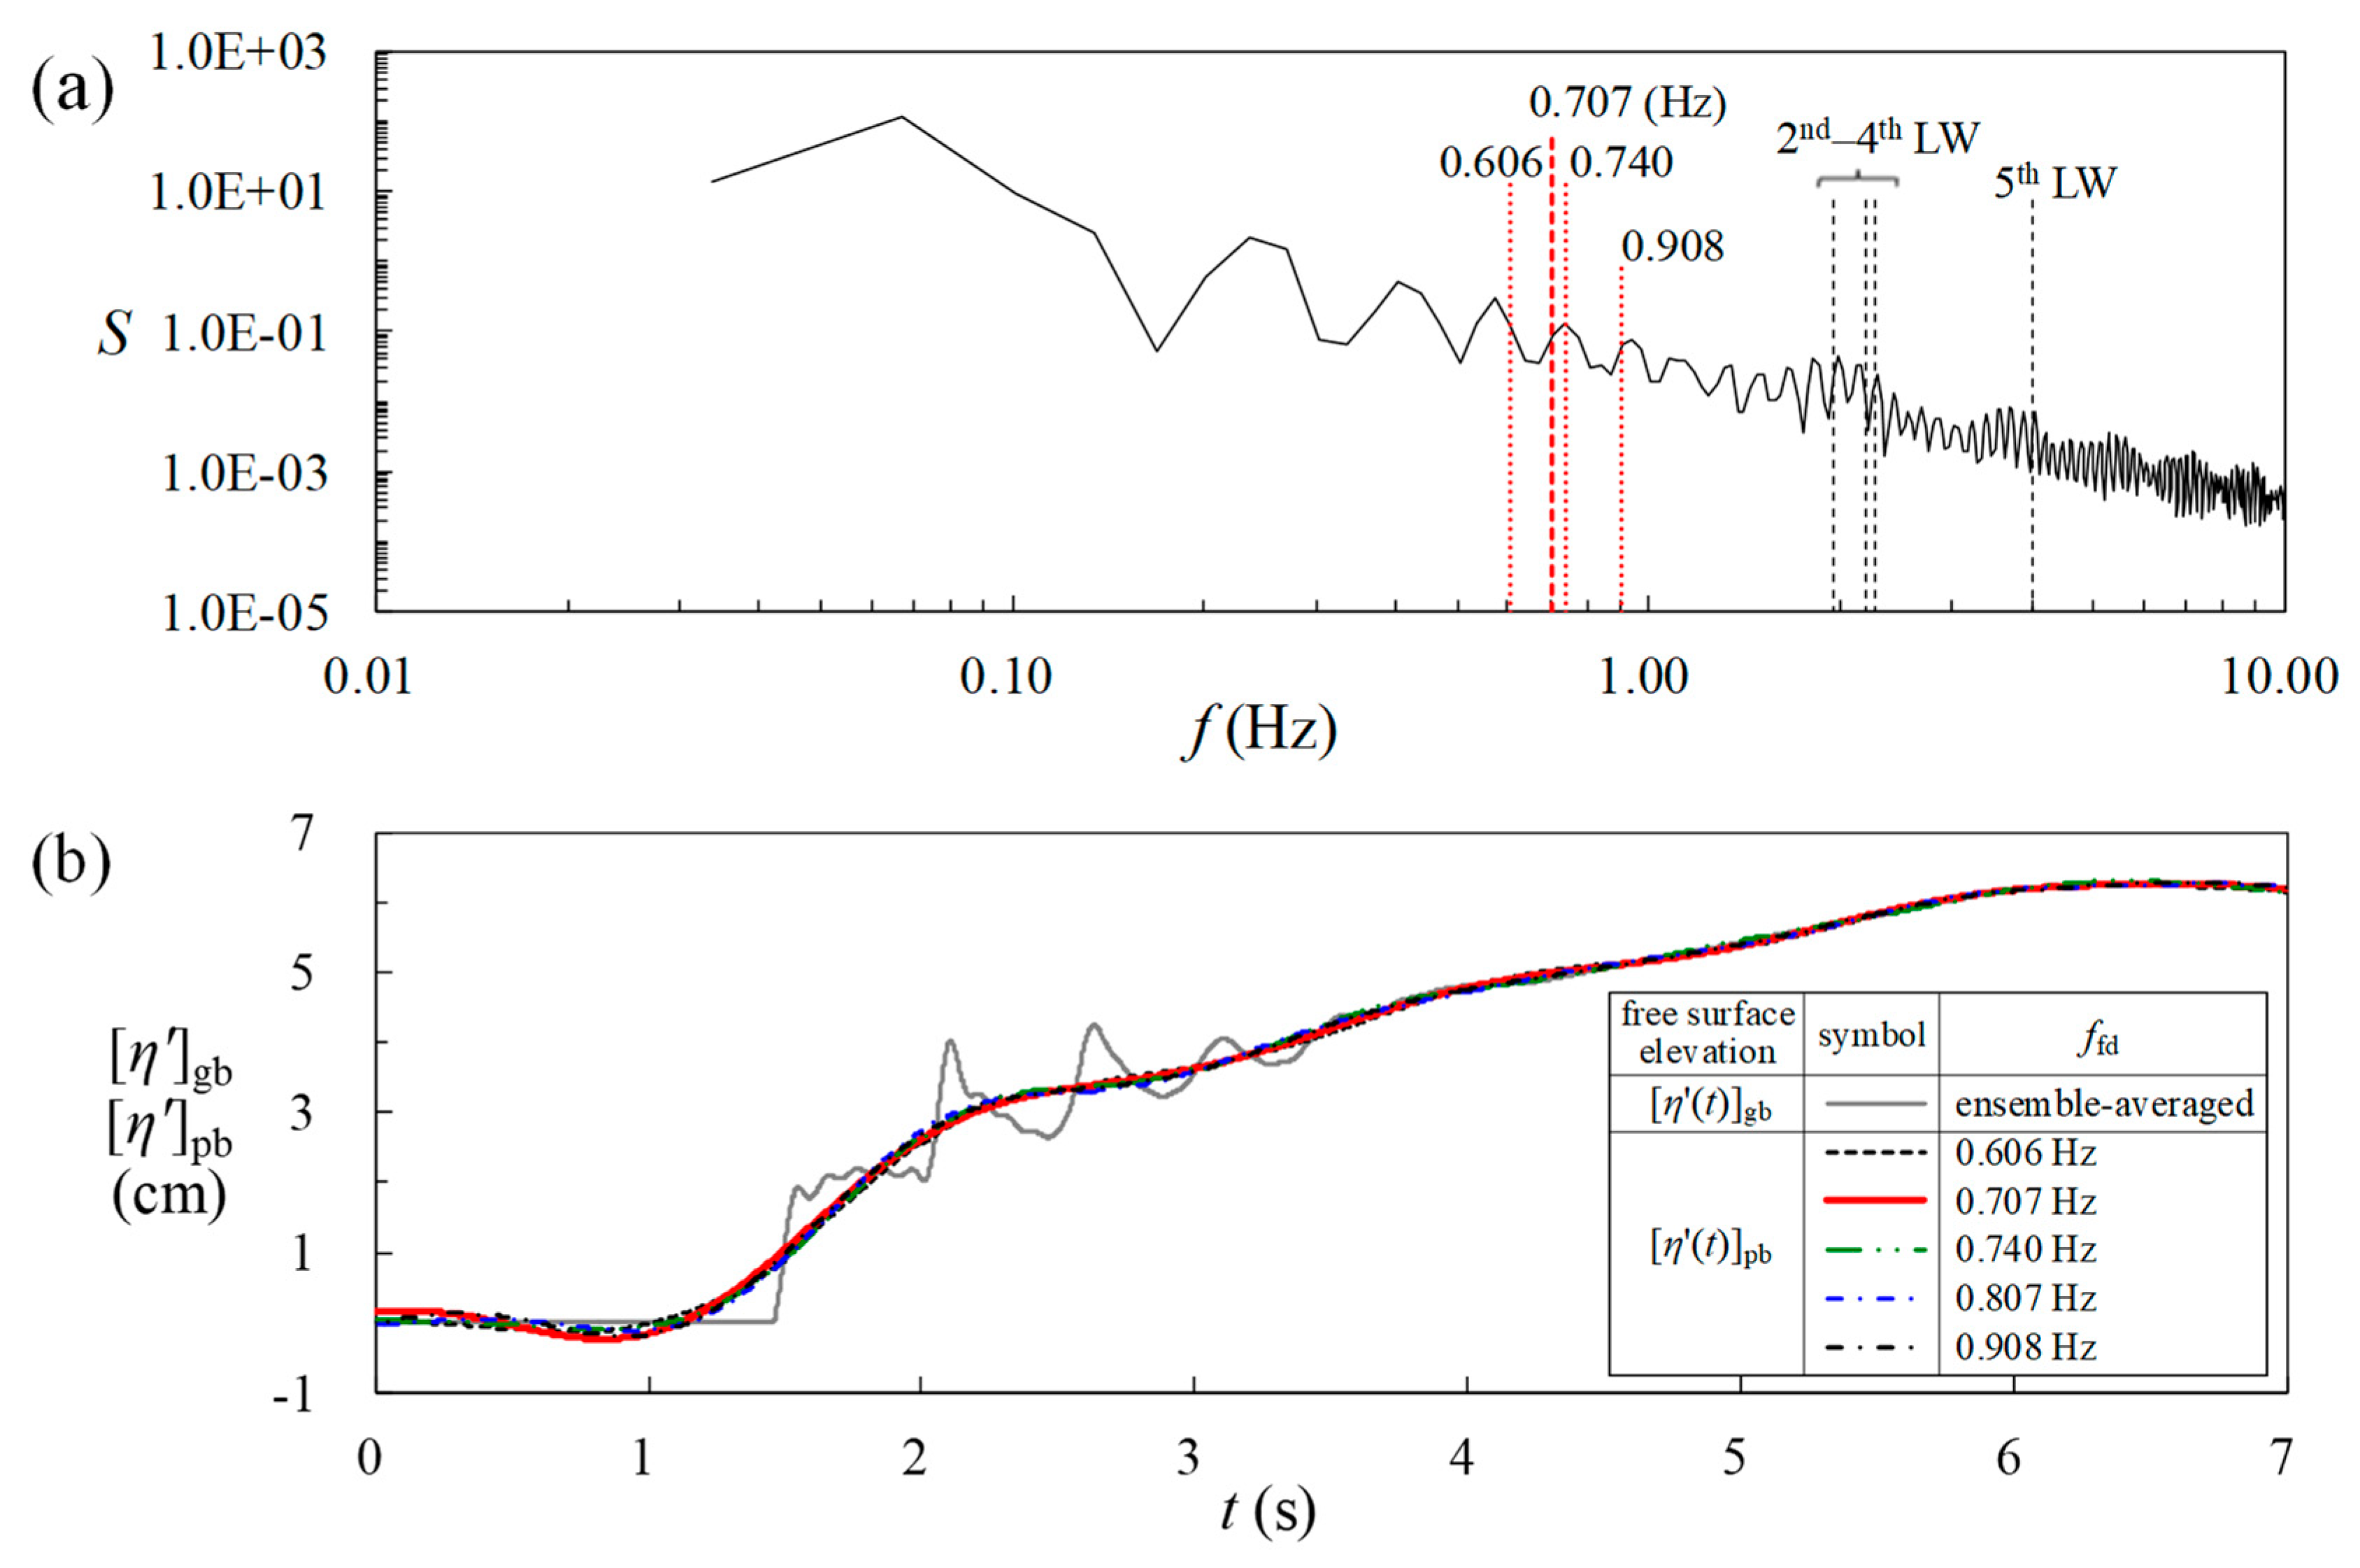
Appendix A. Decomposition of Free Surface Elevation Using FFT and IFFT
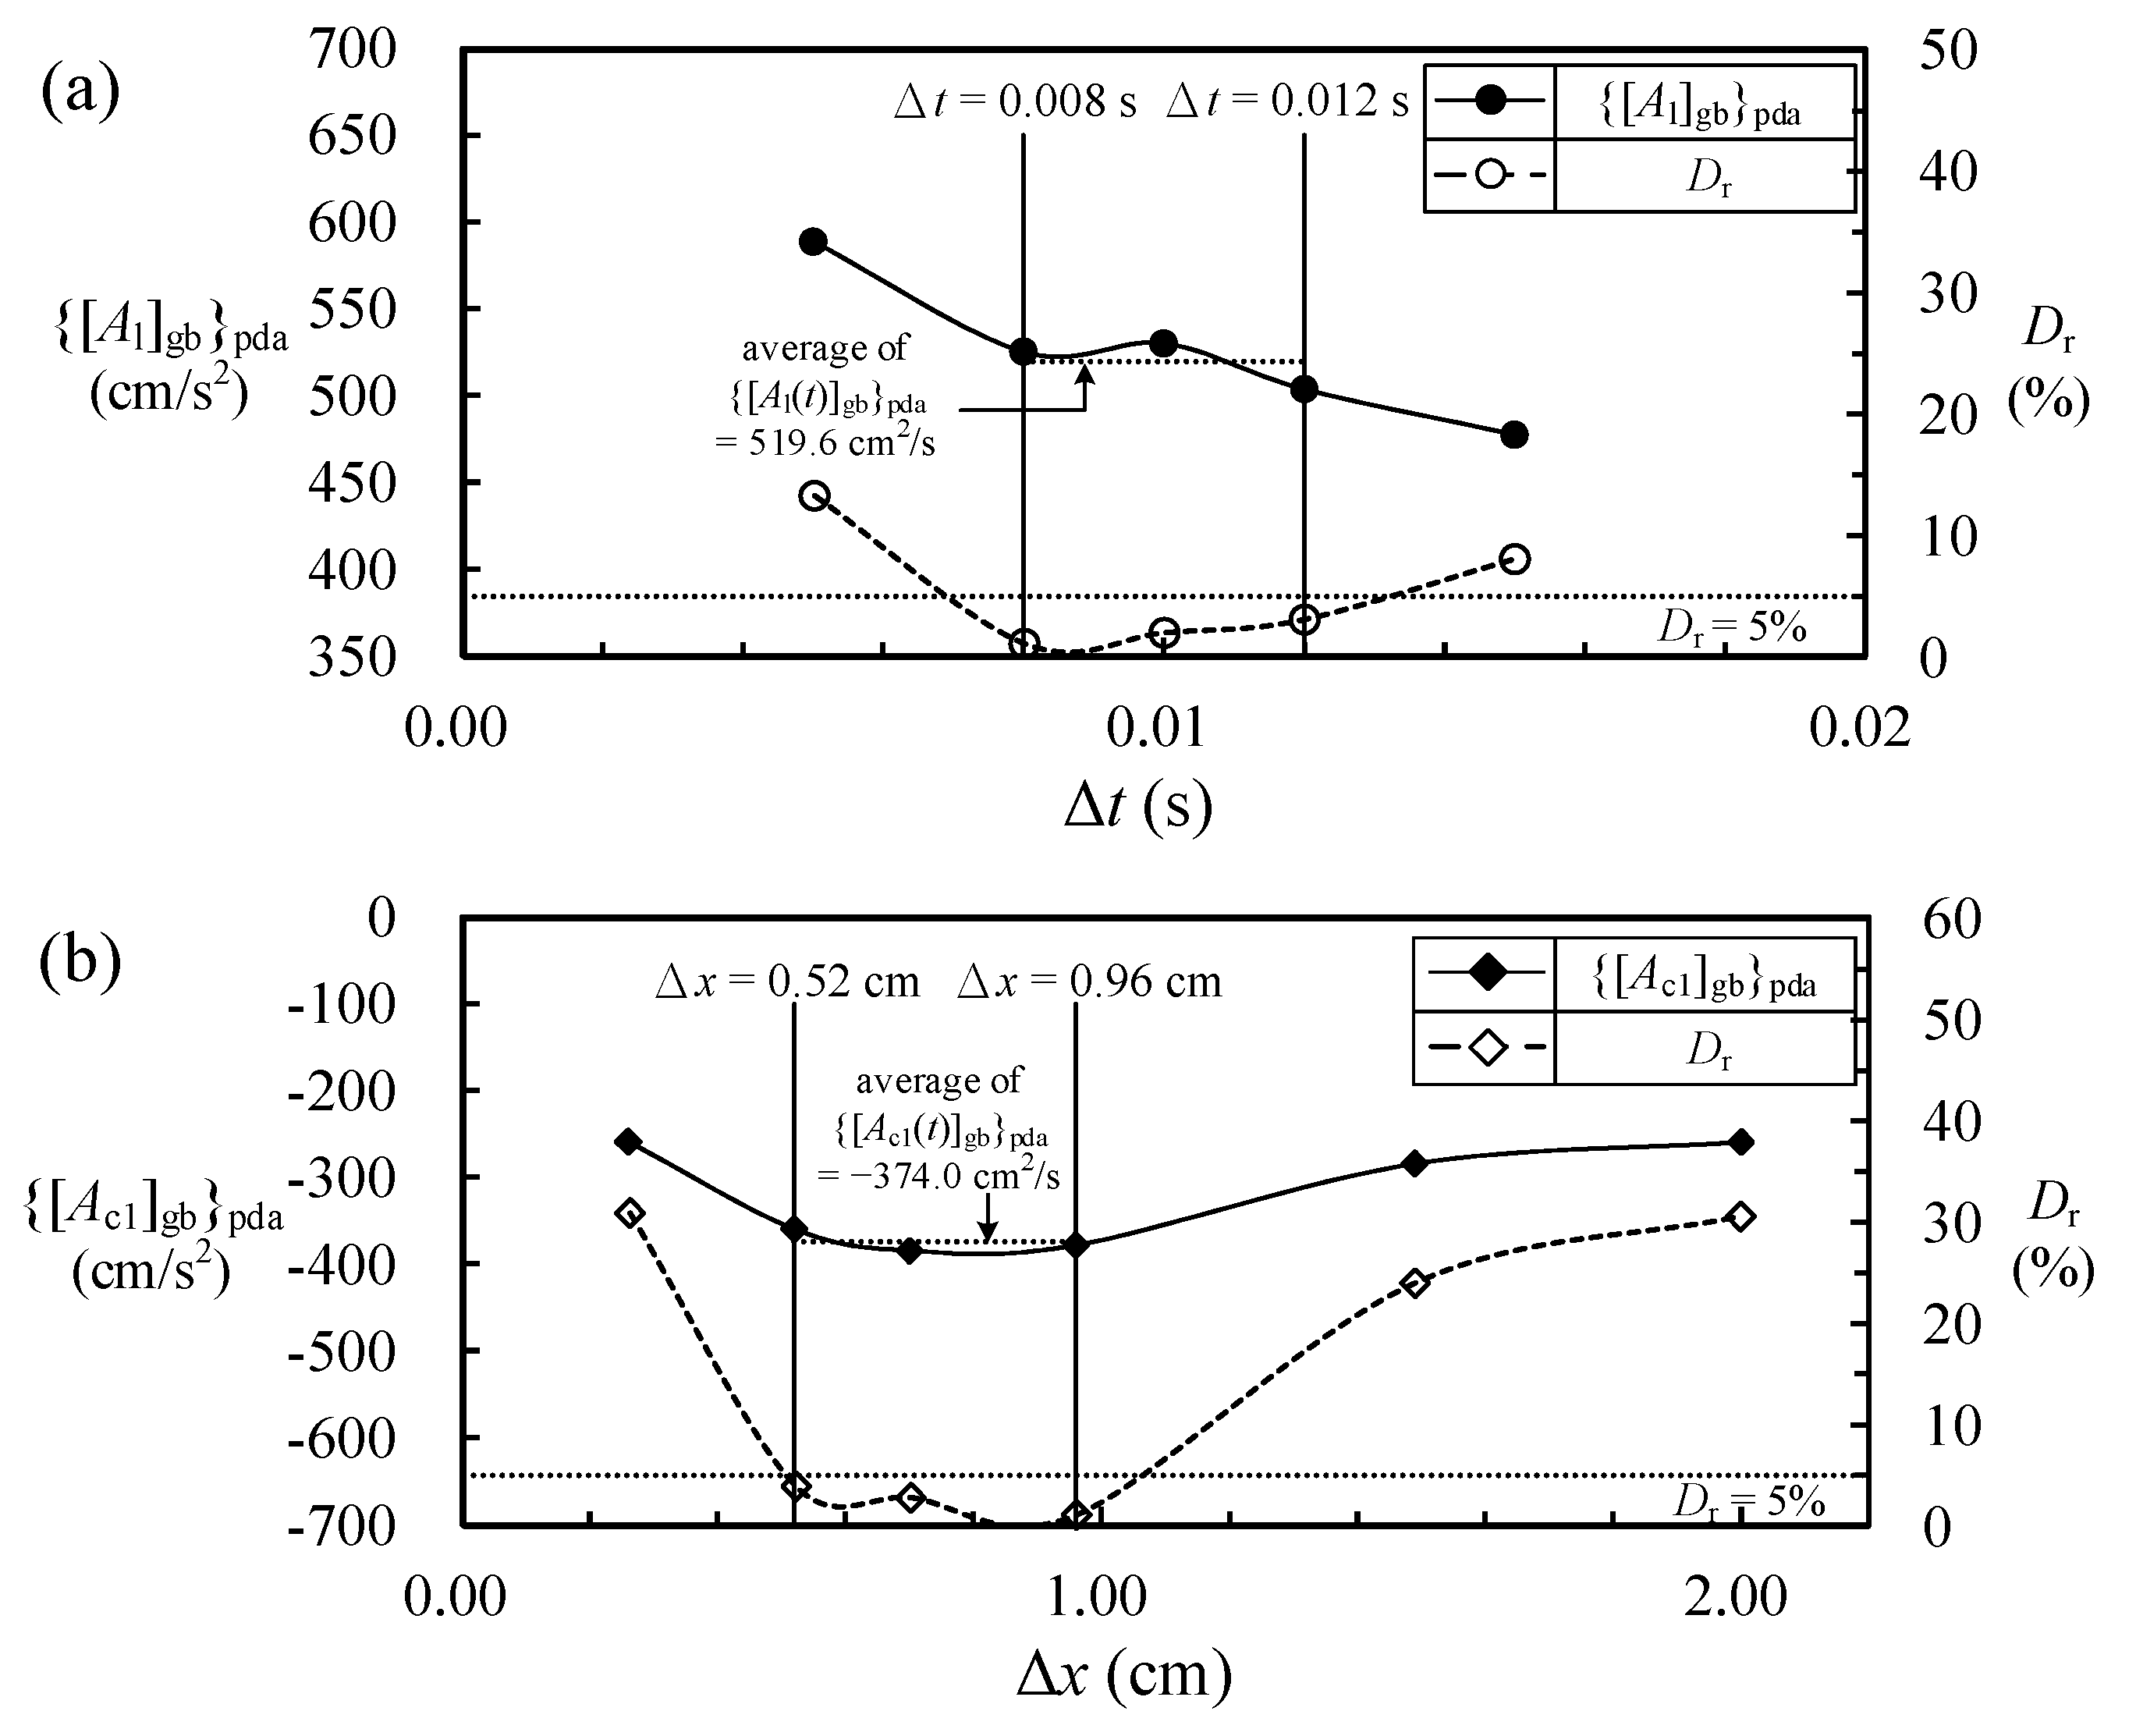
Appendix B. Details for Calculation of Accelerations and Relative Deviations
| (1) | (2) | (3) | (4) | (5) | (6) | (7) | (8) | (9) |
|---|---|---|---|---|---|---|---|---|
| y′ | [u(y′, t − Δt)]gb | [u(y′, t)]gb | [u(y′, t + Δt)]gb | [Al(y′)]gb | [Al(y′)]gb | [Al(y′)]gb | [Al(y’′)]gb | [Al(y′)]gb |
| (cm) | (cm/s) | (cm/s) | (cm/s) | (cm/s2) | (cm/s2) | (cm/s2) | (cm/s2) | (cm/s2) |
| t − Δt = 2.059 s | t = 2.069 s | t + Δt = 2.079 s | Δt = 0.005 s | Δt = 0.008 s | Δt = 0.010 s | Δt = 0.012 s | Δt = 0.015 s | |
| 3.140 | 72.86 | |||||||
| 3.053 | 72.86 | |||||||
| 2.966 | 72.86 | |||||||
| 2.878 | 72.86 | |||||||
| 2.791 | 72.86 | |||||||
| 2.704 | 67.52 | 72.86 | 578.4 | 441.5 | 533.8 | 452.5 | 459.9 | |
| 2.617 | 67.85 | 72.86 | 512.4 | 400.3 | 500.8 | 425.0 | 437.9 | |
| 2.530 | 67.66 | 72.86 | 550.8 | 424.3 | 520.0 | 441.0 | 445.8 | |
| 2.442 | 67.05 | 72.86 | 718.2 | 500.8 | 581.2 | 492.0 | 468.1 | |
| 2.355 | 60.52 | 66.67 | 72.86 | 718.2 | 548.4 | 617.1 | 523.7 | 498.7 |
| 2.268 | 60.52 | 66.67 | 72.86 | 718.2 | 628.4 | 617.1 | 574.2 | 509.6 |
| 2.181 | 60.52 | 66.67 | 72.86 | 744.8 | 628.4 | 617.1 | 574.2 | 564.5 |
| 2.093 | 60.52 | 66.67 | 73.56 | 764.3 | 673.8 | 652.0 | 593.0 | 572.6 |
| 2.006 | 60.52 | 66.67 | 73.65 | 760.9 | 721.8 | 656.3 | 599.0 | 575.7 |
| 1.919 | 60.52 | 66.67 | 73.74 | 759.4 | 695.5 | 661.2 | 589.2 | 576.0 |
| 1.832 | 60.52 | 66.67 | 73.60 | 751.7 | 660.1 | 654.2 | 581.8 | 559.9 |
| 1.745 | 60.52 | 66.91 | 73.28 | 730.8 | 612.7 | 637.8 | 583.6 | 539.2 |
| 1.657 | 60.85 | 67.28 | 72.92 | 716.4 | 574.2 | 603.5 | 568.7 | 521.5 |
| 1.570 | 61.35 | 67.40 | 72.61 | 676.1 | 569.4 | 563.2 | 546.3 | 498.1 |
| 1.483 | 61.63 | 67.38 | 72.28 | 627.7 | 545.8 | 532.4 | 520.6 | 486.3 |
| 1.396 | 61.87 | 66.85 | 71.69 | 564.8 | 521.9 | 491.3 | 502.7 | 474.9 |
| 1.308 | 62.17 | 66.41 | 71.06 | 511.2 | 500.1 | 444.5 | 486.8 | 457.0 |
| 1.221 | 62.14 | 65.81 | 70.57 | 462.2 | 478.5 | 421.6 | 475.8 | 439.6 |
| 1.134 | 61.94 | 65.13 | 69.84 | 423.5 | 454.5 | 395.0 | 451.9 | 426.4 |
| 1.047 | 61.55 | 64.61 | 69.30 | 416.9 | 437.9 | 387.4 | 445.7 | 414.1 |
| 0.960 | 61.02 | 64.17 | 68.97 | 383.0 | 403.8 | 397.4 | 427.5 | 402.7 |
| 0.872 | 60.21 | 63.84 | 68.63 | 345.8 | 403.4 | 421.1 | 417.9 | 388.4 |
| 0.785 | 59.62 | 63.55 | 67.89 | 351.3 | 390.6 | 413.4 | 409.1 | 378.5 |
| 0.698 | 58.91 | 62.87 | 66.94 | 343.3 | 387.1 | 401.6 | 404.4 | 361.3 |
| 0.611 | 58.05 | 62.04 | 65.60 | boundary layer (not included) | ||||
| 0.523 | 57.08 | 61.00 | 64.10 | |||||
| 0.436 | 55.79 | 59.61 | 62.25 | |||||
| 0.349 | 51.76 | 55.30 | 57.66 | |||||
| 0.262 | 45.14 | 46.61 | 47.89 | |||||
| 0.174 | 38.90 | 38.12 | 38.55 | |||||
| 0.087 | 33.12 | 30.26 | 29.84 | |||||
| 0.000 | 0.00 | 0.00 | 0.00 | |||||
| {[Al]gb}pda (cm/s2) | ||||||||
| 588.8 | 525.1 | 530.0 | 503.6 | 477.4 | ||||
| average determined from the values of {[Al]gb}pda for Δt = 0.008, 0.010, and 0.012 s | Dr (%) | |||||||
| 519.6 (cm/s2) | 13.3 | 1.1 | 2.0 | 3.1 | 8.1 | |||
| (1) | (2) | (3) | (4) | (5) | (6) | (7) | (8) | (9) | (10) |
|---|---|---|---|---|---|---|---|---|---|
| y′ | [u(x − Δx, y′)]gb | [u(x, y′)]gb | [u(x + Δx, y′)]gb | [Ac1(y′)]gb | [Ac1(y′)]gb | [Ac1(y′)]gb | [Ac1(y′)]gb | [Ac1(y′)]gb | [Ac1(y′)]gb |
| (cm) | (cm/s) | (cm/s) | (cm/s) | (cm/s2) | (cm/s2) | (cm/s2) | (cm/s2) | (cm/s2) | (cm/s2) |
| x − Δx = 193.04 cm | x = 194.00 cm | x + Δx = 194.96 cm | Δx = 0.26 cm | Δx = 0.52 cm | Δx = 0.70 cm | Δx = 0.96 cm | Δx = 1.49 cm | Δx = 2.0 cm | |
| 3.140 | |||||||||
| 3.053 | 73.32 | ||||||||
| 2.966 | 73.32 | ||||||||
| 2.878 | 73.32 | ||||||||
| 2.791 | 73.32 | ||||||||
| 2.704 | 73.32 | 67.52 | 317.3 | −318.8 | −425.2 | −407.4 | −137.7 | −256.5 | |
| 2.617 | 73.32 | 67.85 | −187.3 | −278.1 | −395.3 | −386.0 | −145.3 | −246.7 | |
| 2.530 | 73.32 | 67.66 | −186.7 | −429.9 | −412.8 | −398.5 | −182.4 | −268.3 | |
| 2.442 | 73.32 | 67.05 | 58.84 | −185.1 | −425.3 | −463.0 | −505.6 | −238.7 | −299.8 |
| 2.355 | 73.32 | 66.67 | 59.55 | −189.8 | −422.4 | −460.4 | −477.9 | −322.0 | −314.9 |
| 2.268 | 73.32 | 66.67 | 60.09 | −211.6 | −422.4 | −460.4 | −459.4 | −324.7 | −286.5 |
| 2.181 | 73.32 | 66.67 | 60.39 | −239.4 | −422.4 | −460.4 | −448.8 | −324.5 | −284.4 |
| 2.093 | 73.24 | 66.67 | 60.60 | −284.7 | −422.4 | −460.4 | −438.8 | −308.6 | −286.1 |
| 2.006 | 73.39 | 66.67 | 60.62 | −342.2 | −442.4 | −476.7 | −443.6 | −317.6 | −284.7 |
| 1.919 | 73.52 | 66.67 | 60.74 | −405.1 | −455.1 | −488.1 | −443.6 | −328.7 | −284.3 |
| 1.832 | 73.30 | 66.67 | 60.71 | −374.3 | −435.3 | −480.4 | −437.1 | −340.6 | −288.0 |
| 1.745 | 73.01 | 66.91 | 60.52 | −377.3 | −451.4 | −483.0 | −435.2 | −356.5 | −288.8 |
| 1.657 | 72.74 | 67.28 | 60.56 | −408.3 | −481.1 | −491.2 | −426.7 | −361.4 | −283.5 |
| 1.570 | 72.55 | 67.40 | 60.53 | −422.0 | −458.4 | −461.7 | −422.3 | −356.8 | −277.9 |
| 1.483 | 72.13 | 67.38 | 60.30 | −433.7 | −467.1 | −454.2 | −415.3 | −344.7 | −258.6 |
| 1.396 | 71.79 | 66.85 | 60.32 | −418.7 | −425.2 | −427.9 | −399.3 | −333.8 | −240.7 |
| 1.308 | 71.35 | 66.41 | 60.65 | −403.1 | −382.8 | −385.5 | −370.1 | −316.2 | −227.9 |
| 1.221 | 70.86 | 65.81 | 60.85 | −375.6 | −335.1 | −335.8 | −342.9 | −301.8 | −218.8 |
| 1.134 | 70.21 | 65.13 | 61.05 | −340.5 | −301.7 | −299.2 | −310.7 | −283.4 | −214.4 |
| 1.047 | 69.24 | 64.61 | 61.08 | −270.6 | −226.9 | −238.9 | −274.7 | −265.2 | −217.3 |
| 0.960 | 68.28 | 64.17 | 61.14 | −198.5 | −199.9 | −197.0 | −238.6 | −248.3 | −220.3 |
| 0.872 | 67.50 | 63.84 | 60.91 | −120.5 | −157.8 | −166.3 | −219.0 | −236.1 | −223.7 |
| 0.785 | 66.72 | 63.55 | 60.73 | −69.3 | −129.4 | −146.8 | −198.2 | −231.1 | −226.9 |
| 0.698 | 65.53 | 62.87 | 60.11 | −79.9 | −136.1 | −153.4 | −177.5 | −217.5 | −228.7 |
| 0.611 | 64.59 | 62.04 | 59.42 | boundary layer (not included) | |||||
| 0.523 | 63.66 | 61.00 | 58.21 | ||||||
| 0.436 | 62.46 | 59.61 | 55.98 | ||||||
| 0.349 | 59.63 | 55.30 | 47.93 | ||||||
| 0.262 | 54.40 | 46.61 | 41.13 | ||||||
| 0.174 | 46.51 | 38.12 | 34.53 | ||||||
| 0.087 | 38.62 | 30.26 | 28.31 | ||||||
| 0.000 | 31.13 | 0.00 | 0.00 | ||||||
| {[Acl]gb}pda (cm/s2) | |||||||||
| −258.6 | −359.5 | −384.3 | −378.2 | −284.3 | −259.5 | ||||
| expected average estimated from the values of {[Acl]gb}pda for Δx = 0.52, 0.70 and 0.96 cm | Dr (%) | ||||||||
| −374.0 (cm/s2) | 30.9 | 3.9 | 2.8 | 1.1 | 24.0 | 30.6 | |||
| (1) | (2) | (3) | (4) | (5) | (6) |
|---|---|---|---|---|---|
| y′ | [v(y′)]gb | [u(y′)]gb | [Ac2(y′)]gb | [At(y′)]gb | [P(y′)]gb |
| (cm) | (cm/s) | (cm/s) | (cm/s2) | (cm/s2) | (cm/s2) |
| x = 194.00 cm | x = 194.00 cm | ||||
| 3.140 | |||||
| 3.053 | |||||
| 2.966 | |||||
| 2.878 | |||||
| 2.791 | |||||
| 2.704 | 14.57 | 67.52 | −55.2 | 71.3 | −71.3 |
| 2.617 | 14.20 | 67.85 | −11.2 | 103.5 | −103.5 |
| 2.530 | 15.36 | 67.66 | 70.8 | 192.3 | −192.3 |
| 2.442 | 12.19 | 67.05 | 69.4 | 144.9 | −144.9 |
| 2.355 | 12.10 | 66.67 | 26.4 | 165.6 | −165.6 |
| 2.268 | 11.33 | 66.67 | 0.0 | 157.7 | −157.7 |
| 2.181 | 11.18 | 66.67 | 0.0 | 168.4 | −168.4 |
| 2.093 | 11.20 | 66.67 | 0.0 | 213.2 | −213.2 |
| 2.006 | 11.35 | 66.67 | 0.0 | 212.7 | −212.7 |
| 1.919 | 11.46 | 66.67 | 0.0 | 217.6 | −217.6 |
| 1.832 | 11.41 | 66.67 | −15.7 | 201.4 | −201.4 |
| 1.745 | 11.24 | 66.91 | −39.1 | 163.4 | −163.4 |
| 1.657 | 10.69 | 67.28 | −30.1 | 146.7 | −146.7 |
| 1.570 | 10.22 | 67.40 | -6.0 | 134.9 | −134.9 |
| 1.483 | 10.11 | 67.38 | 31.8 | 148.9 | −148.9 |
| 1.396 | 9.15 | 66.85 | 50.8 | 142.7 | −142.7 |
| 1.308 | 7.86 | 66.41 | 47.0 | 121.4 | −121.4 |
| 1.221 | 8.03 | 65.81 | 59.0 | 137.7 | −137.7 |
| 1.134 | 7.29 | 65.13 | 50.1 | 134.3 | −134.3 |
| 1.047 | 6.35 | 64.61 | 35.0 | 147.6 | −147.6 |
| 0.960 | 5.71 | 64.17 | 25.2 | 184.0 | −184.0 |
| 0.872 | 4.98 | 63.84 | 17.6 | 219.7 | −219.7 |
| 0.785 | 5.41 | 63.55 | 30.1 | 245.4 | −245.4 |
| 0.698 | 4.94 | 62.87 | 42.7 | 266.9 | −266.9 |
| 0.611 | 5.26 | 62.04 | boundary layer (not included) | ||
| 0.523 | 4.21 | 61.00 | |||
| 0.436 | 3.85 | 59.61 | |||
| 0.349 | 3.15 | 55.30 | |||
| 0.262 | 2.54 | 46.61 | |||
| 0.174 | 1.02 | 38.12 | |||
| 0.087 | 0.46 | 30.26 | |||
| 0.000 | 0.00 | 0.00 | |||
| {[Ac2]gb}pda (cm/s2) | {[At]gb}pda (cm/s2) | {[P]gb}pda (cm/s2) | |||
| 16.6 | 168.4 | −168.4 | |||
References
- Grue, J.; Pelinovsky, E.N.; Frustus, D.; Talipova, T.; Kharif, C. Formation of undular bores and solitary waves in the Strait of Malacca caused by the 26 December 2004 Indian Ocean Tsunami. J. Geophys. Res. 2008, 113, C005008. [Google Scholar] [CrossRef]
- Lin, C.; Kao, M.J.; Wong, W.Y.; Shao, Y.P.; Hu, C.F.; Yuan, J.M.; Raikar, R.V. Effect of leading waves on velocity distribution of undular bore traveling over sloping bottom. Eur. J. Mech. B Fluids 2019, 73, 75–99. [Google Scholar] [CrossRef]
- Yeh, H.H.; Ghazali, A. On bore collapse. J. Geophys. Res. 1988, 93, 6930–6936. [Google Scholar] [CrossRef]
- Yeh, H.H.; Ghazali, A.; Marton, I. Experimental study of bore run-up. J. Fluid Mech. 1989, 206, 563–578. [Google Scholar] [CrossRef]
- Shimozono, T. Experimental study on boundary layer flow under undular and turbulent bores. Proc. Coast. Eng. Conf. B2 JSCE 2011, 67, 46–50. (In Japanese) [Google Scholar] [CrossRef]
- Peregrine, D.H. Calculations of the developments of an undular bore. J. Fluid Mech. 1966, 25, 312–330. [Google Scholar] [CrossRef]
- Soares Frazao, S.; Zech, Y. Undular bores and secondary waves-Experiments and hybrid finite-volume modelling. J. Hydraul. Res. 2014, 40, 33–43. [Google Scholar] [CrossRef]
- Gavrilyuk, S.; Liapidevskii, V.; Chesnokov, A. Spilling breakers in shallow water: Applications to Favre waves and to the shoaling and breaking of solitary waves. J. Fluid Mech. 2016, 808, 441–468. [Google Scholar] [CrossRef]
- Kharif, C.; Abid, M. Nonlinear water waves in shallow water in the presence of constant vorticity: A Whitham approach. Eur. J. Mech. B Fluids 2018, 72, 12–22. [Google Scholar] [CrossRef] [Green Version]
- Madsen, P.A.; Svendsen, I.A. Turbulence bores and hydraulic jumps. J. Fluid Mech. 1983, 129, 1–25. [Google Scholar] [CrossRef]
- Favre, H. Etude Theorique et Experimentale des Ondes de Translation Dans les Canaux Decouverts; Dunod: Paris, France, 1935. [Google Scholar]
- Treske, A. Undular bores (Favre-waves) in open channels: Experimental studies. J. Hydraul. Res. 1994, 32, 335–370. [Google Scholar] [CrossRef]
- Stansby, P.K.; Chegini, A.; Barnes, T.C.D. The initial stages of dam-break flow. J. Fluid Mech. 1998, 374, 407–424. [Google Scholar] [CrossRef]
- Ho, D.V.; Meyer, R.E. Climb of a bore on a beach—Part 1. Uniform beach slope. J. Fluid Mech. 1962, 14, 305–318. [Google Scholar] [CrossRef]
- Shen, M.C.; Meyer, R.E. Climb of a bore on a beach—Part 2. Non-uniform beach slope. J. Fluid Mech. 1963, 16, 108–112. [Google Scholar] [CrossRef]
- Shen, M.C.; Meyer, R.E. Climb of a bore on a beach—Part 3. Run up. J. Fluid Mech. 1963, 16, 113–125. [Google Scholar] [CrossRef]
- Packwood, A.R. Surf and Run-Up on Beaches. Ph.D. Thesis, Bristol University, Bristol, UK, 1980. [Google Scholar]
- Guard, P.A.; Baldock, T.E. The influence of seaward boundary conditions on swash zone hydrodynamics. Coast. Eng. 2007, 54, 321–331. [Google Scholar] [CrossRef]
- Zhang, Q.; Liu, P.L.F. A numerical study of swash flows generated by bores. Coast. Eng. 2008, 55, 1113–1134. [Google Scholar] [CrossRef]
- Miller, R.L. Experimental determination of run-up of undular and fully developed bores. J. Geophys. Res. 1968, 73, 4497–4510. [Google Scholar] [CrossRef]
- Yeh, H.H. Tsunami bore run-up. Nat. Hazards 1991, 4, 209–220. [Google Scholar] [CrossRef]
- Barnes, M.P.; O’Dongoghue, T.; Alsina, J.M.; Baldock, T.E. Direct bed shear stress measurements in bore-driven swash. Coast. Eng. 2009, 56, 853–867. [Google Scholar] [CrossRef] [Green Version]
- O’Donoghue, T.; Pokrajac, D.; Hondebrink, L.J. Laboratory and numerical study of dambreak-generated swash on impermeable slopes. Coast. Eng. 2010, 57, 513–530. [Google Scholar] [CrossRef]
- Kikkert, G.A.; O’Donoghue, T.; Pokrajac, D.; Dodd, N. Experimental study of boredriven swash hydrodynamics on impermeable rough slopes. Coast. Eng. 2012, 60, 149–166. [Google Scholar] [CrossRef]
- Jensen, A.; Pedersen, G.K.; Wood, D.J. An experimental study of wave run-up at a steep beach. J. Fluid Mech. 2003, 486, 161–188. [Google Scholar] [CrossRef] [Green Version]
- Puleo, J.A.; Farhadzadeh, A.; Kobayashi, N. Numerical simulation of swash zone fluid accelerations. J. Geophys. Res. 2007, 112, C07007. [Google Scholar] [CrossRef]
- Higuera, P.; Liu, P.L.F.; Lin, C.; Wong, W.Y.; Kao, M.J. Laboratory-scale swash flows generated by a non-breaking solitary wave on a steep slope. J. Fluid Mech. 2018, 847, 186–227. [Google Scholar] [CrossRef]
- Chang, K.A.; Liu, P.L.F. Velocity, acceleration and vorticity under a breaking wave. Phys. Fluids 1998, 10, 327–329. [Google Scholar] [CrossRef]
- Jensen, A.; Sveen, J.K.; Grue, J.; Richon, J.B.; Gray, C. Acceleration in water waves by extended particle image velocimetry. Exp. Fluids 2001, 30, 500–510. [Google Scholar] [CrossRef]
- Pedrozo-Acuna, A.; Alegria-Arzaburu, A.R.; Torres-Freyermuth, A.; Mendoza, E.; Silva, R. Laboratory investigation of pressure gradients induced by plunging breakers. Coast. Eng. 2011, 58, 722–738. [Google Scholar] [CrossRef]
- Lin, C.; Wong, W.Y.; Raikar, R.V.; Hwung, H.H.; Tsai, C.P. Characteristics of accelerations and pressure gradient during run-down of solitary wave over very steep beach—A case study. Water 2019, 11, 523. [Google Scholar] [CrossRef]
- Tissier, M.; Bonneton, P.; Marche, F.; Chazel, F.; Lannes, D. Nearshore dynamics of tsunami-like undular bores using a fully nonlinear Boussinesq model. J. Coast. Res. 2011, SI64, 1–4. [Google Scholar]
- Bjørkavag, M.; Kalisch, H. Wave breaking in Boussinesq models for undular bores. Phys. Lett. 2011, A375, 1570–1578. [Google Scholar] [CrossRef]
- Lin, C. The Characteristics of Internal Flow Field and Bottom Boundary Layer of Waves Propagating on Sloping Bottom. Ph.D. Thesis, Department of Hydraulics and Ocean Engineering, National Cheng Kung University, Tainan, Taiwan, 1989. (In Chinese). [Google Scholar]







© 2019 by the authors. Licensee MDPI, Basel, Switzerland. This article is an open access article distributed under the terms and conditions of the Creative Commons Attribution (CC BY) license (http://creativecommons.org/licenses/by/4.0/).
Share and Cite
Lin, C.; Wong, W.-Y.; Kao, M.-J.; Yang, J.; Raikar, R.V.; Yuan, J.-M. Hydrodynamic Features of an Undular Bore Traveling on a 1:20 Sloping Beach. Water 2019, 11, 1556. https://doi.org/10.3390/w11081556
Lin C, Wong W-Y, Kao M-J, Yang J, Raikar RV, Yuan J-M. Hydrodynamic Features of an Undular Bore Traveling on a 1:20 Sloping Beach. Water. 2019; 11(8):1556. https://doi.org/10.3390/w11081556
Chicago/Turabian StyleLin, Chang, Wei-Ying Wong, Ming-Jer Kao, James Yang, Rajkumar V. Raikar, and Juan-Ming Yuan. 2019. "Hydrodynamic Features of an Undular Bore Traveling on a 1:20 Sloping Beach" Water 11, no. 8: 1556. https://doi.org/10.3390/w11081556
APA StyleLin, C., Wong, W.-Y., Kao, M.-J., Yang, J., Raikar, R. V., & Yuan, J.-M. (2019). Hydrodynamic Features of an Undular Bore Traveling on a 1:20 Sloping Beach. Water, 11(8), 1556. https://doi.org/10.3390/w11081556


