Article

Multiple Temporal Scales Assessment in the Hydrological Response of Small Mediterranean-Climate Catchments

1
Mediterranean Ecogeomorphological and Hydrological Connectivity Research Team, Department of Geography, University of the Balearic Islands, Ctra. Valldemossa km 7.5, 07122 Palma, Balearic Islands, Spain
2
Institute of Agro—Environmental and Water Economy Research—Inagea, University of the Balearic Islands, Ctra. Valldemossa km 7.5, 07122 Palma, Balearic Islands, Spain
3
Institute of Environmental Assessment and Water Research (IDAEA), Spanish Research Council (CSIC), Jordi Girona 18, 08034 Barcelona, Spain
4
Estación Experimental de Aula Dei, Consejo Superior de Investigaciones Científicas (EEAD-CSIC), 50192 Zaragoza, Spain
*
Author to whom correspondence should be addressed.
Water 2020, 12(1), 299; https://doi.org/10.3390/w12010299
Submission received: 13 November 2019 / Revised: 10 January 2020 / Accepted: 14 January 2020 / Published: 19 January 2020

Abstract

:
Mediterranean-climate catchments are characterized by significant spatial and temporal hydrological variability caused by the interaction of natural as well human-induced abiotic and biotic factors. This study investigates the non-linearity of rainfall-runoff relationship at multiple temporal scales in representative small Mediterranean-climate catchments (i.e., <10 km2) to achieve a better understanding of their hydrological response. The rainfall-runoff relationship was evaluated in 43 catchments at annual and event—203 events in 12 of these 43 catchments—scales. A linear rainfall-runoff relationship was observed at an annual scale, with a higher scatter in pervious (R2: 0.47) than impervious catchments (R2: 0.82). Larger scattering was observed at the event scale, although pervious lithology and agricultural land use promoted significant rainfall-runoff linear relations in winter and spring. These relationships were particularly analysed during five hydrological years in the Es Fangar catchment (3.35 km2; Mallorca, Spain) as a temporal downscaling to assess the intra-annual variability, elucidating whether antecedent wetness conditions played a significant role in runoff generation. The assessment of rainfall-runoff relationships under contrasted lithology, land use and seasonality is a useful approach to improve the hydrological modelling of global change scenarios in small catchments where the linearity and non-linearity of the hydrological response—at multiple temporal scales—can inherently co-exist in Mediterranean-climate catchments.

1. Introduction

The complexity of Mediterranean fluvial systems is caused by the multiple temporal and spatial heterogeneities in the relationships between the natural and human-induced abiotic and biotic variables, especially in the Mediterranean Sea Region [1,2]. The Mediterranean climate lies between 32° and 40° N and S of the Equator and is characterized by a wet and mild winter, a warm and dry summer and a high inter- and intra-annual variability in rainfall patterns. Mediterranean climate regions comprise the Mediterranean Sea Region, the coast of California, Central Chile, the Cape region of South Africa and the southwestern and southern parts of Australia [3]. Under these climatic conditions, catchments are mostly characterized by a high diversity in hydrological regimes [4,5] promoting significant temporal and spatial differences in the hydrological response [6,7,8]. The seasonality of the Mediterranean climate plays a key role in the runoff generation processes, increasing the non-linearity of the rainfall-runoff relationship at the event scale [9,10,11]. In winter and early spring, saturation processes are dominant, due to water reserves triggering the runoff generation [8,12]. During late spring, summer and early autumn, those same authors observed how runoff was generated under Hortonian conditions due to high rainfall intensities. Different runoff mechanisms can co-exist within a catchment [13], although flood events under antecedent saturation wetness conditions enable a larger hydrological response [12,14,15,16].
The spatial variability of runoff generation is also elucidated in the catchment hydrological response as a combination of rainfall-distribution [17] and runoff-contribution areas [18]. Thus, the spatial distribution of landscape elements in relation to each other is fundamental in influencing transfer flow pathways [19]. The main factors governing connectivity are associated to changes in topography [20], soil properties [21], soil type [22] and in vegetation cover [23]. In addition, river connectivity occurs along a three spatial dimension (i.e., longitudinal, lateral and vertical) which can change markedly over time, especially in ephemeral rivers [24]. Consequently, flow pathway activation depends on rainfall amount and intensity, as well as soil moisture antecedent conditions [25,26,27]. Lithology’s effects on runoff response in Mediterranean Sea Region fluvial systems are conditioned by the presence of karst features, as the proportion of carbonate rocks is significantly higher than in other landscapes [28]. Therefore, its characteristics related to hydrology, such as high infiltration rates, deep percolation and spring sources, must be taken into account [29,30,31]. In limestone areas, Hortonian and saturation runoff can both be generated and infiltrated downslope [32,33], whilst in badland areas the runoff generation is characterized by a lower soil infiltration capacity than in karst areas [34]. In areas with high clay subsoil content [35] and over granite bedrock [36], runoff is generated as a combination of a lack of deep percolation and a subsurface runoff over an impervious subsoil layer, even artificially promoted [15].
Land uses also alter the hydrological response, depicting a runoff reduction when agriculture uses are replaced by forests [37]. Afforestation processes due to land abandonment can promote a 40% reduction in the annual water yield in Mediterranean Sea Region fluvial systems [38], whilst forest logging may increase the annual runoff coefficient by up to 16% [39]. However, afforested catchments generate the largest flows and peak discharges at the event scale when compared with forest catchments [40]. Most of these catchments are affected by soil and water conservation structures historically built to reduce overland flow and prevent erosion [41]. The abandonment and degradation of these structures may promote and increase runoff and sediment yield [42], with runoff coefficients being between 20% and 40% in abandoned terraces [43].
Hydrologists develop perceptual models of the catchments they study, which consist of an appreciation of the dominant processes controlling the hydrological response, using field measurements and observations [44]. Numerical models used to simulate catchment behaviour often fail build on this knowledge [45], also considering that the Mediterranean-climate catchments show very heterogeneous responses over time and space, resulting in limitations in hydrological modelling and large uncertainties in predictions [46]. To reduce this spatio-temporal scale variability, small experimental and representative catchments are useful to observe the hydrological response under different or specific land use, lithology and human effect characteristics [47]. The aim of this paper is to investigate the rainfall-runoff relationship at different temporal scales in representative small Mediterranean-climate catchments (i.e., <10 km2), evaluating the role of lithology and land use. At the annual scale, the runoff response was assessed at 43 catchments under a pervious or impervious lithology. At the event scale, the rainfall-runoff response of 203 events was investigated to examine the effects of seasonality, lithology and land use. In addition, the inter- and intra-annual variability of the rainfall-runoff and the temporal downscaling (i.e., annual to event scale) was studied in the Es Fangar Creek catchment (3.35 km2; Mallorca, Spain) during five hydrological years. The rainfall-runoff relationship assessment under contrasted lithology, land use and seasonality may provide new insights into the hydrological modelling of small Mediterranean-climate catchments. These catchments are highly demanding in terms of data and event-scale modelling because classical hydrological models are not well suited to the Mediterranean area, as many hydrological processes remain poorly represented [46].

2. Materials and Methods
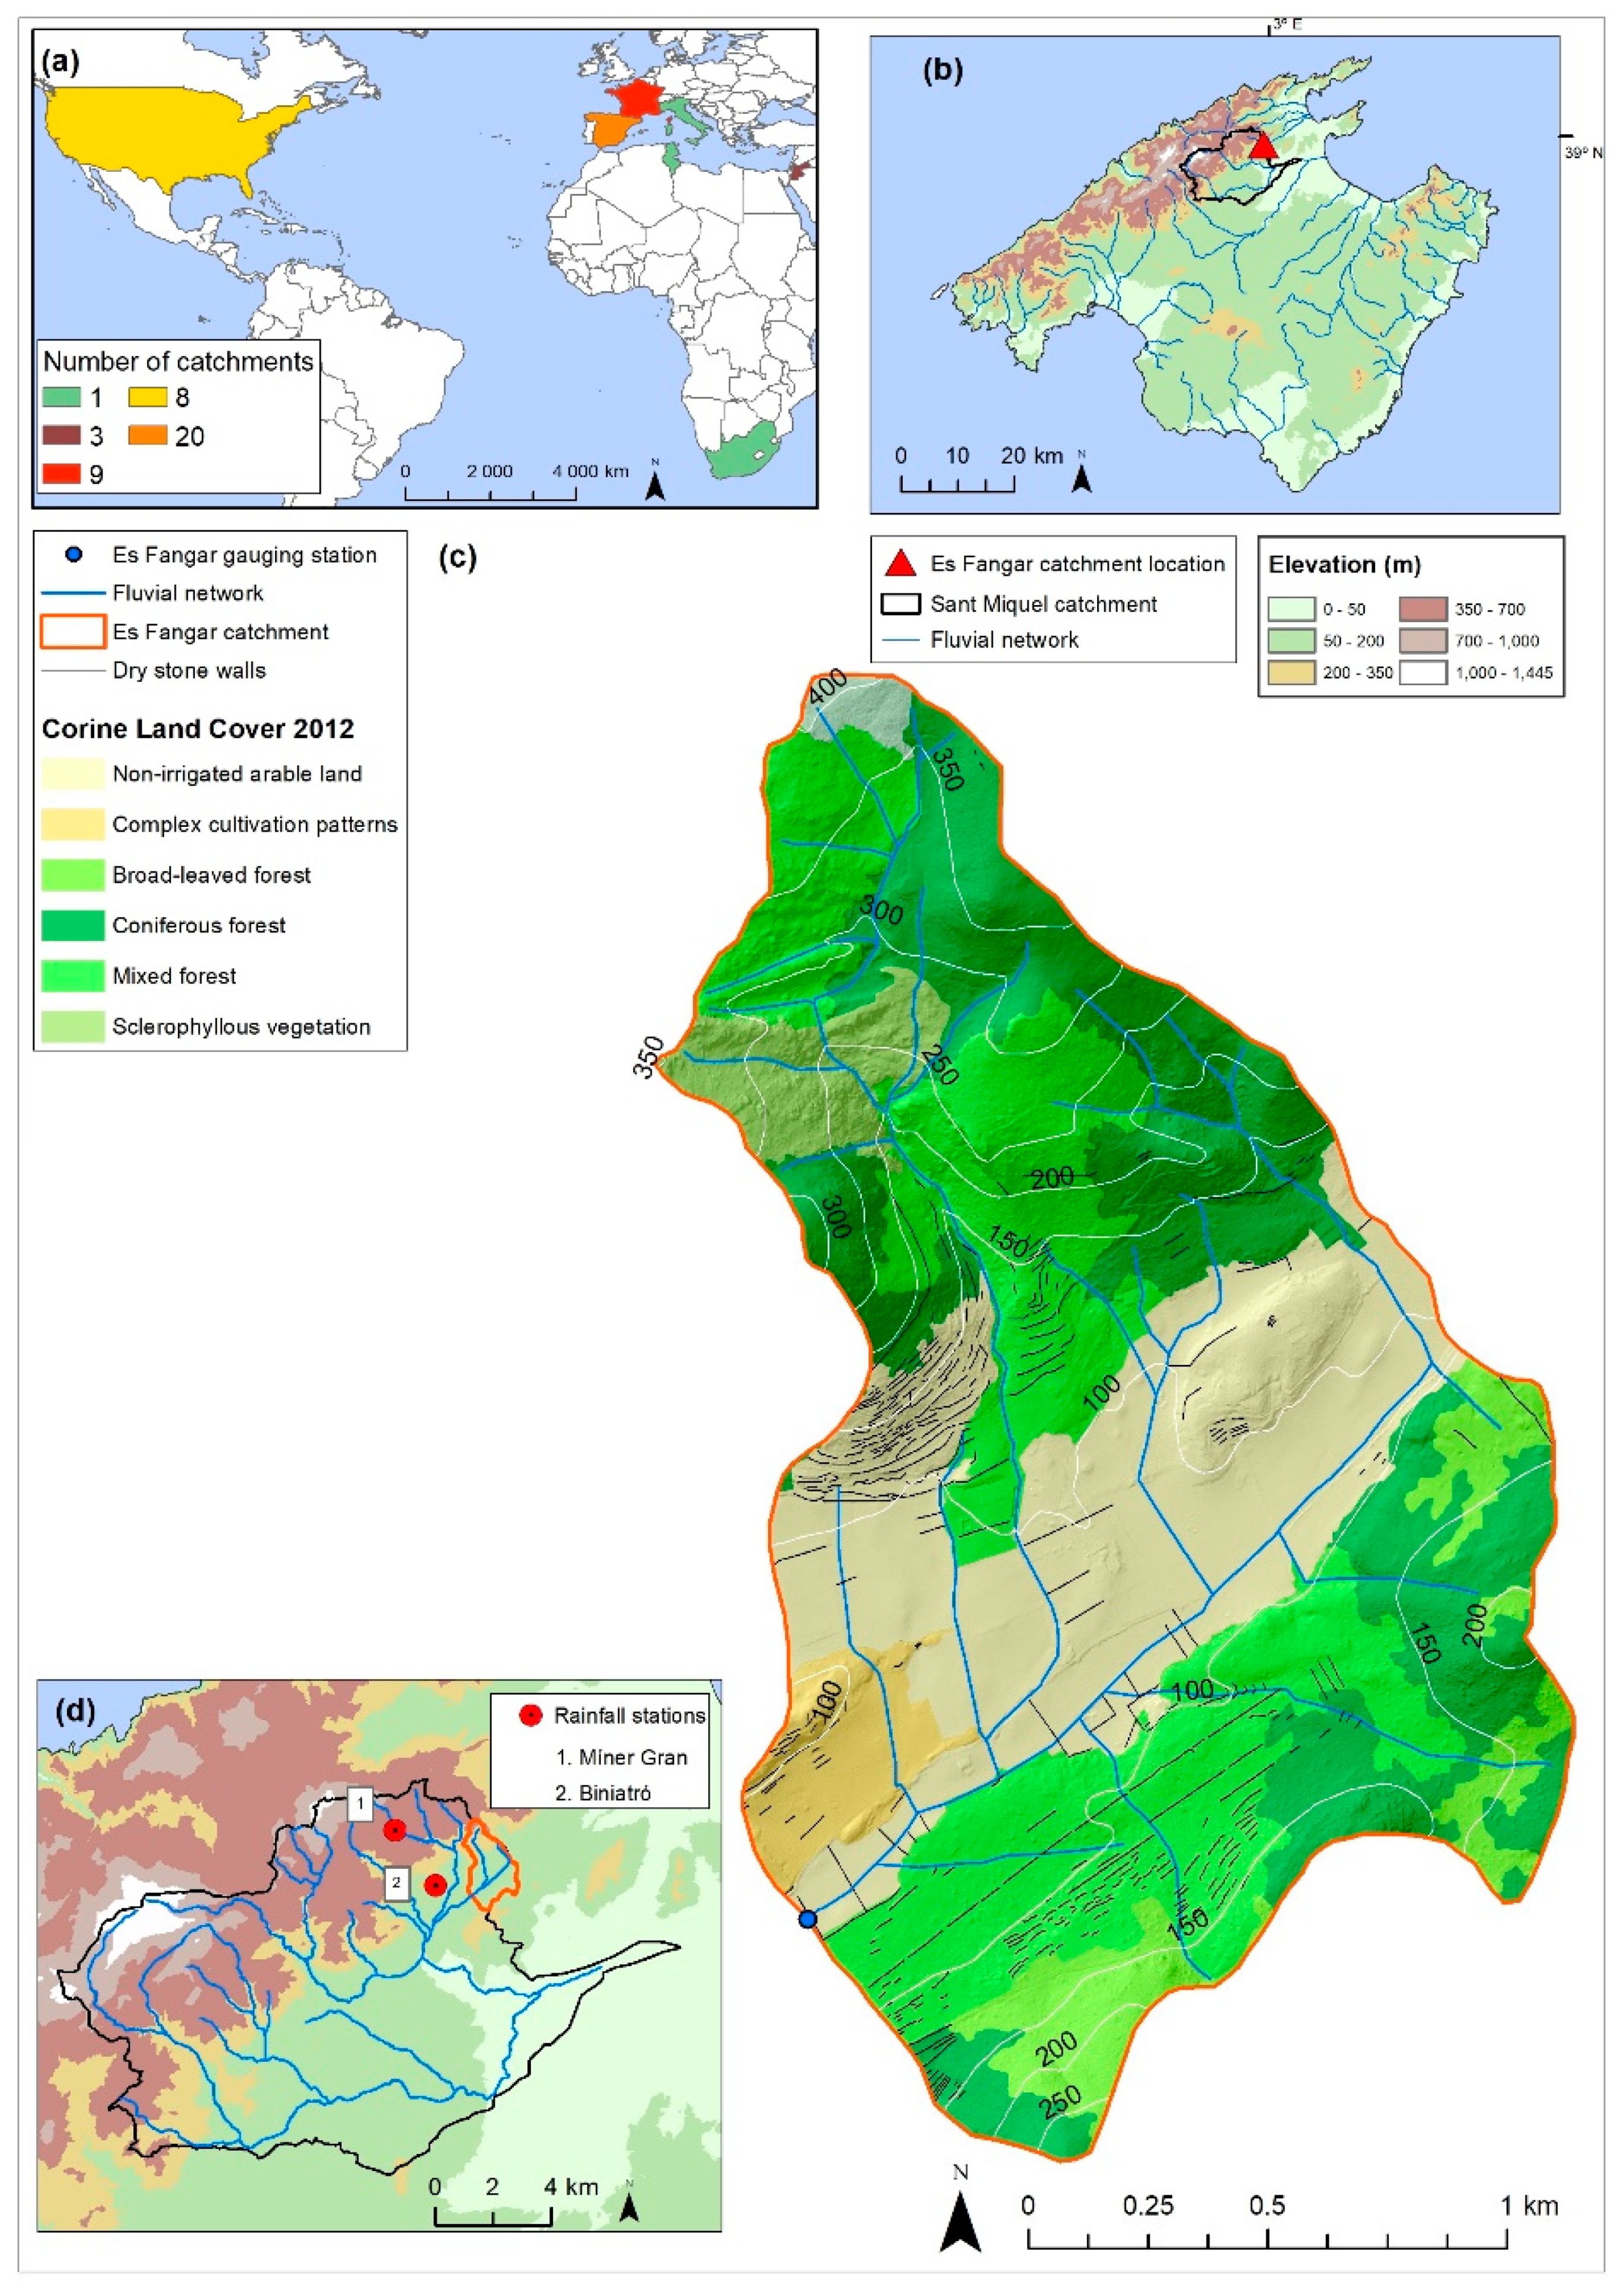
2.1. Study Areas

2.1.1. Small Mediterranean-Climate Catchments

A total of 43 small catchments (i.e., <10 km2) from 22 published studies on the Mediterranean climate regions (Figure 1a) were selected to analyse hydrological response. The geographical distribution of the catchments was grouped into the main climate regions, as follows: (1) Western coast of USA, (2) Western Mediterranean Sea Region (from Spain to Italy), (3) Eastern Mediterranean Sea Region (Israel) and (4) South Africa. The area of the catchments ranged from 0.05 to 9.61 km2, the median value being 1.03 km2 and the standard deviation 2.6 km2. The mean annual rainfall ranged from 367 to 1794 mm y−1, with a median value of 833 mm y−1 ± 334 mm y−1. The mean annual temperature ranged from 6.6 to 17.2 °C with a median value of 13.9 °C ± 3 °C. When temperature information was not available, it was obtained according to Fick and Hijmans [48]. The predominant lithology was pervious in 12 catchments, and was impervious in the other 31. Within the 43 catchments, the studies of 12 of them also contained information related to the main land uses, which was used in this paper for assessing their hydrological response at the event scale. The main land uses were agriculture (3 catchments), agroforestry (3), forestry (1) and shrub (5).

2.1.2. Es Fangar Creek

A temporal downscaling assessment of the inter- and intra-annual variability of the rainfall-runoff relationship was carried out in the Es Fangar Creek catchment, a headwater tributary of the Sant Miquel River catchment (151 km2) located in the north-eastern part of Mallorca Island (Figure 1b) and is representative of Mediterranean mid-mountainous catchments. The lithology is mainly composed of marl and marl-limestone formations from the medium–upper Jurassic and Cretaceous period in the valley bottoms. In the upper parts of the catchment, massive calcareous and dolomite materials from the lower Jurassic period and dolomite and marl formations from the Triassic period (Rhaetian) are dominant. The Es Fangar catchment has an area of 3.4 km2, with altitudes ranging from 72 m.a.s.l. to 404 m.a.s.l. (Figure 1c). The mean slope of the catchment is 26% and the length of the main channel is 3.1 km (average slope of 22%). The drainage network is natural in the headwater parts. In the bottom valley, flow lamination is applied, with transverse walls and also the straightening and diverting of the main stream, with the banks fixed with dry-stone walls for flood control and erosion prevention. In addition, subsurface tile drains are also installed to facilitate drainage due to the impervious materials which would impede agricultural activity during wet periods. As a result, 16% of the surface catchment is occupied by soil and water conservation structures. Since 1950, important socio-economic changes have caused a gradual abandonment of farmland in marginal areas, leading to afforestation. The land uses in 1956 were rainfed herbaceous crops (54%), forest (31%) and scrubland (15%). Nowadays, the main land uses (Figure 1c) are forest (63%), rainfed herbaceous crops (32%) and scrubland (5%). In addition, 54% of terraced land is currently covered by forests (Figure 1c), demonstrating the consolidation of the forest transition. The climate of the area is classified on the Emberger scale [49] as Mediterranean temperate sub-humid. The mean annual rainfall (1965–2016, Biniatró AEMET station) is 927 mm y−1 with a variation coefficient of 23%, and the mean annual temperature is 15.7 °C. A rainfall amount of 180 mm in 24 h is estimated to have a recurrence period of 25 years [50]. The Es Fangar streamflow regime can be classified as intermittent flashy (49% zero days flow), with an annual variability from intermittent (35% zero days flow) to harsh intermittent (62% zero days flow).

2.2. Hydrological Response of Small Mediterranean-Climate Catchments

Bivariate statistical regressions were used to establish the correlations at the annual and event scales between rainfall and runoff in order to assess the hydrological response of small Mediterranean-climate catchments (i.e., <10 km2; Figure 1c). These equations were used descriptively as least squares adjusted for the rainfall-runoff assessment. At the annual scale, data from the 43 representative catchments (Table A1 (a); hereinafter A1a) were collected to observe the influence of lithology on this response; i.e., the catchments were classified as pervious or impervious by using the information regarding the catchments’ characteristics (e.g., soil type, soil texture or lithology materials) extracted from research papers. At the event scale, 203 events from 12 representative catchments were classified according to (a) seasonal occurrence (autumn, winter, spring or summer), (b) pervious or impervious lithology and (c) main land use (agricultural, agroforestry, forest or shrub) (Table A1 (b)). The main land uses of each catchment were divided into specific land uses when the information was available (Figure A1). Most of these studies (79%) were located in the Mediterranean Sea Region and 47% of them studied catchments < 1 km2.

2.3. Monitoring and Data Acquisition in Es Fangar

The rainfall data since 2012 were obtained from the B696 Biniatró AEMET station (Figure 1d; 1 km away from the catchment). In October 2014, a rainfall gauge station (Míner Gran) was installed less than 2.5 km away from the catchment. The Míner Gran rainfall gauge is located 1 m above the ground and connected to a HOBO Pendant® G Data Logger-UA-004-64 that records precipitation at 0.2 mm resolution. A linear regression was established (n = 978; R2: 0.88) for daily rainfall (2014–2017) between the Biniatró and Míner Gran stations to reconstruct rainfall data series from 2012 to 2014 for the Míner Gran station. Due to the lack of temperature data available in the studied catchment, the data of neighbouring AEMET weather stations (i.e., less than 8 km away from the catchment) were used to estimate the catchment’s temperature by using the block kriging technique. With this information, the monthly evapotranspiration (i.e., ETo) was estimated using the equation from Hargreaves and Samani [51].
The gauging station of the Es Fangar catchment was built in July 2012. Its cross section is formed by a rectangular broad-crested weir for low water stages to better measure low discharges. The water level was continuously (1 min time step) measured using a pressure sensor Campbell CS451 connected to a CR200X datalogger and average readings were kept every 15 min. The flow velocity was measured during baseflow conditions and flood events using an OTT MF Pro electromagnetic water flow meter. These flow velocity measurements (n = 17) were subsequently used to calibrate the stage–discharge relationship.

2.4. Rainfall-Runoff Relationship Assessment in Es Fangar

This study is based on data from 5 hydrological years (2012–2013 to 2016–2017). For each runoff event (i.e., when the water stage exceeds the low-flows channel; i.e., 0.036 m3 s−1), a simple hydrograph separation between quickflow and baseflow components was performed through a visual technique based on the breakpoints detected on the logarithmic falling limb of the hydrograph [52]. This hydrograph separation method was used only to characterize the response of the catchment to a rainfall, with no aim of deriving any interpretation in terms of runoff processes. Over a 5-year period, hydrograph separation was conducted on 49 events. Based on the hydrograph separations, the baseflow and quickflow contributions for each hydrological year (October to September) were calculated.
Several variables were derived from the hyetograph and hydrograph from each rainfall-runoff event (Table 1). These variables aimed to characterize the pre-event conditions (antecedent precipitation in 24 h, AP1d; baseflow at the start of the event, Q0) as well as the event characteristics (rainfall depth, Ptot; mean and maximum rainfall intensity, IPmean30 and IPmax30; runoff depth and runoff coefficient, R and Rc; and peak-flow discharge, Qmax). The relationships between these variables were assessed through the Pearson correlation matrix. A more detailed analysis of rainfall-runoff relationships in the Es Fangar catchment was carried out in a second step to investigate the variability of the hydrological response to similar size rainfall events to assess the rainfall-runoff non-linearity. The widest range of events with a similar Ptot (40–50 mm) generating the highest differences in R response was selected. Accordingly, 7 events with a Ptot range from 41.8 to 49.8 mm but with different antecedent conditions or rainfall dynamics were selected and also classified in relation to wet, dry and transition periods, in accordance with Gallart et al. [53].

3. Results

3.1. Hydrological Response of Small Mediterranean-Climate Catchments

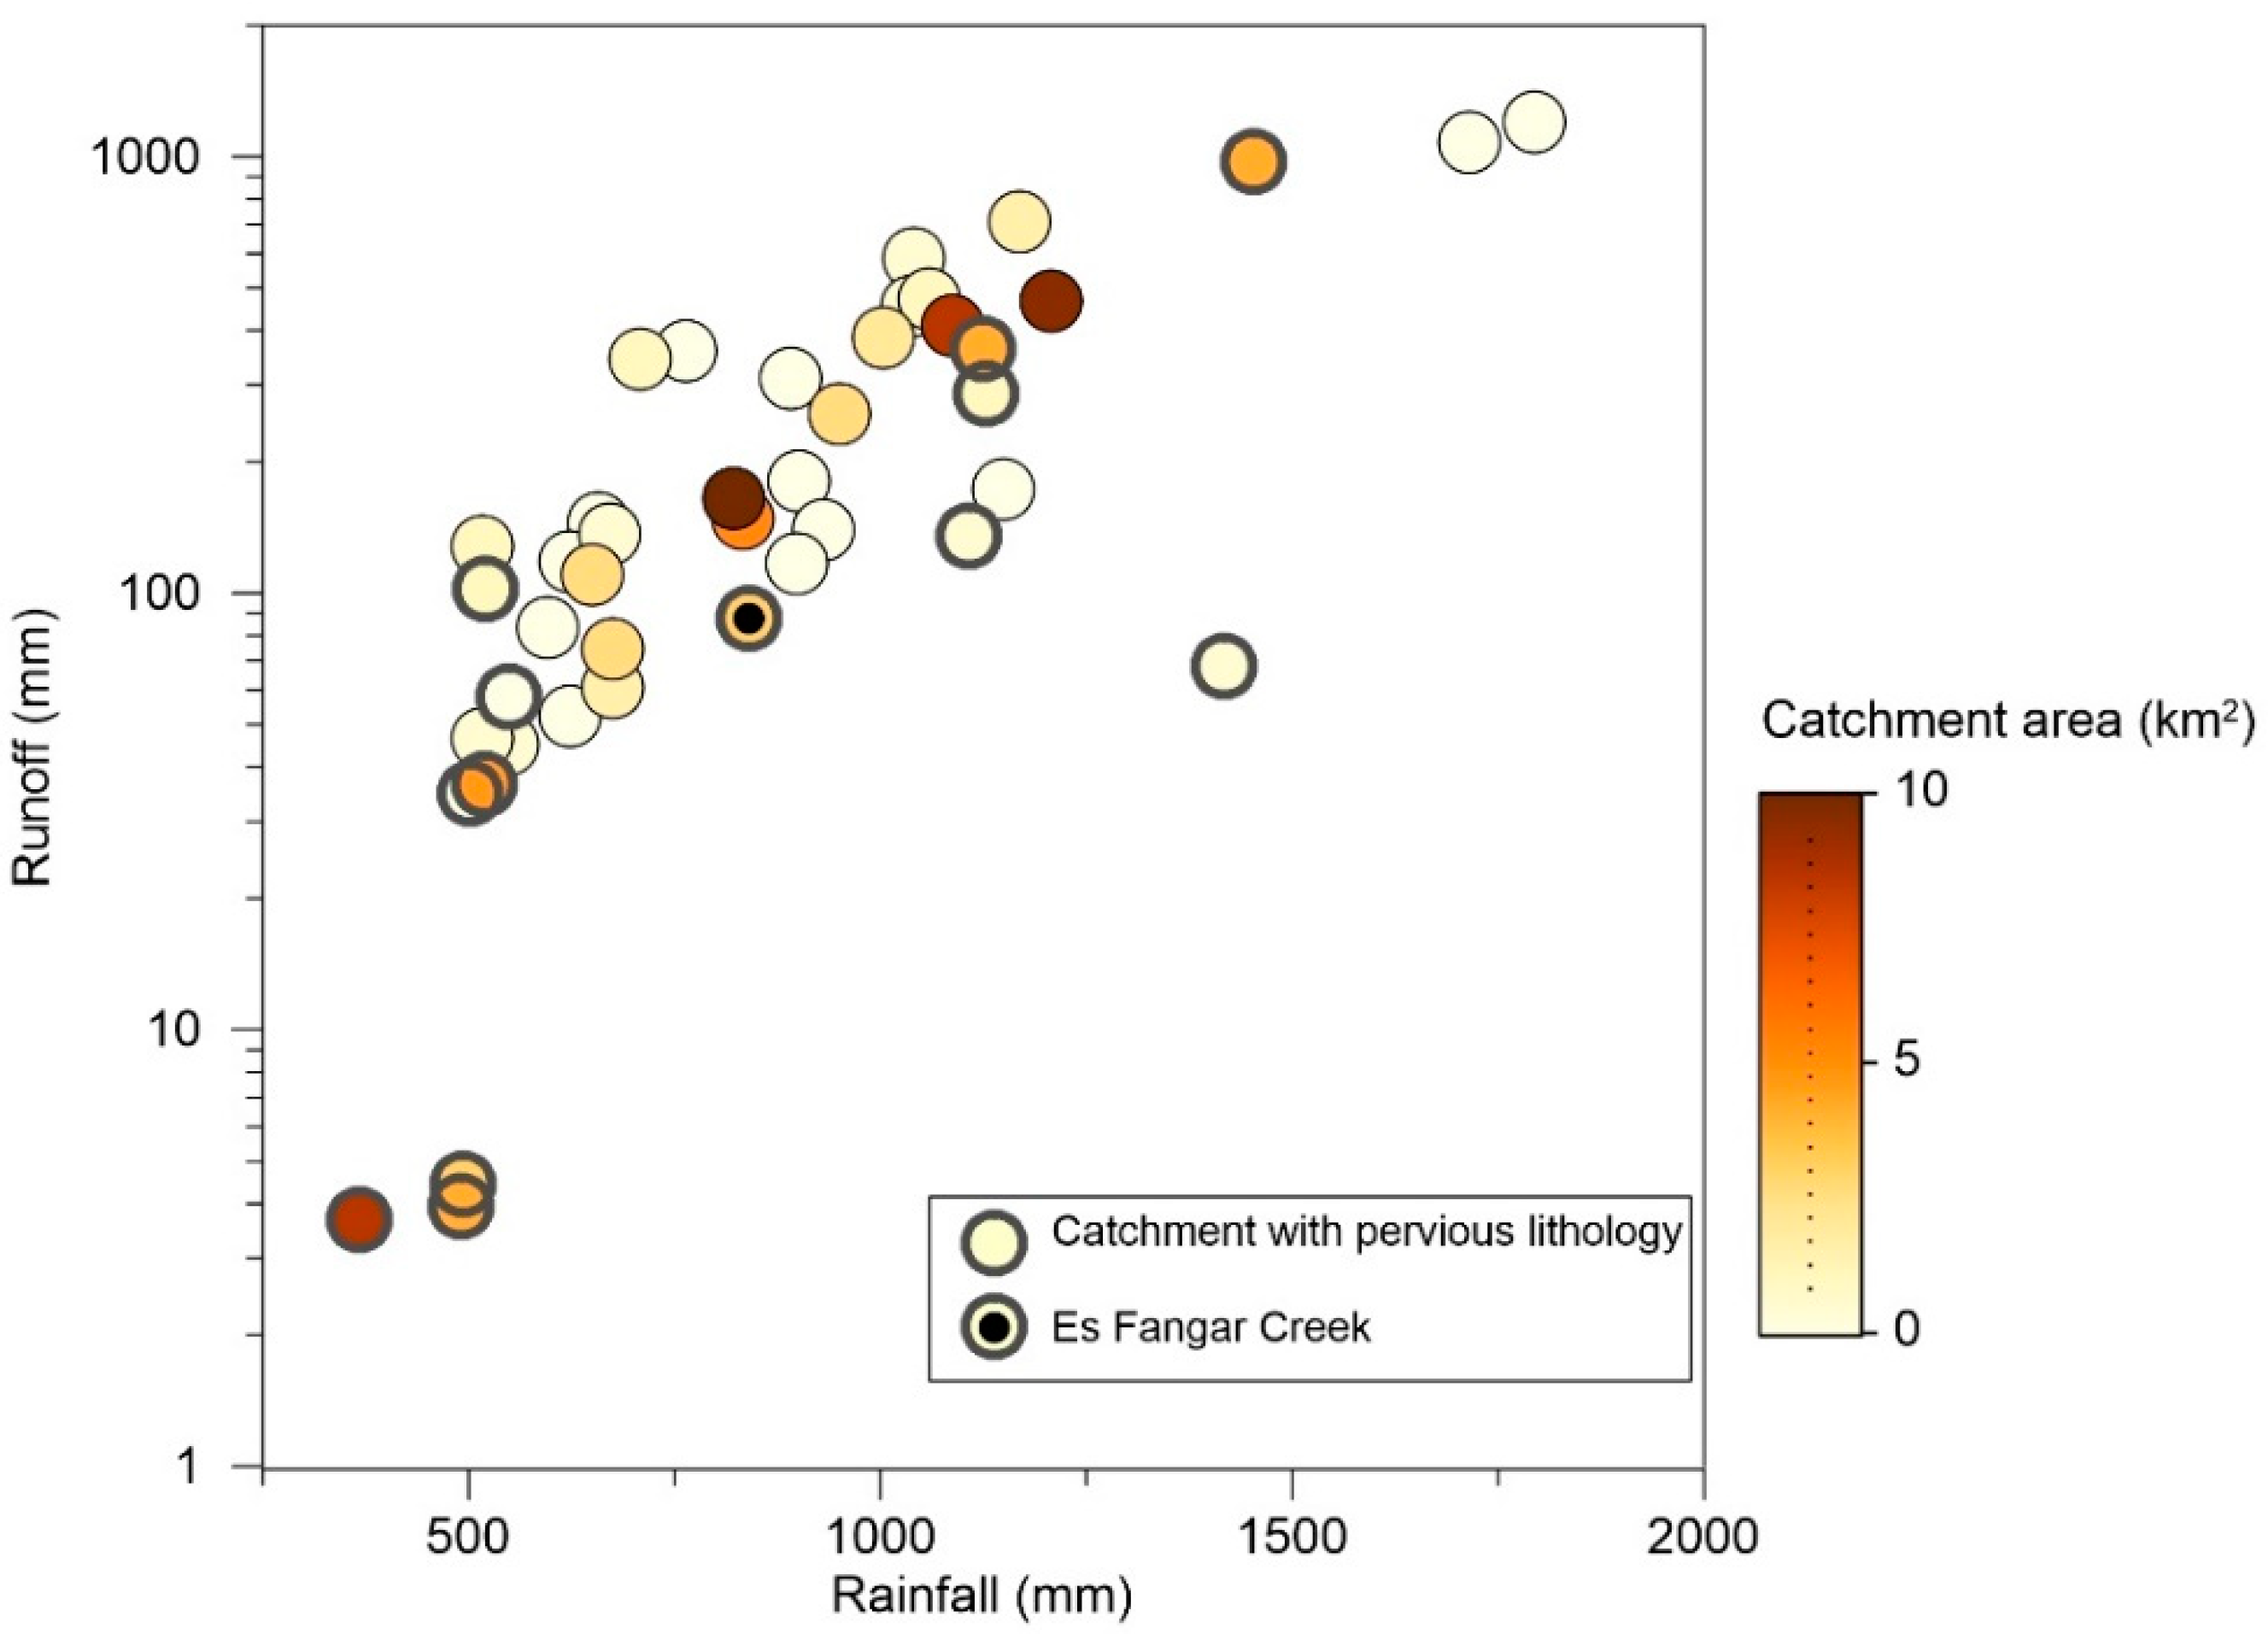
3.1.1. Annual Scale: Lithology Influence

The annual rainfall ranged from 376 to 1794 mm yr−1, whilst R ranged from 3.7 to 1200 mm within these representative catchments under Mediterranean-climate conditions. The relationship between annual rainfall and R (Figure 2) showed a significant positive linear correlation (R2 = 0.68; p < 0.01). However, some scattering was also apparent in the relationship because when catchments with pervious lithology were not included, the regression increased (R2 = 0.82; p < 0.01; see Figure 2). The lowest annual R values (<10 mm) are related to catchments with annual rainfall < 500 mm yr−1 and a pervious lithology (Figure 2), located in the Eastern Mediterranean Sea (Lower Jordan River). Besides, catchments with pervious lithology with ca. 1500 mm yr−1 of annual rainfall showed large differences in their R amount, ranging from 70 to 974 mm.

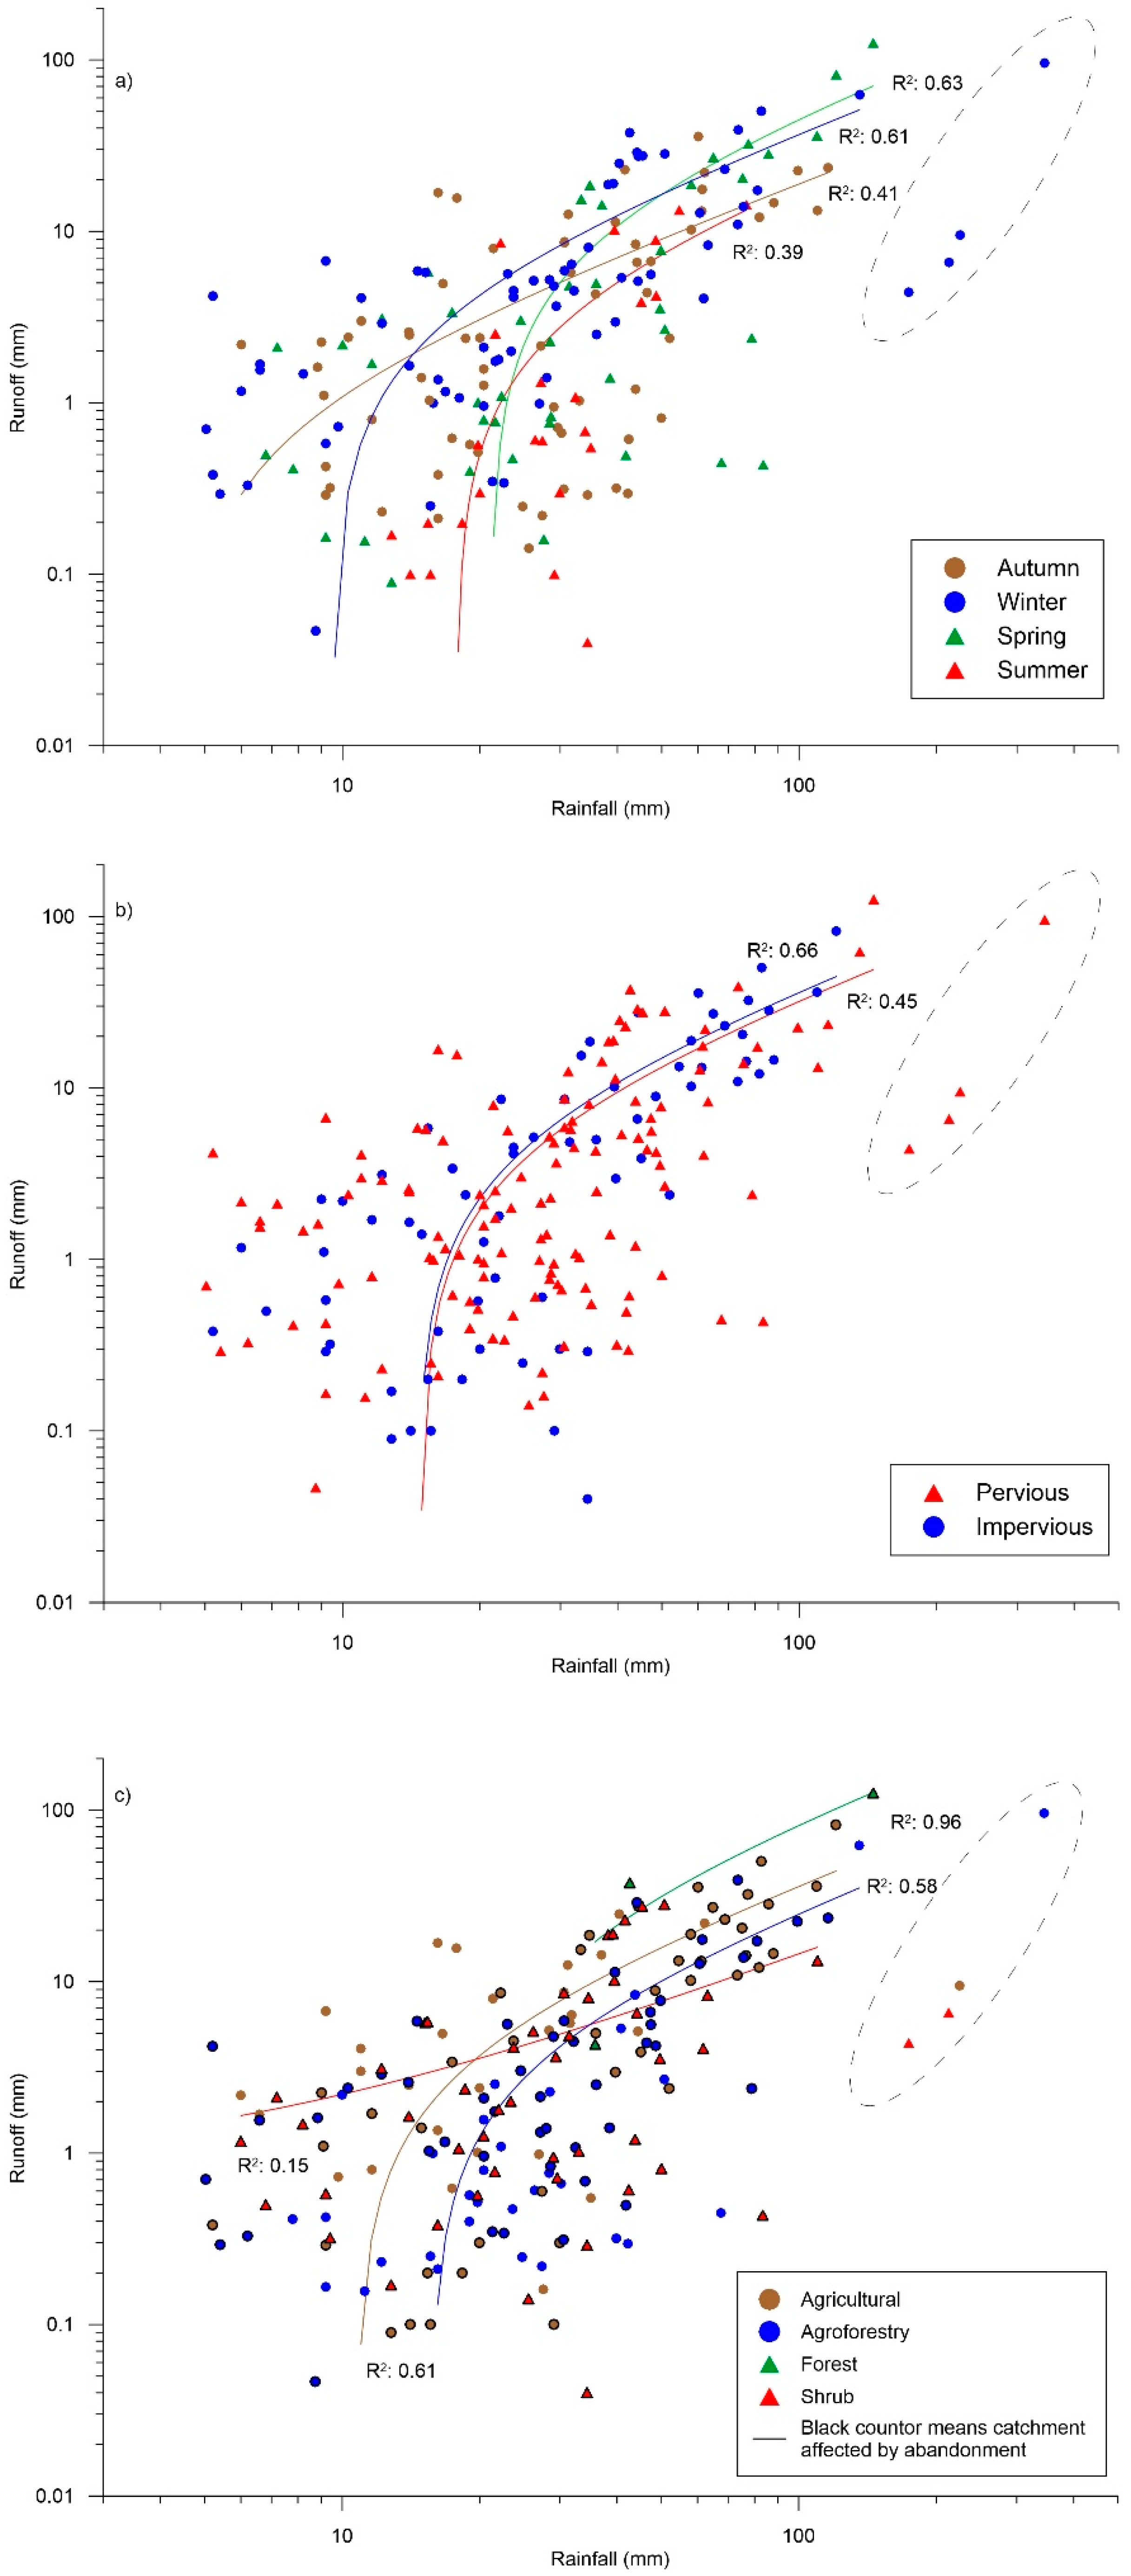
3.1.2. Event Scale: Seasonality, Lithology and Land Use Influences

To investigate the variability of the hydrological response at the event scale, the rainfall-runoff relationships of 203 events from 12 small Mediterranean-climate catchments were analysed (Table A1 (b) and Figure 3). Within Figure 3, the outliers are marked with an ellipsoid and excluded from the correlations because outliers enlarged the rating curves of these correlations, obtaining significant relationships in all cases.
The seasonal distribution of the events was winter (34%), autumn (32%), spring (22%) and summer (12%)—most of them occurred between November and February (47%). Similar seasonal median rainfall was observed, ranging from 26.2 (winter) to 29.0 mm (autumn). The highest seasonal median of event R occurred in winter (4.2 mm). However, those events occurred during the transition periods depicted a similar median R (autumn = 2.3 mm; spring = 2.2 mm) being the lowest value for summer events (0.6 mm). In the case of rainfall-runoff relationships, the highest correlation was obtained in spring (R2 = 0.63), followed by winter, autumn and summer (Figure 3a).
Small differences between the median of R events in catchments with pervious lithology (2.2 mm) and catchments without pervious lithology (3.1 mm) were observed. Nevertheless, significant differences in rainfall-runoff relationships were detected as events in catchments with pervious lithology showed the highest correlation and the lowest scattering (Figure 3b). Rainfall events > 55 mm generated a R > 4 mm, excepting events occurred in late spring (Figure 3a) in catchments with predominance of pervious lithology (Figure 3b).
Event rainfall-runoff relationship was carried out considering the differences in the main land uses of studied catchments (Figure 3c). The median event R in forest (37.6 mm) was higher than agricultural (5.0 mm), shrub (2.0 mm) and agroforest (1.5 mm) catchments. However, the highest correlations between rainfall and R were obtained in catchments with a predominance of forest (R2 = 0.96), agricultural (R2 = 0.61) and agroforest (R2 = 0.58) land uses.

3.2. Hydrological Response at Multiple Temporal Scales in Es Fangar Catchment
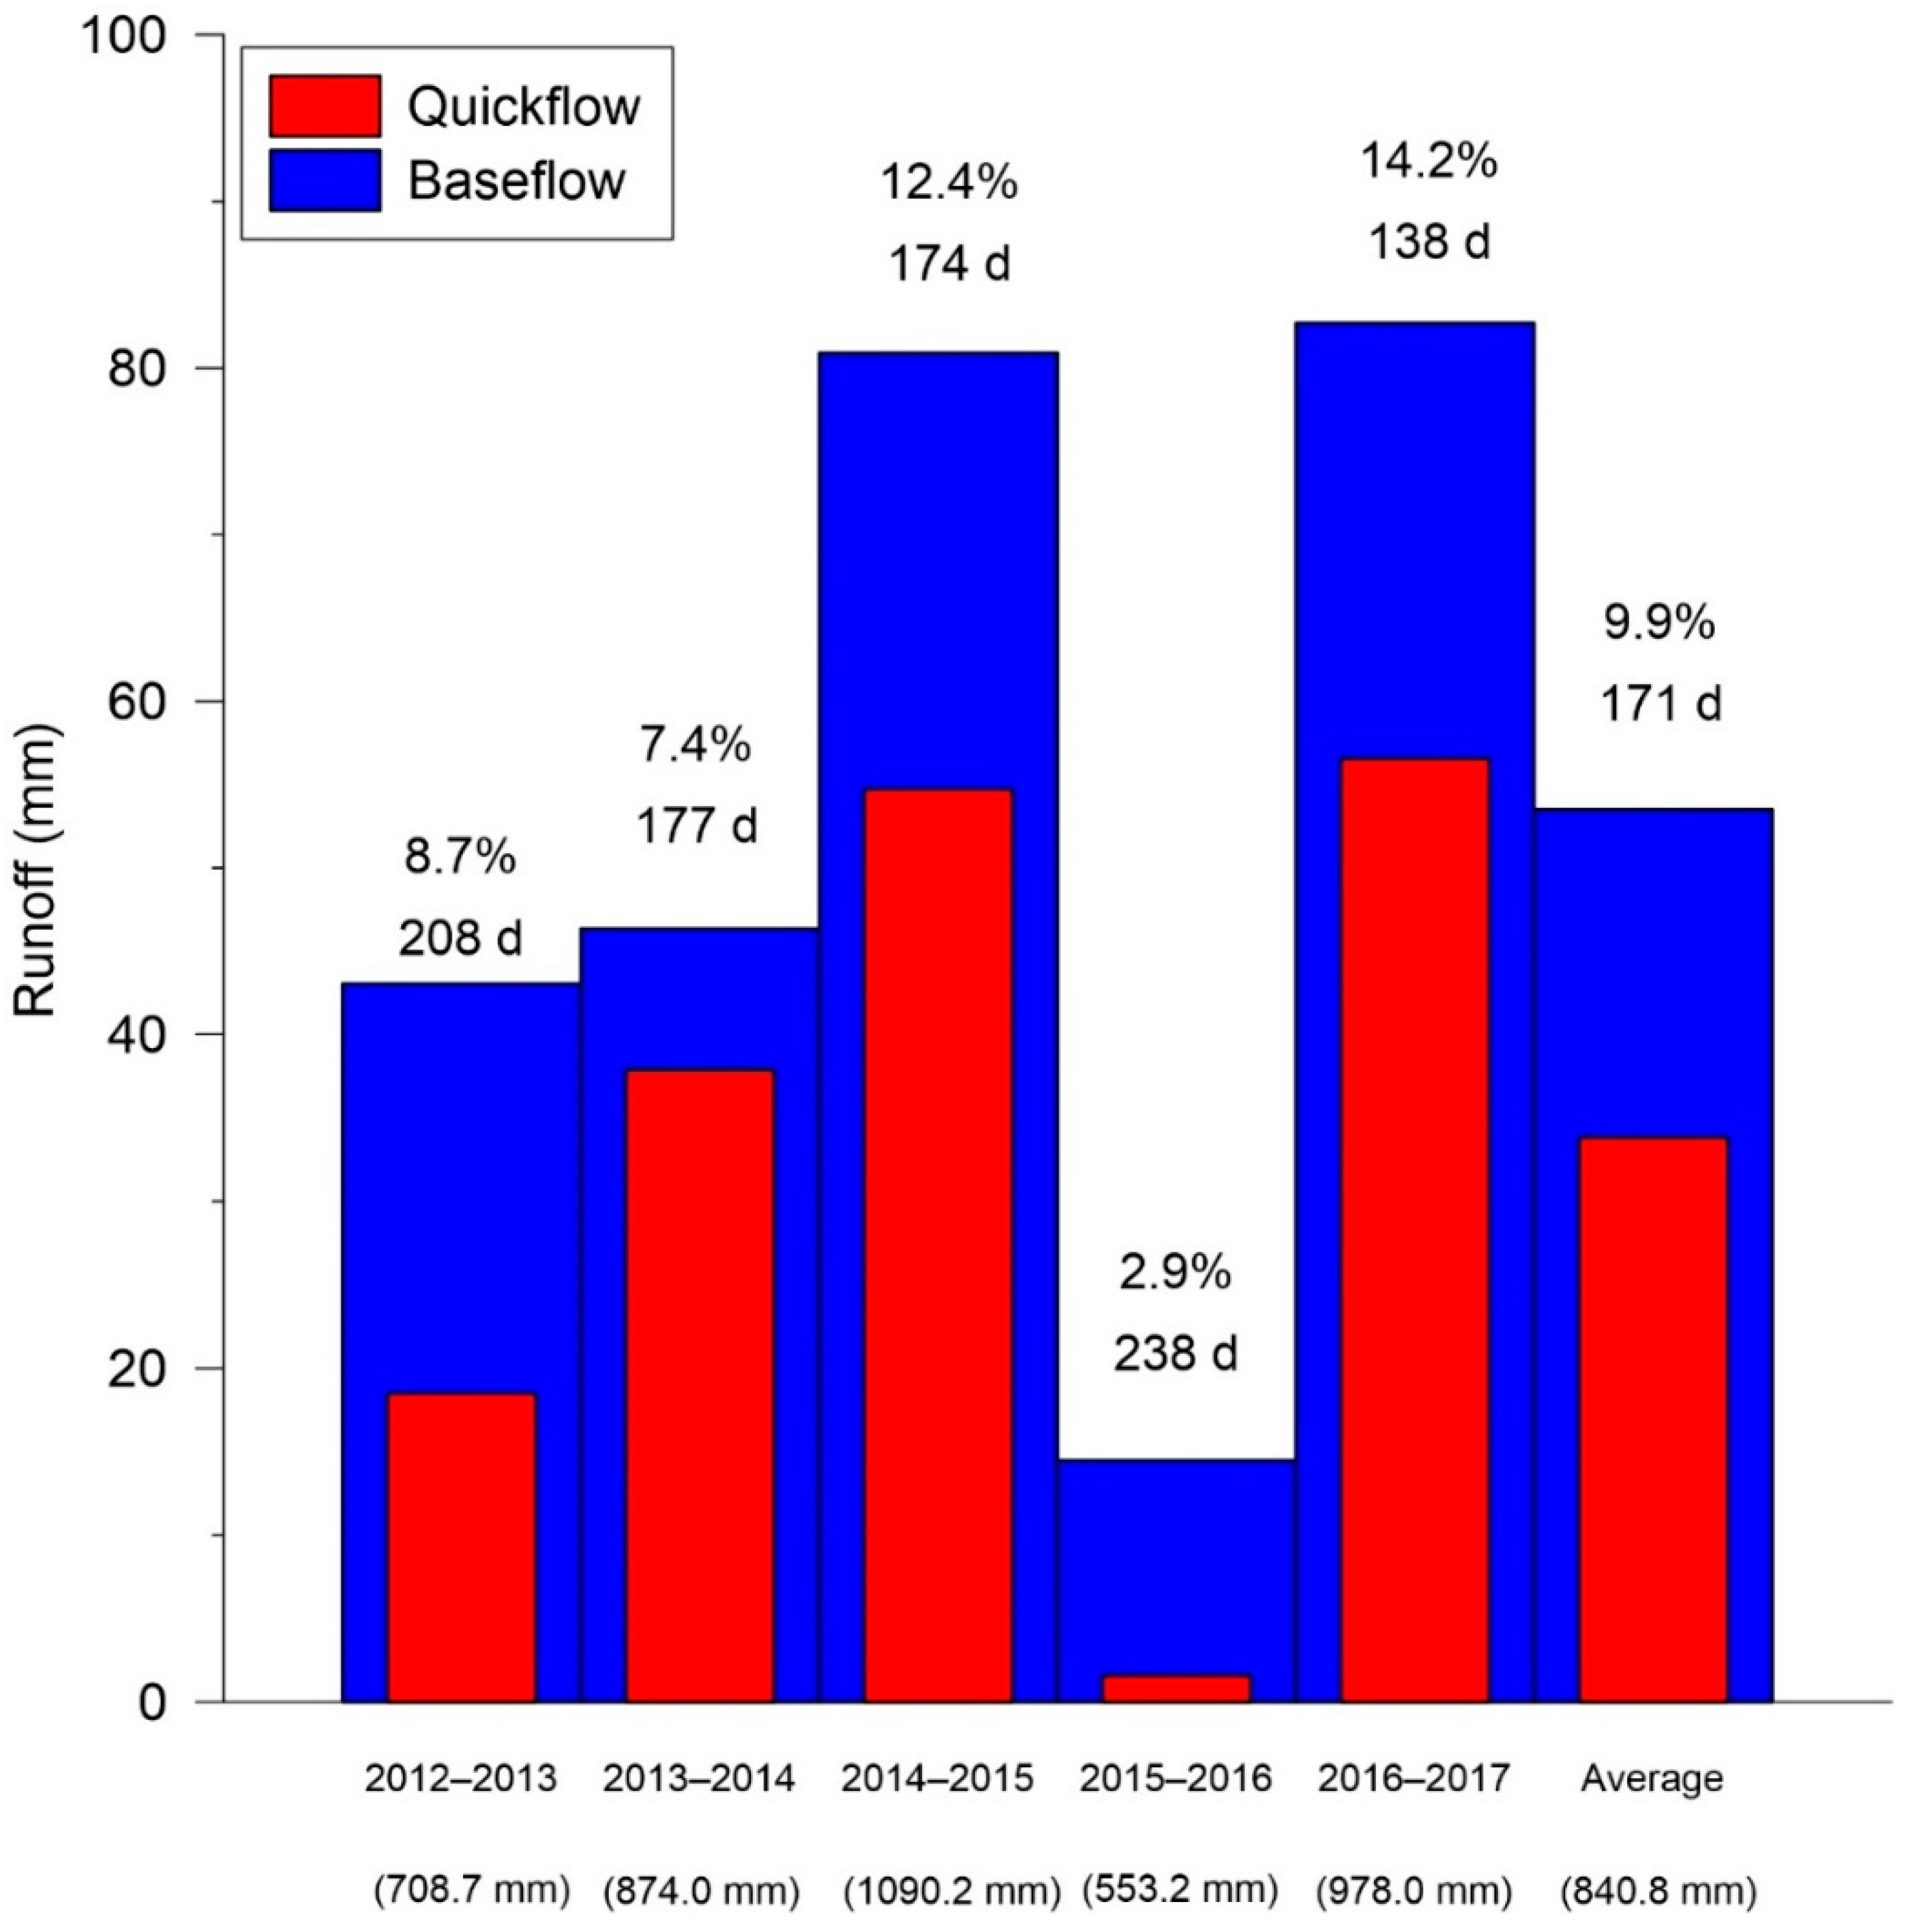
3.2.1. Annual Scale

The mean annual rainfall (840.8 mm yr−1 ± 213 mm y−1) calculated over the five hydrological years (2012–2017) was broadly representative (−9%) of the long term mean annual rainfall (927 mm y−1 ± 215 mm y−1: 1965–2016), but showed a high range of variation (coefficient of variation 25%, being 553 mm y−1 to 1090 mm y−1), characteristic of Mediterranean conditions. Figure 4 shows the annual variability of rainfall, baseflow and quickflow contributions as well the annual Rc and the number of days with observed flow at the gauging station. Linear positive relationships were observed between annual rainfall, R, Rc, baseflow and quickflow (R2 ≥ 0.84, data not shown). The annual Rc ranged from 2.9% to 14.2% (mean value = 10.4%) and quickflow contribution from 9.9% to 45.0% (mean value = 33.0%). During the study period, flow was observed 42.8% of the time. From year to year, the cumulated number of days with flow ranged from 37.8% (138 days) to 65.2% (238 days) of the total days (Figure 4). An inverse relation between annual R and the number of days with flow was established. On the one hand, hydrological years with the largest R (2013–2014, 2014–2015 and 2016–2017) showed fewer days with flow and a lower baseflow contribution (<60%). In these years, 50% to 62% of the annual R was reached in 5 or fewer days (Table A2). In addition, days with more R were always during autumn and winter. On the other hand, the hydrological years with the lowest R (2012–2013 and 2015–2016) showed 208 and 238 days with flow. The baseflow contributions represented 70% and 90%, respectively, and 50% of the annual R was reached in 10 and 17 days, also respectively. The contribution of the 5 days with more R did not exceed 28% and 37%, respectively, and these days with more R were distributed among the four seasons.

3.2.2. Seasonal Scale

Figure 5 shows the monthly mean values of rainfall, reference evapotranspiration and minimum, median and maximum R values. The mean monthly rainfall values were broadly comparable to those observed for the long-term period, except for October, when rainfall during the study period was much lower (56% lower than long-term rainfall).
The seasonal dynamics of rainfall and evapotranspiration controlled the R response. Characteristic wet (winter) and dry (summer) periods alternated throughout the year, separated by transition periods (last autumn and early spring). Autumn was the rainiest season, with low evapotranspiration and flow observed at the outlet for 52.7% of the time, on average. The autumn mean Rc was 9.1% and ranged from 4.1% to 11.4%. During November and December, a continuous baseflow was generated in response to a large rainfall amount after the pre-filling of the initial water storage in October. From October to December, the mean Rc increased from 1.3% to 13.1%. Finally, the minimum, median, average and maximum monthly R amounts in December were higher than in November, even with lower rainfall amounts (Figure 5). Although differences between the hydrological years were observed, autumn was the season with less inter-variability in terms of R response.
During winter, flow occurred during 90.6% of the time, although the mean rainfall amount (294 mm) was lower than in autumn (326 mm). This more frequent presence of flow was caused by the low evapotranspiration demand, thus keeping the hydrological pathways active, as already established in autumn. Consequently, in winter, a R amount similar to that of autumn can be generated from a lower rainfall amount. The winter mean R coefficient was 16.9%, ranging from 1.5% to 27%. During winter, the mean monthly Rc decreased from 18.9% to 14.6% between January and March as a consequence of a decreasing rainfall amount and an increasing evapotranspiration demand.
In spring, flow was observed 41.3% of the time. The monthly rainfall decreased during the season and was much lower (127.4 mm) than in autumn and winter. Although monthly evapotranspiration losses increased and were higher than rainfall, the water reserves accumulated during the autumn and winter months sustained the flow contribution. The spring mean Rc was 5.1%, ranging from 0.4% to 8.4% during the study period. The average monthly R decreased during the season from April (7.7%) to June (0.3%).
Finally, in summer, flow was observed only 0.9% of the time. The stream was most often dry in this season due to the high negative balance between rainfall and evapotranspiration. R was only ephemeral in response to the episodic rainfall events more frequent in September, when 80% of rainfall occurred on average (Figure 5). The summer Rc was 1.4%.

3.2.3. Non-Linearity Assessment at Event Scale

During the study period, the number of flood events per hydrological year was between 2 (2015–2016) and 14 (2014–2015). Their seasonal distribution was 13 events in autumn, 25 in winter, 7 in spring and 4 in summer. The events’ characteristics are detailed in Table A3. An investigation of the variability and the non-linearity of the hydrological response at the event scale was carried out by means of a comparative assessment of seven rainfall-runoff events with similar Ptot, ranging from 41.8 to 49.8 mm, but different antecedent conditions and rainfall dynamics (Figure 6).
The event on 21 January 2017 (Figure 6a) occurred under wet conditions following a runoff event on the day before. AP1d was 35.4 mm and Q0 was high (0.229 m3 s−1). The rainfall characteristics (duration and intensity) were similar to those observed for other events of the same magnitude (Figure 6b,e,g), but the hydrological response was an order of magnitude higher in terms of R (28.9 mm), Rc (65%) and Qmax (3.942 m3 s−1) due to wet antecedent conditions (Table A4). This event had a similar duration to events that occurred under higher rainfall intensities (11 November 2012, 29 September 2014). However, wet antecedent conditions were much more favourable than rainfall intensity to reach a high Qmax and especially a higher R contribution.
The event on 4 April 2012 (Figure 6b) occurred in early spring, ergo at the beginning of the transition period from wet to drier conditions. The antecedent conditions were favourable to R generation, due to the presence of a baseflow maintained by water reserves accumulated in the autumn and winter months. Rc was 16%. The event on 11 November 2012 (Figure 6c) recorded the highest IPmax30 (i.e., 77.5 mm h−1) of the study period, occurring in the transition period from dry to wet conditions (middle autumn). Previous to this event, the stream channel was dry. Under these conditions of rainfall intensity and without previous baseflow, the Rc reached 14%. Although the event on 4 April 2012 recorded a similar Rc (16%) to the 11 November 2012 event, both events resulted in different hydrographs because of different rainfall characteristics (in terms of duration and intensity) and antecedent wetness conditions. As a result, the duration of 44.7 h for the event on 4 April 2012 contrasted with the duration of the 11th November 2012 event, which only lasted 18 h. In addition, the differences between these two events were also relevant in terms of Qmax—1.006 m3 s−1 for the April event and 1.747 m3 s−1 for the event on 11 November 2012.
The event on 8 February 2017 (Figure 6d) occurred during the wet season. AP1d and a Q0 were, respectively, 0 mm and 0.012 m3 s−1. On the contrary, the event on 19 December 2016 (Figure 6e) occurred at the end of the transition period and had an AP1d and a Q0 of 2 mm and 0.012 m3 s−1, respectively. Both events had similar values of IPmax30, AP1d and Q0 (Table A4). Nevertheless, R and Rc were slightly larger for the event on 8 February 2017, likely due to the large rainfall amount accumulated during the two events (more than 400 mm of rainfall between 19 December 2016 and 8 February 2017).
The event on 7 May 2016 (Figure 6g) was similar to the event on 19 December 2016 (Figure 6e) in terms of Ptot, duration and intensity. Nevertheless, R response started earlier (i.e., shorter response time) for the event on 19 December 2016. This difference was caused because the December 2016 event occurred during the wetting-up period when catchment water reserves were increasing. As a result, whilst the R response was relatively small (4.4 mm), Rc (9%) and Qmax (0.394 m3 s−1) were significantly larger than for the event on 7 May 2016 (Table A4), which occurred during the transition period towards dry conditions. With an AP1d of 1.6 mm and Q0 of 0.006 m3 s−1, the lowest R response was generated (see total runoff, Rc and Qmax in Table A4). This R response was also the most delayed, as shown on Figure 6g, starting when 95% of the rain (39.8 mm) had fallen on the catchment.
The event on 29 September 2014 (Figure 6f) occurred during the dry season (i.e., late summer, early autumn) but with an AP1d of 11.8 mm. The rainfall event was the shortest of these seven selected events (3.2 h), with the second highest IPmax30 (56.4 mm h−1) of the study period. This very high intensity triggered a R response during dry conditions. Similar rainfall but lower intensities during dry conditions always produced lower responses (Rc ≤ 3%). Although the R response was relatively small (4.2 mm) with Rc < 10%, Qmax was relatively high (2.356 m3 s−1), promoted by the rainfall intensity.

4. Discussion on Hydrological Responses in Small Mediterranean-Climate and Es Fangar Catchments

4.1. Annual and Seasonal Scales

4.1.1. Small Mediterranean-Climate Catchments: Lithology Influences

Catchments with annual rainfall ranging from 500 to 900 mm yr−1 showed annual R ca. 20–350 mm, where the role played by lithology on the annual R response was important. Accordingly, the highest annual R values (>350 mm) were observed in catchments with badland areas [34] and a high subsoil clay content promoting lateral flow and a perennial regime [35]. Swarowsky et al. [54] also reported an annual R 17% lower than in an adjacent catchment to that investigated by Lewis et al. [35] and related this difference to greater deep infiltration. Similarly to our results, Merheb et al. [46] obtained a significant rainfall-runoff correlation (R2 = 0.69) using 160 catchments from the Mediterranean Region (0.35 to 21,700 km2). These authors highlighted that the scattering observed was due to karstic catchments or snowmelt contributions.
Also, scattering can be observed in the relationship for catchments with annual rainfall >1000 mm yr−1. For this group of catchments, the annual R ranged from 135 to 1200 mm, except for the Santa Magdalena catchment, which is entirely on a limestone lithology and yielded an annual R value of 70 mm [47]. Large annual R values usually corresponded to watertight catchments with R values > 1000 mm yr−1 for two small Mediterranean-climate catchments on granite bedrock [36]. However, karstic environments can also promote very high annual R values, e.g., Ref. [55], as a result of incoming karstic spring sources. The conceptual model developed by Borg Galea et al. [2], which is based in exogenous and endogenous variables that link natural and human-derived variables and their influences in the system on a spatial–temporal scale, emphasized that climate is the main exogenous driver of the rainfall-runoff relationship, although their processes through precipitation, temperature and wind are mediated by catchment geology (endogenous variable).
Different seasonal rainfall-runoff relationships in relation to the influence of rainfall and evapotranspiration [56] are related to the alternation of rainfall and reference evapotranspiration throughout the year reproducing wet (winter), dry (summer) and transition periods (last autumn and early spring) [57]. Accordingly, winter is the season with the highest Rc, from 17% to 56%, due to rainfall being accumulated during autumn—and maintained in winter—and low evapotranspiration demand [10,15,56]. The same pattern was also observed during the five hydrological years assessed in Es Fangar Creek. In addition, all these studies also emphasized that in summer the hydrological response is limited or null, with Rc < 10%. Serrano-Muela [56] observed runoff coefficients < 5% in a range of rainfall amounts of 15–200 mm during summer in a small catchment characterized by a large forest cover. The driest environments in these studies obtained a summer Rc < 2%. Rc in autumn and spring were similar, ranging from 9% to 25% and 5% to 28% respectively. However, a variability throughout the seasons can be observed, especially in late autumn and early spring, as these are transition periods. Additionally, Lana-Renault [10] observed that the wetting-up period was steeper than the drying-down period, which was more progressive in a catchment located in the Pyrenees. Autumn was the season after the driest period, and it was when the evapotranspiration reached the maximum values. The beginning and the end of this season can be quite different in relation to Rc. The catchments have a null or limited response until a succession of rainfall events that fill the water reserves and generate favourable conditions for R generation [56]. The findings of Lana-Renault [10] in spring concluded that the accumulated rainfall during autumn and winter maintain high water reserves, allowing high runoff coefficients, even though spring was not the rainiest season.

4.1.2. Es Fangar

In the Es Fangar catchment, a low mean annual R value (87 mm) was recorded during the 2012–2017 period, despite its mean annual rainfall value (black dot on Figure 2). This result is most likely related to the presence of massive karstic dolomites and breccias in the lithology of the catchment headwaters.
The reported annual R in Es Fangar is within the R range of small catchments located in Mallorca, with annual rainfall ranging from 500 to 900 mm yr−1, which yielded annual R between 36 and 130 mm. From these catchments, the highest R value was observed in an agricultural small lowland catchment prone to receiving subsurface contributions [15]. Spatial differences in the annual R between the headwater (102 mm) and catchment outlet (36 mm) due to transmission losses along the main channel were detected in the Sa Font de la Vila River, a mid-mountainous terraced catchment affected by forest fires [58]. Within this catchment, temporal differences were observed as Rc ranged from 1% to 22% from one year to year.

4.2. Event Scale

4.2.1. Seasonality, Lithology and Land Use Influences on Small Mediterranean-Climate Catchments Hydrological Response

The seasonal dynamics of rainfall and evapotranspiration during the year generate wet, dry and transition periods, which control the R response [10,53]. Therefore, seasonally, the highest correlation observed in spring could be related to the water reserves accumulated during the autumn and winter seasons, which is favourable for R generation [13]. According to the seasonal distribution of the 203 events, other studies in Mediterranean-climate catchments observed an event seasonality in the hydrological response [8,10,59] where autumn rainfall events produced a limited or null R response, especially at the beginning of the season. In addition, in winter and spring, the Rc values were always larger than 3%, being the maximum in spring (70%).
The role of transmission losses due to lithology has been investigated [32,60], depicting how low runoff values were recorded due to infiltration. In this study (see Section 3.2), events assessed in catchments with a predominance of pervious lithology showed a higher scattering than events in impervious catchments. In addition, rainfall events >55 mm generated R > 4 mm, except in events occuring in late spring in catchments with pervious lithology. In this case, the transmission losses due to pervious lithology have more influence on the hydrological response than the seasonal role of the water catchment reserves. Ries et al. [61] identified a low and large R response in rainfall events >50 mm based on the physiographic catchment and rainfall characteristics. Events occurring in catchments, which even had different land uses, with less bedrock permeability and less soil water storage but with higher values of rainfall intensity generate a greater R response than catchments with more bedrock permeability and soil water storage under low rainfall intensities. Contrarily, other types of lithology (i.e., badland areas) are characterized by a low infiltration capacity [62]. Latron and Gallart [63] observed that frequently badlands are the only active area to R response. According to these findings, Nadal-Romero et al. [64] observed an event stormflow coefficient of up to 20% in a Mediterranean-climate catchment with badland areas, even when the headwater catchment was forested (30% of the catchment area).
Events occurring in agricultural catchments obtained the second highest values in the median R and in the rainfall-runoff correlation, as arable land and its spatial distribution within a catchment have been demonstrated to be a driver for R generation [65]. However, events in the forest catchment had the highest correlation and median R, as the water yield and rainfall-runoff relationship decrease in forests catchments when compared to agricultural catchments, due to forest cover [66]. However, this correlation (R2: 0.96; n: 3) and median value is related to the presence of karstic springs in the forest catchment, which was the only forest catchment found in the literature. The median R of forest catchments could be similar to the values obtained in afforested ones, as both land uses trigger a reduction in the R generation. This reduction was quantified in a loss of water yield ca. 10–40% [38,66,67,68,69]. Nevertheless, larger flows and Qmax were observed in afforested catchments than forest ones. The shrub median R (2.0 mm) was higher than afforested catchments, as shrub coverage is characterized by lower vegetation cover than forest and afforested land uses. In addition, the second main land use in shrub catchments is agricultural land use (Figure 1A), which could explain the higher median R compared with the afforested catchments. The same results were observed in García-Ruiz et al. [66], where catchments under shrub land use had lower R contributions than catchments with forest land use due to a lower plant cover density in the shrub catchment.

4.2.2. Rainfall-Runoff Relationship at the Es Fangar Catchment

The identification of driving factors explaining the variability of Rc can be explored through the relationships between Rc and R and Ptot, rainfall, maximum intensity and baseflow at the beginning of the event, as Latron et al. [8] carried out in a mountainous Mediterranean-climate catchment in North Eastern Spain.
Only the correlation between R and Rc was significant in the Es Fangar catchment (Figure A2a), explaining 73% of the variance. As in Latron et al. [8] this relationship had the highest correlation. However, contrarily to Latron et al. [8], the relationship between rainfall and Rc was highly non-lineal in Es Fangar, presenting a huge scattering, especially for Ptot between 20 and 60 mm (Figure A2b), which yielded Rc ranging from 1% to 65%. For larger rainfall events (i.e., 60 to 100 mm), the Rc values were high (>20%), but low R responses (with Rc ranging 1% to 3%) were also observed when large rainfall events were recorded after or during dry conditions. In line with the results from Latron et al. [8], Rc was not related with rainfall intensity (Figure A2c).
The relationship between Q0 and Rc was not linear in the Es Fangar catchment (Figure A2d). A threshold was identified leading to larger Rc (>10%) for events with Q0 above 0.04 m3 s−1, which always occurred between November and April. The relationship between Q0 and Rc in Latron et al. [8] was stronger, because of the presence of a baseflow during most of the year. In general terms, the frequent absence of a baseflow in the Es Fangar catchment between May and October worsens most of the relationships presented in Figure A2 in comparison to a catchment with an almost permanent baseflow, as in Latron et al. [8] and Nadal-Romero et al. [40]. Then, baseflow–Rc correlation increased as the environment got wetter, from R2 = 0.19 in Es Fangar to R2 = 0.70 in a humid catchment [70].
In order to help in identifying the main factors involved in the hydrological response in the Es Fangar catchment, multiples relationships were carried out to investigate the influence of rainfall, Q0 and IPmax30 on R and Qmax (Figure 7). The hydrological response by using R and Qmax was highly non-linear, as observed in other Mediterranean-climate catchments [8,11] because the soil moisture antecedent conditions are crucial for R generation. Figure 7a shows how the R response could not be explained by Q0, as the highest R values presented a large scattering along the Y axis. This pattern confirmed that large R amounts (i.e., >10 mm) may occur from large rainfall events occurring in dry or wet conditions (i.e., with low or high Q0 values). Therefore, Ptot was a key factor for R response, as shown by the significant positive correlation (p < 0.01) between both variables (Table 2). The largest R values were always recorded during last autumn or winter, with contributions of >17 mm (Figure A3 and Table A5), and are characterized by Ptot, R, Rc, Qmax and AP1d values much higher than median values (Table A3). Contrarily, large rainfall events occurring in spring resulted in a small R contribution because of the dry antecedent conditions (i.e., low or null Q0 values). Other authors also assessed relationships between seasonality and R generation. In a mountainous catchment, Lana-Renault [10] observed that the highest rainfall-runoff correlations at the event scale were depicted in winter and spring due to higher water reserves than in autumn and summer. In Es Fangar, a group of events during autumn and winter characterized by Q0 > 0.080 m3 s−1 always generated Rc greater than 14% (Figure A2d). The Ptot of these events ranged from 5.2 to 61.4 mm but the AP1d was larger than 20 mm, except in one event (AP1d: 3.4 mm), which was characterised as the highest IPmax30 (i.e., 77.5 mm h−1) of the study period. These event characteristics suggest that Ptot was the main factor controlling an effective hydrological response as antecedent conditions (i.e., soil moisture degree of the catchment) have been demonstrated to play an important role in R generation [18]. Similarly, Lana-Renault [10] identified a cluster of events characterized with the highest Q0 that generated a larger R response, but the convective rainfall occurring in the Pyrenees during summer blurred the seasonal pattern described in the Es Fangar catchment.
Figure 7b shows that high Qmax values were observed in response to large rainfall amounts (above 50 mm) or for flood events with a Q0 value higher than 0.080 m3 s−1. Both factors had a combined effect on the generation of high Qmax values as shown by the significant correlation observed between Ptot and Q0 and Qmax. The role of wet conditions over Qmax was also observed in other Mediterranean-climate catchments where AP1d correlated significantly with Qmax [15,17,71].
R and Qmax were not significantly correlated with IPmax30 (Table 2). Figure 7c,d show how high values of R and Qmax resulted for events with low IPmax30 when rainfall was > 50 mm or high Q0. This absence of correlation between rainfall and the catchment response (R and Qmax) indicates that R generation is most likely the result of saturation excess processes [72], where Ptot and antecedent conditions played a key role. For events between June and September, saturation excess processes were, however, probably less dominant and combined with infiltration excess processes in response to highest IPmax30 values ranging from 19 to 56.4 mm h−1. As a result, the events observed between June and September were shorter (5.7 to 14 h duration compared to 8 to 65.5 h for wet conditions events). Therefore, R mechanisms co-exist within a Mediterranean catchment [13] such as Es Fangar, with a marked seasonality, with saturation processes being dominant during the wet period and Hortonian R during the dry period. Consequently, the alternation of the R mechanisms generated lower and larger R contributions in events occurring during the dry and wet seasons, respectively. These processes caused the non-linearity of the hydrological response because the same amount of Ptot generated a non-lineal R response due to different soil moisture conditions [15,64].

4.2.3. Non-Linearity Assessment at Es Fangar Catchment

The events analysed in Figure 6 presented a huge variability in their hydrological response, despite recording a similar Ptot, ranging from 41.8 to 49.8 mm. Rc ranged from 1% to 65%, depending on the catchment moisture conditions, rainfall intensities and seasonality characteristics. The highest hydrological response occurred under marked wet soil moisture conditions in the winter period, even with low rainfall intensities (Figure 6a). A similar complexity in R responses has already been observed in other Mediterranean-climate catchments where seasonality and antecedent soil moisture conditions played a key role in R generation [11,57]. Gallart et al. [73] also showed that different R generation behaviours could be observed during the year due to varying catchment wetness conditions and changing rainfall events characteristics. The results obtained by these authors are clearly illustrated by comparing Events 2 and 20 with Events 18 and 37 in Figure 6. Indeed, R events that occurred during wet conditions with low rainfall intensities (18 and 37) showed similar Rc than events that occurred during dry conditions with high rainfall intensities (2 and 20). However, during dry conditions, runoff events resulting from low intensity rainfall yielded the lowest R responses (e.g., Event 36). Our results are also in agreement with the observations made by Schnabel et al. [74], who observed higher R contributions for low rainfall intensities events occurring in periods with high soil water content than for events with high rainfall intensities. Besides, those authors pointed out that this condition was common during years with above average rainfall (i.e., during wet years) but was rarely observed during dry years.

5. Conclusions

The evaluation of multiple temporal scales in contrasting small Mediterranean-climate catchments has improved the understanding of the role played by lithology and land use in the hydrological response. The assessment of rainfall-runoff relationships at the annual scale in small Mediterranean-climate catchments showed a significant linearity in the hydrological response due to the importance of the annual rainfall amount. Nevertheless, lithology effects on R generation explained an increase in the scattering in the rainfall-runoff relationship because pervious and impervious materials triggered larger and lower R contribution, respectively. Despite the significant correlation between rainfall and R, the Es Fangar Creek dataset illustrated a huge intra-annual variability of the rainfall-runoff relationship during the five hydrological years analysed, as seasonal rainfall and evapotranspiration dynamics controlled the R response. These dynamics were clearly observed in the average seasonal Rc, decreasing from winter to summer. As a result, these seasonal differences should be considered as a starting point of the non-linearity generation in the rainfall-runoff relationships at the event scale.
At the event scale, lineal and non-lineal relationships were observed in the rainfall-runoff relationships in small Mediterranean-climate catchments, suggesting that different factors conditioned the R response. The total rainfall was the most significant driving factor, although the interaction between seasonality and the spatial diversity of lithology and land uses at the catchment scale also played an important role in R generation. Thus, the highest correlations at the seasonal scale were observed in those events which occurred in winter and spring when the highest water reserves favoured the R response. Lithology caused a higher dispersion in the rainfall-runoff relationships at the event scale in the set of small Mediterranean catchments because pervious materials required higher antecedent wetness conditions. Different land uses promoted a decrease in R generation, comparing agricultural with scrubland uses, because agriculture promoted the highest correlation in the rainfall-runoff relationships due to lower vegetation cover. Therefore, human-induced alterations related to land uses in the R generation must be assessed in those countries were the abandonment of upland agricultural catchments have allowed natural vegetation to expand (i.e., southern Europe) and also in countries were agriculture and irrigated areas are increasingly replacing forest and shrub lands (i.e., North African Maghreb). However, events under agricultural land use or which occurred in the winter season independently of the land use and lithology catchments were the situations which were able to generate a higher linearity in the rainfall-runoff relationships.
This temporal downscaling from the annual to event scale elucidated how different R mechanisms can co-exist in small Mediterranean-climate catchments, considering the main temporal and spatial factors that govern the river catchment connectivity. Despite this, controls on R generation in Mediterranean-climate catchments require further attention to assess the role of lithology, land use and seasonality and their combined effects on the hydrological response for going beyond in the comprehension of highly sensitive areas to global change, such as the Mediterranean region. Considering that the performance gaps of hydrological processes in hydrological models due to the results of rainfall-runoff at daily scales are smoothed in small Mediterranean-climate catchments, the findings of this study improve the comprehension of hydrological processes as practical field knowledge needed to complete hydrological modelling at the event scale.

Author Contributions

Conceptualization, J.F., J.L. and J.E.; methodology J.E. and M.T.-B.; data curation, J.G.-C., A.C. and M.T.-B.; writing-original draft preparation J.F.; writing-review and editing, J.F., J.L., J.C. and J.E.; visualization J.G.-C., J.C. and A.C. and supervision J.L. and J.E. All authors have read and agreed to the published version of the manuscript.

Funding

This work was supported by the research project CGL2017-88200-R “Functional hydrological and sediment connectivity at Mediterranean catchments: global change scenarios –MEDhyCON2” funded by the Spanish Ministry of Science, Innovation and Universities, the Spanish Agency of Research (AEI) and the European Regional Development Funds (ERDF). The contribution of Jérôme Latron was supported by the research project PCIN-2017-061/AEI also funded by the Spanish Government. Josep Fortesa has a contract funded by the Ministry of Innovation, Research and Tourism of the Autonomous Government of the Balearic Islands (FPI/2048/2017). Julián García-Comendador is in receipt of a pre-doctoral contract (FPU15/05239) funded by the Spanish Ministry of Education, Culture and Sport. Miquel Tomàs-Burguera acknowledges the support from the project CGL2017-83866-C3-3-R financed by the European Regional Development Funds (ERDF) and the Spanish Ministry of Science, Innovation and Universities. Jaume Company is in receipt of Young Qualified Program fund by Employment Service of the Balearic Islands and European Social Fund (SJ-QSP 48/19). Aleix Calsamiglia acknowledges the support from the Spanish Ministry of Science, Innovation and Universities through a pre-doctoral contract (BES-2013-062887).

Acknowledgments

Part of the meteorological data were provided by the Spanish Meteorological Agency (AEMET).

Conflicts of Interest

The authors declare no conflict of interest.

Appendix A

Table A1. Mediterranean studies used into the rainfall-runoff relationship at (a) annual and (b) event scale.
Time ScaleCatchmentCountryArea (km2)Precipitation (mm year−1)Temperature (ºC)Main LithologyReference
(a) Annual scaleWatershed CUSA0.0565716.1ImperviousCited in Latron [47]
TM9Spain0.0689113.5ImperviousCited in Latron [47]
Watershed BUSA0.09901.713.9ImperviousDahlgren et al. [75]
Watershed GUSA0.13931.313.9ImperviousDahlgren et al. [75]
Watershed BUSA0.1762316.1ImperviousCited in Latron [47]
Watershed AUSA0.1962316.1ImperviousCited in Latron [47]
SpruceFrance0.2017946.6ImperviousDidon-Lescot et al. [36]
La SapineFrance0.201715.66.6ImperviousDidon-Lescot et al. [36]
Watershed CUSA0.23898.813.9ImperviousDahlgren et al. [75]
MokobulaamSouth Africa0.26115017.2ImperviousCited in Nadal-Romero [34]
HRECUSA0.3354915.0PerviousSwarowsky et al. [54]
GuadalperalónSpain0.3550216.0PerviousCeballos and Schnabel [9]
La TeulaSpain0.39595.512.5ImperviousCited in Latron [47]
AraguásSpain0.45764.611.8ImperviousNadal-Romero [34]
AvicSpain0.5254812.5ImperviousCited in Latron [47]
Sta MagdalenaSpain0.5314187.3PerviousLatron [47]
Can VilaSpain0.5610419.0ImperviousLatron [47]
BoussicautFrance0.73103813.9ImperviousCited in Latron [47]
San SalvadorSpain0.9211089.5PerviousSerrano-Muela [56]
ParapuñosSpain1.00516.214.3ImperviousSchnabel et al. [74]
SchubertUSA1.0370815.7ImperviousLewis et al. [35]
Can RevullSpain1.0351716.5ImperviousEstrany et al. [15]
Sa MurteraSpain1.20520.416.5PerviousGarcía-Comendador et al. [58]
CannataItaly1.3067114.3PerviousLicciardello et al. [76]
Ca l’IsardSpain1.3211287.3PerviousLatron [47]
VaubarnierFrance1.49105913.9ImperviousCited in Latron [47]
DesteouFrance1.53116913.9ImperviousCited in Latron [47]
BoscSpain1.60675.113.0ImperviousPacheco et al. [77]
TM0Spain2.00100413.5ImperviousCited in Latron [47]
CampàsSpain2.57675.113.0ImperviousPacheco et al. [77]
KamechTunisia2.6365014.0ImperviousSlimane et al. [78]
ArnásSpain2.8495111.0ImperviousLana-Renalut [10]
Headwater 4Jordan3.2049316.7PerviousRiest et al. [61]
Es FangarSpain3.35840.815.7PerviousThis study
Cal RodóSpain4.1711259.0PerviousLatron [47]
Headwater 3Jordan4.2049116.7PerviousRiest et al. [61]
BiniaraixSpain4.401453.212.0PerviousCalsamiglia et al. [55]
Sa Font de la VilaSpain4.80519.616.5PerviousGarcía-Comendador et al. [58]
CogolinsFrance5.4783313.9ImperviousCited in Latron [47]
Headwater 2Jordan8.4036716.7PerviousRiest et al. [61]
MauretsFrance8.48108813.9ImperviousCited in Latron [47]
ValescureFrance9.22120813.9ImperviousCited in Latron [47]
MaravalFrance9.6182213.9ImperviousCited in Latron [47]
CatchmentCountryArea (km2)Precipitation (mm year−1)Land useMain lithologyReference
(b) Event scaleGuadalperalónSpain0.3522AgroforestryPerviousCeballos and Schnabel [9]
Can VilaSpain0.5639.6AgriculturalImperviousLatron and Gallart [18];
Roig-Planasdemunt et al. [79];
Cayuelta et al. [80]
ParapuñosSpain1.0017.4AgroforestryImperviousSchnabel et al. [74]
Can RevullSpain1.0319.9AgriculturalImperviousEstrany et al. [15]
Sa MurteraSpain1.2043.9ShrubPerviousGarcía-Comendador et al. [58]
ArnásSpain2.8420.1ShrubImperviousLana-Renalut [10]
Headwater 4Jordan3.20225AgriculturalPerviousRiest et al. [61]
Es FangarSpain3.3529AgroforestryPerviousThis study
Headwater 3Jordan4.20213ShrubPerviousRiest et al. [61]
BiniaraixSpain4.4042.6ForestPerviousCalsamiglia et al. [55]
Sa Font de la VilaSpain4.8036.9ShrubPerviousGarcía-Comendador et al. [58]
Headwater 2Jordan8.40174ShrubPerviousRiest et al. [61]
Table A2. Relative rainfall and R contribution of the highest 5 days and number of days to reach the 50% of R for each hydrological year in the Es Fangar Creek.
YearRainfall Contribution of 5 Days (%)Runoff Contribution of 5 Days (%)Number of Days to Reach 50% of Runoff
2012–2013323710
2013–201435535
2014–201523505
2015–2016352817
2016–201741283
Table A3. Flood event characteristics during the study period 2012–2017 in the Es Fangar Creek.
IDDatePtot
(mm)
IPmean30
(mm h−1)
IPmax30
(mm h−1)
Qdur
(h)
Q0
(m3 s−1)
Qmax
(m3 s−1)
R
(mm)
Rc
(%)
AP1d
(mm)
AP3d
(mm)
127 October 2012 20:1530.610.133.88.00.0020.1440.31.00.00.0
211 November 2012 22:2047.311.377.518.00.0081.7476.714.13.43.4
328 November 2012 08:0015.56.218.617.50.0300.0941.06.79.79.7
424 January 2013 09:0021.35.724.612.70.0110.0360.31.60.015.3
524 January 2013 22:305.06.713.815.70.0210.0830.713.921.336.6
628 January 2013 03:3016.84.57.844.50.0120.0641.26.91.732.5
728 February 2013 08:0032.13.916.421.20.0170.4274.514.04.611.0
801 March 2013 21:008.75.014.68.00.0350.0770.00.532.240.6
913 March 2013 14:1560.68.724.012.80.0141.61012.821.10.00.0
1014 March 2013 20:306.68.813.217.60.0380.1561.623.560.860.8
1105 April 2013 22:3038.54.111.048.50.0070.0591.43.60.00.0
1228 April 2013 21:0024.6NDND46.50.0110.3473.012.322.123.0
1319 November 2013 02:1599.35.343.064.70.0021.41422.522.77.075.5
1422 November 2013 09:308.8NDND24.70.0440.0931.618.21.31.3
1527 November 2013 18:4514.03.19.339.50.0280.1152.618.69.215.3
1629 November 2013 10:3010.3NDND25.50.0460.1552.423.33.628.8
1730 November 2013 18:4539.52.36.646.30.0541.10511.328.710.340.2
1804 April 2014 03:1549.82.66.644.70.0021.0067.815.63.88.0
1925 April 2014 06:4528.66.414.415.50.0000.1800.82.95.013.4
2029 September 2014 13:4548.616.256.414.00.0012.3564.28.711.813.9
2104 December 2014 22:4527.24.512.444.30.0160.1972.17.99.469.2
2228 December 2014 10:4536.05.110.839.30.0080.1832.57.02.22.2
2320 January 2015 13:0081.02.712.450.00.0102.09417.321.49.09.0
2403 February 2015 09:4522.61.49.67.50.0190.0580.31.50.421.6
2504 February 2015 11:1573.61.35.265.50.0502.45339.253.222.635.8
2621 February 2015 22:1530.61.66.824.80.0220.8835.919.30.00.0
2724 February 2015 00:4520.42.710.818.20.0310.0771.04.70.030.6
2827 February 2015 13:0020.43.19.231.80.0260.1642.110.35.411.8
2914 March 2015 18:0021.63.910.416.70.0150.3511.78.10.00.0
3022 March 2015 02:456.24.111.28.70.0200.0560.35.31.411.6
3124 March 2015 23:1575.61.87.242.80.0330.92413.918.40.07.6
3204 September 2015 03:0032.41.719.611.00.0040.7831.13.30.62.6
3330 September 2015 08:1534.02.45.69.70.0010.1320.72.08.013.0
3430 September 2015 18:1527.22.013.216.80.0370.2071.34.936.247.0
3501 April 2016 16:0078.82.714.043.50.0160.2222.43.00.00.0
3607 May 2016 11:1541.82.76.413.50.0060.0920.51.21.61.6
3719 December 2016 02:3046.42.37.627.20.0120.3944.49.52.016.6
3820 December 2016 09:00115.86.321.616.00.0542.43423.520.324.449.2
3921 December 2016 04:3061.44.99.633.70.6261.56517.628.6116.0164.6
4020 January 2017 07:5028.01.86.813.00.0130.1801.45.04.09.8
4120 January 2017 17:4514.61.77.610.70.0821.6875.940.228.437.2
4221 January 2017 07:0044.22.67.619.20.2303.94228.965.435.450.6
4322 January 2017 04:005.21.04.05.70.3601.4654.280.835.450.6
4422 January 2017 16:0012.20.84.09.00.2430.4612.923.844.496.2
4523 January 2017 20:5229.02.14.825.00.1500.3554.816.520.287.2
4625 January 2017 11:455.41.24.831.30.0360.2350.35.40.051.6
4727 January 2017 17:0023.02.911.655.00.0270.3065.624.50.05.6
488 February 2017 06:3047.42.98.841.50.0130.8435.611.80.012.8
495 June 2017 10:4567.63.021.65.70.0280.3300.40.72.62.6
Min5.00.84.05.70.0000.0360.00.50.00.0
Max115.816.277.565.50.6263.94239.280.8116.0164.6
Median29.02.910.819.20.00.32.411.84.013.9
SD25.53.013.816.40.1080.8578.316.220.631.6
Table A4. Main characteristics of the selected events for non-linearity analysis in Es Fangar Creek.
IDFlood EventPtot
(mm)
IPmax30
(mm h−1)
R
(mm)
Rc
(%)
Qmax
(m3 s−1)
Q0
(m3 s−1)
AP1d
(mm)
4221 January 2017 07:0044.27.628.9653.9420.22935.4
1804 April 2014 03:1549.86.67.8161.0060.0023.8
211 November 2012 22:1547.377.56.7141.7470.0083.4
4808 February 2017 06:3047.48.85.6120.8430.0120.0
3719 December 2016 02:3046.47.64.490.3940.0122.0
2029 September 2014 13:4548.656.44.292.3560.01511.8
3607 May 2016 11:1541.86.40.510.0920.0061.6
Table A5. Main characteristics of the highest runoff event contribution in Es Fangar Creek during the study period 2012–2017.
IDFlood EventPtot
(mm)
IPmax30
(mm h−1)
R
(mm)
Rc
(%)
Qmax
(m3 s−1)
Q0
(m3 s−1)
AP1d
(mm)
2504 February 2015 11:1573.65.239.2532.4530.04622.6
4221 January 2017 07:0044.27.628.9653.9420.22935.4
3820 December 2016 09:00115.821.623.5202.4340.05424.4
1319 November 2013 02:1599.343.022.5231.4140.0217.0
3921 December 2016 04:3061.49.617.6291.5650.626116.0
2320 January 2015 13:0081.012.417.3212.0940.0109.0
Figure A1. Land uses (%) for the 10 of 12 small Mediterranean-climate catchments selected for the rainfall-runoff relationship analysis. Guadalperalón and Parapuños catchments have not detailed land uses information.
Water 12 00299 g0a1
Figure A2. Relationship between (a) R and Rc coefficient, (b) rainfall and Rc, (c) IPmax30 intensity and Rc and (d) base-flow specific discharge and Rc at Es Fangar Creek. Dotted lines show significant (p < 0.01) fits with a power function.
Water 12 00299 g0a2
Figure A3. Highest R event contribution during the study period (2012–17) at Es Fangar Creek. The numbers located at the peak of each hydrograph indicate the ID of the events recorded in Es Fangar Creek during the study period 2012–2017, further exposed in Table A3.
Water 12 00299 g0a3

References

  1. Chiu, M.-C.; Leigh, C.; Mazor, R.; Cid, N.; Resh, V. Anthropogenic Threats to Intermittent Rivers and Ephemeral Streams. In Intermittent Rivers and Ephemeral Streams: Ecology and Management; Academic Press: Cambridge, MA, USA, 2017; pp. 433–454. ISBN 978-0-12-803904-5. [Google Scholar]
  2. Borg Galea, A.; Sadler, J.P.; Hannah, D.M.; Datry, T.; Dugdale, S.J. Mediterranean Intermittent Rivers and Ephemeral Streams: Challenges in monitoring complexity. Ecohydrology 2019, 12. [Google Scholar] [CrossRef]
  3. Kottek, M.; Grieser, J.; Beck, C.; Rudolf, B.; Rubel, F. World Map of the Köppen-Geiger climate classification updated. Meteorol. Z. 2006, 15, 259–263. [Google Scholar] [CrossRef]
  4. Datry, T.; Bonada, N.; Boulton, A. General Introduction. In Intermittent Rivers and Ephemeral Streams: Ecology and Management; Academic Press: Cambridge, MA, USA, 2017; pp. 1–597. ISBN 978-0-12-803904-5. Available online: https://www.elsevier.com/books/intermittent-rivers-and-ephemeral-streams/datry/978-0-12-803835-2 (accessed on 18 January 2020).
  5. Oueslati, O.; De Girolamo, A.M.; Abouabdillah, A.; Kjeldsen, T.R.; Lo Porto, A. Classifying the flow regimes of Mediterranean streams using multivariate analysis. Hydrol. Process. 2015, 29, 4666–4682. [Google Scholar] [CrossRef]
  6. Costigan, K.H.; Kennard, M.J.; Leigh, C.; Sauquet, E.; Boulton, A.J. Flow Regimes in Intermittent Rivers and Ephemeral Streams. Intermittent Rivers Ephemer Streams. 2017, pp. 51–78. Available online: https://www.elsevier.com/books/intermittent-rivers-and-ephemeral-streams/datry/978-0-12-803835-2 (accessed on 18 January 2020).
  7. De Girolamo, A.M.; Lo Porto, A.; Pappagallo, G.; Tzoraki, O.; Gallart, F. The Hydrological Status Concept: Application at a Temporary River (Candelaro, Italy). River Res. Appl. 2015, 31, 892–903. [Google Scholar] [CrossRef]
  8. Latron, J.; Soler, M.; Llorens, P.; Gallart, F. Spatial and temporal variability of the hydrological response in a small Mediterranean research catchment (Vallcebre, Eastern Pyrenees). Hydrol. Process. 2008, 22, 775–787. [Google Scholar] [CrossRef]
  9. Ceballos, A.; Schnabel, S. Hydrological behaviour of a small catchment in the dehesa landuse system (Extremadura, SW Spain). J. Hydrol. 1998, 210, 146–160. [Google Scholar] [CrossRef]
  10. Lana-Renault, N. Respuesta Hidrológica y Sedimentológica en una Cuenca de Montaña Media Afectada por Cambios de Cubierta Vegetal: La Cuenca Experimental de Arnás. Pirineo Central, Universidad de Zaragoza. 2007. Available online: https://dialnet.unirioja.es/servlet/tesis?codigo=113822 (accessed on 21 April 2019).
  11. López-Tarazón, J.; Batalla, R.J.; Vericat, D.; Balasch, J.C. Rainfall, runoff and sediment transport relations in a mesoscale mountainous catchment: The River Isábena (Ebro basin). Catena 2010, 82, 23–34. [Google Scholar] [CrossRef]
  12. Lana-Renault, N.; Latron, J.; Regüés, D. Streamflow response and water-table dynamics in a sub-Mediterranean research catchment (Central Pyrenees). J. Hydrol. 2007, 347, 497–507. [Google Scholar] [CrossRef]
  13. Manus, C.; Anquetin, S.; Braud, I.; Vandervaere, J.-P.; Creutin, J.-D.; Viallet, P.; Gaume, E. Hydrology and Earth System Sciences A modeling approach to assess the hydrological response of small mediterranean catchments to the variability of soil characteristics in a context of extreme events. Hydrol. Earth Syst. Sci. 2009, 13, 79–97. [Google Scholar] [CrossRef] [Green Version]
  14. Efstratiadis, A.; Koussis, A.D.; Koutsoyiannis, D.; Mamassis, N. Flood design recipes vs. reality: Can predictions for ungauged basins be trusted? Hazards Earth Syst. Sci 2014, 14, 1417–1428. [Google Scholar] [CrossRef] [Green Version]
  15. Estrany, J.; Garcia, C.; Batalla, R.J. Hydrological response of a small mediterranean agricultural catchment. J. Hydrol. 2010, 380, 180–190. [Google Scholar] [CrossRef]
  16. Huza, J.; Teuling, A.J.; Braud, I.; Grazioli, J.; Melsen, L.A.; Nord, G.; Raupach, T.H.; Uijlenhoet, R. Precipitation, soil moisture and runoff variability in a small river catchment (Ardèche, France) during HyMeX Special Observation Period 1. J. Hydrol. 2014, 516, 330–342. [Google Scholar] [CrossRef] [Green Version]
  17. Zoccatelli, D.; Marra, F.; Armon, M.; Rinat, Y.; Smith, J.A.; Morin, E. Contrasting rainfall-runoff characteristics of floods in desert and Mediterranean basins. Hydrol. Earth Syst. Sci. 2019, 23, 2665–2678. [Google Scholar] [CrossRef] [Green Version]
  18. Latron, J.; Gallart, F. Seasonal dynamics of runoff-contributing areas in a small mediterranean research catchment (Vallcebre, Eastern Pyrenees). J. Hydrol. 2007, 335, 194–206. [Google Scholar] [CrossRef]
  19. Lexartza-Artza, I.; Wainwright, J. Hydrological connectivity: Linking concepts with practical implications. Catena 2009, 79, 146–152. [Google Scholar] [CrossRef]
  20. McGlynn, B.L.; McDonnell, J.J. Role of discrete landscape units in controlling catchment dissolved organic carbon dynamics. Water Resour. Res. 2003, 39, 1090. [Google Scholar] [CrossRef] [Green Version]
  21. Buttle, J.M.; McDonald, D.J. Coupled vertical and lateral preferential flow on a forested slope. Water Resour. Res. 2002, 38, 18-1–18-16. [Google Scholar] [CrossRef]
  22. Tetzlaff, D.; Soulsby, C.; Waldron, S.; Malcolm, I.A.; Bacon, P.J.; Dunn, S.M.; Lilly, A.; Youngson, A.F. Conceptualization of runoff processes using a geographical information system and tracers in a nested mesoscale catchment. Hydrol. Process. 2007, 21, 1289–1307. [Google Scholar] [CrossRef]
  23. Emanuel, R.E.; Hazen, A.G.; Mcglynn, B.L.; Jencso, K.G. Vegetation and topographic influences on the connectivity of shallow groundwater between hillslopes and streams. Ecohydrology 2014, 7, 887–895. [Google Scholar] [CrossRef]
  24. Boulton, A.J.; Rolls, R.J.; Jaeger, K.L. Hydrological Connectivity in Intermittent Rivers and Ephemeral Streams. In Intermittent Rivers Ephemer Streams; Academic Press: Cambridge, MA, USA, 2017; pp. 79–108. Available online: https://www.sciencedirect.com/science/article/pii/B9780128038352000048 (accessed on 18 January 2020).
  25. Penna, D.; Tromp-Van Meerveld, H.J.; Gobbi, A.; Borga, M.; Dalla Fontana, G. The influence of soil moisture on threshold runoff generation processes in an alpine headwater catchment. Hydrol. Earth Syst. Sci. 2011, 15, 689–702. [Google Scholar] [CrossRef] [Green Version]
  26. Tromp-Van Meerveld, H.J.; McDonnell, J.J. Threshold relations in subsurface stormflow: 1. A 147-storm analysis of the Panola hillslope. Water Resour. Res. 2006, 42, W02410. [Google Scholar] [CrossRef] [Green Version]
  27. Saffarpour, S.; Western, A.W.; Adams, R.; Mcdonnell, J.J. Multiple runoff processes and multiple thresholds control agricultural runoff generation. Hydrol. Earth Syst. Sci 2016, 20, 4525–4545. [Google Scholar] [CrossRef] [Green Version]
  28. Woodward, J. (Ed.) The Physical Geography of the Mediterranean; Oxford University Press: New York, NY, USA, 2009; ISBN 978-0-19-926803-0. [Google Scholar]
  29. Coustau, M.; Bouvier, C.; Borrell-Estupina, V.; Jourde, H. Natural Hazards and Earth System Sciences Flood modelling with a distributed event-based parsimonious rainfall-runoff model: Case of the karstic Lez river catchment. Hazards Earth Syst. Sci 2012, 12, 1119–1133. [Google Scholar] [CrossRef]
  30. Koutroulis, A.G.; Tsanis, I.K.; Daliakopoulos, I.N.; Jacob, D. Impact of climate change on water resources status: A case study for Crete Island, Greece. J. Hydrol. 2013, 479, 146–158. [Google Scholar] [CrossRef] [Green Version]
  31. Nikolaidis, N.P.; Demetropoulou, L.; Froebrich, J.; Jacobs, C.; Gallart, F.; Prat, N.; Porto, A.L.; Campana, C.; Papadoulakis, V.; Skoulikidis, N.; et al. Towards sustainable management of Mediterranean river basins: Policy recommendations on management aspects of temporary streams. Water Policy 2013, 15, 830–849. [Google Scholar] [CrossRef]
  32. Calvo-Cases, A.; Boix-Fayos, C.; Imeson, A. Runoff generation, sediment movement and soil water behaviour on calcareous (limestone) slopes of some Mediterranean environments in southeast Spain. Geomorphology 2003, 50, 269–291. [Google Scholar] [CrossRef]
  33. Cantón, Y.; Solé-Benet, A.; De Vente, J.; Boix-Fayos, C.; Calvo-Cases, A.; Asensio, C.; Puigdefábregas, J. A review of runoff generation and soil erosion across scales in semiarid south-eastern Spain. J. Arid Environ. 2011, 75, 1254–1261. [Google Scholar] [CrossRef]
  34. Nadal-Romero, E. Las áreas de Cárcavas (badlands) Como Fuente de Sedimento en Cuencas de Montaña: Procesos de Meteorización, Erosión y Transporte en Margas del Pirineo Central, Universidad de Zaragoza. 2007. Available online: https://dialnet.unirioja.es/servlet/tesis?codigo=206095 (accessed on 22 April 2019).
  35. Lewis, D.; Singer, M.; Dahlgren, R.; Tate, K. Hydrology in a California oak woodland watershed: A 17-year study. J. Hydrol. 2000, 240, 106–117. [Google Scholar] [CrossRef]
  36. Didon-Lescot, J.-F.; Guillet, B.; Lelong, F. Effect of the clearfelling on the water quality: Example of a spruce forest on a small catchment in France. Acta Geológica Hispánica 1993, 28, 45–53. [Google Scholar]
  37. Zuazo, D.V.; Pleguezuelo, C. Soil-erosion and runoff prevention by plant covers. A review. Agron. Sustain. Dev. 2008, 28, 65–86. [Google Scholar] [CrossRef] [Green Version]
  38. Buendia, C.; Batalla, R.J.; Sabater, S.; Palau, A.; Marcé, R. Runoff Trends Driven by Climate and Afforestation in a Pyrenean Basin. Land Degrad. Dev. 2016, 27, 823–838. [Google Scholar] [CrossRef] [Green Version]
  39. Caloiero, T.; Biondo, C.; Callegari, G.; Collalti, A.; Froio, R.; Maesano, M.; Matteucci, G.; Pellicone, G.; Veltri, A. Results of a long-term study on an experimental watershed in southern Italy. Forum Geogr. 2016, 15, 55–65. [Google Scholar] [CrossRef]
  40. Nadal-Romero, E.; Cammeraat, E.; Serrano-Muela, M.P.; Lana-Renault, N.; Regüés, D. Hydrological response of an afforested catchment in a Mediterranean humid mountain area: A comparative study with a natural forest. Hydrol. Process. 2016, 30, 2717–2733. [Google Scholar] [CrossRef]
  41. Tarolli, P.; Preti, F.; Romano, N. Terraced landscapes: From an old best practice to a potential hazard for soil degradation due to land abandonment. Anthropocene 2014, 6, 10–25. [Google Scholar] [CrossRef]
  42. Lesschen, J.P.; Cammeraat, L.H.; Nieman, T. Erosion and terrace failure due to agricultural land abandonment in a semi-arid environment. Earth Surf. Process. Landforms 2008, 33, 1574–1584. [Google Scholar] [CrossRef]
  43. Arnáez, J.; Lana-Renault, N.; Lasanta, T.; Ruiz-Flaño, P.; Castroviejo, J. Effects of farming terraces on hydrological and geomorphological processes. A review. Catena 2015, 128, 122–134. [Google Scholar] [CrossRef] [Green Version]
  44. Beven, K. Rainfall-Runoff Modelling The Primer, 2nd ed.; Wiley: Chichester, UK, 2012; ISBN 978-0-47-071459-1. [Google Scholar]
  45. Klemeš, V. Dilettantism in hydrology: Transition or destiny? Water Resour. Res. 1986, 22, 177S–188S. [Google Scholar] [CrossRef]
  46. Merheb, M.; Moussa, R.; Abdallah, C.; Colin, F.; Perrin, C.; Baghdadi, N. Hydrological response characteristics of Mediterranean catchments at different time scales: A meta-analysis. Hydrol. Sci. J. 2016, 61, 2520–2539. [Google Scholar] [CrossRef] [Green Version]
  47. Latron, J. Estudio del Funcionamiento Hidrológico de una Cuenca Mediterránea de Montaña (Vallcebre, Pirineos Catalanes), Universitat de Barcelona. 2003. Available online: https://dialnet.unirioja.es/servlet/tesis?codigo=235272 (accessed on 18 April 2019).
  48. Fick, S.E.; Hijmans, R.J. WorldClim 2: New 1-km spatial resolution climate surfaces for global land areas. Int. J. Climatol. 2017, 37, 4302–4315. [Google Scholar] [CrossRef]
  49. Guijarro, J.A. Contribución a la Bioclimatología de Baleares, Universitat de les Illes Balears. 1986. Available online: https://dialnet.unirioja.es/servlet/libro?codigo=613782 (accessed on 14 March 2019).
  50. YACU Estudio de Caracterización del régimen Extremo de Precipitaciones en la Isla de Mallorca, Junta D’Aigües de Les Illes Balears: Palma de Mallorca. 2003. Available online: http://observatoriaigua.uib.es/repositori/tp_precipitacion_2002.pdf (accessed on 18 April 2019).
  51. Hargreaves, G.H.; Samani, Z.A. Reference Crop Evapotranspiration from Temperature. Appl. Eng. Agric. 1985, 1, 96–99. [Google Scholar] [CrossRef]
  52. Maidment, D.R. Handbook of Hydrology, 1st ed.; McGraw-Hill: New York NY, USA, 1993; ISBN 0070397325. Available online: https://www.abebooks.com/9780070397323/Handbook-Hydrology-Maidment-David-0070397325/plp (accessed on 16 March 2019).
  53. Gallart, F.; Amaxidis, Y.; Botti, P.; Canè, G.; Castillo, V.; Chapman, P.; Froebrich, J.; García-Pintado, J.; Latron, J.; Llorens, R.; et al. Investigating hydrological regimes and processes in a set of catchments with temporary waters in Mediterranean Europe. Hydrol. Sci. J. 2008, 53, 618–628. [Google Scholar] [CrossRef]
  54. Swarowsky, A.; Dahlgren, R.A.; Tate, K.W.; Hopmans, J.W.; O’Geen, A.T. Catchment-Scale Soil Water Dynamics in a Mediterranean-Type Oak Woodland. Vadose Zone J. 2011, 10, 800. [Google Scholar] [CrossRef] [Green Version]
  55. Calsamiglia, A.; Fortesa, J.; Garcia-Comendador, J.; Estrany, J. Respuesta hidro-sedimentaria en dos cuencas mediterráneas representativas afectadas por el cambio global. Cuaternario y Geomorfol. 2016, 30, 87–103. [Google Scholar] [CrossRef] [Green Version]
  56. Serrano-Muela, M.P. Influencia de la Cubierta Vegetal y las Propiedades del Suelo en la Respuesta Hidrológica: Generación de Escorrentía en una Cuenca Forestal de la Montaña Media Pirenaica, Universidad de Zaragoza. 2012. Available online: https://dialnet.unirioja.es/servlet/tesis?codigo=77003 (accessed on 15 May 2019).
  57. Gallart, F.; Llorens, P.; Latron, J.; Regüés, D. Hydrological processes and their seasonal controls in a small Mediterranean mountain catchment in the Pyrenees. Hydrol. Earth Syst. Sci. 2002, 6, 527–537. [Google Scholar] [CrossRef] [Green Version]
  58. García-Comendador, J.; Fortesa, J.; Calsamiglia, A.; Calvo-Cases, A.; Estrany, J. Post-fire hydrological response and suspended sediment transport of a terraced Mediterranean catchment. Earth Surf. Process. Landforms 2017, 42, 2254–2265. [Google Scholar] [CrossRef]
  59. Gaillard, E.; Lavabre, J.; Isbérie, C.; Normand, M. Etat hydrique d’une parcelle et écoulements dans un petit basin versant du massif cristallin des Maures. Hydrogéologie 1995, 4, 41–48. [Google Scholar]
  60. Tzoraki, O.; Nikolaidis, N.P. A generalized framework for modeling the hydrologic and biogeochemical response of a Mediterranean temporary river basin. J. Hydrol. 2007, 346, 112–121. [Google Scholar] [CrossRef]
  61. Ries, F.; Schmidt, S.; Sauter, M.; Lange, J. Controls on runoff generation along a steep climatic gradient in the Eastern Mediterranean. J. Hydrol. Reg. Stud. 2017, 9, 18–33. [Google Scholar] [CrossRef] [Green Version]
  62. Regüés, D.; Gallart, F. Seasonal patterns of runoff and erosion responses to simulated rainfall in badland area in Mediterranean mountain conditions (Vallcebre, southeastern Pyrenees). Earth Surf. Process. Landforms 2004, 29, 755–767. [Google Scholar] [CrossRef]
  63. Latron, J.; Gallart, F. Hydrological Response of Two Nested Small Mediterranean Basins Presenting Various Degradation States. Phys. Chem. Earth 1995, 20, 369–374. [Google Scholar] [CrossRef]
  64. Nadal-Romero, E.; Latron, J.; Lana-Renault, N.; Serrano-Muela, P.; Martí-Bono, C.; Regüés, D. Temporal variability in hydrological response within a small catchment with badland areas, central Pyrenees. Hydrol. Sci. J. 2008, 53, 629–639. [Google Scholar] [CrossRef]
  65. Cerdan, O.; Le Bissonnais, Y.; Govers, G.; Lecomte, V.; van Oost, K.; Couturier, A.; King, C.; Dubreuil, N. Scale effect on runoff from experimental plots to catchments in agricultural areas in Normandy. J. Hydrol. 2004, 299, 4–14. [Google Scholar] [CrossRef]
  66. García-Ruiz, J.M.; Regüés, D.; Alvera, B.; Lana-Renault, N.; Serrano-Muela, P.; Nadal-Romero, E.; Navas, A.; Latron, J.; Martí-Bono, C.; Arnáez, J. Flood generation and sediment transport in experimental catchments affected by land use changes in the central Pyrenees. J. Hydrol. 2008, 356, 245–260. [Google Scholar] [CrossRef] [Green Version]
  67. Beguería, S.; López-Moreno, J.I.; Lorente, A.; Seeger, M.; García-Ruiz, J.M. Assessing the Effect of Climate Oscillations and Land-use Changes on Streamflow in the Central Spanish Pyrenees. AMBIO A J. Hum. Environ. 2003, 32, 283–286. [Google Scholar] [CrossRef] [PubMed]
  68. Buendia, C.; Bussi, G.; Tuset, J.; Vericat, D.; Sabater, S.; Palau, A.; Batalla, R.J. Effects of afforestation on runoff and sediment load in an upland Mediterranean catchment. Sci. Total Environ. 2016, 540, 144–157. [Google Scholar] [CrossRef]
  69. Gallart, F.; Llorens, P. Water resources and environmental change in Spain. A key issue for sustainable integrated catchment management. Cuad. Investig. Geográfica 2001, 27, 7–16. [Google Scholar] [CrossRef]
  70. Jordan, J.P. Spatial and temporal variability of stormflow generation processes on a Swiss catchment. J. Hydrol. 1994, 1–4, 357–382. [Google Scholar] [CrossRef]
  71. Tuset, J.; Vericat, D.; Batalla, R.J. Rainfall, runoff and sediment transport in a Mediterranean mountainous catchment. Sci. Total Environ. 2016, 540, 114–132. [Google Scholar] [CrossRef]
  72. Dunne, T.; Black, R.D. Partial Area Contributions to Storm Runoff in a Small New England Watershed. Water Resour. Res. 1970, 6, 1296–1311. [Google Scholar] [CrossRef] [Green Version]
  73. Gallart, F.; Llorens, P.; Latron, J. Studying the role of old agricultural terraces on runoff generation in a small Mediterranean mountainous basin. J. Hydrol. 1994, 159, 291–303. [Google Scholar] [CrossRef]
  74. Schnabel, S.; Lozano Parra, J.; Gómez-Gutiérrez, A.; Alfonso-Torreño, A. Hydrological dynamics in a small catchment with silvopastoral land use in SW Spain. Cuad. Investig. Geográfica 2018, 44, 557–580. [Google Scholar] [CrossRef] [Green Version]
  75. Dahlgren, R.A.; Tate, K.W.; Lewis, D.J.; Atwill, E.R.; Harper, J.M.; Allen-Diaz, B.H. Watershed research examines rangeland management effects on water quality. Calif. Agric. 2001, 55, 64–71. [Google Scholar] [CrossRef]
  76. Licciardello, F.; Barbagallo, S.; Gallart, F. Hydrological and erosional response of a small catchment in Sicily. J. Hydrol. Hydromech 2019, 67, 201–212. [Google Scholar] [CrossRef] [Green Version]
  77. Pacheco, E.; Farguell, J.; Úbeda, X.; Outeiro, L.; Miguel, A. Runoff and sediment production in a mediterranean basin under two different land uses. Cuaternario y Geomorfol. 2011, 25, 103–114. [Google Scholar]
  78. Ben Slimane, A.; Raclot, D.; Rebai, H.; Le Bissonnais, Y.; Planchon, O.; Bouksila, F. Combining field monitoring and aerial imagery to evaluate the role of gully erosion in a Mediterranean catchment (Tunisia). CATENA 2018, 170, 73–83. [Google Scholar] [CrossRef]
  79. Roig-Planasdemunt, M.; Llorens, P.; Latron, J. Seasonal and storm flow dynamics of dissolved organic carbon in a Mediterranean mountain catchment (Vallcebre, eastern Pyrenees). Hydrol. Sci. J. 2016, 62, 1–14. [Google Scholar] [CrossRef]
  80. Cayuela, C.; Latron, J.; Geris, J.; Llorens, P. Spatio-temporal variability of the isotopic input signal in a partly forested catchment: Implications for hydrograph separation. Hydrol. Process. 2019, 33, 36–46. [Google Scholar] [CrossRef]
Figure 1. (a) Map of the small Mediterranean-climate catchments selected to assess the rainfall-runoff relationship at the annual and event scale. (b) Map of Mallorca Island, showing the location of the Sant Miquel River and Es Fangar Creek catchments. (c) Map of the Es Fangar Creek catchment, showing the different land-uses, the stream network and the gauging station. (d) Map of the Sant Miquel River catchment with the location of rainfall stations used in this study.
Water 12 00299 g001
Figure 2. Rainfall-runoff for 43 small Mediterranean-climate catchments at the annual scale. Catchments with pervious lithology are marked with a grey halo. The Es Fangar Creek value is illustrated with a black dot.
Water 12 00299 g002
Figure 3. Rainfall-runoff relationship at the event scale classified by (a) season, (b) lithology and (c) land uses at 12 small Mediterranean-climate catchments. Outliers are marked with an ellipsoid.
Water 12 00299 g003
Figure 4. Baseflow and quickflow contributions (mm) in the total flow for each hydrological year (October to September) at Es Fangar Creek. The annual Rc is depicted in %, as well as the total number of days (d) with recorded flow at the gauging station. The total annual rainfall is also illustrated in brackets.
Water 12 00299 g004
Figure 5. Monthly time series of rainfall, R, reference evapotranspiration during the study period (2012–2017) at Es Fangar Creek. Box plots show minimum, median and maximum monthly R. Blue dots show mean monthly R. Long term (1964–2017) monthly rainfall distribution is also depicted.
Water 12 00299 g005
Figure 6. Selected events for non-linearity analysis at Es Fangar Creek. Events with a total precipitation between ca. 40 and 50 mm. The numbers located at the peak of each hydrograph indicate the ID of the events recorded in Es Fangar Creek during the study period 2012–2017, further exposed in Table A3.
Water 12 00299 g006
Figure 7. Multiples relationships between rainfall and R variables at the event scale at Es Fangar Creek: (a) rainfall-antecedent discharge-runoff; (b) rainfall–antecedent discharge-Qmax relationship; (c) IPmax30-rainfall-runoff and (d) IPmax30-rainfall-Qmax. The points with an ID are depicting the selected events for the non-linearity assessment, as it can be further consulted in Figure 6 and Table A3.
Water 12 00299 g007
Table 1. Pre-event and event conditions variables to explain the rainfall-runoff relationship in the Es Fangar Creek catchment.
Pre-Event ConditionsEvent Conditions
Q0 Baseflow at the start of the flood (m3 s−1)PtotRainfall depth (mm)
AP1dAntecedent precipitation 1 day before (mm)IPmean30Average rainfall intensity (mm h−1)
IPmax30Maximum 30’ rainfall intensity (mm h−1)
QmaxMaximum peak discharge (m3 s−1)
RRunoff (mm)
RcRunoff coefficient
Table 2. Pearson correlation matrix between selected variables.
Variables Q0PtotIPmean30IPmax30QmaxRRc
Q010.030.000.080.390.280.53
Ptot 10.090.270.550.680.07
IPmean30 10.790.15−0.06−0.21
IPmax30 10.250.03−0.17
Qmax 10.820.67
R 10.62
Rc 1
Correlation significant at 0.01 level

