City Resilience towards Coastal Hazards: An Integrated Bottom-Up and Top-Down Assessment


1
Tsunami & Disaster Mitigation Research Centre (TDMRC), Graduate School of Mathematics and Applied Science, Department of Family Medicine, Faculty of Medicine, Universitas Syiah Kuala, Jl. Prof. Dr. Ibrahim Hasan, Ulee Lheue, Meuraxa, Banda Aceh 23232, Indonesia
2
Tsunami & Disaster Mitigation Research Centre (TDMRC) and Department of Civil Engineering, Faculty of Engineering, Universitas Syiah Kuala, Jl. Tgk. Syech Abdul Rauf, Darussalam, Banda Aceh 23111, Indonesia
3
Department of Chemistry, Faculty of Mathematics and Natural Sciences (FMIPA), Universitas Syiah Kuala, Jl. Tgk. Syech Abdul Rauf, Darussalam, Banda Aceh 23111, Indonesia
4
Department of Statistics, Faculty of Mathematics and Natural Sciences (FMIPA), Universitas Syiah Kuala, Jl. Tgk. Syech Abdul Rauf, Darussalam, Banda Aceh 23111, Indonesia
5
Tsunami & Disaster Mitigation Research Centre (TDMRC) and Department of Electrical and Computer Engineering, Faculty of Engineering, Universitas Syiah Kuala, Jl. Tgk. Syech Abdul Rauf, Darussalam, Banda Aceh 23111, Indonesia
*
Authors to whom correspondence should be addressed.
Water 2020, 12(10), 2823; https://doi.org/10.3390/w12102823
Submission received: 4 September 2020
/
Revised: 5 October 2020
/
Accepted: 6 October 2020
/
Published: 11 October 2020
(This article belongs to the Special Issue Assessment of Current and Future Vulnerability of Coastal Flooding)
Abstract
:Community resilience is increasingly required to adapt to the effects of the frequency and severity of the ever-increasing number of coastal hazards. This paper uses the case study of the city of Banda Aceh, Indonesia, which was devastated by the 2004 Indian Ocean Tsunami, with the aim of investigating the city’s level of resilience towards coastal hazards. This paper aims to: (i) assess the preparedness of coastal communities; (ii) evaluate the level of resilience of the city to coastal hazards; and (iii) formulate strategic steps in an effort to mitigate coastal hazards in Banda Aceh. The evaluation was conducted using mixed methods (both quantitative and qualitative) through data triangulation. Data collection involved 311 household surveys, two focus group discussions with 30 participants, and interviews with seven representatives from government and non-government organisations. Regarding the survey, the preparedness level of Banda Aceh’s residents is categorised as “low“. The results of overall city resilience assessments are also classified as “low”. This finding indicates that more planned, systematic, and sustainable efforts are needed. Hence, this study also recommends strategies to enhance resilience in dealing with coastal hazards.
1. Introduction
Over the coming decades, demographic trends are likely to confirm that more and innumerable people are living in areas that are vulnerable to disaster risk. Currently, a significant proportion of the world’s population is living in coastal regions. Regrettably, coastal areas are highly susceptible to the impacts of global climate change and the intensity of coastal hazards, such as erosion, storm surges, flooding, and tsunamis [1,2,3,4,5].
These coastal hazards significantly impair social, cultural, and natural assets and vital resources for communities living in low-lying coastal zones. Certain conditions severely impact coastal cities that do not have adequate preparation and adaptation strategies [6,7].
Responding to concerns about the consequences of increasing the frequency and severity of coastal hazards, the concept of community resilience has become increasingly advanced among academics and policymakers. Efforts to anticipate and reduce the impacts of coastal hazards are among the main focuses in the 2015–2030 Sustainable Development Goals (SDGs) and the Sendai Framework for Disaster Risk Reduction (SFDRR). One of the goals affirmed by the SDGs is to take concrete actions to tackle climate change and its impacts (Goal 13). Some of the targets include incorporating strengthening resilience and adapting to the adverse effects of natural hazards and climate change. This is done by integrating climate-related actions into development policies, strategies, and planning [8,9].
The term resilience, along with its numerous derivates, has a long and distinct history. It originally comes from physics and materials engineering and can be physically measured and calculated [10,11]. Resilience has a different meaning from resistance. Resistance is the capacity to overcome disturbances without incurring losses. Meanwhile, resilience is the capacity to recover from disruptions after a significant loss has occurred [12]. Other than that, resilience is also about seeing a better move forward following a shock event [13].
The definition of resilience that applies to society reflects the adaptive capacity of a community or system to manage disruptions from adverse events or crises. Moreover, resilience provides a community with the ability to recover from adversity and to reduce future impacts [8,9,10]. Coastal resilience is defined as the capability of a socio-economic and natural system in a coastal environment to deal with a crisis that is generated by circumstances, such as sea-level rise, extreme events, and human impacts, by adjusting to the crisis while sustaining their basic function(s) [14]. Meanwhile, the city’s resilience is the capacity of individuals, communities, and systems of a city to survive, adapt to and absorb future shocks and pressures on the social, economic, technical systems and infrastructure in the town, so that it can sustain the same function, structure, system, and identity [15,16,17].
Several studies recommend integrating local and ‘bottom-up’ resilience efforts with a top-down approach that involves various stakeholders to formulate strategies [18,19,20]. It is necessary to examine resilience levels and disseminate results effectively to enhance the transparency of the planning process and policymakers’ accountability. If developed and implemented in collaboration with different stakeholders, the resilience assessment process could also engage the community and enhance their role in the decision-making process [18,19].
Furthermore, stakeholder involvement would improve the risk communication of community members and help them to understand what resilience means to them and whatever is the current level of resilience [21,22,23,24]. Collaboration in the resilience assessment process would also lead to the formation of social networks that are considered essential to an increase in resilience. Studies on increasing bottom-up resilience revealed that adaptive capacity was strongly influenced by local social and cultural considerations [6,25,26,27]. As the concept of community resilience has emerged, recognition of the importance of developing methods and instruments for assessment has also increased. Despite the fact that more assessment methods are being used to assess coastal resilience, there is no integrative assessment tool that combines a bottom-up and top-down approach [28,29].
Hence, this study aims to conduct a bottom-up and top-down investigation of the coastal resilience using a case study of Banda Aceh City, located on the island of Sumatra, Indonesia, which was devastated by the 2004 Indian Ocean Tsunami (IOT), triggered by a magnitude (M) 9.1 earthquake [30]. This study sequentially aims to: (i) assess coastal community preparedness; (ii) evaluate the city’s resilience level towards coastal hazards; and (iii) formulate strategic measures to mitigate coastal hazards in Banda Aceh. Further, to the best of our knowledge, this study is considered to be one of the first studies of this severely affected coastal city as a result of the 2004 IOT. We combine coastal hazard issues (tsunami and coastal floods) with climate change-induced sea-level rise and this effort could represent a breakthrough in integrating disaster risk reduction issues into climate change adaptation.
2. Study Area
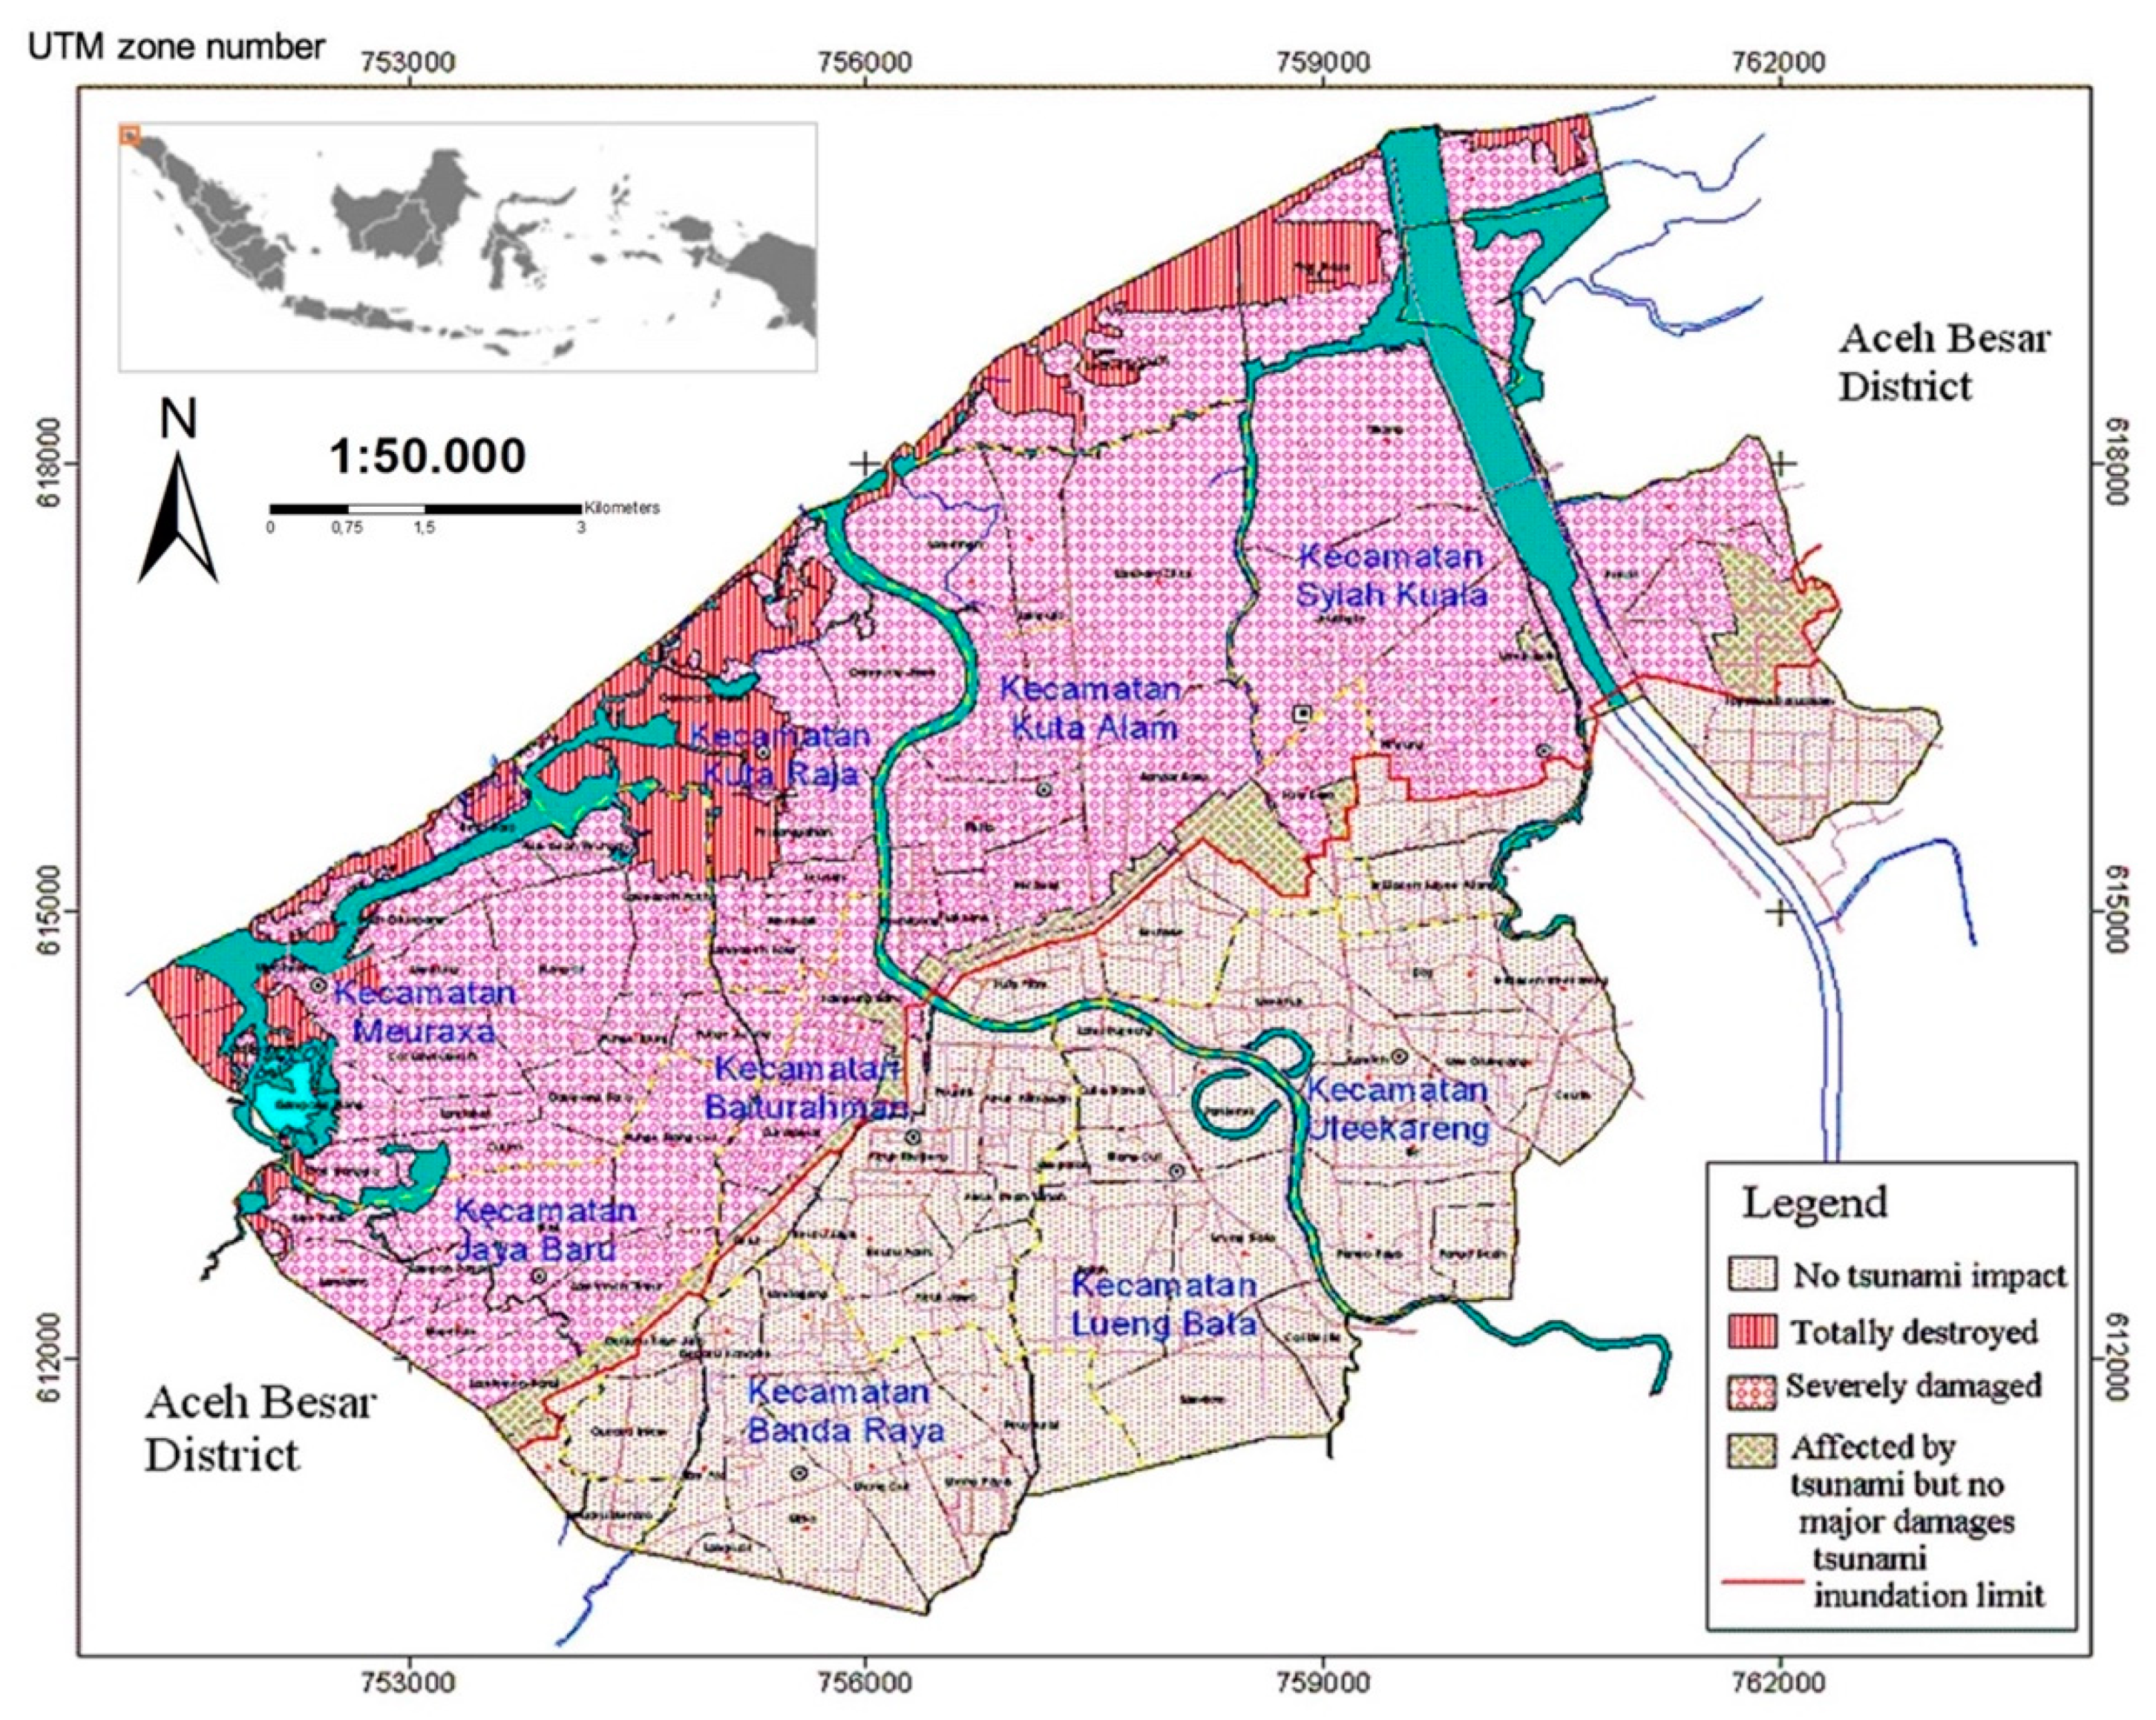
Banda Aceh was one of the severely affected city’s most during the 2004 IOT, where wave heights on the coast were about 20 m to the west and about 15 m to the east [31]. The tsunami inundation in Banda Aceh reached 3 to 4.5 km into the mainland, causing almost 50% of the city to be devastated [32].
Nonetheless, ten years after the tsunami, people resettled in the coastal areas. It is noteworthy that the history of the tsunami event is no longer a consideration of the community in choosing residence location. Communities considered housing rental prices, land prices, distance from work, and family connections as the three main reasons that drove people to select a new place to live [33].
The 2004 tsunami confirmed that Banda Aceh was vulnerable to a tsunami. The findings from other studies also noted that at least 11 tsunamis had struck the northern end of Sumatra Island, namely Banda Aceh and Aceh Besar District [34]. On this evidence, it can be inferred that the tsunami disaster will remain a severe threat to the City and surrounding areas. Based on the characteristics of the tsunami sources around the subducted Indo-Australian Plate (IAP), the estimated shortest tsunami wave arrival time is 35 minutes [35].
Banda Aceh has a relatively flat topography that is very vulnerable to the impact of rising sea levels caused by climate change. The topographic condition (altitude) of Banda Aceh ranges from −0.45 m to +1.00 m above sea level (asl), with an average height of 0.80 m asl. The shape of the land surface (physiography) is relatively flat with a slope between 2%–8%. This surface shape indicates that the rate of erosion is relatively low, but very susceptible to inundation, mostly when tides and sea waves occur, especially in the northern or coastal area’s beach. With sea-level rise being as high as 7 mm per year, within the next 100 years, 11% of the Banda Aceh City area will likely be submerged by tidal floods. A tsunami could threaten areas that are up to 4 km from the shoreline if a similar earthquake to that of December 26, 2004, occurred [36,37].
Banda Aceh consists of nine districts and 90 villages (Figure 1). Four Subdistricts are directly adjacent to the shoreline, namely Meuraxa, Kutaraja, Kuta Alam, and Syiah Kuala. Regarding the event of the IOT on 26 December 2004, these four districts were also the most severely affected areas, together with five other Subdistricts, namely, Jaya Baru, Baiturrahman, Lueng Bata, Ulee Kareng, and Banda Raya.
Banda Aceh is one of the coastal cities in Aceh Province, Indonesia, with a moderate demographic size. At the end of 2018, Banda Aceh had a population of 265,111, with a density of 4321 people/km2. The highest population is in Kuta Alam Subdistrict, which is 52,645 people, whereas the highest population density is in Baiturrahman Subdistrict, with 8250 people/km2. Compared to the population in 2017, amounting to 259,913 people, the growth rate of the residents of Banda Aceh is 2%. This percentage is higher than the average population growth rate in Aceh Province in 2018 at 1.77% [38,39].
3. Methodology
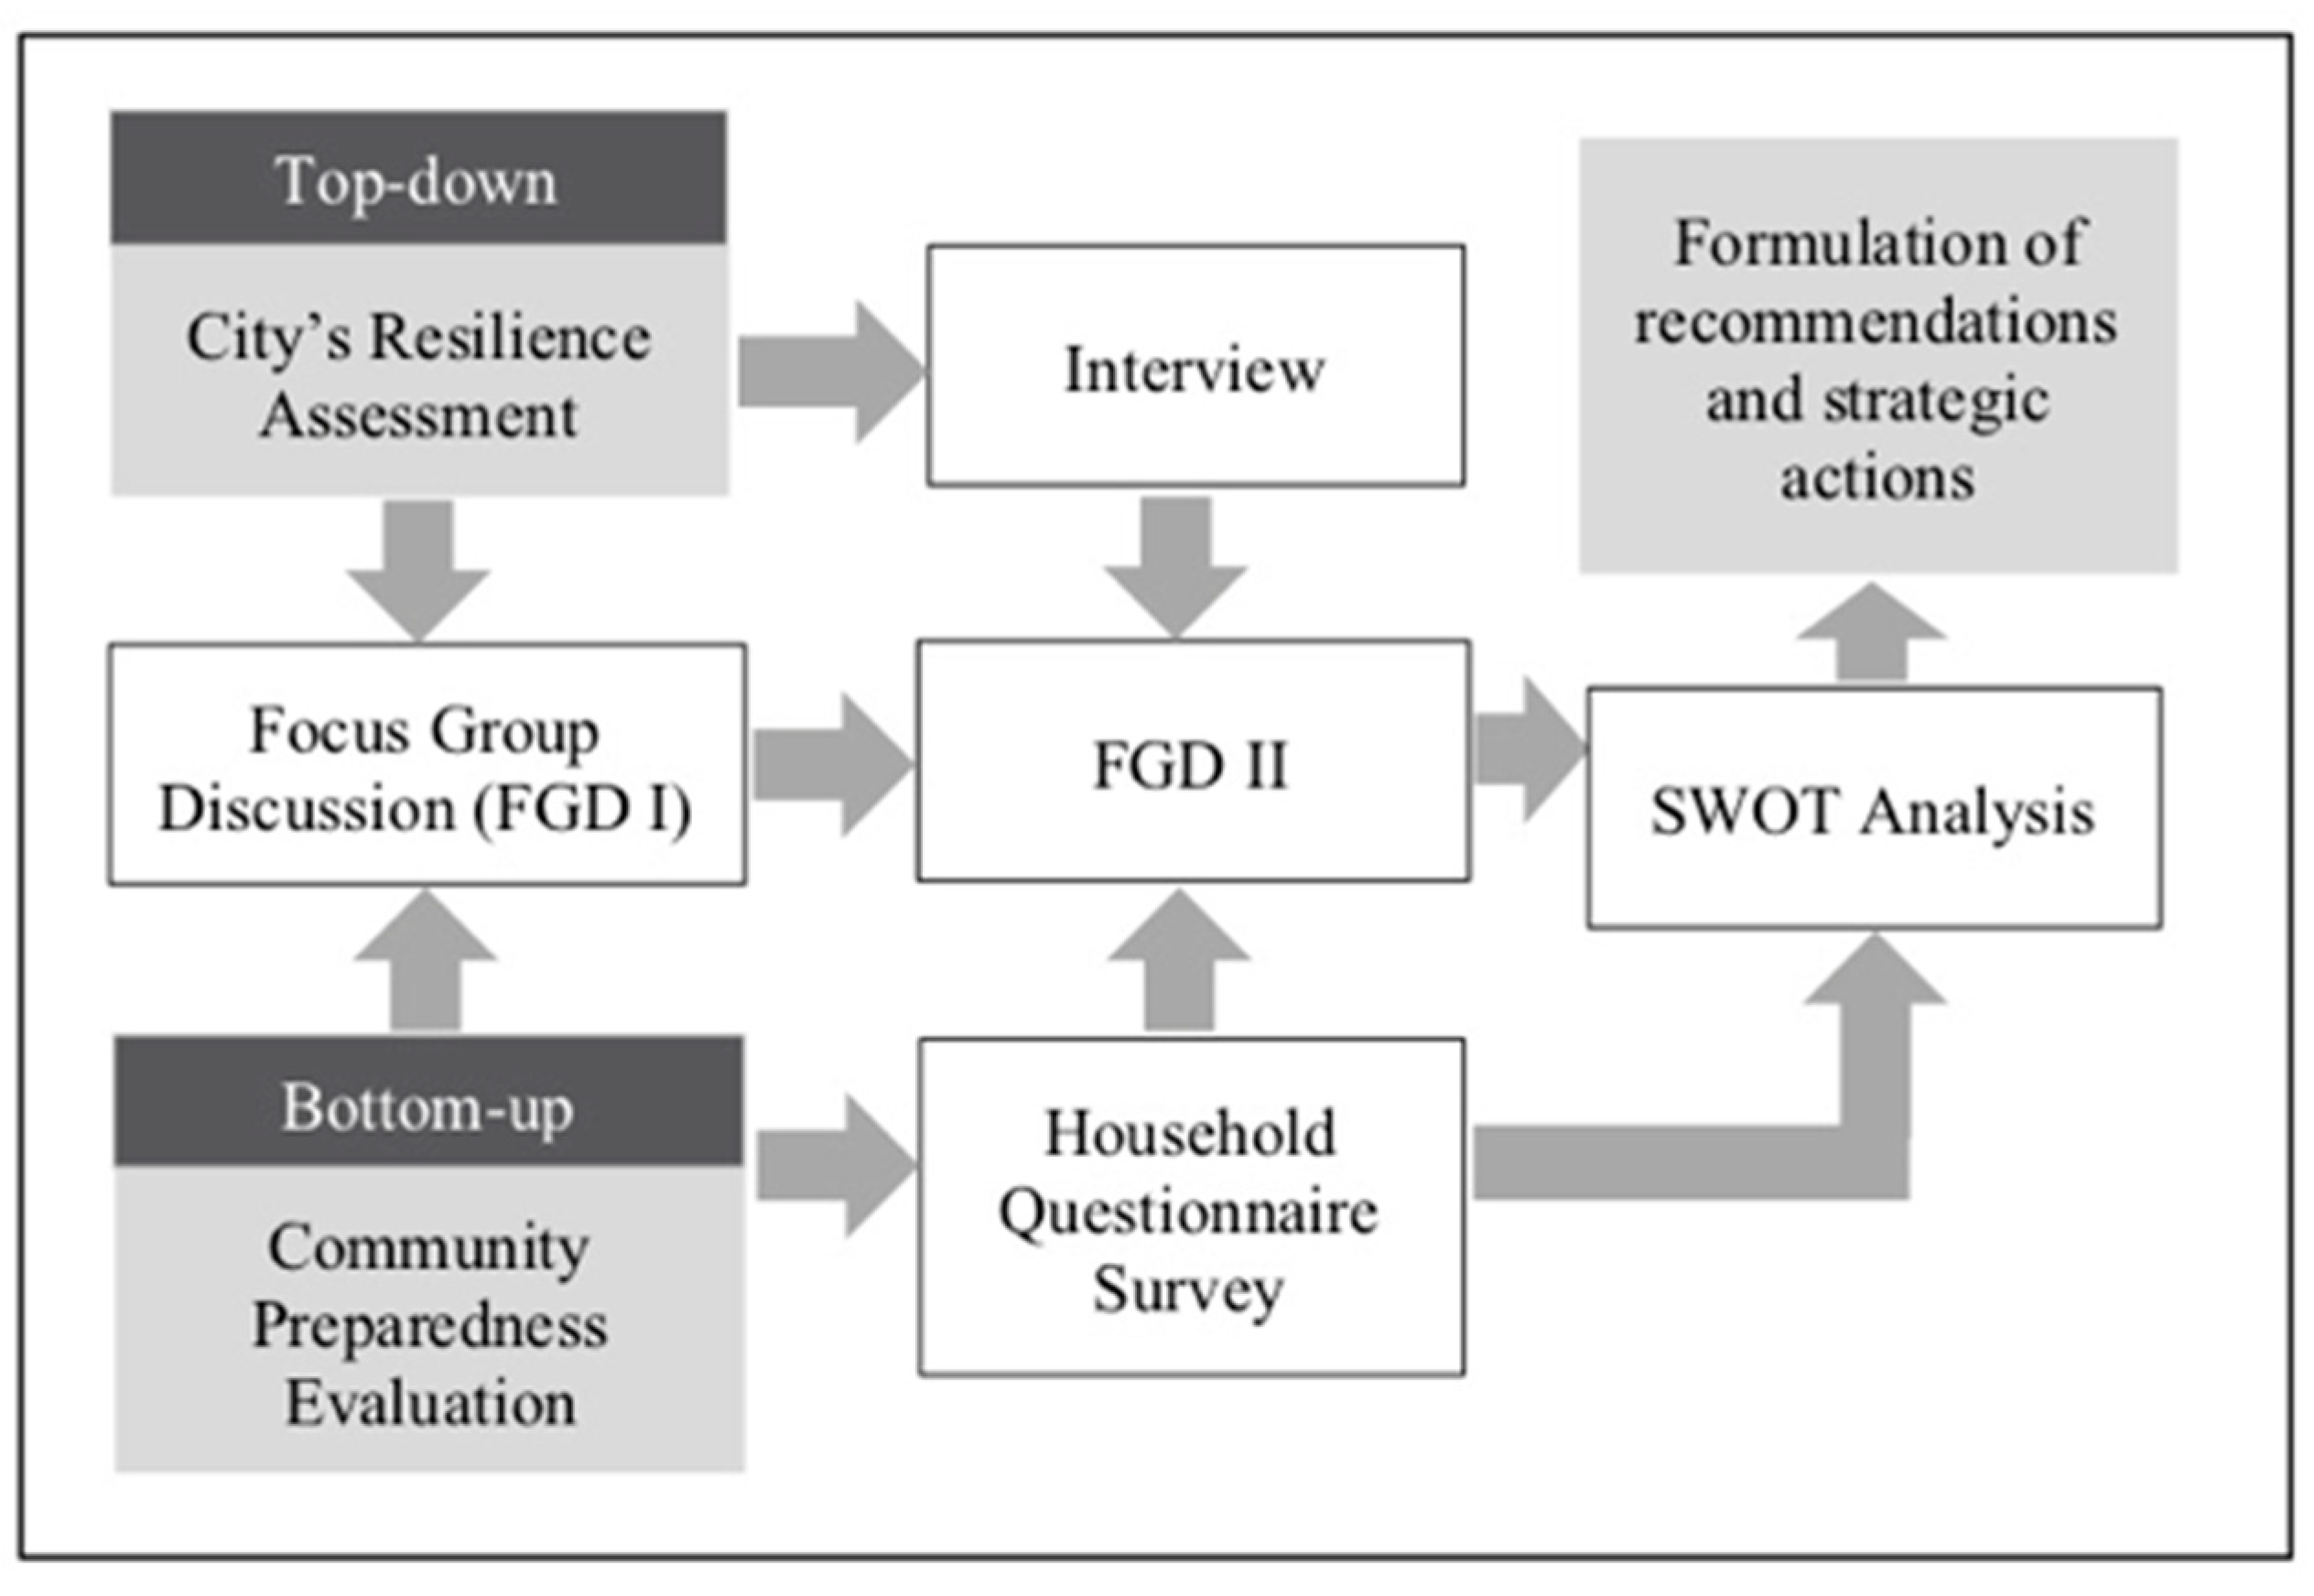
To address the research objectives, this study was conducted in three stages, namely: (i) evaluation of coastal community preparedness, (ii) assessment of the level of the city’s resilience to coastal hazards, and (iii) formulation of recommendations and strategic actions to enhance the city’s resilience toward coastal hazards.
The city’s resilience study was carried out using a quantitative and qualitative (mixed-method) approach through the triangulation of data/source. The data triangulation technique involves comparing and checking the degree of trust in the information obtained over different times (months) and using different tools. The expected result of the comparison is in the form of similarities or reasons for differences [40]. Data collection was carried out through several measures, including household survey, focus group discussion (FGD), and interviews. The flowchart methodology of this study is shown in Figure 2.
Oktari et al. (2020) had previously developed the instrument that is used to study city resilience [41]. This instrument consists of five resilience parameters (4 variables, 16 indicators each), including (i) institutional/governance, (ii) social and economic, (iii) coastal resource management, (iv) land use management and infrastructure, and (v) adaptation and mitigation strategies.
Rating indicators were scored into: (i) 0 (no information); (ii) 1 (no known plans/strategy/process); (iii) 2 (there is a plan/strategy/process in existence but it has a known weakness); (iv) 3 (there is a plan/strategy/process in place and it is effective) and (v) 4 (there is a plan/strategy/process in place and it is sustained).
Analysis of the calculation of the score of each parameter was performed using the Formula (1):
The resilience score was calculated using the Equation (2):
The resilience scores ranged between 0 and 4, and were divided into three categories: (i) Low (<3) resilience; (ii) Medium (3–4) resilience; and (iii) High (>4) resilience.
Some of the details that are needed to complete the city’s resilience assessment were obtained from the results of the community preparedness survey. The parameters used to assess the preparedness of coastal communities were adopted from a framework developed by LIPI-UNESCO [42]. The latter has developed appropriate indicators and key questions to determine community preparedness in facing the impacts of rising sea levels due to climate change and other coastal hazards. Data collection techniques were carried out using questionnaires and interviews.
In this study, the respondents were individuals who represent households. Data were collected in four (4) sub-districts in Banda Aceh, namely Syiah Kuala, Kuta Raja, Kuta Alam, and Meuraxa. A total of 311 respondents were selected with a purposive random sampling technique, whereby the chosen respondents were located in coastal areas.
The results of the questionnaire were analysed using an index to measure the level of community preparedness in dealing with coastal hazards. The questions in this parameter are assumed to have the same value, that is, if the correct answer is worth “1” and the answer is wrong or answer “don’t know” is worth “0”. The index value calculation uses the following Formula (3):
The index value is in the range of 0–100. The higher the index value, the greater the level of preparedness. Index values are divided into the following categories: (i) Very high (80.00–100); (ii) High (60.00–79.99); (iii) Moderate (40.00–59.99); (iv) Low (39.99–20); and (v) Very low (0–19.99).
The first FGD was held on 14 September 2018. The FGD aimed to conduct an initial assessment of the city resilience of Banda Aceh towards coastal hazards. The FGD participants consisted of 30 people who were experts and practitioners in the field of climate change and disasters, both from the local and national levels, which included elements of government, non-government, and academics. The second FGD was carried out on October 9, 2019 and was intended to further investigate the city resilience of Banda Aceh towards coastal hazards. This FGD also facilitated the Strengths Weakness Opportunities Threats (SWOT) analysis to identify recommendations and strategic measures with which to advance the city’s resilience toward coastal hazards.
Interviews were conducted with seven people who represented government agencies and Non-Governmental Organisations (NGOs) to compare or check the results of the FGDs that had been undertaken and to obtain more in-depth information. Interviews were conducted from December 2018 to March 2019.
4. Results
4.1. Coastal Community Preparedness in Banda Aceh
A total of 311 respondents representing households in the four sub-districts in Banda Aceh were approached and interviewed. The demographic characteristics of the respondents are presented in Table 1.
Most of the respondents were 30–39 years old (35.37%), and the majority (67.52%) were women. Around 42.44% of the respondents had graduated from high school, and almost half (45.98%) of the respondents were employees. As many as 46.30% of the respondents’ houses were less than 500 m from the shoreline. The majority of respondents were direct cash transfer recipients (82.96%) and owned welfare cards for low-income families (91.00%), while the percentage of respondents who received the rice-for-poor scheme was 36.66%.
The results of the coastal community preparedness study are reported based on four (4) parameters, namely: (1) knowledge of coastal hazards, (2) emergency response plans, (3) early warning, and (4) resource mobilisation.
4.1.1. Knowledge of Coastal Hazards
Knowledge of coastal hazards was measured by several indicators, namely, the impact of sea-level rise, tidal flood characteristics, and signs of a tsunami. Some tsunami signs include an earthquake that makes it difficult to stand, seawater receded suddenly, powerful and unusual noises from the sea (like explosions), and giant waves on the horizon. Individuals or households who have a good level of knowledge are assumed to be better prepared to take anticipatory efforts to deal with coastal hazards that might occur, because knowledge is the foundation of awareness to perform emergency response plans, early warning, and the mobilising of resources.
From the analysis of the questionnaire, the respondents’ knowledge of coastal hazards is still lacking. Some respondents (40–50%) were aware that rising sea levels have an impact on the occurrence of floods and submerged coastal areas. Further, a few (<50%) respondents thought that rising sea levels also generated a clean (potable) water crisis, infrastructure damaged, decreased fishery production, and lost tourism attractiveness.
The results of the study also showed that there was still a misconception of knowledge about tsunami signs. The majority of respondents thought that the signs of a tsunami, including that triggered by a powerful earthquake, mean that people could not stand up on their feet, and that they would be followed (entrapped) by the receding seawater. Every tsunami event is not necessarily preceded by strong earthquakes and receding seawater, and examples of this are: Pangandaran Tsunami on 17 July 2006, Mentawai on 26 October 2010, and the Palu-Donggala 2018. Further, unlike most of the tsunamis that have occurred in Indonesia, the 2018 Sunda Strait Tsunami was not generated by an earthquake [43,44,45,46].
Knowledge dissemination is inseparable from the role of media that would broadcast information to the public. Based on the results of the present study, the common sources of the respondents’ knowledge were from relatives, friends, and neighbours (82, 90%), and TV (79, 03%).
Despite the fact that the coastal area of Banda Aceh was the most severely affected in the 2004 tsunami, it turns out there are still some people who claim to have received little information about the tsunami. As for the rising sea levels, the majority of respondents claimed not to have been exposed to adequate information about this hazard. This situation occurs because the community has not felt the impact directly, given the rising sea levels, causing a negative impact at a slow pace and over a long period of time, but with a high degree of certainty.
4.1.2. Emergency Response Plan
Emergency response plans are an important component that need to be equipped in the context of community preparedness towards coastal hazards, especially tsunamis. In this study, the emergency response plan was measured by asking about anticipatory steps that are taken by the respondents if a coastal hazard occurs, as well as about access to basic services (water, electricity, sanitation, etc.).
The majority of respondents have recognised the hazards in their environment (65.16%) and they consequently prepare clothes, cash, and family emergency needs (75.81%). Few respondents had developed evacuation plans, identified safe points, and practiced evacuation plans with families (around 20–30%). This condition is miserable, considering that the coastal area received more attention after the 2004 tsunami. Various government agencies and NGOs made efforts to improve community preparedness, especially in dealing with tsunamis.
Most of the people of Banda Aceh have access to electricity services (97.42%), clean (potable) water (82.58%), and information/communication (65.48%). However, for sanitation services and public transportation, the percentage is still low at 54.52% and 31.61%, respectively.
4.1.3. Early Warning System
An adequate early warning would be very beneficial for the community, in order to avoid the risks that may occur. Early warning consists of a combination of both the technological capability and the human ability to follow up on the results of the early warning. Early warning, as part of disaster risk reduction, is not only about technically accurate warnings, because it must also build a solid understanding of the risk of a warning, establish relationships between providers and warning users, and also increase the ability of authorities and communities to react appropriately to early warnings. If one of these components has not been accorded, then the early warning system will not succeed as a whole [47].
The results of our data analysis show that almost all respondents were exposed to the tsunami early warning system (93.87%). This state could be achieved due to the routine activation of tsunami sirens by the government on the 26th of every month. The primary purpose of establishing a tsunami early warning system is to save lives and reduce the loss of life and damage. If a series of procedures is accurately carried out, suffering from the tsunami disaster can be minimised.
Most of the respondents (71.29%) stated that the government is a source of early warning information. For the dissemination of early warning information to be effective, it requires the involvement of various parties in various sectors at all levels, including government, communities at risk, community organisations, Non-Governmental Organisations (NGOs), the media, and the private sector. Without the involvement of various stakeholders, the early warning system will not be adequate [47]. Whether or not warnings are remitted to communities in disaster-risk areas depends on their awareness and the ability of those communities to carry out the roles and responsibilities of all actors in the communication chain.
Some respondents (61%) perceived the siren noises to be an automatic response to disaster, where, in fact, the siren should be activated manually, by a particular person at a particular location. Some respondents (75.16%) also conceived that if a siren noise is given, it indicates that a tsunami will occur. Significantly, the siren is activated as an evacuation order to find, move to, and reach a safer place when a potential tsunami occurs.
4.1.4. Resource Mobilisation
The parameters of resource mobilisation were valued based on community actions, training programmes (resources), and access. The study also revealed that there were several actions taken by some respondents to anticipate coastal hazards, such as having savings, insurance, land/house in a potentially less harmful position, other livelihoods and relatives/friends for protection. Except for having relatives/friends, the overall alternative preparation was only claimed by less than 20% of respondents.
Only 35% of respondents have participated in training/workshop programmes on coastal hazard mitigation, first aid training, victim search and rescue, and clean (potable) water treatment. Access to preparedness information, emergency communication tools, transportation for evacuation, and health facilities was owned by more than 46% of respondents.
4.1.5. Community Preparedness Index
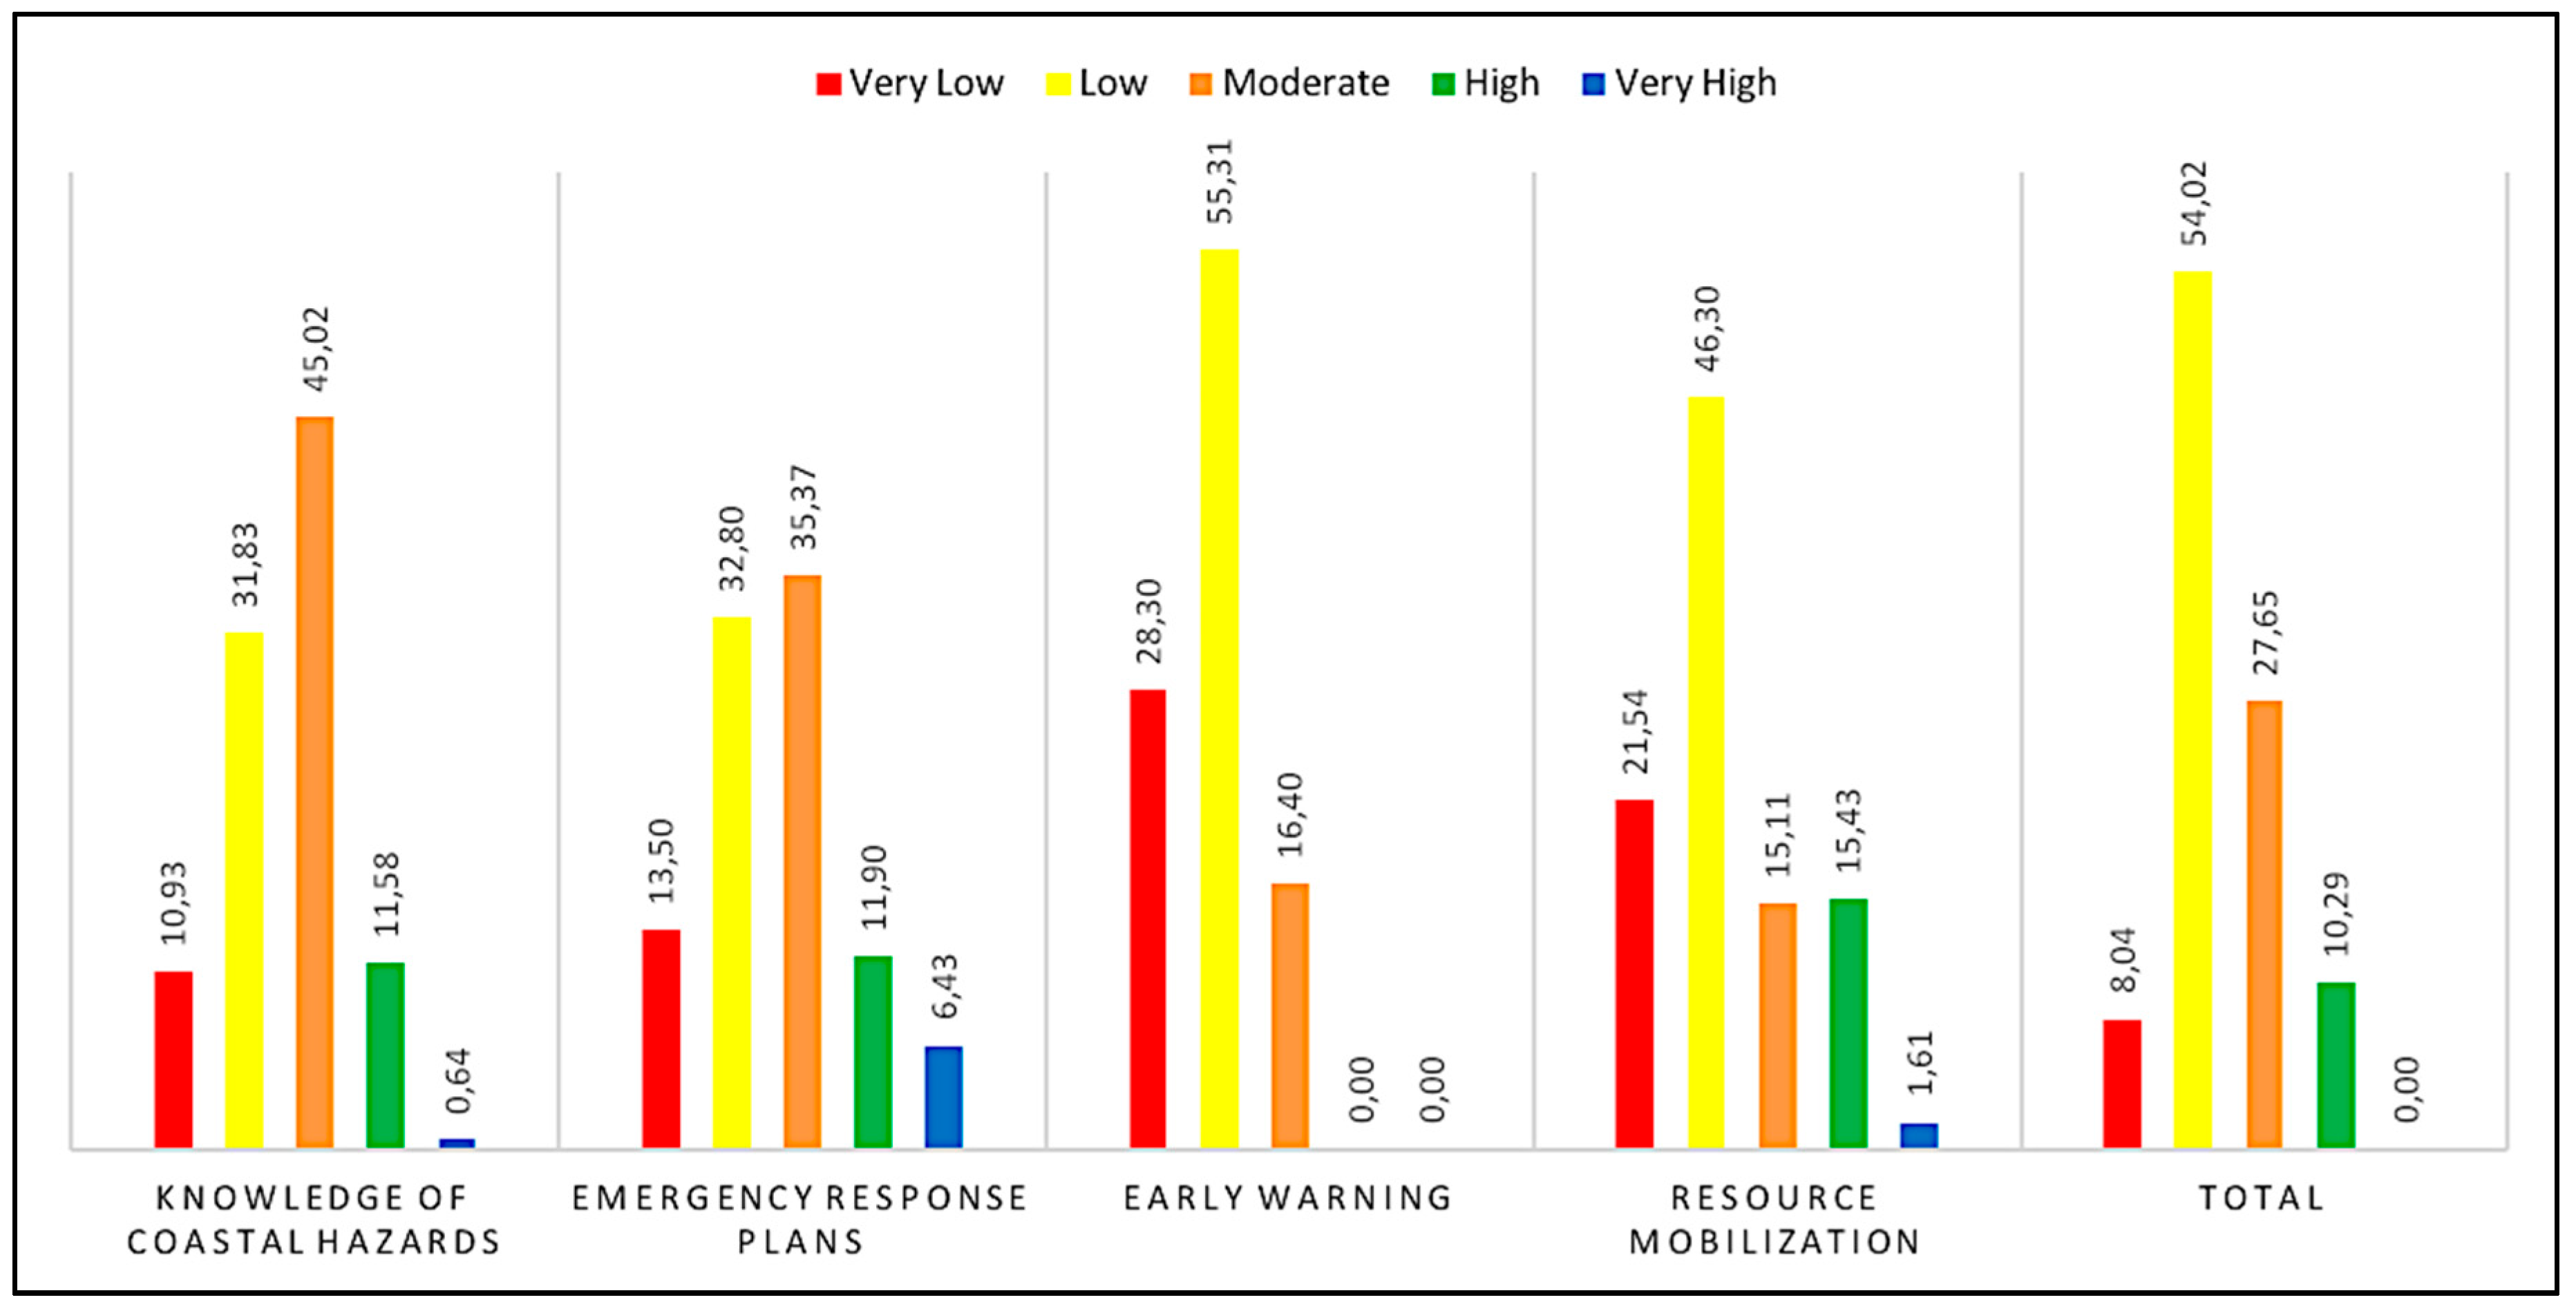
The Community Preparedness Index calculation for each parameter showed that the majority of Banda Aceh residents are still not prepared to withstand coastal hazards. This interpretation can be justified from the distribution of respondents’ in the category of “moderate” and “low” levels of preparedness for each parameter, and as a whole (see Figure 3).
For the parameter of knowledge of coastal hazards and emergency response plans, most of the respondents are in the category of “moderate”, with percentages of 45.02% and 35.37%, respectively. Furthermore, the majority of inhabitants are in the “low” category for early warning (55.31%) and resource mobilisation (46.30%).
The level of community preparedness is defined as the cumulative index value of each parameter (knowledge of coastal hazards, emergency response plans, early warning, and resource mobilisation). The majority of respondents (54.02%) had a low level of preparedness. While the respondents in the high and moderate categories were 10.29% and 27.65%, respectively. The remaining 8% of respondents fell into the “very low” category.
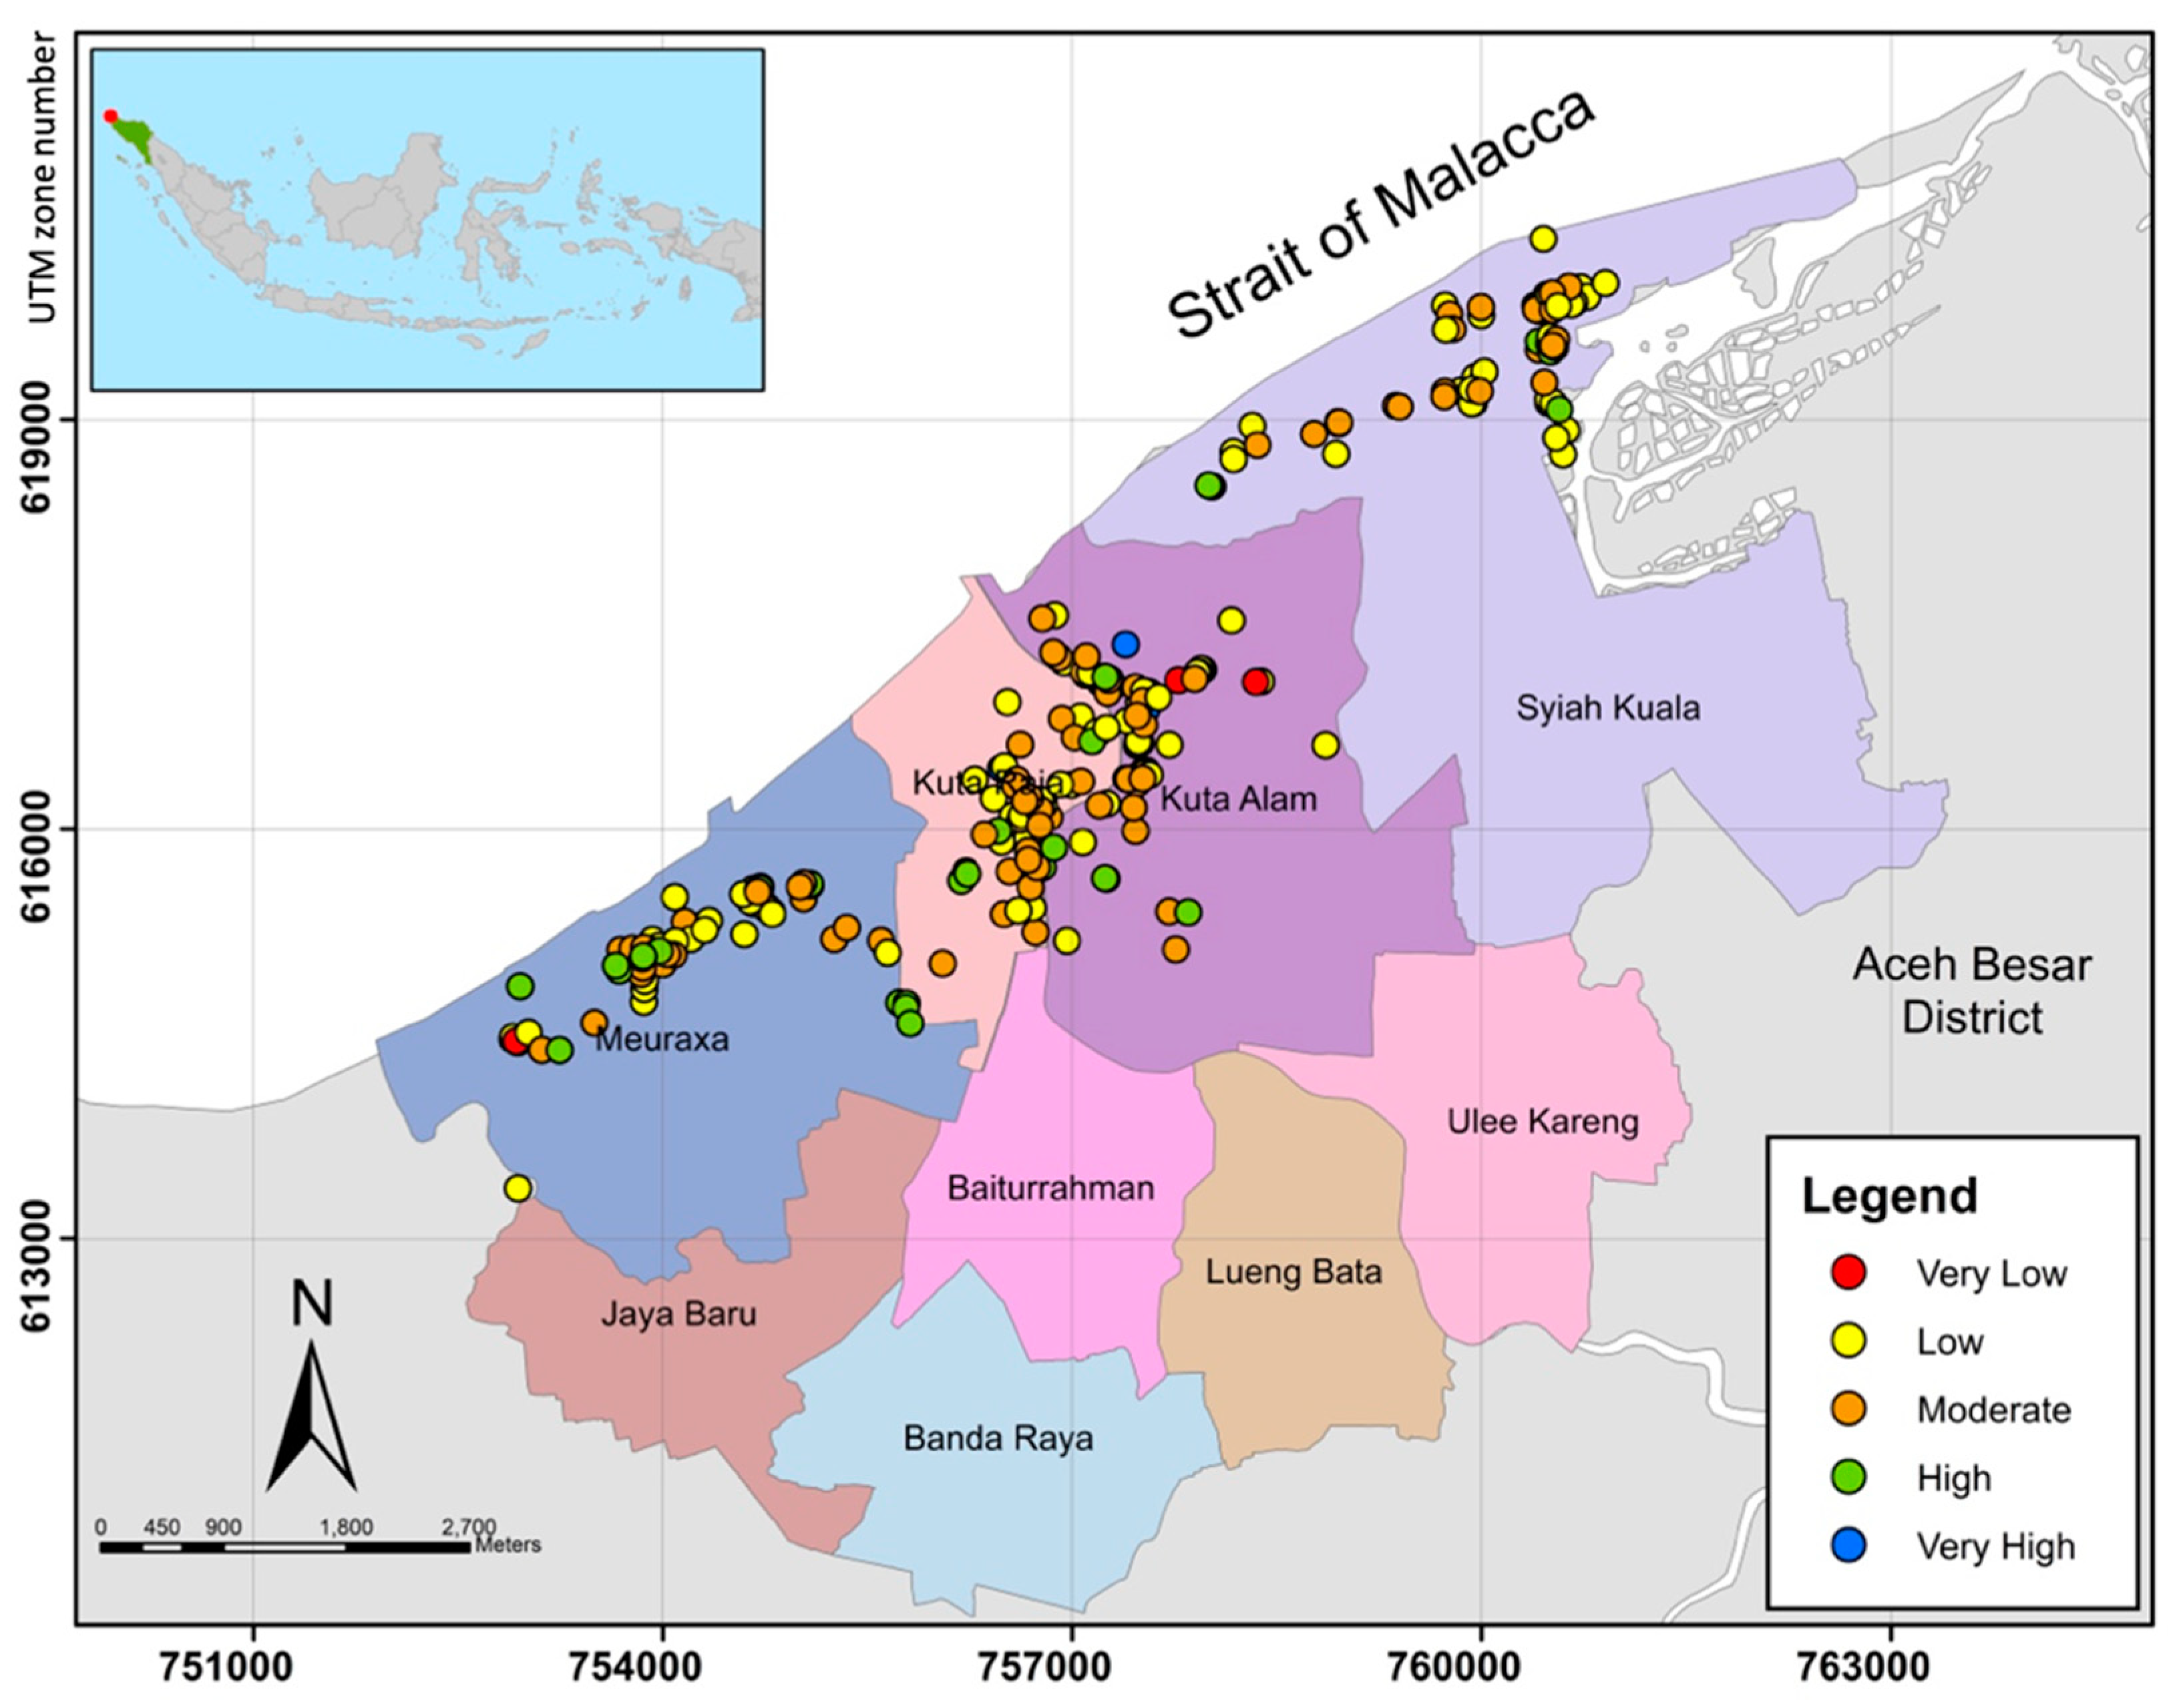
The spatial analysis of the respondent’s level of preparedness toward coastal hazards is visualized in Figure 4.
Overall, the calculation of the Banda Aceh people’s Preparedness Index value is provided in Table 2. All parameters indicate the index value in the “moderate” and “low” categories. The lowest index score is for the warning system parameter.
The total index of community preparedness towards coastal hazards falls in the “low” category, with an index value of 36.97.
4.2. Banda Aceh City’s Resilience towards Coastal Hazards
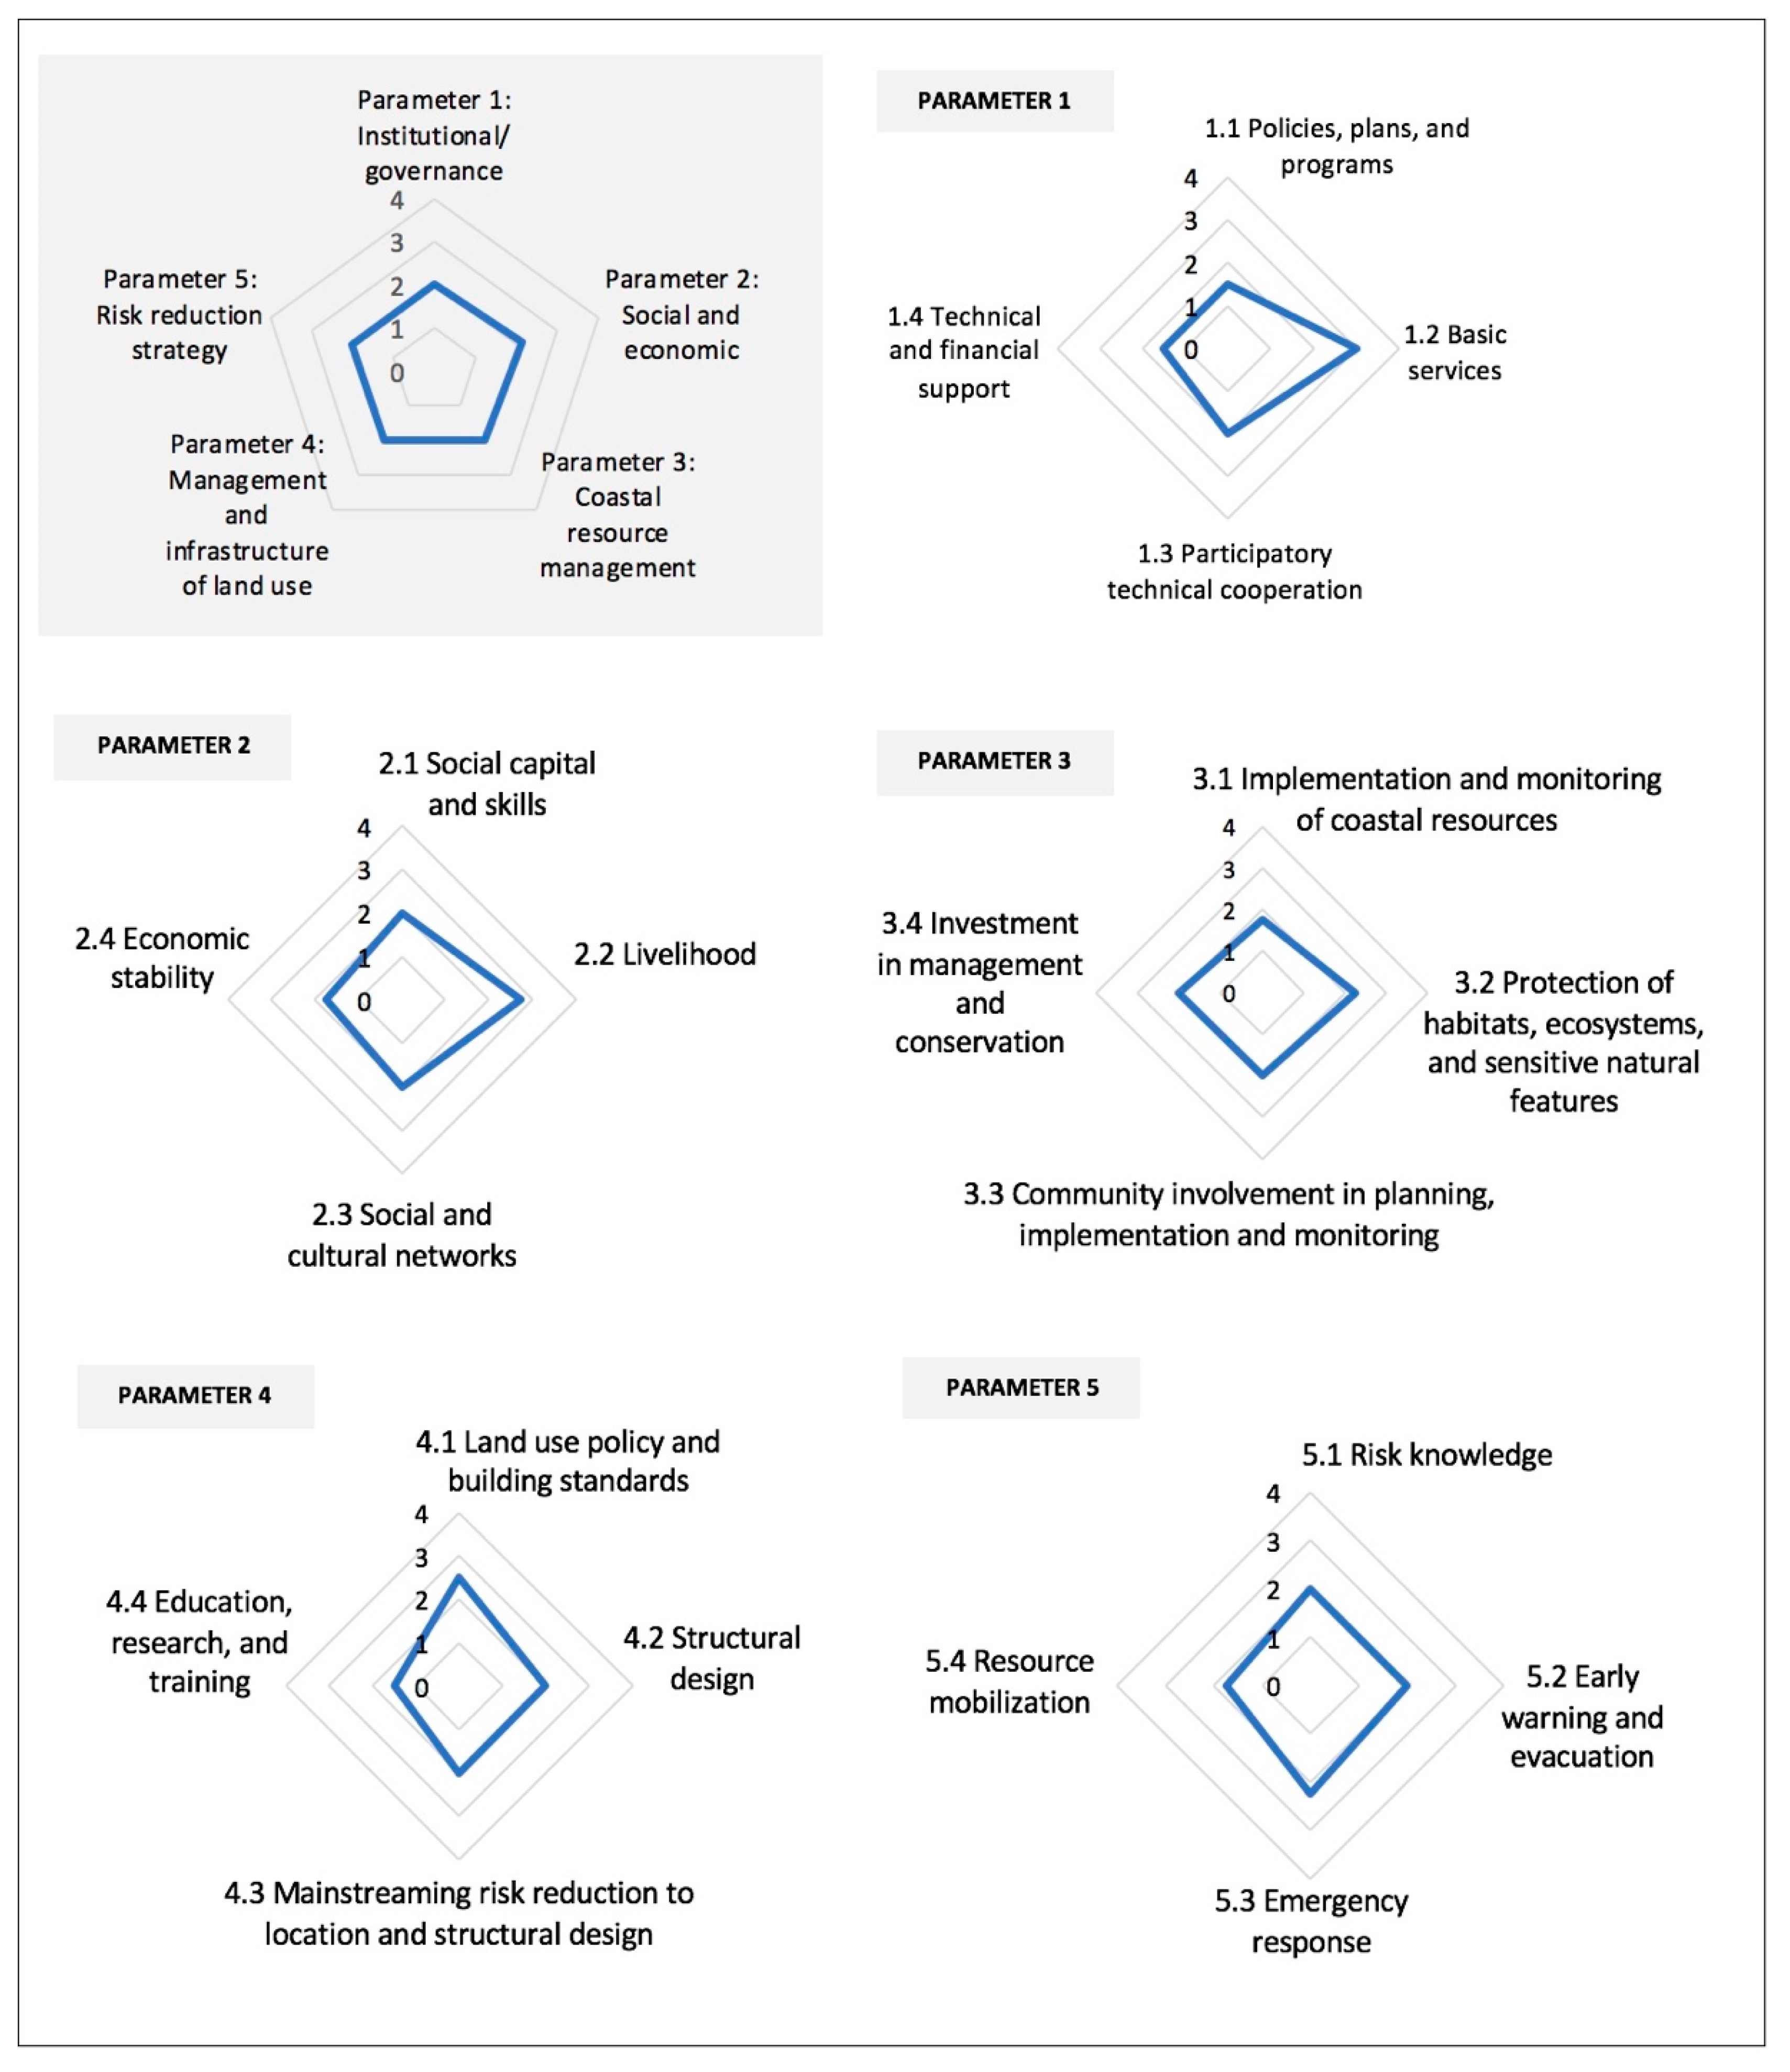
The city resilience study on the impact of coastal hazards used five resilience parameters, namely: (1) institutional/governance, (2) social economy, (3) management of coastal resources, (4) management and infrastructure of land use, and (5) risk reduction strategies.
4.2.1. Institutional/Governance
The institutional and governance parameters, in general, report a range of scores between 1 and 3, as shown in Figure 5. Only indicators in basic service variables have a score of 3 (Id121, Id122, Id123, and Id124). The household surveys also strengthened this result, where access to the coastal community of Banda Aceh for electricity and clean (potable) water services had been obtained by 92.42% and 82.58% of respondents, respectively. At this time, people get access to electricity from the National Electricity Company (Perusahaan Listrik Negara/PLN). By 2018, 99.52% of households in the Banda Aceh had electricity accessed from PLN, and the rest from privately generated electricity services (0.48%) [33,34].
Banda Aceh does not have a policy or planning document that is specifically aimed at protecting coastal areas. However, at the provincial level, Aceh already has a Zoning Plan for Coastal Areas and Small Islands (Rencana Zonasi Wilayah Pesisir dan Pulau-Pulau Kecil/RZWP3K) 2020–2040. This document aims to regulate all activities that use coastal space within Aceh’s jurisdiction that can be well integrated and able to provide more optimal results, which contain specific measures that are related to the use of coastal areas.
4.2.2. Social Economy
The results of the FGD acknowledges that the majority of indicators in the parameter of social and economic (Figure 6) are at a value of 2, meaning that a plan/strategy does exist, but it is not yet effective. Most indicators on the variable livelihood reach a value of 3 (Id221, Id222, Id223).
This condition implies that the people of Banda Aceh have alternative livelihoods, aside from being a fisherman, for example. The number of fishermen in Banda Aceh in 2018 was 1300, while fishery farmers were 401. There were 44 fishpond farmer groups and 61 fishermen groups in Banda Aceh. The number of small and medium-sized businesses in Banda Aceh in the field of trade was 6507, of agriculture 10, and of fisheries 20 [38].
4.2.3. Coastal Resource Management
Based on the results of the study, the implementation and monitoring of coastal resources, habitat protection, community involvement in planning, implementation, and monitoring and investment in conservation management have not been effective. The consensus agreed to rate a score of two for all indicators (see Figure 7), except for Id313 (score 1) and Id321 (score 3).
The area of preserved areas in Banda Aceh reached 142.61 ha or 2.42%. The percentage of green open space for the total area of Banda Aceh is increasing every year. In 2018, the area of green open space reached 835.56 ha or 14.14% of land surface area.
The involvement of the community in planning, implementation, and monitoring of coastal protection programmes was also strengthened by the results of the household survey. The respondents stated that only a few members of the community were directly involved in programme planning (26.45), programme implementation (24.52), problem-solving (23.23%), and programme monitoring (22.58%).
4.2.4. Management and Infrastructure of Land Use
Overall, the assessment of indicators on the management and infrastructure of land-use parameters (Figure 8) attained a score of two, except for Id411 and Id413 (score 3) and Id442 and Id443 (score 1).
The results of the study indicated that education, research, and training related to land use management and infrastructure have not been conducted. Land-use policies and building standards have been partially effective. According to BPS data (2019), all urban and rural roads in Banda Aceh are asphalt covered with a length reaching 707,343 m. Around 80.55% are in good condition, but the rest are in a state of moderate to severe damage.
The ratio of the number of buildings that obtained a building permit in the coastal area also shows that there are still many illegal buildings. In the Kuta Raja sub-district, 68.32% (2718 of 3979 buildings) had a building permit. Likewise, in the Kuta Alam sub-district, the ownership ratio of buildings with permits (Izin Mendirikan Bangunan/IMB) is 74.80% (9052 of 12,102 buildings), Syiah Kuala 74.10% (8130 out of 10,971 buildings), and Meuraxa 72.50% (5652 of 7796 buildings). Most of the Banda Aceh areas are residential areas (1087.91 ha or 18.41%), offices and trade (113.39 ha or 1.92%), health facilities (15.89 ha or 0.27%), educational facilities (64 ha or 1.08%), tourism (7.12 ha or 0.12%), and the rest are other designation areas.
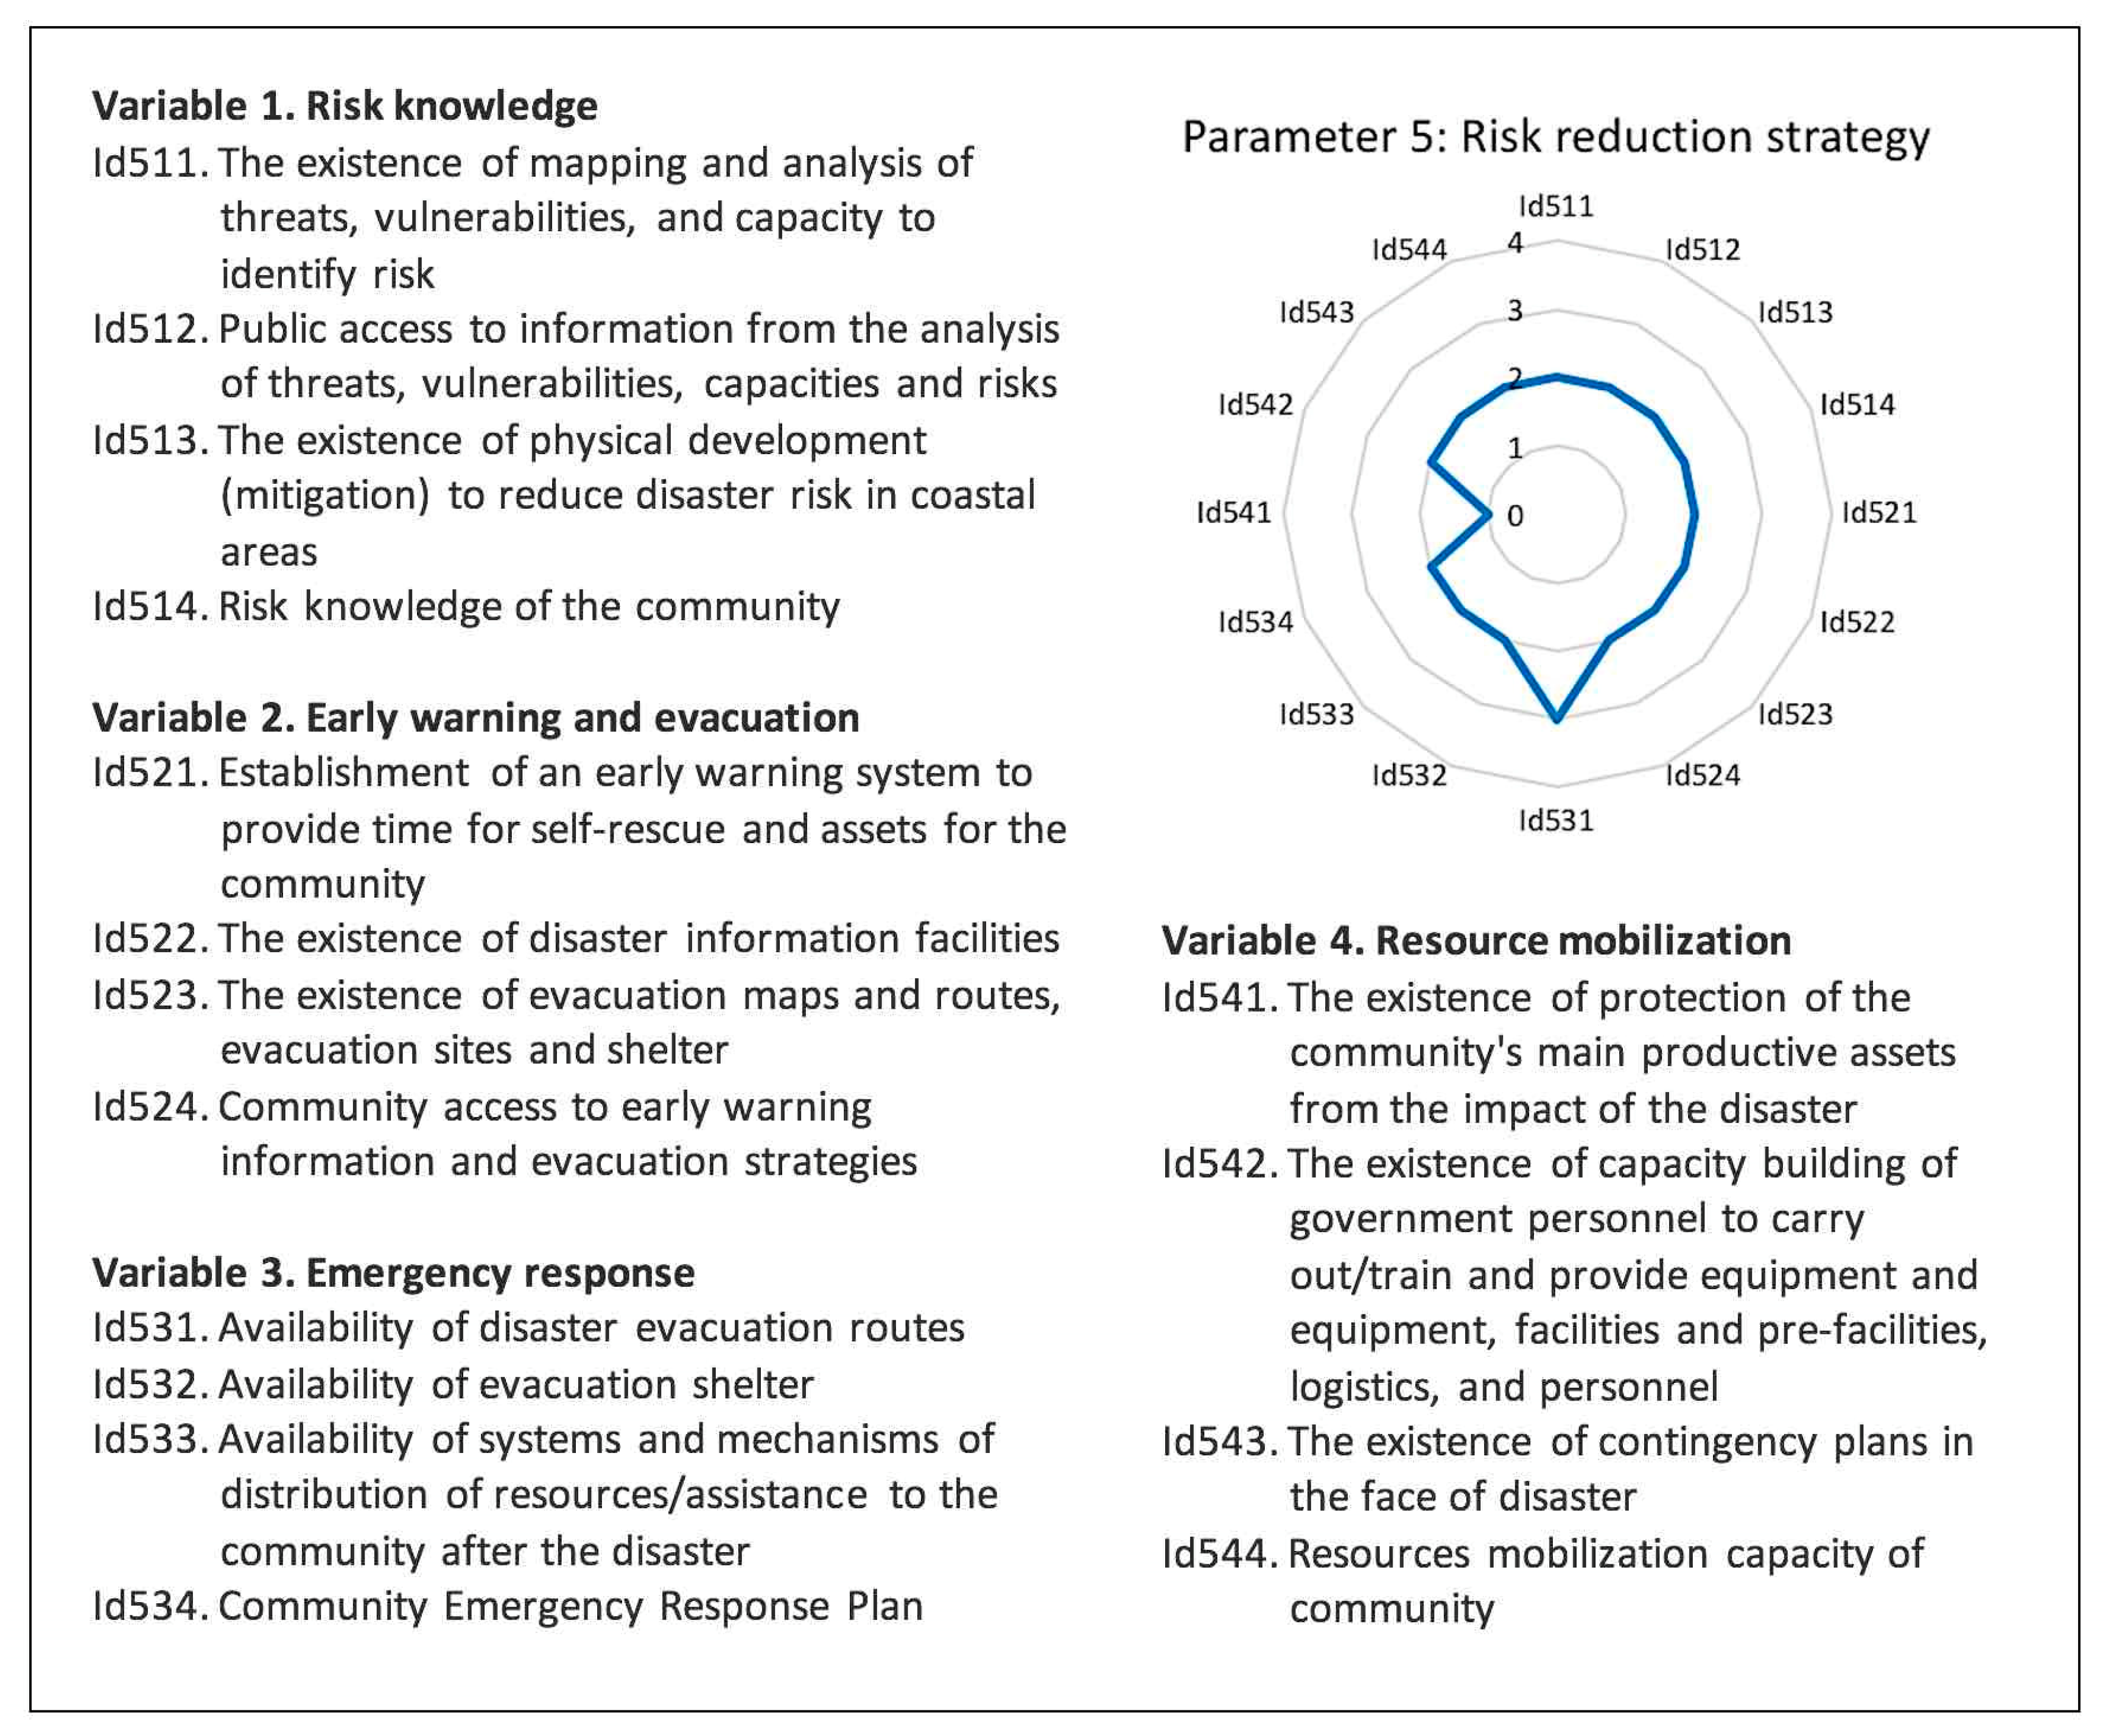
4.2.5. Risk Reduction Strategy
Regarding the assessment of the indicators on the parameters of risk reduction strategy, the majority were in rating 2—only Id531 and Id541, respectively, were in ratings 3 and 1 (see Figure 9). This result was also strengthened by the household survey, thus explaining why aspects of knowledge about risk, emergency response plans, early warning, and mobilisation of community resources were in the category of unprepared (low level), as described in the results of the previous coastal community preparedness study (see Section 4.1).
The overall assessment results of the resilience parameters shown in Figure 10 were low resilience, and the values were in the range of 2 (Parameters 1, 3, 4, and 5) to 2.12 (Parameter 2).
4.3. Strategies and Recommendations to Enhance City Resilience
The SWOT analysis in this study was used throughout interviews and FGDs in order to recognise strengths, weaknesses, opportunities, and threats that encompass the city’s resilience to coastal hazards. It is required in order to give an appraisal through internal and external factors as an essential frame of the SWOT analysis. The internal factors influence the configuration of the strengths and weaknesses (S and W, respectively). The external factors influence the creation of opportunities and threats (O and T, respectively).
The SWOT analysis was performed by comparing internal factors with external factors. The internal factors are listed in a matrix called the Internal Strategic Factor Analysis Summary (IFAS). External factors are recorded into an External Strategic Factor Analysis Summary (EFAS) matrix. Both IFAS and EFAS matrices are presented in Table 3 and Table 4, respectively.
The mechanism used to classify strategic factors in increasing resilience to coastal hazards is the SWOT matrix. This matrix clearly illustrates how external opportunities and threats encountered by the community can be adjusted by their strengths and weaknesses. This matrix offers four sets of possible strategic alternatives.
Firstly, the SO (Strength-Opportunities) Strategy—build upon the mindset of utilising all the power to seize and take advantage of the maximum opportunities. Secondly, the ST (Strengths-Threats) Strategy—using the strengths that are possessed to overcome threats. Thirdly, the WO (Weaknesses-Opportunities) Strategy—based on the utilisation of existing opportunities by minimising existing weaknesses. Fourthly, WT (Weaknesses-Threats) Strategy, in accordance with activities that are defensive and attempt to minimise current weaknesses and to avoid threats.
Based on the results of the study, strategy recommendations are formulated, as presented in Table 5. In general, there are two types of strategies that need to be counted—first, mitigation efforts, both structural (SO1, SO2, WO1, WO2, and WO3) and non-structural (ST1, ST2, and ST3) to reduce risk and adapt to coastal hazards. Second, integrating policies, data, resources, and programs related to coastal hazards to improve the resilience of cities (WT1, WT2, and WT3).
5. Discussion
Over the last few decades, coastal areas have been increasingly affected by natural hazards, resulting in increased economic losses and deaths [6,7]. Typically, in coastal areas, the impact of a disaster depends on several factors, including the intensity and frequency of natural hazards, climate change, and coastal stress. However, it is widely assumed that resilient coasts can effectively cope with stresses and impacts of coastal hazards. To build a resilient coast, it is important to assess the level of both community preparedness and coastal resilience [8].
In this context, the overall coastal community preparedness index of Banda Aceh is in the “low” category, with index score 36.97 out of 100. For the parameters of knowledge of coastal hazards and emergency response plans, the analysis results show a “moderate” level of preparedness with index values of 41.52 and 42.39, respectively. Meanwhile, the early warning system and resource mobilisation parameters are at the “low” level with index values of 28.70 and 35.26, respectively. This condition is quite alarming, considering that Banda Aceh is highly vulnerable to coastal hazards. The level of preparedness of a community is dynamic, implying that it can increase or decrease over time. Changes that occur in society, including social, economic, cultural, and political differences, also influence the preparedness condition. For this reason, efforts need to be made to regularly maintain and improve the level of preparedness of the community.
The method of assessing community preparedness in facing coastal hazards that have been used in this study provides necessary information about what is occurring in the field. This information is crucial as a process of thoughtfulness regarding administering an assessment of a city’s resilience, especially with respect to the social-economic parameters. Previous studies have shown that the social economy is one of the parameters or aspects used in assessing resilience [48,49,50,51].
In this study, the results of the community preparedness survey in facing coastal hazards were used to assess several indicators in the study parameters of the coastal city’s resilience, namely, institutional/governance (Parameter 1), social and economic (Parameter 2), management of coastal resources (Parameter 3), and risk reduction strategies (Parameter 5). In these parameters, several indicators are assessed, based on secondary data (government reports), and validated using primary data that were obtained through community preparedness surveys. Indicators in Parameter 1 that required input from the community survey are the percentage of households that have access to electricity, clean (potable) water, sanitation, and solid waste facilities. In Parameter 2, the percentage of people who work in the agriculture, fishery, and trade sectors also confirmed the survey results. The indicator of community involvement in planning, implementing, and monitoring coastal protection programmes also indicated by way of the survey some support for Parameter 3. The community preparedness survey also provides detailed information on the community’s risk knowledge, community access to early warning information and evacuation strategies, emergency response plans, and community mobilisation capacity needed in Parameter 5 of the coastal resilience assessment.
The overall assessment results of the city’s resilience in Banda Aceh are low. This result indicates that efforts made to deal with coastal hazards have not been effective. For this coastal hazard assessment/judgment, a more planned, systematic, and sustainable effort is necessary so that the consequences of coastal hazards can be reduced. Accordingly, the study of coastal resilience in this study is also complemented by a SWOT analysis in order to develop strategies and recommendations that would enhance city resilience.
This study confirms the benefits of using quantitative and qualitative approaches (mixed methods) to collect data in order to assess urban resilience through data/source triangulation, whereby the data collection would involve several activities, including household surveys, Focus Group Discussions (FGD), and interviews. The data triangulation technique involves comparing and re-checking the level of confidence in information obtained through different means and at different times. The expected results of the comparisons are similarities or reasons for differences [40].
The results of this study also augment the idea that low-lying or coastal areas have a higher risk of coastal hazards [48]. Rapid population growth, accompanied by a lack of public understanding of disaster risks, has led to the utilisation of buffer zone areas as residential areas. This condition has caused damage to the coastal ecosystems and worsens Banda Aceh’s vulnerability to the tsunami and other coastal hazards [33].
6. Conclusions
This study has expanded an integrative assessment method for evaluating the level of the city’s resilience toward coastal hazards. This method is employed by first assessing the level of community preparedness (at the household level) in dealing with coastal hazards, where the results will be adopted when conducting a more comprehensive evaluation of the city’s resilience. This bottom-up procedure is essential to ensure that information from the grass-roots level is considered. Whereas the top-down approach is carried out to ensure that the correct conceptual information is still applied. Top-down evaluation of the city’s resilience level is performed through interviews and focus group discussions with policymakers, practitioners, and academics.
The application of this method is applied to assess the level of resilience of Banda Aceh, which is a tsunami-prone area, in dealing with coastal hazards. The analysis revealed that the level of preparedness of the people of Banda Aceh was in the “low” category. The city’s overall resilience assessment result is also categorised as “low”, indicating that more planned, systematic and sustainable effort is required, and therefore, this study also recommends the outlined strategies.
Further research is needed to explore the replication of this method in other coastal hazard-prone regions. It would enable some understanding of how the resilience level towards coastal hazards, as measured by this integrative approach, will adjust due to the social, economic, political, and environmental circumstances.
Author Contributions
Conceptualization, R.S.O.; methodology, R.S.O.; formal analysis, R.S.O.; investigation, R.S.O.; data curation, R.S.O.; writing—original draft preparation, R.S.O.; writing—review and editing, S., R.I., H.S., K.M.; supervision, S., R.I., H.S., K.M.; funding acquisition, S., K.M. All authors have read and agreed to the published version of the manuscript.
Funding
This research was funded by Partnership Enhanced Engagement in Research from United States Agencies for International Development (PEER USAID) Cycle 5 and National Academies of Sciences, Engineering, and Medicines (NASEM) grant award No. AID-OAAA-A-11-00012, sub-award No. 2000007546 (#5-395), and Kementerian Pendidikan dan Kebudayaan (KEMDIKBUD) under 2020 Doctoral Research Grant No. 174/SP2H/ADM/LT/DPRM/2020.
Acknowledgments
As one IRDR Young Scientist, the first author is thankful for the opportunity and support from Integrated Research on Disaster Risk (IRDR), Beijing, China. The authors would also like to acknowledge the contribution of Arisna Fauzia and the task force for drafting document of tsunami and coastal flood mitigation strategies amplified by rising sea levels as a result of climate change.
Conflicts of Interest
The authors declare no conflict of interest.
References
- Bunce, M.; Brown, K.; Rosendo, S. Policy misfits, climate change and cross-scale vulnerability in coastal Africa: How development projects undermine resilience. Environ. Sci. Policy 2010, 13, 485–497. [Google Scholar] [CrossRef]
- Lewis, J. Some realities of resilience: An updated case study of storms and flooding at Chiswell, Dorset. Disaster Prev. Manag. 2013, 22, 300–311. [Google Scholar] [CrossRef]
- Mehvar, S.; Filatova, T.; Dastgheib, A.; De Ruyter van Steveninck, E.; Ranasinghe, R. Quantifying economic value of coastal ecosystem services: A review. J. Mar. Sci. Eng. 2018, 6, 5. [Google Scholar] [CrossRef] [Green Version]
- Kumar, L.; Eliot, I.; Nunn, P.D.; Stul, T.; McLean, R. An indicative index of physical susceptibility of small islands to coastal erosion induced by climate change: An application to the Pacific islands. Geomat. Nat. Hazards Risk 2018, 9, 691–702. [Google Scholar] [CrossRef]
- Ferro-Azcona, H.; Espinoza-Tenorio, A.; Calderón-Contreras, R.; Ramenzoni, V.C.; País, M.D.L.M.G.; Mesa-Jurado, M.A. Adaptive capacity and social-ecological resilience of coastal areas: A systematic review. Ocean Coast. Manag. 2019, 173, 36–51. [Google Scholar] [CrossRef]
- Nunn, P.D.; Runman, J.; Falanruw, M.; Kumar, R. Culturally grounded responses to coastal change on islands in the Federated States of Micronesia, northwest Pacific Ocean. Reg. Environ. Chang. 2017, 17, 959–971. [Google Scholar] [CrossRef]
- Bevacqua, A.; Yu, D.; Zhang, Y. Coastal vulnerability: Evolving concepts in understanding vulnerable people and places. Environ. Sci. Policy 2018, 82, 19–29. [Google Scholar] [CrossRef]
- UNISDR. Sendai Framework for Disaster Risk Reduction 2015–2030, United Nations International Strategy for Disaster Reduction; UNISDR: Geneva, Switzerland, 2015. [Google Scholar]
- United Nations General Assembly. The Sustainable Development Goals (SDGs). Transforming Our World: The 2030 Agenda for Sustainable Development; United Nations General Assembly: New York, NY, USA, 2015. [Google Scholar]
- Alexander, D.E. Resilience and disaster risk reduction: An etymological journey. Nat. Hazards Earth Syst. Sci. Discuss. 2013, 1, 1257–1284. [Google Scholar] [CrossRef]
- Tilloy, A.; Malamud, B.D.; Winter, H.; Joly-Laugel, A. A review of quantification methodologies for multi-hazard interrelationships. Earth Sci. Rev. 2019, 196, 102881. [Google Scholar] [CrossRef]
- Lake, P.S. Resistance, resilience and restoration. Ecol. Manag. Restor. 2013, 14, 20–24. [Google Scholar] [CrossRef]
- Radke, J.D.; Biging, G.S.; Roberts, K.H.; Schmidt-Poolman, M.; Foster, H.; Roe, E.; Ju, Y.; Lindbergh, S.; Beach, T.; Maier, L.; et al. Assessing extreme weather-related vulnerability and identifying resilience options for California’s interdependent transportation fuel sector. In California’s Fourth Climate Change Assessment; California, Energy Commission, University of California: Berkeley, CA, USA, 2018; pp. 1–353. [Google Scholar]
- Masselink, G.; Lazarus, E.D. Defining coastal resilience. Water 2019, 11, 2587. [Google Scholar] [CrossRef] [Green Version]
- Engle, N.L.; de Bremond, A.; Malone, E.L.; Moss, R.H. Towards a resilience indicator framework for making climate-change adaptation decisions. Mitig. Adapt. Strateg. Glob. Chang. 2014, 19, 1295–1312. [Google Scholar] [CrossRef]
- Patel, S.S.; Rogers, M.B.; Amlôt, R.; Rubin, G.J. What do we mean by community resilience? A systematic literature review of how it is defined in the literature. PLoS Curr. 2017, 9. [Google Scholar] [CrossRef]
- Jones, L.; d’Errico, M. Whose resilience matters? Like-for-like comparison of objective and subjective evaluations of resilience. World Dev. 2019, 124, 104632. [Google Scholar] [CrossRef]
- Butler, J.R.A.; Wise, R.M.; Skewes, T.D.; Bohensky, E.L.; Peterson, N.; Suadnya, W.; Yanuartati, Y.; Handayani, T.; Habibi, P.; Puspadi, K.; et al. Integrating top-down and bottom-up adaptation planning to build adaptive capacity: A structured learning approach. Coast. Manag. 2015, 43, 346–364. [Google Scholar] [CrossRef]
- Bennett, N.J.; Kadfak, A.; Dearden, P. Community-based scenario planning: A process for vulnerability analysis and adaptation planning to social–ecological change in coastal communities. Environ. Dev. Sustain. 2016, 18, 1771–1799. [Google Scholar] [CrossRef]
- Ferreira, A.; Seixas, S.; Marques, J.C. Bottom-up management approach to coastal marine protected areas in Portugal. Ocean. Coast. Manag. 2015, 118, 275–281. [Google Scholar] [CrossRef]
- Sovacool, B.K. Perceptions of climate change risks and resilient island planning in the Maldives. Mitig. Adapt. Strateg. Glob. Chang. 2012, 17, 731–752. [Google Scholar] [CrossRef]
- Cox, R.S.; Hamlen, M. Community disaster resilience and the rural resilience index. Am. Behav. Sci. 2015, 59, 220–237. [Google Scholar] [CrossRef]
- Khazai, B.; Bendimerad, F.; Cardona, O.D.; Carreño, M.L.; Barbat, A.H.; Buton, C.G. A Guide to Measuring Urban Risk Resilience: Principles, Tools and Practice of Urban Indicators; Earthquakes and Megacities Initiative (EMI): Quezon City, Philippines, 2015. [Google Scholar]
- White, I.; O’Hare, P. From rhetoric to reality: Which resilience, why resilience, and whose resilience in spatial planning? Environ. Plan C Gov. Policy 2014, 32, 934–950. [Google Scholar] [CrossRef]
- Lin, B.B.; Capon, T.; Langston, A.; Taylor, B.; Wise, R.; Williams, R.; Lazarow, N. Adaptation pathways in coastal case studies: Lessons learned and future directions. Coast. Manag. 2017, 45, 384–405. [Google Scholar] [CrossRef]
- Rouse, H.L.; Bell, R.G.; Lundquist, C.J.; Blackett, P.E.; Hicks, D.M.; King, D.N. Coastal adaptation to climate change in Aotearoa-New Zealand. N. Z. J. Mar. Freshw. Res. 2017, 51, 183–222. [Google Scholar] [CrossRef]
- Cinner, J.E.; Adger, W.N.; Allison, E.H.; Barnes, M.L.; Brown, K.; Cohen, P.J.; Gelcich, S.; Hicks, C.C.; Hughes, T.P.; Lau, J.; et al. Building adaptive capacity to climate change in tropical coastal communities. Nat. Clim. Chang. 2018, 8, 117–123. [Google Scholar] [CrossRef] [Green Version]
- Cohen, O.; Bolotin, A.; Lahad, M.; Goldberg, A.; Aharonson-Daniel, L. Increasing sensitivity of results by using quantile regression analysis for exploring community resilience. Ecol. Indic. 2016, 66, 497–502. [Google Scholar] [CrossRef] [Green Version]
- Cutter, S.L. The landscape of disaster resilience indicators in the USA. Nat. Hazards 2016, 80, 741–758. [Google Scholar] [CrossRef]
- US Geological Survey. Available online: https://www.usgs.gov/centers/pcmsc/science/tsunami-generation-2004-m91-sumatra-andaman-earthquake?qt-science_center_objects=0#qt-science_center_objects (accessed on 3 October 2020).
- Lavigne, F.; Paris, R.; Grancher, D.; Wassmer, P.; Brunstein, D.; Vautier, F.; Leone, F.; Flohic, F.; De Coster, B.; Gunawan, T.; et al. Reconstruction of tsunami inland propagation on December 26, 2004 in Banda Aceh, Indonesia, through field investigations. Pure Appl. Geophys. 2009, 166, 259–281. [Google Scholar] [CrossRef]
- Ghobarah, A.; Saatcioglu, M.; Nistor, I. The impact of the 26 December 2004 earthquake and tsunami on structures and infrastructure. Eng. Struct. 2006, 28, 312–326. [Google Scholar] [CrossRef]
- Syamsidik; Oktari, R.S.; Munadi, K.; Arief, S.; Fajri, I.Z. Changes in coastal land use and the reasons for selecting places to live in Banda Aceh 10 years after the 2004 Indian Ocean tsunami. Nat. Hazards 2017, 88, 1503–1521. [Google Scholar] [CrossRef]
- Rubin, C.M.; Horton, B.P.; Sieh, K.; Pilarczyk, J.E.; Daly, P.; Ismail, N.; Parnell, A.C. Highly variable recurrence of tsunamis in the 7400 years before the 2004 Indian Ocean tsunami. Nat. Commun. 2017, 8, 16019. [Google Scholar] [CrossRef]
- Syamsidik; Rasyif, T.M.; Kato, S. Development of accurate tsunami estimated times of arrival for tsunami-prone cities in Aceh, Indonesia. Int. J. Disaster Risk Reduct. 2015, 14, 403–410. [Google Scholar] [CrossRef]
- Tursina; Syamsidik; Kato, S. Projections of tsunami inundation area coupled with impacts of sea level rise in Banda Aceh, Indonesia. In AIP Conference Proceedings; AIP Publishing: College Park, MD, USA, 2017; Volume 1892, p. 100003. [Google Scholar]
- Al’ala, M.; Syamsidik; Kato, S. Predicting impact of SLR on coastal flooding in Banda Aceh coastal defences. In AIP Conference Proceedings; AIP Publishing: College Park, MD, USA, 2017; Volume 1892, p. 100004. [Google Scholar]
- BPS Aceh. Aceh Province in Figures. BPS Provinsi Aceh, 2019. Available online: https://aceh.bps.go.id/publication/2019/08/16/c874b8b17e60e74da57b8501/provinsi-aceh-dalam-angka-2019.html (accessed on 17 June 2020).
- BPS Banda Aceh. Banda Aceh Municipality in Figures. BPS Kota Banda Aceh, 2019. Available online: https://bandaacehkota.bps.go.id/publication/2019/08/16/731a4401ebf3dcf4aa5c5414/kota-banda-aceh-dalam-angka-2019.html (accessed on 17 June 2020).
- Fielding, N.G. Triangulation and mixed methods designs: Data integration with new research technologies. J. Mix. Methods Res. 2012, 6, 124–136. [Google Scholar] [CrossRef] [Green Version]
- Oktari, R.S.; Comfort, L.K.; Syamsidik; Dwitama, P. Measuring coastal cities’ resilience toward coastal hazards: Instrument development and validation. Prog. Disaster Sci. 2020, 5, 100057. [Google Scholar] [CrossRef]
- LIPI-UNESCO. Kesiapsiagaan Masyarakat Dalam Mengantisipasi Bencana Gempa dan Tsunami; LIPI-UNESCO: Jakarta, Indonesia, 2006; Available online: http://www.buku-e.lipi.go.id/utama.cgi?sejarahversi&jans001&1273262299 (accessed on 17 June 2020).
- Kato, T.; Ito, T.; Abidin, H.Z. Preliminary report on crustal deformation surveys and tsunami measurements caused by the July 17, 2006 South off Java Island Earthquake and Tsunami, Indonesia. Earth Planets Space 2007, 59, 1055–1059. [Google Scholar] [CrossRef] [Green Version]
- Syamsidik; Istiyanto, D.C. Tsunami mitigation measures for tsunami prone small islands: Lessons learned from the 2010 Tsunami around the Mentawai Islands of Indonesia. J. Earthq. Tsunami 2013, 7, 1350002. [Google Scholar] [CrossRef]
- Syamsidik; Benazir; Umar, M.; Margaglio, G.; Fitrayansyah, A. Post-tsunami surve y of the 28 September 2018 tsunami near Palu Bay in Central Sulawesi, Indonesia: Impacts and challenges to coastal communities. Int. J. Disaster Risk Reduct. 2019, 38, 101229. [Google Scholar] [CrossRef]
- Paris, A.; Heinrich, P.; Paris, R.; Abadie, S. The December 22, 2018 Anak Krakatau, Indonesia, landslide and tsunami: Preliminary modeling results. Pure Appl. Geophys. 2019, 177, 571–590. [Google Scholar] [CrossRef] [Green Version]
- Oktari, R.S.; Munadi, K.; Ridha, M. Effectiveness of dissemination and communication element of tsunami early warning system in Aceh. Procedia Econ. Financ. 2014, 18, 136–142. [Google Scholar] [CrossRef] [Green Version]
- Prashar, S.; Shaw, R.; Takeuchi, Y. Assessing the resilience of Delhi to climate-related disasters: A comprehensive approach. Nat. Hazards 2012, 64, 1609–1624. [Google Scholar] [CrossRef]
- Williams, P.; Sands, D. UN city disaster resilience scorecard. In An Edited Collection of Authored Pieces Comparing, Contrasting and Integrating Risk and Resilience with an Emphasis on Ways to Measure Resilience; UN: New York, NY, USA, 2016; p. 248. [Google Scholar]
- Rubinoff, P.; Courtney, C. How Resilient is Your Coastal Community? A Guide for Evaluating Coastal Community Resilience to Tsunamis and Other Coastal Hazards, Basins and Coasts News, Integrated Management for Coastal and Freshwater Systems; United States Agency for International Development: Chicago, IL, USA, 2007; Volume 2, pp. 24–28. [Google Scholar]
- TRF. City Resilience Framework. The Rockefeller Foundation and ARUP. 2014. Available online: https://www.rockefellerfoundation.org/wp-content/uploads/City-Resilience-Framework-2015.pdf (accessed on 17 June 2020).
Figure 1.
Map of Banda Aceh with area of Tsunami damages (geographic coordinate system is UTM) [33].
Figure 1.
Map of Banda Aceh with area of Tsunami damages (geographic coordinate system is UTM) [33].

Figure 2.
Research Flowchart.

Figure 3.
Distribution of community preparedness level for each parameter and total index.

Figure 4.
Distribution of Banda Aceh people’s level of preparedness for coastal hazards (geographic coordinate system is UTM).
Figure 4.
Distribution of Banda Aceh people’s level of preparedness for coastal hazards (geographic coordinate system is UTM).

Figure 5.
The evaluation results of the indicators in Parameter 1.

Figure 6.
The evaluation results of the indicators in Parameter 2.

Figure 7.
The evaluation results of the indicators in Parameter 3.

Figure 8.
The evaluation results of the indicators in Parameter 4.

Figure 9.
The evaluation results of the indicators in Parameter 5.

Figure 10.
Results of the Banda Aceh Coastal Resilience Assessment.


Table 1.
Characteristics of respondents.
| Variable | N | % |
|---|---|---|
| Age Group (years) | ||
| Less than 20 | 3 | 0.96 |
| 20–29 | 64 | 20.58 |
| 30–39 | 110 | 35.37 |
| 40–49 | 78 | 25.08 |
| More than 50 | 56 | 18.01 |
| Gender | ||
| Male | 101 | 32.48 |
| Female | 210 | 67.52 |
| Educational Background | ||
| Never attended school | 9 | 2.89 |
| Not graduated from elementary school | 34 | 10.93 |
| Elementary School | 21 | 6.75 |
| Junior high school | 69 | 22.19 |
| Senior high school | 132 | 42.44 |
| Higher education | 46 | 14.79 |
| Employment Status | ||
| Employee | 143 | 45.98 |
| Unemployment | 8 | 2.57 |
| Job seeker | 8 | 2.57 |
| Housewife | 128 | 41.16 |
| Other | 24 | 7.72 |
| The Distance between Residence and Shoreline (m) | ||
| Less than 500 | 144 | 46.30 |
| 500–2000 | 137 | 44.05 |
| More than 2000 | 8 | 2.57 |
| Government Aid Received | ||
| Direct cash transfer (BLT) | 258 | 82.96 |
| Rice-for-poor scheme | 114 | 36.66 |
| Welfare card for poor families (Gakin) | 283 | 91.00 |
Table 2.
Index Score of Banda Aceh’s community preparedness.
| Parameter | Index Score | Category |
|---|---|---|
| Knowledge of coastal hazards | 41.52 | Moderate |
| Emergency response plans | 42.39 | Moderate |
| Early Warning system | 28.70 | Low |
| Resource mobilisation | 35.26 | Low |
| Total | 36.97 | Low |
Table 3.
Internal Strategic Factor Analysis Summary (IFAS).
| ASPECTS | STRENGTHS | WEAKNESS |
|---|---|---|
| Human Resources | S1: Various agencies and organisations across stakeholders S2: Personnel who have a scientific background and computer simulation skills S3: Personnel who are able to communicate and negotiate with national and international partners S4: Human resources experienced and trained in the disaster-related field | W1: Unequal perceptions about the impact of coastal hazards W2: High-level dynamics of government organisations (employee mutations) W3: No specific reward and certification for skilled disaster personnel |
| Financial Resources | S5: Special Autonomy funds (OTSUS) for DRR activities S6: Agency’s internal budget allocated for DRR | W4: Use of funds that are not targeted (not in line with priorities) W5: Partial funding for the large infrastructure still depends on the central government W6: The allocation of 1% for disaster is not in accordance with existing regulations |
| Physical Resources | S7: Revetment along the beach S8: Building flood control S9: Mangrove forest on the coast S10: Tsunami evacuation building S11: Escape route for tsunami evacuation route S12: Tsunami warning sirens are activated on 26th day of each month | W7: Some revetment has functionally decreased: the building elevation is not high enough during high tide conditions W8: Most of the flood gates on the seashore are damaged, have sedimentation, and creek embankments have failures W9: Escape buildings within the coastal area have not been evenly spread out, and the management of buildings has not been functionally appropriate W10: Road capacity and route for disaster evacuation are not maximum, but this is mainly on the east side of Banda Aceh |
| Regulations/Policies | S13: Regulations that support DRR efforts S14: Disaster insurance in the form of cash compensation to disaster victims, Card of Marine and Fisheries Business Actors (KUSUKA) S15: Supporting documents in DRR such as Disaster Management Plans (RPB), Contingency Plans for Flood, Earthquake, and Tsunami | W11: Information about the coastal hazards which are amplified by the impacts of climate change are not integrated into the existing regulations W12: Inadequate law enforcement for violations of spatial planning W13: RPB has not been strengthened as a Regional Regulation (Qanun) |
| Coordination System | S16: Collaborations between agencies and stakeholders, i.e., the Emergency Response Team in government offices, including Hospitals. | W14: Existing coordination does not consider other coastal hazards |
| Geographical Condition | W15: The relative sloping topography causes the more widespread impact of the tsunami and tidal flood W16: Most of the area is located on the coast, which is vulnerable to tsunami threat and tidal flood | |
| Demographic Condition | S17: Population density on the coast is relatively low, therefore, it is easier to arrange the area S18: There are local wisdom values that contain DRR S19: Interaction and attitudes of togetherness among society | W17: No detailed data on vulnerable groups such as the elderly, children, and people with disabilities |
Table 4.
External Strategic Factor Analysis Summary (EFAS).
| ASPECTS | OPPORTUNITIES | THREATS |
|---|---|---|
| Supporting organisations/resources | O1: Involvement of various agencies, organisations (at the local, national, international), community groups, and individuals O2: Numerous infiltrations of knowledge and visits by international disaster activists to disseminate the latest disaster science O3: The existence of educational and research institutions in the disaster field | T1: Programme overlaps, not sustainable, and there is even the possibility of a blank spot if there is no programme coordination and synergy |
| Geographical Condition | O4: The area is not so abundant with moderately identical geographical characteristics O5: Administratively, it is bordered by Aceh Besar which has relatively high geographic conditions so that it can be utilised as an escape hill | T2: The coastal area is relatively unfavourable due to damage in the upstream area (outside Banda Aceh) T3: Development of the coastal regions that disrupt mangrove forest ecosystems T4: Flooding in downstream (caused by damage in the river at upstream) and increasingly affects the coast of Banda Aceh when the tidal flooding also occurs |
| Demographic and social conditions of the community | O6: Local wisdom values containing DRR O7: Strong social cohesion among the community | T5: Lack of understanding of coastal hazards among new residents (migrants) T6: Lack of public awareness in the use of spatial planning following regional spatial planning (RTRW) T7: The community still owns most of the green open space in Banda Aceh T8: Not all coastal areas have disaster evacuation facilities |
| Regulations/Policies | O8: Governor Regulation No. 43 of 2010 on the Aceh Tsunami Early Warning System O9: Protected areas controlled by the government, including green open spaces which are 10.8% of the total area O10: Tsunami early warning system and evacuation facilities O11: Proper waste management system with a new landfill site is far from the coast O12: Initiation of Disaster Education Qanun (local regulation) O13: Support of various NGOs in advocating for several disaster regulations O14: Central policy to examine government and community preparedness during National Disaster Preparedness Day O15: Village Regulations (reusam) on DRR O16: Plans to build an outer ring city or Banda Aceh Outer Ring Road (BORR) O17: Aceh Province Earthquake and Tsunami Contingency Plans | T9: Public are not confident in the evacuation facility (escape building) T10: Inadequate control over development in coastal areas, resulting in many illegal and unlicensed buildings in coastal areas T11: DRR and CCA efforts are still performed separately even though the two are interrelated T12: Deficiencies in the regulations and policies reinforcements, especially in terms of the transition of the function of green open spaces into a massive development area |
| Political Situation | O18: The political situation is peaceful and conducive to driving DRR efforts | T13: No proper understanding among politicians and bureaucrats |
| Financial | O19: Active participation of the business community for DRR O20: Support and commitment of NGOs in financing disaster programmes O21: PERMENDES (Ministry of Villages Regulation) No. 11 of 2019 on Priority of the Use of Village Funds in 2020, which allows allocation for DRR activities | T14: The allocation of financial support and un-coordinated programmes causes overlapping and repetitive activities (wasteful financial resources) |
Table 5.
SWOT Analysis Matrix.
| IFAS | STRENGTHS | WEAKNESS | |
|---|---|---|---|
| EFAS | |||
| OPPORTUNITIES | STRATEGIES (S-O) | STRATEGIES (W-O) | |
| SO1: BORR construction by adding elevation as a co-benefit structure to reduce the impact of tsunamis (S3, O16) SO2: Provision of land, mangrove planting, mangrove maintenance (S9, O1) | WO1: Construction of escape hill as an evacuation facility and infrastructure for coastal communities (W16, O5) WO2: Improvement of drainage network function as an effort to overcome the impact of tidal flood inundation (W16, O21) WO3: Road widening and upgrading for evacuation route (W10, O4) | ||
| THREATS | STRATEGIES (S-T) | STRATEGIES (W-T) | |
| ST1: Socialization, Training and Simulation/drill on coastal hazards (S4, T5) ST2: Improvement of the Aceh Krueng floodway (S8, T4) ST3: Improved coastal protection function (S17, T12) | WT1: Mainstream information about coastal hazards into existing documents or SOPs (W11, T1) WT2: Integrate policies, data, resources, and programs related to coastal hazards to improve urban resilience (W14, T6) WT3: Procurement and improvement of functional escape buildings (W9, T8) | ||
© 2020 by the authors. Licensee MDPI, Basel, Switzerland. This article is an open access article distributed under the terms and conditions of the Creative Commons Attribution (CC BY) license (http://creativecommons.org/licenses/by/4.0/).
Share and Cite
MDPI and ACS Style
Oktari, R.S.; Syamsidik; Idroes, R.; Sofyan, H.; Munadi, K. City Resilience towards Coastal Hazards: An Integrated Bottom-Up and Top-Down Assessment. Water 2020, 12, 2823. https://doi.org/10.3390/w12102823
AMA Style
Oktari RS, Syamsidik, Idroes R, Sofyan H, Munadi K. City Resilience towards Coastal Hazards: An Integrated Bottom-Up and Top-Down Assessment. Water. 2020; 12(10):2823. https://doi.org/10.3390/w12102823
Chicago/Turabian StyleOktari, Rina Suryani, Syamsidik, Rinaldi Idroes, Hizir Sofyan, and Khairul Munadi. 2020. "City Resilience towards Coastal Hazards: An Integrated Bottom-Up and Top-Down Assessment" Water 12, no. 10: 2823. https://doi.org/10.3390/w12102823
Note that from the first issue of 2016, this journal uses article numbers instead of page numbers. See further details here.