Correction: Jang, D., et al. The Downscaling Study for Typhoon-Induced Coastal Inundation. Water 2020, 12, 1103


Department of Data-Centric Problem-Solving Research, Korea Institute of Science and Technology Information (KISTI), Daejeon 34141, Korea
*
Author to whom correspondence should be addressed.
Water 2020, 12(10), 2914; https://doi.org/10.3390/w12102914
Submission received: 7 September 2020
/
Accepted: 9 October 2020
/
Published: 19 October 2020
(This article belongs to the Section Oceans and Coastal Zones)
The authors wish to make the following corrections to this paper [1]:
1. Change in Main Body Paragraphs
We have recently changed the model for wave condition of KMA-CoWW3 model by Korea Meteorological Administration instead of the Simulating WAve Nearshore (SWAN). CoWW3 model is the most reliable model for the prediction of wave mechanics and is also developed based on the WW3 (WAVEWATCH3) model. WAVEWATCH3 (WAVE-height, WATer depth and Current Hindcasting) is developed at NOAA/NCEP with the WAM model and has being used in the field for the wave forecast. Wave and its components are numerically solved based on the random phase spectral action density balance equation for wavenumber-direction spectra (WW3 manual, 2019). This model used regular grid in a spherical or Cartesian coordinate (optionally). The CoWW3 model was optimized for wave forecasting of Korea based on WW3 by Korea Meteorological Administration (KMA) and has been operated since 2008 in South Korea. Additionally, we excluded the validation contents of the previous model, SWAN because we replaced and used more reliable and currently used models in the field. Therefore, we have also corrected all descriptions and applications about wave simulation in several parts of this paper, as follows:
This downscaling approach applied several numerical models, which are the Weather Research and Forecasting model (WRF) for typhoon simulation, the Finite Volume Community Ocean Model (FVCOM) for tide and surge simulation, and the Simulating Wave Nearshore (SWAN) for wave simulation.
To correct the model description, we would like to make the following corrections:
This downscaling approach applied several numerical models, which are the Weather Research and Forecasting model (WRF) for typhoon simulation, the Finite Volume Community Ocean Model (FVCOM) for tide and surge simulation, and the Coastal Wave Prediction Model (Coastal Wave Watch III-CoWW3) by Korea Meteorological Administration for wave simulation.
Tables 1–3 show the description of the typhoon, surge and wave modeling using Weather Research and Forecasting model (WRF), the Finite Volume Community Ocean Model (FVCOM), and the Simulating Wave Nearshore (SWAN), respectively.
To correct the mode description and exclude the previous model, we would like to make the following corrections:
Tables 1 and 2 show the description of the typhoon, surge and wave modeling using Weather Research and Forecasting model (WRF), the Finite Volume Community Ocean Model (FVCOM), and the Coastal Wave Prediction Model (Coastal WaveWatch III, CoWW3) by the Korea Meteorological Administration which provides the overall results for the meteorological monitoring and prediction in South Korea, respectively [32,33].
Lastly, SWAN computations can be made on a regular, curvilinear grid, and a triangular mesh in a Cartesian or spherical coordinate system. It was developed by Delft University of Technology, and computes random, short-crested wind-generated waves in coastal and inland regions
To correct the model description, we would like to make the following corrections:
Lastly, wave computations by CoWW3, which is developed based on WW3 (WAVEWATCH3), can be made on a regular grid in a Cartesian or spherical coordinate system. WAVEWATCH3 is developed at NOAA/NCEP (National Oceanic and Atmospheric Administration/National Center for Environmental Prediction) with the WAM model, and has been used in the field of wave forecasting. Wave and its components are numerically solved based on the random phase spectral action density balance equation for wavenumber-direction spectra [34–37].
Therefore, to consider the wave-driven effect on downscaling for coastal inundation, we simulated the wave motion using SWAN. Simulated wave height is depicted in Figure 9 with the contour map. Figure 10 shows the verification of wave modeling.
To correct the scientific description and exclude the unnecessary contents about previous model validation in Figure 10, we would like to make the following corrections:
Therefore, to consider the wave-driven effect on downscaling for coastal inundation, we simulated the wave motion using CoWW3 model [32,33]. The simulated wave height is depicted in Figure 9 with the contour map.
These changes have no material impact on the conclusions of our paper. We apologize to our readers.
2. Change in Figures/Tables
The author wishes to make the following correction to this paper [1]. Due to replacement of the wave model, replace:
Figure 1.
Conceptual diagram of analysis system and data processing.

with
Figure 1.
Conceptual diagram of analysis system and data processing.

The author wishes to make the following correction to this paper [1]. Due to re-labeling, replace:
Figure 2.
Model description for simulation of typhoon-induced coastal inundation (AD: Atmosphere Domain, OD: Ocean Domain).
Figure 2.
Model description for simulation of typhoon-induced coastal inundation (AD: Atmosphere Domain, OD: Ocean Domain).

with
Figure 2.
Model description for simulation of typhoon-induced coastal inundation (AD: Atmosphere Domain, OD: Ocean Domain).
Figure 2.
Model description for simulation of typhoon-induced coastal inundation (AD: Atmosphere Domain, OD: Ocean Domain).

The author wishes to make the following correction to this paper [1]. Due to the re-modeling of CoWW3, replace:
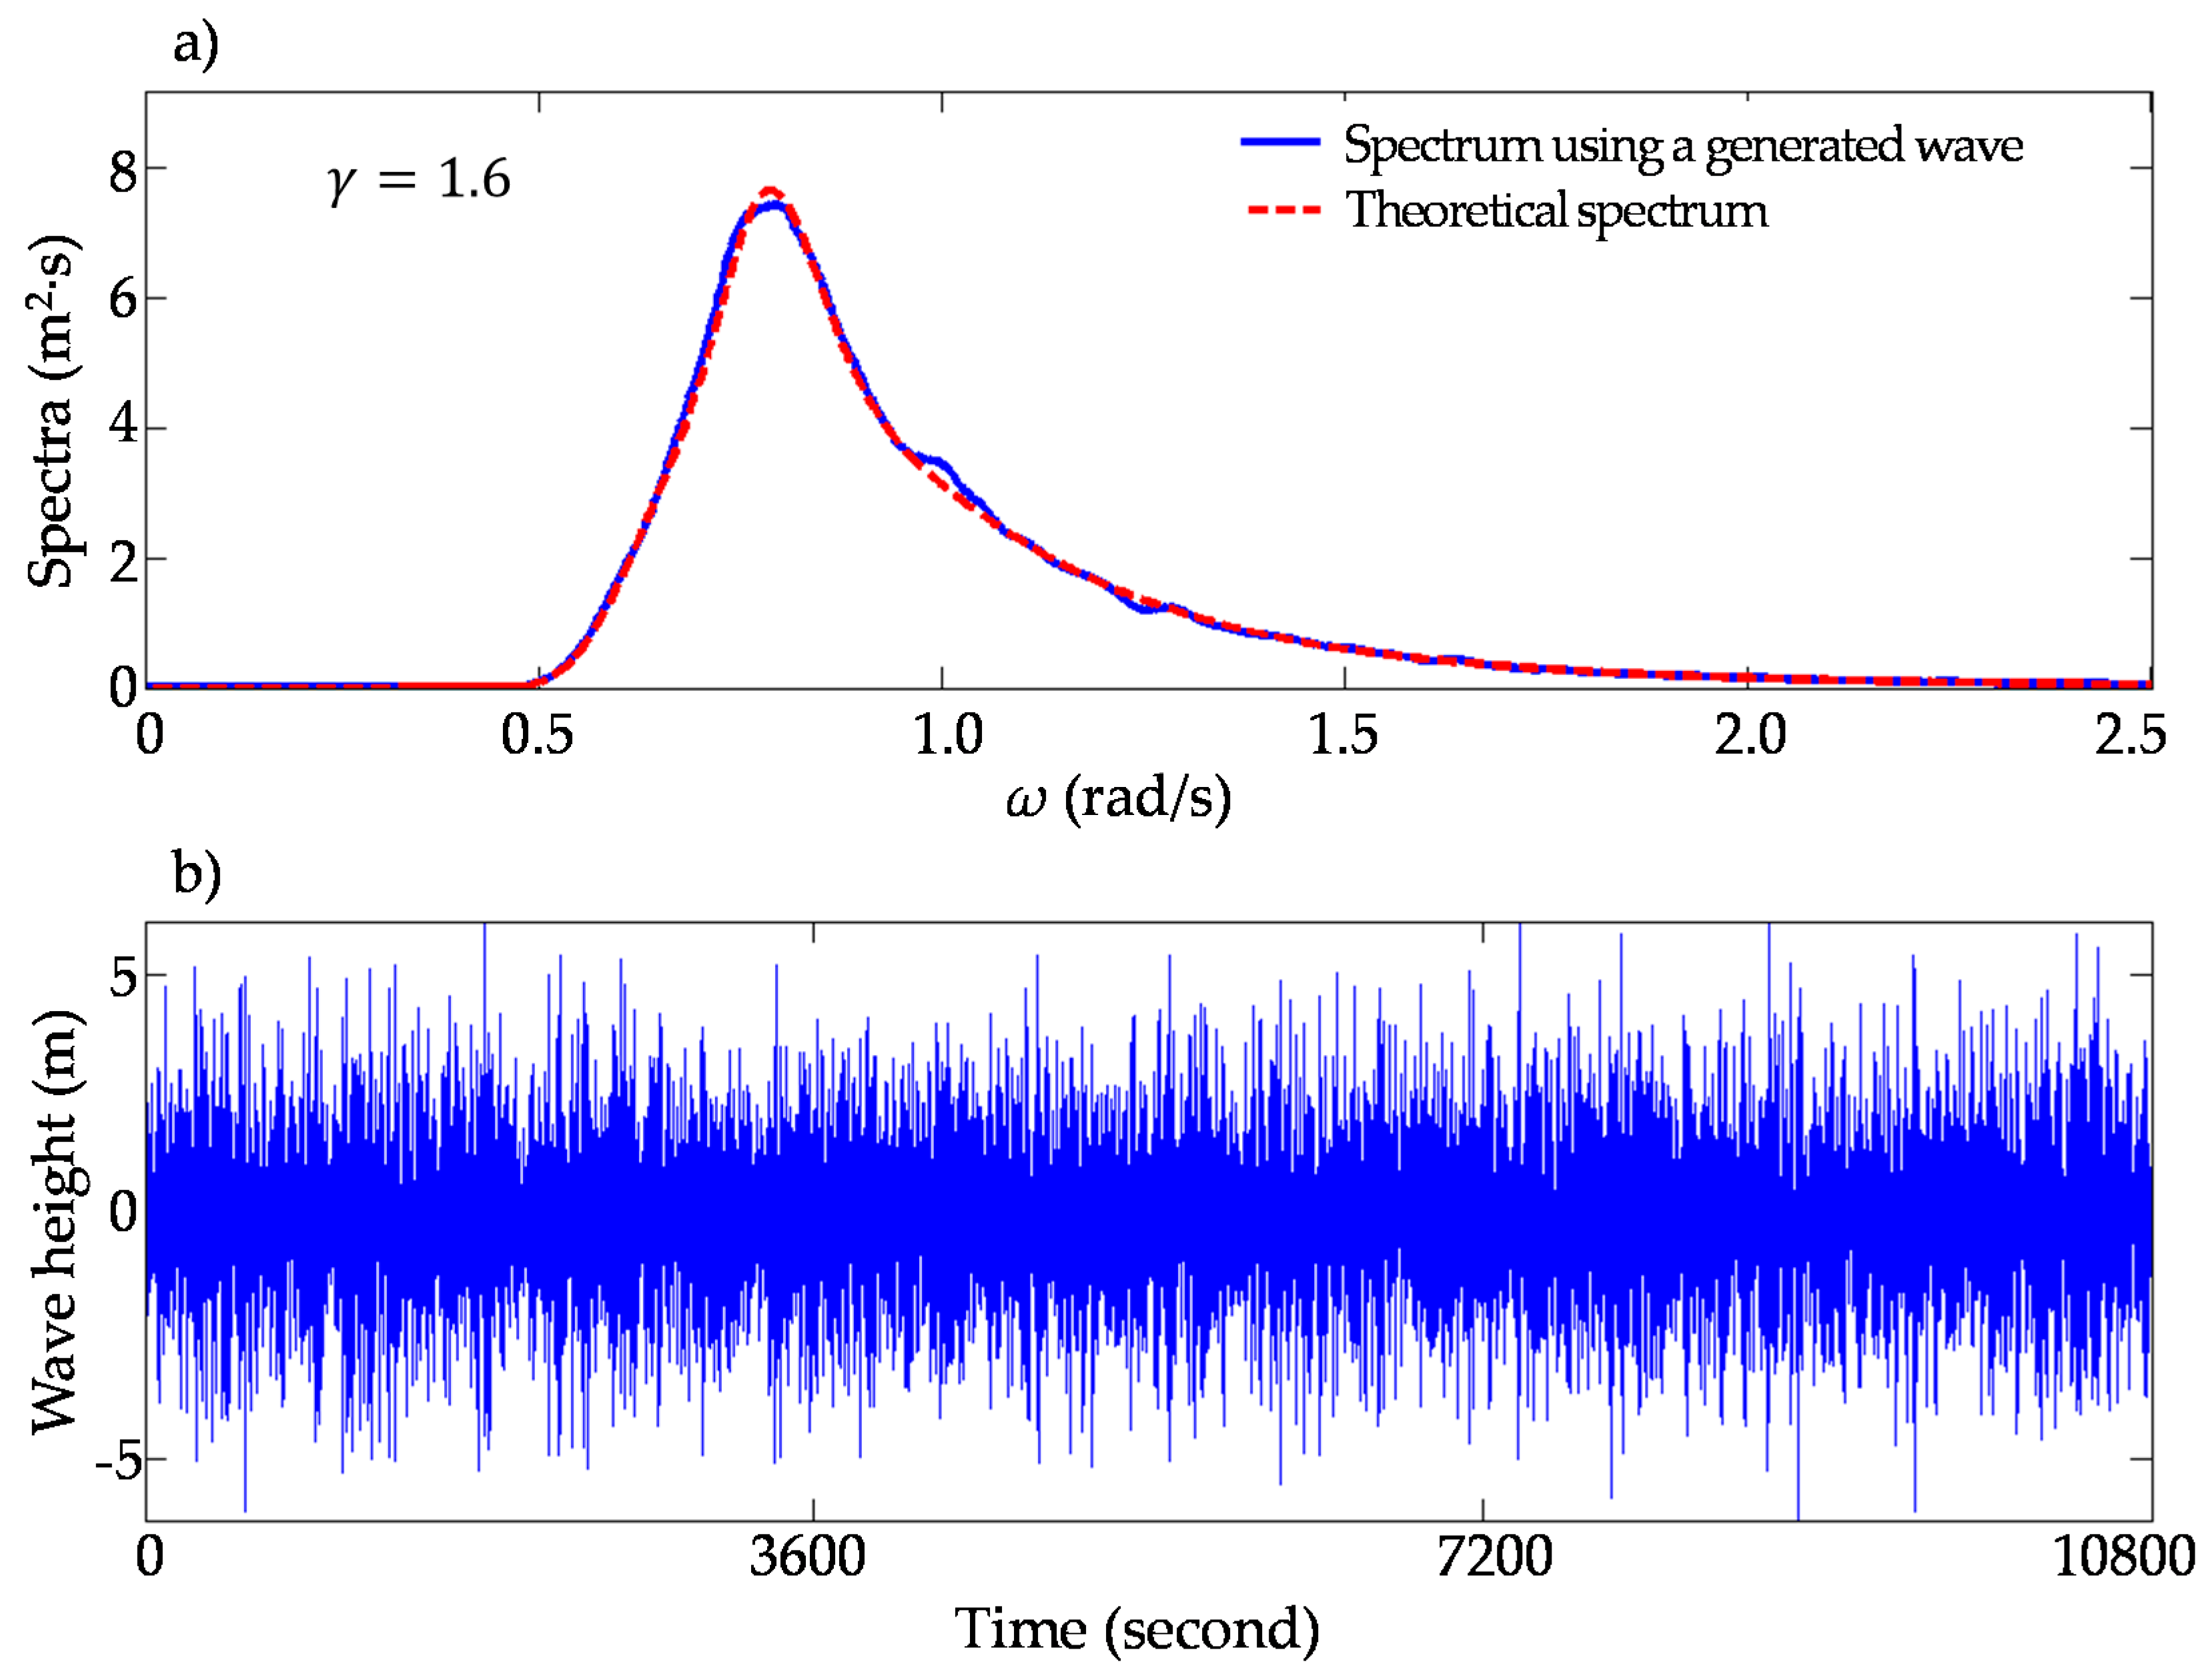
Figure 3.
Comparison of the irregular wave height: (a) comparison between generated wave spectrum and theoretical spectrum, (b) irregular wave height (m) at the node located in the middle of the open boundary line.
Figure 3.
Comparison of the irregular wave height: (a) comparison between generated wave spectrum and theoretical spectrum, (b) irregular wave height (m) at the node located in the middle of the open boundary line.

with
Figure 3.
Comparison of the irregular wave height: (a) comparison between generated wave spectrum and theoretical spectrum, (b) irregular wave height (m) at the node located in the middle of the open boundary line.
Figure 3.
Comparison of the irregular wave height: (a) comparison between generated wave spectrum and theoretical spectrum, (b) irregular wave height (m) at the node located in the middle of the open boundary line.

The author wishes to make the following correction to this paper [1]. Due to the modelling of CoWW3, replace:
Figure 9.
Contour map of simulated significant wave height near the application site.

Figure 10.
Verification of typhoon-induced wave by SWAN (black scatter: observed results; red dashed line: simulated results).
Figure 10.
Verification of typhoon-induced wave by SWAN (black scatter: observed results; red dashed line: simulated results).

with
Figure 9.
Contour map of simulated significant wave height near the application site.

The author wishes to make the following correction to this paper [1]. Due to modelling CoWW3, replace:
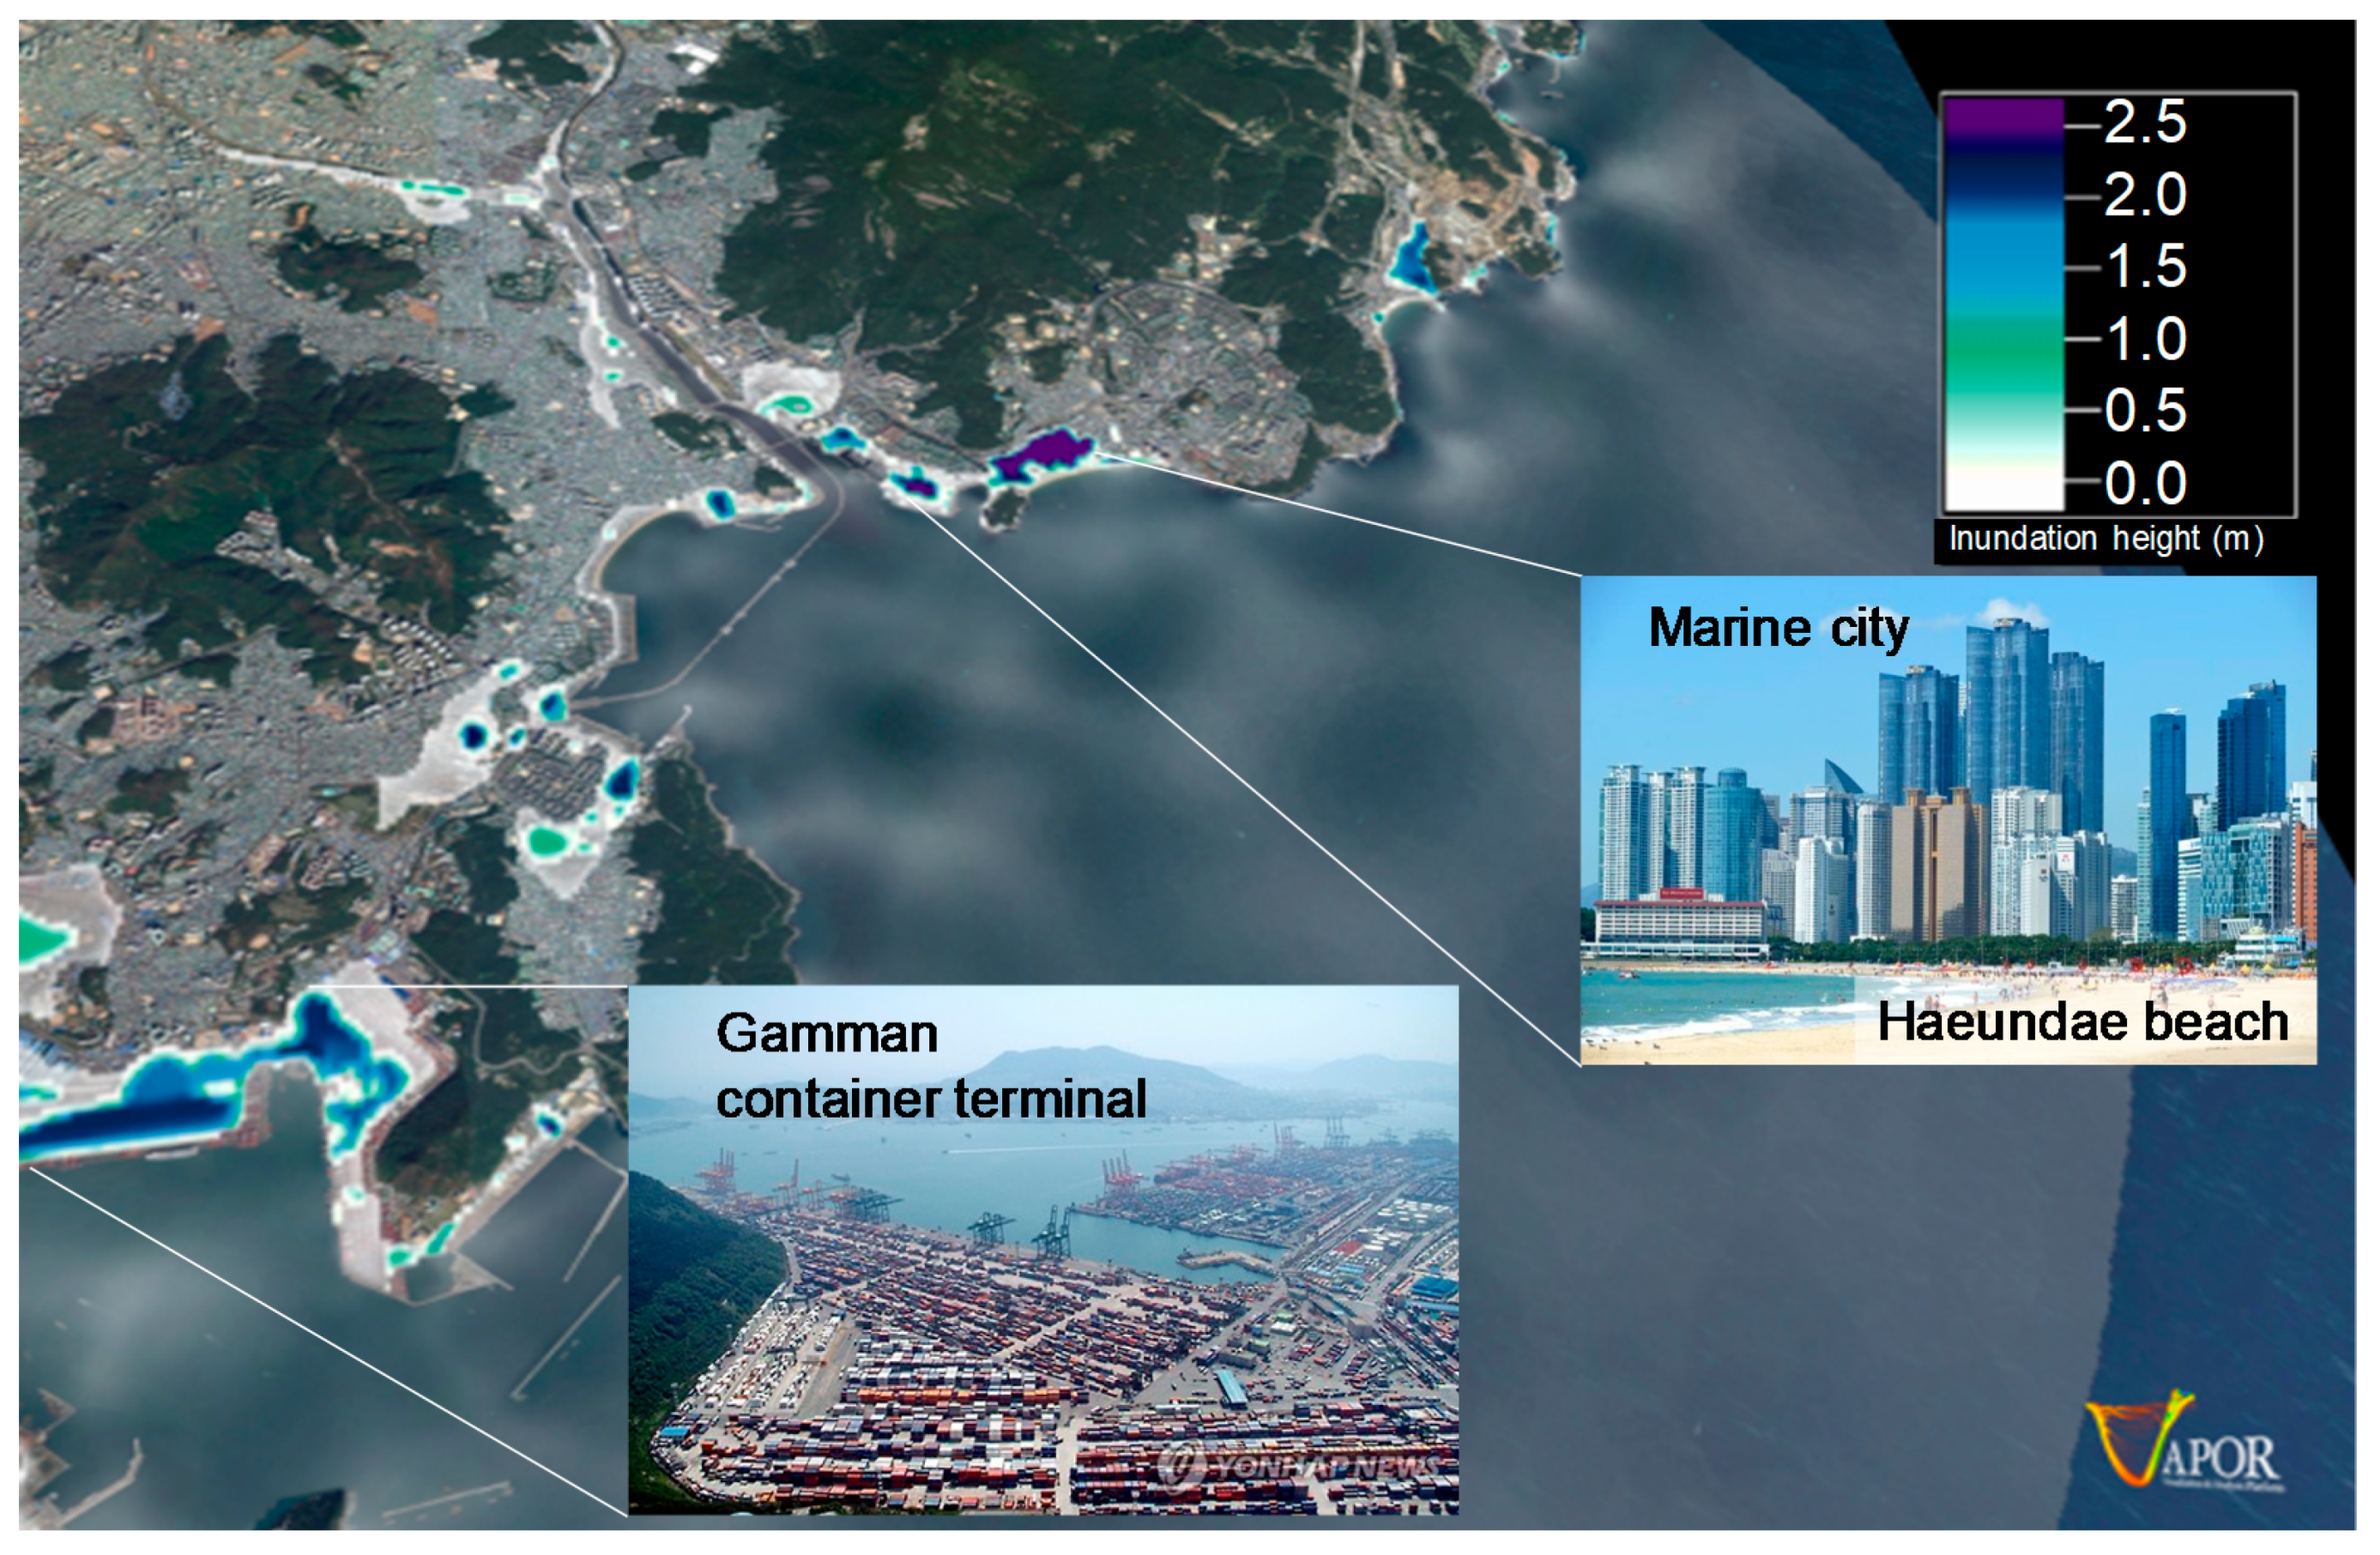
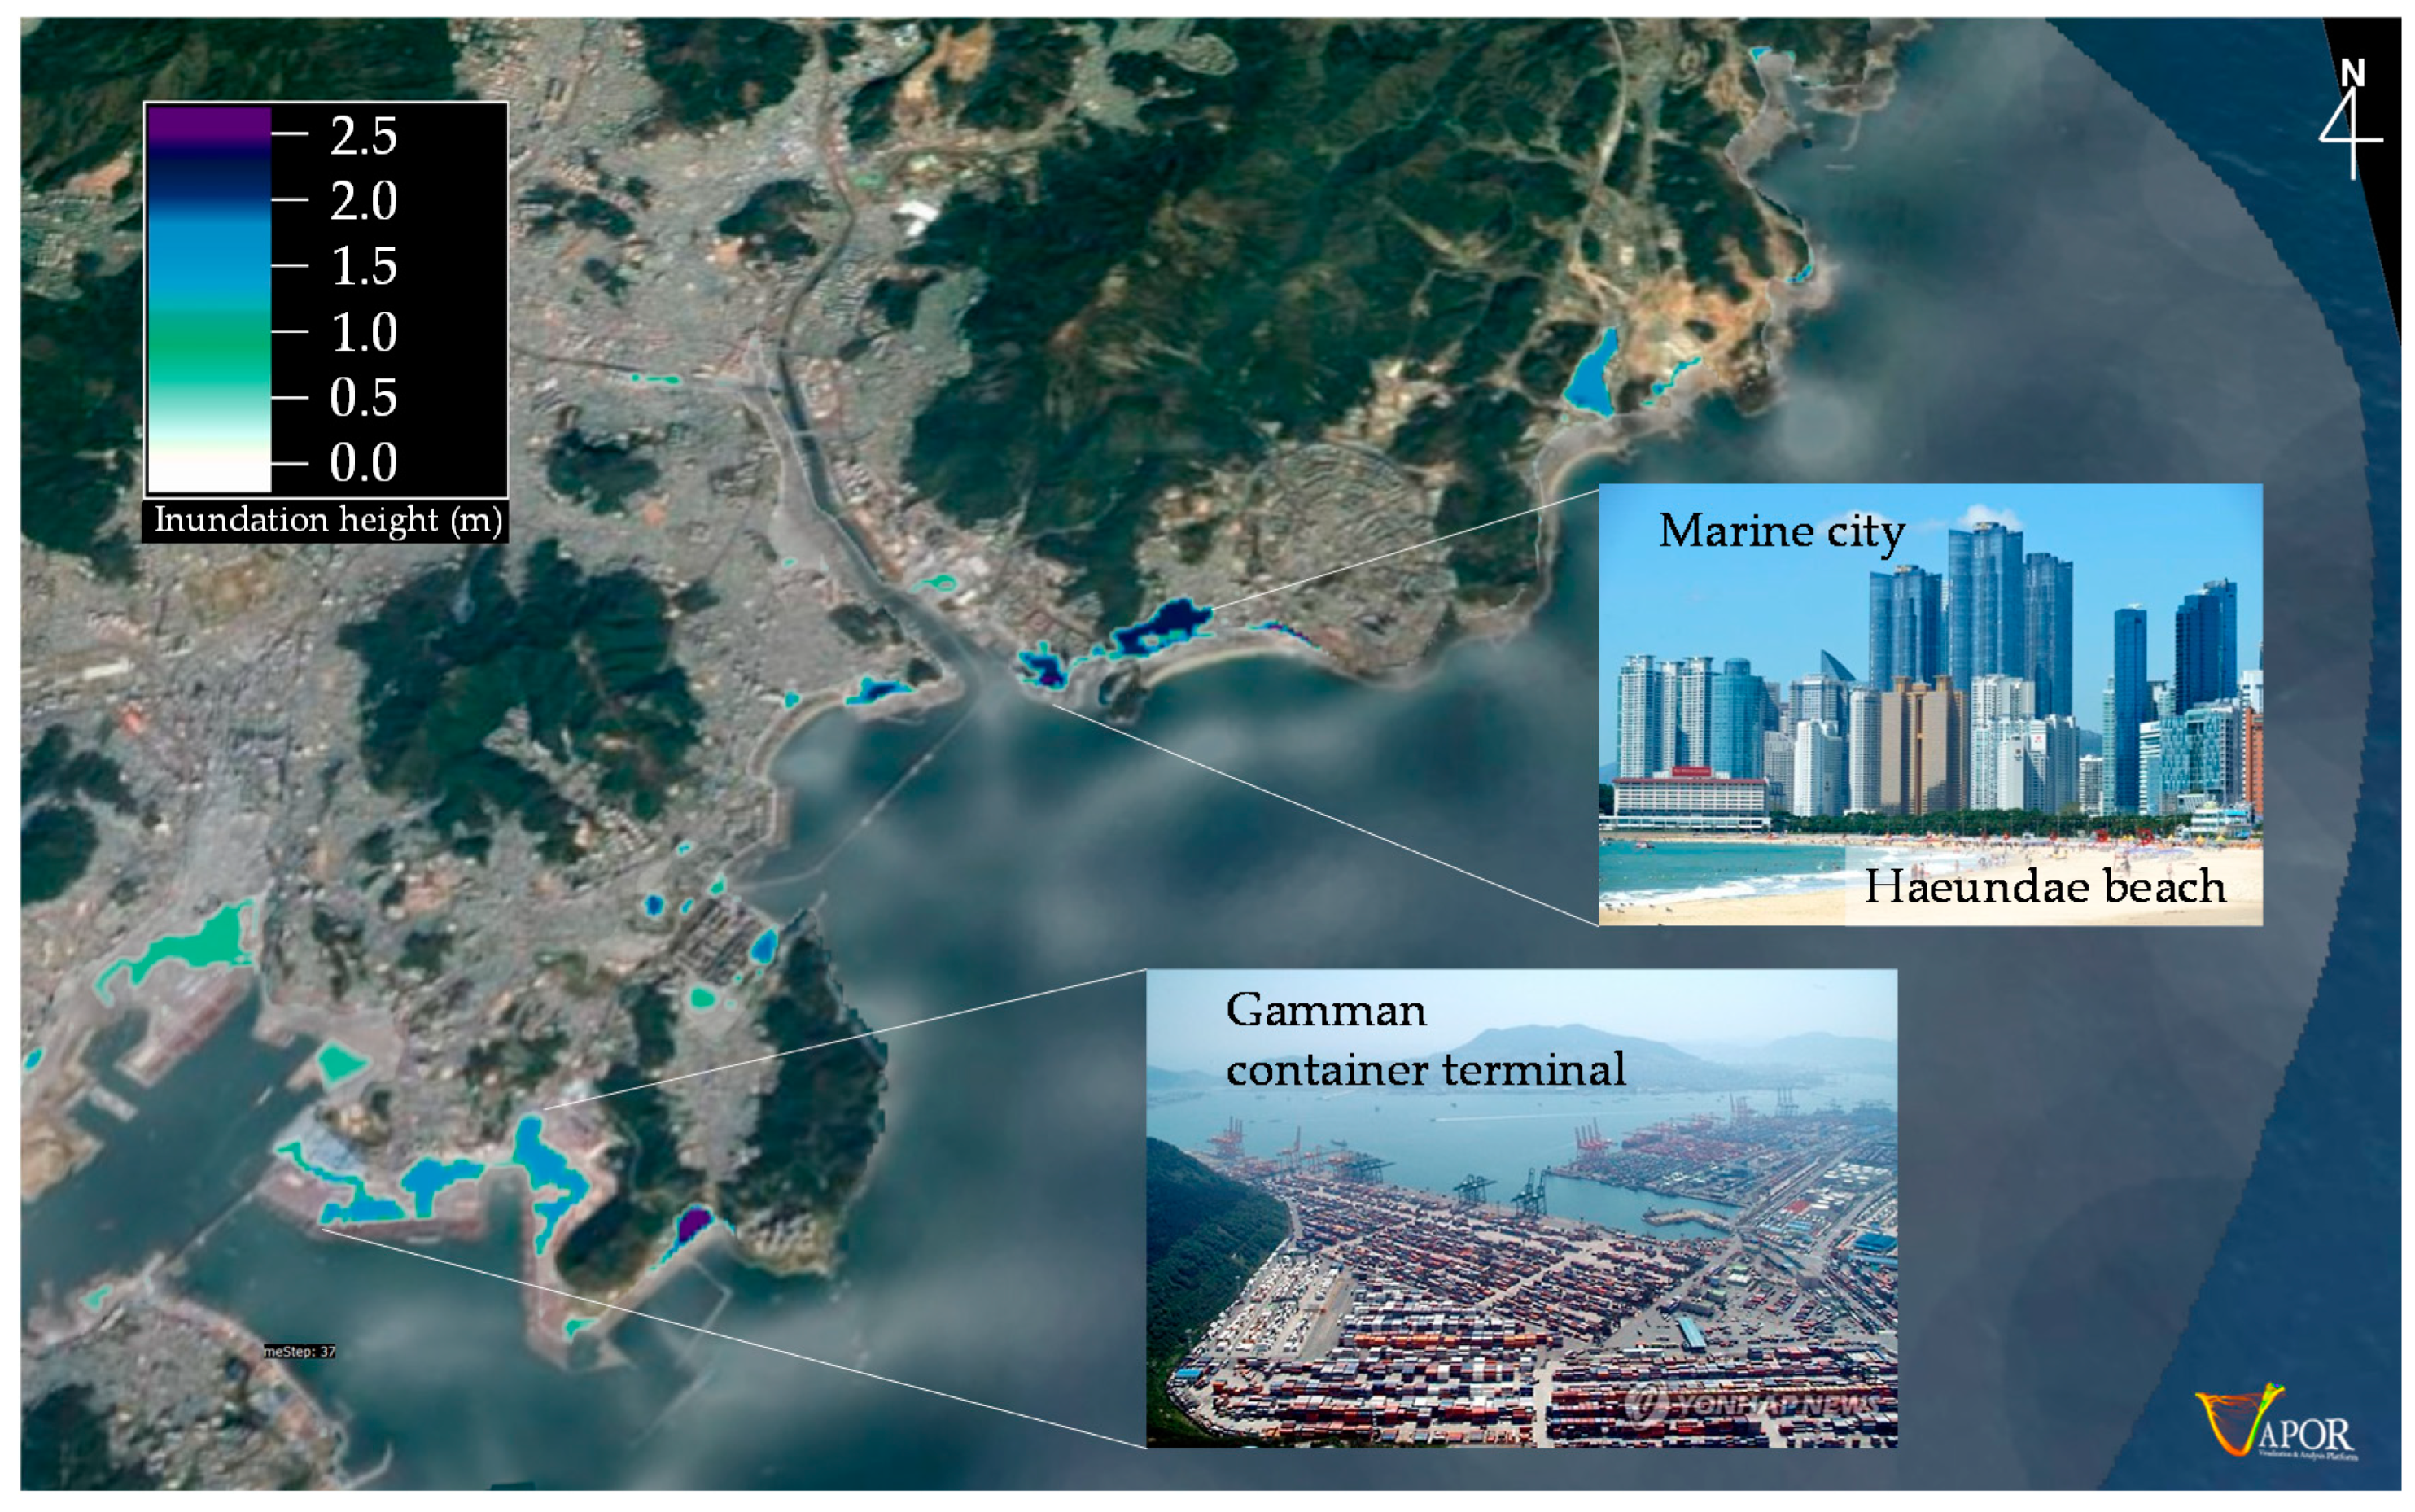
Figure 12.
Visualization of coastal inundation results on the South coast near Busan city.

with
Figure 11.
Visualization of coastal inundation results on the South coast near Busan city.

The authors would like to apologize for any inconvenience caused to the readers by these changes.
All of these changes have no material impact on the conclusions of our paper. We apologize to our readers.
Reference
- Jang, D.; Joo, W.; Jeong, H.-H.; Kim, W.; Park, S.W.; Song, Y. The Downscaling Study for Typhoon-Induced Coastal Inundation. Water 2020, 12, 1103. [Google Scholar] [CrossRef] [Green Version]
Publisher’s Note: MDPI stays neutral with regard to jurisdictional claims in published maps and institutional affiliations. |
© 2020 by the authors. Licensee MDPI, Basel, Switzerland. This article is an open access article distributed under the terms and conditions of the Creative Commons Attribution (CC BY) license (http://creativecommons.org/licenses/by/4.0/).
Share and Cite
MDPI and ACS Style
Jang, D.; Joo, W.; Jeong, C.-H.; Kim, W.; Park, S.W.; Song, Y. Correction: Jang, D., et al. The Downscaling Study for Typhoon-Induced Coastal Inundation. Water 2020, 12, 1103. Water 2020, 12, 2914. https://doi.org/10.3390/w12102914
AMA Style
Jang D, Joo W, Jeong C-H, Kim W, Park SW, Song Y. Correction: Jang, D., et al. The Downscaling Study for Typhoon-Induced Coastal Inundation. Water 2020, 12, 1103. Water. 2020; 12(10):2914. https://doi.org/10.3390/w12102914
Chicago/Turabian StyleJang, Dongmin, Wonkyun Joo, Chang-Hoo Jeong, Wonsu Kim, Sung Won Park, and Yoojin Song. 2020. "Correction: Jang, D., et al. The Downscaling Study for Typhoon-Induced Coastal Inundation. Water 2020, 12, 1103" Water 12, no. 10: 2914. https://doi.org/10.3390/w12102914
Note that from the first issue of 2016, this journal uses article numbers instead of page numbers. See further details here.