Article

Performance Analysis for the Anaerobic Membrane Bioreactor Combined with the Forward Osmosis Membrane Bioreactor: Process Conditions Optimization, Wastewater Treatment and Sludge Characteristics

1
Marine College, Shandong University, Weihai 264209, China
2
State Key Laboratory of Urban Water Resources and Water Environment, School of Marine Science and Technology, Harbin Institute of Technology at Weihai, Weihai 264200, China
3
Key Laboratory of Groundwater Resources and Environment (Ministry of Education), Jilin University, Changchun 130021, China
4
School of Environmental Science and Engineering, Sun Yat-Sen University, Guangzhou 510275, China
*
Authors to whom correspondence should be addressed.
Water 2020, 12(11), 2958; https://doi.org/10.3390/w12112958
Submission received: 16 September 2020 / Revised: 18 October 2020 / Accepted: 20 October 2020 / Published: 22 October 2020
(This article belongs to the Special Issue Enhancement of Anaerobic Digestion for Energy and Resource Recovery)

Abstract

:
The anaerobic membrane bioreactors (AnMBR) were operated at 35 °C (H-AnMBR) and 25 °C (L-AnMBR) for long-term wastewater treatment. Two aerobic forward osmosis membrane bioreactors (FOMBRs) were utilized to treat the effluents of H-AnMBR and L-AnMBR, respectively. During the 180 days of operation, it is worth noting that the combined system was feasible, and the pollutant removal efficiency was higher. Though the permeate chemical oxygen demand (COD) of H-AnMBR (18.94 mg/L) was obviously lower than that of L-AnMBR (51.09 mg/L), the permeate CODs of the FOMBRs were almost the same with the average concentrations of 7.57 and 7.58 mg/L for the H-FOMBR and L-FOMBR, respectively. It was interesting that for both the AnMBRs, the permeate total nitrogen (TN) concentration was higher than that in bulk phase. However, the TN concentrations in the effluent remained stable with the values of 20.12 and 15.22 mg/L in the H-FOMBR and L-FOMBR effluents, respectively. For the two systems, the characteristics of activated sludge flocs were different for H-AnMBR-FOMBR sludge and L-AnMBR-FOMBR sludge. The viscosity of L-AnMBR-activated sludge (2.09 Pa·s) was higher compared to that of H-AnMBR (1.31 Pa·s), while the viscosity of activated sludge in L-FOMBR (1.44 Pa·s) was a little lower than that in H-FOMBR (1.48 Pa·s). The capillary water absorption time of L-AnMBR-activated sludge (69.6 s) was higher compared to that of H-AnMBR (49.5 s), while the capillary water absorption time of activated sludge in L-FOMBR (14.6 s) was little lower than that in H-FOMBR (15.6 s). The particle size of H-AnMBR-activated sludge (119.62 nm) was larger than that of L-AnMBR-activated sludge (84.92 nm), but the particle size of H-FOMBR-activated sludge (143.81 nm) was significantly smaller than that of L-FOMBR-activated sludge (293.38 nm). The observations of flocs indicated that the flocs of activated sludge in H-AnMBR were relatively loose, while the flocs of L-AnMBR were relatively tight. The fine sludge floc was less present in the L-FOMBR than in the H-FOMBR. Therefore, in the process of sewage treatment, the influent of each unit in the AnMBR-FOMBR system should have suitable organic content to maintain the particle sizes of sludge flocs.

1. Introduction

In recent years, anaerobic membrane bioreactors (AnMBRs) have attracted much attention due to their advantages for wastewater treatment [1]. It had been reported that the combination of membrane separation technology and an anaerobic bioreactor may allow for municipal wastewater treatment with the benefits of lower sludge production and net energy production, without the extra costs for aeration [2]. Anaerobic processes can work under different temperature conditions, and temperature is one of the most important process variables in anaerobic digestion systems [3].
Generally, the activities of microorganisms in a biological process decrease when the temperature decreases, which consequently results in decreases in the chemical oxygen demand (COD) removal efficiencies. Besides its effect on the metabolic activities of the microbial population, temperature has a profound effect on factors such as biogas solubility, the solubility of (in)organic compounds and the settling characteristics of the biological solids [4]. However, a key problem is the need to treat municipal wastewater without heating, and the implementation of AnMBRs in municipal wastewater treatment at ambient temperature is technically feasible, which is defined as temperatures of 5–30 °C [3]. Martinez-Sosa et al. reported that the COD removal efficiencies close to 90% were achieved at both 35 °C and 20 °C, and the bioreactor temperature impacted methane recovery in an AnMBR treating municipal wastewater [5].
However, a certain level of post-treatment is required, since AnMBR effluents do not comply with the nutrient (i.e., nitrogen and phosphorus) discharge limits [6,7]. The reason for the low removal of nitrogen and phosphorus is that both of nitrogen and phosphorus removal processes needed anoxic and aerobic zones [8]. It should be noted that the concentrations of nutrients in AnMBR effluents are typically higher than in their influents as a result of organic matter degradation [9]. Therefore, in most cases, this means that the post treatment is required if the effluent is to be reclaimed. The combination of AnMBRs with conventional biological treatment technologies will face challenges due to the low COD: N and COD: P ratios.
Forward osmosis (FO) has been recognized as a promising technology for wastewater reclamation and seawater desalination [10]. Recent research effort has been focused on development of FOMBR [11,12], which is a combination of a conventional MBR with a high retention forward osmosis (FO) membrane [13]. The FOMBR makes use of osmotic pressure. Where an osmotic draw solute causes water movement across a selectively permeable membrane driven by the difference in osmotic pressures across the membrane. It has been reported that the first publication on FOMBR appeared in 2008 [12] and subsequently more and more studies had been investigated [11,14,15,16,17]. The FOMBR could provide a path to resolving this challenge of AnMBR effluent due to the low COD: N and COD: P ratios, since the FO process can almost totally reject N and P contaminants.
The anaerobic membrane bioreactors (AnMBRs) were operated with the temperatures of 35 °C and 25 °C, respectively, for long-term wastewater treatment, and two aerobic forward osmosis membrane bioreactors (FOMBRs) were operated with direct feeds of effluent from the AnMBRs. Therefore, the objective of this research was to evaluate the performances of the combinations of AnMBRs and FOMBRs: (1) optimize AnMBR and FOMBR operation parameters; (2) assess the gas and volatile fatty acid (VFA) generation in different temperature conditions; (3) investigate the efficiencies of wastewater treatment for AnMBR and FOMBR; and (4) analyze sludge characteristics of the AnMBR and FOMBR. On this basis, a new combination approach for effective wastewater treatment and energy recovery is proposed.

2. Materials and Methods

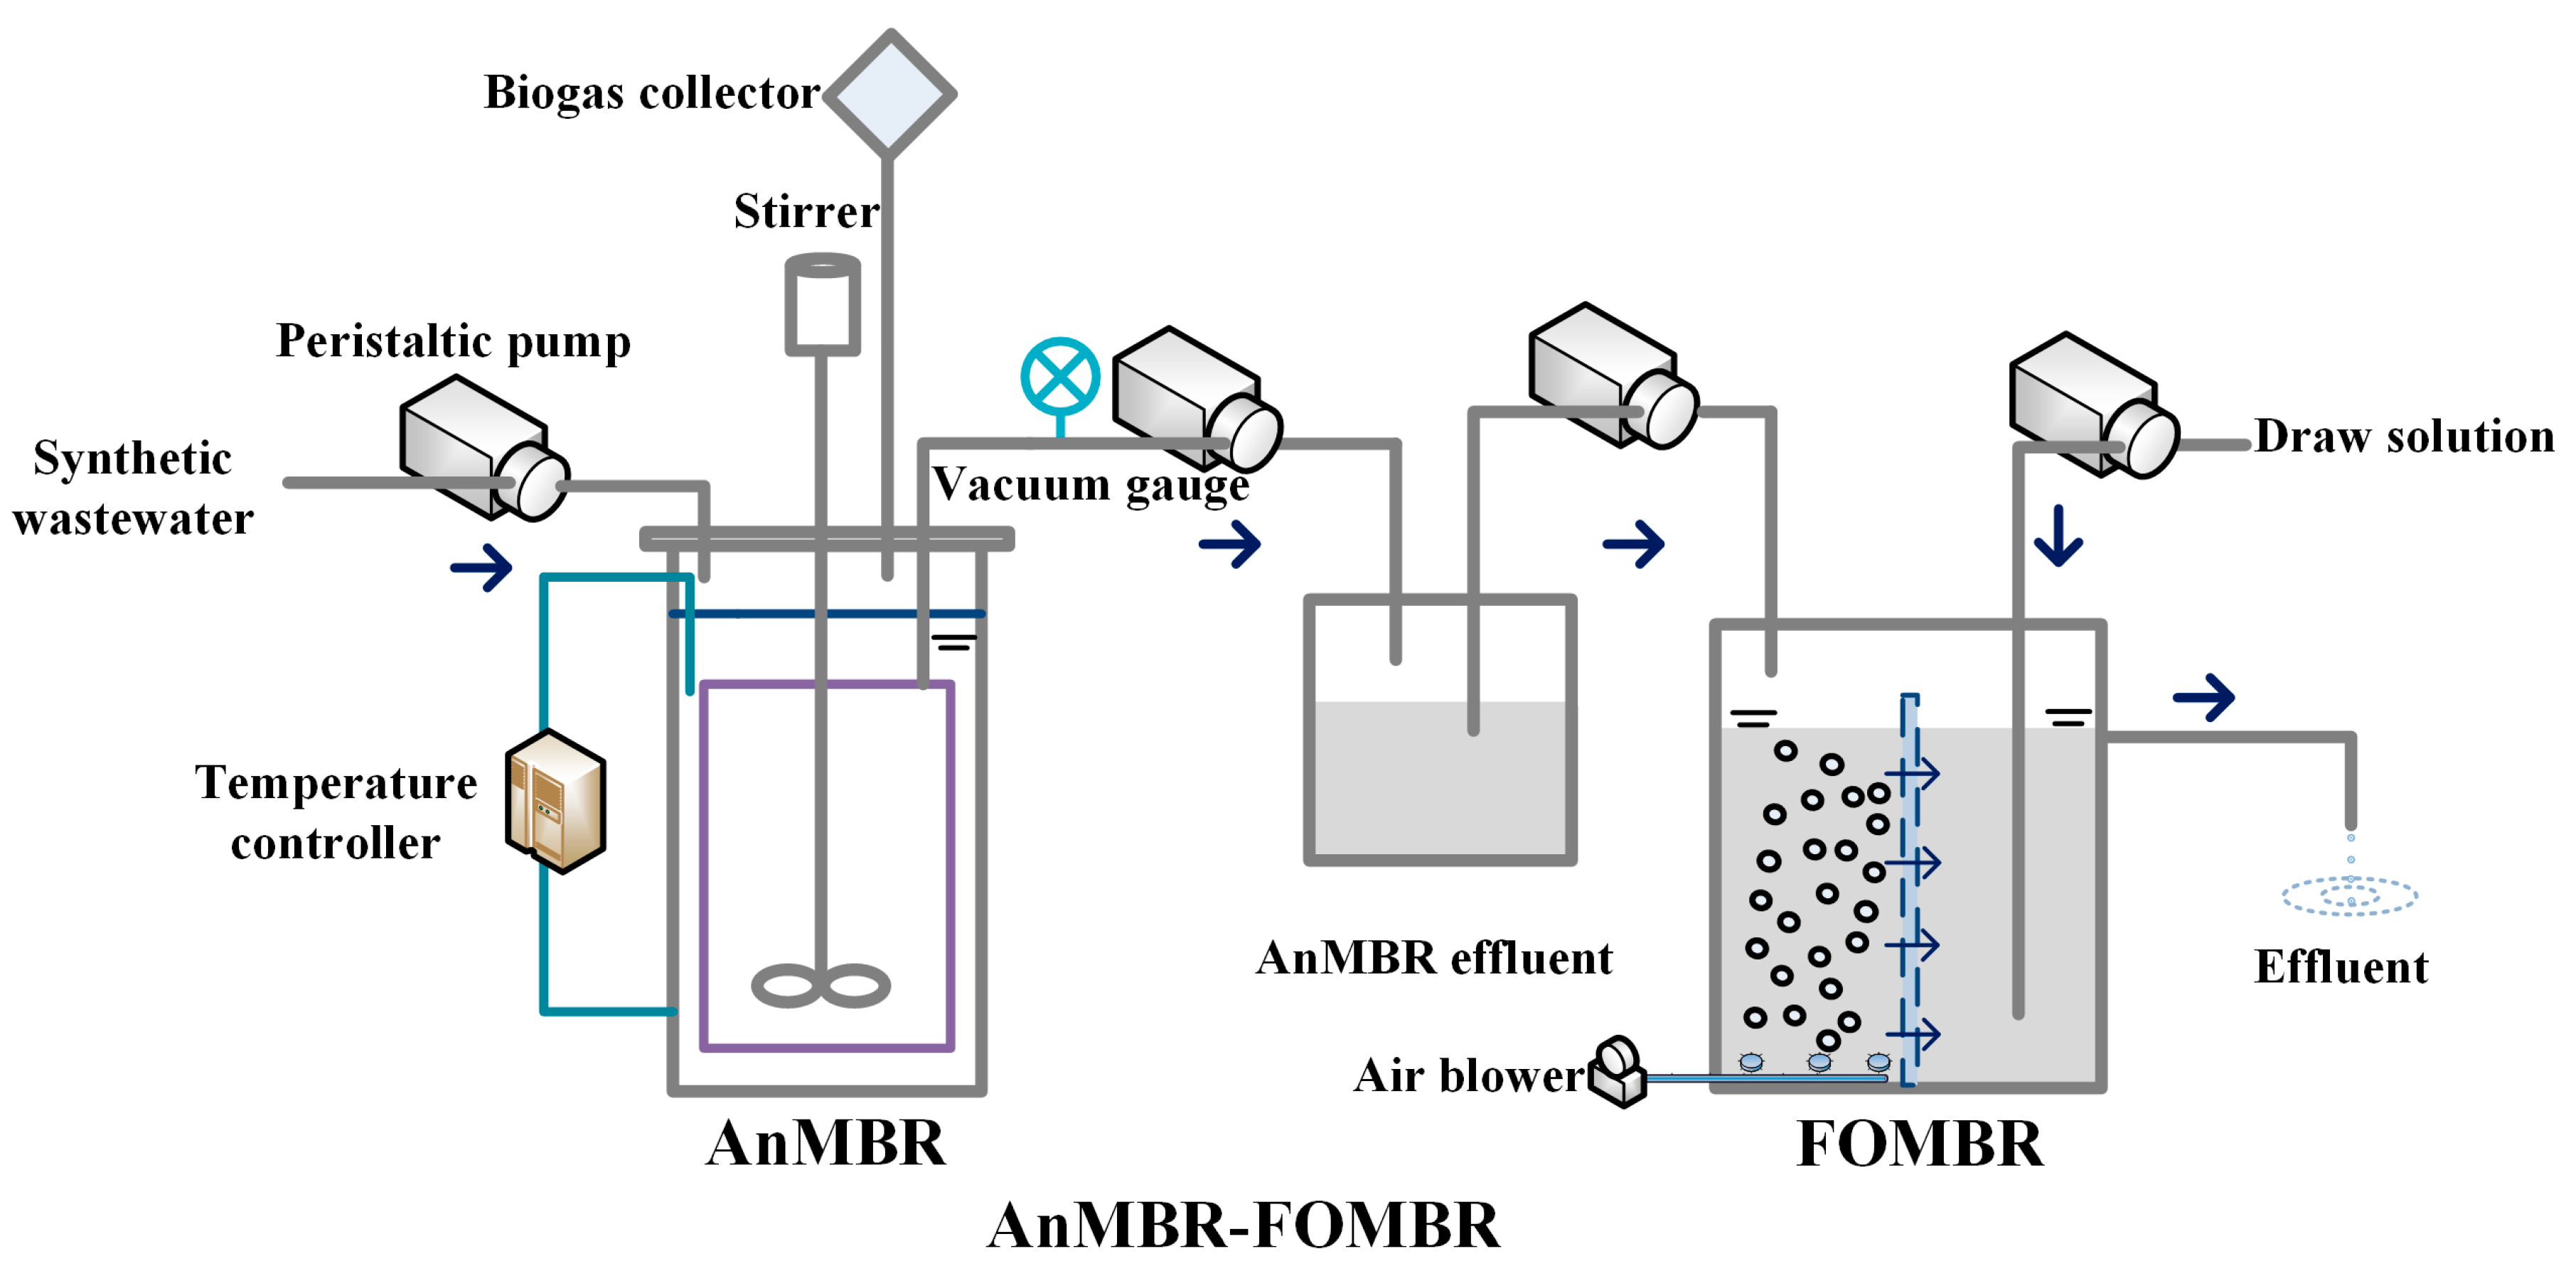
2.1. Experimental Set-Up of AnMBR-FOMBR

The experimental set-up of submerged AnMBR is shown in Figure 1. The two same AnMBRs were employed in this study and were operated at 35 °C (H-AnMBR) and 25 °C (L-AnMBR), respectively, and the effluents of the two anaerobic MBRs flowed into two aerobic FOMBRs (denoted as H-FOMBR and L-FOMBR), respectively.
The cylindrical AnMBR was made of polymethyl methacrylate with an effective volume of 8.0 L. The AnMBR was installed with a circle submerged hollow fiber microfiltration (MF) membrane module, which was made of polyvinylidene fluoride (PVDF) with a nominal pore size of 0.22 μm and an effective surface area of 0.2 m2 (Motian, Tianjin, China). The effluent pump and water level controller were controlled by an autocontrol system. The bioreactor temperature was maintained by an electric heater and controlled at scheduled temperatures by a thermostatic controller. The transmembrane pressure (TMP) was recorded by a vacuum meter (YB150, Yangquan, China).
The FOMBR was rectangular (L 300 mm × W 50 mm × H 400 mm) with effective volume of 2.4 L and with a flat-sheet membrane module made of cellulose triacetate (CTA) membranes (Hydration Technologies Inc.). An air diffuser was fixed at the bottom of biological reaction tank for aeration to scour the membrane surface.

2.2. Feed and Operating Conditions

A synthetic wastewater simulating municipal wastewater was used as feed water for the AnMBR according to previous study [18]. Activated sludge sampled from a local municipal wastewater treatment plant was used as inoculum for the MBRs. The biogas production was monitored with a water displacement gas collector at ambient temperature (23–25 °C). The biogas yield values were corrected to standard conditions (1 atm, 0 °C).

2.3. Analytical Methods

The COD, sludge concentration (MLSS), volatile solid concentration (MLVSS) and sludge volume index (SVI) were determined according to standard methods [19]. The dissolved oxygen (DO) concentrations (TriOxmatic 160R, WTW, München, Germany) in the aeration tank were monitored. The total nitrogen (TN) concentration was measured by a total organic carbon (TOC) analyser (TOC-5000A, Shimadzu, Kyoto, Japan). Biogas produced from reactors was captured continuously in gas bags from the headspace of the reactor. The gas composition was analyzed by gas chromatography (Model SC-7, Shandong Lunan Instrument Factory, Zaozhuang, China). The volatile fatty acids (VFAs) were measured by gas chromatography (GC 7890, Agilent, Wilmington, DE, USA) equipped with a flame ionization detector (FID). The capillary water absorption time (CST) was measured by instrument (TYPE 304M, Triton Electronics, Essex, UK). Viscosity of the mixed liquor in the system was also monitored using a viscosity meter (Brookfield, Model LVDV-E, Middleboro, MA, USA). All the above analyses were conducted in triplicate, and their average values were reported. Particle size distribution (PSD) was analyzed through a Mastersizer 2000 coupled to Hydro 2000SM (A) with a detection range of 0.02–2000 μm (Mastersizer 2000, Malverin, UK). The sludge floc morphology was investigated by microscopy (BX51, Olympus, Japan) and the images were obtained. Scanning electron microscope (SEM) micrographs were captured by a Hitachi S-3000N SEM (Tokyo, Japan).

3. Results and Discussion

3.1. Optimization of Process Conditions for the AnMBR and the FOMBR

3.1.1. Optimization of the AnMBR’s Operational Conditions

Generally, the selection of operation parameters should be considered before the start-up and operation of MBR. According to the objective of this project, the parameters that needed to be optimized in this study were as follows: membrane module configuration, mixing speed, suction and pause time and hydraulic retention time (HRT). Taking COD removal efficiency as the main reference through the experiment, the operation parameters were optimized, as shown in Table 1. Meanwhile, the change of membrane pressure (TMP) was observed.
The treatment efficiencies of AnMBRs with curtain membrane modules, flat sheet membrane modules and circular membrane modules designed in this study were compared. It was found that the treatment efficiencies of AnMBRs with flat sheet membranes and curtain membranes were not much different from those with the designed circular membrane module, but the change of TMP was different. The TMP transition of an AnMBR with curtain membrane occurred after 25 days of operation, and the TMP transition of an AnMBR with flat sheet membrane occurred after 30 days of operation. However, the TMP of an AnMBR with ring membrane module did not change during 30 days of operation with the value of 0.25 kPa, so the design of ring membrane module was conducive to delaying membrane fouling.
The anaerobic membrane bioreactor designed in this study was equipped with an agitator. The purpose was to use the agitator to completely mix the mixed liquid in the reactor, and at the same time use cross flow to wash the sludge deposited on the membrane surface to delay membrane pollution. However, high stirring speed would affect the aggregation of sludge flocs, and low stirring speed would lead to sludge deposition on the membrane surface, resulting in membrane fouling. Through the change of TMP observed in the experiment, it was found that the stirring speed was suitable to be controlled at 150 rpm.
The water was discharged in the pressure-driven membrane bioreactor by external pressure. Generally speaking, the peristaltic pump was used in the laboratory-scale membrane bioreactor to pump water with intermittent operation. The suction and pause mode of the aerobic membrane bioreactor was generally 8 min on/2 min off. Due to the large viscosity and the small particle size of anaerobic sludge, membrane fouling was easy to occur. In the experiment, the suction and pause mode was 8 min on/2 min off, 4 min on/1 min off and 7 min on/3 min off, respectively.
It was found that the three suction and pause modes had little effect on the COD removal efficacies, but it was obviously observed that when the suction and pause mode was 8 min on/2 min off, the TMP increased rapidly. When the suction and pause mode was 4 min/1 min, the TMP increased most slowly, so the stop time ratio was 4 min on/1 min off in the subsequent experiments.
Since the biomass was retained when the anaerobic membrane bioreactor was operated at any temperature, the sludge retention time (SRT) and HRT in the membrane bioreactor were separated [4]. Baek et al. indicated that at 32 °C, with an HRT of 12–24 h and an SRT of more than 200 days, the anaerobic membrane bioreactor was used to treat the effluent from the sedimentation tank to obtain high quality effluent [20]. Further, high SRTs help micro-organisms to adapt to the different compounds present in industrial wastewaters, many of which can be difficult to biodegrade [21]. In this study, due to the slow growth of anaerobic activated sludge, SRT was maintained at 150, 300 and 450 days, respectively. Comparing the treatment efficiencies of different SRTs in the anaerobic membrane bioreactor, it was found that the treatment efficiency was lower at the SRT of 150 days. Due to the slow growth of the activated sludge in the anaerobic process, the short SRT would have resulted in a lower sludge concentration in the reactor. The longer SRT (450 days) would have made the sludge flocs in the system disintegrate, and cause the sludge viscosity to increase, resulting in the membrane fouling intensification. Therefore, the SRT was maintained at 300 days in the following experiment.
The pH of the mixed liquid in the anaerobic membrane bioreactor had effects on the properties of the anaerobic sludge and the activity of the microorganism. In order to prevent the over-acidification of the reactor, and to make the hydrogenic and methanogenic bacteria and other microorganisms in the reactor survive in the appropriate pH range, the anaerobic reactor was generally controlled at the pH of 6.8–7.5. In this study, a pH probe was used to monitor the pH in the reactor at any time, and the pH in the reactor was controlled at 7.0–7.3.
To sum up, the operational parameters of the anaerobic membrane bioreactor determined by the experiment were as follows: the circular membrane module, the stirring speed of 150 rpm, the suction and pause mode of 4 min on/1 min off, the SRT of 300 days and the pH of 7.0–7.3.

3.1.2. Optimization of the FOMBR’s Operational Conditions

Before the establishment of the combined system, the operation parameters of the forward osmosis membrane bioreactor were optimized. The parameters to be optimized included the orientation of the active layer of the forward osmosis membrane (including the active layer towards the reaction pool side and the active layer towards the driving pool side), the concentration of dissolved oxygen, SRT, the species of draw solution and the concentration of draw solution. The operation parameters were determined by taking the membrane fouling cycle as the main reference, and the long period of membrane fouling indicated that the selected parameters were suitable for operation. The optimized operation parameters are shown in Table 2.
As shown in Table 2, the type of draw solution had effects on the driving force and the permeate flux. At the same time, the selection of draw solution also needed to consider economic factors and membrane fouling. In the experiment, it was found that the membrane fouling cycle with MgCl2 as the draw solution was short, which was caused by the reverse diffusion of MgCl2 to the side of reaction tank. The membrane fouling was enhanced by cross-linking of organic matter by the complexation of divalent cations, while the membrane fouling caused by reverse diffusion of sodium ions was weak. At the same time, the cost of MgCl2 was more than that of NaCl; therefore, NaCl solution was selected in this study as the draw solution. It can be seen from the table that the period of membrane fouling with the active layer to the side of the reaction pool was longer than that with the active layer to the side of the driving pool. At the same time, the surface of the active layer was smoother than that of the supporting layer, and the sludge was not easy to deposit. Therefore, in this study, the active layer was selected to be placed towards the side of the reaction pool.
Dissolved oxygen was an important factor affecting the biological activity. At the same time, aeration could wash the sludge deposited on the membrane surface and make the sludge completely mixed in the reactor. The experimental results showed that it was suitable to control the dissolved oxygen at 2.5 mg/L in the FOMBR. The phenomenon of reverse osmosis with salt in the reaction tank inhibited the activity of microorganisms and reduced the growth of activated sludge; meanwhile, the membrane fouling rate of short SRT was faster than that of long SRT. In this study, the SRT was maintained at 80 days. The concentration of the draw solution had effects on the driving force and the permeate water yield. The high concentration of the draw solution increased the driving force, but the increase of the salt reverse osmosis also caused the concentration polarization phenomenon and accelerated the membrane fouling rate. Compared with the draw solution concentration of 2 mol/L, the membrane fouling cycle was longer with the draw solution concentration of 1 mol/L.
To sum up, the operational parameters of the FOMBR in this study were as follows: the active layer of the membrane towards the side of the reactor, the dissolved oxygen concentration of 2.5 mg/L, the SRT of 80 days and the draw solution of 1 mol/L NaCl solution.

3.2. Biogas Production and VFA Generation

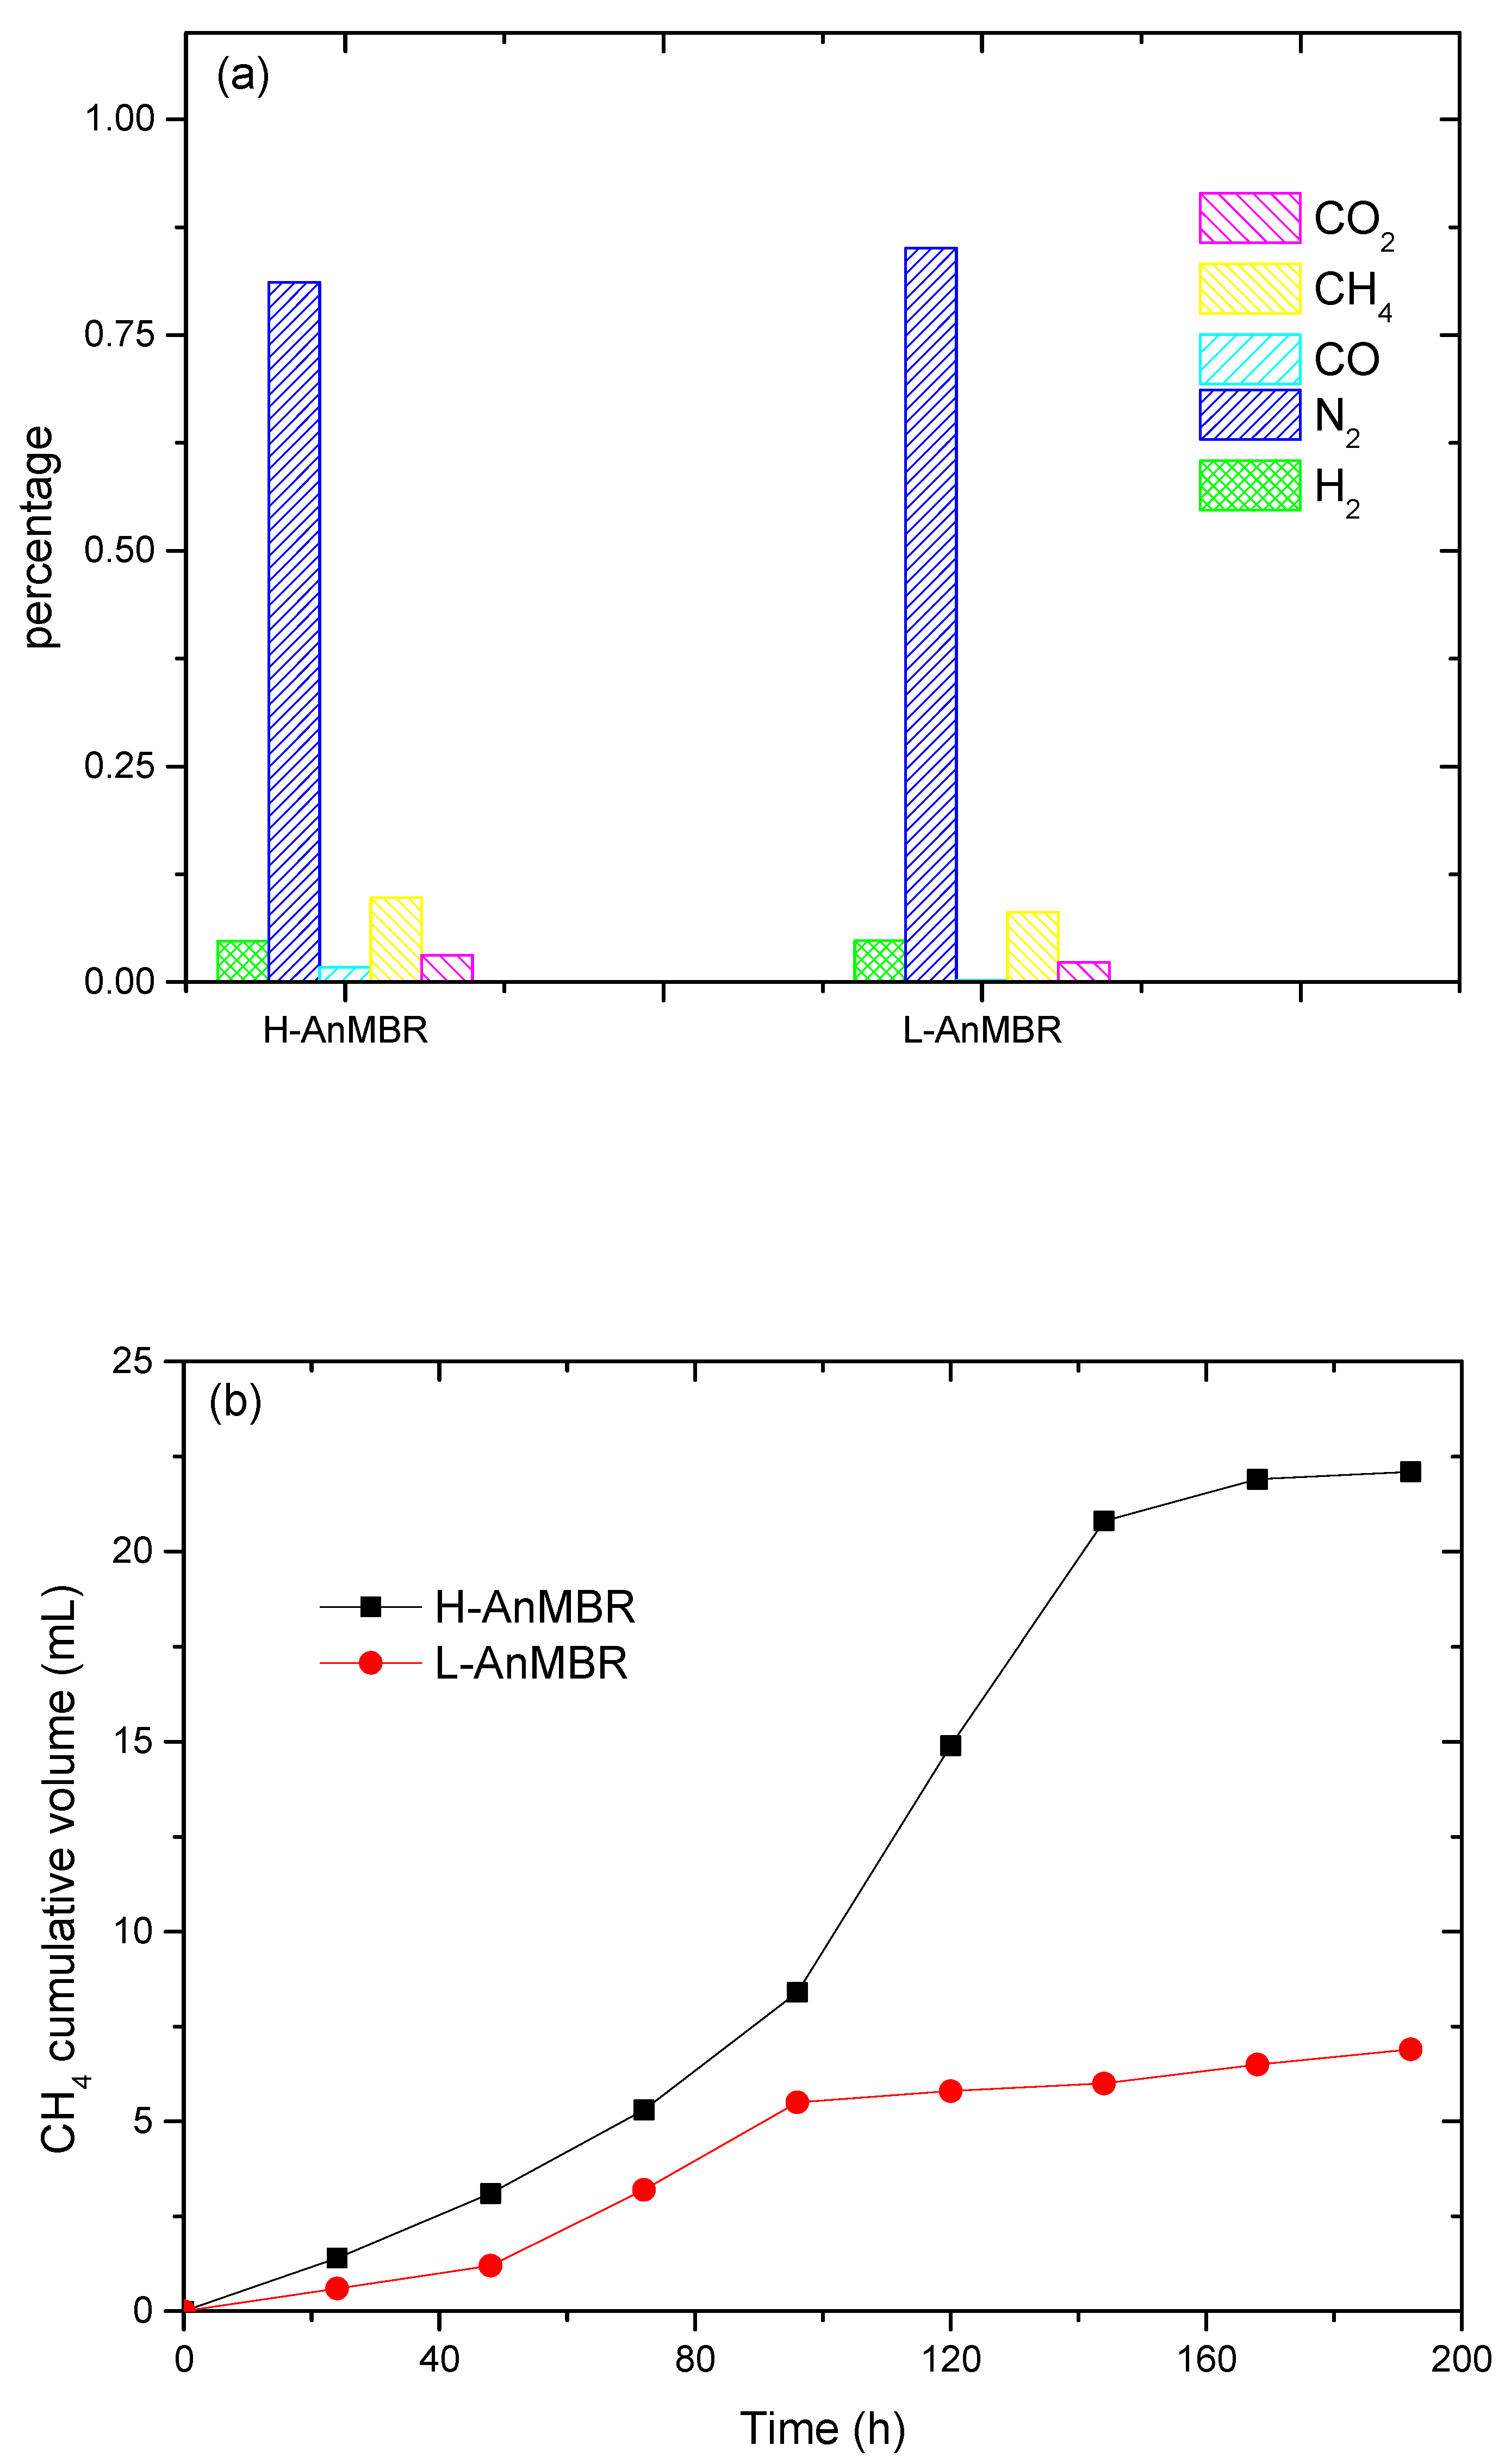
3.2.1. Gas Production of the AnMBR for Long-Term Wastewater Treatment

The biogas recovery is a notable advantage for the anaerobic process. The biogas production rate was converted to standard values (1 atm, 0 °C) during the whole operating period. The gas composition was also markedly different between the H-AnMBR and L-AnMBR, as shown in Figure 2a. In the L-AnMBR, the gas phase was composed of 3.71% hydrogen, 90.89% nitrogen, 4.15% methane and 1.25% carbon dioxide, and in the H-AnMBR, the gas phase was composed of 20.03% hydrogen, 89.13% nitrogen, 6.15% methane and 1.52% carbon dioxide. Continuous biogas production could be observed in AnMBR systems for wastewater treatment.
Biogas is a type of a renewable energy that can be produced by the anaerobic digestion of various types of biomass [22]. Meanwhile, it has been shown that the overall process of biogas use has many environmental benefits, such as a decrease in carbon emissions, reduction of pathogens and better odor management of the waste [23]. Moreover, the process of biogas use is regarded as easy to handle and to have accurately predicted outcomes as compared with other forms of renewable energies [24]. Furthermore, biogas effectively promotes the concepts of circular economy which revolve around the basic concepts of reuse and recycling of waste [25].
The cumulative methane content is shown in Figure 2b at certain times during the operation processes of the H-AnMBR and L-AnMBR. The methane production rate of the L-AnMBR was lower than that in the H-AnMBR, indicating a higher biogas production rate at a higher temperature. In a normal biogas plant, CH4 content is approximately 70% while the biogas from the AnMBR had a methane content in the range of 70–90% with other impurities such as nitrogen (0–15%) and carbon dioxide (3–15%) [8]. The biogas rich in methane can be used in many ways, for example, for direct heat and electricity generation, and can even be refined as a fuel.

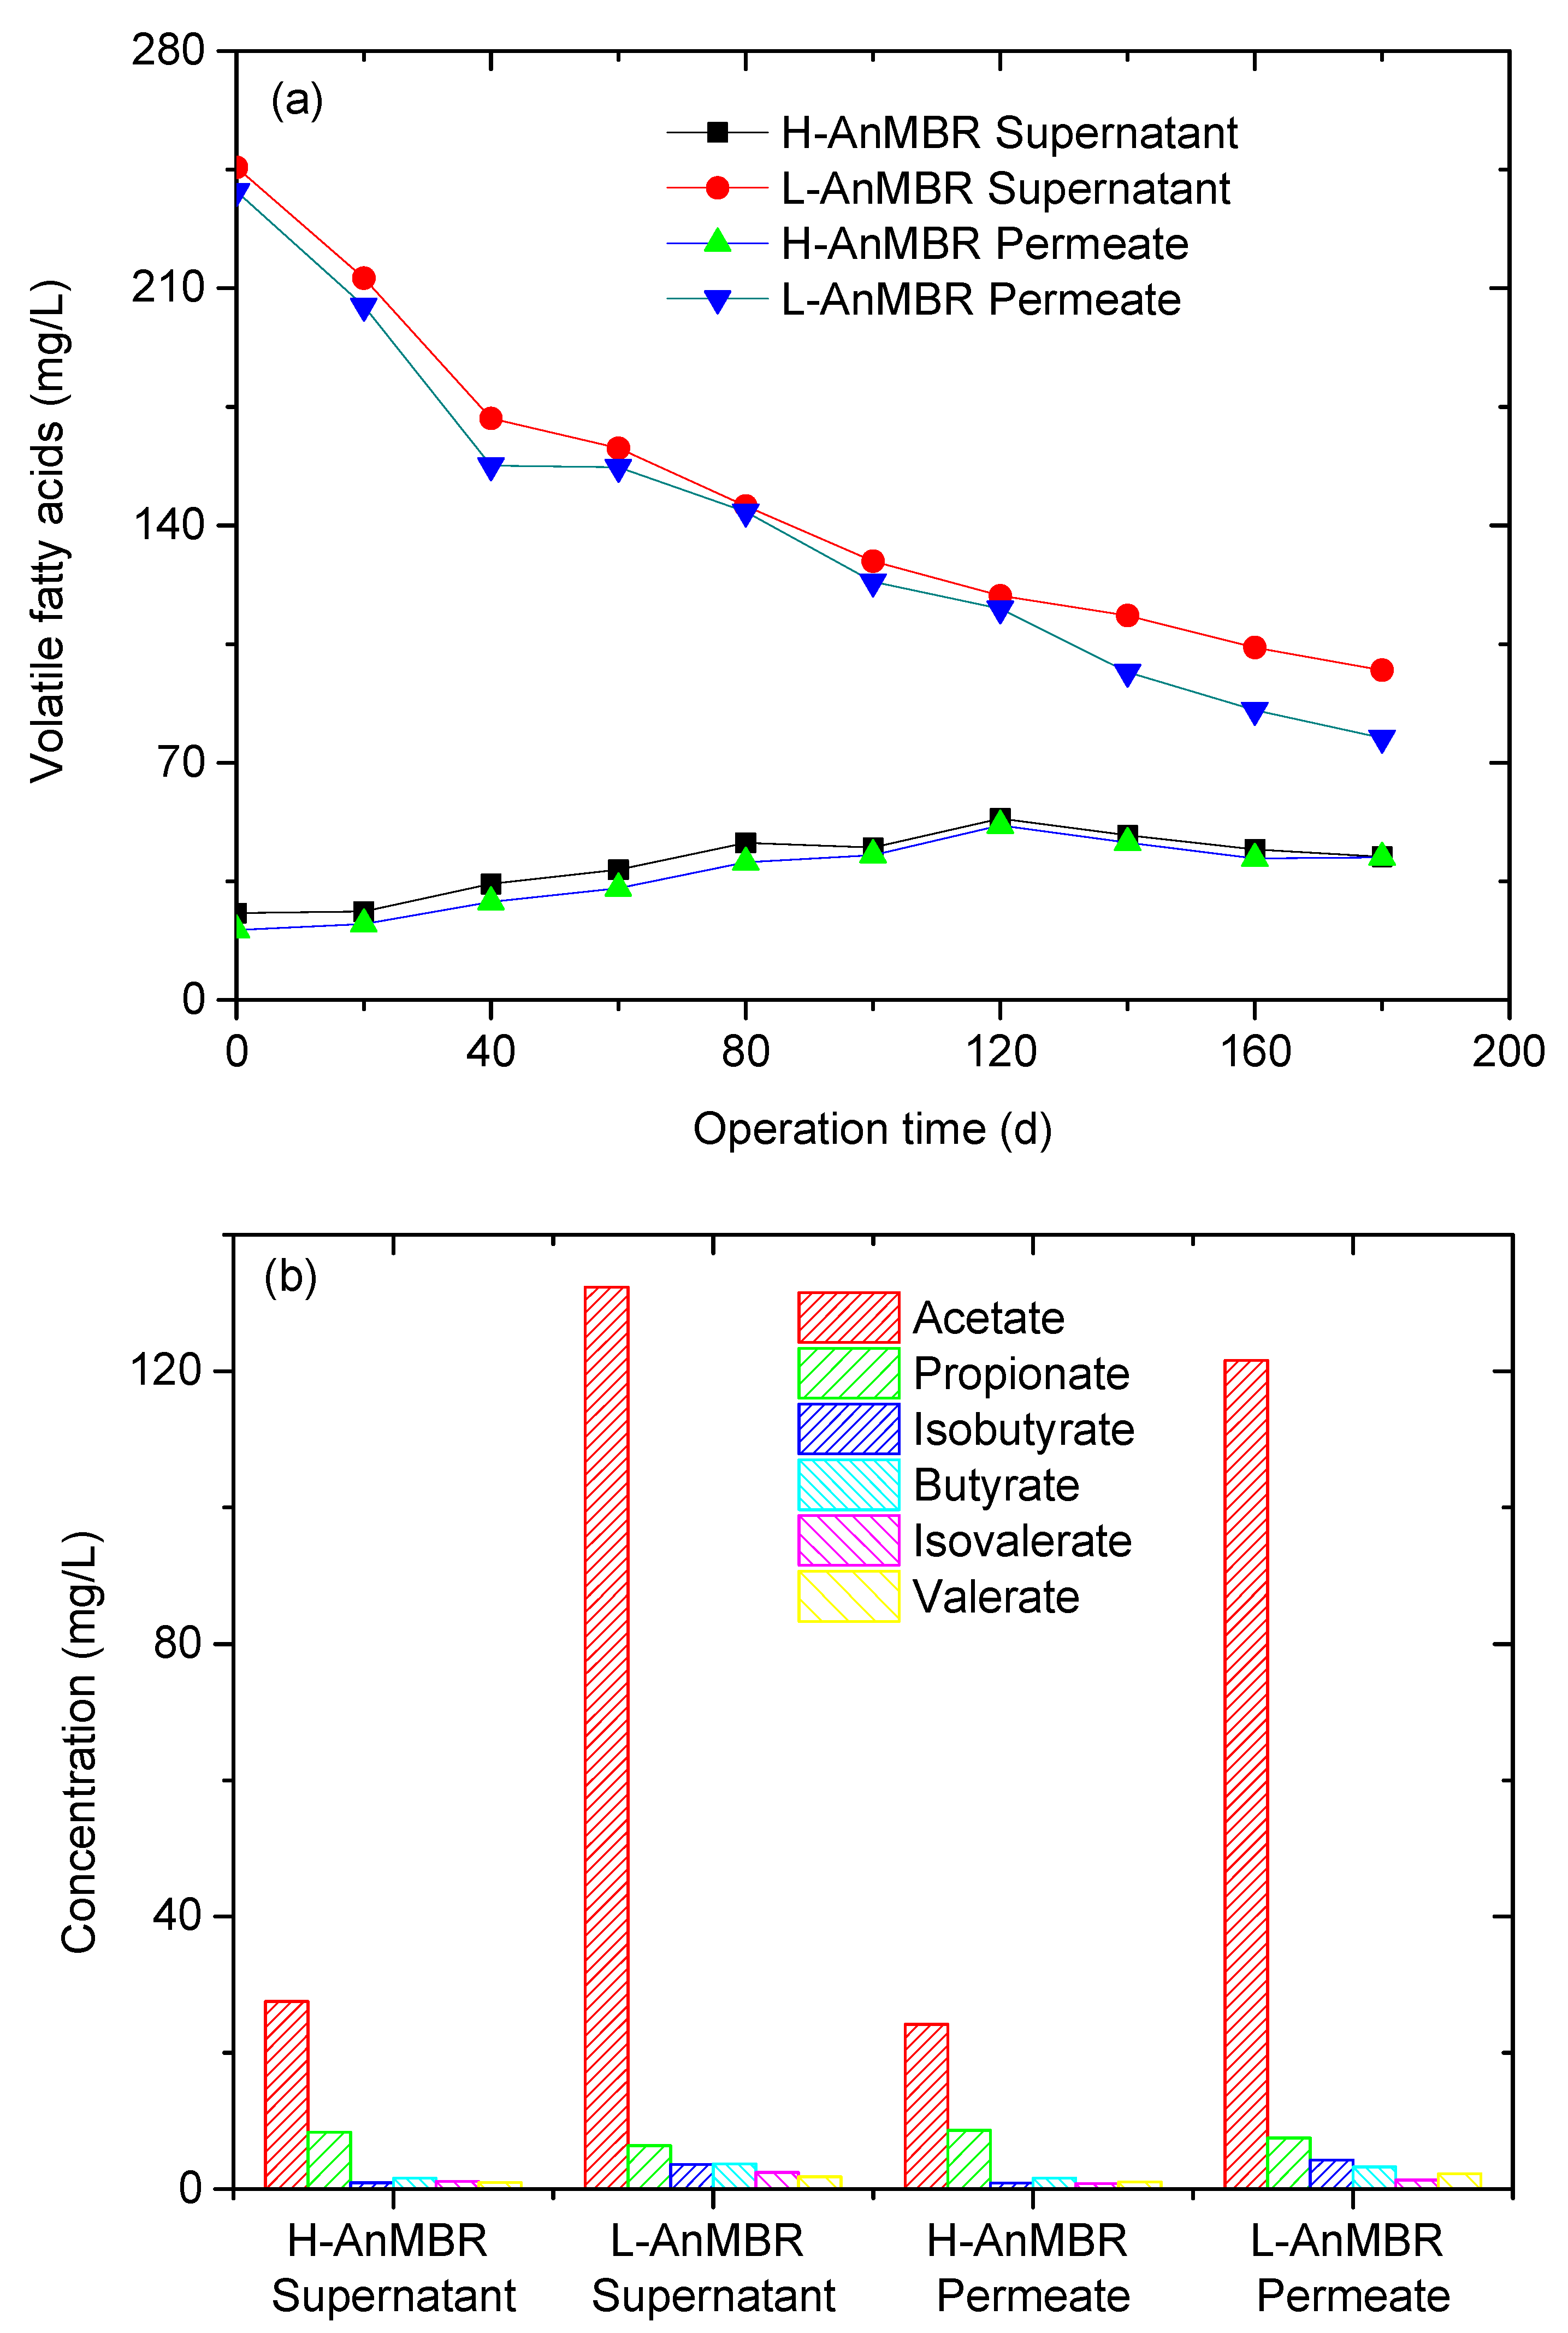
3.2.2. VFA Production of the AnMBR for Long-Term Wastewater Treatment

The change trends of VFAs in the H-AnMBR and L-AnMBR are shown in Figure 3. The total VFA concentrations in the permeates of the H-AnMBR and L-AnMBR averaged 37.04 and 140.05 mg/L as acetate, respectively, whereas the total VFA concentrations averaged 40.47 and 150.23 mg/L as acetate in the supernatants of the H-AnMBR and L-AnMBR, respectively. It could be found that acetic acid was the predominant VFA in both reactors. For the H-AnMBR, VFAs in the permeate were largely comprised of acetate (average concentration 24.15 mg/L) and propionate (average concentration 8.58 mg/L). With respect to the L-AnMBR, VFAs in the permeate were largely made up of acetate (average concentration of 121.56 mg/L) and propionate (average concentration of 7.48 mg/L). The other VFAs’ concentrations in permeate, such as isobutyrate, butyrate, isovalerate and valerate, were lower.
It is known that lower temperatures can decrease the number of viable microorganisms [26]. This can result in poor performances in the cases where mesophilic bacteria do not grow well under ambient temperatures. Meanwhile, it has also been reported that the half saturation constant for acetate increases significantly at low temperatures [26]. Low temperature hydrolysis is commonly found to be the rate-limiting step in anaerobic degradation, and as temperature decreases, the rate of hydrolysis becomes even lower; therefore, at these temperatures, acetate formation and acetoclastic methanogenesis are the main pathways for methane formation [27]. The accumulation acetate should be further degraded with post treatment.

3.3. Wastewater Treatment Performance of the AnMBR and FOMBR

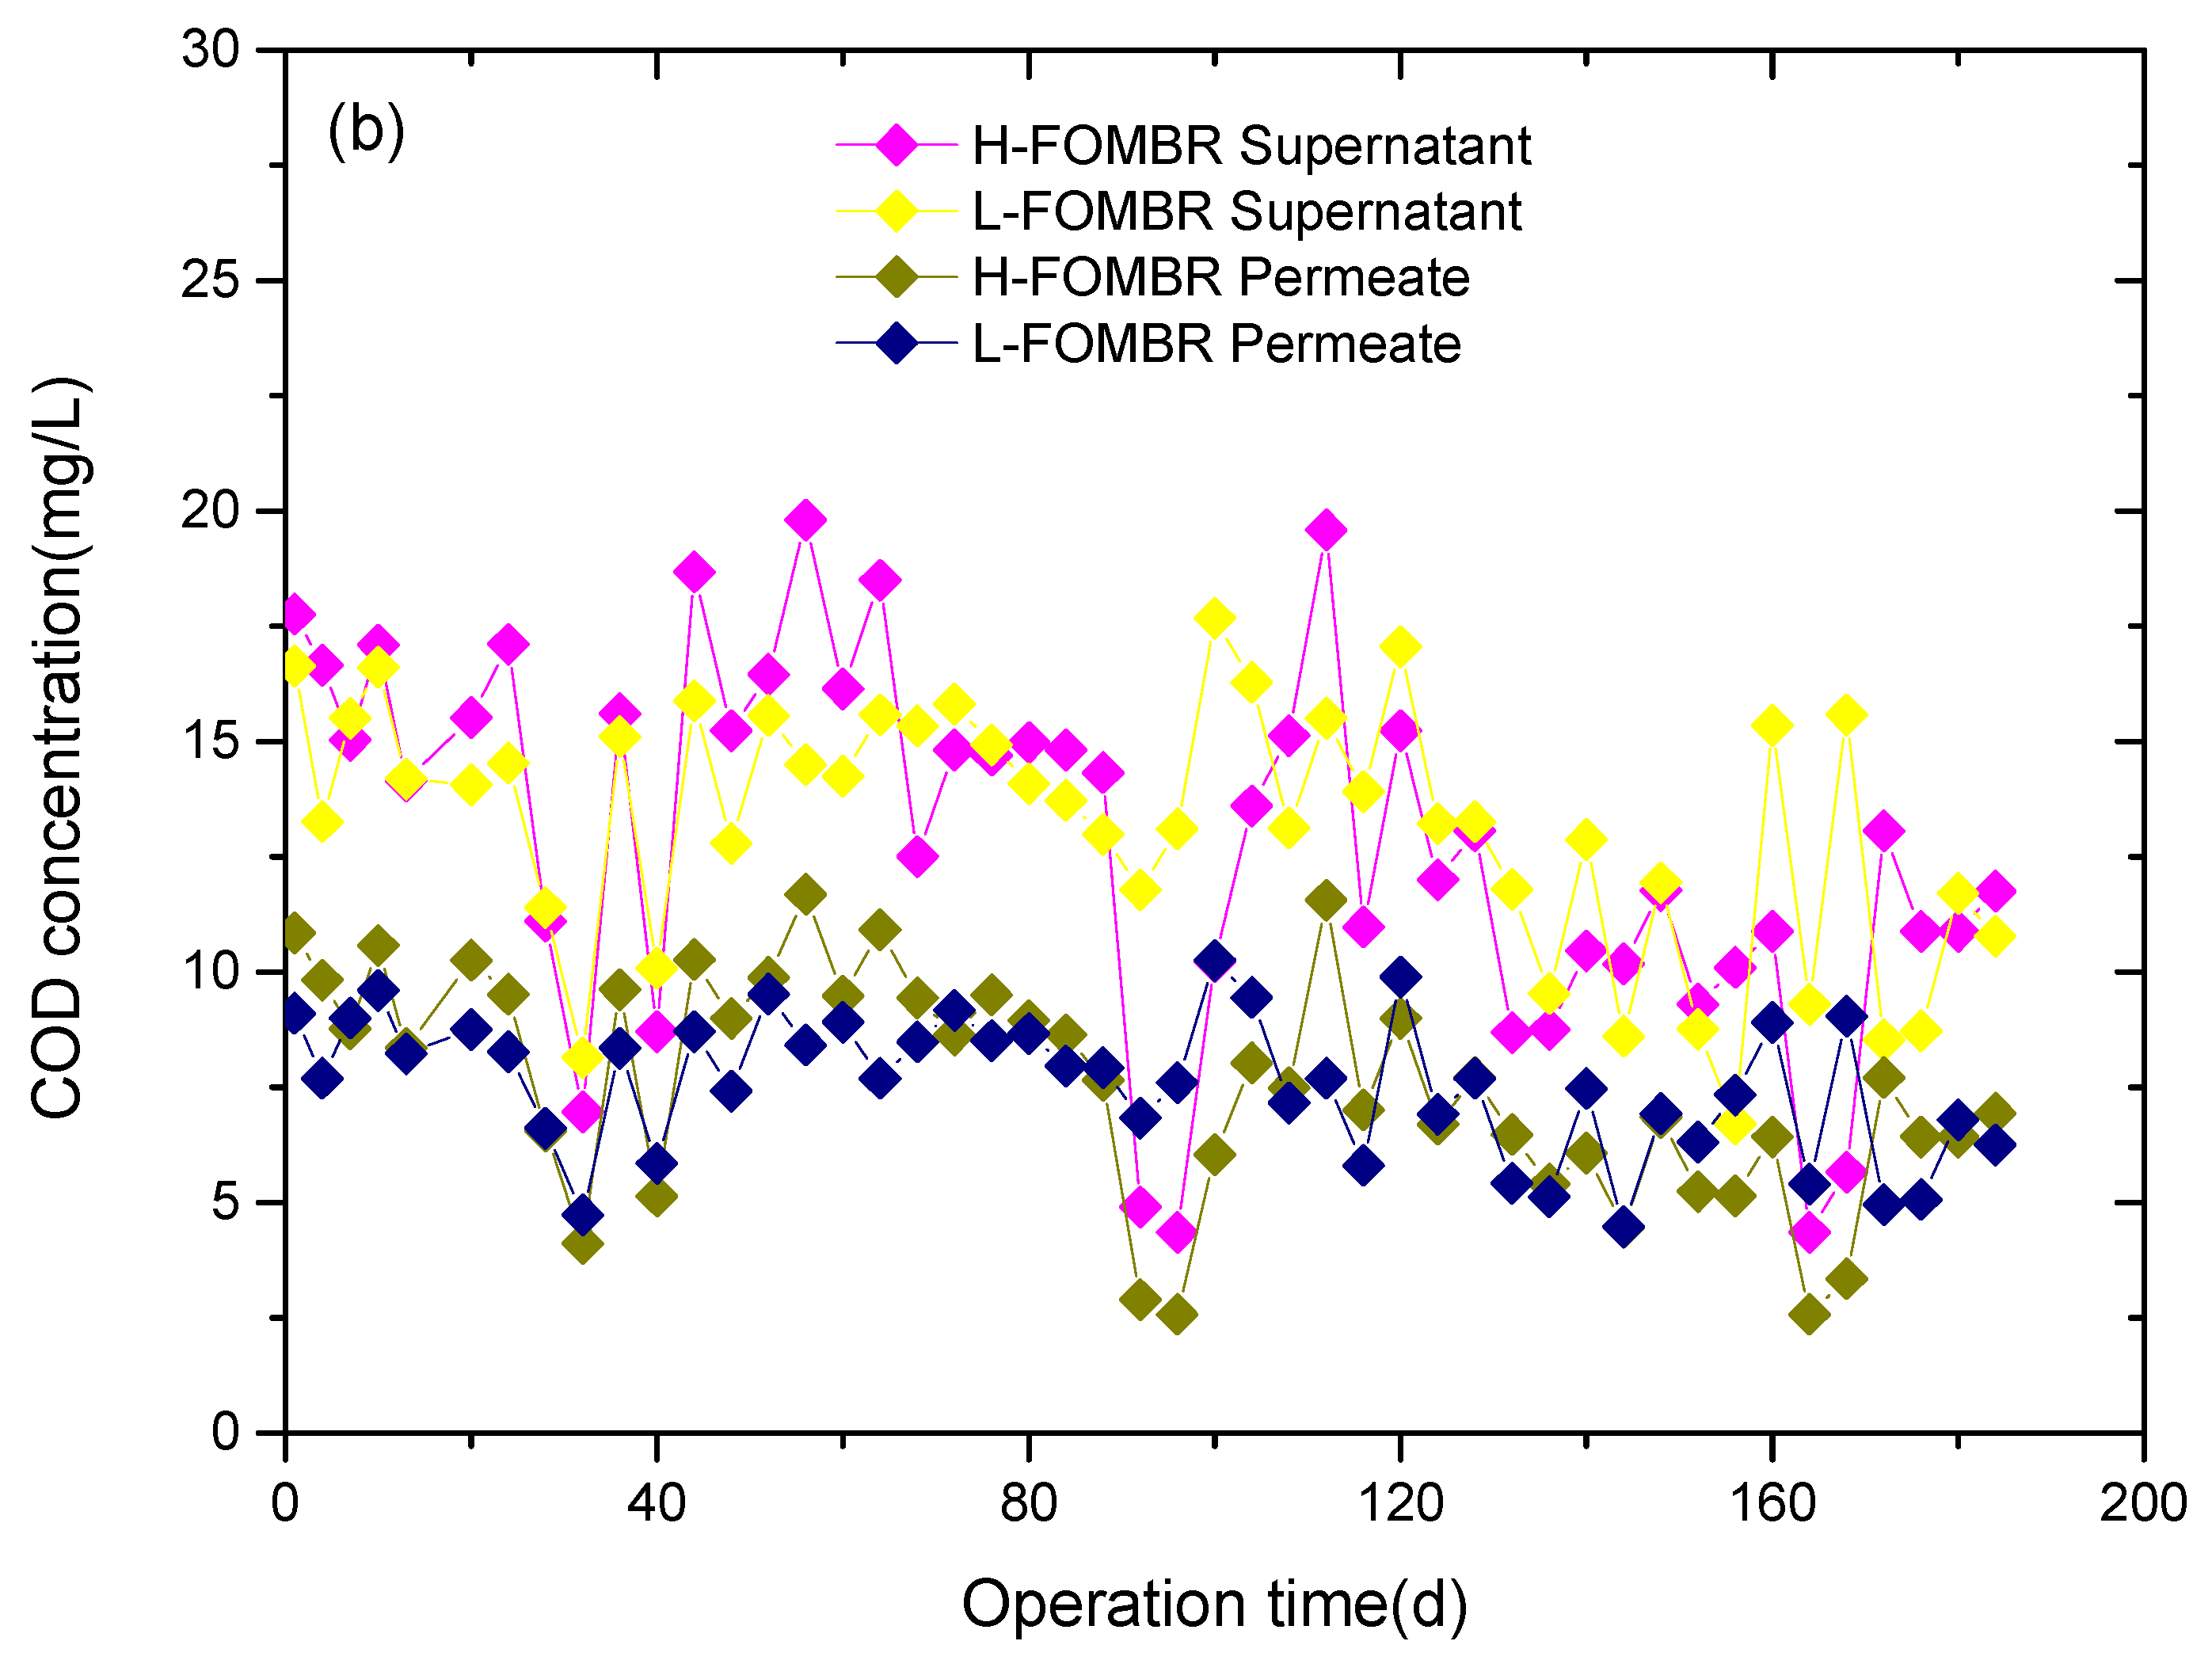
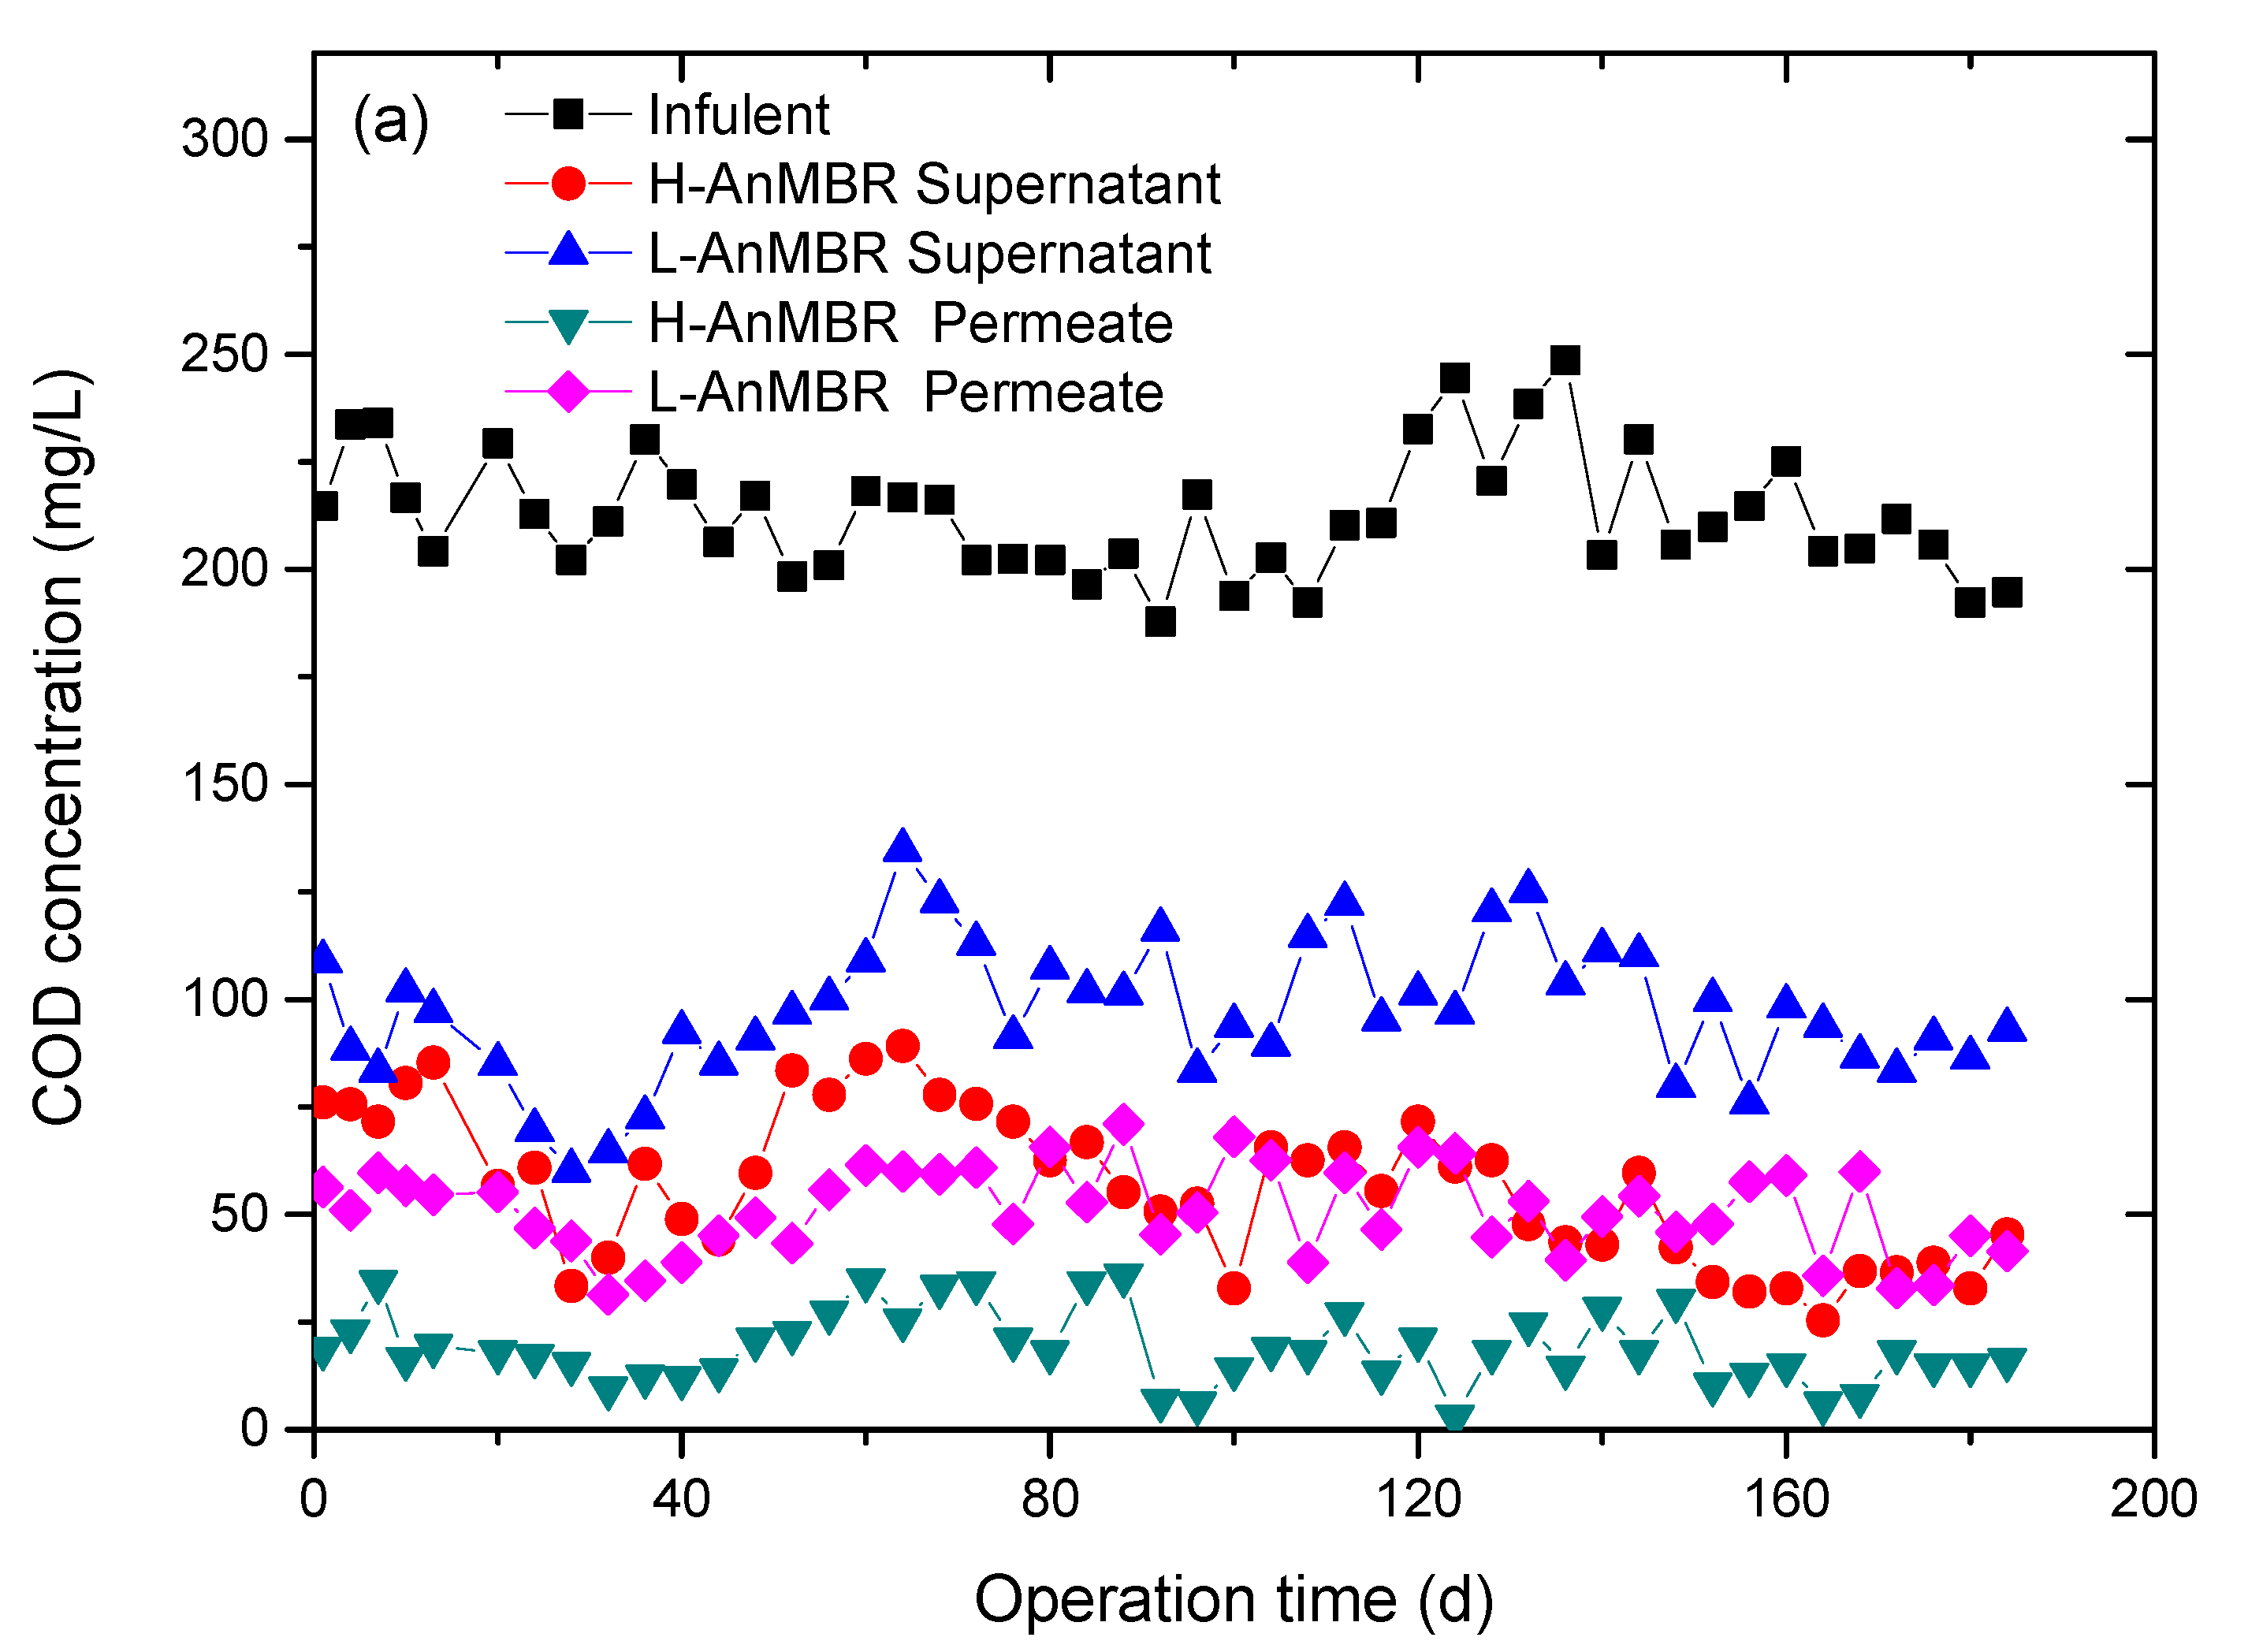
3.3.1. COD Removal of the AnMBR+FOMBR

COD removal efficiency is an important indicator to evaluate the treatment performance of wastewater. The COD concentrations in the influents, supernatants and permeates of H-AnMBR and L-AnMBR during the whole operation period are shown in Figure 4a. The average COD value in the influent was 212.61 mg/L, while the permeate COD values were 18.94 and 51.09 mg/L for the H-AnMBR and L-AnMBR, respectively. The average COD removal efficiencies were about 91.09% and 75.97% on average for the H-AnMBR and L-AnMBR, respectively. The permeate from the L-AnMBR presented a higher COD compared with the permeate from the H-AnMBR. The COD content in the L-AnMBR permeate was higher due to the accumulation of VFA, and there were more solubilized organic components that were not transformed into methane and left the system.
The evolutions of the COD concentrations in the bulk phases and permeates of the two FOMBRs are listed in Figure 4b. It was evident that the permeate COD of the H-AnMBR was lower than that of the L-AnMBR, but both of the permeate CODs in the FOMBRs were about the same, with the average concentrations of 7.57 and 7.58 mg/L, respectively. This meant that the further degradation of FOMBR was more effective, and the combined system was feasible.

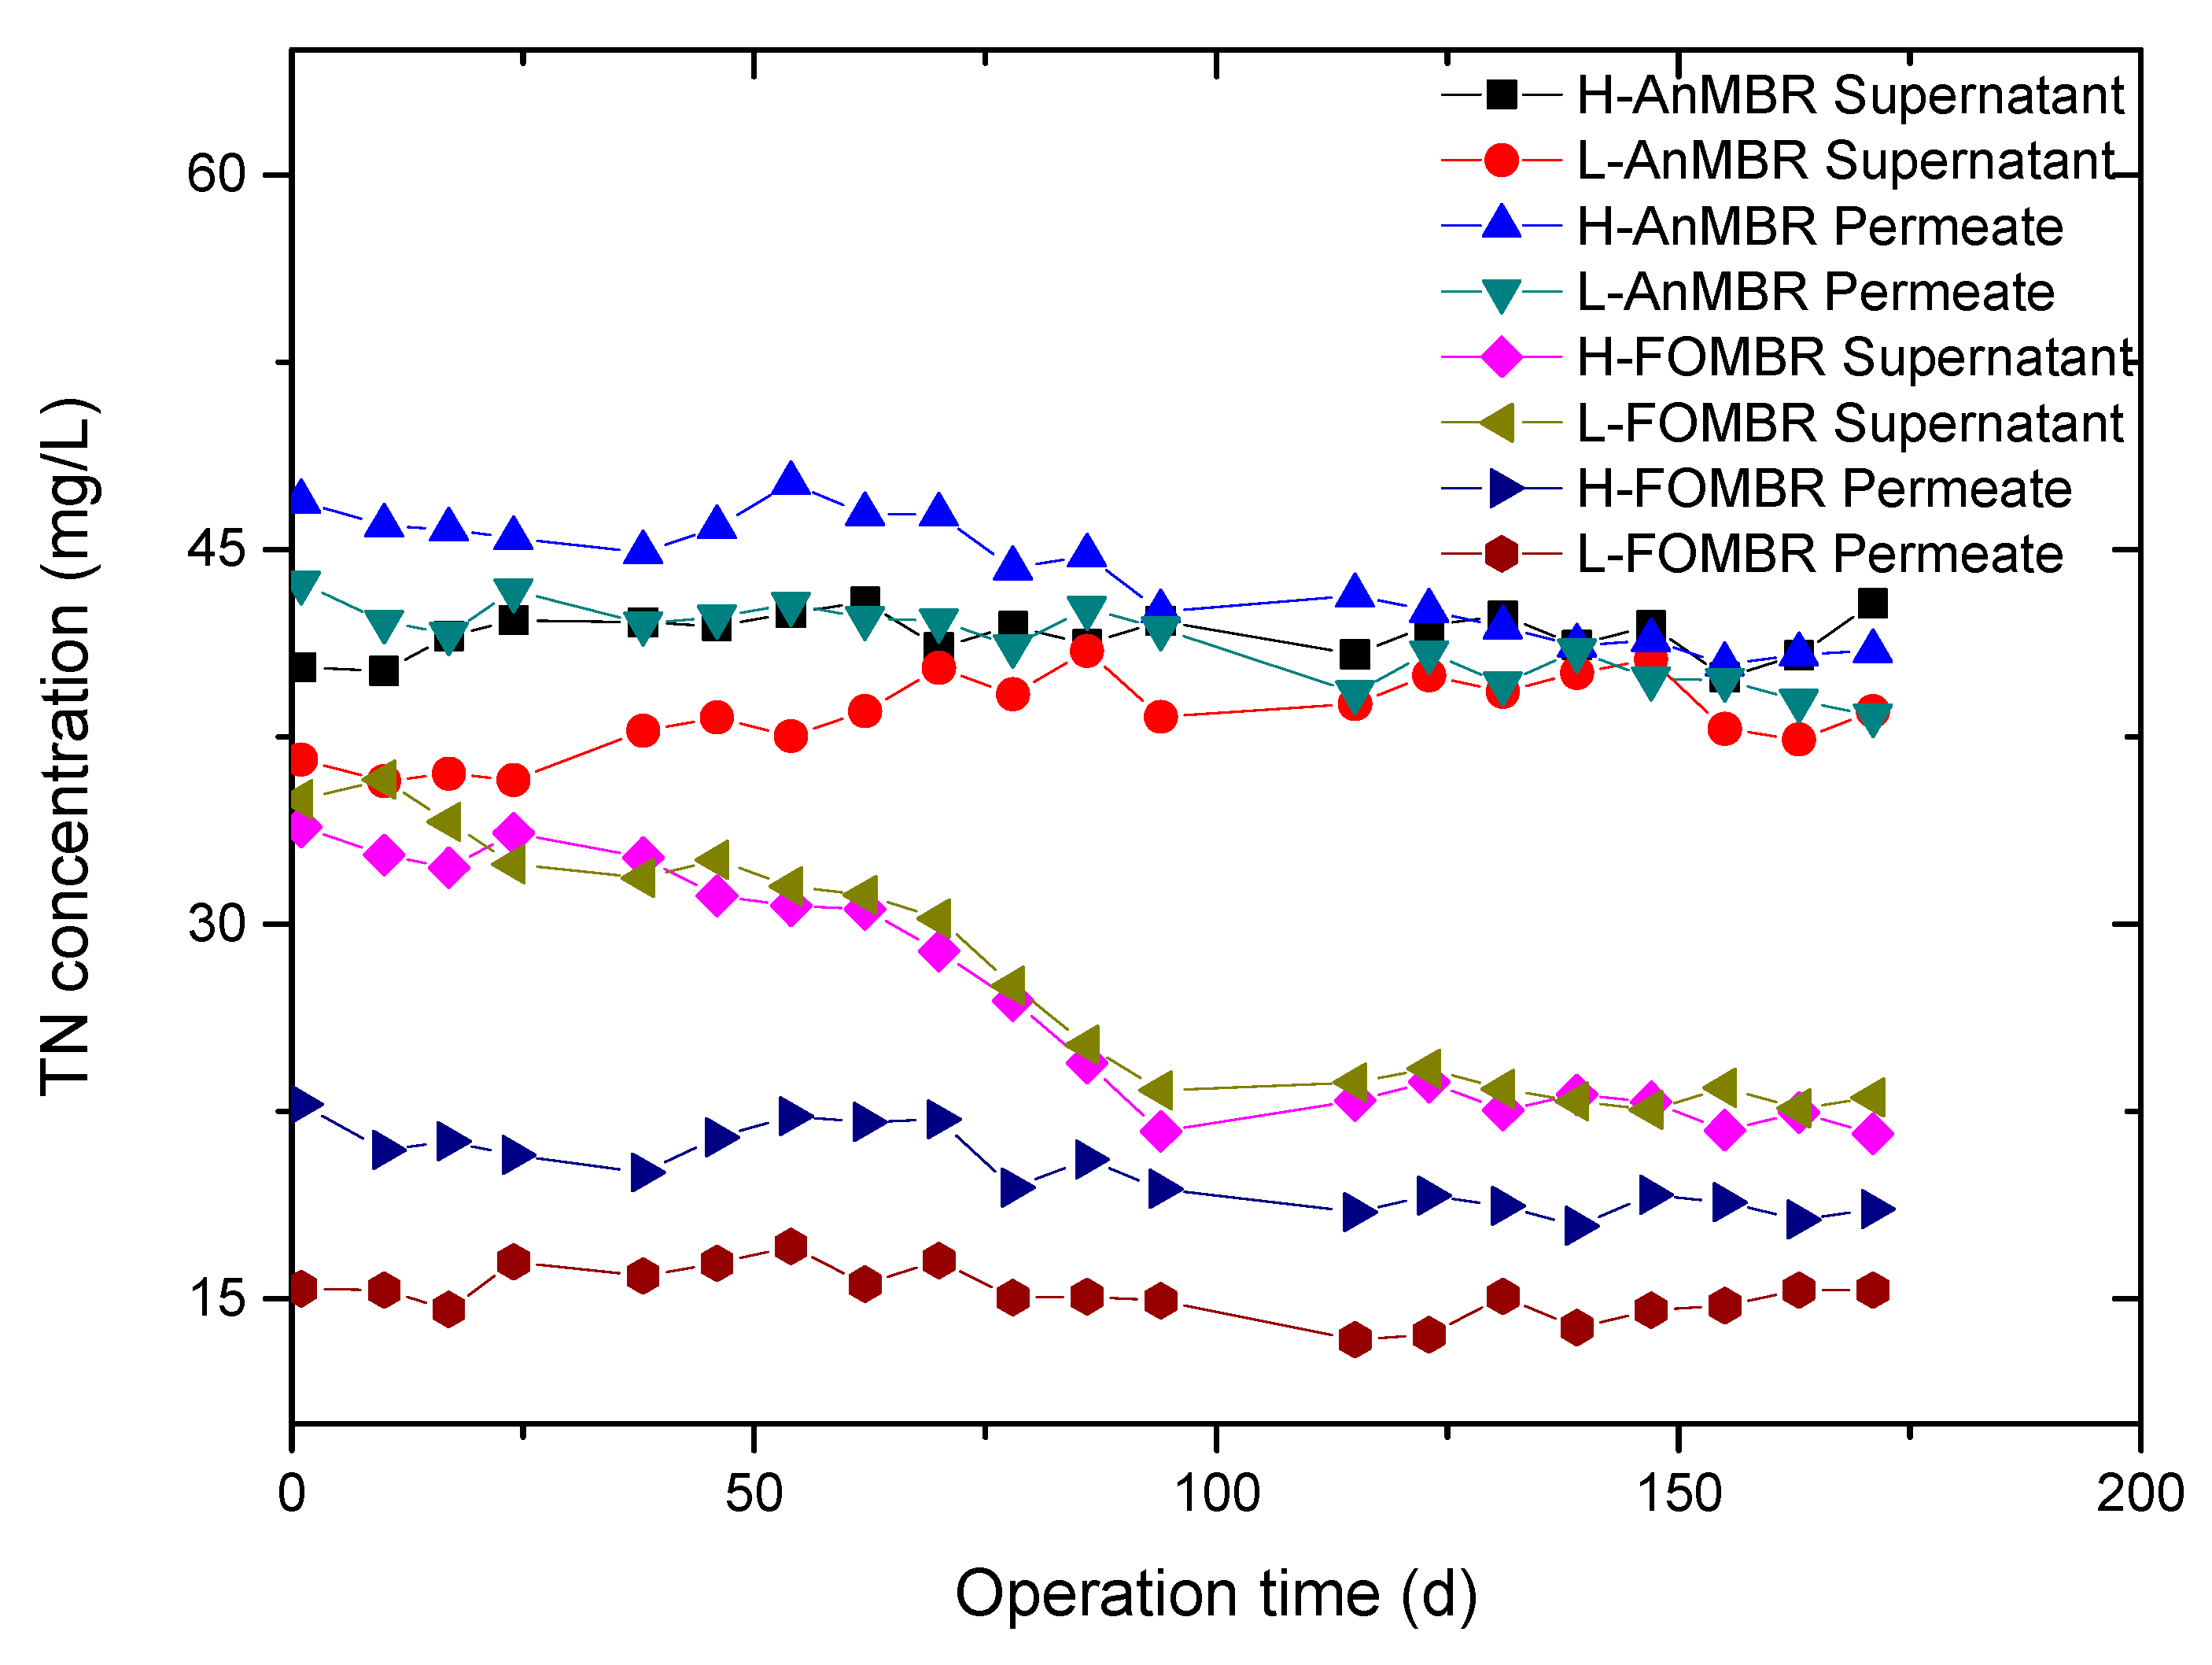
3.3.2. The Total Nitrogen Concentration Changes in the AnMBR

The evolutions of TN concentrations in the bulk phases and permeates of the H-AnMBR and L-AnMBR and the H-FOMBR and L-FOMBR are shown in Figure 5. It is shown that the TN in the bulk phase of the H-AnMBR and L-AnMBR kept at stable values. With the same influent TN concentration, the TN concentration in the H-AnMBR was higher than for the L-AnMBR in bulk phase, and the average values were 41.58 and 38.37 mg/L in the H-AnMBR and L-AnMBR, respectively. It was interesting that in the H-AnMBR and L-AnMBR, the permeate TN concentration was higher than that in bulk phase. The higher concentration of permeate TN was due to the release of nitrogenous substances into the water through reduction reaction in anaerobic conditions, especially proteins, etc., which may have led to rises of effluent TN concentration in the H-AnMBR and L-AnMBR.
The total nitrogen in the FOMBR treating the H-AnMBR and L-AnMBR effluent was also investigated, as shown in Figure 5. The total nitrogen concentrations of the two FOMBRs in the supernatant fluid were about the same, and the changing trends were similar. The concentrations of total nitrogen were reduced slowly in the first 90 days in the bulk phases of the two FOMBRs, and then remained stable at about 22 mg/L. The total nitrogen concentrations in the effluents of the two FOMBRs remained stable, and the average concentrations in the permeate were 20.12 and 15.22 mg/L in the H-FOMBR and L-FOMBR, respectively.

3.4. Sludge Characteristics of the AnMBR and FOMBR

3.4.1. Basic Physical Properties of Sludge

The physical properties of activated sludge in the combined system, including MLSS, MLVSS, SVI, viscosity and CST, were investigated, as shown in Table 3. It can be seen that the SVI value of H-AnMBR was lower than that of L-AnMBR, indicating that the filtration performance of activated sludge in H-AnMBR was better, while in FOMBR, the activated sludge in L-FOMBR had better sedimentation. It can also be seen from the viscosity and capillary water absorption time that the viscosity and capillary water absorption time of L-AnMBR-activated sludge were higher compared to those of H-AnMBR, indicating that L-AnMBR had poor dewaterability, while in FOMBR, the viscosity and capillary water absorption time of activated sludge in L-FOMBR were slightly lower than those in H-FOMBR.

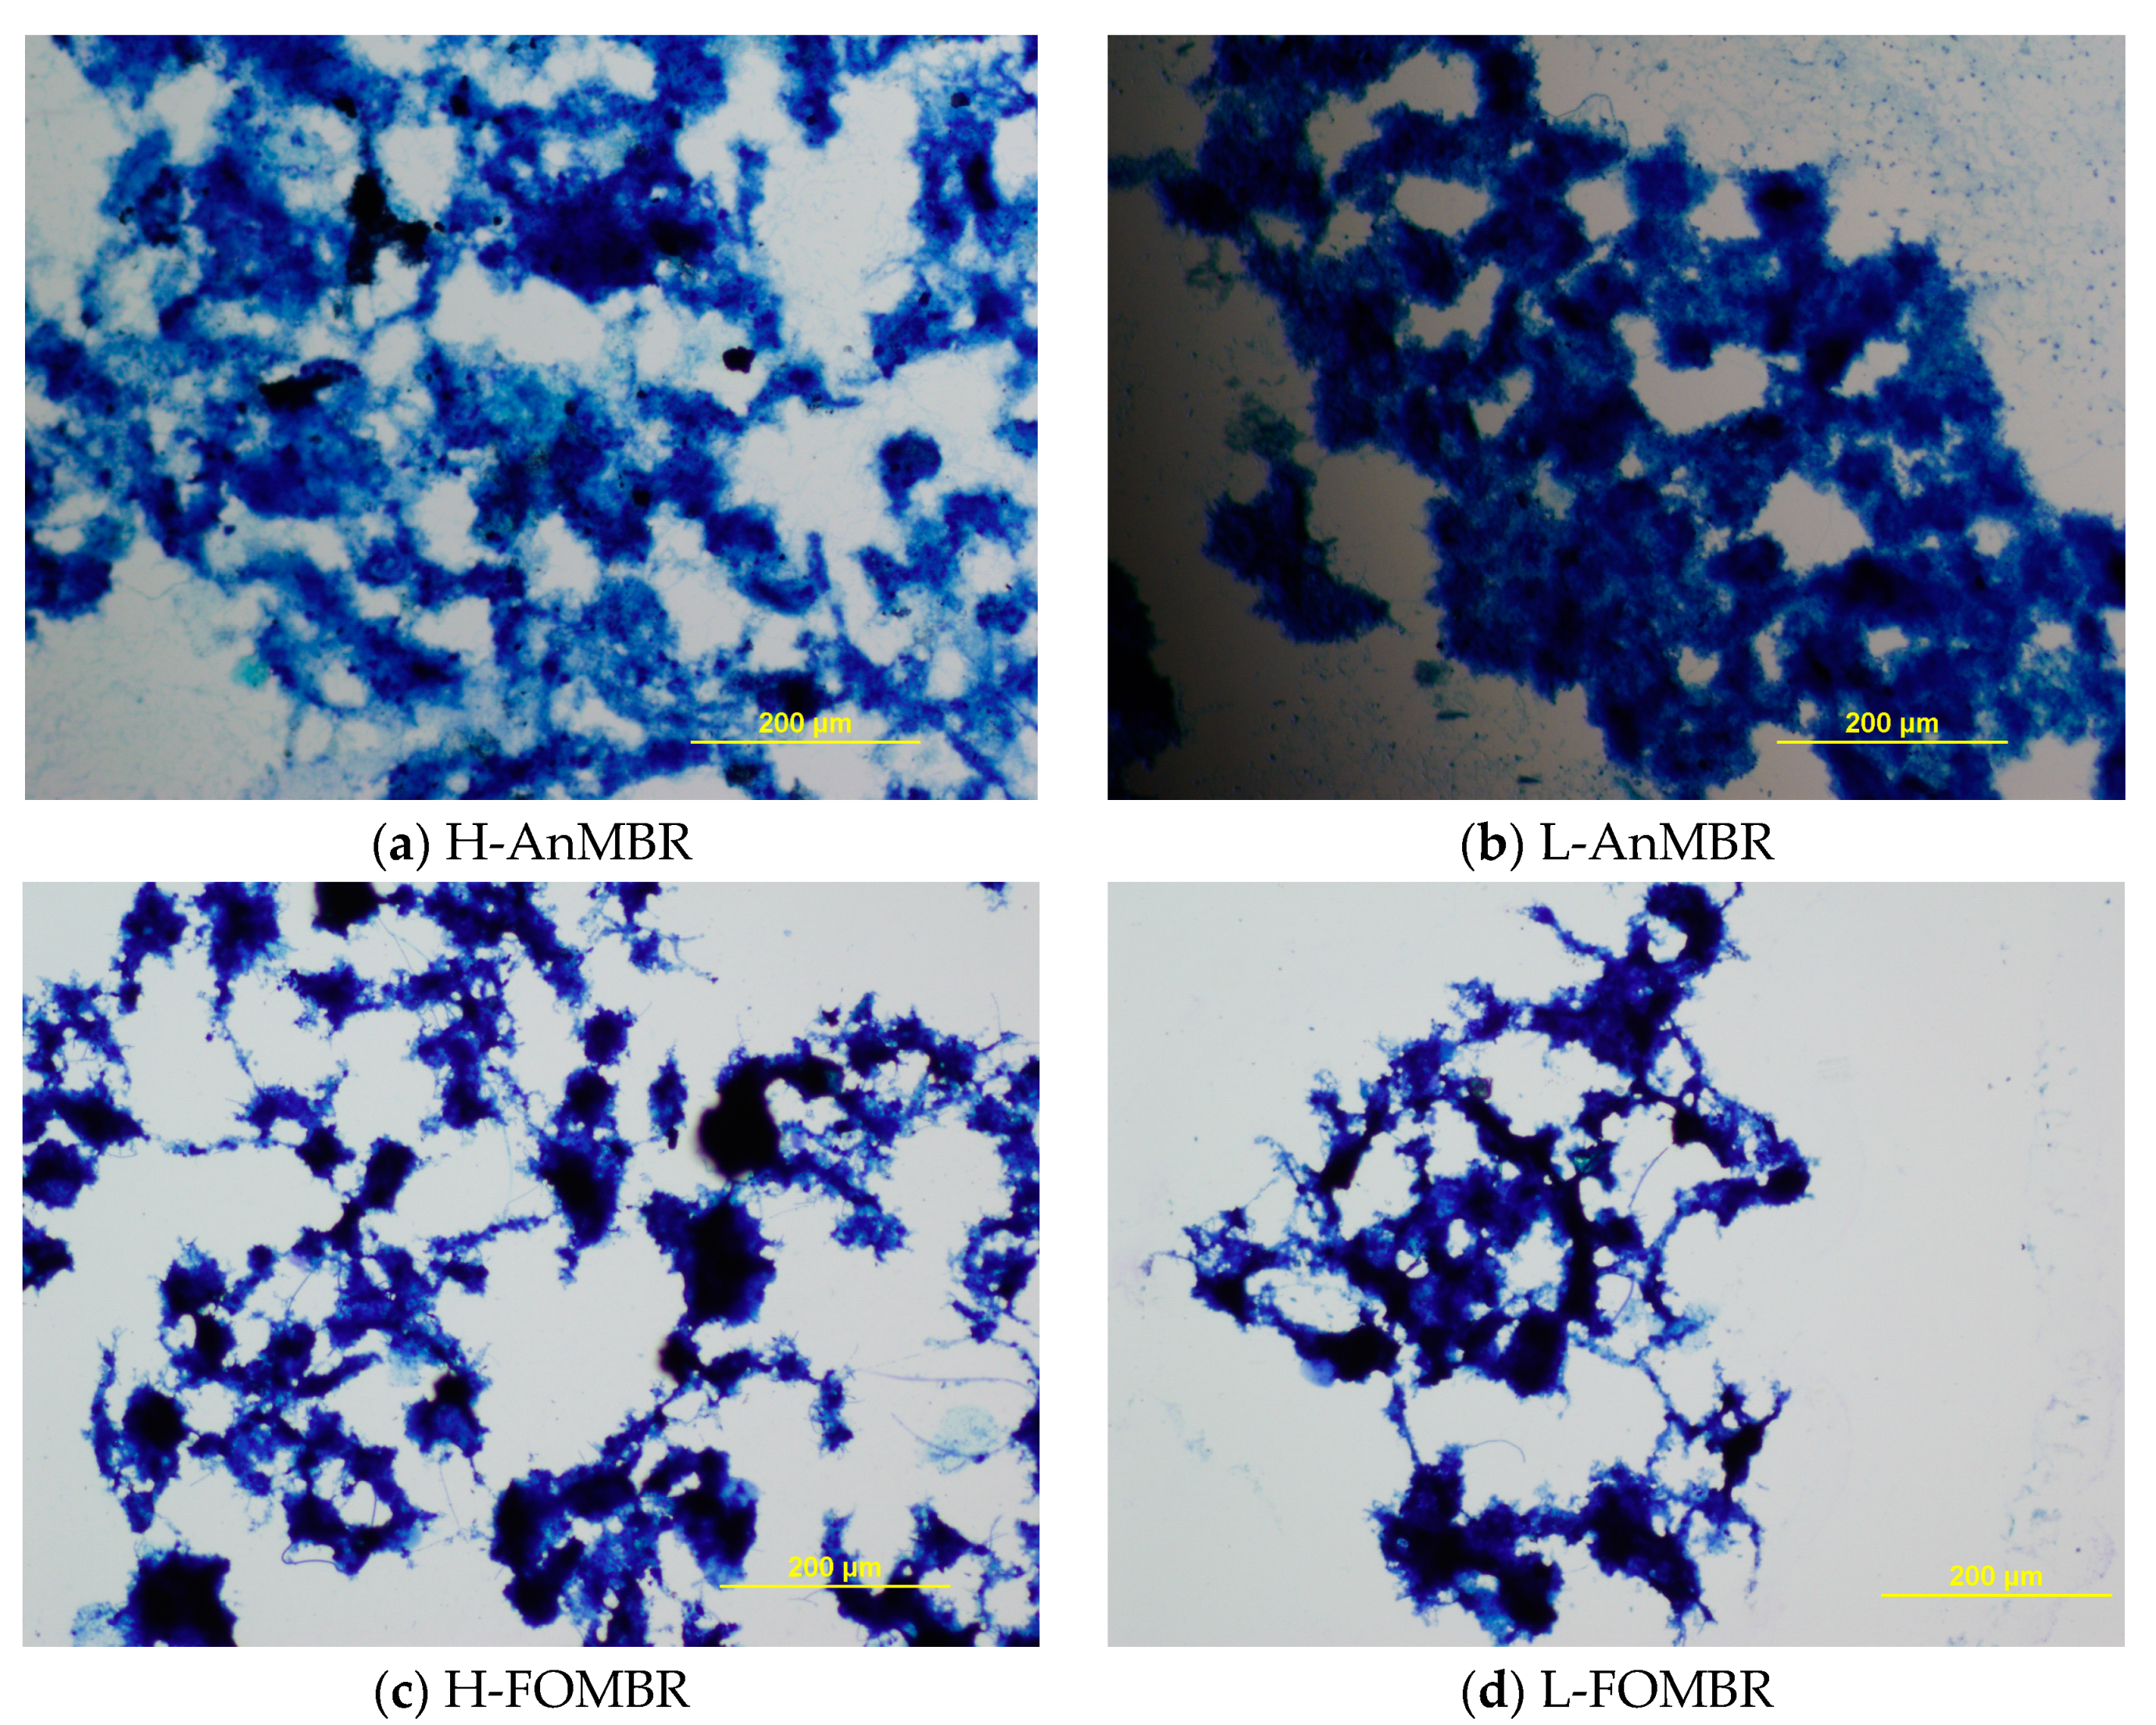
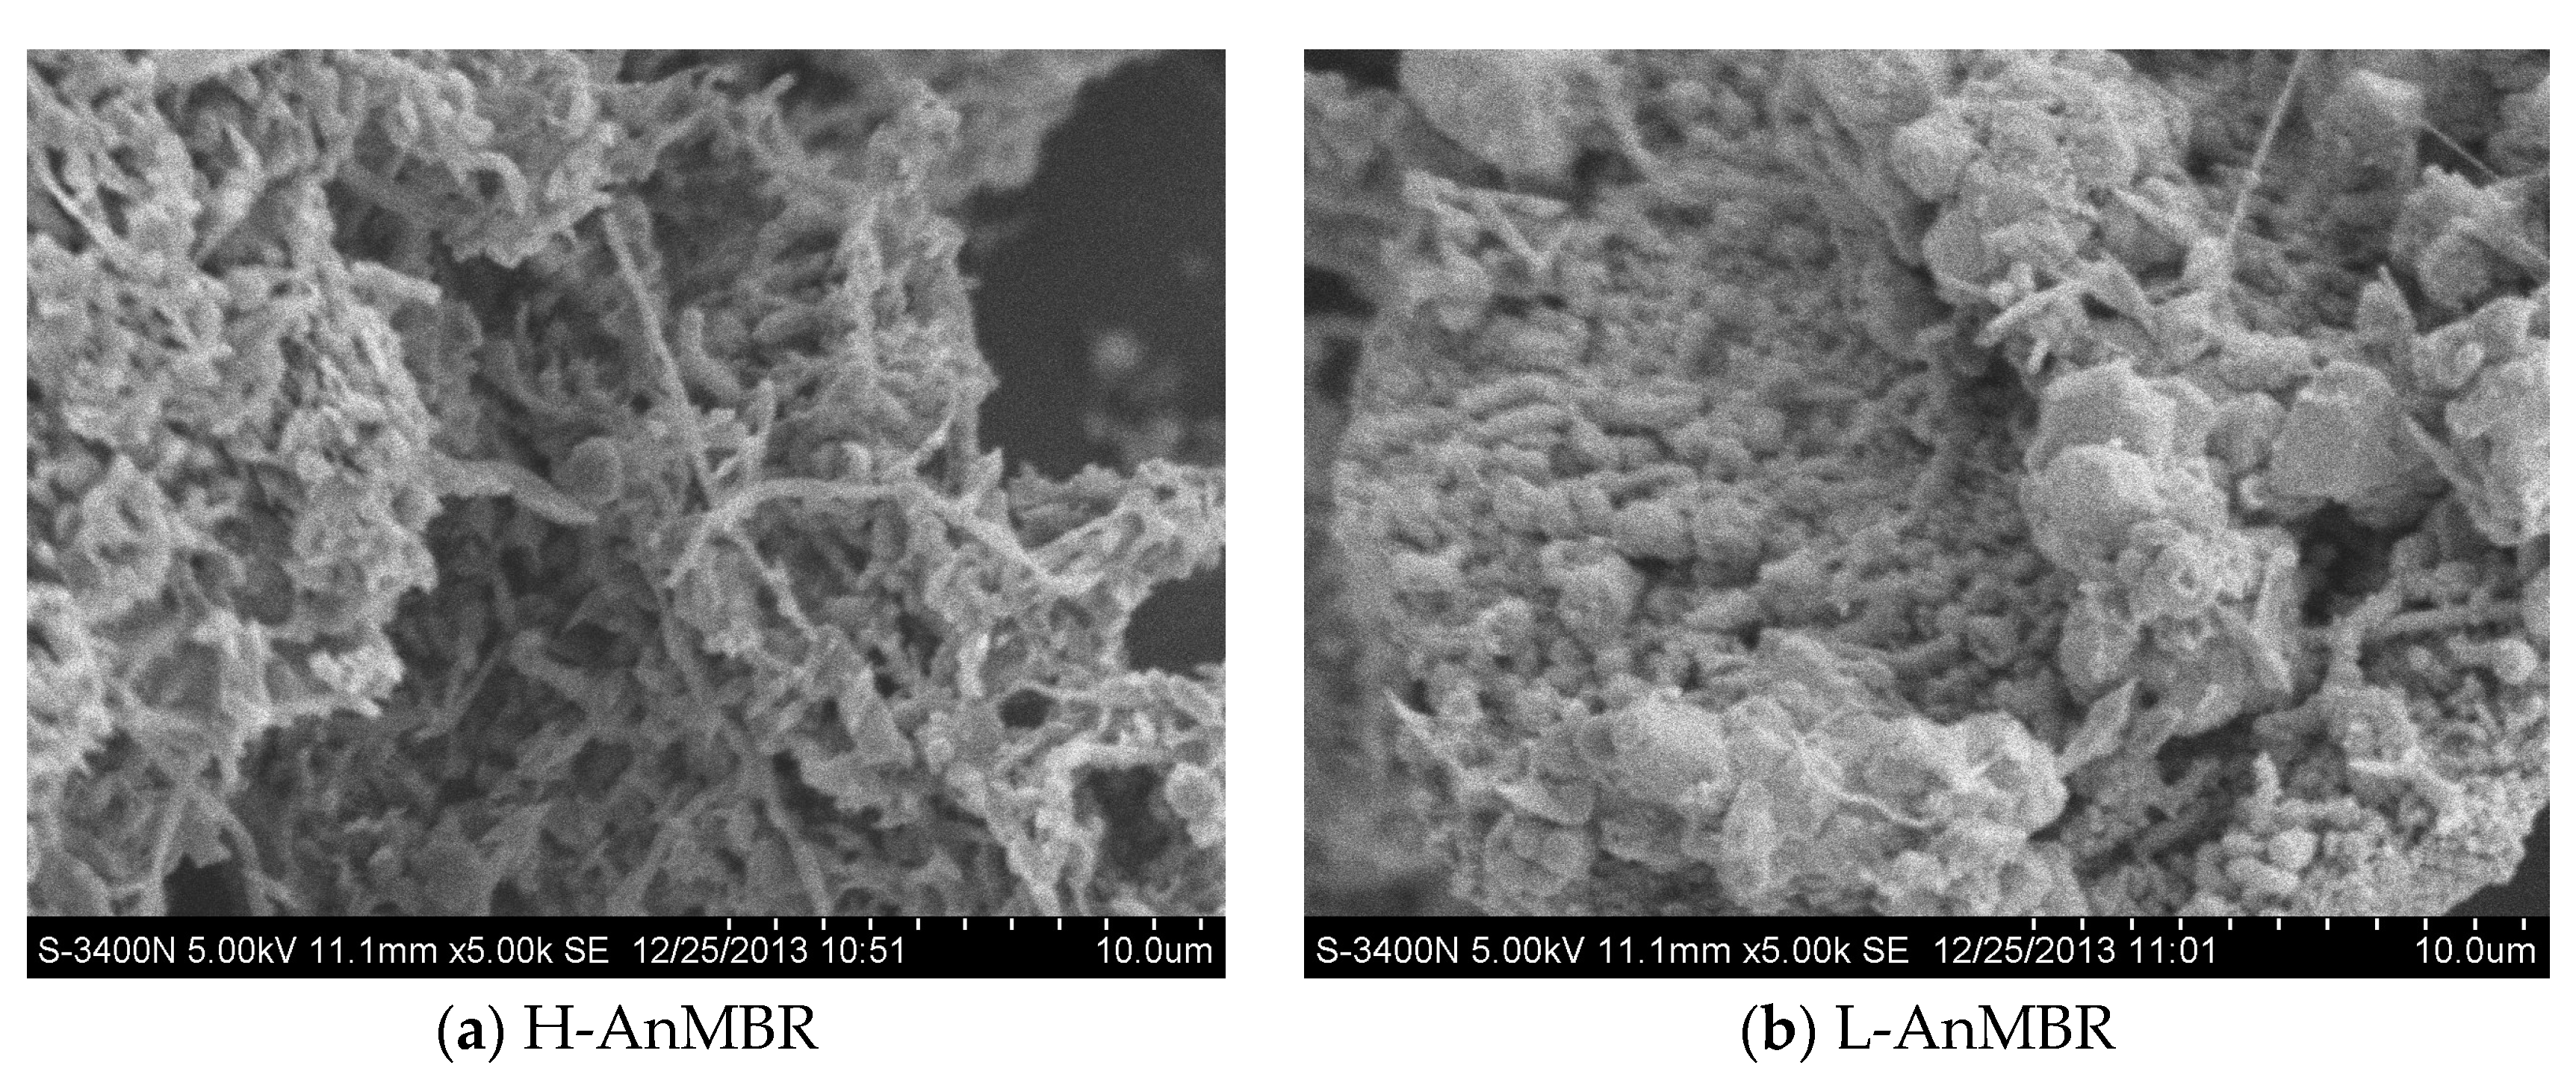
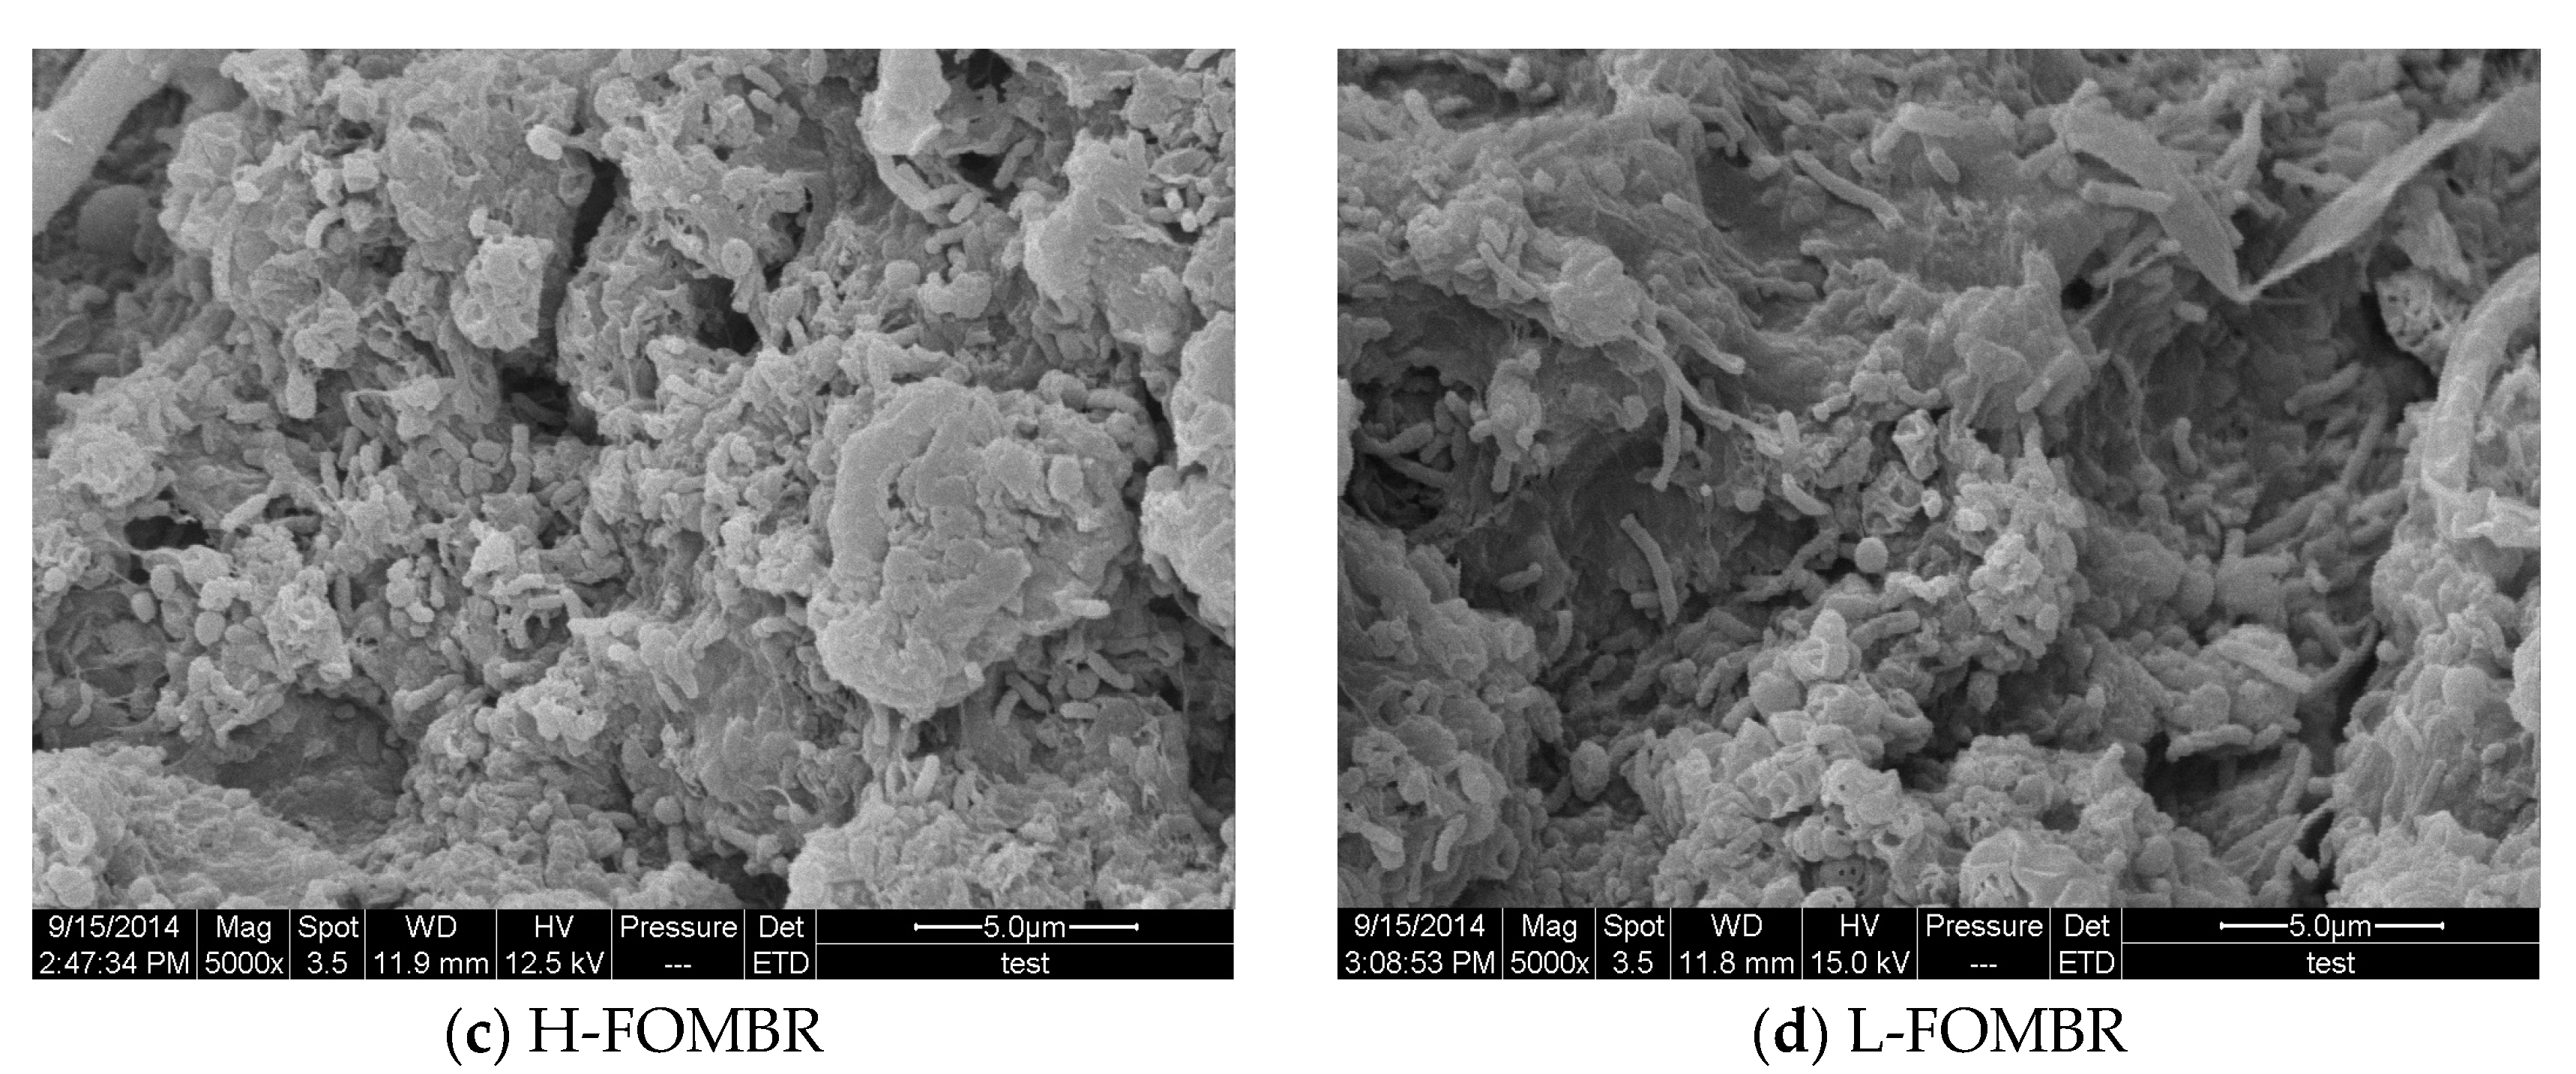
3.4.2. Morphologies of Activated Sludge Flocs

The properties of activated sludge had effects on the microbial activities of the bioreactors, and then affected the treatment efficiency. The floc morphologies of the activated sludge in different reactors were different. The floc morphologies are shown in Figure 6. It can be seen from the observation of flocs that the flocs of activated sludge in H-AnMBR were relatively loose, while the flocs of L-AnMBR were relatively tight. It is illustrated in Figure 6c,d that the fine sludge floc was less present in the H-FOMBR than that in the L-FOMBR.
SEM was used to characterize the microscopic morphology of sludge, as shown in Figure 7. It can be seen that the sludge flocs of H-AnMBR contained more bacillus and the sludge particles were loose, while L-AnMBR contained more coccus and the sludge particles were compact and small. Compared with L-FOMBR, H-FOMBR contained more fine sludge flocs, which is consistent with the floc morphology analysis results of the previous section.

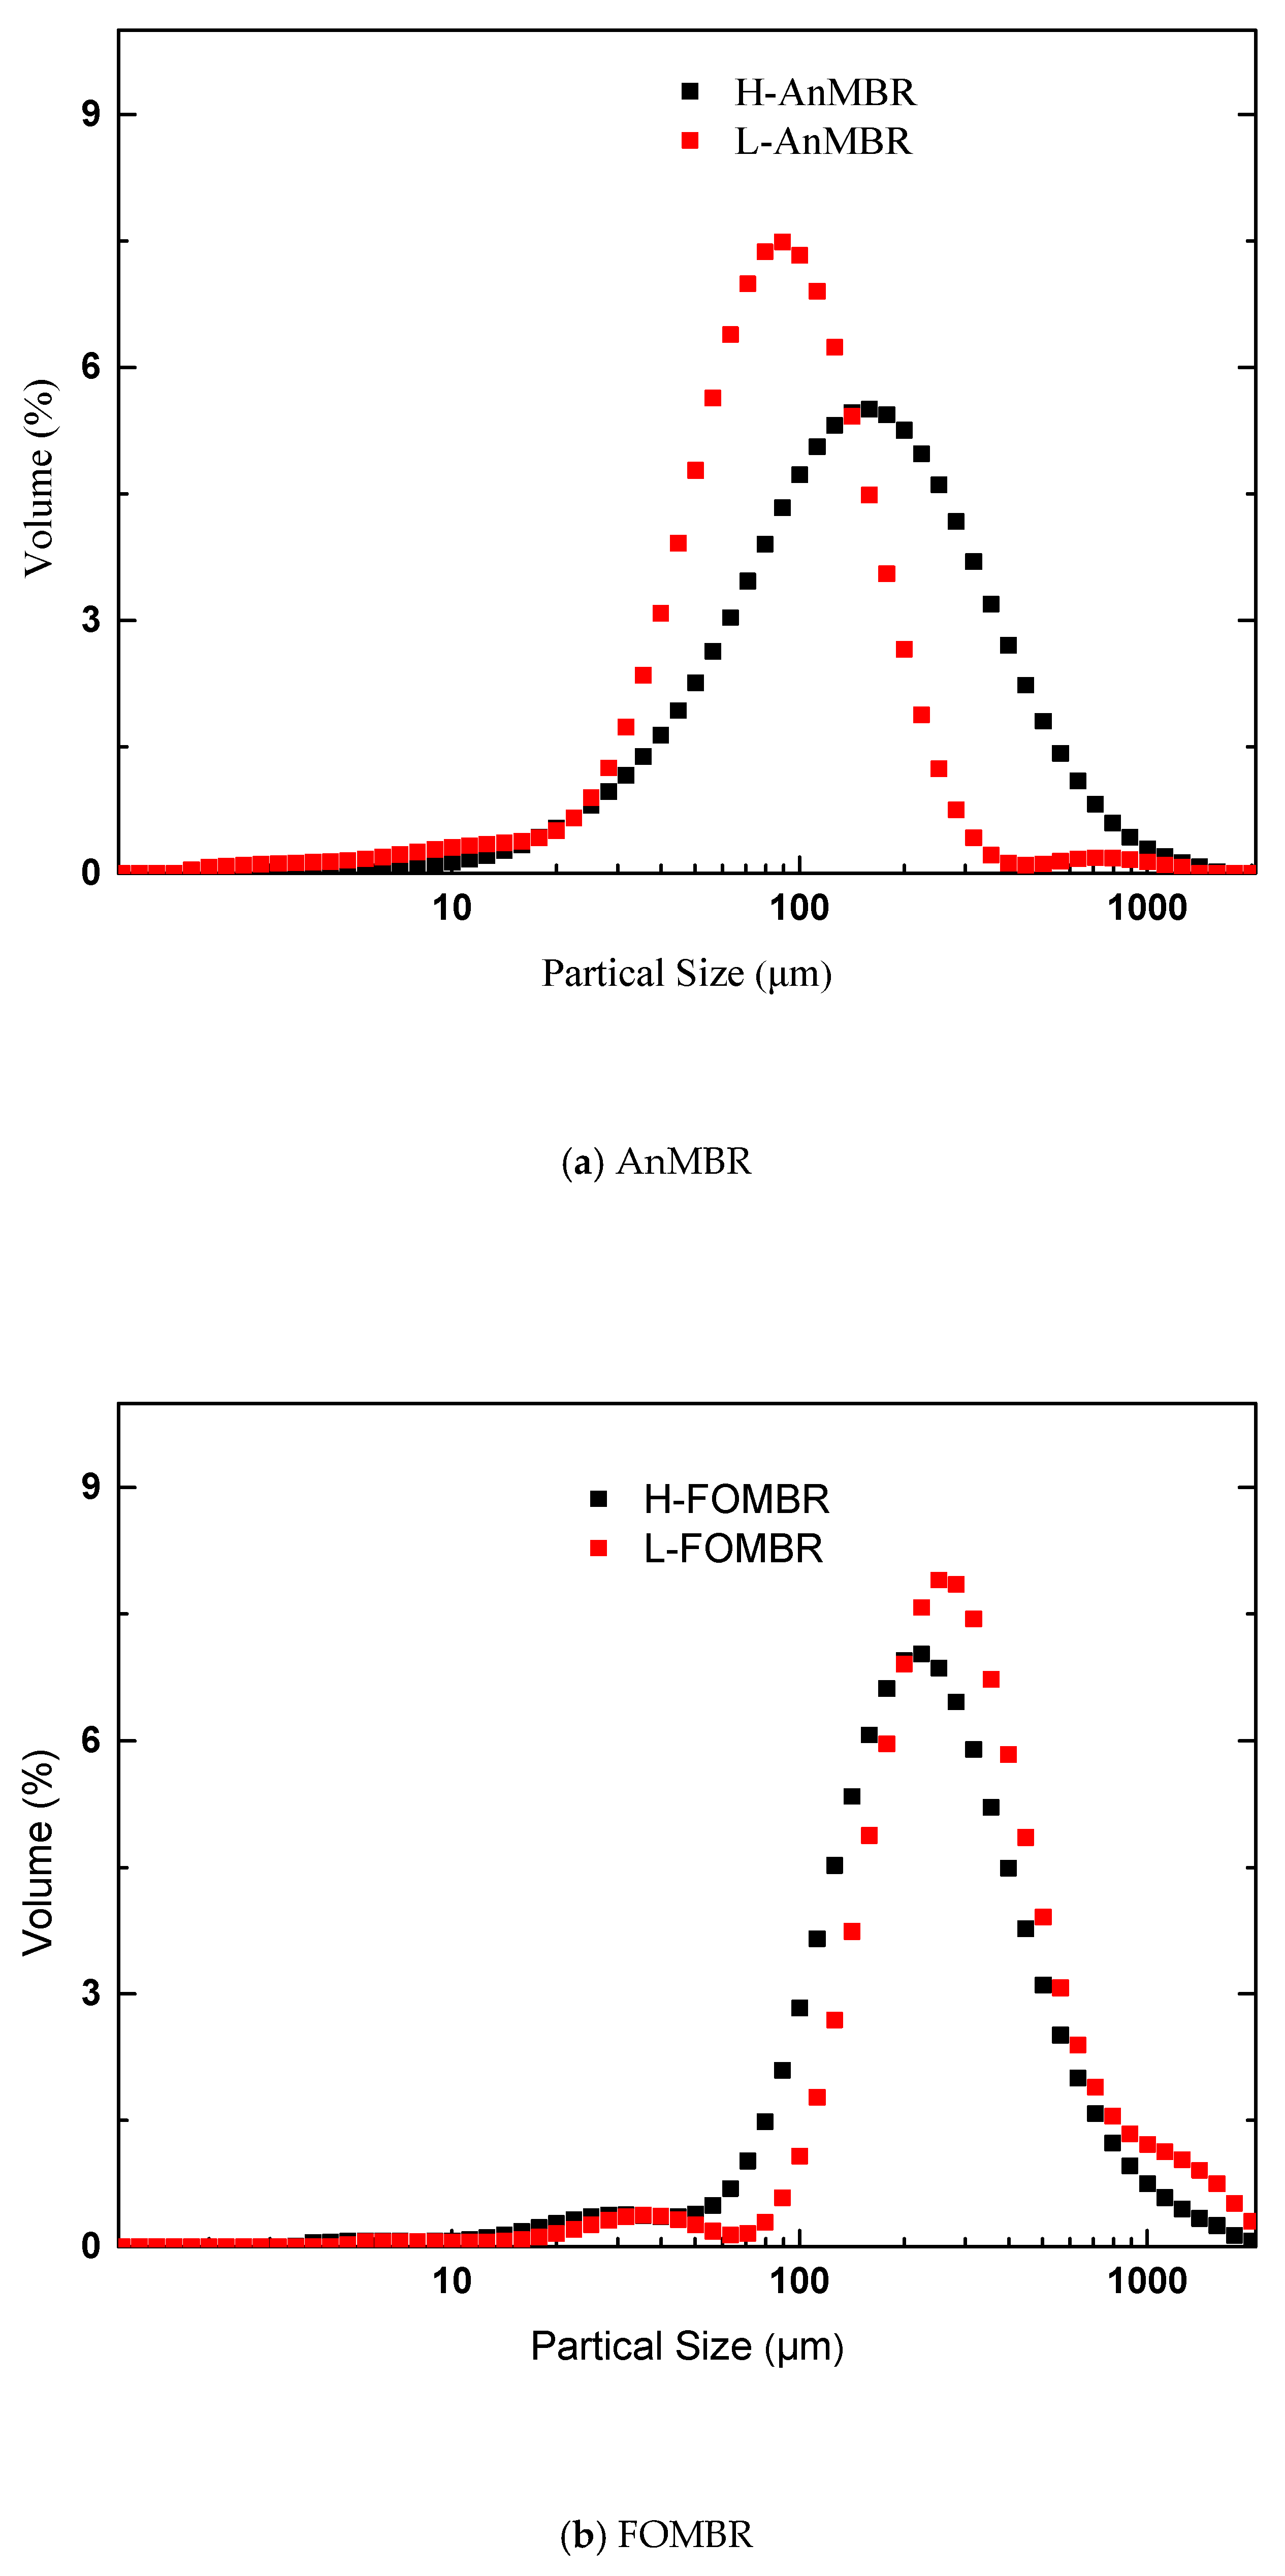
3.4.3. Particle Size Distribution of Sludge Flocs

The particle size of the mixture has a certain impact on membrane fouling [28,29,30]. The particle size distribution of activated sludge in the combined system is shown in Figure 8. It can be seen from Figure 8a that there are two peaks in the particle size distribution of L-AnMBR, which are in the ranges of 2–20 and 30–150 μm, respectively, while the particle size of H-AnMBR only had a wide range of 50–400 μm. In the activated sludge of L-AnMBR, 4.2% of the particle size distribution was 2–20 μm, and 81.5% of the particles were 30–150 μm; in the activated sludge of H-AnMBR, 81.14% of the particles were in the range of 50–400 μm, only 2.7% of the particles were in the range of 2–20 μm and 58.3% of the particles were in the range of 30–150 μm. It can be seen that the sludge particle size of H-AnMBR is larger than that of L-AnMBR.
It can be seen from the particle size distribution parameters more clearly that the volume median diameter D (0.5) of H-AnMBR sludge is higher than that of L-AnMBR sludge, which showed that the particle size of H-AnMBR-activated sludge is larger than that of L-AnMBR-activated sludge. Zhou et al. reported that the micro-particles were mainly formed by filamentous microorganisms associated with the cake layer resistance, and the colloidal particles were mainly formed by sulphate-reducing bacteria linked to the initial fouling formation [31]. Smith et al. speculated that the decrease in median particle size likely accelerated membrane fouling [9].
Compared with anaerobic activated sludge, the particle size of aerobic activated sludge was larger. From the particle size distribution of forward osmosis activated sludge (Figure 8b), it can be seen that the particle size distribution curve of activated sludge in L-FOMBR shifted to the large particle size direction compared to that of activated sludge in H-FOMBR. The particle size of H-FOMBR-activated sludge was significantly smaller than that of L-FOMBR-activated sludge. The particle size distribution ratios of activated sludge in the two reactors were similar, but the particle size ranges were different.
The particle size of activated sludge in the FOMBR showed a bimodal distribution. The bimodal positions of the particle distribution for H-FOMBR-activated sludge were 2–30 μm and 70–350 μm, respectively, accounting for 4.0% and 79.9% of the particle distribution, while the bimodal positions of L-FOMBR were 5–70 μm and 160–630 μm, respectively, accounting for 3.0% and 76.7% of the particle distribution. From the parameters of sludge particle size, it can be seen that the particle size of the H-FOMBR is significantly smaller than that of the L-FOMBR. The volume median diameter D (0.5) of activated sludge in L-FOMBR were almost twice of that of activated sludge in H-FOMBR. Although the forward osmosis membrane was different from the microporous membrane, compared with the large particle size, the deposition of small particle size on the membrane surface could cause the compact cake layer. Therefore, the small particle size sludge can reduce the effluent flux faster, which was the reason for the forward osmosis membrane fouling.
It can be seen from this that different influent water quality changed the particle size of sludge flocs in FOMBR, resulting in a different membrane fouling rate for the FOMBR. Therefore, in the process of sewage treatment, the influent of the FOMBR should have a suitable organic content to maintain the particle size of sludge flocs, and the membrane fouling rate of the FOMBR was relatively low at this influent concentration.

4. Conclusions

The combination of an anaerobic membrane bioreactor (AnMBR) and a forward osmosis membrane bioreactor (FOMBR) was operated for wastewater treatment. The operation parameters of the AnMBR and FOMBR were optimized by the experiment. Continuous biogas production could be observed in AnMBR systems, and the methane production rate of in the AnMBR at 25 °C (L-AnMBR) was lower than that in the AnMBR at 35 °C (H-AnMBR). During the 180 days of operation, the permeate CODs of the two systems were almost the same with the values of 7.57 and 7.58 mg/L, respectively, but the TN treatment performance in the L-AnMBR–FOMBR system was better compared to the H-AnMBR–FOMBR system. As for the sludge characteristics of the AnMBR and FOMBR, the activated sludge dewaterability of H-AnMBR–FOMBR system was better than that of the corresponding unit in the L-AnMBR–FOMBR system. The sludge particle size of activated sludge showed different trends in different units of the two systems. The floc size of H-AnMBR-activated sludge was larger than that of L-AnMBR-activated sludge; however, the floc size of H-FOMBR sludge was significantly smaller than that of L-FOMBR sludge. The different sludge characteristics had little effect on treatment performance of the AnMBR–FOMBR system. In general, the two systems both could achieve better treatment performance, and the combined system was feasible.

Author Contributions

Data curation, Z.G.; formal analysis, C.J. and C.Z.; investigation, Y.D. and Z.L. (Zhenlin Liang); writing—original draft, Z.L. (Zhipeng Li); writing—review and editing, X.H. and J.M. All authors have read and agreed to the published version of the manuscript.

Funding

This study was supported by the National Natural Science Foundation of China (No. 51408158) and the Natural Science Foundation of Shandong Province of China (No. ZR2019QEE012).

Conflicts of Interest

The authors declare that they have no conflict of interest.

References

  1. Vinardell, S.; Astals, S.; Peces, M.; Cardete, M.A.; Fernández, I.; Mata-Alvarez, J.; Dosta, J. Advances in anaerobic membrane bioreactor technology for municipal wastewater treatment: A 2020 updated review. Renew. Sustain. Energy Rev. 2020, 130, 109936. [Google Scholar] [CrossRef]
  2. Lim, M.; Patureau, D.; Heran, M.; Lesage, G.; Kim, J. Removal of organic micropollutants in anaerobic membrane bioreactors in wastewater treatment: Critical review. Environ. Sci. Water Res. Technol. 2020, 6, 1230–1243. [Google Scholar] [CrossRef]
  3. Zhen, L.; Shuming, Y.; Yuyou, L.; Wen, W.; Wang, X.C.; Rong, C. Application of anaerobic membrane bioreactors to municipal wastewater treatment at ambient temperature: A review of achievements, challenges, and perspectives. Bioresour. Technol. 2018, 267, 756–768. [Google Scholar]
  4. Ozgun, H.; Dereli, R.K.; Ersahin, M.E.; Kinaci, C.; Spanjers, H.; van Lier, J.B. A review of anaerobic membrane bioreactors for municipal wastewater treatment: Integration options, limitations and expectations. Sep. Purif. Technol. 2013, 118, 89–104. [Google Scholar] [CrossRef]
  5. Martinez-Sosa, D.; Helmreich, B.; Netter, T.; Paris, S.; Bischof, F.; Horn, H. Anaerobic submerged membrane bioreactor (AnSMBR) for municipal wastewater treatment under mesophilic and psychrophilic temperature conditions. Bioresour. Technol. 2011, 102, 10377–10385. [Google Scholar] [CrossRef]
  6. Foglia, A.; Akyol, Ç.; Frison, N.; Katsou, E.; Eusebi, A.L.; Fatone, F. Long-term operation of a pilot-scale anaerobic membrane bioreactor (AnMBR) treating high salinity low loaded municipal wastewater in real environment. Sep. Purif. Technol. 2020, 236, 116279. [Google Scholar] [CrossRef]
  7. Zhen, G.; Pan, Y.; Lu, X.; Li, Y.-Y.; Zhang, Z.; Niu, C.; Kumar, G.; Kobayashi, T.; Zhao, Y.; Xu, K. Anaerobic membrane bioreactor towards biowaste biorefinery and chemical energy harvest: Recent progress, membrane fouling and future perspectives. Renew. Sustain. Energy Rev. 2019, 115, 109392. [Google Scholar] [CrossRef]
  8. Lin, H.J.; Peng, W.; Zhang, M.J.; Chen, J.R.; Hong, H.C.; Zhang, Y. A review on anaerobic membrane bioreactors: Applications, membrane fouling and future perspectives. Desalination 2013, 314, 169–188. [Google Scholar] [CrossRef]
  9. Smith, A.L.; Stadler, L.B.; Love, N.G.; Skerlos, S.J.; Raskin, L. Perspectives on anaerobic membrane bioreactor treatment of domestic wastewater: A critical review. Bioresour. Technol. 2012, 122, 149–159. [Google Scholar] [CrossRef]
  10. Wang, X.; Wang, C.; Tang, C.Y.; Hu, T.; Li, X.; Ren, Y. Development of a novel anaerobic membrane bioreactor simultaneously integrating microfiltration and forward osmosis membranes for low-strength wastewater treatment. J. Membr. Sci. 2017, 527, 1–7. [Google Scholar] [CrossRef]
  11. Cornelissen, E.R.; Harmsen, D.; de Korte, K.F.; Ruiken, C.J.; Qin, J.J.; Oo, H.; Wessels, L.P. Membrane fouling and process performance of forward osmosis membranes on activated sludge. J. Membr. Sci. 2008, 319, 158–168. [Google Scholar] [CrossRef]
  12. Achilli, A.; Cath, T.Y.; Marchand, E.A.; Childress, A.E. The forward osmosis membrane bioreactor: A low fouling alternative to MBR processes. Desalination 2009, 239, 10–21. [Google Scholar] [CrossRef]
  13. Yap, W.J.; Zhang, J.S.; Lay, W.C.L.; Cao, B.; Fane, A.G.; Liu, Y. State of the art of osmotic membrane bioreactors for water reclamation. Bioresour. Technol. 2012, 122, 217–222. [Google Scholar] [CrossRef] [PubMed]
  14. Cornelissen, E.R.; Harmsen, D.; Beerendonk, E.F.; Qin, J.J.; Oo, H.; de Korte, K.F.; Kappelhof, J.W.M.N. The innovative Osmotic Membrane Bioreactor (OMBR) for reuse of wastewater. Water Sci. Technol. 2011, 63, 1557–1565. [Google Scholar] [CrossRef] [PubMed]
  15. Qin, J.J.; Kekre, K.A.; Oo, M.H.; Tao, G.H.; Lay, C.L.; Lew, C.H.; Cornelissen, E.R.; Ruiken, C.J. Preliminary study of osmotic membrane bioreactor: Effects of draw solution on water flux and air scouring on fouling. Water Sci. Technol. 2010, 62, 1353–1360. [Google Scholar] [CrossRef]
  16. Lay, W.C.L.; Zhang, Q.Y.; Zhang, J.S.; McDougald, D.; Tang, C.Y.; Wang, R.; Liu, Y.; Fane, A.G. Study of integration of forward osmosis and biological process: Membrane performance under elevated salt environment. Desalination 2011, 283, 123–130. [Google Scholar] [CrossRef]
  17. Zhang, J.S.; Loong, W.L.C.; Chou, S.R.; Tang, C.Y.; Wang, R.; Fane, A.G. Membrane biofouling and scaling in forward osmosis membrane bioreactor. J. Membr. Sci. 2012, 403, 8–14. [Google Scholar] [CrossRef]
  18. Ding, Y.; Liang, Z.L.; Guo, Z.S.; Li, Z.P.; Hou, X.G.; Jin, C. The Performance and Microbial Community Identification in Mesophilic and Atmospheric Anaerobic Membrane Bioreactor for Municipal Wastewater Treatment Associated with Different Hydraulic Retention Times. Water 2019, 11, 160. [Google Scholar] [CrossRef] [Green Version]
  19. Chinese Environmental Science Press. Standard Methods for Examination of Water and Wastewater, 4th ed.; Chinese Environmental Science Press: Beijing, China, 2002. [Google Scholar]
  20. Baek, S.H.; Pagilla, K.R.; Kim, H.-J. Lab-scale study of an anaerobic membrane bioreactor (AnMBR) for dilute municipal wastewater treatment. Biotechnol. Bioproc. E 2010, 15, 704–708. [Google Scholar] [CrossRef]
  21. Dvořák, L.; Gómez, M.; Dolina, J.; Černín, A. Anaerobic membrane bioreactors—A mini review with emphasis on industrial wastewater treatment: Applications, limitations and perspectives. Desalin. Water Treat. 2015, 57, 19062–19076. [Google Scholar] [CrossRef] [Green Version]
  22. Nemestóthy, N.; Bakonyi, P.; Szentgyrgyi, E.; Kumar, G.; Nguyen, D.D.; Chang, S.W.; Kim, S.H.; Bélafi-Bakó, K. Evaluation of a membrane permeation system for biogas upgrading using model and real gaseous mixtures: The effect of operating conditions on separation behaviour, methane recovery and process stability. J. Clean. Prod. 2018, 185, 44–51. [Google Scholar] [CrossRef] [Green Version]
  23. Ahmad, W.; Sethupathi, S.; Kanadasan, G.; Lau, L.C.; Kanthasamy, R. A review on the removal of hydrogen sulfide from biogas by adsorption using sorbents derived from waste. Rev. Chem. Eng. 2019. [Google Scholar] [CrossRef]
  24. Agustini, C.; da Costa, M.; Gutterres, M. Biogas production from tannery solid wastes–Scale-up and cost saving analysis. J. Clean. Prod. 2018, 187, 158–164. [Google Scholar] [CrossRef]
  25. Abad, V.; Avila, R.; Vicent, T.; Font, X. Promoting circular economy in the surroundings of an organic fraction of municipal solid waste anaerobic digestion treatment plant: Biogas production impact and economic factors. Bioresour. Technol. 2019, 283, 10–17. [Google Scholar] [CrossRef] [PubMed]
  26. Trzcinski, A.P.; Stuckey, D.C. Treatment of municipal solid waste leachate using a submerged anaerobic membrane bioreactor at mesophilic and psychrophilic temperatures: Analysis of recalcitrants in the permeate using GC-MS. Water Res. 2010, 44, 671–680. [Google Scholar] [CrossRef] [Green Version]
  27. Dhaked, R.K.; Singh, P.; Singh, L. Biomethanation under psychrophilic conditions. Waste Manag. 2010, 30, 2490–2496. [Google Scholar] [CrossRef]
  28. Christensen, M.L.; Niessen, W.; Sørensen, N.B.; Hansen, S.H.; Jørgensen, M.K.; Nielsen, P.H. Sludge fractionation as a method to study and predict fouling in MBR systems. Sep. Purif. Technol. 2018, 194, 329–337. [Google Scholar] [CrossRef]
  29. Dong, Q.; Parker, W.; Dagnew, M. Impact of FeCl3 dosing on AnMBR treatment of municipal wastewater. Water Res. 2015, 80, 281–293. [Google Scholar] [CrossRef]
  30. Ozgun, H.; Tao, Y.; Ersahin, M.E.; Zhou, Z.; Gimenez, J.B.; Spanjers, H.; van Lier, J.B. Impact of temperature on feed-flow characteristics and filtration performance of an upflow anaerobic sludge blanket coupled ultrafiltration membrane treating municipal wastewater. Water Res. 2015, 83, 71–83. [Google Scholar] [CrossRef]
  31. Zhou, Z.; Tao, Y.; Zhang, S.; Xiao, Y.; Meng, F.; Stuckey, D.C. Size-dependent microbial diversity of sub-visible particles in a submerged anaerobic membrane bioreactor (SAnMBR): Implications for membrane fouling. Water Res. 2019, 159, 20–29. [Google Scholar] [CrossRef]
Figure 1. The schematic representation of the combined system consisting of AnMBR and FOMBR.
Water 12 02958 g001
Figure 2. The gas composition (a) and the cumulative methane content (b) in the H-AnMBR and L-AnMBR.
Water 12 02958 g002
Figure 3. The change trends (a) and composition (b) of volatile fatty acids (VFAs) in the H-AnMBR and L-AnMBR.
Water 12 02958 g003
Figure 4. The chemical oxygen demand (COD) concentrations in the influent, supernatant and permeate during the whole operation period in the H-AnMBR and L-AnMBR (a) and the H-FOMBR and L-FOMBR (b).
Water 12 02958 g004aWater 12 02958 g004b
Figure 5. The evolution of total nitrogen (TN) concentrations in the H-AnMBR and L-AnMBR and the H-FOMBR and L-FOMBR.
Water 12 02958 g005
Figure 6. Photos of activated sludge flocs from the (a) H-AnMBR and (b) L-AnMBR and the (c) H-FOMBR and (d) L-FOMBR.
Water 12 02958 g006
Figure 7. SEM pictures of activated sludge flocs from the (a) H-AnMBR and (b) L-AnMBR and the (c) H-FOMBR and (d) L-FOMBR.
Water 12 02958 g007aWater 12 02958 g007b
Figure 8. Particles size distributions of sludge samples in (a) AnMBRs and (b) FOMBRs.
Water 12 02958 g008
Table 1. Optimized operational parameters of the AnMBR.
Membrane Module ConfigurationMixing Speed (rpm)Suction and Pause Time (min/min)SRT (d)COD Removal Efficiency (%)
Ring Type1504/130089.1
Flat-Sheet1504/130087.5
Curtain Type1504/130088.7
Ring Type2504/130070.9
Ring Type504/130086.3
Ring Type1508/230084.4
Ring Type1507/330084.9
Ring Type1504/115080.4
Ring Type1504/145082.9
Table 2. Optimized operational parameters of forward osmosis membrane bioreactors (FOMBRs).
The Species of Draw Solution The Orientation of the Active LayerThe Concentration of Dissolved Oxygen (mg/L)SRT (d)The Concentration of Draw Solution (mol/L)The Membrane Fouling Cycle (d)
NaClthe reaction pool2.580130
MgCl2the reaction pool2.580118
NaClthe driving pool2.580125
NaClthe reaction pool4.080123
NaClthe reaction pool2.540120
NaClthe reaction pool2.580228
Table 3. The characters of active sludge in combined systems.
MLSS (mg/L)MLVSS (mg/L)SVI (mL/g)Viscosity (Pa·s)CST (s)
H-AnMBR58615211118.581.3149.5
L-AnMBR60245098151.892.0969.6
H-FOMBR25001212134.001.4815.6
L-FOMBR3200221092.191.4414.6
Publisher’s Note: MDPI stays neutral with regard to jurisdictional claims in published maps and institutional affiliations.

