1. Introduction
The Water Supply and Sewerage Company of Thessaloniki (EYATH S.A.) in Greece maintains and manages a large number of installations and water distribution systems, including pumping stations, water tanks, and large diameter pipeline, aiming to transport water to all areas of the Thessaloniki conurbation under its responsibility, and to satisfy the water needs of its numerous consumers. The city of Thessaloniki, the second largest city in Greece, has a dual and quite complex water supply system, partially covering its water needs with groundwater (aqueduct of Aravissos) and surface water (aqueduct of Aliakmonas river). The aqueducts of Thessaloniki city have been studied and constructed over a long period depending on the water needs and available resources, while nowadays the whole system operates on a daily basis to meet the water demand needs of the city.
1.1. Aim and Objectives
The present work primarily aims at the development and implementation of a detailed hydraulic model for the aqueducts of the Thessaloniki conurbation, which will be able to simulate and assess the hydraulic behavior of the system’s elements and critical infrastructure for its current operational status, as well as its response to different management strategies in case of emergency conditions. To accomplish this main goal, a thorough attempt is made to: (1) produce reliable estimates of water demand in the different areas of Thessaloniki conurbation, (2) collect and update available topographical, geometrical and hydraulic data regarding the current status of the water supply system, and (3) adjust the calibration parameters of the model accordingly based on the aforementioned data. In this work, hydraulic simulation of the water distribution system (WDS) of Thessaloniki in its current operational status is also considered with the development, analysis, and simulation of alternative emergency scenarios for distributing water to the different areas of the city in case of a failure in one of its aqueducts. The former emergency scenarios also incorporate the utilisation of existing interconnections between the aqueducts, not deployed under normal operating conditions of the system.
The hydraulic simulation of Thessaloniki’s aqueducts under normal and emergency conditions, such as failure in any of the city’s aqueducts causing water shortage for quite an elongated period of time and discomfort to the city’s residents, will significantly assist understanding the aqueducts’ operating rules and restrictions. Assessing the hydraulic behavior of the studied system under abnormal and sometimes critical conditions targets the management of available water reserves fairly and equally among the different areas of the city, with the fewest possible interventions and operations by the managing company’s staff during the crisis. It also contributes to finding optimum ways of managing available water resources, as well as formulating operating rules for existing pumping stations and water tanks of the network, in order to handle and manage a crisis during the time needed for repair works. This work was highly motivated by a severe structural failure which occurred on the main pipeline of one of the city’s aqueducts (aqueduct of Aravissos) in 2018, resulting in water shortage for almost one week in the entire city and causing emergency conditions for both the managing company, EYATH S.A., and the city itself. This serious crisis reinforced the need for a detailed and up-to-date hydraulic simulation of the city’s aqueducts, which incorporates, explores, and simulates alternative scenarios for distributing the available resources among the different areas of the network in a fair and equitable way, in case of a severe failure in one of the city’s aqueducts. A flow diagram of the proposed methodology is presented in
Figure 1.
The methodology introduced in this work is quite simple, comprehensive, and practical, mainly on the basis of the simulation procedures used to cope with water shortage conditions in the aqueducts of quite a large and complex WDS, with a limited existing SCADA (supervisory control and data acquisition) system. For emergency conditions resembling those described in this work, a modified hydraulic analysis is currently applied in the literature. This analysis does not necessarily consider the required demands of the WDS, but examines water availability based on pressure conditions at its nodes. Therefore, unlike the demand-driven analysis (DDA), demand at a certain node of the network is herein considered a function of pressure, therefore flow is set equal to zero if the nodal head is below a critical minimum value and increases up to a desirable threshold of the nodal head until an adequate flow is satisfied (nodal demand). However, in this work, an analysis based on pressure-dependent demands is avoided. The necessity to deviate from such an analysis results mainly from difficulties in extracting typical pressure-dependent demand curves for the different areas of the WDS considering that the system is poorly instrumented, as well as in defining thresholds for both the minimum and desirable head of the different demand nodes. The approach introduced in this work is beneficial in the sense that it considers a demand satisfaction ratio, defined as the ratio of the flow that is available to the flow that is required, for each area of the WDS equal to unit during water supply periods, which assists in fulfilling the main objectives of water distribution management under abnormal conditions of the system.
The methodology presented also includes different aspects that could possibly lead to more reliable and feasible hydraulic simulations of WDSs, especially for those that are poorly instrumented, under both normal and abnormal conditions. Assessing water demand in the different areas of the WDS is one such aspect. In this work, water demand estimation in the different areas of the city combines: (a) design/theoretical methods, (b) measurements from the existing limited SCADA system, and (c) measured data of water consumption from water meters installed in the different areas of the WDS. After assessing water demand in the different areas of the network, the hydraulic model is calibrated for both pipe roughness characteristics and the hydraulic properties of float valves and TCVs in EPS mode. To accomplish this, the system is first divided into smaller and distinct parts, and an iterative procedure is followed for certain hydraulic parameters to converge to measured quantities or satisfy defined constraints.
This work introduces and simulates different scenarios of system operation in the case of failure in the aqueducts of a real case study, following a real emergency event which happened in the city Thessaloniki in 2018, analysing and comparing the response of the system to each of these scenarios and examining the fulfilment of requirements and objectives set by the managing authority. Within this framework, different alternative scenarios of system operation in the case of emergency are considered. These scenarios do not only include different intermittent water supply schedules, but also consider completely cutting off water supply in entire areas after some time, or utilise existing pipes or/and pumping stations not used under normal operating conditions of the WDS.
1.2. Literature Review
Hydraulic simulation of pressurised pipe systems is quite a crucial step for managing large water distribution networks (WDNs), as well as for decision making under both normal and abnormal conditions. EPANET is a freely distributed modeling software package by EPA (United States Environmental Protection Agency) which is used, among other things, to design new WDNs and water infrastructure, as well as to analyse and manage existing WDNs, optimise the operations of tanks and pumps, and investigate water quality problems [
1]. OpenFlows WaterGEMS software [
2], based on the hydraulic engine of EPANET, is a flexible modeling environment to design, analyse and optimise WDSs, provided with advanced hydraulic features, geospatial model-building, optimisation and asset management tools. Yu-Kun et al. [
3] present a modeling approach of the WDN of Zhengzhou city in China using WaterGEMS software, based on information acquired from a GIS (Geographic Information System) database. Peaking factor and pipe roughness coefficient of the studied network are assessed by means of a sensitivity analysis. Avesani et al. [
4] describe modifications to EPANET software for modeling WDNs with variable tank heads in unsteady flow conditions. Jiang et al. [
5] introduce a detailed analysis of a water supply network in WaterGEMS software, emphasising on pipe modeling processes, as well as on collection of flow and pressure SCADA data used for calibrating the model. Elsheikh et al. [
6] model the aging WDN of Tanta city in Egypt using WaterCAD Haestad software to consider optimal interventions and possible extensions of the network. Steady state measurements, fire flow tests, and extended period measurements of pressure and flow are used to assess the roughness coefficient of pipes of the studied network. Okeya et al. [
7] introduce an online modeling approach of a WDS combing a hydraulic model with SCADA and data assimilation techniques, to improve the real-time estimation of water demand and to predict reliable future system states. Alves et al. [
8] present an EPANET-based approach to modeling and calibrating a WDN presenting pressure problems and characterised by a scarce data inventory. The model is run multiple times, finally achieving a good representation of the simulated system and a satisfactory level of accuracy. Sonaje and Joshi [
9] review available software used for modeling WDNs, intercomparing them in terms of application. Kara et al. [
10] present an EPANET-based hydraulic model of a touristic area in Antalya, Turkey, characterised by large temporal and spatial variations of water consumption profiles and rates throughout the highly varying topographic levels of the area. Pressure and flow measurements from a SCADA station located at the entrance of the DMA (District Metered Area), pressure measurements at different elevations, monthly water consumption rates of the population served, and hourly water consumption rates of representative end users of the service, are used to calibrate the hydraulic model. Świtnicka et al. [
11] use WaterGEMS software to optimise the operation of a WDS by maximising flow velocity in the system’s pipes, regulating pressure head, and minimising water retention time in the network and pump energy consumption. Optimal solution for the network, including pipe diameters, hydraulic parameters of pumps, as well as locating new pressure reducing valves (PRVs) and pipe connections, is found using metaheuristic methods, such as genetic algorithms. Chatzivasili et al. [
12] introduce a hybrid, two-stage approach for modeling large scale WDNs and evaluate the proposed approach through WaterGEMS software, obtaining very good results. The proposed approach uses the Geometric Partitioning Method to divide the WDN into smaller areas, followed by the application of Student’s t-mixture model to find optimal locations for isolation valves and to separate DMAs.
Under pressure-deficient conditions of a WDS, demand can only be partially satisfied until the system fully recovers. Under such emergency conditions, the actual water amount available at a demand node depends on available pressure conditions by means of establishing a node head-flow relationship (NHFR). Analysis based on NHFR has been used, among others, in parameter calibration, leakage management, and vulnerability and reliability analysis of WDSs [
13,
14,
15,
16,
17,
18,
19]. Ingeduld et al. [
20] adjust the EPANET source code to model intermittent water supply and present a simplified model where node demands depend on respective pressure values. Wu and Walski [
21] develop and present an approach to simulate abnormal events in WDNs based on pressure-dependent demand modeling. Fiorini Morosini et al. [
22] propose a pressure-driven analysis (PDA) based approach to efficiently manage a WDN during emergency conditions. Pressure-deficient conditions are usually simulated by a NHFR acting to reduce or even eliminate the nodal demand when the pressure drops below certain appropriately defined thresholds [
23,
24]. Such conditions are also simulated by incorporating artificial elements (i.e., reservoirs, pipes, flow control valves, emitters) in the WDS [
24,
25,
26,
27]. Two principal schemes of this category can be summarised in the inclusion of artificial reservoirs coupled with flow control valves (FCVs), check valves, and artificial pipes with suitable resistance properties [
27] and emitters connected to demand nodes coupled with FCVs and check valves [
24].
Lee et al. [
28] propose modification techniques in the applied hydraulic models to resolve issues of negative pressure DDA or of total head reverse in PDA, arising during abnormal conditions of the network caused by pipe damages or rapid increases in demand. Nardo et al. [
29] use fractal and topological metrics to assess the resilience of a WDN to a possible pipe failure and test the proposed methodology on two real WDNs in southern Italy. Batish [
30] introduces a methodology to design intermittent water supply networks to adjust to financial constraints in the operation of drinking water systems in developing countries. Fontanazza et al. [
31] propose a methodology for analyzing an intermittent water supply system under water scarcity conditions, resulting in significant alterations to both water availability for the users, as well as to the performance of the network itself. Vairavamoorthy et al. [
32] analyse guidelines for the design and control of intermittent WDSs under water scarcity conditions in developing countries, and incorporate all required modifications in a network analysis simulation tool coupled with an optimal design tool. Soltanjalili et al. [
33] propose hedging or intermittent water supply as an appropriate means to confront with water shortage conditions. Their methodology considers available water, consumption fluctuations, and consumer satisfaction, among other factors, by linking the EPANET 2 hydraulic simulator to the honey-bee mating optimisation (HBMO) algorithm, and calculating WDN performance criteria. However, Agathokleous and Christodoulou [
34] highlight that intermittent water supply practices and operations negatively affect the vulnerability of WDNs, estimating an increase in the number of water loss incidents during and immediately after such periods.
2. Study Area and Available Data
To meet the water demand needs of the conurbation of Thessaloniki, EYATH S.A. supplies water to around 500,000 water meters in the area. The water needs of the city are currently covered by three resources: (1) Aliakmonas river (surface water), (2) Aravissos springs (source water), and (3) water supply boreholes in the plain of Thessaloniki (groundwater). The abovementioned water sources provide drinking water to the conurbation of Thessaloniki via the aqueduct of Aliakmonas, which conveys water from Aliakmonas river to the Thessaloniki Water Treatment Plant (TWTP), and via the aqueduct of Aravissos, which transports water from Aravissos springs and water supply boreholes of the broader area of Thessaloniki to the central pumping station of Dendropotamos at the southwestern edge of the city. Within the conurbation of Thessaloniki, there is a wide network of water tanks and pumping stations that receive water from one of the two aqueducts, or from both aqueducts at the same time. The aqueducts of Thessaloniki extend over 460 km, while the entire WDS consists of water supply pipes with a total length exceeding 2690 km.
Operation of the aqueduct of Aliakmonas started in 2003, transporting water to central tanks of high-altitude areas in the conurbation of Thessaloniki, while in the low-altitude areas of the city, water was still supplied by the aqueduct of Aravissos (the oldest aqueduct used to supply the entire city before 2003). The aqueduct of Aliakmonas brought significant changes to both the operation and management of pumping stations, tanks, and WDNs of Thessaloniki, effectively transferring the “gravity center” of the water supply system. However, nowadays there are still tanks in the water system of the city which are supplied simultaneously by both aqueducts. During the last decades, the inclusion of new areas characterised by increased urban development (residential and commercial), together with an apparent degradation of the water quality of some of Thessaloniki’s water supply boreholes, which renders them inappropriate for use, resulted in a marginal coverage of the city’s total water needs, especially during the summer months. Considering the aforementioned problem, a main priority for EYATH S.A. included in the Water Resources Management Plan of Thessaloniki [
35] is to increase the capacity of the TWTP to an output of 300,000 m
3/day (2nd stage of the TWTP), considering that its current capacity can reach 150,000 m
3/day (1st stage of the TWTP).
For Aravissos aqueduct, two pressure pipes (DN800 and DN1000) start from the central pumping station-suction tank of Dendropotamos (P-ST35) transporting water to the pumping station suction tank of Evangelistria (P-ST17), pumping group of DN800, and pumping stations-suction tanks of Kalithea (P-ST12) and Kassandrou (P-ST14), pumping group of DN1000. From P-ST17, water is pumped to the tanks of Agios Pavlos (T18) and Saranta Eklisies (T19). P-ST12 pumps water to the tanks of Neapolis (T10), Kafkasou (T11), and Sykies (T13), while water is pumped from T13 to the high-altitude tank of Eptapirgio (T15). P-ST14 supplies water to tanks of Vlatades (T16) and Toumpa (T20). From T20, water is transferred to the tank of Kalamaria (T27), and pumped to the tank of Pylaia (T21), which in turn pumps water to a series of tanks in the settlement of Panorama in eastern Thessaloniki (T22—Lykoi, T23—Gymnasio, T61—Tompoudes, T24—Analipsi, T25—Toumpitsa). For Aliakmonas river aqueduct, a DN1700 steel pipe starts from the outlet of the TWTP and ends up to the pumping station of Ionia (P-3), after suppling the industrial area of Thessaloniki and the tank of Diavata (T36) with water. T36, which also collects water from boreholes in the areas of Axios and Eleousa, supplies water to the petroleum industry EKO and pumps water to the tank of Kato Evosmos (T6), in the western part of the city. From P-3, water is transferred to the regulating tank of Oraiokastro (T4) and from there to a number of tanks located in moderate to high-altitude areas of the city. More specifically, the aqueduct of Aliakmonas provides water to the tanks of Ano Evosmos (T5), Efkarpia (T63), Meteora (T9), Polichniotisa (T7), Androutsou (T48), Zefiron (T59), Akropolis (T64), as well as tanks in the area of Oraiokastro (T44, T45, T47, T50, T52, T69) and partly to the tanks of Neapolis (T10), Vlatadon (T16), Toumpa (T20) and Kalamaria (T27).
Figure 2 presents a basic layout of Thessaloniki’s aqueducts within the conurbation. Blue, red, purple, and orange colors represent water supplied by the aqueduct of Aravissos, Aliakmonas, Aravissos, and Aliakmonas, or Aliakmonas and water supply boreholes, respectively.
Figure 2 also includes information on material and diameter of the system’s main pipes.
From
Figure 2, it is quite obvious that the majority of the system’s tanks is supplied by pumping stations, while there are some tanks supplied by another tank by means of gravity flow in pressurised pipes. For the latter, mostly observed at the pipeline of Aliakmonas aqueduct, water supply is controlled using TCVs or float valves. TCVs are also installed on pipes entering P-ST12 and P-ST14 (pumping group DN1000) because both installations are supplied from P-ST35 through the main pressure pipe DN1000. Field trips were conducted for the purposes of this study, focusing on data collection for TCVs (butterfly valves) of the city’s aqueducts. The opening and closing angles of the system’s TCVs were measured in the field and transformed to a minor loss coefficient for each valve by means of the minor loss versus valve opening angle curve provided by the manufacturing company. Such estimates are used as initial values of TCV head loss coefficient within the hydraulic model calibration process described in
Section 3.
To set up the hydraulic model of the city’s water supply system, dimensions and main geometrical and hydraulic properties of tanks and pumping stations were collected. For the system’s water tanks the following data was gathered from existing drawings, the company’s GIS system, as well as field measurements: (a) base elevation, (b) minimum elevation of water in the tank, usually considered equal to the elevation of the outlet pipe’s top, (c) maximum elevation of water in the tank, usually considered equal to the elevation of the tank’s overflow pipe, (d) shape of the tank’s cross section, and (e) dimensions of the tank’s cross section. For all pumps and pumping stations of the system, pump curves or nominal flow and head data were collected where available.
Inflows to the WDS of Thessaloniki conurbation were calculated based on available data on daily water quantities transferred from Aravissos springs, Sindos, Halkidona, Axios, and Eleousa water supply boreholes, as well as from the TWTP, provided on a monthly basis for the year 2018. Daily water quantities were also available for the outflows of P-ST35, pumping station P-3 and tank T36, as well as for supplying the industrial area of the city and EKO industry. Using simple averaging of water quantities in all months, and considering the balance of inflows and outflows in both aqueducts of the system, inflows were estimated at 5052 m3/h for the TWTP, 4256 m3/h for Aravissos springs and water supply boreholes of Halkidona, 731 m3/h for the water supply boreholes of Sindos and 469 m3/h for the water supply boreholes of Axios and Eleousa. The average daily water consumption of the conurbation was estimated at 252,217 m3/day, while the minimum and maximum daily water consumption observed in 2018 is 216,964 m3/day and 286,137 m3/day, respectively. The total active volume of the system’s tanks was estimated to correspond to 60.3% of the latter.
The severe structural failure of the Aravissos main pipeline in 2018, resulted in a reduction of about 100,000 m3/day of water supplied to the city, leading to water shortage and causing emergency conditions for both the managing company, EYATH S.A., and the city itself. This serious crisis reinforced the need for a detailed and up-to-date hydraulic simulation of the city’s aqueducts, creating an urgent need to formulate alternative emergency scenarios based on appropriately defined intermittent water supply schedules to distribute the available resources among the different areas of the network. Hydraulic simulation of the city’s aqueducts in case of emergency conditions, such as the ones mentioned above, will contribute to an equitable management of available water quantities, but also to enquire optimal use of available water resources and operation of existing pumping stations and tanks of the WDS.
3. Materials and Methods
3.1. Estimation of Mean Water Demand in the City’s Tank Zones
The hydraulic model of Thessaloniki’s aqueducts includes a network of almost 136 km. The TWTP, and more specifically the tank at the outlet of the facility (T3), T36, and the facility of Kalohori (P-ST34) upstream of P-ST35 are used to define the hydraulic boundary conditions of the modeled water supply system. The hydraulic model created includes twenty-six tanks providing water to their areas of influence (tank zones), while there are seven smaller areas supplied directly by pressure pipes from pumping stations (see
Figure 3). It should be noted that the city center of Thessaloniki is supplied directly from pressure pipe DN800 from P-ST35. The industrial area of Thessaloniki is supplied with almost 35,000 m
3/day, while a constant supply of 4250 m
3/day is also considered for EKO industry.
To estimate water demand in all tank zones of the conurbation, both theoretical and measured data was considered in this work. The theoretical estimation of water demand relied upon using population data, as well as data on specific water consumption of the different urban planning units of Thessaloniki. Population data for all urban planning units of Thessaloniki, referring to year 2018, was obtained using information from 2011 census, as well as information from each municipality’s general urban plan. The specific water consumption for each urban planning unit was assessed processing real data of water consumption, increased by about 25% to account for water losses of the network. The above resulted in estimates of specific water consumption in the conurbation of Thessaloniki ranging from 200 lit/c/day to 350 lit/c/day. Τhe theoretical water demand in all tank zones was then assessed, after calculating the areas of all urban planning units located within the boundaries of each tank zone, estimating water demand within each such part, and finally adding up water demands of all parts of different urban planning units located in a tank zone.
To assist water demand estimation in the tank zones, water consumption data was also acquired for a total of more than 500,000 water meters installed in the conurbation of Thessaloniki. The datasets available include, among other information, the geographical coordinates of each water meter and data on its age and total water volume recorded. The water meters were first geo-allocated on the company’s GIS system and mean annual water consumptions (divide total water volume recorded by age for each water meter) of all water meters belonging to the same tank zone were added. It should be noted that results of the abovementioned procedure should only be used with caution, due to the large number of uncertainties entering the estimation process, that mostly concentrate on inaccuracies in the coordinates of the water meters, location of the boundaries of the system’s tank zones, water meter accuracy (especially for ageing water meters), inaccuracies in water meter age and volume records (especially for very old devices), estimation of mean water consumption ignoring variations throughout the years, and water losses in the WDS.
Final estimates of water demand in each tank zone, to be used in the hydraulic model, were assessed by also considering available information from the existing SCADA system of EYATH S.A. However, it should be noted that the aforementioned SCADA system records the operating state of the WDS only partly, due to the small number of pressure and flow meters installed, as well as the fact that water level is not monitored in all tanks of the system. For tank zones with installed flow meters at the tank’s outlet pipe or downstream a pumping station, measured data were used to assess water demand (i.e., use daily flow data from the pumps’ working schedule at P-ST17 to assess water demand in tank zone T19, or assume a constant rate of decay in water level of T59 to assess water demand in its tank zone). In the majority of tank zones in the study area, theoretical and measured data (i.e., daily water level variations in a tank, daily flow variations at a pumping station’s pressure pipe, water balance of inflows and outflows at a subsystem of the network) were indeed combined to assess water demand, while in areas with no available information, theoretically estimated water demand was assigned to the respective tank zones.
Water demand for each tank zone, estimated as summarised above, was assigned in the hydraulic model as an outflow from each respective tank. For the sake of simplicity, water demand of some small areas supplied directly from pressure pipes (see
Figure 3), was added to water demand of the upstream or downstream tank zone. Therefore, the water demand of areas d, e, and g of
Figure 3 was added to water demand of tank zone T19 (zone d), and T20 (zones e and g), respectively. Tank T39 was not included in the hydraulic model of the system, due to the very low water consumption in its area of influence, while its demand was added to the one of tank zone T6. Water demands of tank zones T44, T45, T47, T50, T52, and T69 were simulated as water consumption from tank T4.
3.2. Calibration of the Hydraulic Model for the Existing Operating State of the System
The existing SCADA system provided available water level data in some of the system’s tanks, as well as pressure and flow measurements downstream of the pumping stations, during a typical day. The data collected were used to calibrate the hydraulic model of the WDS, as well as to extract important information on its operating state. Hydraulic modeling of Thessaloniki’s aqueducts was performed using Bentley OpenFlows WaterGEMS software [
2]. Calibration of the system’s hydraulic model was performed manually in EPS mode for an entire day, having as main calibration parameters the roughness coefficients of the system’s pipes, and head loss characteristics of float valves and TCVs located upstream of some of the network’s tanks. Hydraulic model calibration was performed dividing it in smaller and distinct parts and units, following an iterative procedure for certain hydraulic parameters to converge to measured quantities or satisfy defined constraints.
Initial, minimum, and maximum water levels in the system’s tanks were acquired from EYATH S.A’s installed SCADA system, where available. In tanks with no available water level measurements, minimum and maximum water levels were estimated from elevations of the tank’s inlet and overflow pipes, while initial water levels were configured somehow lower than the respective maximum water levels. The basic hydraulic simulation was conducted for an entire day, starting from 6:00 am. At the starting time, water in all tanks was considered at its maximum observed level. However, in some of the key tanks of the system (P-ST17, T10, P-ST12, T20, T36), initial water level was considered lower to avoid overflow caused by the limited water demand of the early morning hours, combined with the constant supply of these tanks during the day. Operating rules for pumps and pumping stations of the system were adjusted using water levels of downstream tanks as reference points. For tanks supplied by more than one pumps, the last one turns on when water is at the minimum operating level of the tank. The latter was acquired for the majority of the system’s tanks from EAYTH S.A.’s existing SCADA system. The rest of the pumps turn on 10 cm higher in a row. Correspondingly, the first pump of the pumping station turns off at the maximum operating level of the tank (provided by the SCADA system), while the others turn off 10 cm lower in a row. Therefore, each successive pump of the pumping station turns on when water demand of the respective tank zone augments, as water level in the downstream tank falls.
For the pumping group DN800 in Aravissos aqueduct, there is always one operating pump in P-ST35, while the second turns on conditional on water intake, as well as on water demand of tank zones supplied by P-ST17. Therefore, operation of the second pump of pumping group DN800 was adjusted conditional on water level in P-ST17. The pumping group DN1000 usually operates with 2–3 pumps supplying water to P-ST12 and P-ST14. At P-ST12, each of the pumping stations to T10, T11 and T13 includes two similar pumps, which operate following the general rules described above. As tank T13 is also supplied by T11, water level in T11 was also used to adjust the operation of both pumping stations to T13. At P-ST14, one pump constantly operates supplying water directly to a small area of Thessaloniki’s conurbation (area c in
Figure 3), a second one supplies water to T16 which is also accompanied with a throttling valve to tank T20 (the valve opens more when T16 is full), and a maximum of four other pumps transport water to T20, two of which operate constantly on a daily basis. From these four pumps to T20, two pumps were adjusted to operate conditional on the operation of the second and the third pump in P-ST35 (pumping group DN1000), respectively.
In the aqueduct of Aliakmonas river, water is pumped from T36 to T6 using two similar pumps, which operate following the general rules described above. At P-3 two similar pumps were adjusted to operate conditional on water level in T4. The regulating tank T4 transports water to the tanks of Aliakmonas aqueduct, as well as to P-ST8. Water is pumped from P-ST8 to T9 by means of two similar pumps which turn on in a row following the formulated operating rules. In times of high water demand in tank zone T9 (i.e., especially during the summer months) water could also be pumped from tank T13 through P-66 (water pumped from Aravissos aqueduct), with the existing pump serving as the last one to turn on in this sub-system (P-66 turns on when water level in T9 is minimum and turns off 20 cm below its maximum value).
Suction tanks of the city’s WDS with a limited storage capacity (i.e., suction tank of P-ST14 and P-ST8) were simulated in the hydraulic model as pressure reducing valves (PRVs). Hydraulic grade setting of the valve was considered equal to water elevation in the suction tank. This transformation ensures the preservation of a constant water level in the suction tank, overcoming possible numerical instabilities during the simulation process.
Float valves (T9 to T7, T22 to T61, T20 to T27, P-ST14 to T16) were represented as isolation valves in the hydraulic model, accompanied with an additional adjustment of pipe closing or opening based on water level in the downstream tank. Head loss coefficients of isolation valves were calibrated to satisfy water demand of the respective tank zones. Opening or closing of the valve was connected to a minimum or a maximum operating level at the downstream tank, acquired from the installed SCADA system. Head loss coefficients of TCVs of Aliakmonas aqueduct were calibrated to satisfy the total daily demand of the respective tank zones. Initial values used in the calibration process were collected during field measurement campaigns (see
Section 2). The main necessity to calibrate the head loss coefficients of the network’s TCVs results from the fact that, if the initial values were kept, the tanks could empty or overflow after a number of days. Therefore, head loss coefficients of TCVs were calibrated, so that tank water levels at the end of the day are really close to the initial ones.
Roughness coefficients of pressure pipes were calibrated using available flow and pressure data from EYATH S.A.’s SCADA system downstream of pumps or pumping stations. For pipes with no available pressure measurements, roughness coefficients were adjusted based on pipe material and age information, conditional on satisfying daily demand of the different tank zones during the simulation interval. Hazen Williams coefficients for the system’s pipes range between 60 and 150. For the majority of pipes, the Hazen Williams coefficient was fixed at 110.
3.3. Emergency Scenarios for Network Operation in Case of Failure in a Central Aqueduct
The assumption of failure in one of the central aqueducts of the studied WDS brought about different alternative scenarios to encounter problems in water distribution management. The fact that there is quite a large number of tanks currently supplied by both aqueducts (see
Section 2), that could receive water from a single source during a possible crisis, significantly assisted to define water supply schedules for the system’s tank zones. Therefore, a basic failure scenario was defined for each aqueduct, where the majority of tanks supplied by both aqueducts during normal operating conditions (few exceptions were allowed caused by network topology, and demand satisfaction balance between the two aqueducts) received water only from the aqueduct operating properly. High water consumption of the industrial area of Thessaloniki led to the formulation of an additional scenario that considers interrupting its water supply in case of failure in Aravissos aqueduct. It should be noted that in case of failure in Aliakmonas aqueduct, water supply of this area is automatically interrupted after the first hours of the crisis. The water supply capacity of the two aqueducts, elevation of the system’s tanks, and network configuration with high and low elevation areas supplied by the aqueducts of Aliakmonas and Aravissos, respectively, and existing links between the two aqueducts not used under normal operating conditions, resulted in formulating two additional scenarios in case of failure in Aravissos aqueduct based on utilising existing interconnections.
Therefore, the majority of the alternative emergency scenarios formed relate with failure in Aravissos aqueduct. This is also attributed to the aqueduct’s age (compared to Aliakmonas aqueduct), combined with its reinforced concrete material and the existence of quite a high water table in the area it crosses, as well as to the recent experience from the 2018 emergency in the city of Thessaloniki. The alternative scenarios of this work were formed to confront with: (1) a basic failure scenario at Aravissos aqueduct, (2) a scenario of failure at Aravissos aqueduct, interrupting water supply of the industrial area of Thessaloniki after verifying the failure, (3) a failure scenario at Aravissos aqueduct, activating the interconnection of the two aqueducts using an existing pipeline from T36 to P-ST34, (4) a scenario of failure at Aravissos aqueduct, activating a newly constructed DN500 pipeline connecting the two aqueducts, and (5) a basic failure scenario at Aliakmonas aqueduct cutting off water supply from the TWTP. The four failure scenarios at Aravissos aqueduct include cutting off water supply from Aravissos springs (≈87,000 m3/day), while preserving water quantities from Halkidona and Sindos boreholes (≈33,000 m3/day). Water production from the TWTP was increased to 135,000 m3/day (from 121,000 m3/day during normal conditions), while preserving water quantities from Axios and Eleousa boreholes entering T36. Failure at Aliakmonas aqueduct is simulated in the hydraulic model by cutting off water supply from the TWTP (≈121,000 m3/day).
Emergency scenarios for network operation in case of failure in one of the city’s aqueducts were formulated to include intermittent water supply, depending on the available amount of water per aqueduct, ensuring a fair and equitable distribution of water reserves and periods of water supply interruption among all tank zones of the system. Achievement of the aforementioned goal was further assisted (see
Section 4) by the development and application of scenarios (3) and (4). In all five scenarios examined, operating rules of pumping stations and tanks of both aqueducts were also investigated and adjusted accordingly to contribute to achieving the principal objectives of the study.
To formulate all alternative water supply scenarios, water demand in all different tank zones of the system was considered fixed and equal to the existing peak demand of each area (average water consumption in each tank zone multiplied by a peak factor). However, water demand during emergency conditions, like the ones described above, is thought to significantly increase, introducing high uncertainty in hydraulic simulations, as well as in the intermittent water supply schedules. In this work, the adjusted schedules were formed to keep a low number of necessary interventions in the system while managing the crisis, not only for the sake of simplicity, but also to reduce the probability of failure in other parts of the WDS during the time of repair. The basic characteristics of intermittent water supply schedules created rely heavily upon estimated water demand in each tank zone of the system, and are therefore subject to possible revisions and alterations in case of any significant change. The lack of detailed recording of the system’s hydraulic behavior under normal operating conditions, coupled with a necessity to readjust the head loss characteristics of Aliakmonas’ aqueduct TCVs to achieve the simulation objectives in case of emergency, increase the uncertainty of the extracted simulation results for all alternative scenarios.
During the initial hours of detected failure, and before implementing an intermittent water supply schedule, an attempt was made to use the volume of water stored in the system’s tanks. Therefore, the hydraulic model of the system was adjusted to interrupt water supply of almost all tanks, until a minimum water level was attained in each of them. This minimum water level used for all emergency scenarios was considered at 0.80 m from each tank’s outlet pipe, for all tanks supplied by pumps or pumping stations, except from tank T13, where a higher value of 1.95 m was preserved. For the rest of the system’s tanks, the emergency water level was set at 0.50 m (unless the minimum water level during normal operating conditions was lower). For tanks supplied by more than one pump, the last one was assumed to turn on when water was at the emergency level, while the rest of the pumps were considered to turn on 10 cm higher in a row. All pumps were adjusted to turn off 20 cm higher (compared to their starting water level). Head loss characteristics of TCVs upstream of Aliakmonas’ aqueduct tanks were readjusted to satisfy water demand in all studied tank zones during the water supply periods of the intermittent water supply schedule applied in each emergency scenario. All hydraulic simulations for the emergency scenarios were run in EPS mode of WaterGEMS software for a time period of 2.5 days (almost half a day to use the water stored in the system’s tanks and two entire days to apply the intermittent water supply schedules).
Implementing an intermittent water supply schedule, primarily based on adjusted operating rules of the pumps, requires to control the flow downstream the system’s tanks. This should be performed to ensure that water supply in each tank zone is interrupted when the respective tank empties, while when a minimum water level is assured, a peak demand of the respective tank zone will be satisfied. Since hydraulic modelling during emergency conditions is not typical in the sense of flows being controlled by demands, outflows of tanks to their tank zones were complimented with FCVs and ended up at reservoirs. The initial flow setting of each FCV was adjusted to the peak flow value of the respective tank zone. This was performed to meet the unit demand satisfaction ratio (defined as the ratio of the flow that is available to the flow that is required) of each tank zone during water supply periods. To better achieve the objectives of the simulation, FCVs of a limited number of critical tank zones were kept closed during the intervals of water supply interruption.
The main failure scenario at Aravissos aqueduct (scenario 1) was based on the assumption of water supply cut off from Aravissos springs, so that water only from water supply boreholes enters P-ST35. Emergency scenario 1 was based on an assumption of uninterrupted water supply to the industrial area of Thessaloniki, to EKO industry and to critical infrastructure, such as large hospitals in the east of the city. Tank zones supplied solely by Aravissos aqueduct under normal conditions were assumed to belong to the system of P-ST35 (tank zone T16 was also included), while Aliakmonas aqueduct was assumed to transport water to all other tank zones. Daily water demand of the two aqueducts was thus covered by almost 48% and 63%, respectively, used as a basis to form the intermittent water supply schedule. The system supplied by the DN800 pumping group was therefore subject to a six-hourly intermittent water supply schedule. Operation of the system supplied by the DN1000 pumping group was simulated to depend on the water level in P-ST35 suction tank, conditional on the necessary water quantity for the DN800 system being lower than the total inflow to P-ST35. During operating hours of the DN800 system, water supply to P-ST14 and T13 was interrupted. The latter was performed to ensure sufficient water quantities for the high elevation T15, during operating hours of the DN1000 system. During the first hours of the event, an attempt was made to use the volume of water stored in the system’s tanks (water at the beginning of the simulation process was assumed to be at its lowest level observed during normal operating conditions). This time needed for the tanks of Aliakmonas aqueduct (tanks supplied by Aliakmonas aqueduct or by both aqueducts during normal conditions, except for T16) was considered fixed and equal to 12 h. After these initial 12 h interval, an intermittent water supply schedule was selected for the tanks of Aliakmonas aqueduct, cutting off water supply every 5 h for 3 h intervals. The water supply of T10 and T20 from Aravissos aqueduct, as well as the water supply of T27 from T20 were interrupted.
Emergency scenario 2 was also based on a failure detected in Aravissos aqueduct. Water supply to the industrial area of Thessaloniki was interrupted after the first 12 h of the detected failure. In this case daily water demand of the two aqueducts was covered by almost 48% and 84%, respectively. Therefore, this scenario considered an intermittent water supply schedule for Aravissos aqueduct, similar to the one presented for scenario 1. After the initial 12 h interval, an intermittent water supply schedule was also selected for the tanks of Aliakmonas aqueduct, cutting off water supply every 10 h for 2 h intervals.
Emergency scenario 3 was assumed to include an increase in water inflow to P-ST35 (≈469 m
3/h) from the boreholes of Axios and Eleousa. A DN600 pipe connecting the two aqueducts was used to transport the additional water quantity to the system of P-ST35 (during normal operating conditions, water from Axios and Eleousa boreholes is transported to T36 of Aliakmonas aqueduct). Tank zones supplied solely by Aravissos aqueduct under normal conditions were assumed to belong to the system of P-ST35 (tank zones T16 and T10 were also included), while Aliakmonas aqueduct was assumed to transport water to all other tank zones. Daily water demand from both aqueducts was thus covered to almost 58%. For Aravissos aqueduct, the intermittent water supply schedule was simulated to start after the first 8 h of the crisis, including cutting off water supply almost every 4.5 h for time intervals of 3.5 h. During the time periods of continuous water supply, only one pump was set active for the pumping group DN800, while the pumps of DN1000 were simulated to turn on to preserve the water level in the suction tank of P-ST35 in the range of 1.40–2.00 m, even during the period of water supply cut off. During the periods of water supply interruption, the TCV upstream of P-ST14 was set to closed. P-ST14 was also simulated to pump water to P-ST17 (see
Figure 2) through a DN300 pipe (inactive during normal operating conditions), while T20 was adjusted to receive water only from Aliakmonas aqueduct. Pumps from P-ST12 to T10 were adjusted to operate only during the periods of continuous water supply of the implemented schedule. For Aliakmonas aqueduct, the implemented intermittent water supply schedule was similar to the one followed in Aravissos aqueduct, while water supply of the industrial area of Thessaloniki, EKO industry, as well as critical infrastructure remained uninterrupted.
Emergency scenario 4 was assumed to include an interconnection of the city’s aqueducts, performed with the newly constructed DN500 pipe (see
Figure 4), which supplies the city center (supplied directly from DN800 of Aravissos aqueduct during normal operating conditions) with water directly from the TWTP. Tank zones supplied by the pumping group DN1000 of Aravissos aqueduct under normal conditions were assumed to belong to the system of P-ST35 (tank zone T10 and part of T16 were also included), while Aliakmonas aqueduct was assumed to transport water to all other tank zones. Daily water demand from both aqueducts was thus covered to almost 58%. For Aravissos aqueduct, the intermittent water supply schedule started after the first 12 h of the crisis, including cutting off water supply almost every 4.5 h for time intervals of 3.5 h. Adjustments similar to those of scenario 3 were performed in the hydraulic model for pumps of DN1000 in P-ST35, the TCV upstream of P-ST14, water supply of P-ST17 and T20, as well operation of pumps from P-ST12 to T10. It should be noted that for this scenario, T10 was assumed to receive water only from Aravissos aqueduct. For Aliakmonas aqueduct, most adjustments of this scenario were similar to those of scenario 3. However, it should be emphasised that the pumping group of DN800 was supplied by both aqueducts of Aliakmonas (pipe DN500 connects the Aliakmonas main pipeline to DN800) and Aravissos (pipe DN300 from P-ST14 to P-ST17 was activated), following the applied intermittent water supply schedule for Aravissos aqueduct.
Emergency scenario 5 concerns a major failure at the aqueduct of Aliakmonas, interrupting water supply especially to high elevation areas of the city. Conditional on this failure scenario, the boreholes of Axios and Eleousa are the main water supply sources to the entire aqueduct of Aliakmonas. Water exchange between the city’s aqueducts was mainly achieved, here, using an existing DN600 pipe to transport water from P-ST34 to T36 (this pipe was used in emergency scenario 3 for transporting water from Axios and Eleousa boreholes to P-ST34). The maximum capacity of the pipe reaches 600 m3/h. It should be noted that the supply of the industrial area of Thessaloniki was assumed to continue until the water level in the TWTP downstream tank falls below 4.60 m, while when this tank empties, pumping of water to tank zones of T4 (T44, T45, T47, T50, T52, T69) stops. To create the intermittent water supply schedule for this emergency scenario, tank zones supplied solely by the aqueduct of Aliakmonas during normal conditions, were assumed to receive water through the aqueducts’ central infrastructure (tank T36 and regulating tank T4), while the aqueduct of Aravissos was assumed to supply the rest of the tank zones. Considering the abovementioned, emergency management for this scenario was formed to include two distinct phases, one corresponding to the first hours of the failure (the first 19 h for the tank downstream of TWTP to empty) and one to the upcoming hours. During the first hours of the crisis, tank T36 was simulated to receive input from both the TWTP and water boreholes, supplying T6 with water. The pumping group of DN800 was simulated to operate with one or two pumps at P-ST35, to preserve the water level of P-ST17 to emergency standards. The pumping group of DN1000 was simulated to operate with 2–3 pumps in P-ST35, with the third one turning on or off conditional on the water level in the suction tank of P-ST35. During the second part of the scenario, an intermittent water supply schedule of 4.25 h continuous water supply followed by a 3.75 h cut off was implemented for both aqueducts, activating the pipe DN600 from P-ST34 to support the aqueduct of Aliakmonas, as well as a partial contribution from Aravissos aqueduct to T9 through the pump P-66. The pumping station of T6 was also activated during this stage to transport water to T5. The pumping group of DN800 was modelled to follow the intermittent water supply schedule, while the pumping group of DN1000 was adjusted to operate conditional on water level elevation in the suction tank of P-ST35. Water supply to T20 was assumed to be continuous and uninterrupted, while the pipe DN350 from T20 to T27 was kept closed. To prevent critical tanks from emptying during the water supply interruption intervals, consumption valves (FCVs in the hydraulic model) for tank zones T13 and T15 were kept closed during these intervals.
4. Results
Figure 5 presents final estimates of mean water demand assessed for all tank zones of Thessaloniki’s WDS. These estimates are compared with the respective values assessed theoretically -design demands- (see
Section 3.1). It should be noted that total water demands resulting from adding mean annual consumptions of all water meters located in each tank zone of the system (see
Section 3.1) were assessed in the majority of cases lower than final tank zone demand estimates presented in
Figure 5. For the most representative tank zones of the WDS these differences range in the interval 25–40%, possibly approximating water losses in the different areas of the network. However, the respective water demands are not included in
Figure 5, mainly due to significant uncertainties in the estimation process.
Theoretical and final water demand estimates are really close in most of the tank zones shown in
Figure 5. Higher differences are observed for tank zones T6 and T5 (in the western part of the city), for tank zone T18, as well as for the city center (tank zone P-ST35).
Figure 6 presents daily variation of the coefficient of hourly water demand considered in this work. Separate variation schemes of the coefficient were considered for tank zones located in the city (majority of tank zones) and in its suburbs (i.e., tank zones T48, T59, T64, T23, T24 and T25). Daily variation of water demand for urban tank zones is based on analyzed measured data from a previous study in Thessaloniki city [
36]. The selected scheme corresponds to tank zone T11, which serves quite a large area close to the city center. For the suburban tank zones, a daily variation scheme from existing literature [
37,
38,
39,
40] was used in this work.
Hydraulic simulation of the system was performed in OpenFlows WaterGEMS software [
2] following the methodology presented in
Section 3.2 Mean water demand in the city’s tank zones (
Figure 5), as well as hourly water demand variations within the day (
Figure 6), were used in the hydraulic model to simulate the system’s response to normal operating conditions.
Figure 7 presents the daily operation time for all pumping stations or pumps of Thessaloniki’s aqueducts, estimated from the hydraulic simulation of the system during normal operating conditions. Pump operation was adjusted following the methodology described in
Section 3.2 of this work. The total working hours of the system’s pumps exceed 650 h per day, while the total amount of water pumped is estimated at about 380,000 m
3/day.
Results of the simulation reveal that the majority of the system’s pumps operate at medium to quite high efficiencies. However, it should be noted that pump efficiency significantly changes throughout the years, and therefore the use of manufacturers’ efficiency data for the system’s pumps (most pumps of the system are really old) can sometimes lead to unreliable results especially in terms of energy consumption and greenhouse gas emissions (GHG) of the entire system. Daily energy usage is really high for the pump P-3 downstream of TWTP, the two pumps of pumping group DN1000 to P-ST12 and P-ST14 and the one pump of pumping group DN800 to P-ST17, with the abovementioned pumps using more than 45% of the energy of the entire system on a daily basis. Energy usage is also high for pumps from T13 to T15, T36 to T6, T8 to T9, P-ST14 to T20, and P-ST17 to T19. It should be noted that optimization of pump operation for the WDS of Thessaloniki to minimize operating costs and GHG emissions of the system is a subject for future research.
During emergency conditions of the system (see
Section 3.3), water demand in all tank zones is assumed to attain its maximum value during the entire period of study. A peak factor of λ = 1.117 (see
Figure 6) is used to estimate water demand in the tank zones of the system (both urban and suburban). This peak factor is only applied to tank zones with domestic consumers, while water demand in industrial areas of the system is kept constant. Considering the conservative case in which a failure at one of the city’s aqueducts happens when water in the system’s tanks is at its lowest level during normal operating conditions,
Figure 8 presents the time needed for each tank to reach its emergency water level. From
Figure 8, it is evident that water stored in some of the tanks of Aliakmonas aqueduct (i.e., T9, T48, T59, T64) could satisfy water demand in their tank zones for many hours during a water crisis period. In Aravissos aqueduct, water demand of tank zone T18 could also be satisfied for more than 20 h at the beginning of the emergency period.
For emergency scenario 1, different intermittent water supply schedules were created for the city’s aqueducts (see
Section 3.3).
Figure 9 presents total flow at the two central pipes (DN800 and DN1000) of Aravissos aqueduct for the simulation period of 2.5 days. It can be noted that water supply of DN800 strictly follows the intermittent water supply schedule for Aravissos aqueduct (six-hourly water supply followed by six-hourly cut off). For the pumping group of DN800, one pump constantly operates at P-ST35 during water supply periods, while the second one turns on conditional on water elevation in P-ST17. Water supply of pipe DN1000 is continuously interrupted, due to adjustments performed in the hydraulic model (turning a pump on or off depending on water level in P-ST35).
Figure 10 presents water consumption from the pumping group of DN800, including water supply of the city’s center, and water supply of tank zones T18 and T19. Water supply of the city center from pressure pipe DN800 justifies its direct response to the imposed intermittent schedule. For tank zones T18 and T19, water supply seems to continue during the interruption periods. Especially for tank zone T18, prolongation of water supply periods could be mainly attributed to large storage volume of T18, compared to water demand in the respective tank zone. For the pumping group of DN1000, not shown here for the sake of brevity, tank zone T11 seems to receive water during the assigned six-hourly periods with very short interruptions caused by water supply adjustments/controls in the hydraulic model, water supply of tank zone T13 strictly follows the imposed schedule due to adjustments performed directly at the FCV at the tank’s outlet, while water supply of tank zone T15 seems to be problematic. The high-altitude tank T15 seems to supply its tank zone with water during the first 12 h of the failure until water level in the tank reaches its emergency value, while in the next two days water supply of the tank zone is limited. The latter is mainly attributed to its dependence to water level elevation in the upstream tank T13, as well as the capacity of the existing pumps (from T13 to T15), detected to be marginal compared to the tank zone’s water needs.
Figure 11 presents water supply in some indicative tank zones of Aliakmonas aqueduct (T4, T5, T9, T22, T24, T25). For tank zones T4, T5 and T6 (not shown here), the objectives of the intermittent water supply schedule for Aliakmonas aqueduct are quite fully accomplished. However, in the majority of the aqueduct’s tanks, it is rather difficult to strictly follow the designed schedule, mainly due to network topology issues and the relative comparison between the storage volume of each tank and water consumption/demand in its tank zone. For the series tanks T22, T61, T23, T24 in the eastern part of Thessaloniki city, it is quite evident that water supply periods are longer than the ones assigned in the schedule, mainly caused by pumping schedules applied in this scenario. However, the water supply of the high-altitude tank T25 seems to be highly problematic.
Figure 12 presents daily water supply (in hours and in %) for all tank zones of the system during a typical day (application of the intermittent water supply schedule has already started) for emergency scenario 1. Specified duration of water supply periods based on the applied intermittent water supply schedule for both aqueducts is also included as a straight line (blue and red color for the aqueducts of Aravissos and Aliakmonas, respectively). The green bars correspond to areas of the system, where water supply is considered uninterrupted (the industrial area of Thessaloniki, EKO industry, and critical infrastructure of the city).
Results for emergency scenario 1 show: (a) a total inability of the system to supply the high-altitude tanks of the network (T15 and T25), which was also verified for the event of failure at the aqueduct of Aravissos in 2018; (b) good coverage of daily water needs for the majority of tanks supplied by both aqueducts, mainly the ones connected in series (mostly due to the configured operational rules of the pumps upstream of the tanks), as well as the majority of tanks in the suburbs except for the high-altitude tank of Acropolis (T64) supplied with water for less than 11 h a day; (c) partial coverage (60–75% of the daily intervals) of the rest of the tank zones in the aqueduct of Aliakmonas (tank zones fully or partially supplied by the aqueduct of Aliakmonas under normal operating conditions of the system i.e., T20 and T27); and (d) approximately 50% (48–58% of the daily intervals) coverage of the daily water demand for the aqueduct of Aravissos (excluding T18, which covers the daily water needs of its area/zone for more than 19 h, due to its high storage volume compared to the area’s water demand).
For emergency scenario 2 (
Figure 13), which considers interrupting water supply to the industrial area of Thessaloniki after the first 12 h of a failure in Aravissos aqueduct, an increase is estimated for water quantities and water supply time periods for areas of Aliakmonas aqueduct. However, no significant benefit is expected for the areas supplied by the aqueduct of Aravissos. In particular, this scenario achieves coverage of daily water demand of areas in the aqueduct of Aliakmonas to a proportion exceeding 83% (for the area supplied by the high-altitude T25 this proportion reaches almost 50%), while for the aqueduct of Aravissos, results do not differ from those extracted for emergency scenario 1.
Figure 13 includes a comparison of daily water supply extracted from scenario 2 with the respective results for scenario 1.
For emergency scenario 3, which activates an interconnection of the two aqueducts through P-ST34, a common intermittent water supply schedule was assigned to both aqueducts.
Figure 14 presents total flow at the two central pipes (DN800 and DN1000) of Aravissos aqueduct for the simulation period of 56 h (two days plus 8 h to use water stored in the system’s tanks). It can be noted that water supply of DN800 strictly follows the applied intermittent water supply schedule. For the pumping group of DN800, only one pump constantly operates at P-ST35 during water supply periods. Water supply of pipe DN1000 is continuously interrupted due to adjustments performed in the hydraulic model (turning a pump on or off depending on water level in P-ST35). Water supply of the city center from pressure pipe DN800 strictly follows the imposed intermittent schedule, tank zone T19 seems to not follow the implemented schedule with shorter periods of water supply after the first 1.5 days of the simulation period, while for tank zone T18 water supply periods present a time delay with respect to the implemented schedule (after the first 1.5 days where water supply of the tank zone is continuous). For the pumping group of DN1000, not shown here for the sake of brevity, tank zone T13 strictly follows the imposed schedule, while water supply of tank zones T10 and T11 seems to last longer than 4.5 h. The main difference in the system’s response with respect to emergency scenario 1 has to do with water supply of the high-altitude tank zone T15, which seems to improve.
Figure 15 presents water supply in some indicative tank zones of Aliakmonas aqueduct (T5, T6, T9, T22, T24, T25). The objectives of the intermittent water supply schedule for Aliakmonas aqueduct are quite fully accomplished for tank zones T5 and T6 (and for T4), while water supply periods are longer than those assigned in the schedule for tank zone T9, as well as tank zones in the eastern part of the city (e.g., T22, T23, and T24). Water supply of the high-altitude T25 remains highly problematic.
Figure 16 presents daily water supply (in hours as well as %) for all tank zones of the system during a typical day (application of the intermittent water supply schedule has already started) for emergency scenario 3. Specified duration of water supply periods based on the applied intermittent water supply schedule for emergency scenario 3 is also included as a straight line. The industrial area of Thessaloniki, EKO industry, and critical infrastructure in the northeastern part of the city are considered to receive continuous water supply during the crisis.
Figure 16 includes a comparison of daily water supply extracted from emergency scenario 3 (pink bars) with the respective results for emergency scenario 1 (blue bars).
Results for emergency scenario 3 show that, compared to emergency scenario 1, there is: (a) an increase in the duration of water supply for some tank zones of Aravissos aqueduct (this is not the case for tank zones T18 and T19 where a decrease of 30% and 36% respectively, is anticipated); (b) an increase in duration of water supply for the city center; (c) a significant improvement in water supply of high-altitude tank zone T15, while this is not the case for T25 in the eastern part of the city; and (d) a significant improvement in water supply of large tank zones, such as T11. For tank zones T11 and T13, the duration of daily water supply periods increases more than 56% and 16% respectively, while the respective increase for the city center reaches 21.5%. For the high-altitude tank zone T15, total duration of daily water supply increases more than 2.5 times.
For emergency scenario 4, where the two aqueducts are fully connected by means of a DN500 pipeline, a common intermittent water supply schedule, similar to the one applied for emergency scenario 3, was assigned for the entire system.
Figure 17 presents total flow at the city center, supplied directly from Aliakmonas aqueduct through DN500, as well as water supply of tank zones T18 and T19 during the 2.5 days (two days plus 12 h to use storage volume of tanks) simulation period. Water supply of the city center strictly follows the applied intermittent water supply schedule, tank zone T19 is supplied for somehow longer periods than those defined, while water supply of tank zone T18 covers the most of the simulation period. The water supply of tank zone T11 lasts longer than assigned, tank zone T10 follows the intermittent water supply schedule with very short interruptions therein, tank zone T13 strictly follows the intermittent water supply schedule, while the performance of the high-altitude tank zone T15 is improved (compared to emergency scenario 1). Some tank zones in Aliakmonas aqueduct perform quite similar to emergency scenario 3, while some differences arise for tank zones T5, T6, T7, T9, T10, and T64.
Figure 18 presents daily water supply (in hours as well as %) for all tank zones of the system during a typical day (application of the intermittent water supply schedule has already started) for emergency scenario 4 compared to those of emergency scenario 3. Specified duration of water supply periods based on the applied intermittent water supply schedule is also included as a straight line. Continuous water supply was assumed for the industrial area of Thessaloniki, EKO industry, and critical infrastructure in the northeastern part of the city.
Results for emergency scenario 4 show that compared to emergency scenario 3 there is: (a) an increase in duration of daily water supply for the high-altitude tank zone T15 (almost 15%), however it is still not possible to satisfy the objectives set by the implemented schedule; (b) a significant increase in daily water supply of tank zones T18 and T19, reaching almost 21 h/ day for T18 (increase more than 50% for T18 and 65% for T19); (c) a significant decrease in daily water supply duration for tank zones T10 (almost 19%) and T64 (more than 50%); (d) a decrease in daily water supply of tank zones T5, T7, and T9 (up to 9%). Therefore, considering the current water production from TWTP, emergency scenario 4 offers benefits compared to emergency scenario 3, especially for tank zones of pumping group DN800, while water supply of the high-altitude tank zone T25 remains problematic. However, it should be noted that both scenarios 3 and 4, offer significant advantages compared to emergency scenario 1, where no connection of the two aqueducts is considered.
Emergency scenario 5 considers responding to a failure at the central aqueduct of Aliakmonas. Hydraulic simulation for this scenario was performed for a period of 67 h (two days plus 19 h to use water stored in system’s tanks) and resulted in continuous water supply of the industrial area of Thessaloniki and pumping of water to tank zones of T4 (T44, T45, T47, T50, T52, T69) for the first 5.25 h and 18.15 h of the crisis, respectively. After this time, there is no alternative way to supply these areas with water. Tank zones T5 and T6 strictly follow the water supply schedule implemented, due to turning on or off FCVs downstream these areas’ head tanks, while water supply of tank zones T9 and T63 lasts longer than assigned.
Figure 19 presents total flow at the two central pipes (DN800 and DN1000) of Aravissos aqueduct for the simulation period. Water flow in DN800 strictly follows the intermittent water supply schedule applied, with one or two pumps operating in P-ST35. Water flow in DN1000 is continuous, using two or even three pumps, conditional on water level in the suction tank of P-ST35. Water supply in tank zone T11 lasts longer than assigned by the schedule, T10 presents interruptions during water supply periods, while tank zones T13 and T15 present difficulties in following the defined schedule.
Figure 20 presents total flow for the city center, as well as for tank zones T18 and T19 (pumping group DN800). The city center strictly follows the applied schedule, while water supply in tank zone T19 and especially in T18 exceeds the assigned duration. Tank zones in the eastern part of the city (T22, T23, T24, T61) do not follow the intermittent water supply schedule, while water is pumped to the high-altitude tank zone T25 only during the first 19 h of the crisis (
Figure 21).
Figure 22 presents daily water supply (in hours as well as %) for all tank zones of the system during a typical day (application of the intermittent water supply schedule has already started) for emergency scenario 5. Blue bars correspond to tank zones supplied directly from P-ST35, while red bars correspond to tank zones supplied by water transferred from Aravissos to Aliakmonas aqueduct through DN600 from P-ST34, as well as from T13 to T9 through P-66 (see
Figure 2). The specified duration of daily water supply periods based on the applied intermittent water supply schedule is also included as a straight line.
It is obvious from
Figure 22 that the water supply of the industrial area of Thessaloniki, as well as of tank zones supplied by pumped water from T4, stops completely after the first hours of the crisis. Water can be transported to EKO industry for less than 12 h during a typical emergency day, while water supply of the city center stays close to estimates for emergency scenario 1 (almost 10% higher). Water supply of tank zone T25 is highly problematic, while for tank zones T10, T15, T20, T27 and T64, daily duration of water supply is estimated lower than the defined threshold. Based on results extracted for emergency scenarios 1 and 5, it can be concluded that a possible failure in Aliakmonas aqueduct is more difficult to manage, compared to a failure in Aravissos aqueduct. For the large majority of tank zones (apart from tank zones P-ST35, T11, T13, T15 and T18), duration of water supply periods is estimated higher for a tentative failure in Aravissos aqueduct (emergency scenario 1), compared to a respective failure in Aliakmonas aqueduct (emergency scenario 5), while in the latter an intermittent water supply schedule seems more difficult to follow.
5. Conclusions
In this work, a simple, comprehensive, and practical methodology was introduced to cope with water shortage conditions in the aqueducts of quite a large and complex WDS, with a limited existing SCADA system. Results of the simulations for both normal and abnormal conditions of the WDS suggest that the procedures followed are reliable and robust, while keeping the computational time low. The methodology presented assesses water demands in the different areas of the system combining both theoretical and measured data, while calibration of the WDS was performed in EPS mode following an iterative procedure for certain hydraulic parameters to converge to measured quantities or satisfy defined constraints. For emergency conditions of the network, the analysis conducted deviates from PDA, mainly because of large uncertainties in extracting typical pressure-dependent demand curves for the different tank zones and in defining thresholds for both the minimum and desirable head of the different demand nodes, ensuring a unit demand satisfaction ratio during water supply periods in each tank zone.
A hydraulic simulation model for the aqueducts of Thessaloniki city in Greece was developed to model the current operating state of the network, as well as its response to emergency conditions resulting from a major failure in one of them. Hydraulic simulations were performed using OpenFlows WaterGEMS software in EPS mode, including estimating water demand in all areas of the conurbation and calibrating the hydraulic model under both normal (pipe roughness coefficients, head loss characteristics of TCVs) and abnormal conditions (head loss characteristics of TCVs). Failure in the city’s aqueducts was confronted with the development and hydraulic simulation of five emergency scenarios of network operation, two of which consider possible interconnections of the studied aqueducts. These scenarios, which include appropriately defined intermittent water supply schedules for the aqueducts, were created on a basis of a fair and equitable management of water among the different areas of the city, also assuming a small number of interventions/operations during the crisis. The simulations revealed quite a satisfactory compliance of the system’s operation with the defined schedules, and an improved management of limited water reserves in some areas of the WDS when considering interconnections of the city’s aqueducts.
Hydraulic simulations for all emergency scenarios showed that the main objectives set for managing such adverse conditions in the city of Thessaloniki were satisfactorily met. However, it is evident that it was not always possible to strictly comply with the designed intermittent water supply schedules. A better distribution of the available water resources in each such case would require lots of additional interventions in the city’s water system performed during the crisis. The application of operating rules to consumer valves (FCVs at the outlet of tanks) following the intermittent water supply schedule of each emergency scenario (close the valve during water supply cut off periods) could significantly assist in fulfilling the simulation objectives and perfectly meeting the assigned requirements at the cost of a huge increase in the number of necessary operations and handlings from the water supply company’s (EYATH S.A.) working staff, which could in turn significantly increase vulnerability of the system’s elements to sudden and severe failures.
For emergency scenario 1, including response to a major failure in Aravissos aqueduct, the hydraulic simulation verified that the objective of applying a six-hourly intermittent water supply schedule for the tanks of Aravissos aqueduct was not always feasible. The water schedule was fully satisfied for the city center, while some tanks of the network downstream of pumping stations continued to supply their tank zones during water supply interruption periods. Water needs in tank zones fully or partially supplied by the aqueduct of Aliakmonas during normal operating conditions were satisfied up to almost 60–75% (higher proportions were observed for the series tanks in the eastern part of the city), while the water supply of high-altitude tank zones in both aqueducts was proven highly problematic. For emergency scenario 2, which considers interrupting water supply to the industrial area of Thessaloniki after the first 12 h of a major failure in the aqueduct of Aravissos, an increase was estimated for water quantities and water supply time periods for areas of Aliakmonas aqueduct, compared to emergency scenario 1, however without achieving any benefit for the areas supplied by the aqueduct of Aravissos.
Emergency scenarios 3 and 4 were formulated to include responses to a major failure in Aravissos aqueduct considering possible interconnections of the city’s central aqueducts. Both scenarios improved the performance of the entire water system (compared to emergency scenarios 1 and 2), assisting in fulfilling the principal objectives of the hydraulic simulation under abnormal conditions of the network. Major improvements can be summarised to an increase in the duration of water supply for large tank zones of Aravissos aqueduct, including high-altitude tank zones of great historical interest.
For emergency scenario 5, including response to a major failure in Aliakmonas aqueduct, hydraulic simulation has proven that application of a defined intermittent water supply schedule in such a case is more difficult, compared to a tentative failure in Aravissos aqueduct (emergency scenarios 1–4), rendering such conditions more adverse to handle and to manage. For this scenario, hydraulic simulation has indicated interruption of water supply of the industrial area of Thessaloniki, as well as of some high-altitude areas of Aliakmonas aqueduct, after the first hours of the crisis, while for some large tank zones of the city daily duration of water supply was estimated lower than the one assigned by the intermittent water supply schedule.
In the present work, basic reasoning and rules for constructing emergency management scenarios for the operation of aqueducts in a large city characterised by a dual water supply system were introduced and analysed further. Such scenarios were defined to include intermittent water supply schedules for the different areas of the network, considering that it still operates with its normal topology and elements but based on a different distribution of available water reserves between the system’s sources, completely interrupting water supply to certain areas of the network if necessary, or taking advantage of existing connections between the aqueducts and using system elements or infrastructure not utilised under normal operating conditions. The definition of case specific emergency water levels in the system’s tanks, estimation of average time to reach them (for each aqueduct) when the emergency starts, definition of water supply and cut off periods based on available input and demands per aqueduct, determination of pump operating rules, and deactivation of network elements to support the defined schedules are some basic concepts and steps used when formulating the abovementioned emergency scenarios.
All emergency scenarios of this work have not been tested and validated in practice, and represent theoretical ones, considering the purely theoretical methodology followed and the basic assumptions (see
Section 3) it was based on. The above emergency scenarios simulate the direct response of the network to the different operations and handlings performed by the water supply company, which differs from the actual response of the system due to inertia conditions, handling of valves, air-fixing in the network, and pipe conductivity, among others. It is also noted that it was not possible to simulate the exact response of the system’s aqueducts in the week between 28 March and 1 April 2018, mainly due to the lack of very detailed information on hydraulic quantities of the entire system and on operations performed during the crisis, and also due to the very large number of changes in the implemented management measures during the same period. Although this work presents theoretical scenarios, the defined intermittent water supply schedules follow some of the basic directions and operations performed during the actual crisis management, resulting in simulated operating conditions resembling those that occurred during the real event.
It is worth noting that simulations for emergency scenarios considered in this work were based on an assumption of increased water consumption in all tank zones of the studied system. During such conditions, as well as in cases of planned or unplanned system maintenance or power failure at pump stations, the daily water demand is usually not based on the notions of diurnal variation, but on a maximum water quantity collected during the supply hours. This assumption was also verified during the event of failure in the Aravissos aqueduct in 2018. Therefore, in this work water demand for all emergency scenarios was considered constant during the assigned time intervals of water supply in each tank zone and equal to the peak demand during normal operating conditions of the system. However, it should be noted that estimation of water demand during emergency conditions introduces a large amount of uncertainty in the formulated intermittent water supply schedules and in the simulation results in general, and requires further investigation and analysis.
A strict compliance with the initially defined water supply schedules will be supported by installing a detailed SCADA system in the network for full monitoring of its hydraulic parameters, as well as by replacing manually controlled TCVs with modern electronic ones controlled by a central server. The above are also expected to significantly contribute to further development of the city’s aqueducts’ hydraulic model, enabling a more reliable dynamic calibration of the model thereby improving its ability to predict the system’s behavior under different operating scenarios. They are also expected to improve the managing company’s response to similar conditions, and to significantly contribute to the development of newly improved intermittent water supply schedules for available water reserves. Following the installation of a detailed SCADA system at the watermains and tanks of the WDS the aforementioned alternative scenarios are also expected to contribute to the development of a decision support system (DSS) for emergency management.
Once the installation of a fully equipped SCADA system is completed, it will be connected to the hydraulic model of the WDS to create a digital twin. Such an approach will allow to quickly adjust daily demands of the different areas/tank zones of the entire system and will assist in controlling and simulating pipe breaks or fire response, creating customized element alerts. Creation of a digital twin will provide more reliable estimates of hydraulic quantities and can be used even for forecasting hydraulic emergencies in the future.
In the present work, the operation of the studied WDS was reproduced for a typical daily interval, calibrating the numerical model to represent the existing hydraulic parameters of the system. However, the analysis conducted did not consider operational costs (economical, environmental) of the system. Future work will focus on optimum pump scheduling to significantly decrease energy consumption costs and GHG emissions of the system’s pumping stations. It is therefore a subject for future work to ensure a trade-off between energy usage, energy consumption costs, and pumping station efficiency, and to present a methodology for assessing optimum daily pumping schedules.

 ,
, 
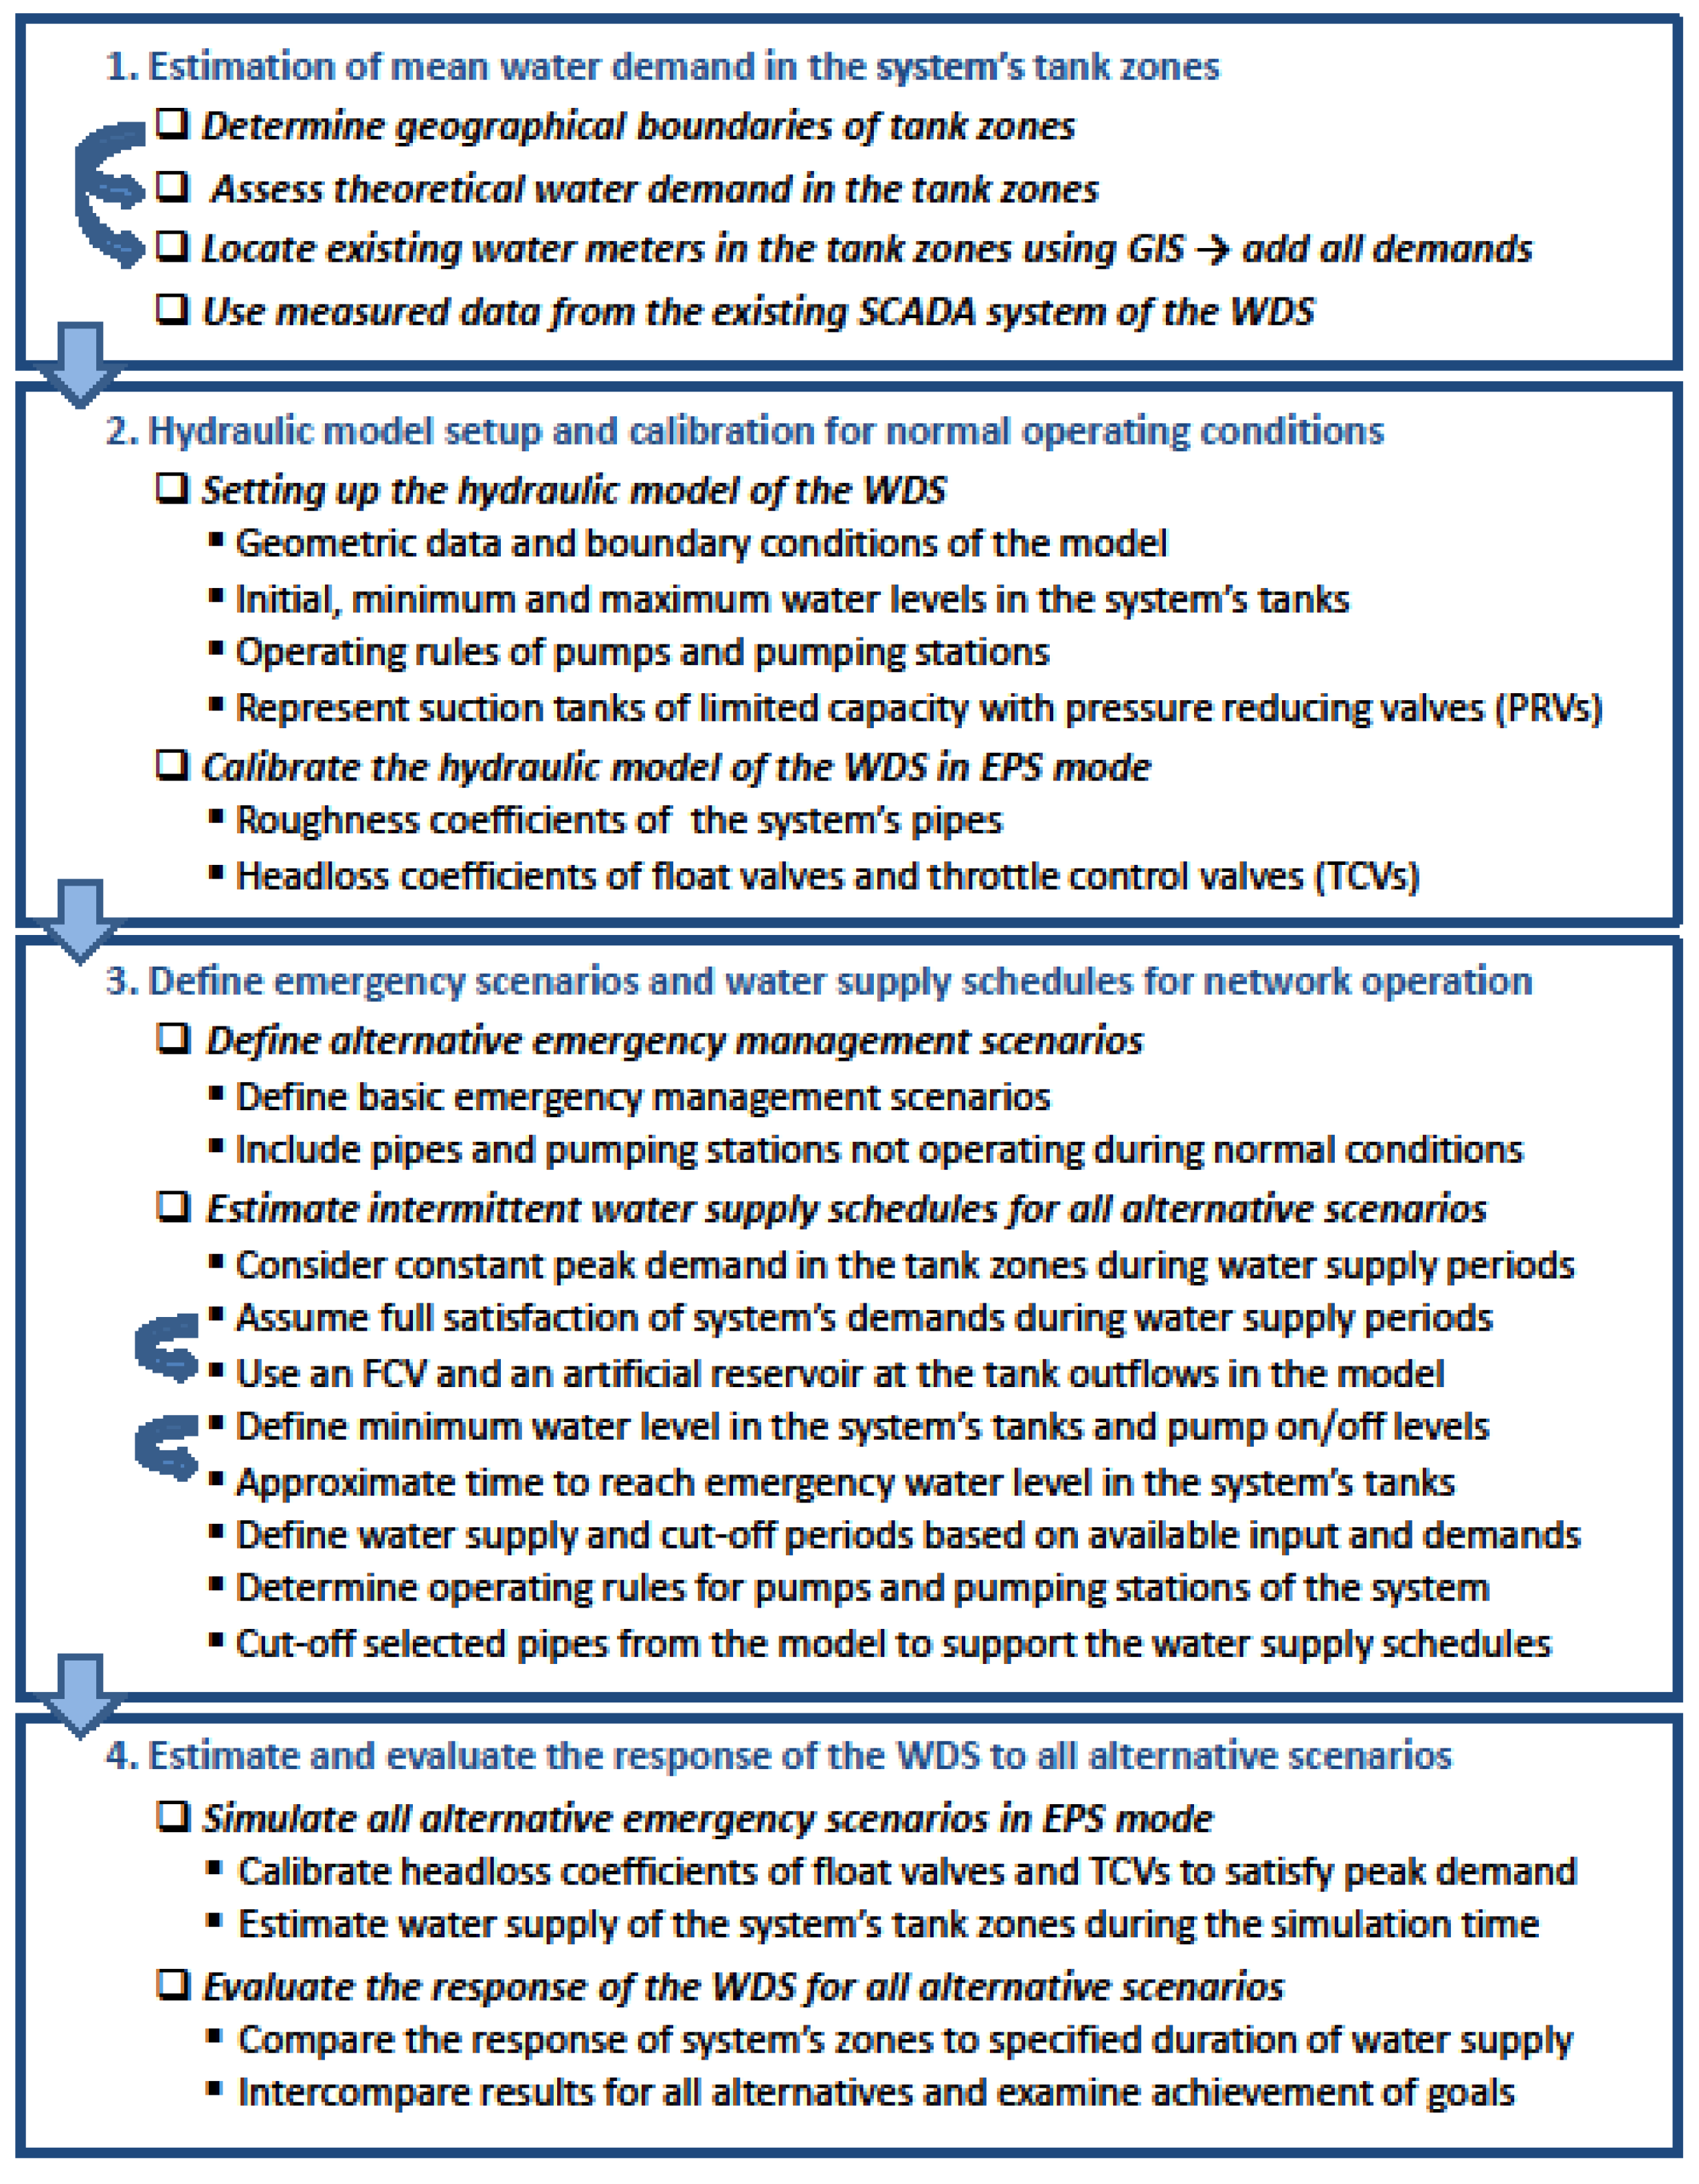
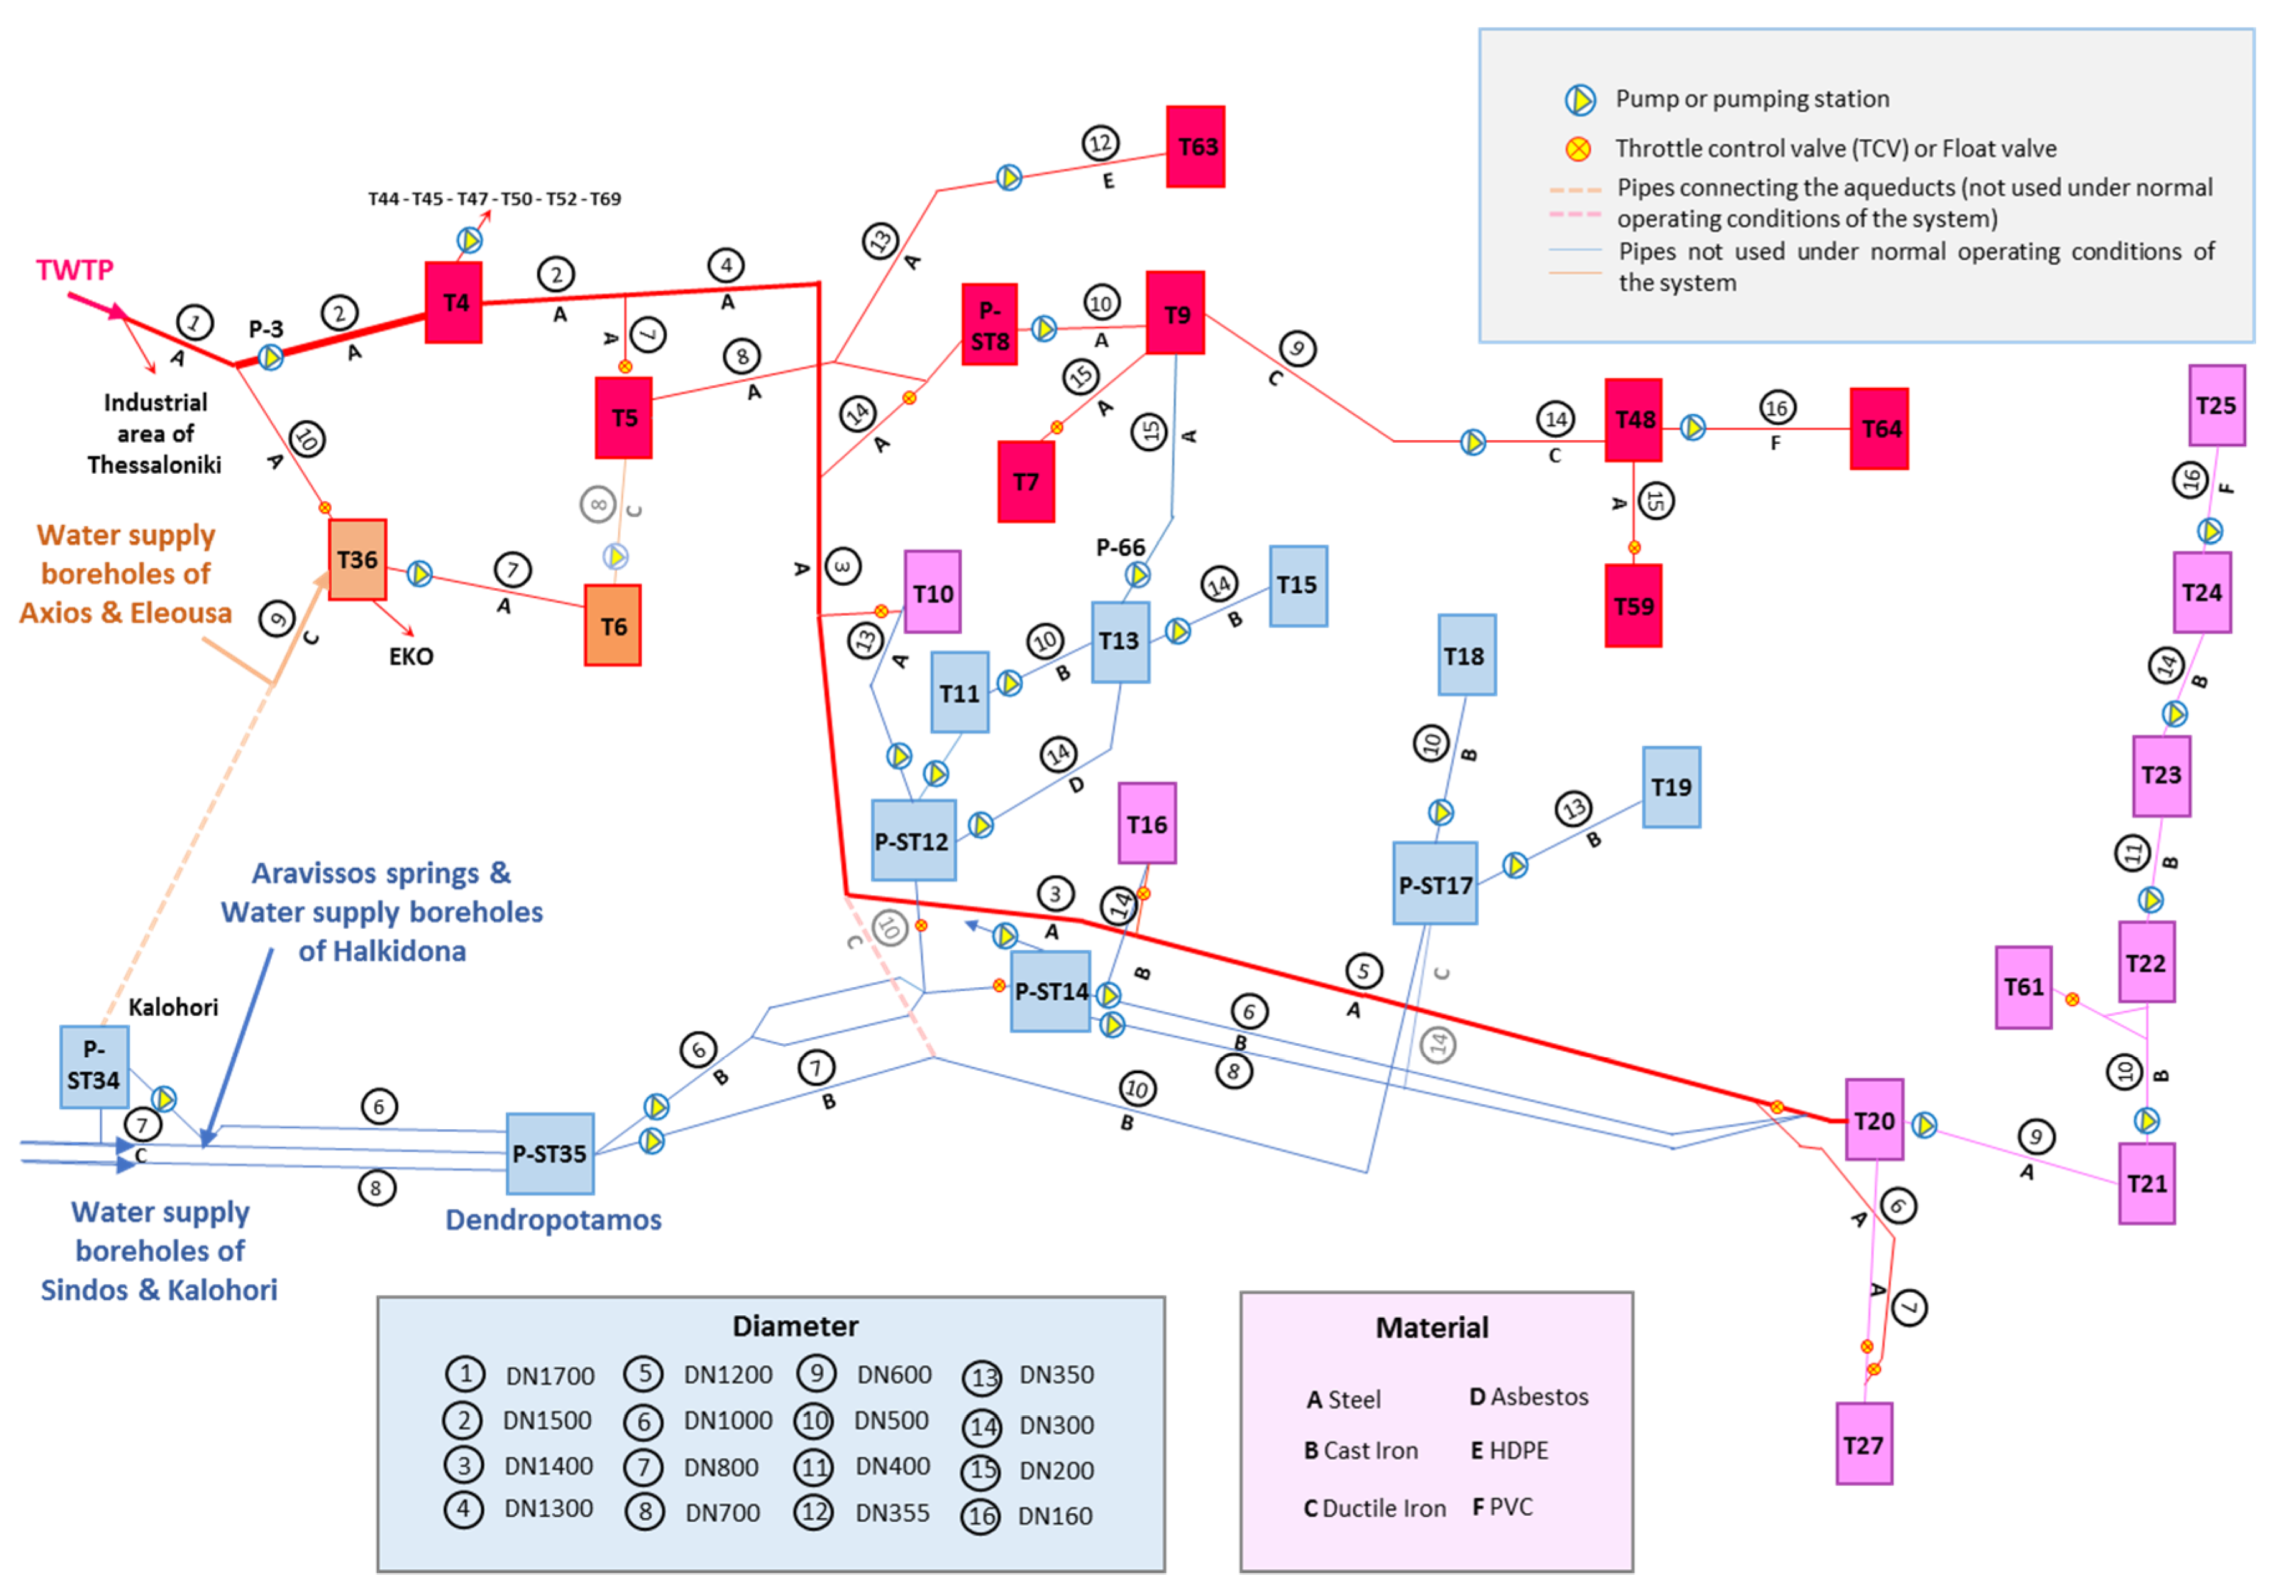
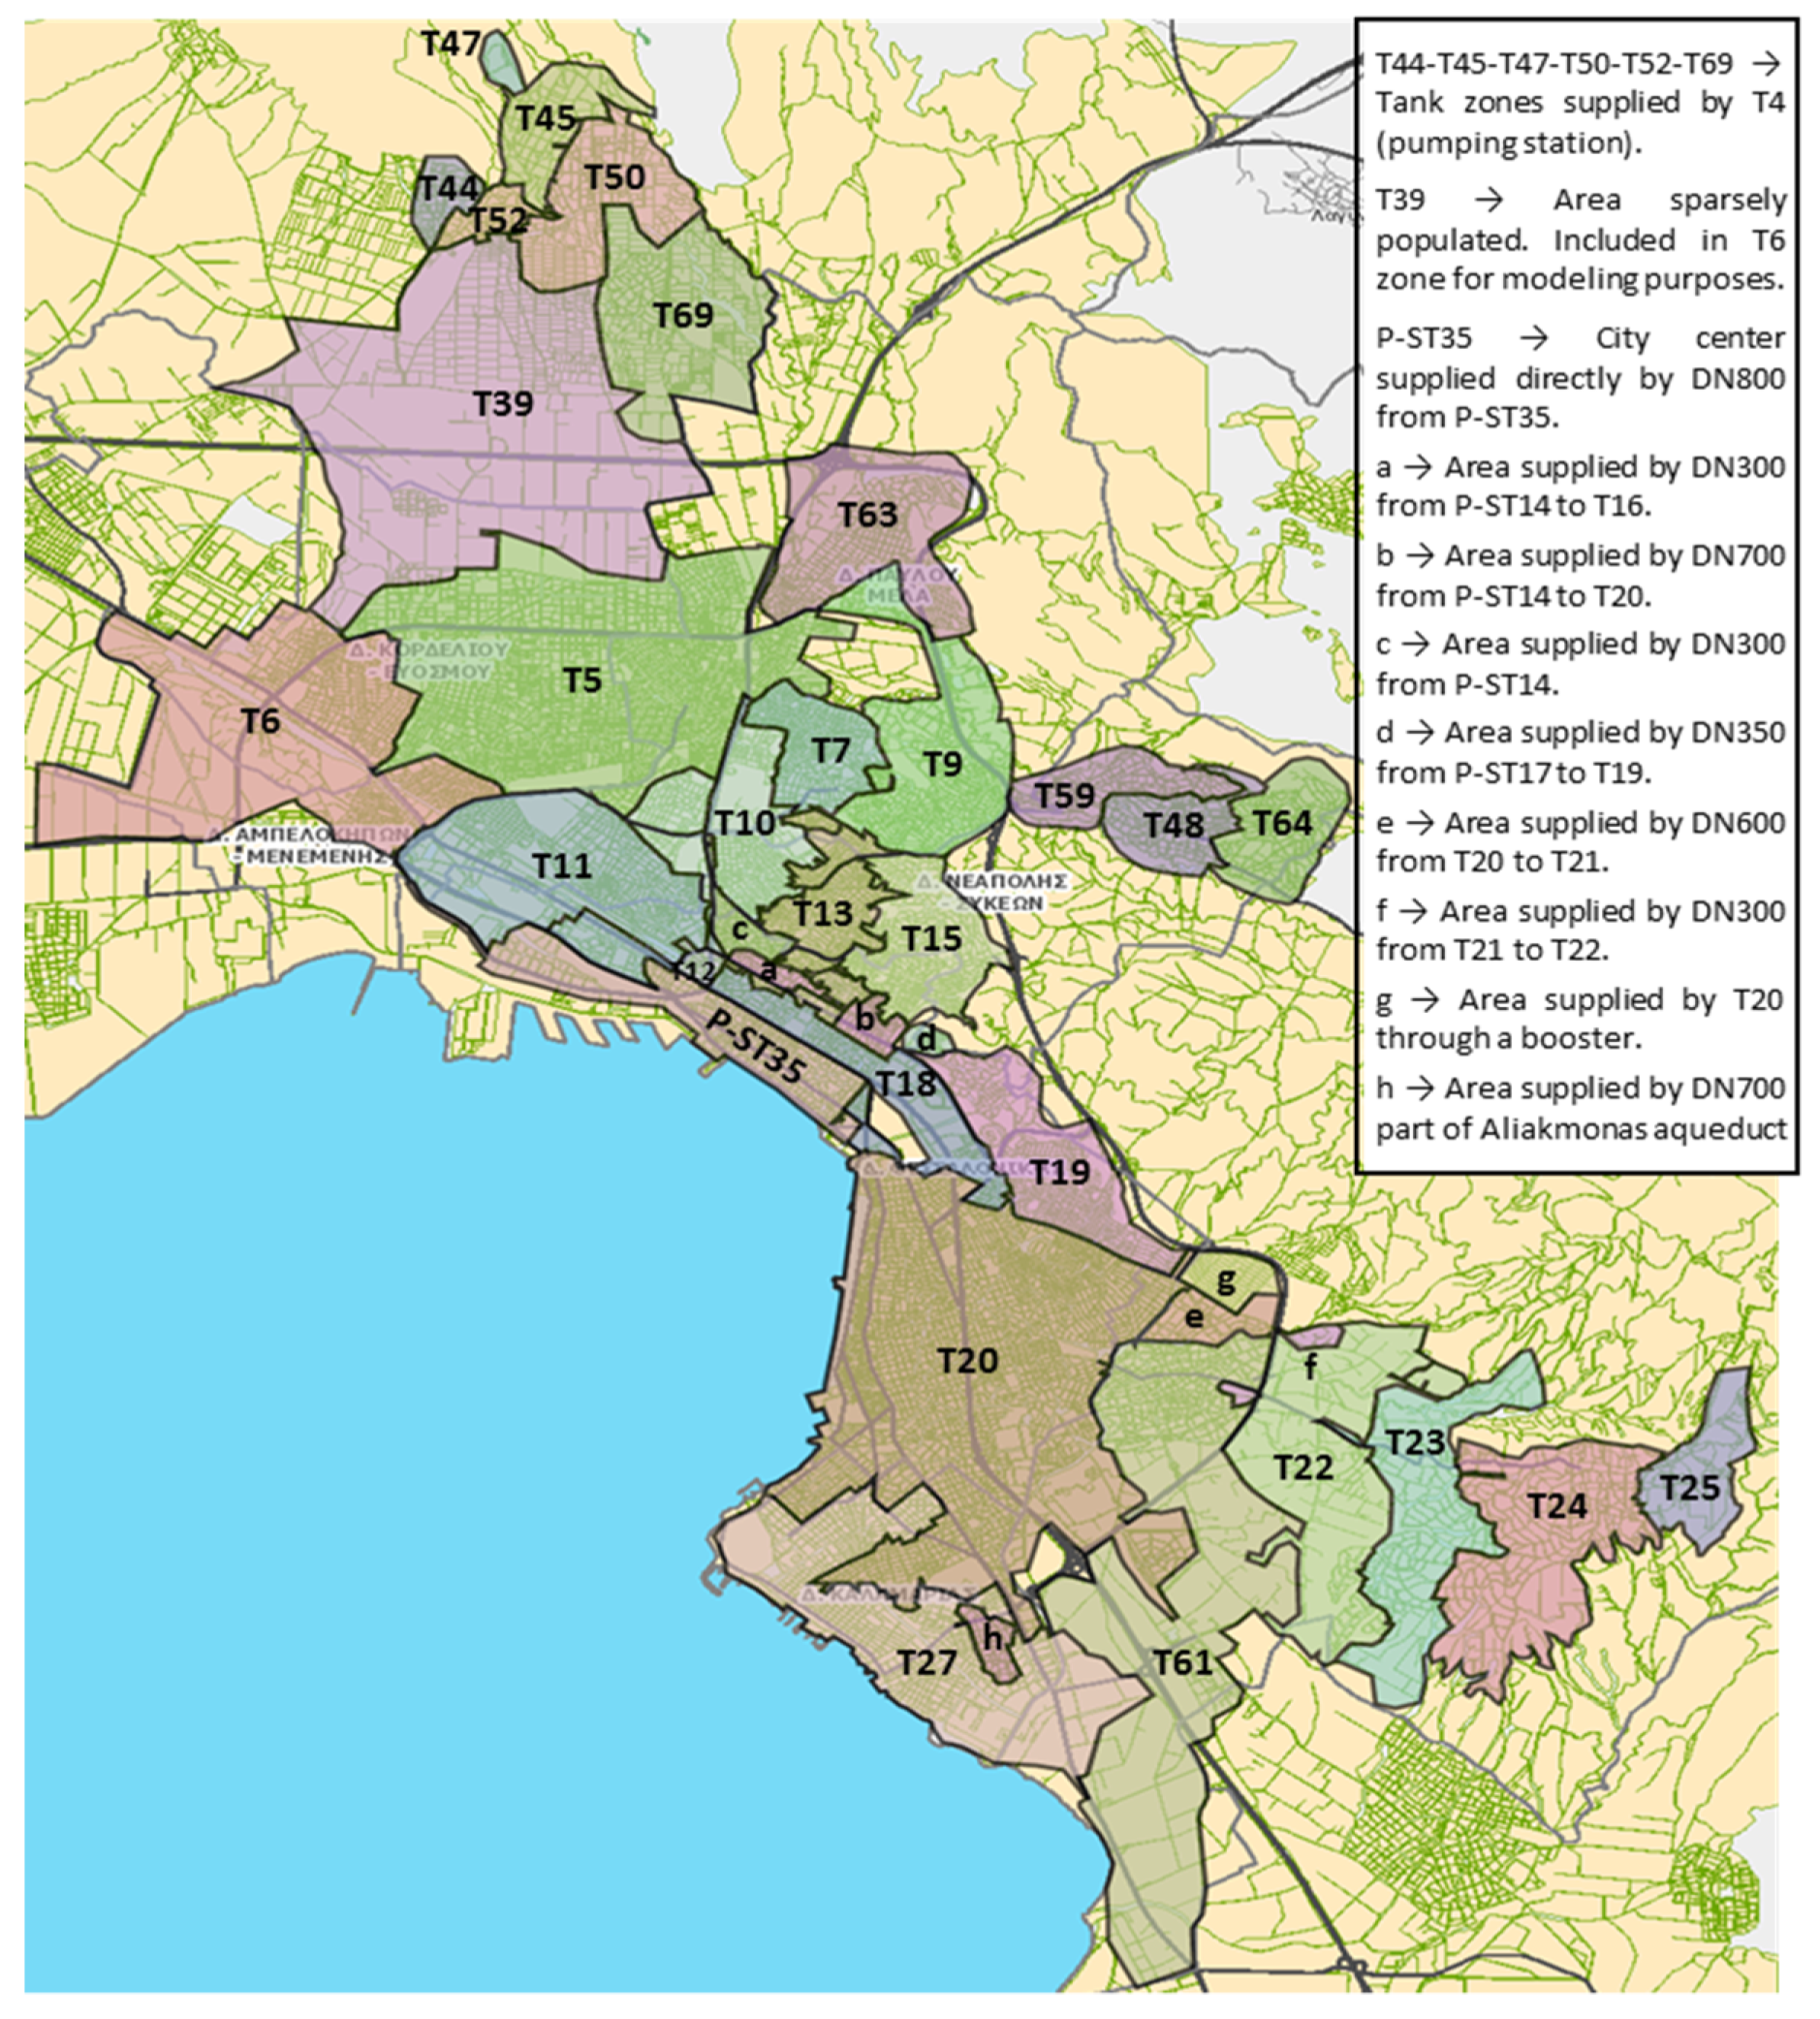
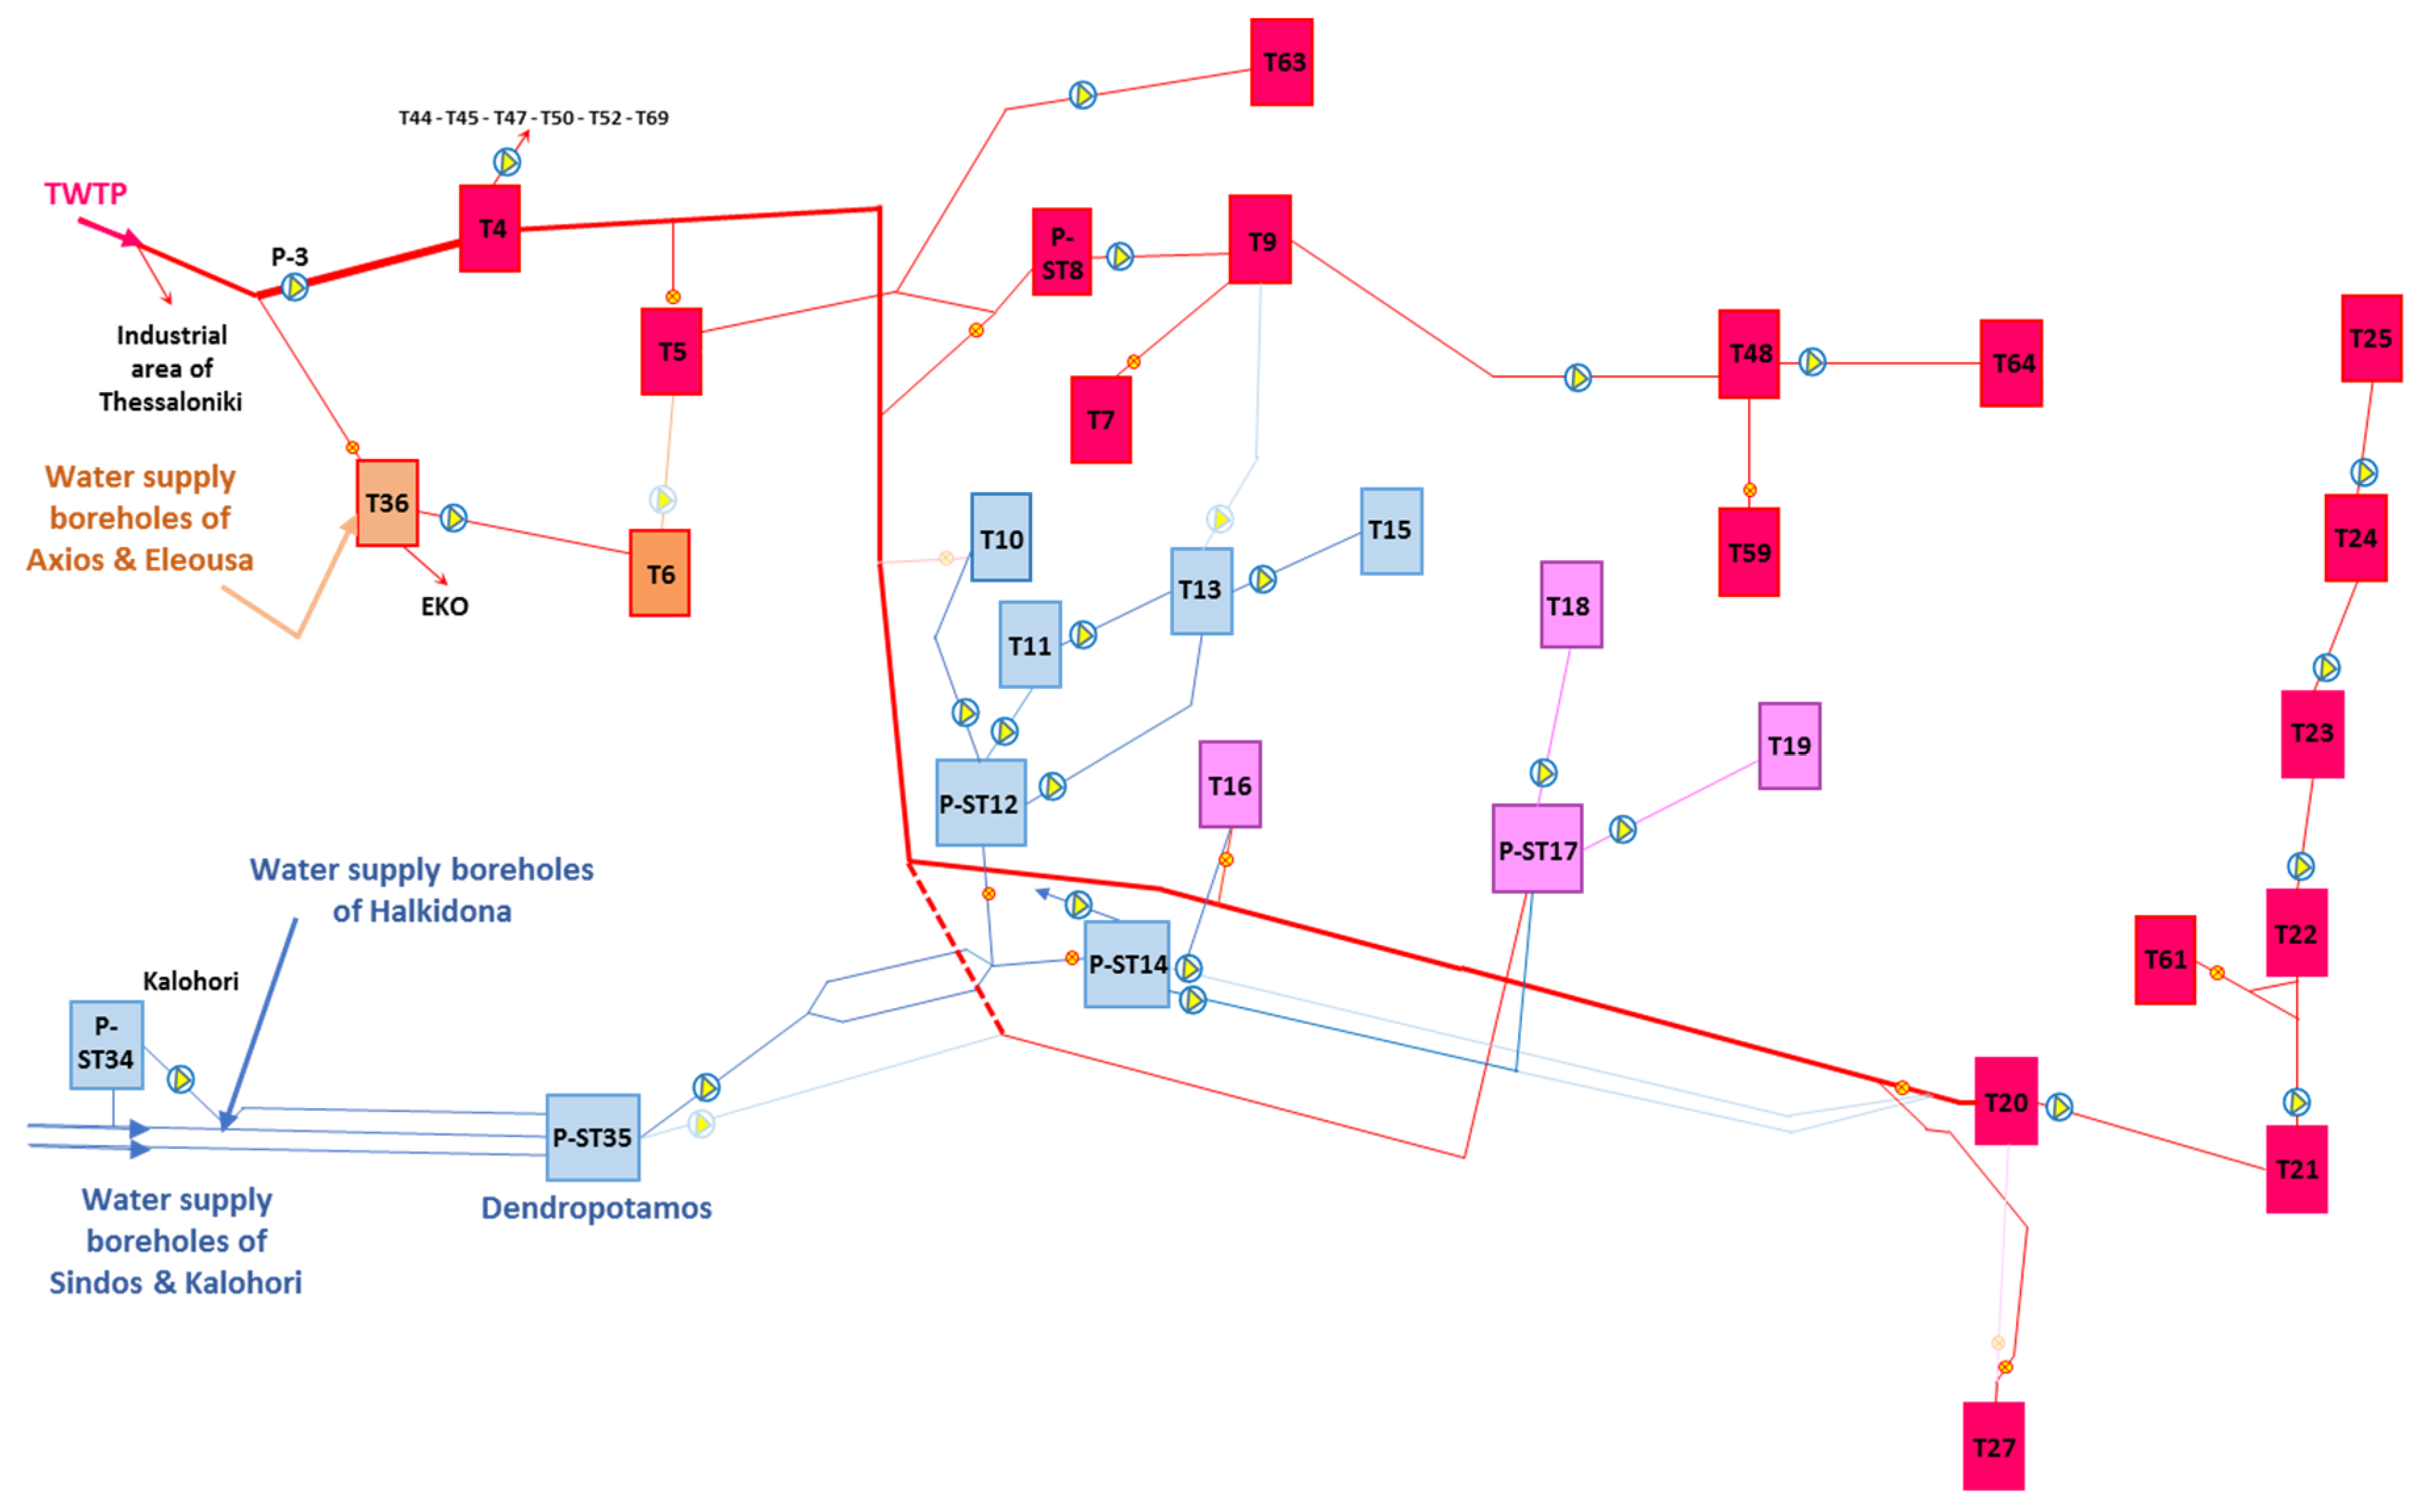
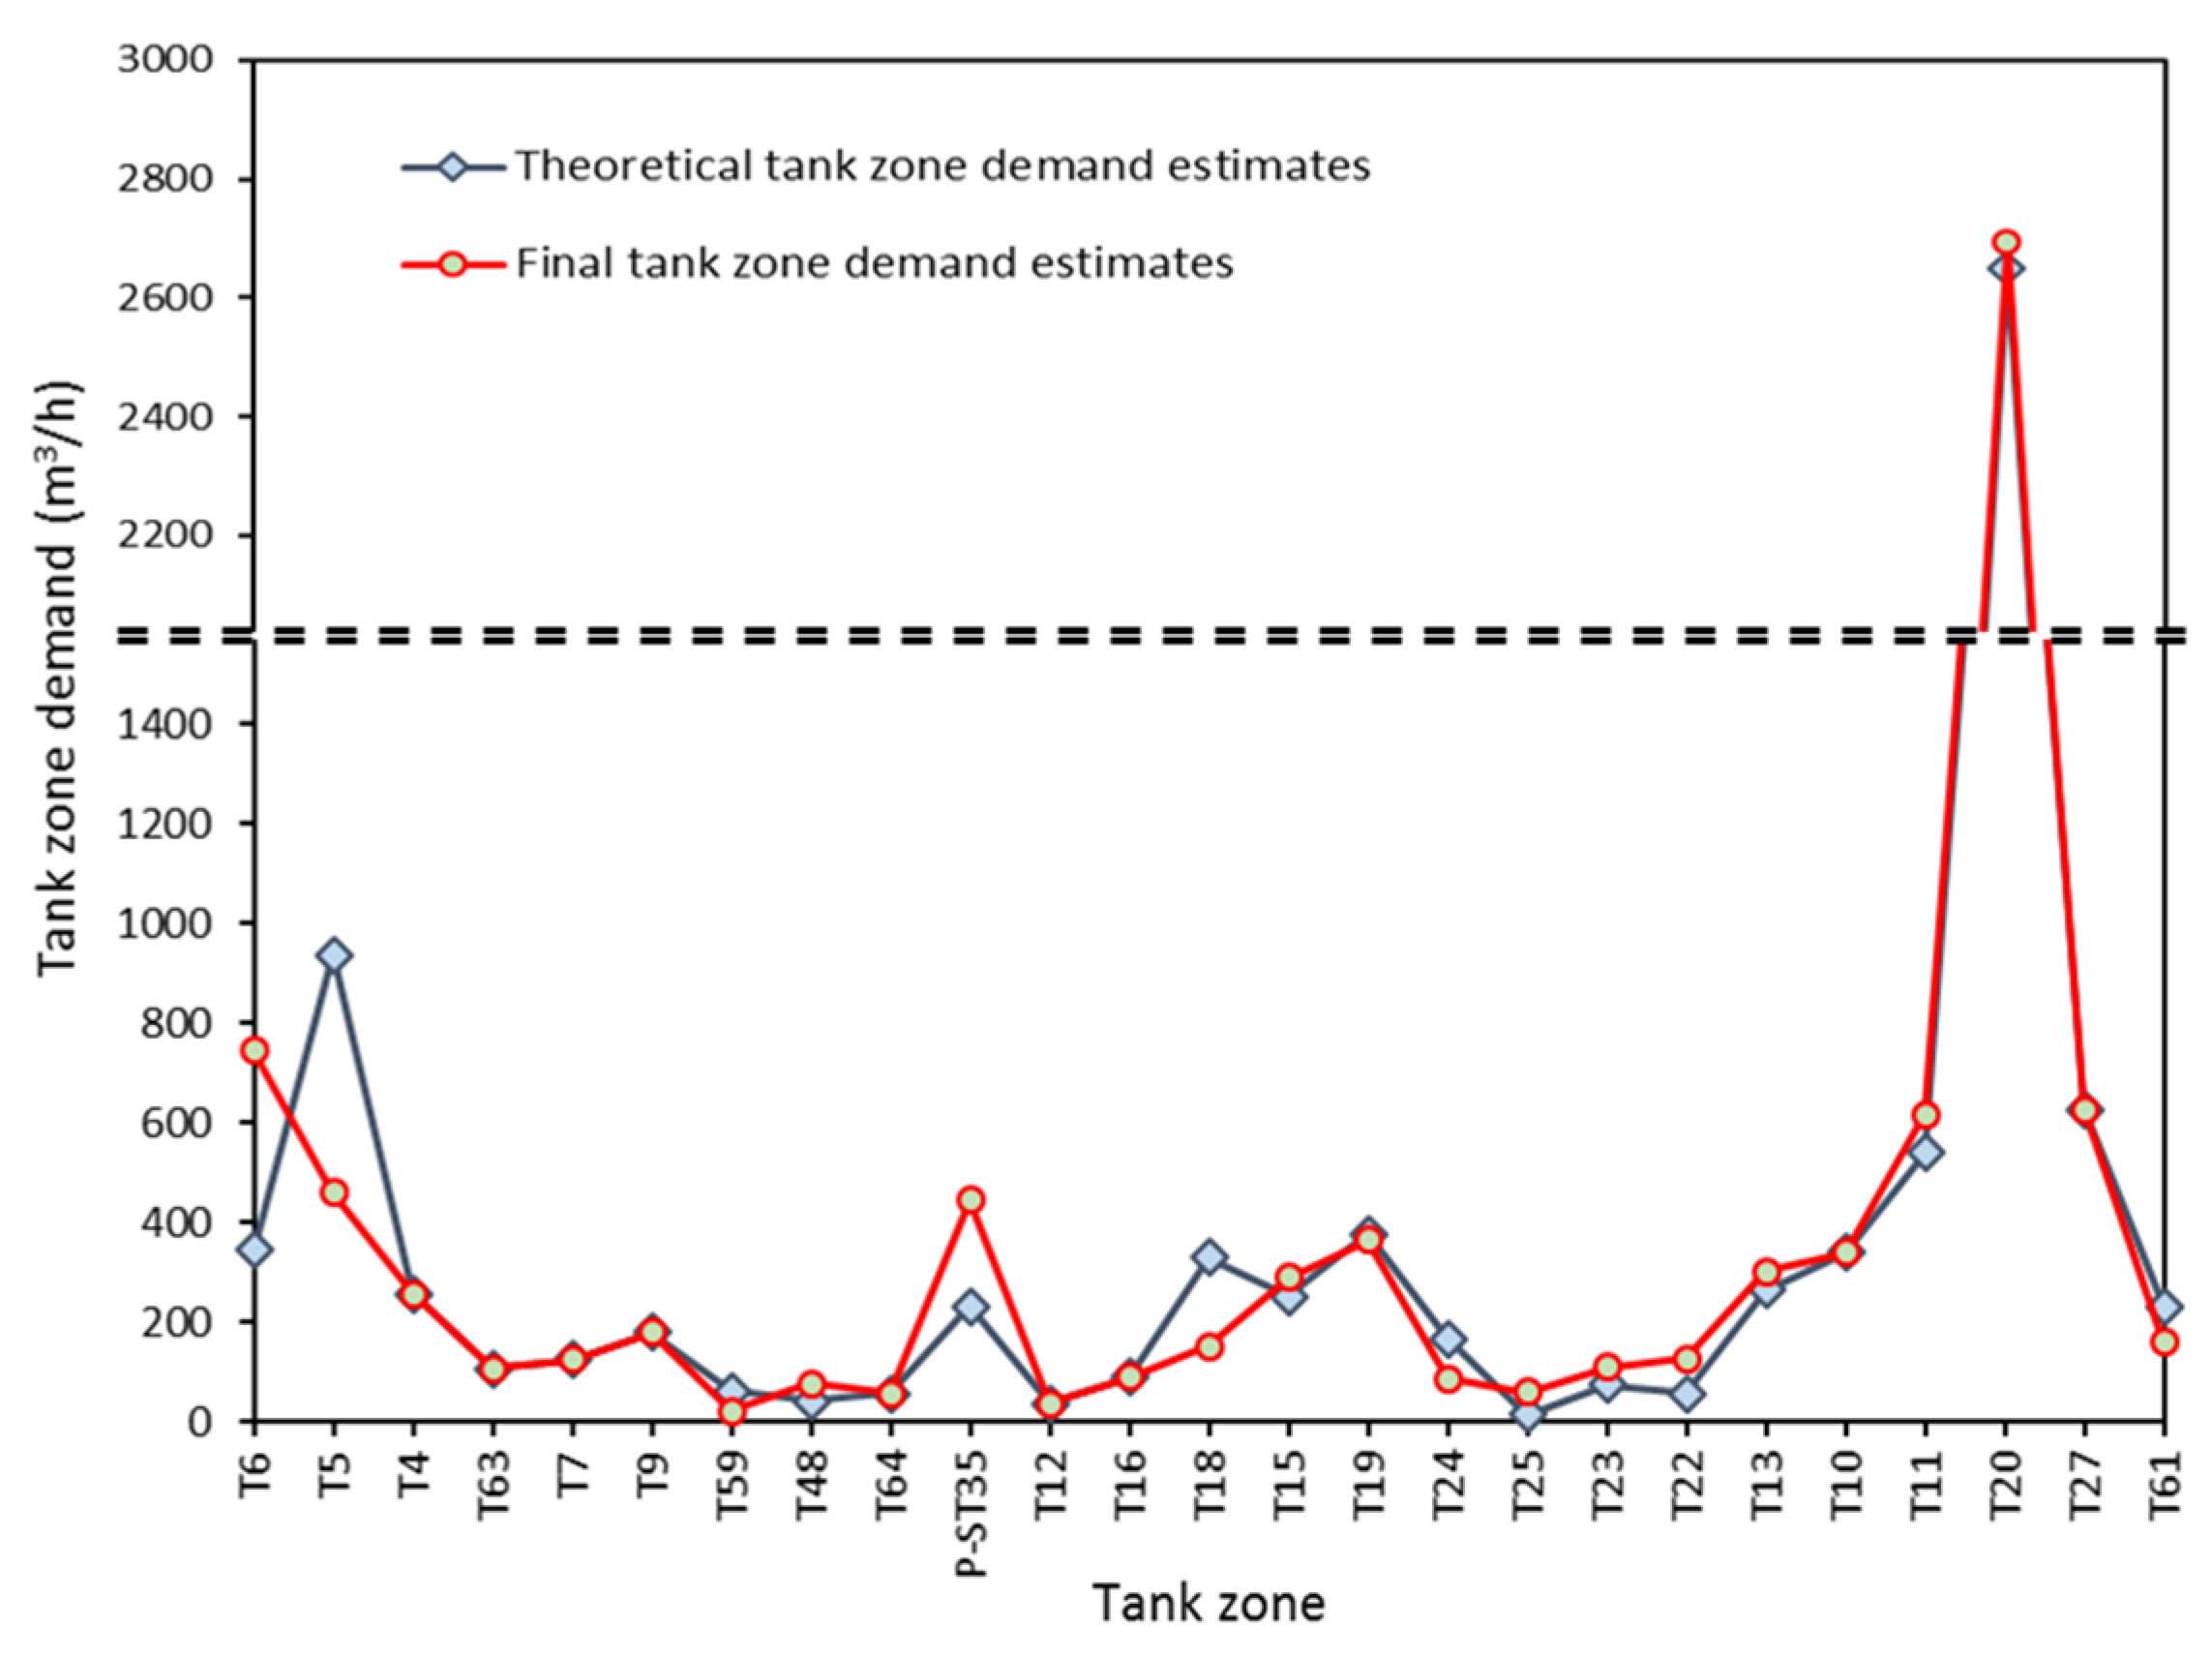
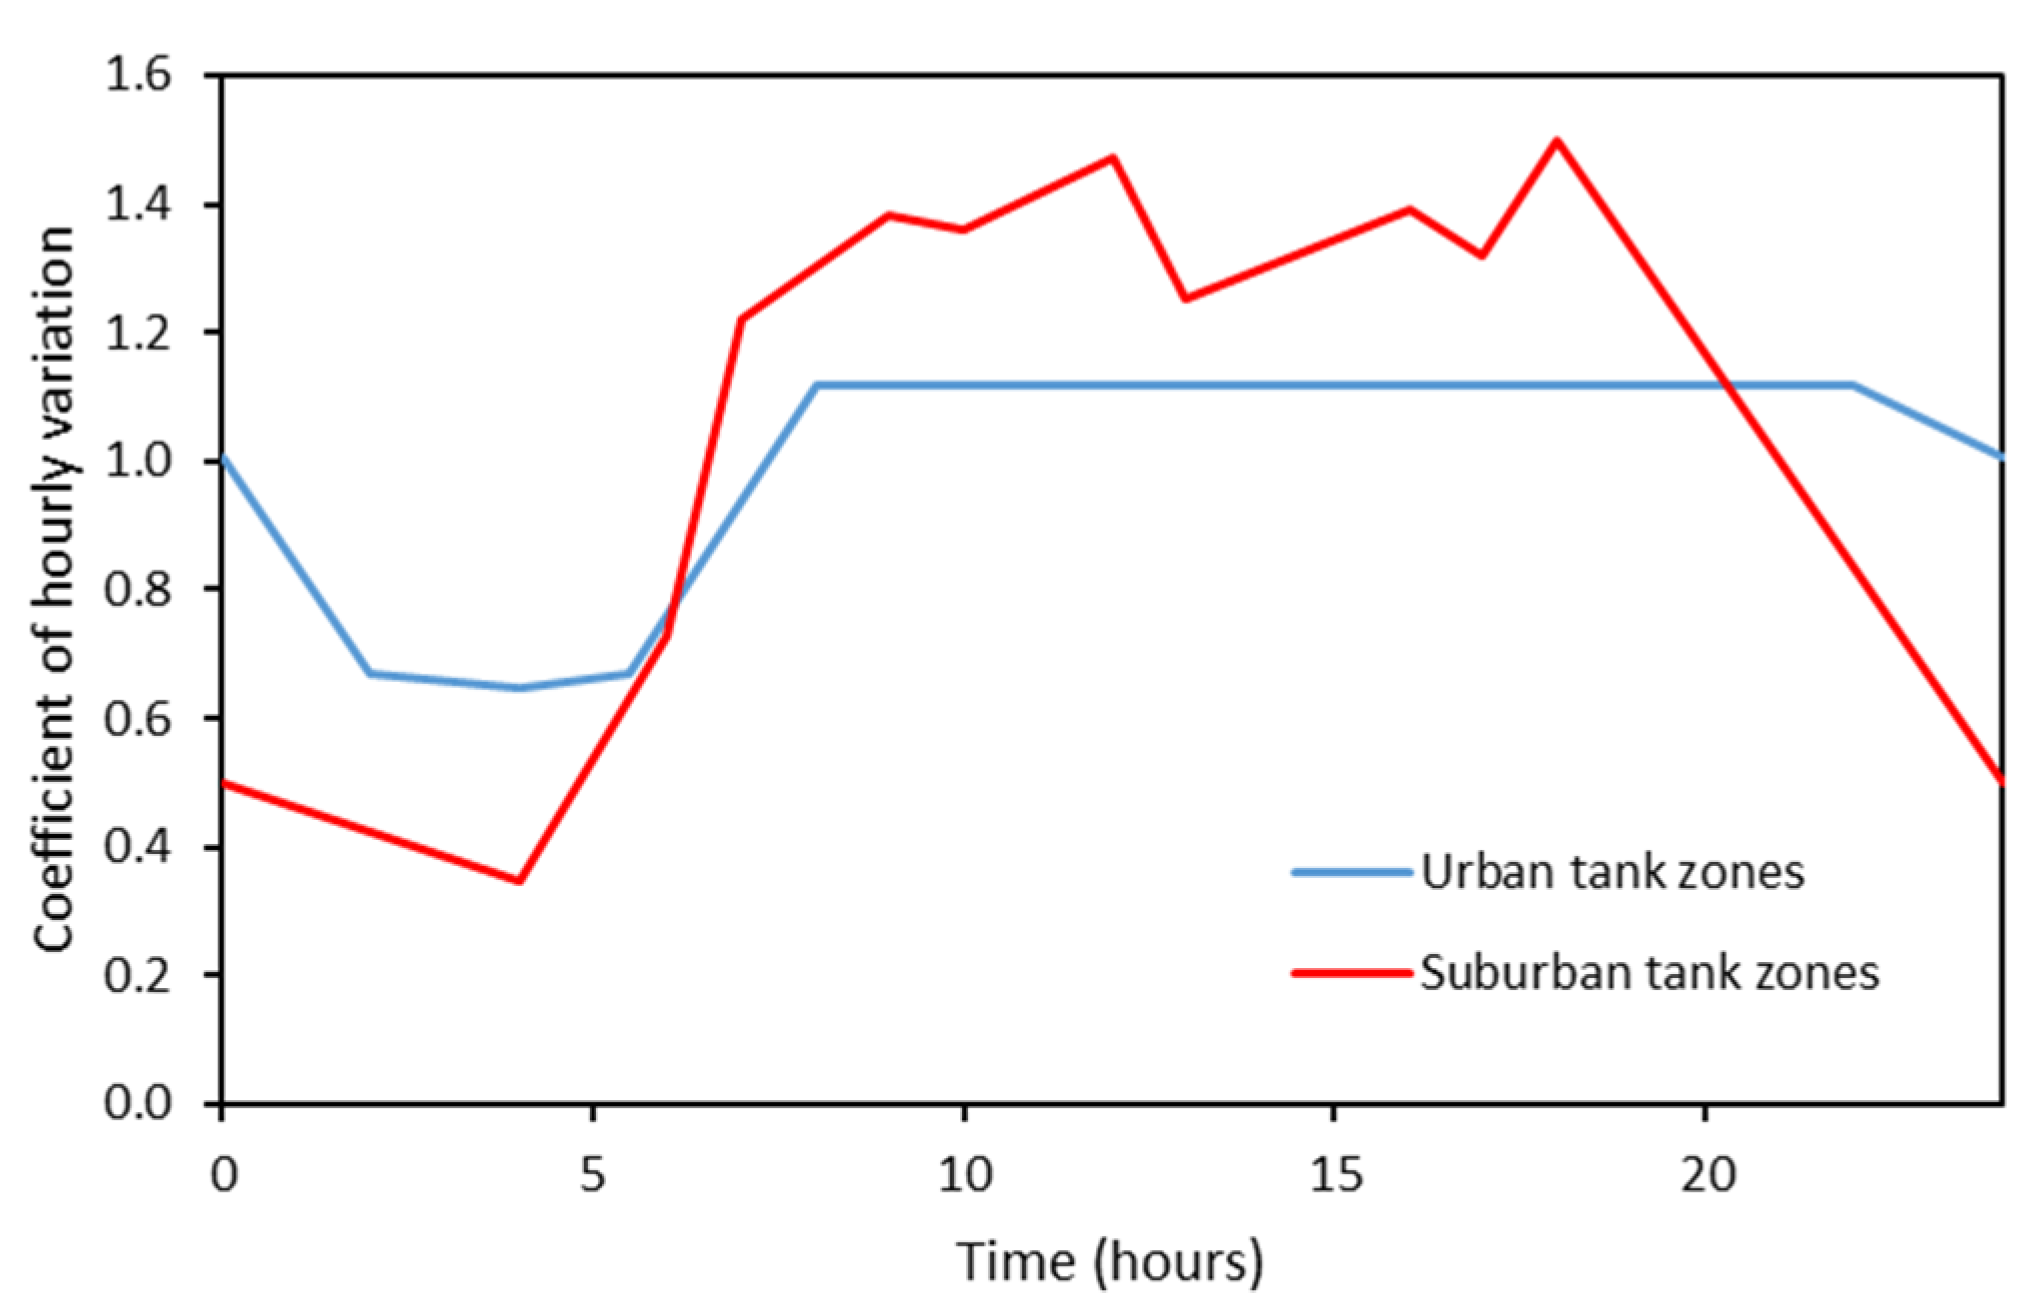
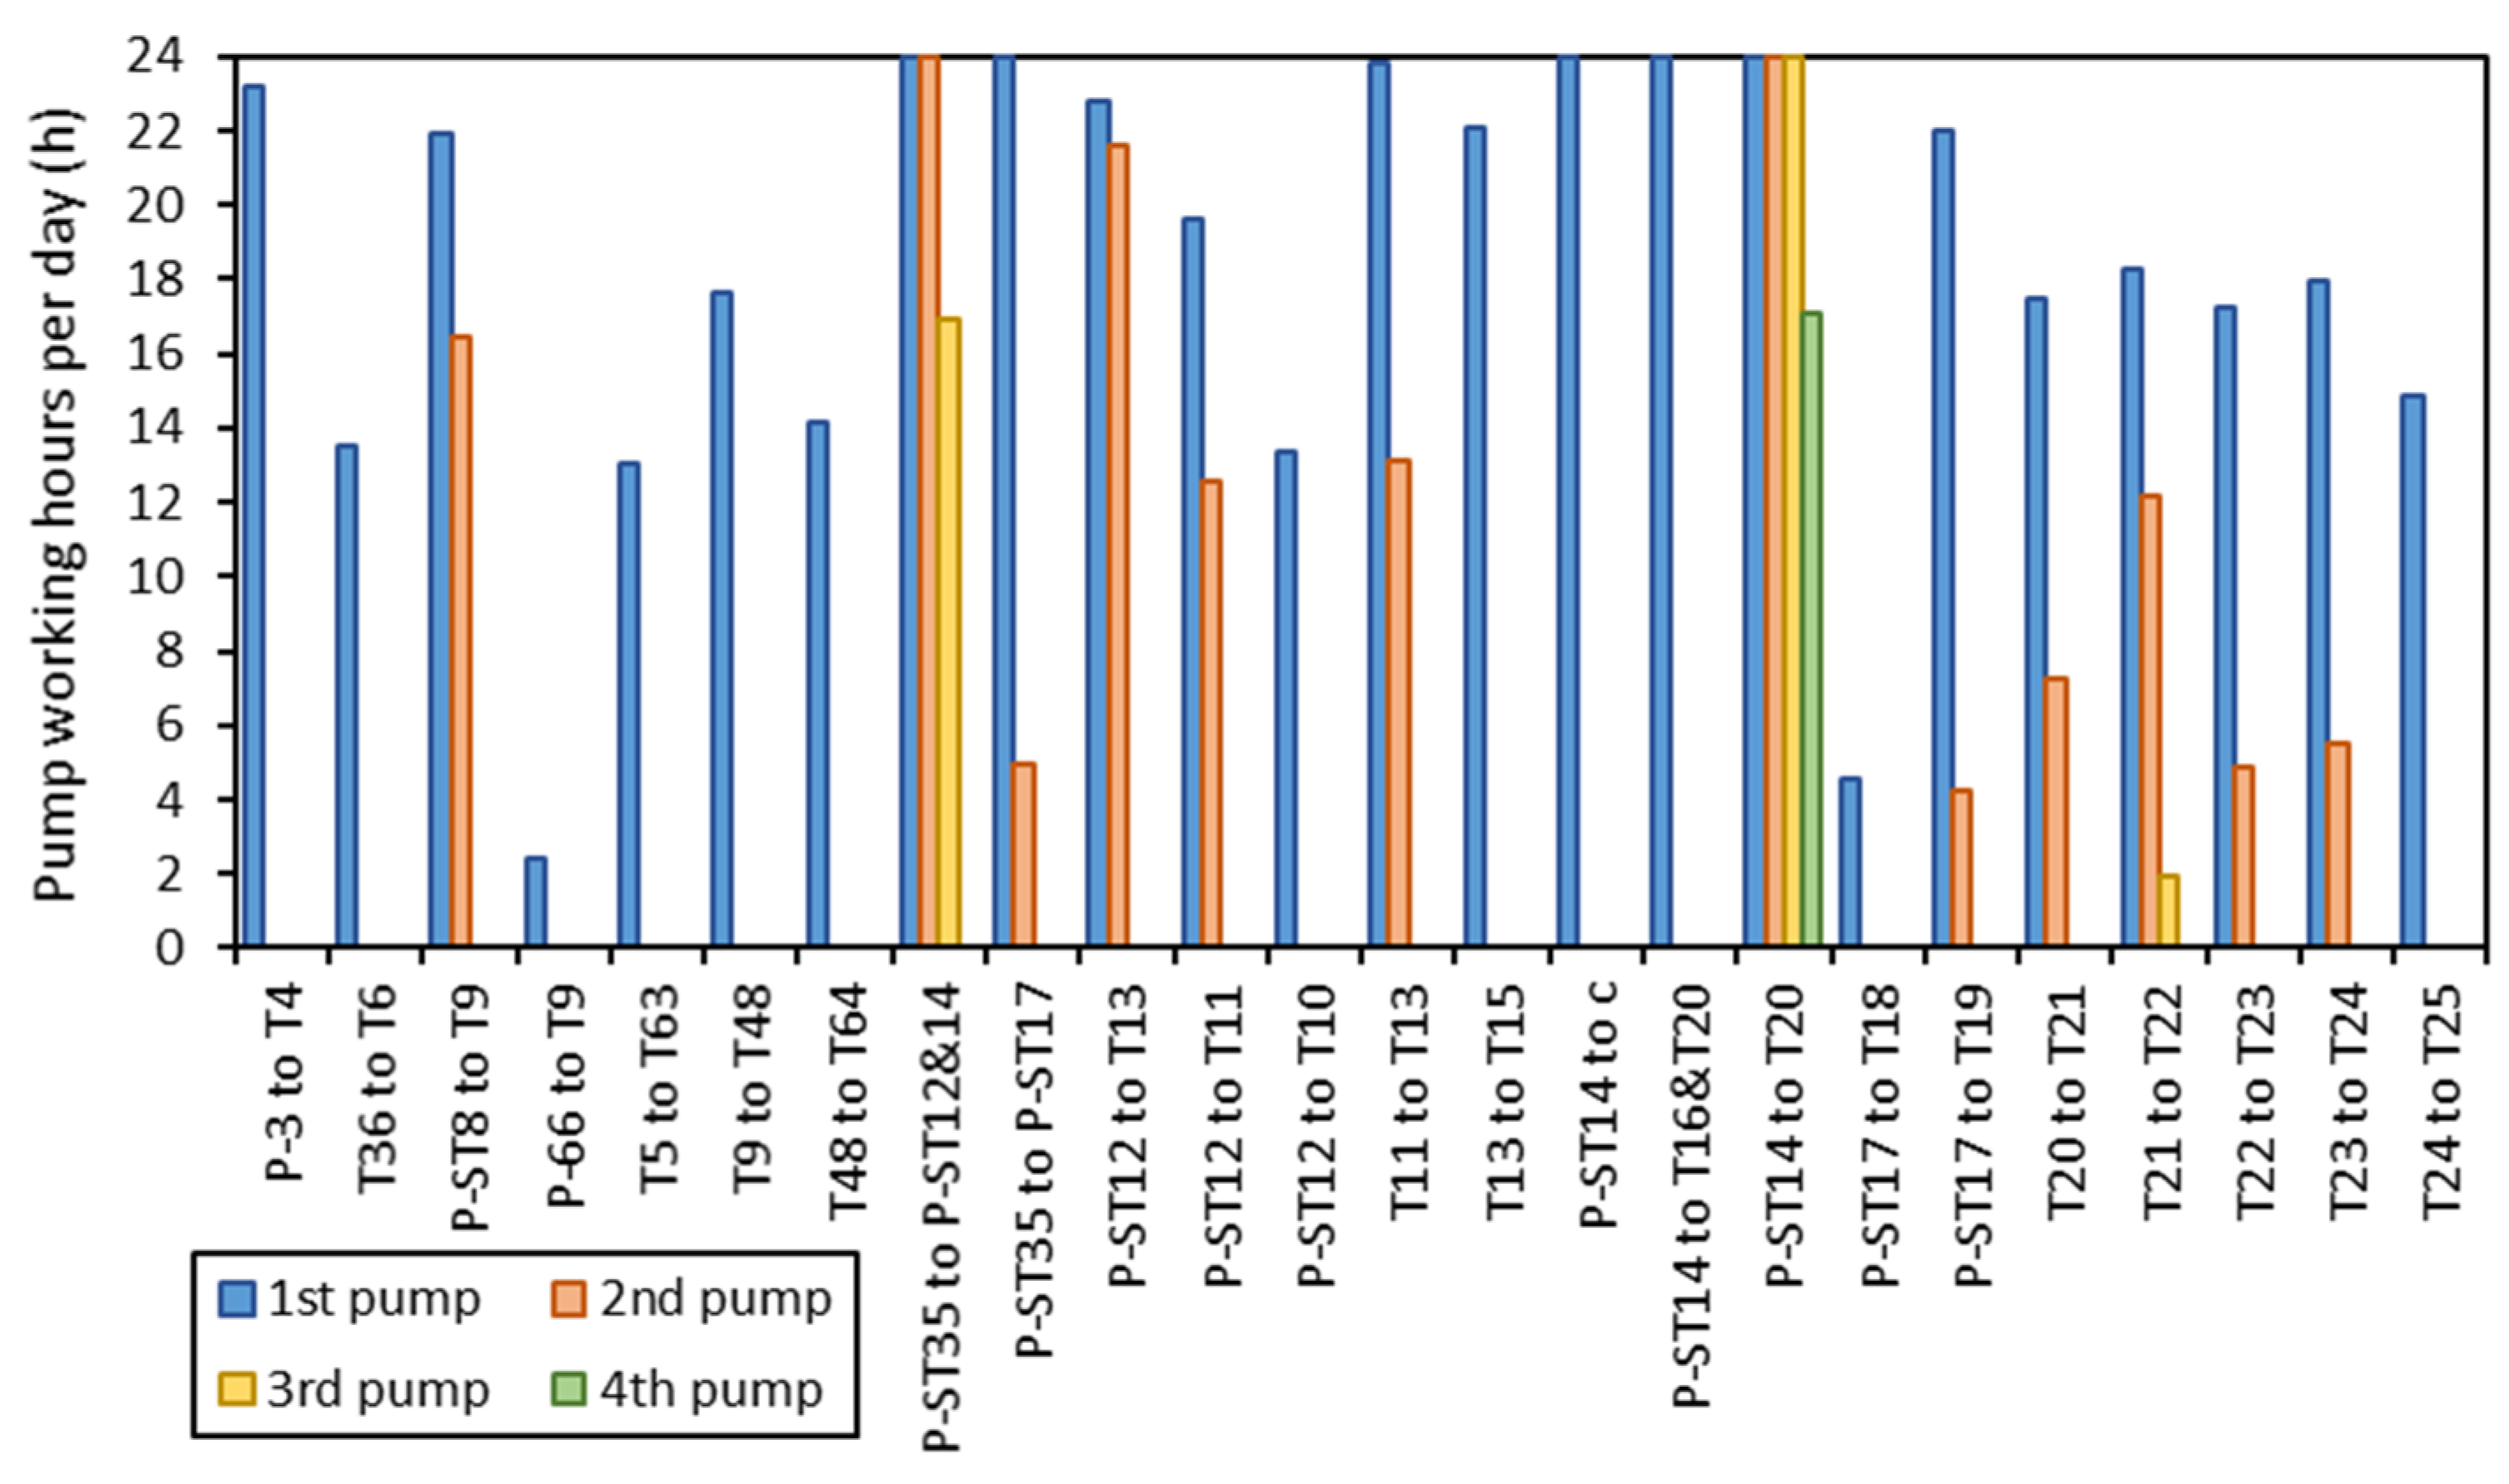
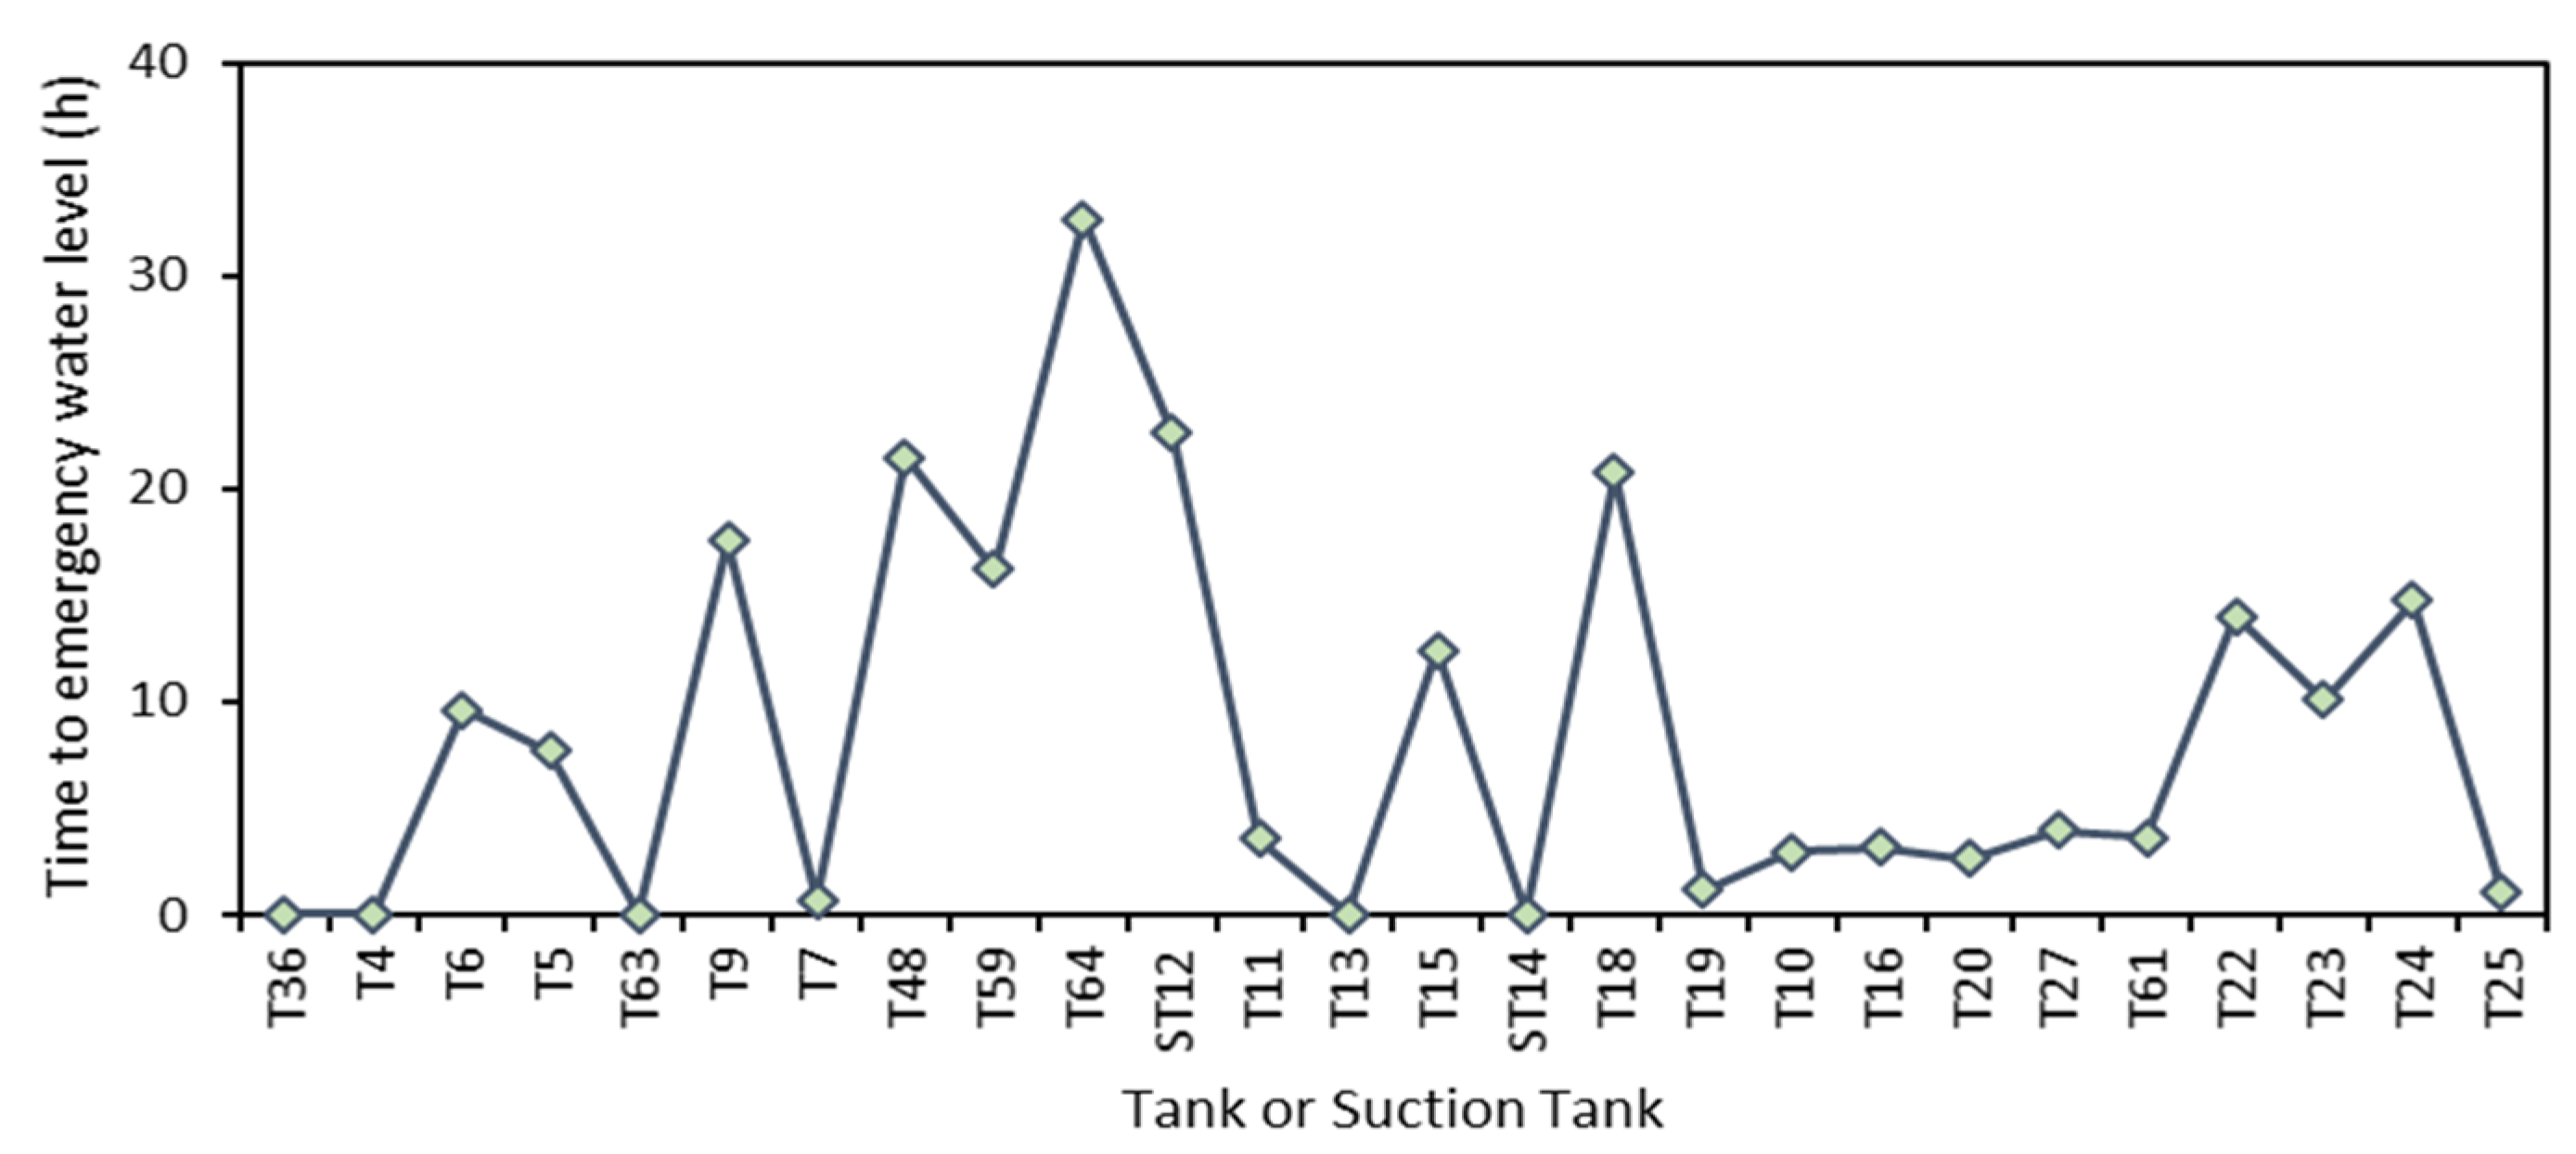
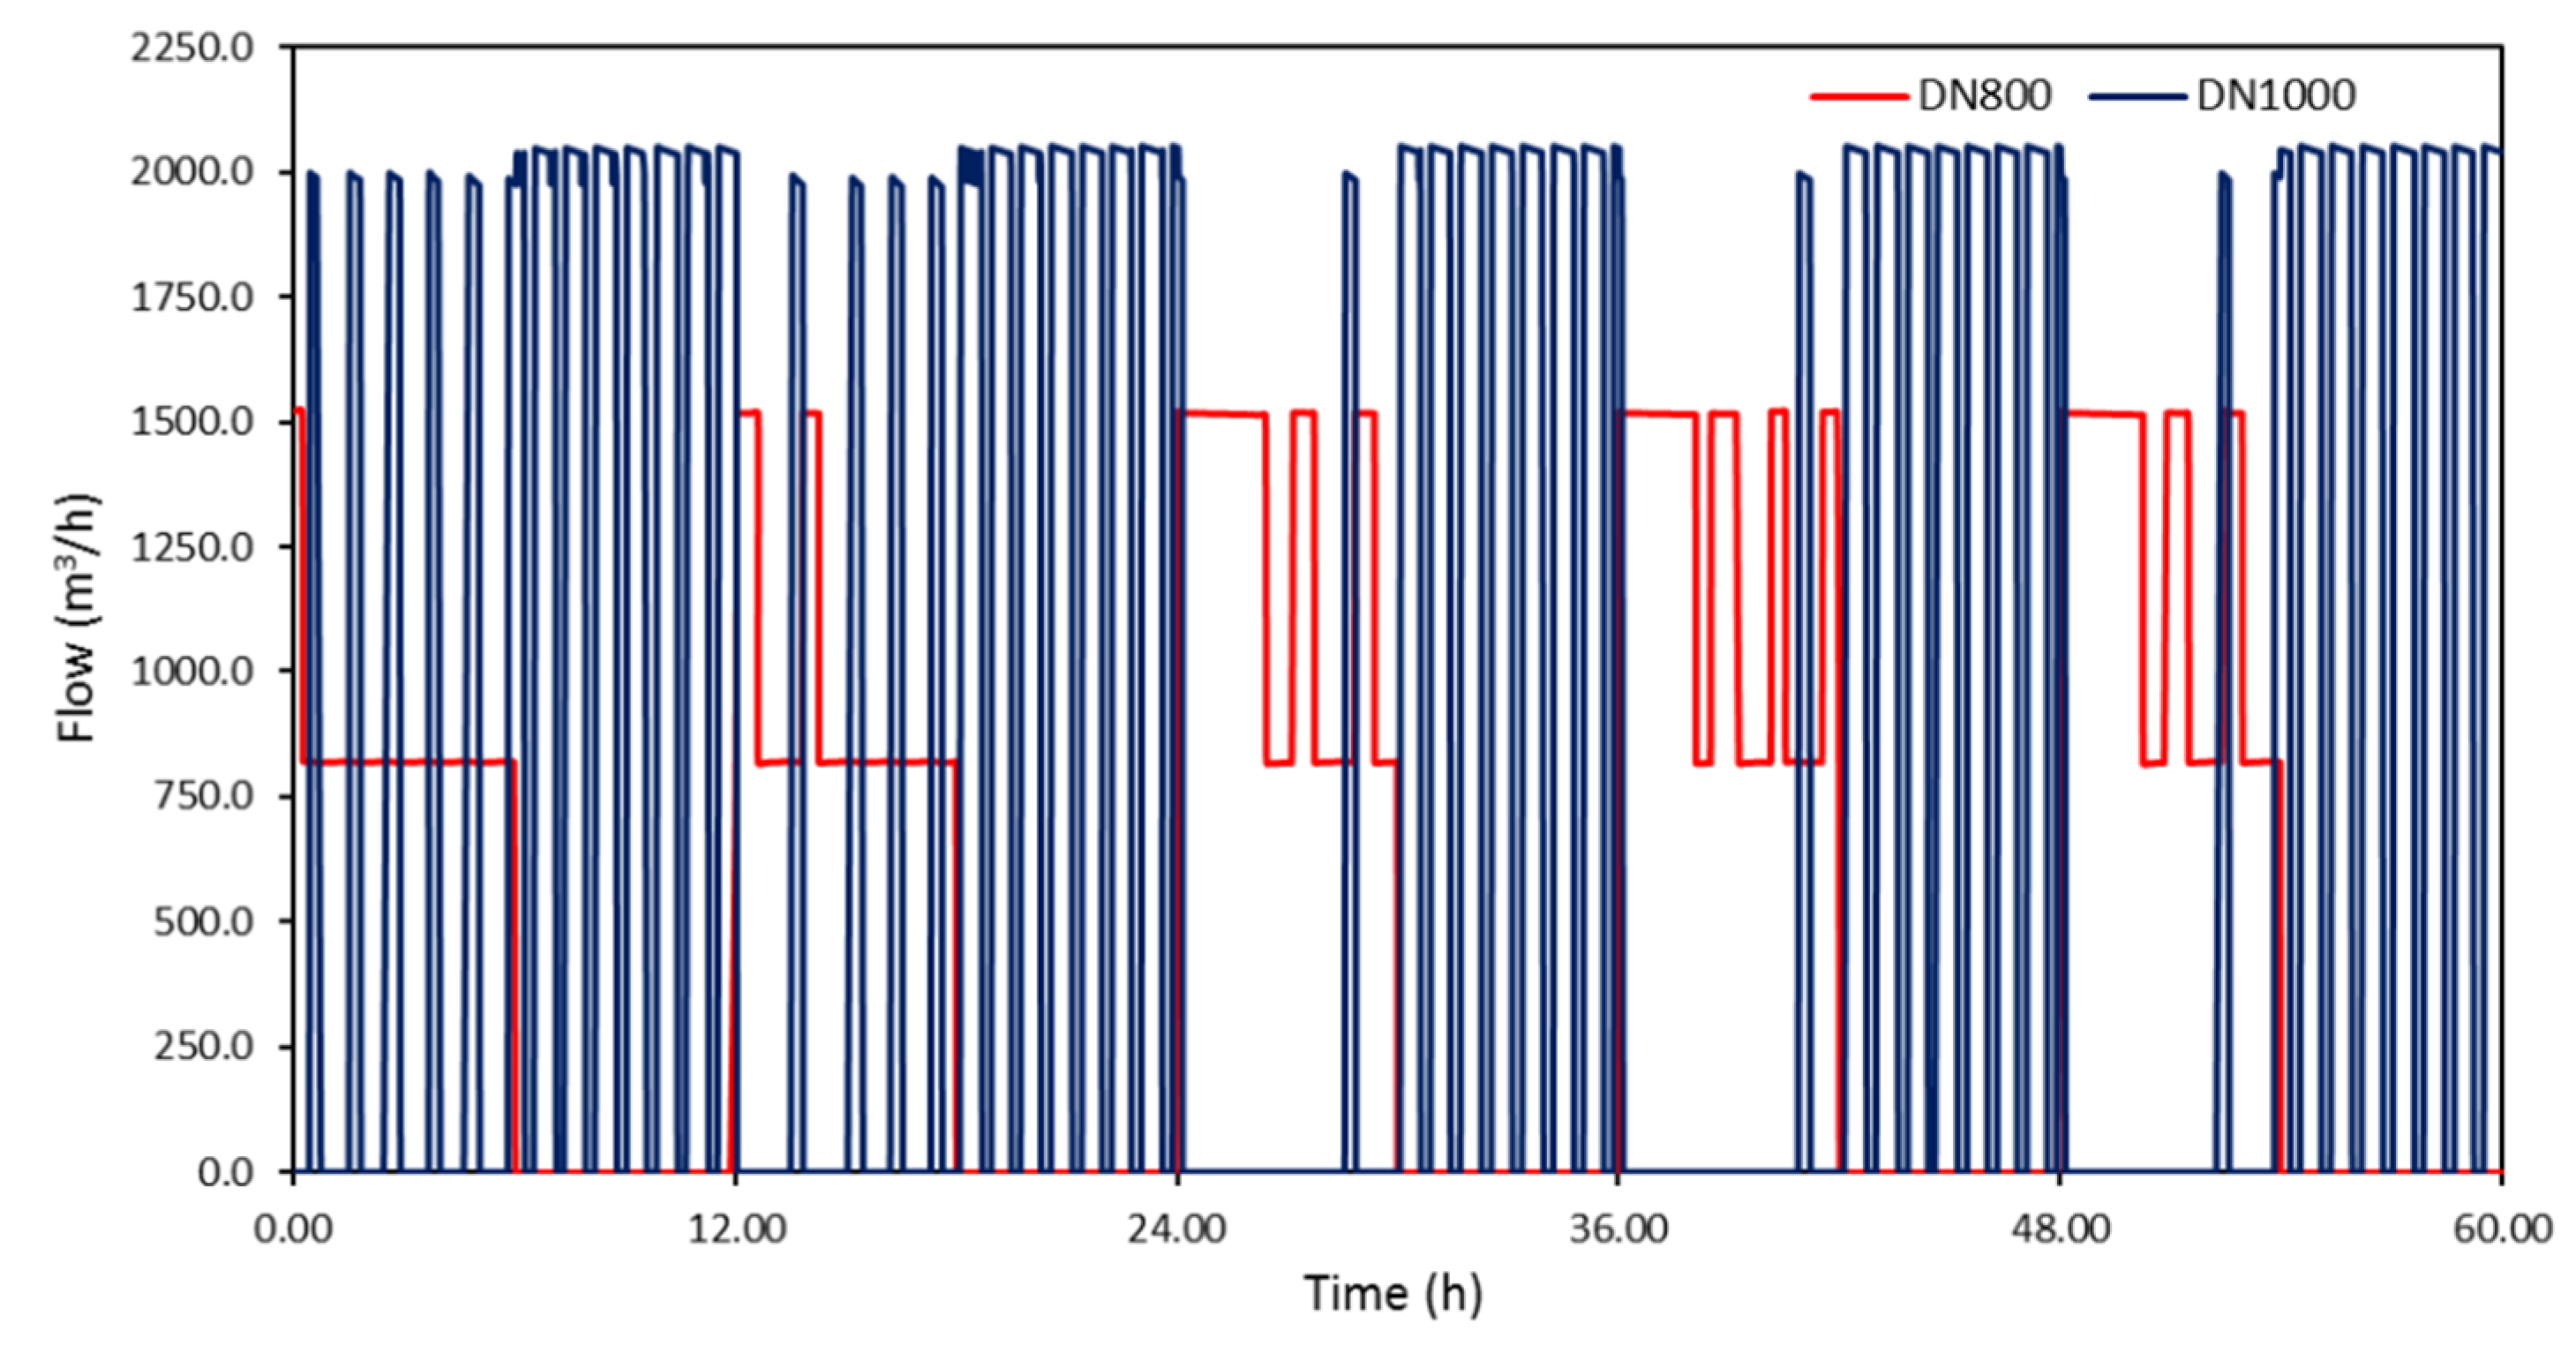
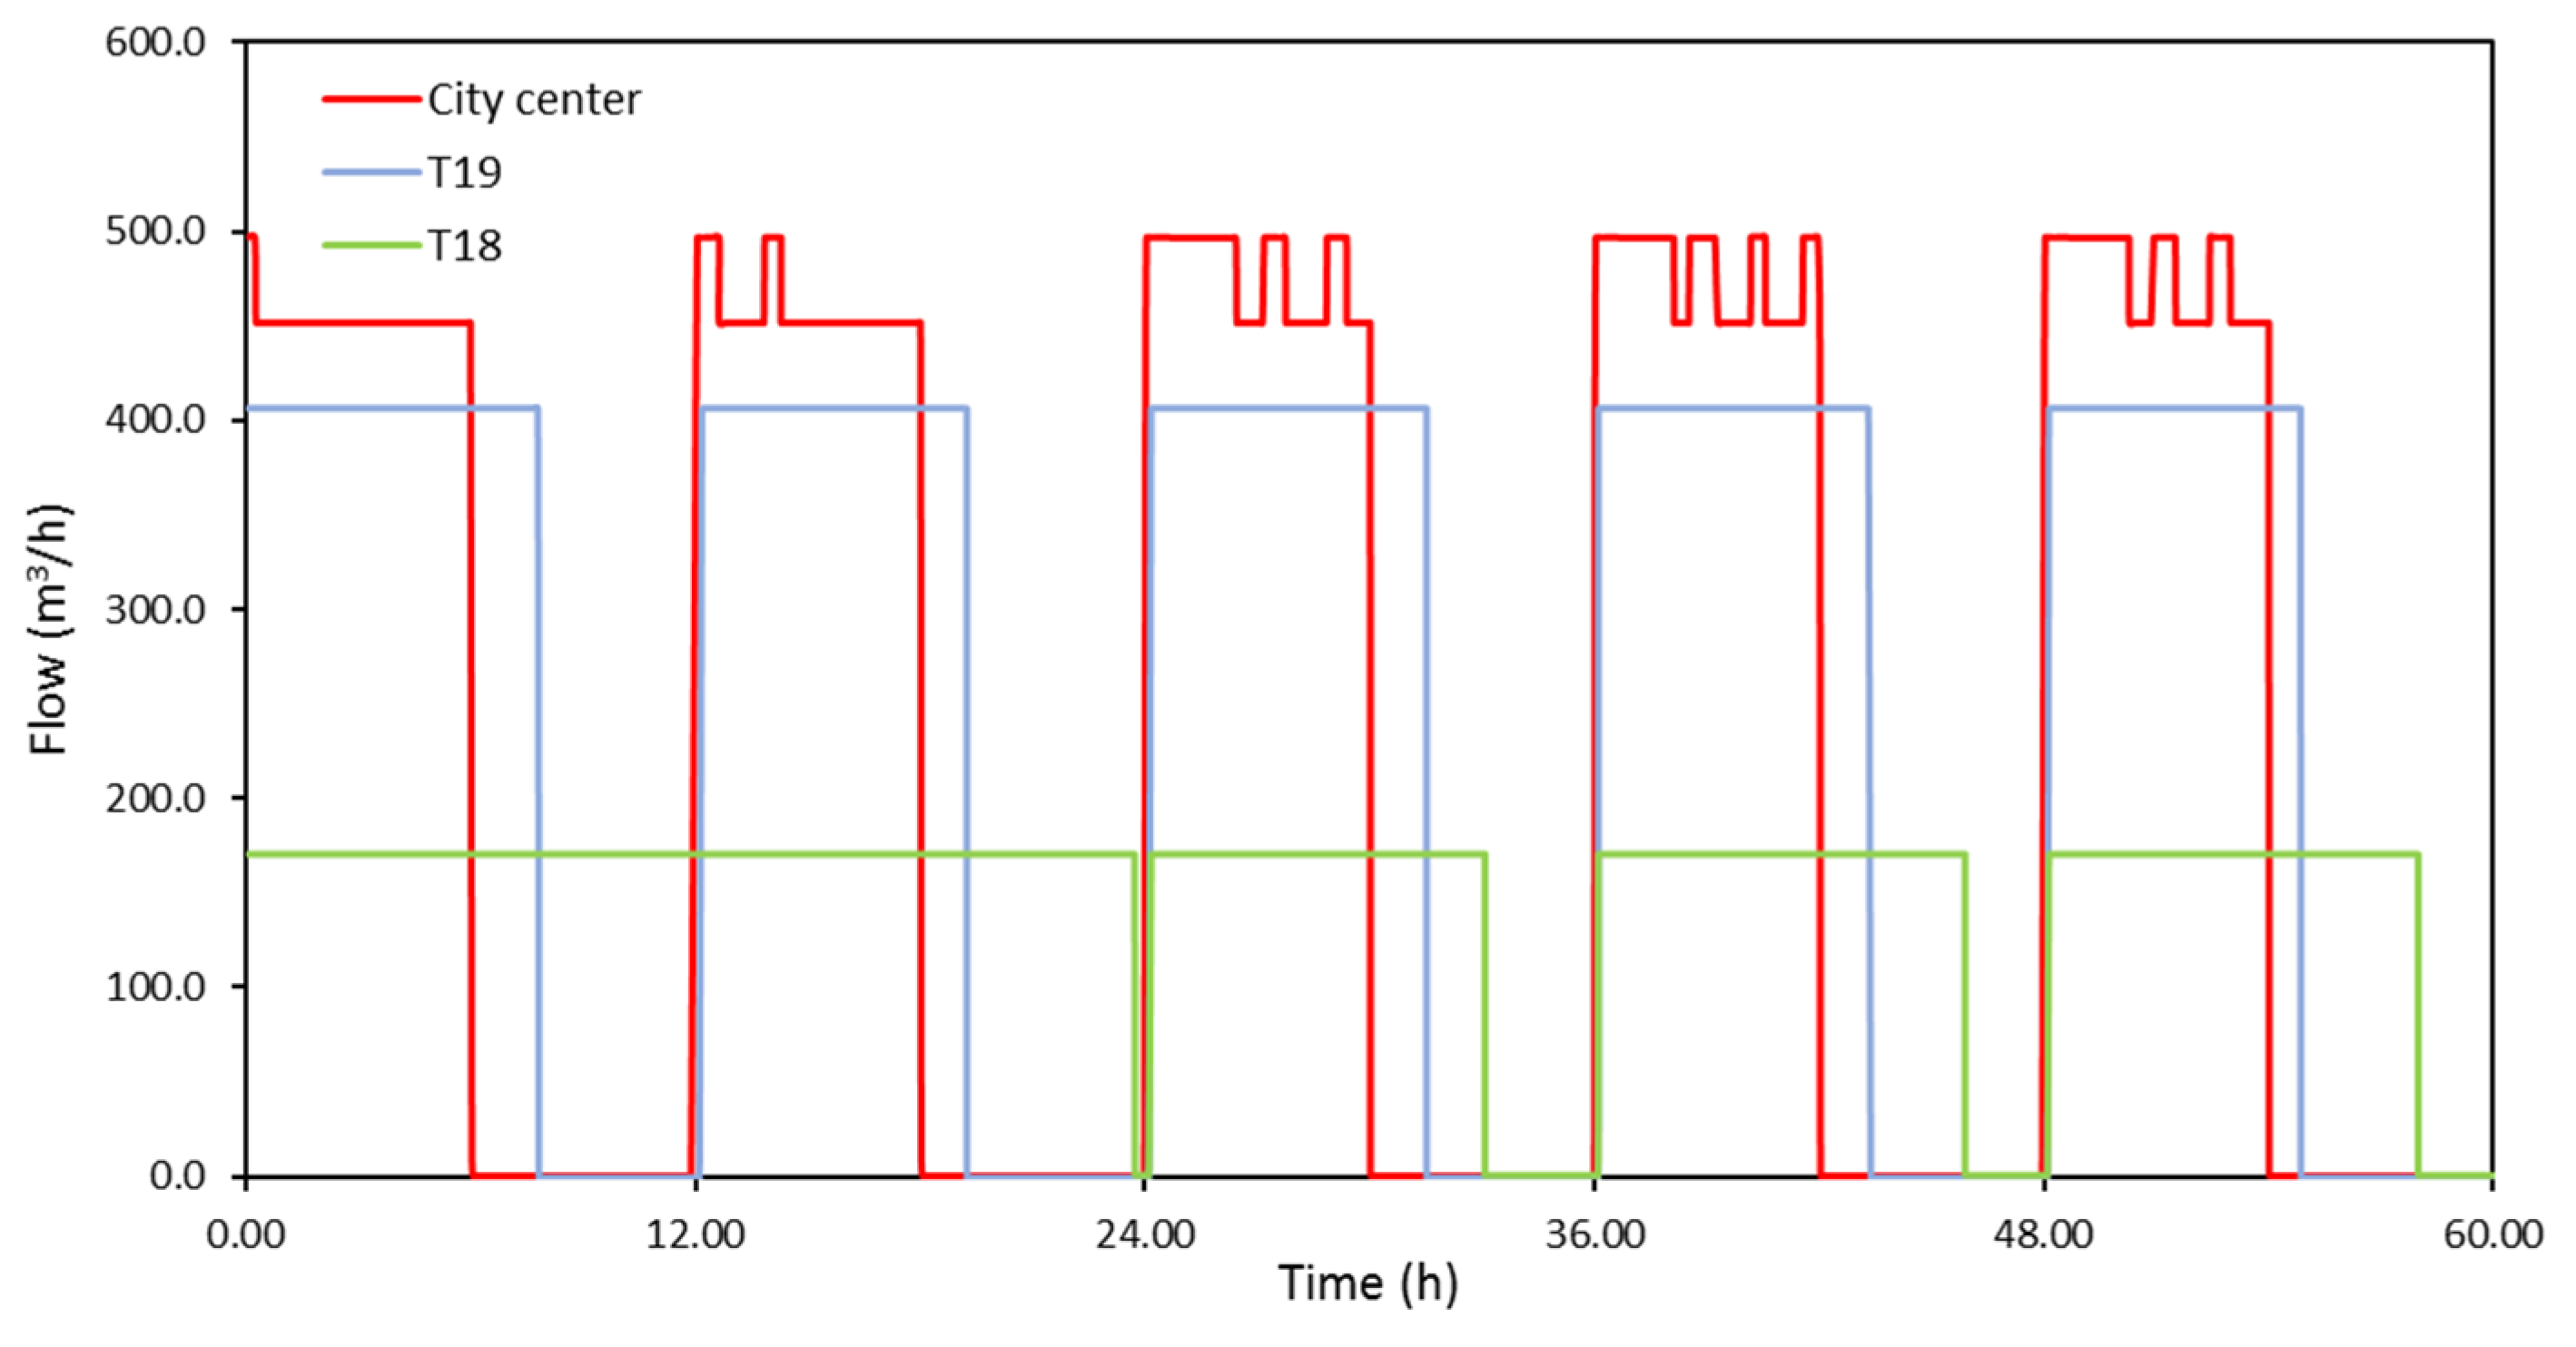
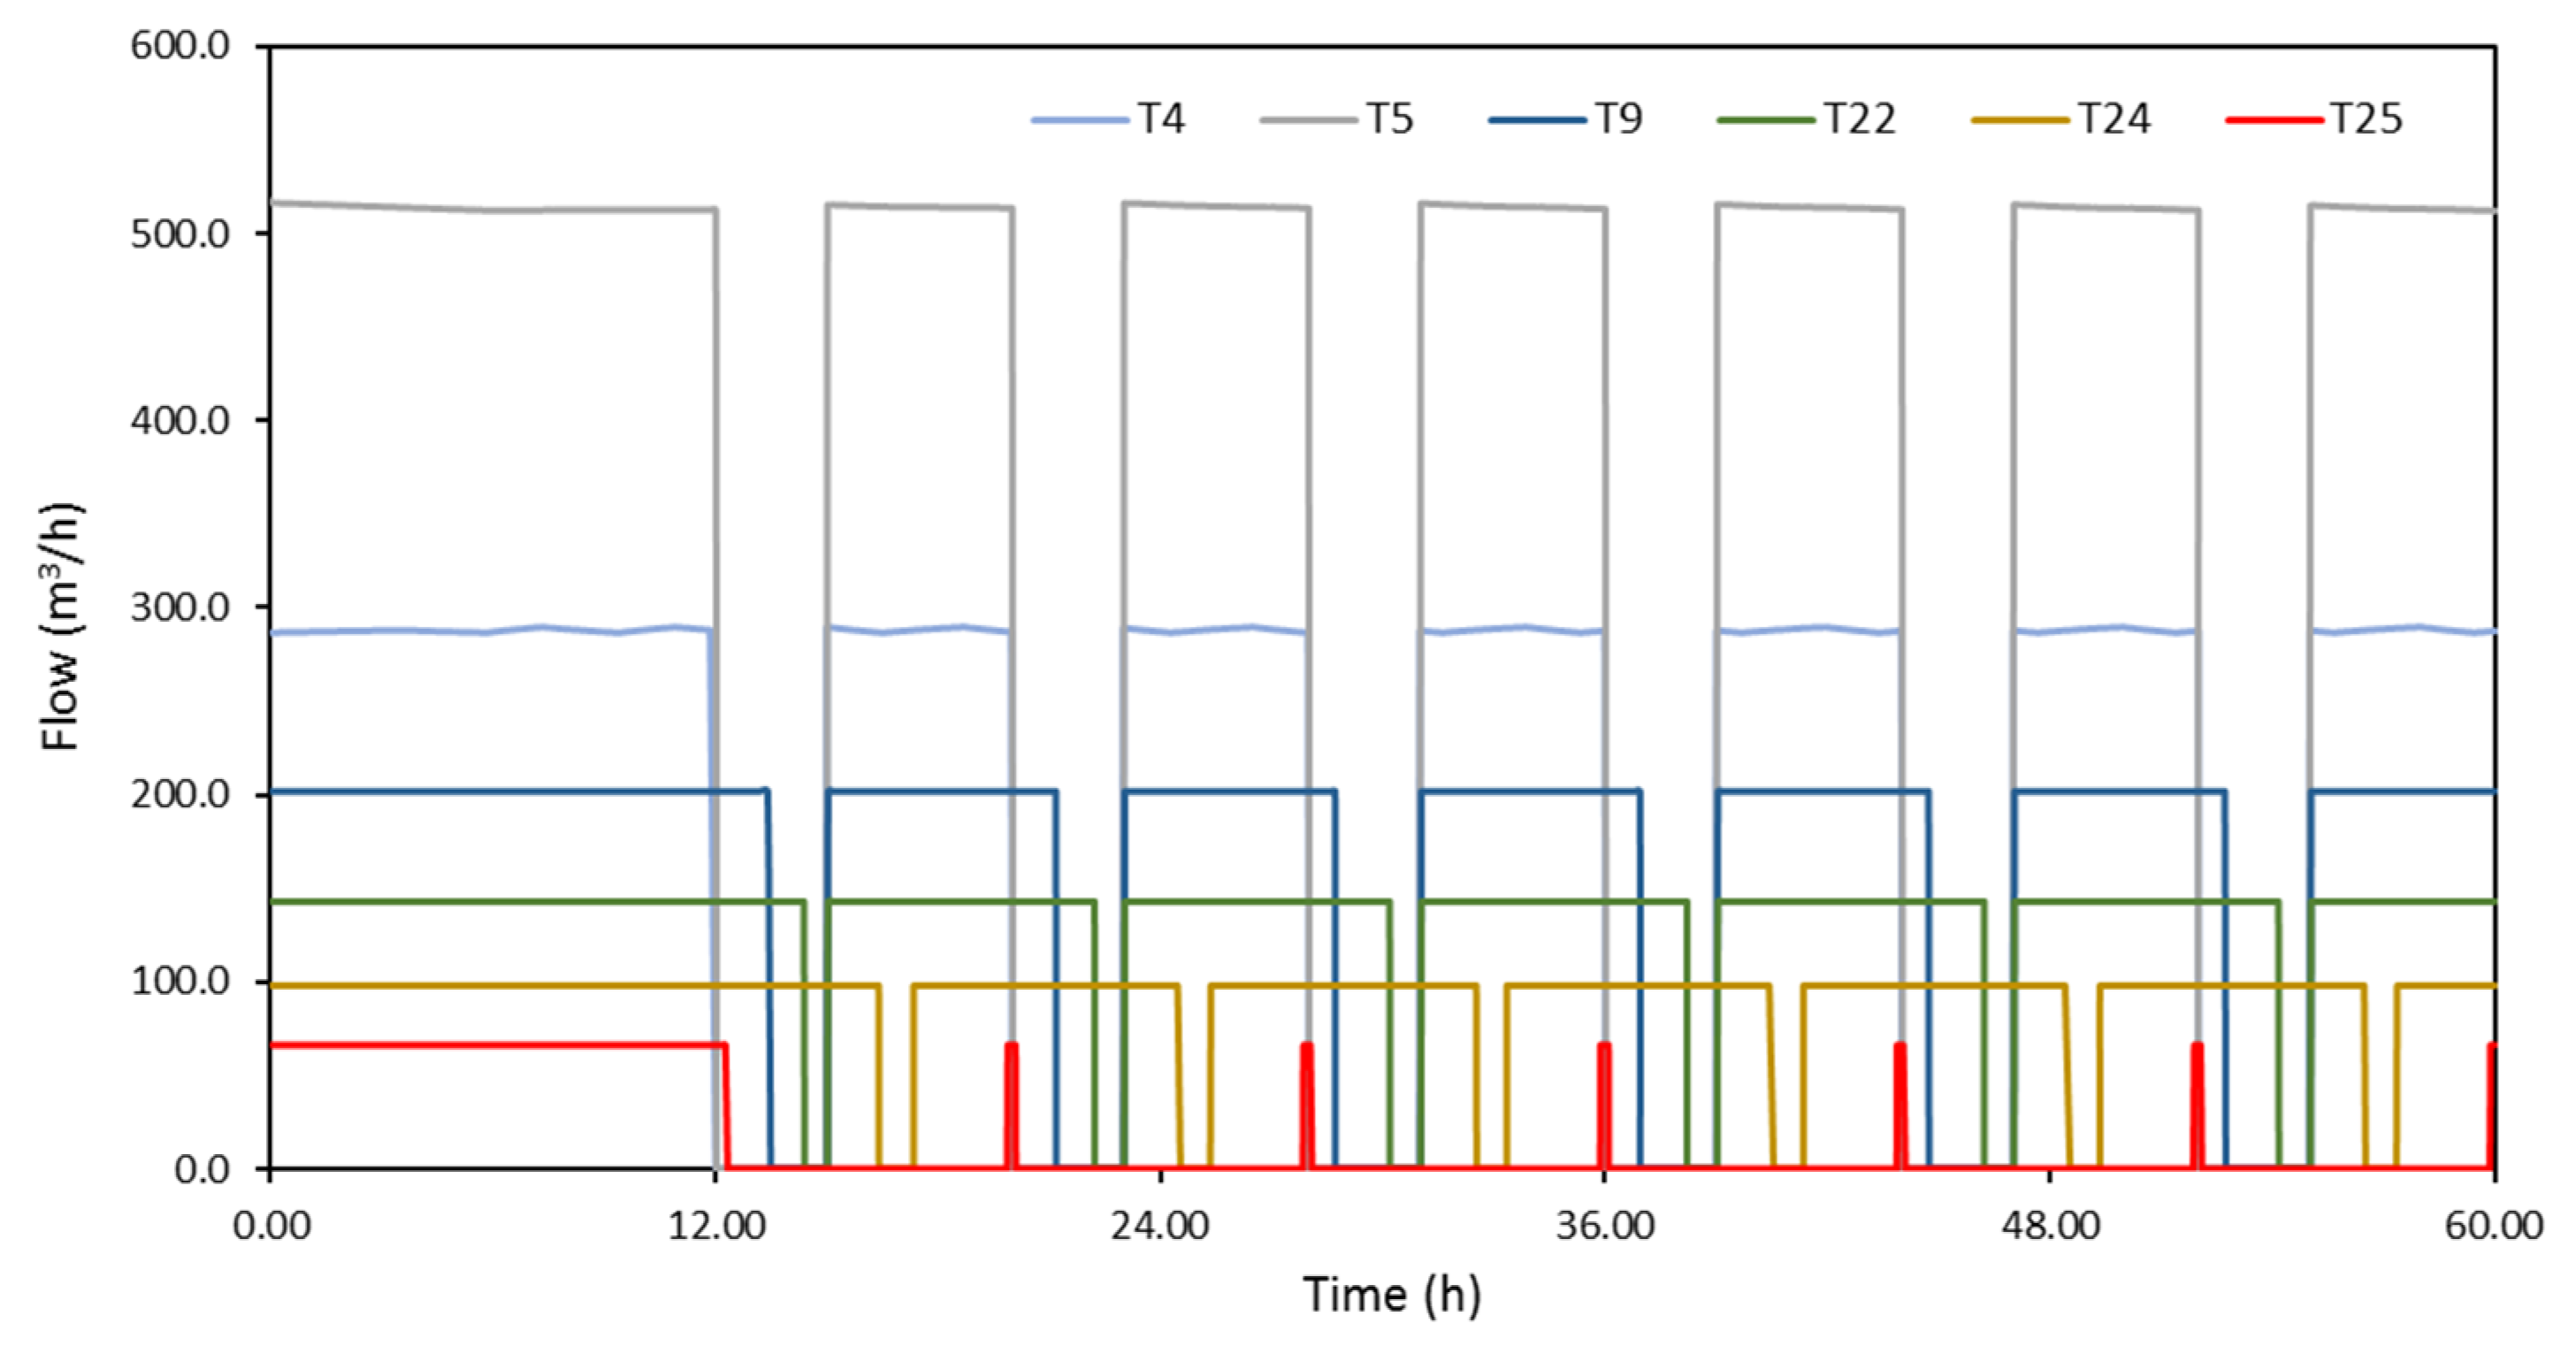
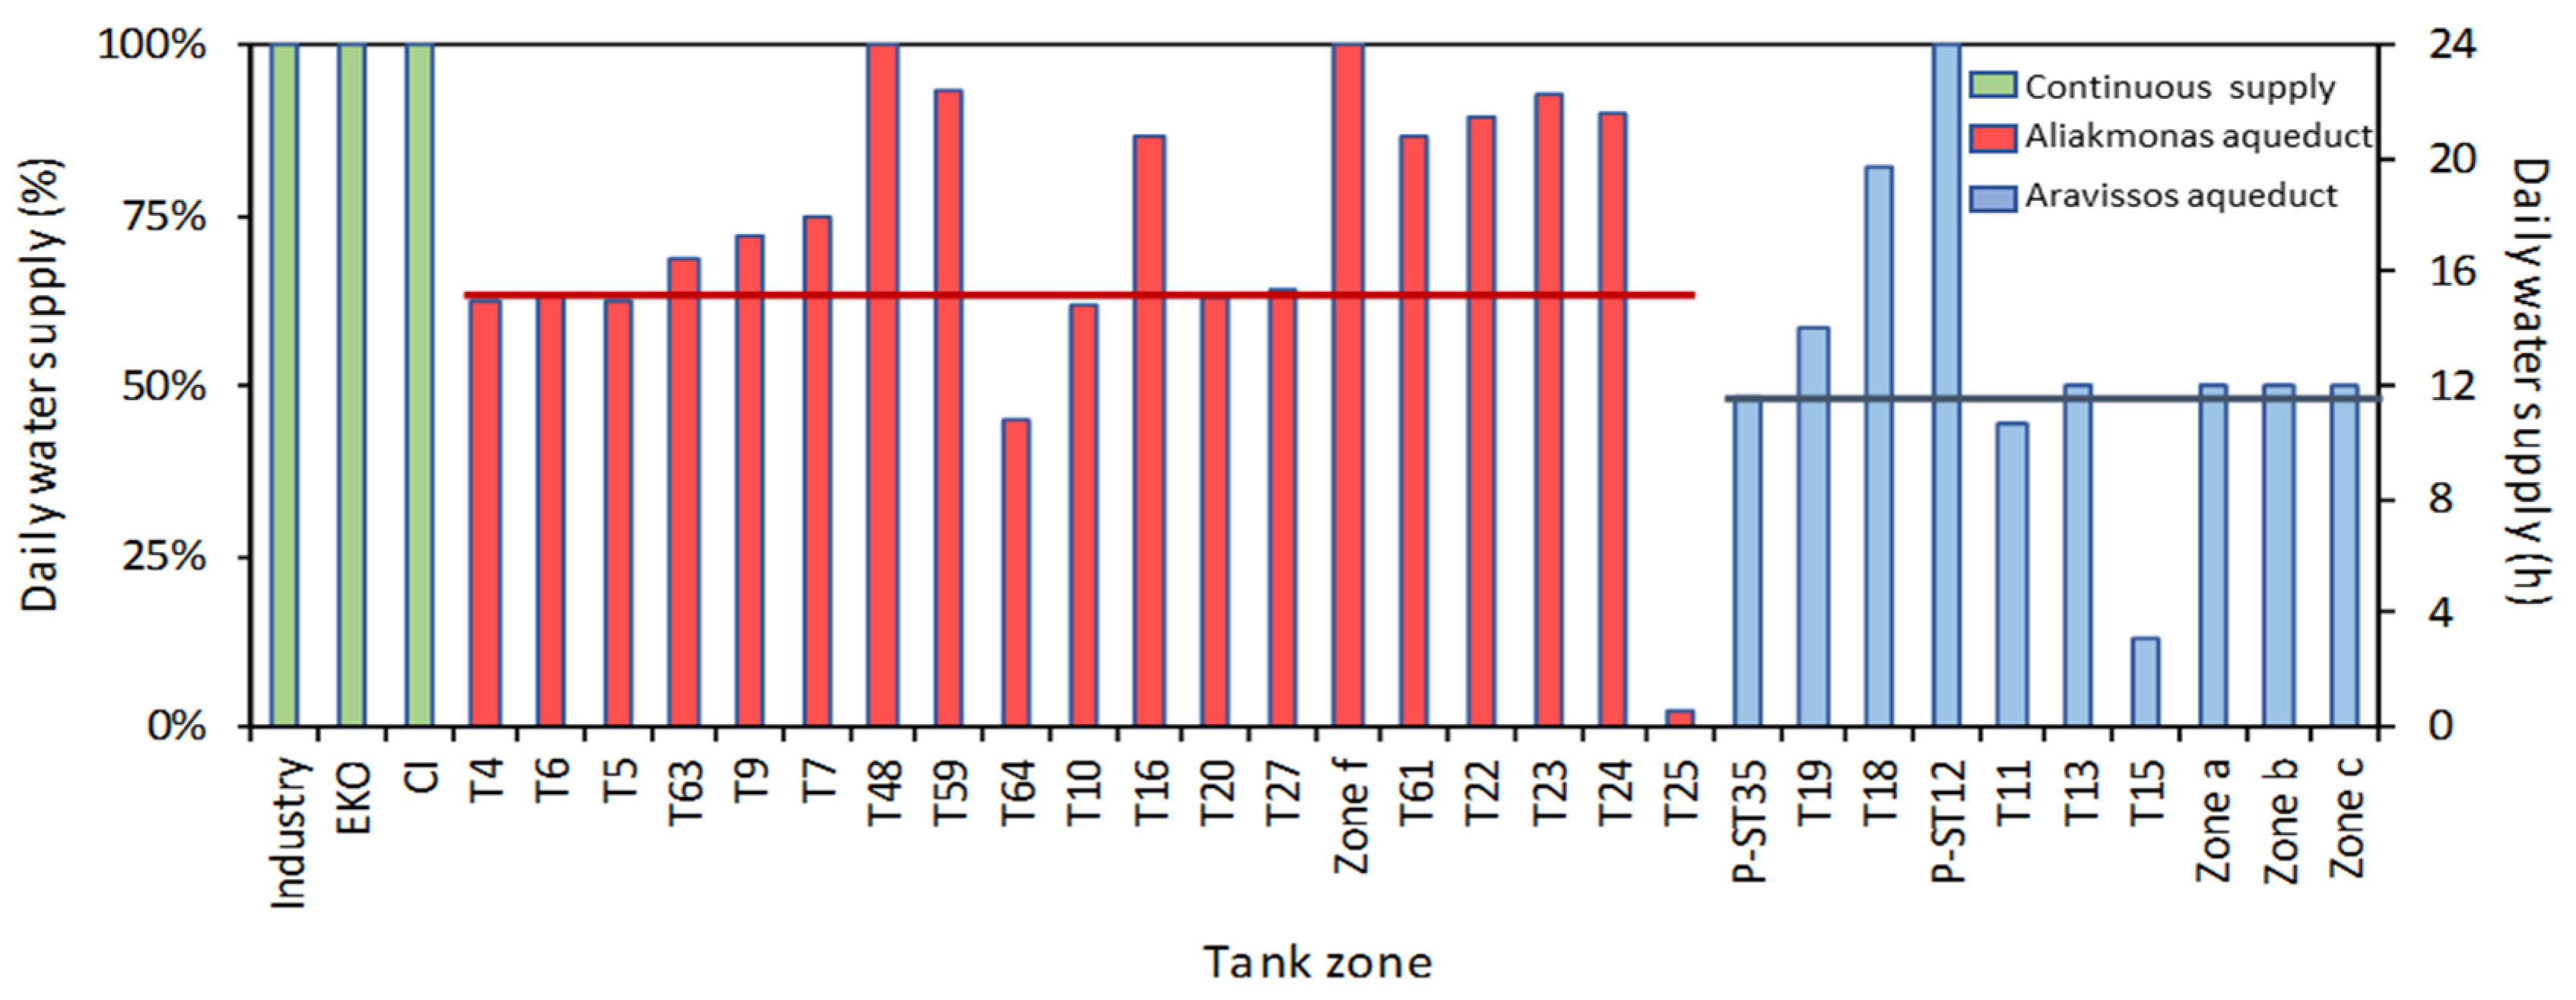
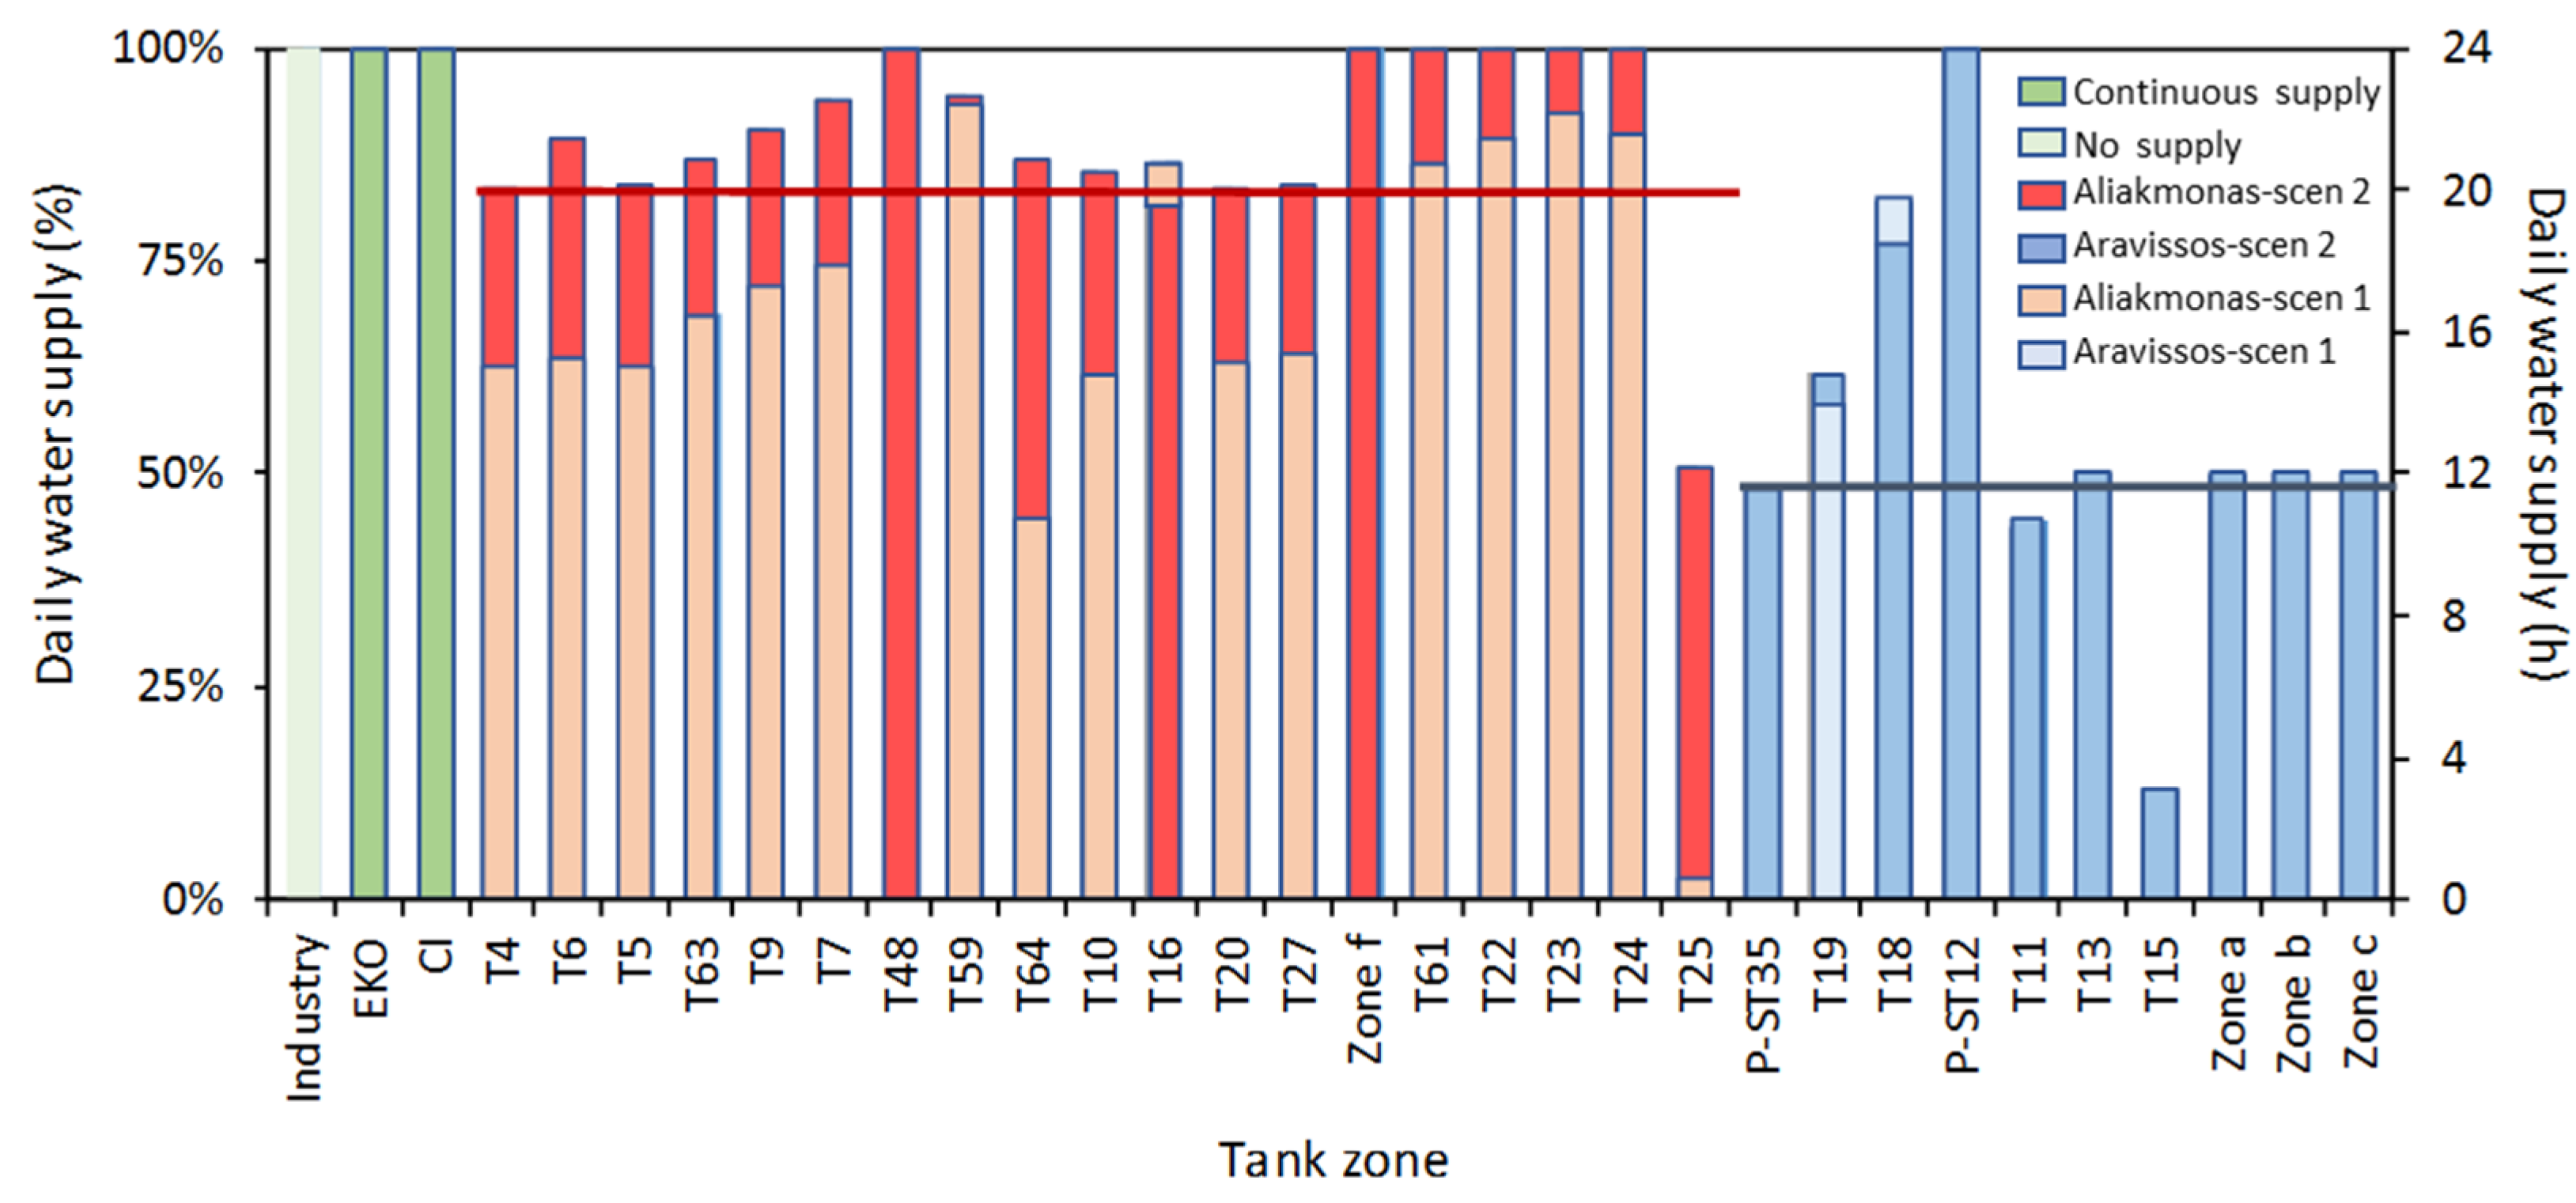
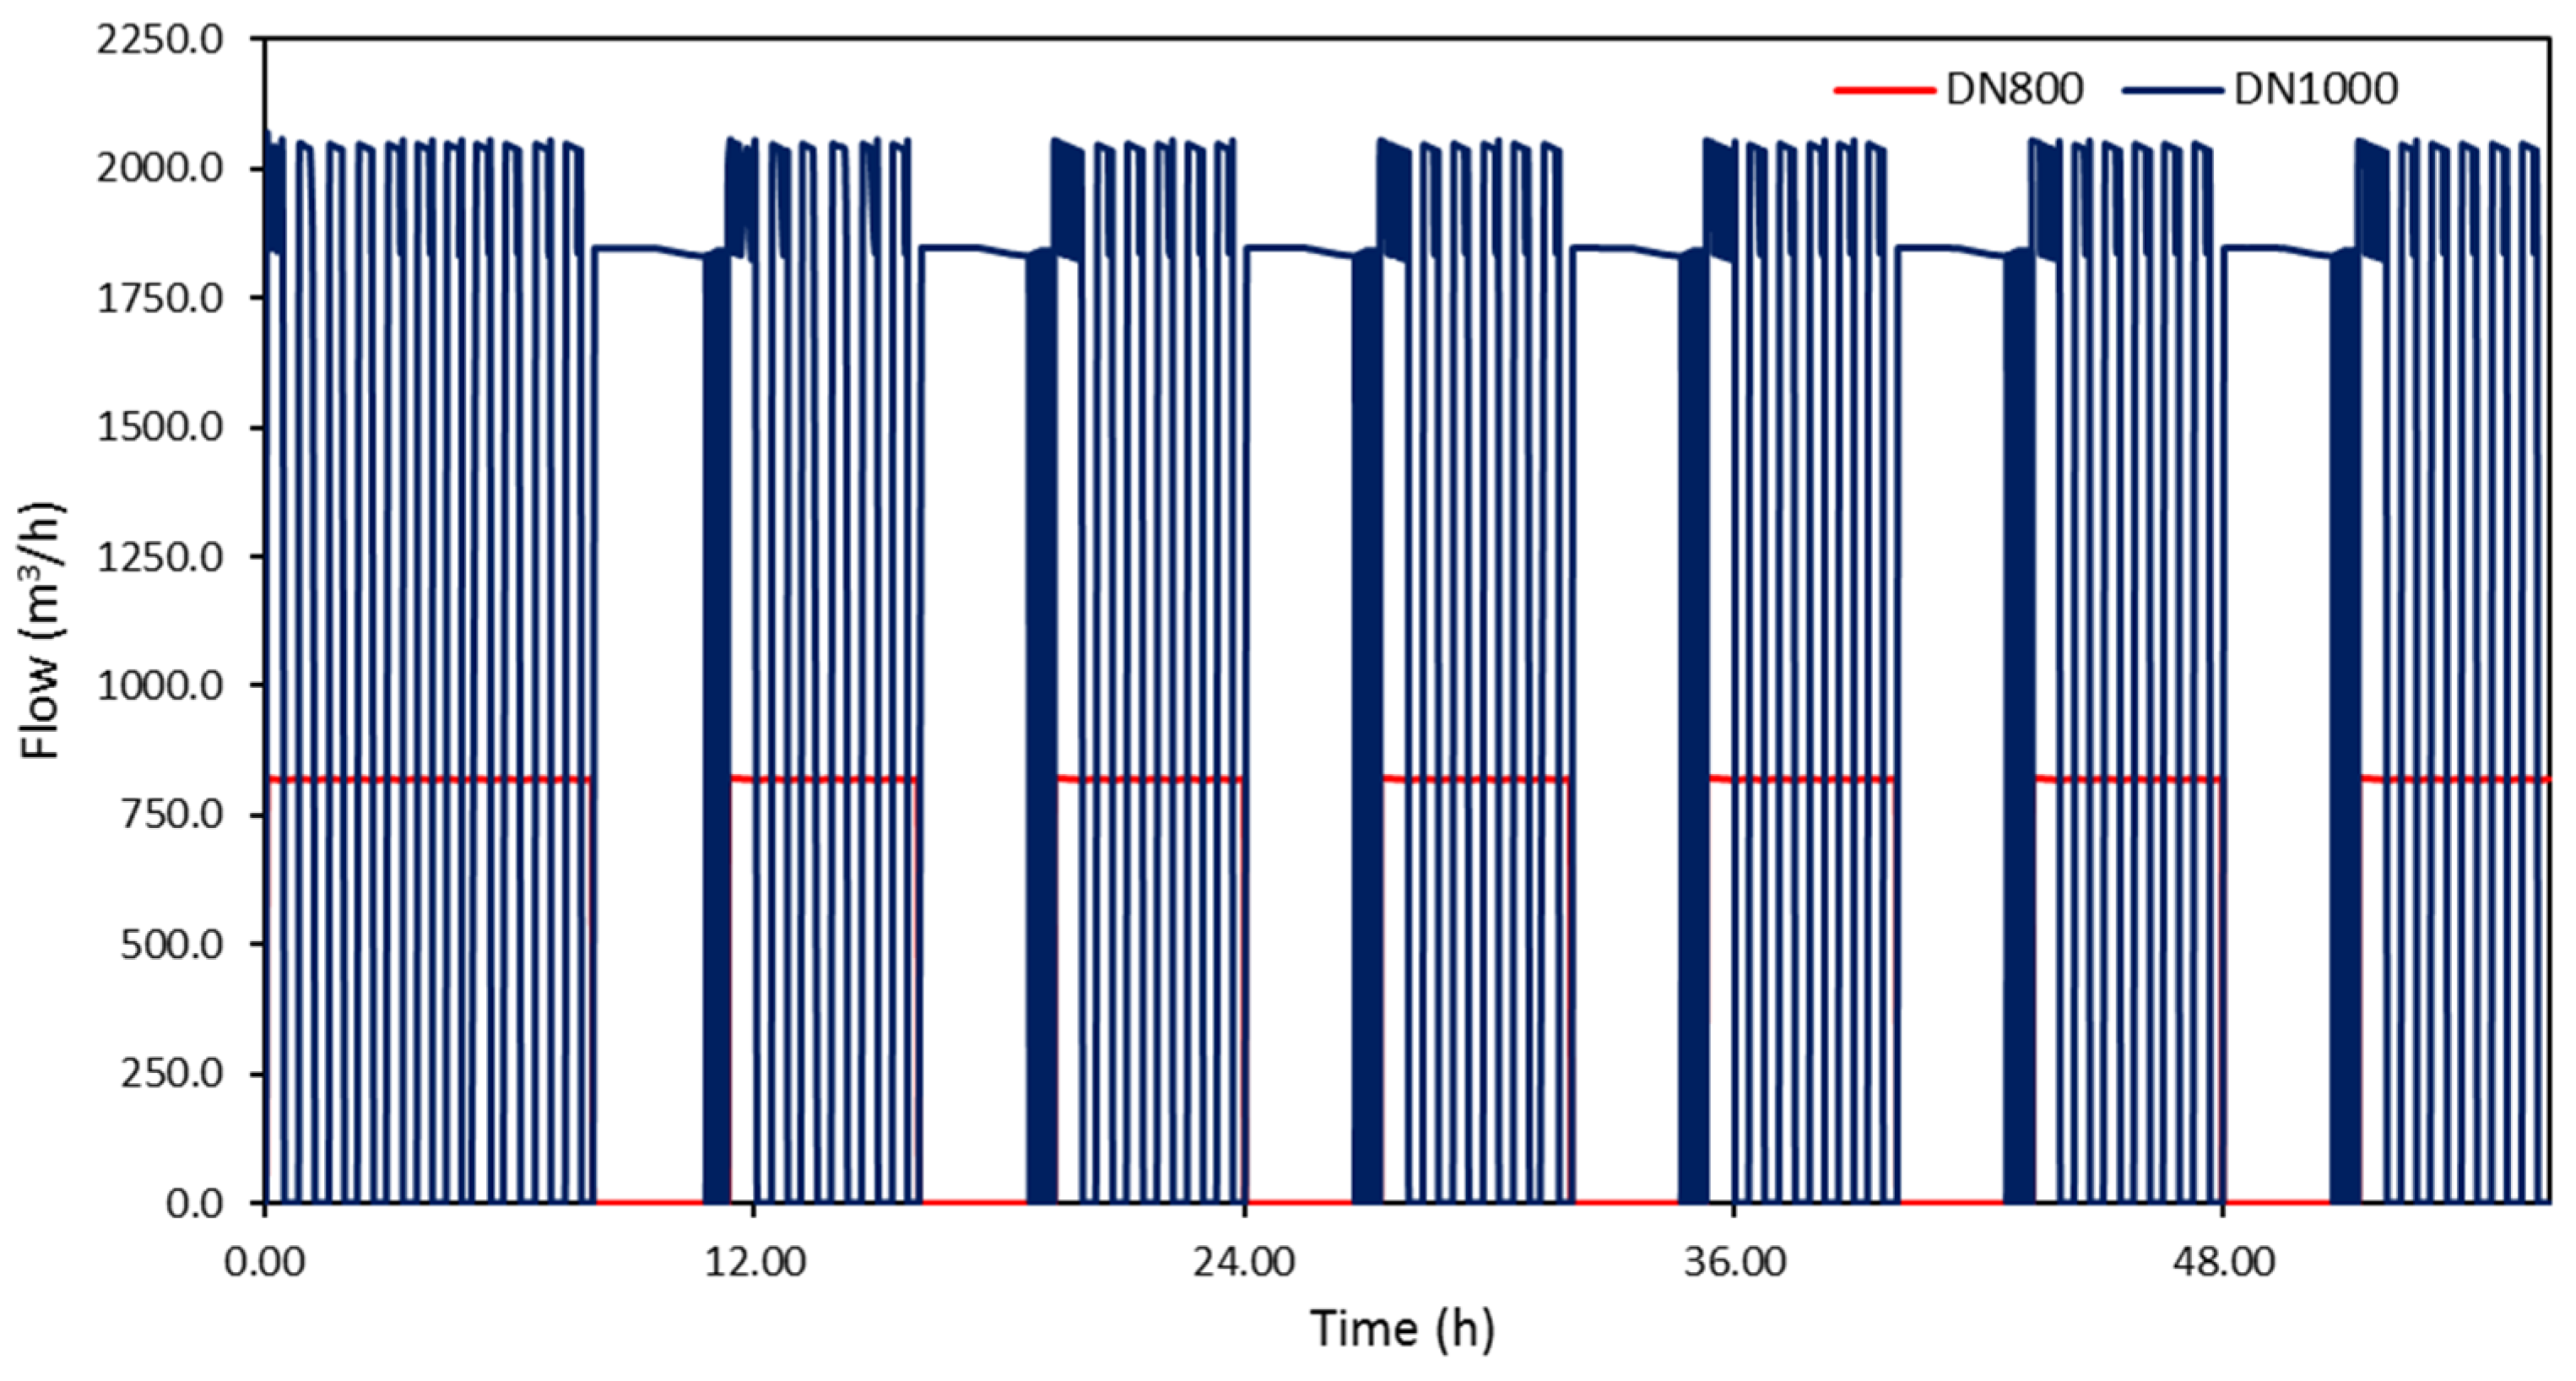
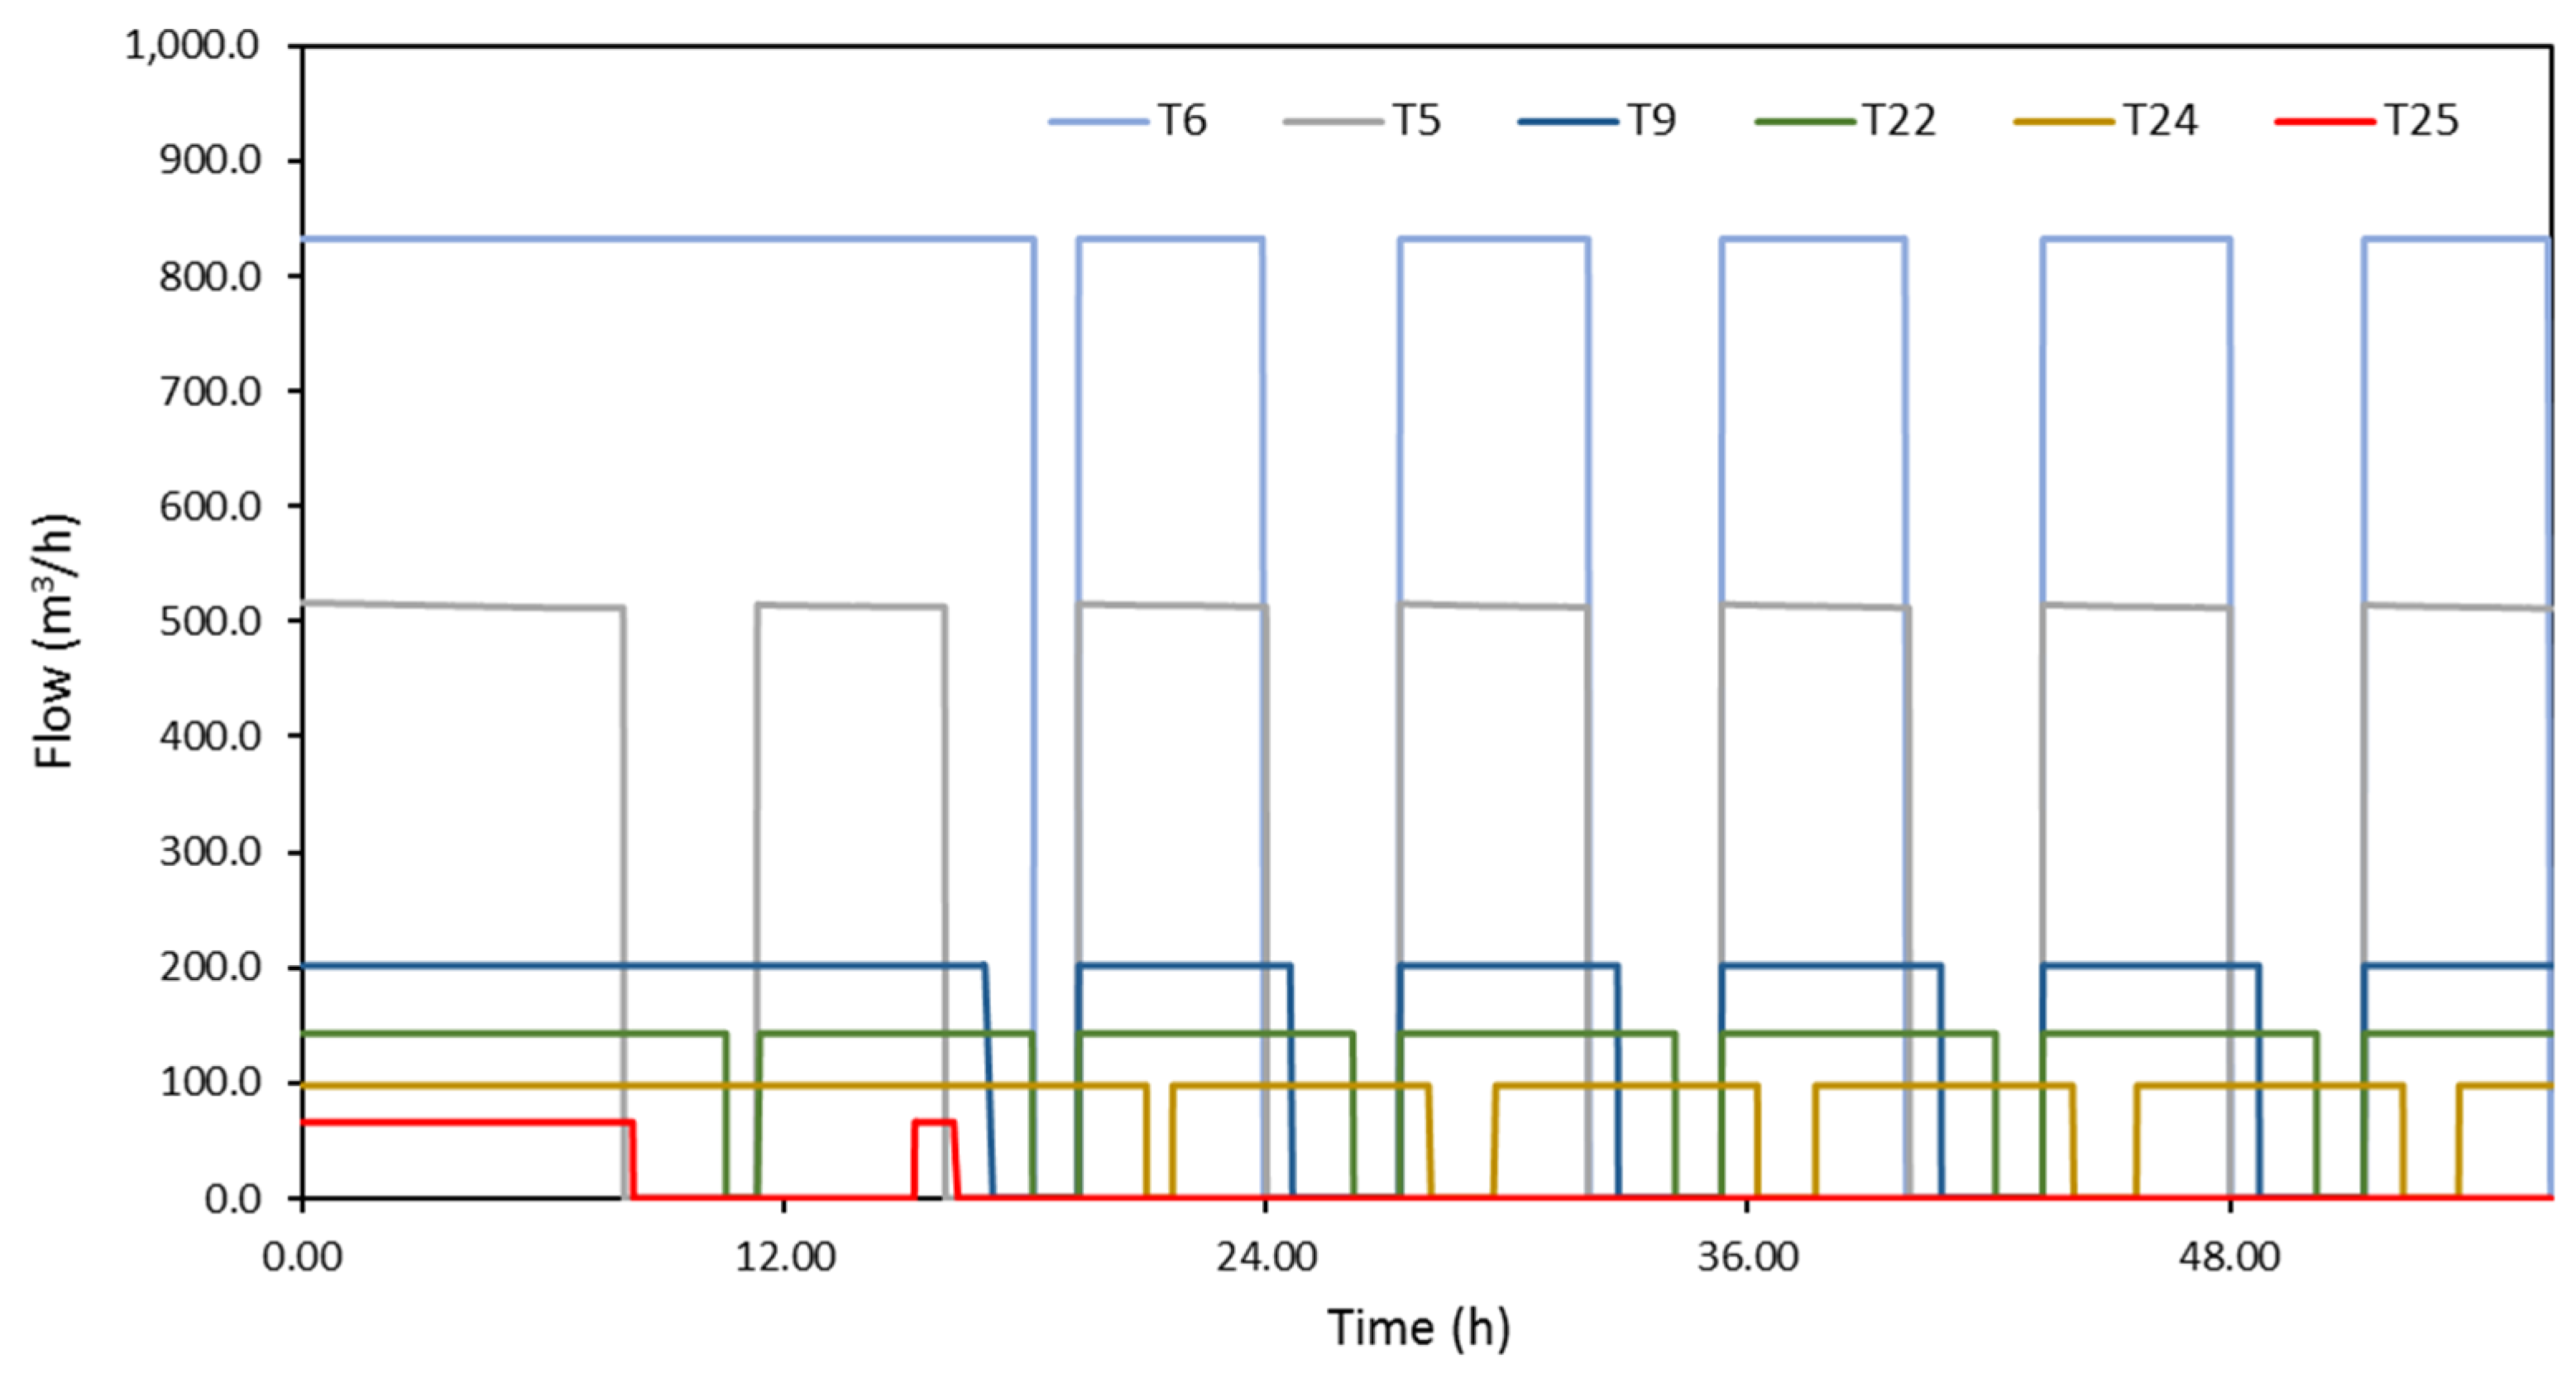
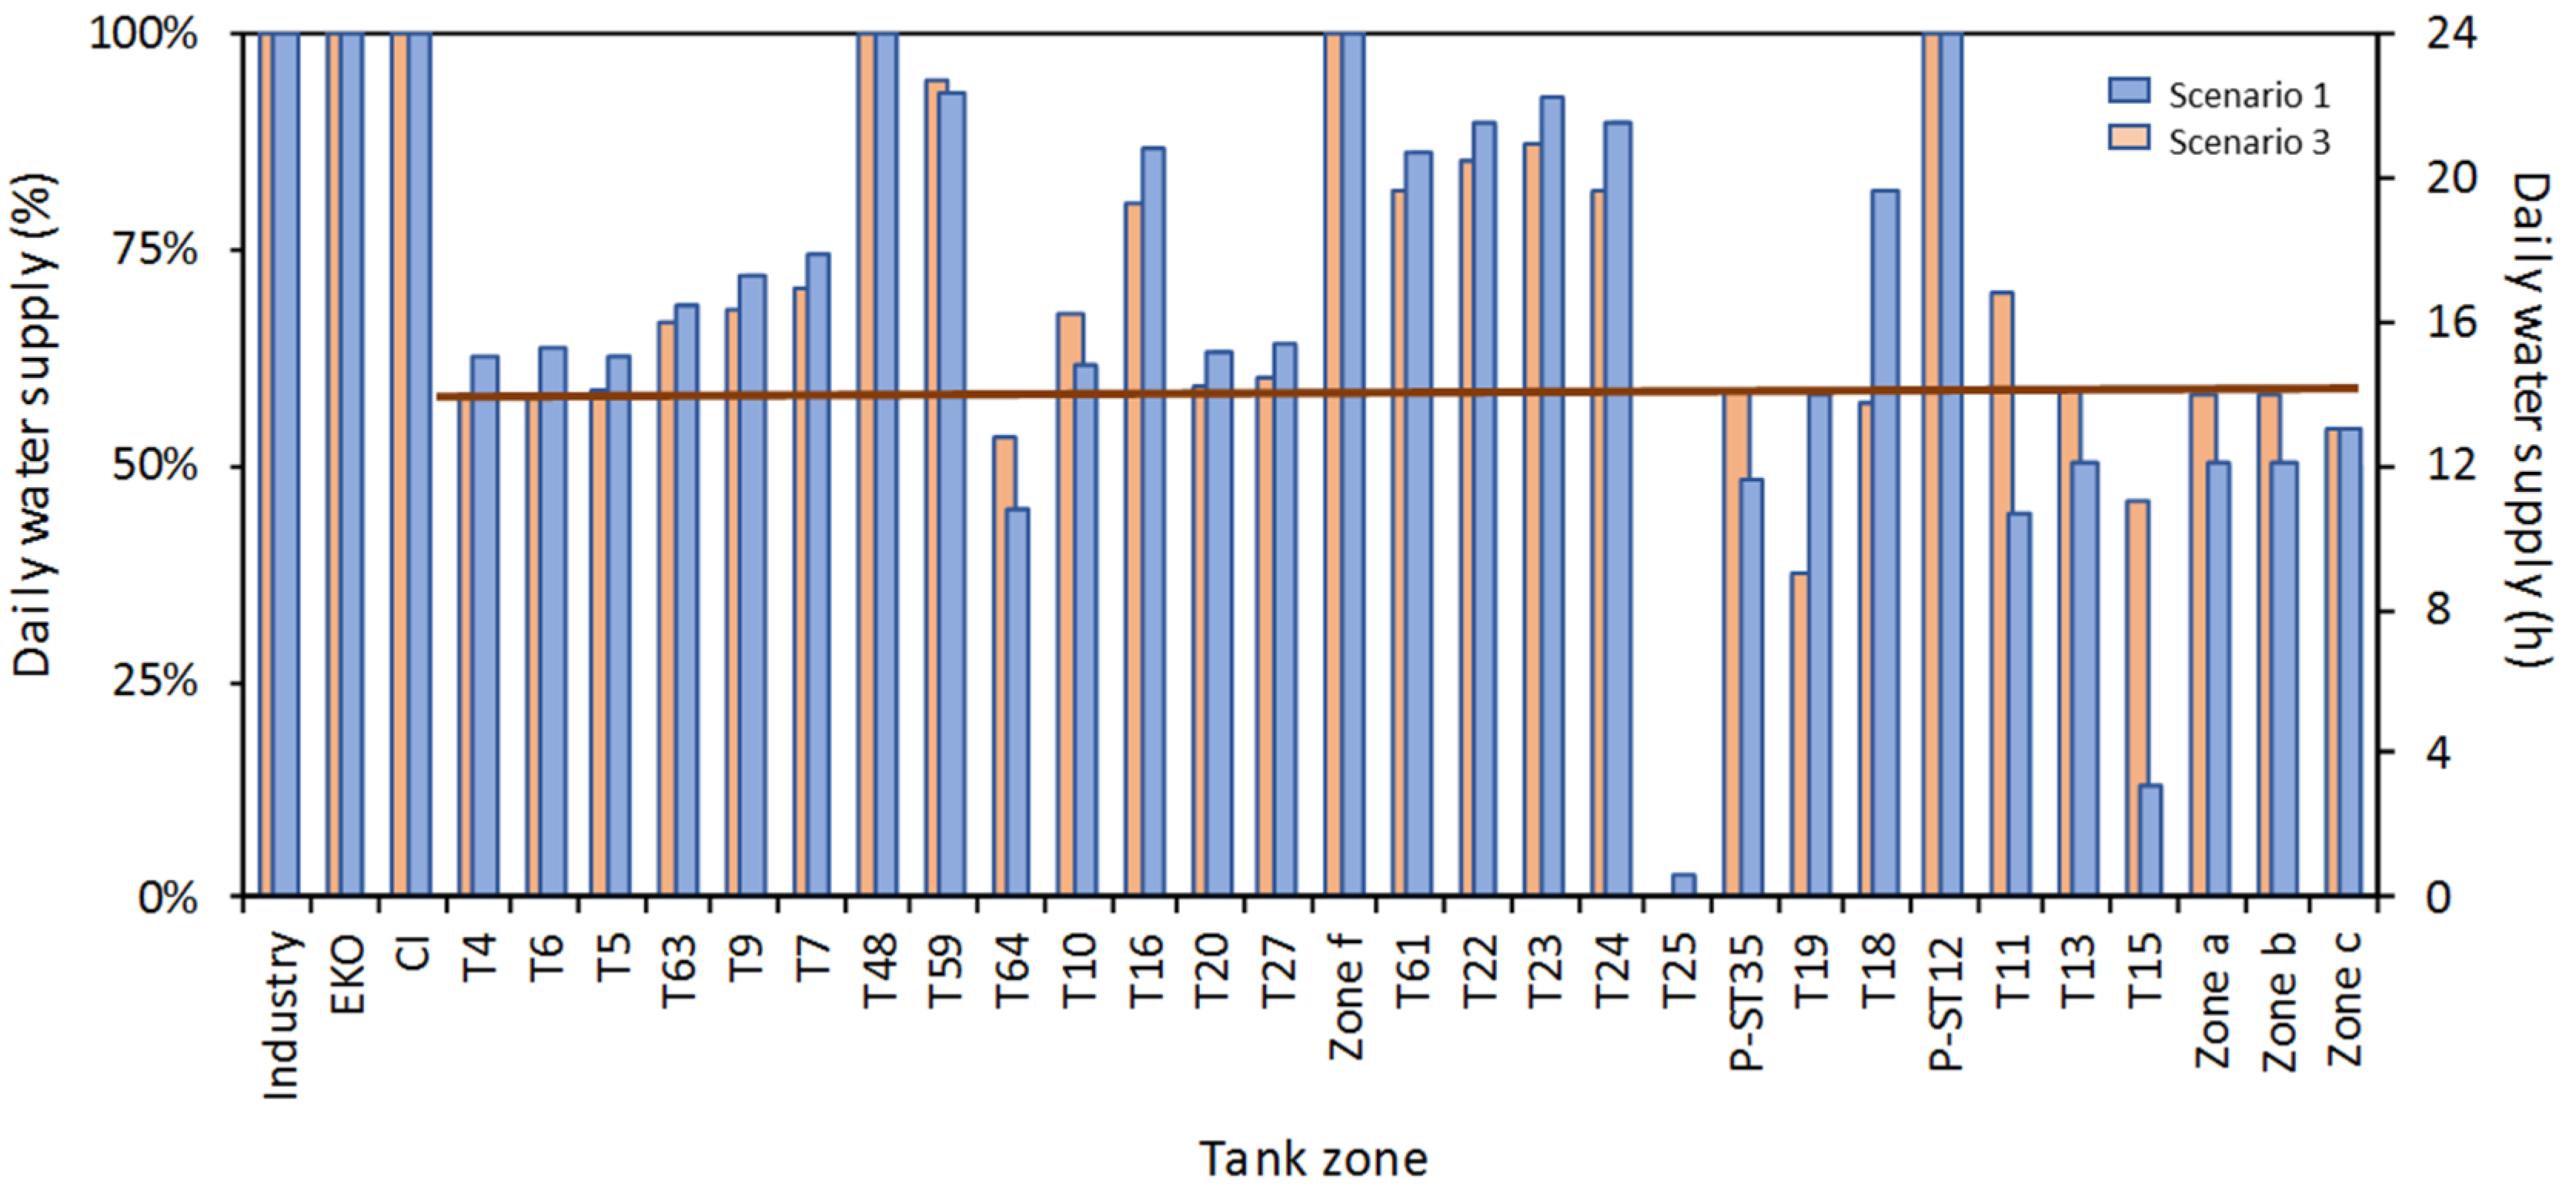
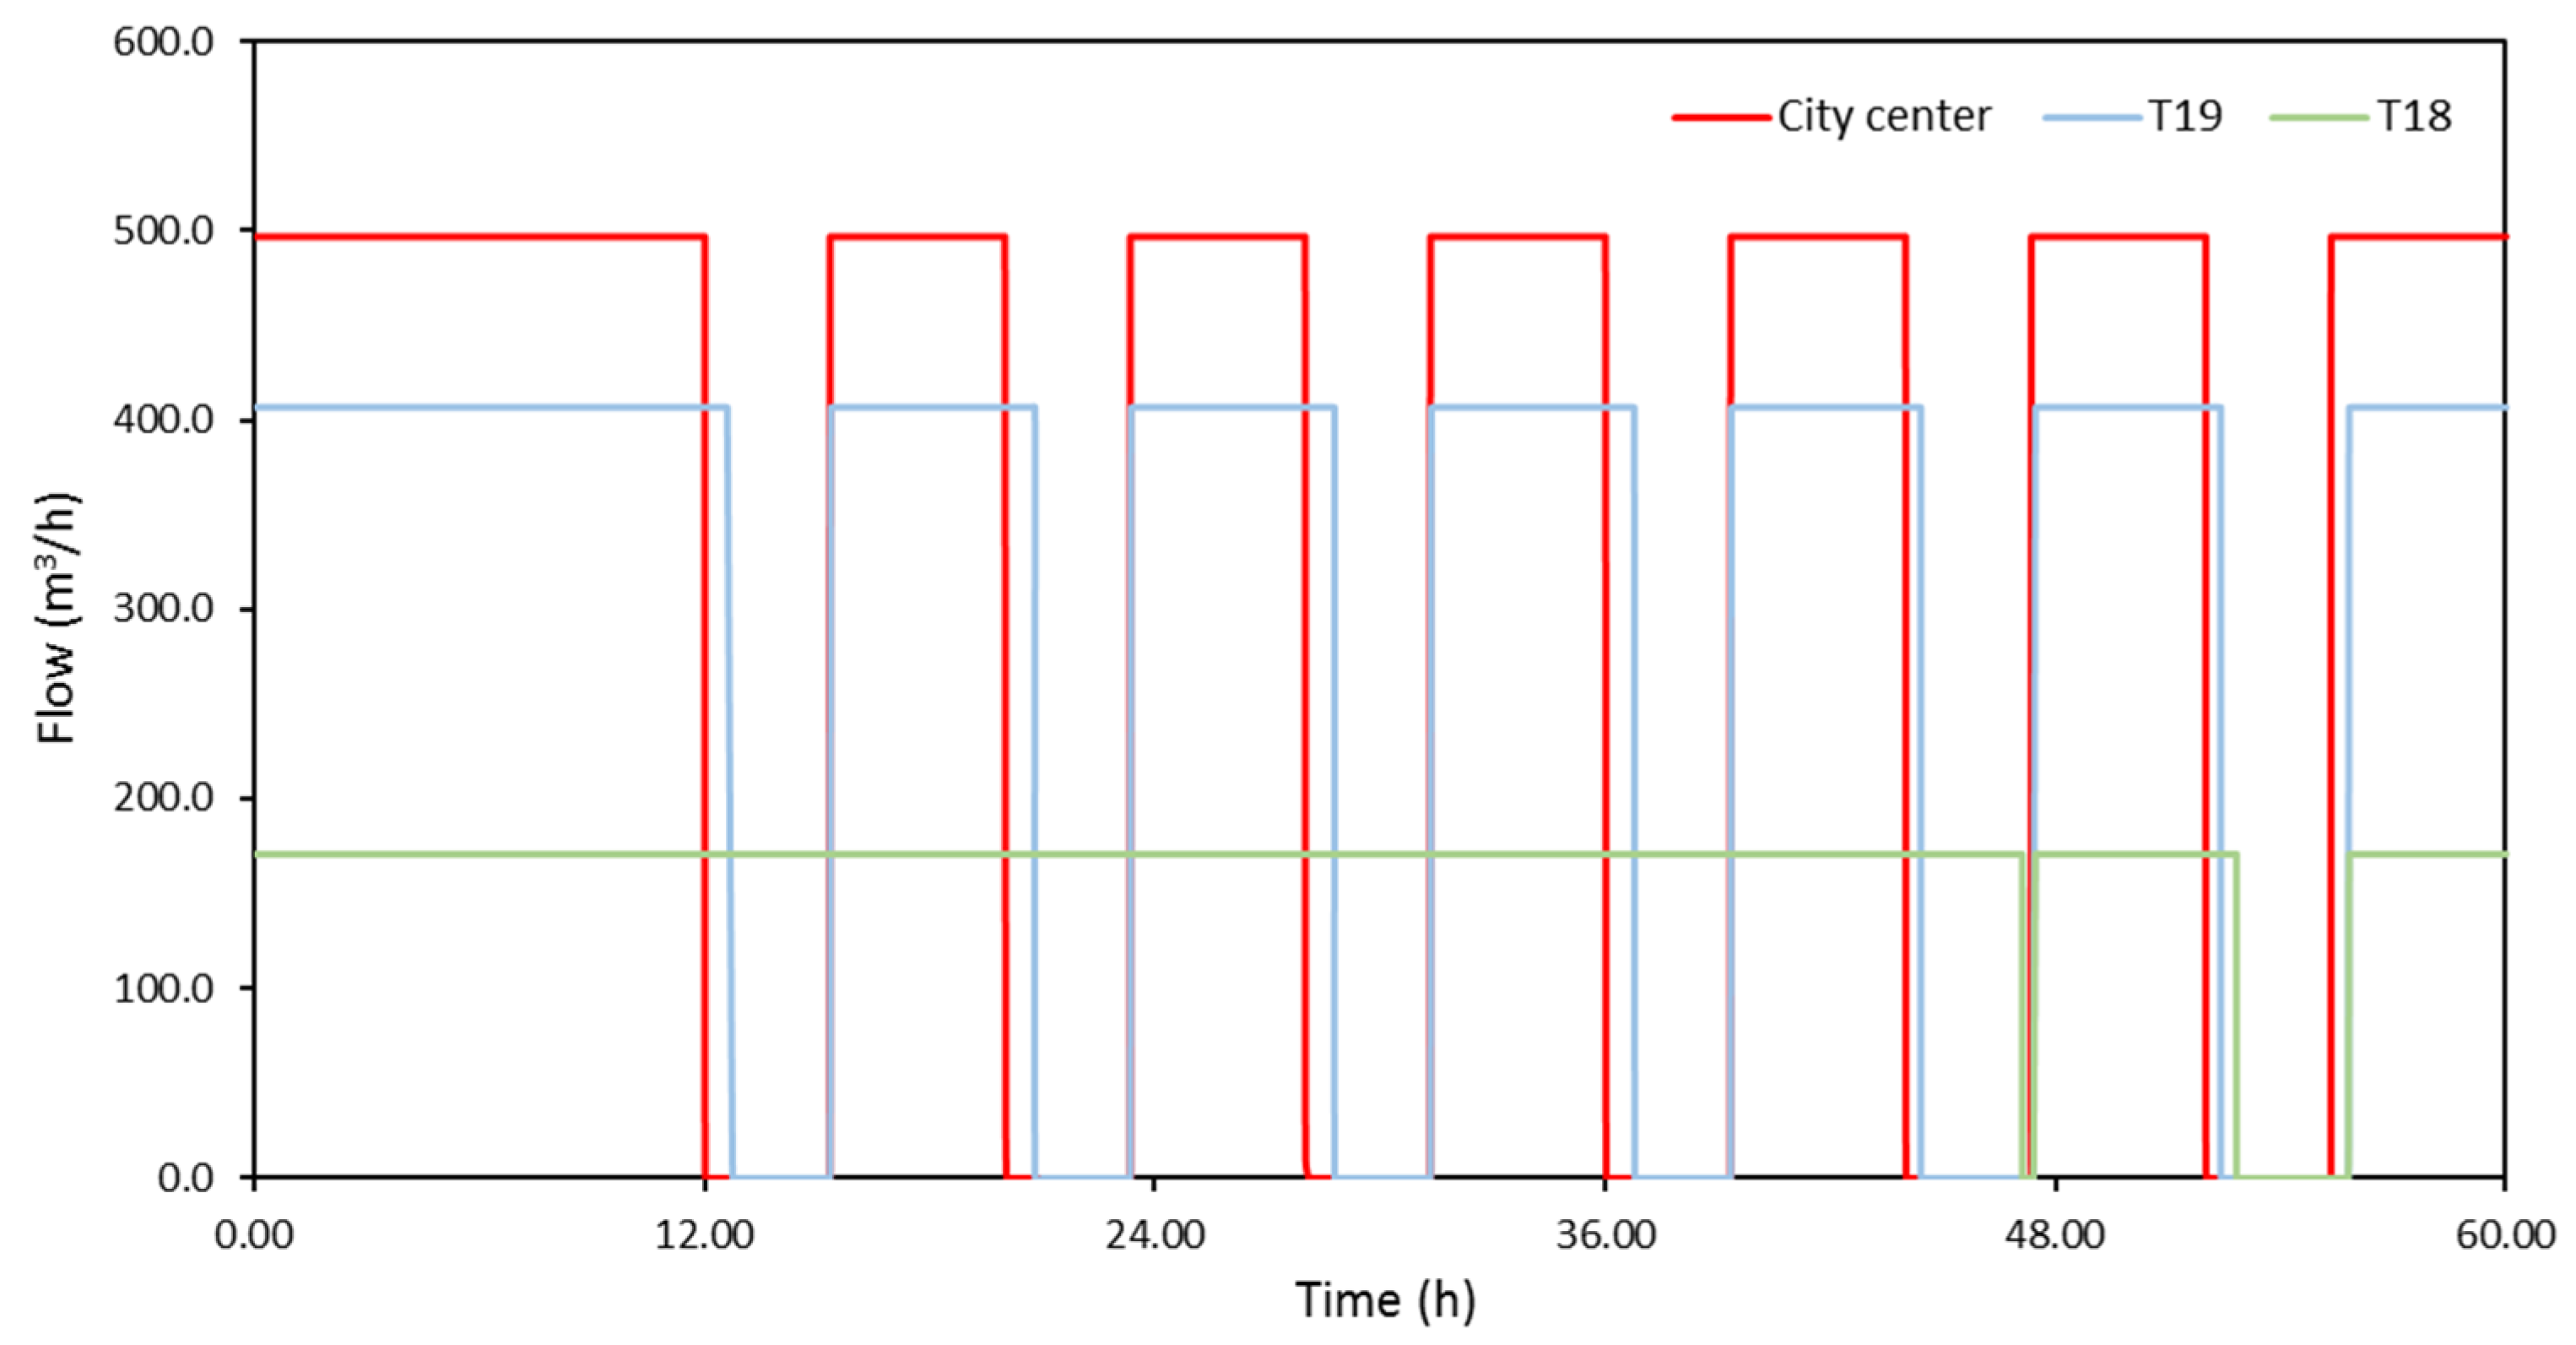
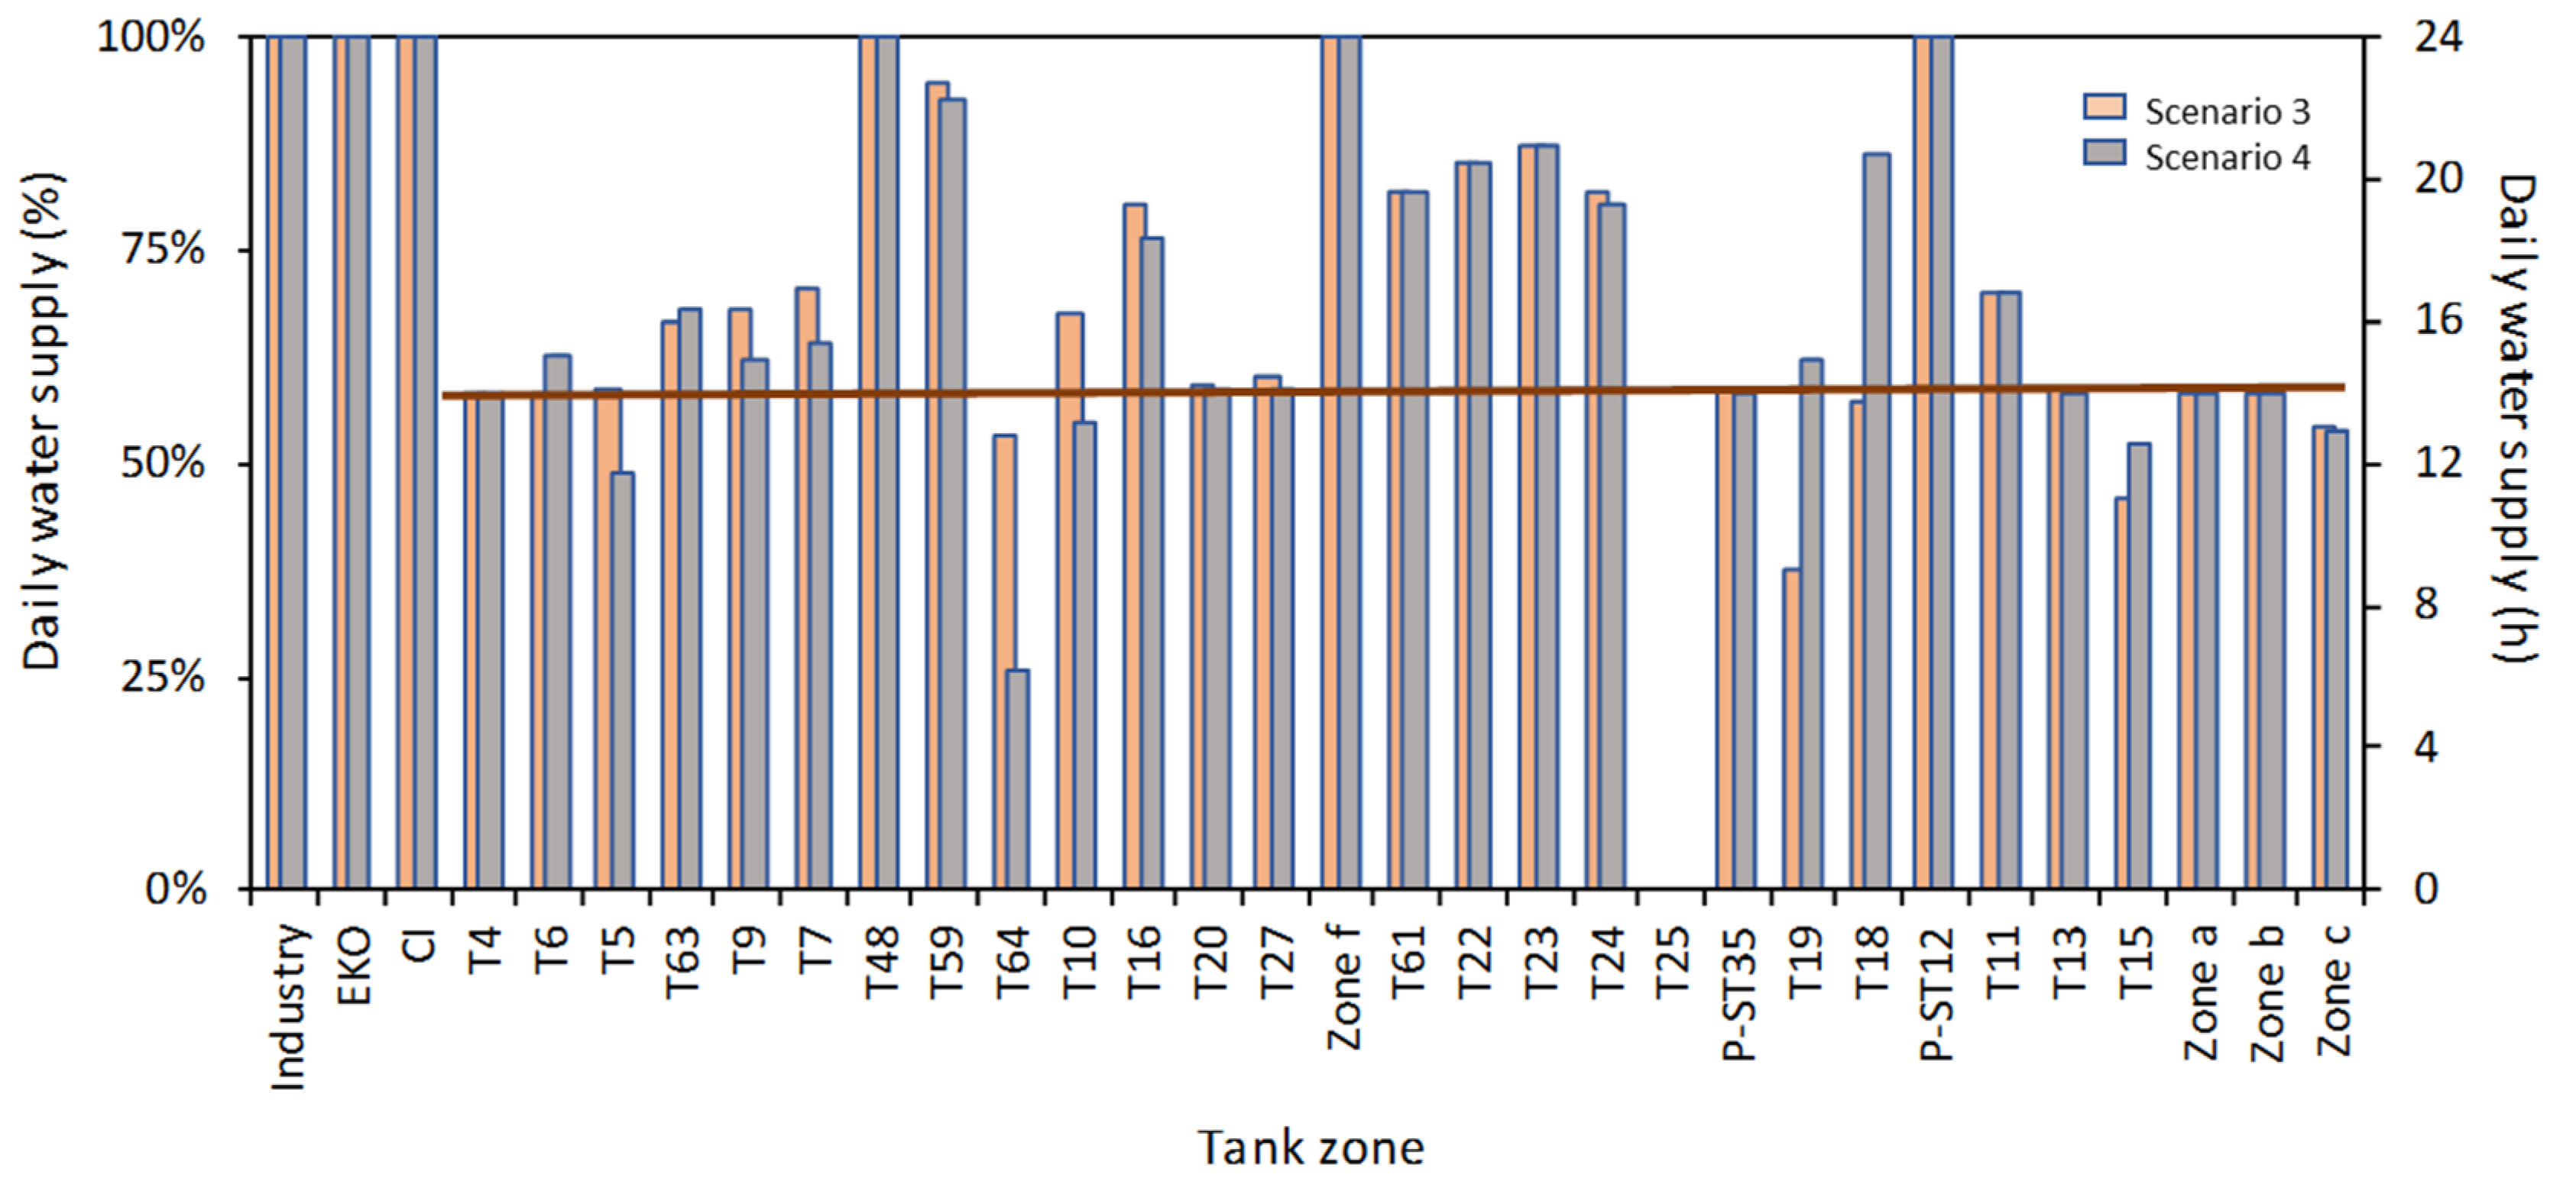
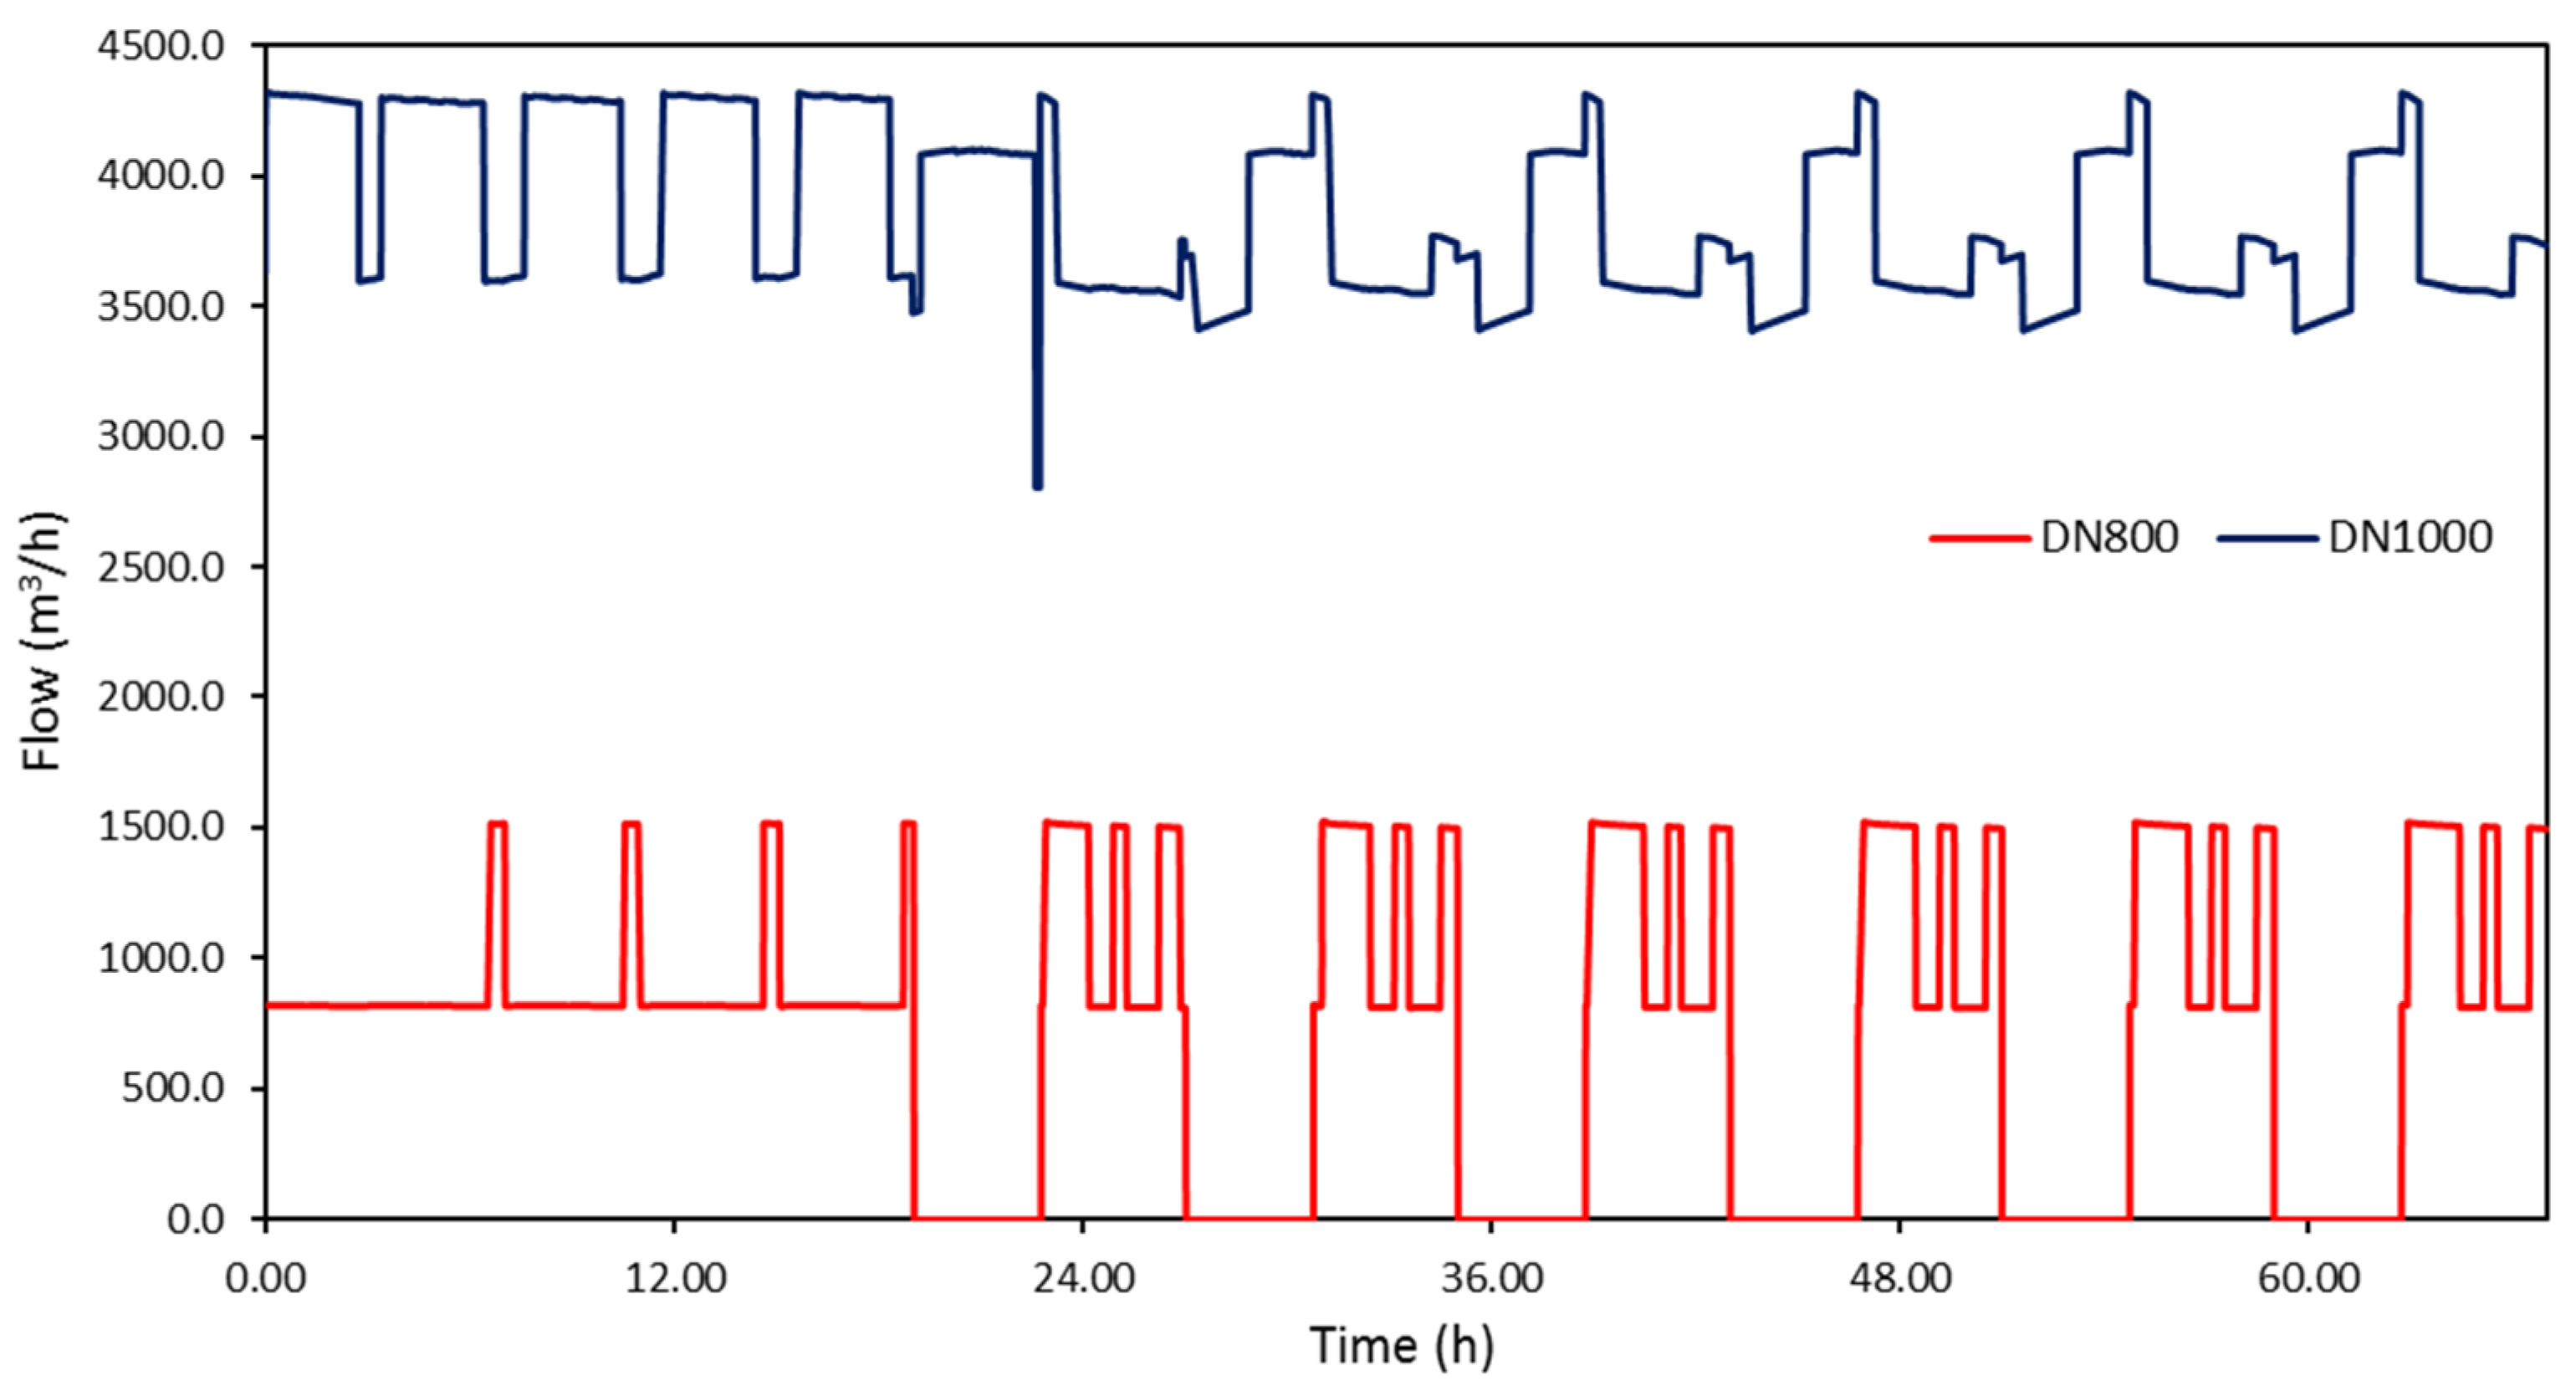
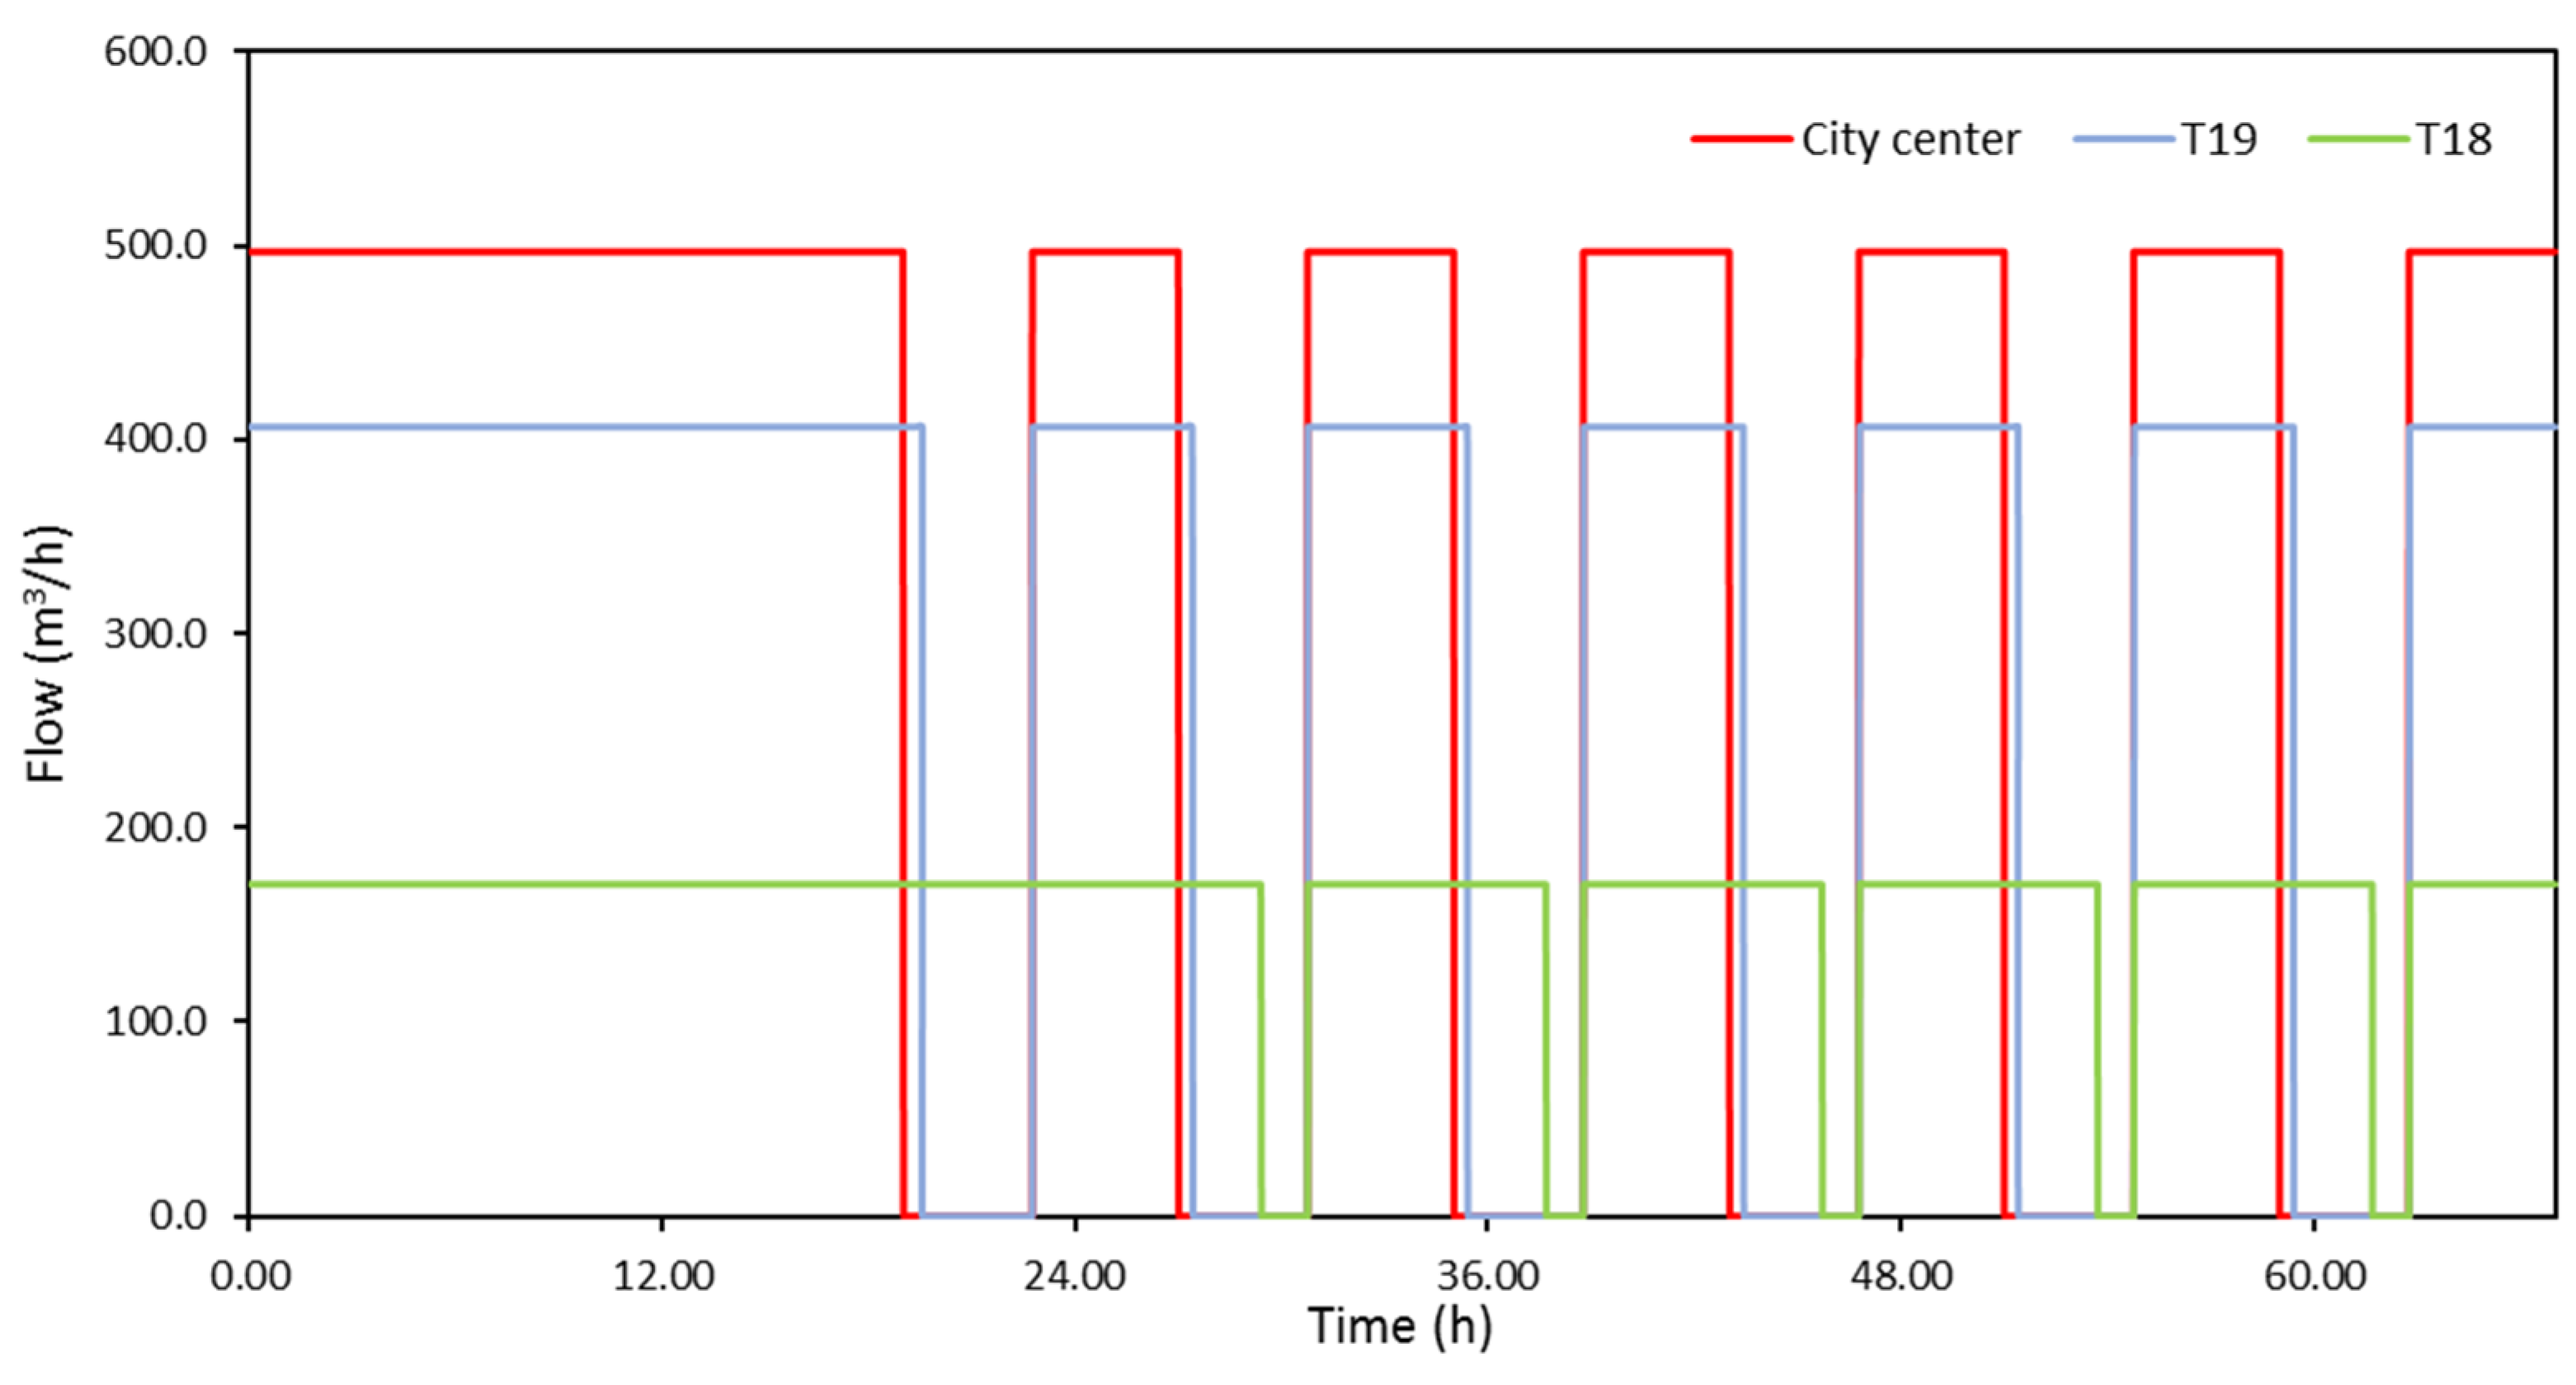


