Evaluation of the Storage Effect Considering Possible Redevelopment Options of the Peace Dam in South Korea


1
School of Civil, Environmental and Architectural Engineering, College of Engineering, Korea University, Seoul 02841, Korea
2
National Drought Information Analysis Center, Integrated Water Resources Management Department, K-water, Daejeon 34340, Korea
*
Author to whom correspondence should be addressed.
Water 2020, 12(6), 1674; https://doi.org/10.3390/w12061674
Submission received: 15 April 2020
/
Revised: 6 June 2020
/
Accepted: 9 June 2020
/
Published: 11 June 2020
(This article belongs to the Special Issue Analysis, Evaluation and Optimization of Infrastructures Serving Water Systems)
Abstract
:The Peace Dam is one of two flood control dams in South Korea. Located near the demilitarized zone (DMZ) between North and South Korea, the Peace Dam was constructed as a counter measure to the Imnam Dam of North Korea. However, the recent reconciliation efforts between North and South Korea have raised the possibility for the redevelopment of the Peace Dam to be a multi-purpose dam. This study evaluates the possible increase of the flood control ability of the Peace Dam under the condition of its redevelopment. The allocation of flood control and water conservation storage as well as the reservoir operation method is determined to follow the other similar-sized dams in Korea. The flood control ability is quantified by introducing the concept of a storage coefficient. In order to estimate the storage coefficient, an exponential nonlinear reservoir model was used. The results can be summarized as follows: First, the current Peace Dam, a flood control dam, is found to have a small flood control ability. Quantified by the storage coefficient, the flood control ability of the current Peace Dam is estimated to be just 3.9 h. Second, the maximum storage coefficient of the Peace Dam can be increased up to 22.6 h. Here, it is assumed that the dam is operated by the rigid reservoir operation method (rigid ROM) in which the discharge is determined by applying a constant rate (specifically, 0.5 in this study) to the inflow until the peak inflow is reached. In addition, this result is based on the assumption that the ratio between water conservation storage and flood control storage is three. That is, even though the flood control storage is set at just 25% of the total storage, the storage coefficient is increased to be more than five times that of the current Peace Dam. In addition, secured water conservation storage can significantly increase the benefits associated with the redevelopment of the Peace Dam.
1. Introduction
In April 1986, North Korea announced the construction plan for the Kumgang Mountain Hydro-Power Generation Plant, which included a diversion called the Imnam Dam. Construction of the dam began in October 1986. The dam was planned as a rockfill dam with a height of 121.5 m and a total storage capacity of 2720 × 106 m3. As the Imnam Dam was planned to be located very near to the demilitarized zone (DMZ) (i.e., very near to South Korea), breakage of the dam could cause serious damage to Seoul, the capital city of South Korea [1]. Another concern for South Korea was the potential use of the dam for military purposes.
In November 1986, the South Korean government announced a dam construction plan to prepare for possible breakage of the Imnam Dam. They named this new dam the Peace Dam. The dam construction was planned with regard to construction safety, economic feasibility, and the construction progress of the Imnam Dam. The size of the Peace Dam was also determined to be sufficient to withstand the breakage of the Imnam Dam. As a result, during the first stage of dam construction from February 1987 to December 1989, the dam was constructed with a height of 80 m and a total storage of 590 × 106 m3, and in the second stage of dam construction from September 2002 to December 2006, the dam was expanded to a height of 125 m and a total storage of 2630 × 106 m3 [2,3]. In fact, the total storage could be expanded even larger to 3275.4 × 106 m3 if the fact that the Imnam Dam is located very near to the Peace Dam were to be disregarded.
The Peace Dam is categorized as a flood control dam that does not involve any hydropower generation or gate operation. The purpose of the flood control is to protect Seoul, the capital city of South Korea, from the effects of a potential breakage of the Imnam Dam. Based on various simulation studies on dam structure, the spillway type was determined to be a discharge tunnel. In total, four discharge tunnels with a diameter of 10 m were constructed on the right-hand-side of the dam. The flood control effect is achieved simply by the relation between the dam storage and discharge through these four discharge tunnels [2,3].
There are only two flood control dams in South Korea: the Peace Dam and the Hantangang Dam. Interestingly, these two dams are both located in shared river basins near the DMZ. These two dams were determined to be flood control dams due to the effects of a potential conflict between North and South Korea. However, the recent reconciliation between North and South Korea has raised the possible redevelopment of these two flood control dams into multi-purpose dams [4]. These two dams can be more effective and economical by introducing reservoir operation, since the benefits like water supply and recreation use can be increased [5]. Flood control ability can also be enhanced even in the case where some portion of the total storage is assigned for water conservation.
The storage for water conservation of a dam is usually determined by analyzing how the water level and storage of the reservoir varies over time using historical inflow data. In the case of an ungauged basin, the inflow data can be generated by rainfall-runoff analysis. No matter what method is used, it is known that the desired regulation period is very important, and the minimum required active storage capacity would be computed differently depending on it [6]. The Peace Dam is also located in an ungauged basin, so the runoff data is not available. More seriously, as most of the basin of the Peace Dam is within the North Korean Territory, the rainfall data is not available either. Due to these limitations, this study refers to other dams in South Korea to determine storage for water conservation.
This study evaluates the possible increase of the flood control ability of the Peace Dam under the condition of its redevelopment. The redevelopment of the Peace Dam means changing it from a flood control dam to a multi-purpose dam serving both the purposes of flood control and water conservation. The allocation of flood control and water conservation storage as well as the reservoir operation method of the Peace Dam is assumed to follow that of other similar-sized dams in Korea. Flood control ability is quantified by introducing the concept of a storage coefficient.
2. The Peace Dam in Korea
The Peace Dam was originally planned to prepare for the effects of the potential breakage of the Imnam Dam in North Korea. As the Peace Dam is located within the DMZ between North and South Korea, it was built as a simple flood control dam without any reservoir operation. It has four discharge tunnels (i.e., orifices) to effectively release the dam storage.
The Peace Dam is located within the North Han River Basin, which covers 41% (10,739 km2) of the entire Han River Basin. The basin area of the Peace Dam is 3227 km2, of which 2869.9 km2 are in the North Korean Territory. The main channel length is 171 km, and the channel slope is 0.39%. The curve number (CN) according to the natural resources conservation service-curve number (NRCS-CN) method [7] is determined to be 64.5 by considering the soil, land use, and vegetation, which is similar to those of other river basins in South Korea. Figure 1 shows the locations of the Peace Dam and its basin.
The Peace Dam is a concrete-faced rockfill dam (CFRD). The Peace Dam was constructed in two phases. The first phase was from February 1987 to December 1989, during which the dam was constructed with a height of 80 m, length of 410 m, and total storage capacity of 590 × 106 m3. The second phase was from September 2002 to December 2006, when the dam was expanded to a height of 125 m, length of 601 m, and total storage of 2630 × 106 m3.
The spillway of the Peace Dam is composed of four discharge tunnels with a diameter of 10 m that are located at the right-hand side of the dam. All of the inflow was designed to be discharged by these tunnels. Due to the lag between the inflow and discharge, the storage effect occurs. The elevation of the entrance of one tunnel is EL. 159.5 m, while those for the remaining three tunnels are all EL. 170.0 m. The elevations of the exit of the tunnels are all the same at EL. 158.0 m. The length of the tunnel varies from 910 m to 1100 m, so the slope also varies from 0.165% to 1.218%. Figure 2 shows the shape of the Peace Dam and its spillways (the area-capacity curve of the Peace Dam is given in Figure A1).
3. Possible Redevelopment Options of the Peace Dam and Its Flood Control Ability
3.1. Allocation of Flood Control and Water Conservation Storage
In total, 20 multi-purpose dams have been built in Korea since 1961, which was when the Sumjin Dam, the first multi-purpose dam in Korea, was completed. The purposes of these multi-purpose dams include water supply, hydropower generation, and flood control. As each multi-purpose dam was planned to satisfy certain specific purposes at that time, flood control storage and water conservation storage vary from dam to dam. However, mainly due to the obligatory Preliminary Feasibility Evaluation (PFE) in Korea, any proposed multi-purpose dam must prove its economic validity. Direct benefits from a dam typically include water supply (living, industrial, and agricultural), flood control, hydroelectric power generation, etc. In the case that the power generation is small or negligible as in this case, an easy way to increase the economic validity is to increase the water conservation storage, as the economic effect of flood control was generally underestimated. As a result, most multi-purpose dams in Korea have secured rather large water conservation storage.
Water conservation storage, also called active storage, is defined as the storage from the low water level (LWL) to the high water level (HWL). That is, the HWL is the highest water level designated for water conservation. On the other hand, the flood control storage is defined as the storage from the HWL to the flood water level (FWL). In some dams in Korea, the restricted water level (RWL), as opposed to the HWL, was also introduced for the wet period from 21 July to 20 September in order to increase the flood control storage [8]. The RWL is generally set 3 m lower than the HWL.
The total storage, water conservation storage, and flood control storage of 19 dams, which are the only dams for which this information is currently available, are summarized in Table 1 [9]. In general, the water conservation storage is larger than the flood control storage, but the ratio between the two varies substantially from dam to dam. The Namgang Dam has the smallest ratio at 1.1, while the Jangheung Dam has the highest ratio at 21.4. On average, the ratio is 7.3. In particular, the Namgang Dam, which is a small dam compared to its basin area, lowers its water level to far below the HWL during the wet season. As a result, the sum of the water conservation storage and flood control storage is larger than its total storage.
For the effective operation of the Peace Dam, it is necessary to determine the HWL and/or RWL. In this study, the HWL and/or RWL were determined by considering the ratio between the water conservation storage and flood control storage. In fact, the ratio varies between dams, but is found to be very dependent upon both the dam size and the dam basin area. The four biggest dams based on total storage, which is larger than 109 m3, have an average ratio of 4.4. By contrast, the other smaller dams have a ratio of about 8.0. The seven biggest dams based on basin area, which is larger than 1000 km2, have an average ratio of 4.3, which is much smaller than that of other dams, which is about 9.0. It is obvious that the portion of water conservation storage tends to be larger for small dams, while that of the flood control storage tends to be larger for large dams.
The Peace Dam is a large dam with a basin area of 3227 km2 and a total storage of 3275.4 × 106 m3. It was assumed in this study that the ratio between water conservation storage and flood control storage might be determined to be similar to those of other large dams in Korea. This study considered various cases between 1.1 and 9.1, which are the smallest and largest ratios of the large dams in Korea with a basin area larger than 1000 km2 or a total storage larger than 109 m3. As the smallest and highest ratios of the existing large dams in Korea are 1.1 and 9.1, this study considered the ratios of 3, 5, 7, and 9 (which are referred to as C/F = 3, C/F = 5, C/F = 7, and C/F = 9, respectively) as possible candidates for the Peace Dam.
The flood control ability of the Peace Dam was originally evaluated with a 200-year design flood [1]. Basically, the same exact design flood was considered in this study. One important condition additionally considered in this study was that, after the dam redevelopment, the water level could not be higher than the FWL in any case. This could be a serious problem for the safety of a rockfill dam. In addition, as most severe storms occur during the wet season, the RWL was applied in this evaluation instead of the HWL. The LWL of the Peace Dam was determined to be the lowest elevation of the entrance of the four drainage pipes, i.e., EL. 159.5 m. The RWL could then be determined automatically by applying the ratio between the water conservation storage and flood control storage (i.e., the C/F ratio). The RWLs and the C/F ratios considered in this study are summarized in Table 2. As shown in the table, if the RWL is set to 159.5 m, the C/F ratio becomes zero, as no water conservation storage exists. The C/F ratio increases as the RWL increases, and it becomes infinite as the RWL meets the FWL, i.e., EL. 269.3 m.
3.2. Reservoir Operation Method
There are many reservoir operation methods (ROMs), one of which is selected to most effectively satisfy the purpose of the dam. The generally accepted ROMs include the Auto ROM, Rigid ROM, and Technical ROM. Among them, the Auto ROM may be the simplest ROM, which only guarantees the dam safety. This method is generally used in the case that no inflow information is available or only low-quality information is available. As shown in Figure 3a, no discharge is allowed until the reservoir reaches the target level. Then, all of the inflow is discharged to maintain the target reservoir level. However, this method may not be appropriate as it is not so effective for flood control to result in increased flood damage in the downstream area.
The Technical ROM is the method applied when the inflow information is available. Effective use of the dam reservoir as well as the effective flood control is possible, but accurate inflow information is a prerequisite. As shown in Figure 3b, the constant discharge () is determined to make the total volume of discharge the same as the target volume of flood control. The discharge begins at and ends at when the inflow equals . The Technical ROM is a very effective reservoir operation method, but only under the condition that the inflow hydrograph is accurately predicted. If an accurate inflow hydrograph is not available, it is not practically easy to apply the Technical ROM to any reservoir.
Finally, the Rigid ROM is based on the rule called the constant rate—constant magnitude. As shown in Figure 3c, the discharge is determined by applying a constant rate to the inflow until the peak inflow is reached, and then the constant magnitude is released. In fact, this Rigid ROM is applied to most multi-purpose dams in Korea. In Figure 3c, the constant rate R is defined as the ratio , while the constant magnitude is denoted by . In the case that , becomes .
As shown in Table 1, the most common reservoir operation method applied to multi-purpose dams in Korea is the Rigid ROM. Thirteen out of 19 multi-purpose dams adopt the Rigid ROM, while the other dams adopt the Spillway Rule Curve (SRC) or some empirical methods, mostly modified version of the Rigid ROM. The reason why the Rigid ROM is commonly adopted in Korea is that the Rigid ROM is believed to be practical for flood control as well as to maximize water conservation storage. This study also considered the use of the Rigid ROM as a reservoir operation method for the Peace Dam.
For the application of the Rigid ROM, it is necessary to determine the constant rate R. This constant rate is closely related to the flood control ability of a dam, particularly the flood control rate defined by the difference between the peak inflow and the peak discharge divided by the peak inflow. In the case of the Rigid ROM, the flood control rate becomes 1 − R. If R is equal to 1.0, the flood control rate becomes 0.0, and if R is equal to 0.0, the flood control rate becomes 1.0. Table 1 also presents the constant rate R accepted by multi-purpose dams in Korea. Most dams have an R value around 0.3–0.7 (with an average value of about 0.5).
It was not easy to determine R at the initial stage of the redevelopment plan of the Peace Dam. Instead, this study considered four different values of R—0.2, 0.4, 0.6, and 0.8. These four R values were later evaluated based on considerations of dam safety and reservoir operation efficiency. For example, a high R value will decrease the efficiency of water conservation and flood control but increase the dam safety. The R value should be determined by considering all of these objectives of a multi-purpose dam.
3.3. Simulation of Reservoir Operation and Storage-Discharge Relation
3.3.1. Generation of Inflow Data
When planning the current Peace Dam, the rainfall data used to simulate the inflow data were the design rainfall data corresponding to the return period of 200 years. This simulated inflow data was then used to determine several details of the dam, including the tunnel-type spillway [1].
The same return period of 200 years was also considered in this study in order to generate the inflow data to the Peace Dam. This design rainfall was developed based on the Map of Probable Rainfall in Korea [10], and rainfall durations of 12, 24, 48, 72, 84, and 96 h were considered for the rainfall-runoff analysis in this study. Among these six cases, the worst case was selected for the reservoir operation. The overall procedure is summarized by a flowchart and given in Figure A2. The probable rainfalls were estimated to be 328.9, 455.6, 611.4, 702.1, 731.5, and 752.4 mm. The areal reduction factor was applied to convert the point rainfall into the areal one, while the Huff method [11] was applied to temporally distribute the probable rainfall.
The effective rainfall was derived by applying the NRCS-CN method, which is the most popular method for calculating the infiltration amount in Korea. The curve number (CN) was estimated according to the information on soil, land use, and vegetation obtained from the National Water Resources Management Information System (WAMIS) (www.wamis.go.kr). The CN was estimated to be 64.5, and the AMC-III condition was applied to consider the wet summer season in Korea. Meanwhile, the CN for the AMC-III condition became 80.7.
The direct runoff was estimated by applying the Clark watershed routing method [12]. There may be some error in the estimated runoff caused by disregarding the base flow. However, in Korea, the base flow is far smaller than the direct runoff during flood, and thus, the base flow is generally disregarded in the flood runoff analysis [13]. Two important parameters of the Clark watershed routing method—the concentration time and storage coefficient —were estimated by applying the following empirical formula developed for the Han River Basin [14].
where is the concentration time (hour) and is the storage coefficient (hour). Further, is the channel length (km), and is the channel slope. and for the Peace Dam Basin are 171 km and 0.00387, respectively [1]. The estimated and are 19.4 h and 17.1 h, respectively. The unit hydrograph derived by applying these parameters is shown in Figure 4.
The critical rainfall duration which caused the highest reservoir water level, was then selected among the six rainfall durations considered in this study, i.e., 12, 24, 48, 72, 84, and 96 h. In this calculation, the current condition of the dam was considered, and thus the initial water level was set at the LWL. The simulated peak discharge of the dam and the peak water level for each case are summarized in Table 3.
As shown in Table 3, the peak water level increased when rainfall durations up to 72 h were applied, then decreased thereafter for longer rainfall durations. As a result of the simulation, this study determined the critical rainfall duration for the Peace Dam to be 72 h. The rainfall histogram and the inflow hydrograph for the probable rainfall with a duration of 72 h are shown in Figure 5.
3.3.2. Simulation Results
The reservoir operation was done by applying the Rigid ROM according to the inflow hydrograph prepared in the previous section. Four different RWLs were considered in this simulation along with four different constant rates. In total, 16 operation results were then derived and evaluated. The simulated results (discharge and water level) along with the inflow hydrograph are compared in Figure 6.
It should be noted in Figure 6 that all four cases with the constant rates of 0.2 and 0.4, regardless of the given RWL, failed to maintain the water level lower than the FWL (EL. 269.3 m). Clearly, the constant rates of 0.2 and 0.4 may not be applicable to the Peace Dam. When applying the constant rate of 0.6, both cases C/F = 3 and C/F = 5 satisfied the safety condition. Finally, when applying the constant rate of 0.8, all of the cases from C/F = 3 to C/F = 9 were found to satisfy the safety condition.
In order to derive the storage-discharge relation, this study considered the data up to the peak inflow. This was done simply because only the given amount of flow is discharged after the peak inflow in the application of the Rigid ROM. If the inflow is smaller than this given value, then the entire inflow is discharged. Thus, several storage values can correspond to one discharge value, and one storage value can correspond to several discharge values. As a result, the relation of storage–discharge can be distorted, and the dam storage coefficient can be underestimated. It can also be considered that the discharge after the peak inflow simply does not contribute much to the flood control ability of a dam. A comparison of the storage–discharge relations derived for the four cases is presented in Figure 7.
Figure 7 shows that the shape of the graph depends on the constant rate R and that the interception is determined by the RWL. With a constant rate of 0.2, as the discharge cannot be so high even though the flood control storage increases substantially, the storage–discharge curve has a steep slope. On the other hand, if the constant rate R is higher, the slope becomes milder. Clearly, among the four constant rates considered in this study, the curve with the constant rate of 0.8 shows the mildest slope.
4. Evaluation of Storage Effect
4.1. Quantification of Dam Storage Effect Based on a Nonlinear Reservoir Model
There are various indicators for quantifying flood control ability and/or storage effect. For example, flow control rate, reservoir discharge rate, reservoir storage rate, and reservoir utilization rate are simple indicators. The flow control rate is also called flood control rate, which indicates the ability to control the peak flood. The reservoir discharge rate and storage rate indicate the storage ability of the reservoir. Finally, reservoir utilization rate is an indicator of how much the flood control storage was used for the flood [15]. However, since these indicators simply evaluate the flood control ability and/or storage effect using only changes of water level or storage, it is difficult to regard them as a single indicator representing the storage characteristics of the dam.
It is known that the storage effect of the reservoir is fully dependent on this storage and outflow relationship [16], and it can be quantified by the storage coefficient [17]. In a linear reservoir model, the storage effect is quantified as a proportional coefficient between the reservoir storage and discharge. However, the relationship between the reservoir storage and discharge is rarely linear. Specifically, the reservoir storage is generally much bigger than the discharge, and the storage varies nonlinearly with respect to the reservoir depth. There have been many studies that considered this nonlinear relationship. Most of the recent studies were on the power function [18,19,20] and logarithmic function model [21,22]. Besides the aforementioned models, [17] proposed an exponential nonlinear model. According to [17], only the exponential function model was found to provide a realistic storage coefficient of a reservoir among three different nonlinear models (power function model, logarithmic function model, and exponential function model). The relationship between the reservoir storage and discharge represented by an exponential function can be expressed as follows.
where and are constants representing the reservoir characteristics.
With the given relationship between the reservoir storage and discharge, it is possible to derive the equation for discharge from a reservoir by solving the continuity equation. By substituting the storage of the continuity equation according to Equation (3) above, one can obtain the following differential equation about the discharge:
If considering the instantaneous inflow to the nonlinear reservoir to derive the impulse response function of a reservoir, it is rather easy to solve the continuity equation presented above. That is, for , one can get
Unfortunately, there is no analytical solution available for Equation (5). The maximum number of terms in the left-hand side of Equation (5) is only two in the case that the analytical interpretation is favored. In this case, the solution can be derived by introducing the Wright function [23].
where and is defined by , satisfying . Further, in this equation, the subscript 1 + 2 indicates that only the first and second terms of Equation (5) are considered to derive the outflow hydrograph. When the impulse response function of a reservoir is given in a functional form, it is easy to then derive the storage coefficient. The storage coefficient () is derived by dividing the outflow by its first derivative at the inflection point [24]. That is,
It should be noted that the above definition of the storage coefficient is based on the assumption of a linear system. In the case that the reservoir is not linear, the storage coefficient estimated by Equation (7) may be just an approximation. In contrast to the linear reservoir case, the estimated storage coefficient is no longer the proportional coefficient between the storage and discharge. However, this ratio must be a good approximation.
The procedure for deriving the storage coefficient is rather complicated. The analytical solution is only available when considering the two terms on the left-hand side of Equation (5), which is
where can be estimated using the relations and by the definition of the function [23]. As , and is estimated to be about 0.567. Finally, the storage coefficient is determined to be . Based on a numerical simulation, [17] showed that the storage coefficient converged with an increasing number of terms in Equation (5). This trend is consistent regardless of the value , and the storage coefficient was determined to be 172% of , i.e., .
4.2. Storage Coefficients Before and after the Dam Redevelopment
4.2.1. Current Peace Dam
The current Peace Dam is a flood control dam that is not controlled by any reservoir operation rule. As the dam discharge is calculated using a simple orifice formula, the fitting of the nonlinear exponential function to the storage-discharge relation could be done directly and easily. Fitting of the nonlinear exponential function was done by applying the least squares method (LSM). The fitting result is shown in Figure 8. The estimated parameters and are 13,255,229.2 and 0.000000173231, respectively. Their product becomes 2.3 and the storage coefficient () is estimated to be 3.9 h. This estimated storage coefficient is, in fact, far smaller than those of other dams in Korea with comparable total storage and basin area.
4.2.2. After the Redevelopment
In the previous section, 16 new storage-discharge relations were derived by applying four different RWLs and four different Rs of the Rigid ROM. Fitting of the nonlinear exponential function was also done by applying the LSM. The fitting results are summarized in Table 4. In all cases, the coefficient of determination was estimated to be higher than 0.98.
As shown in Table 4, the newly estimated storage coefficient was found to be extremely dependent on the assumed constant rate. For a constant rate of 0.8, the dam storage coefficient was estimated to be about 5.8 h, which was not substantially different from that of the current Peace Dam (3.9 h). However, if applying a constant rate of 0.2, the storage coefficient grew much bigger, from 88.3 to 89.3 h depending on the RWL (about 23 times higher than the current one). When considering the constant rate of 0.5 (this result is not provided in Table 4), which was a value similar to those of the dams in Korea with similar sizes to the Peace Dam, the storage coefficient was estimated to be around 20 h (about five times that of the current Peace Dam). Additionally, it was found that the storage coefficient was increased with higher RWL, even though the increase was as large as in the case of controlling the constant rate. This result was mainly due to the fact that more flood control storage corresponds to the given discharge value when a higher RWL is assigned.
4.3. Discussions
This study compared the results derived in the previous section with those obtained by applying the method described by [17], who analyzed several multi-purpose dams in Korea to derive a possible relation between the dam storage coefficient and the characteristics of the dam itself and the dam basin. They found that the dam storage coefficient could be explained by the flood control storage () divided by the channel length (). That is,
where is the storage coefficient (h), is the flood control storage (106 m3), and is the channel length (km). It is particularly noticeable that the storage coefficient can be expressed as a linear function of (106 m3/km).
As the storage coefficient of a given dam is mainly controlled by the flood control storage, it can be smaller if the RWL is set to a higher value. In this study, four different RWLs were considered, which corresponded to the flood control storage values of 818.9 × 10⁶ m3, 545.9 × 10⁶ m3, 409.4 × 10⁶ m3, and 327.5 × 10⁶ m3, respectively. With the channel length of the Peace Dam basin fixed at 171 km, the values of (106 m3/km) for those four cases became 4.8, 3.2, 2.4, and 1.9, respectively. Now, using Equation (9), the dam storage coefficients were calculated to be 44.6, 30.6, 23.6, and 19.4 h, respectively. Finally, these estimates were compared with those of the cases considered in this study (Figure 9).
In the previous section, the dam storage coefficient was estimated differentially depending on the given RWL and the constant rate R. However, if considering the cases satisfying the safety condition in which the peak water level could not be higher than the FWL, the cases of C/F = 3 and C/F = 5 with the constant rate 0.6 along with all cases with the constant rate 0.8 were found to be valid. For these cases, the storage coefficients were estimated to be 15.2, 15.3, and 5.8 h, respectively. Additionally, if simply counting the flood control ability alone, the case of C/F = 3 with the constant rate 0.42 was estimated to be the best, as the storage coefficient was estimated to be 31.1 h. However, if counting both the flood control ability and the water conservation capacity, the case of C/F = 3 with the constant rate of 0.5 would be the most reasonable, with a dam storage coefficient of 22.6 h.
This result can also be evaluated against the other multi-purpose dams in Korea. First, it is possible to consider the ratio between the water conservation storage and the flood control storage (e.g., the cases C/F = 3 and C/F = 5). Interestingly, all three similarly sized dams in Korea (i.e., the Chungju Dam, Soyanggang Dam, and Daecheong Dam) have ratios around 3 (specifically, 2.9, 2.2, and 3.2, respectively). Accordingly, the case of C/F = 3 may be assumed to be more practical than the case of C/F = 5. The estimated storage coefficient for the case of C/F = 3 (i.e., 22.6 h) was substantially smaller than that of the Soyanggang Dam (42.8 h), similar to that of the Chungju Dam (22.5 h), and much higher than that of the Daecheong Dam (8.1 h). It should also be noted that the determined constant rate R for the Peace Dam in this study is similar to those of these dams. That is, the constant rate R of the Soyanggang Dam is 0.519, while of the Daecheong Dam is 0.550. All of these evaluation results indicate that the most appropriate option for the Peace Dam is the case of C/F = 3 with the constant rate R = 0.5.
5. Conclusions
The Peace Dam is one of the two flood control dams in South Korea. Located near the demilitarized zone (DMZ) between North and South Korea, the Peace Dam was constructed as a counter measure to the Imnam Dam of North Korea. The Imnam Dam is also located very near to the DMZ. However, the recent reconciliation between North and South Korea has raised the possible redevelopment of the Peace Dam into a multi-purpose dam. This study evaluated a possible increase in the flood control ability of the Peace Dam under the condition of its redevelopment.
The results can be summarized as follows. First, the current Peace Dam, a flood control dam, was found to have a small flood control ability. Quantified by the storage coefficient, the flood control ability of the current Peace Dam was estimated to be just 3.9 h. This estimated storage coefficient is far smaller than those of other multi-purpose dams in Korea with similar total storage and basin area.
Second, the maximum storage coefficient of the Peace Dam could be increased up to 22.6 h. Here, it was assumed that the dam was operated by the rigid ROM with a constant rate of 0.5. In addition, this result was based on the assumption that the ratio between water conservation storage and the flood control storage was three, i.e., C/F = 3. This estimated storage coefficient was more than five times that of the current Peace Dam. Further, the estimated storage coefficient was found to be similar to that of the Chungju Dam (22.5 h), which is also similar in terms of total storage and basin size.
As shown in the above results, the flood control ability of a dam can be significantly increased using the reservoir operation method. Even though the flood control storage was assigned to be just 25% of the total storage, the storage coefficient was increased to more than five times of the current Peace Dam. Additionally, the secured water conservation storage can also significantly increase the benefit of the redevelopment of the Peace Dam. This entire procedure used in this study can also be applied to other dam to select an optimum alternative plan by quantifying the storage effect of candidates.
In order to realize and maintain the redevelopment of the Peace Dam, the foundation for political consensus with North Korea is necessary, and the cooperative system needs to be institutionalized. In other words, North Korea’s cooperation, located upstream, should be backed up for the results confirmed in this study to be realized. As the Imnam Dam is currently under hydroelectric power, the economic issues caused by the distribution of river flows cannot be ignored. If the economic aspect is focused on, policies such as the Water-Energy Trade, in which South Korea supplies North Korea with electricity losses commensurate with the river flows, could be an option. However, in the harsh light of reality, North and South Korea have several variables, including political and military issues, due to the special situation in which the division of the Korean Peninsula has been stuck for a long time. Therefore, these issues should be reviewed and mutually negotiated from various aspects.
Author Contributions
Conceptualization, C.Y.; data curation, H.S.; formal analysis, H.S.; investigation, J.L.; writing—original draft preparation, J.L.; writing—review and editing, C.Y. All authors have read and agreed to the published version of the manuscript.
Funding
This research was funded by Korea Ministry of Environment (MOE) grant number 127559 and Korea Ministry of Environment (MOE) grant number 79615.
Conflicts of Interest
The authors declare no conflict of interest.
Data Availability Statement
The data that support the findings of this study are available from the corresponding author upon reasonable request.
Appendix A
Figure A1.
The area-capacity curve of the Peace Dam.
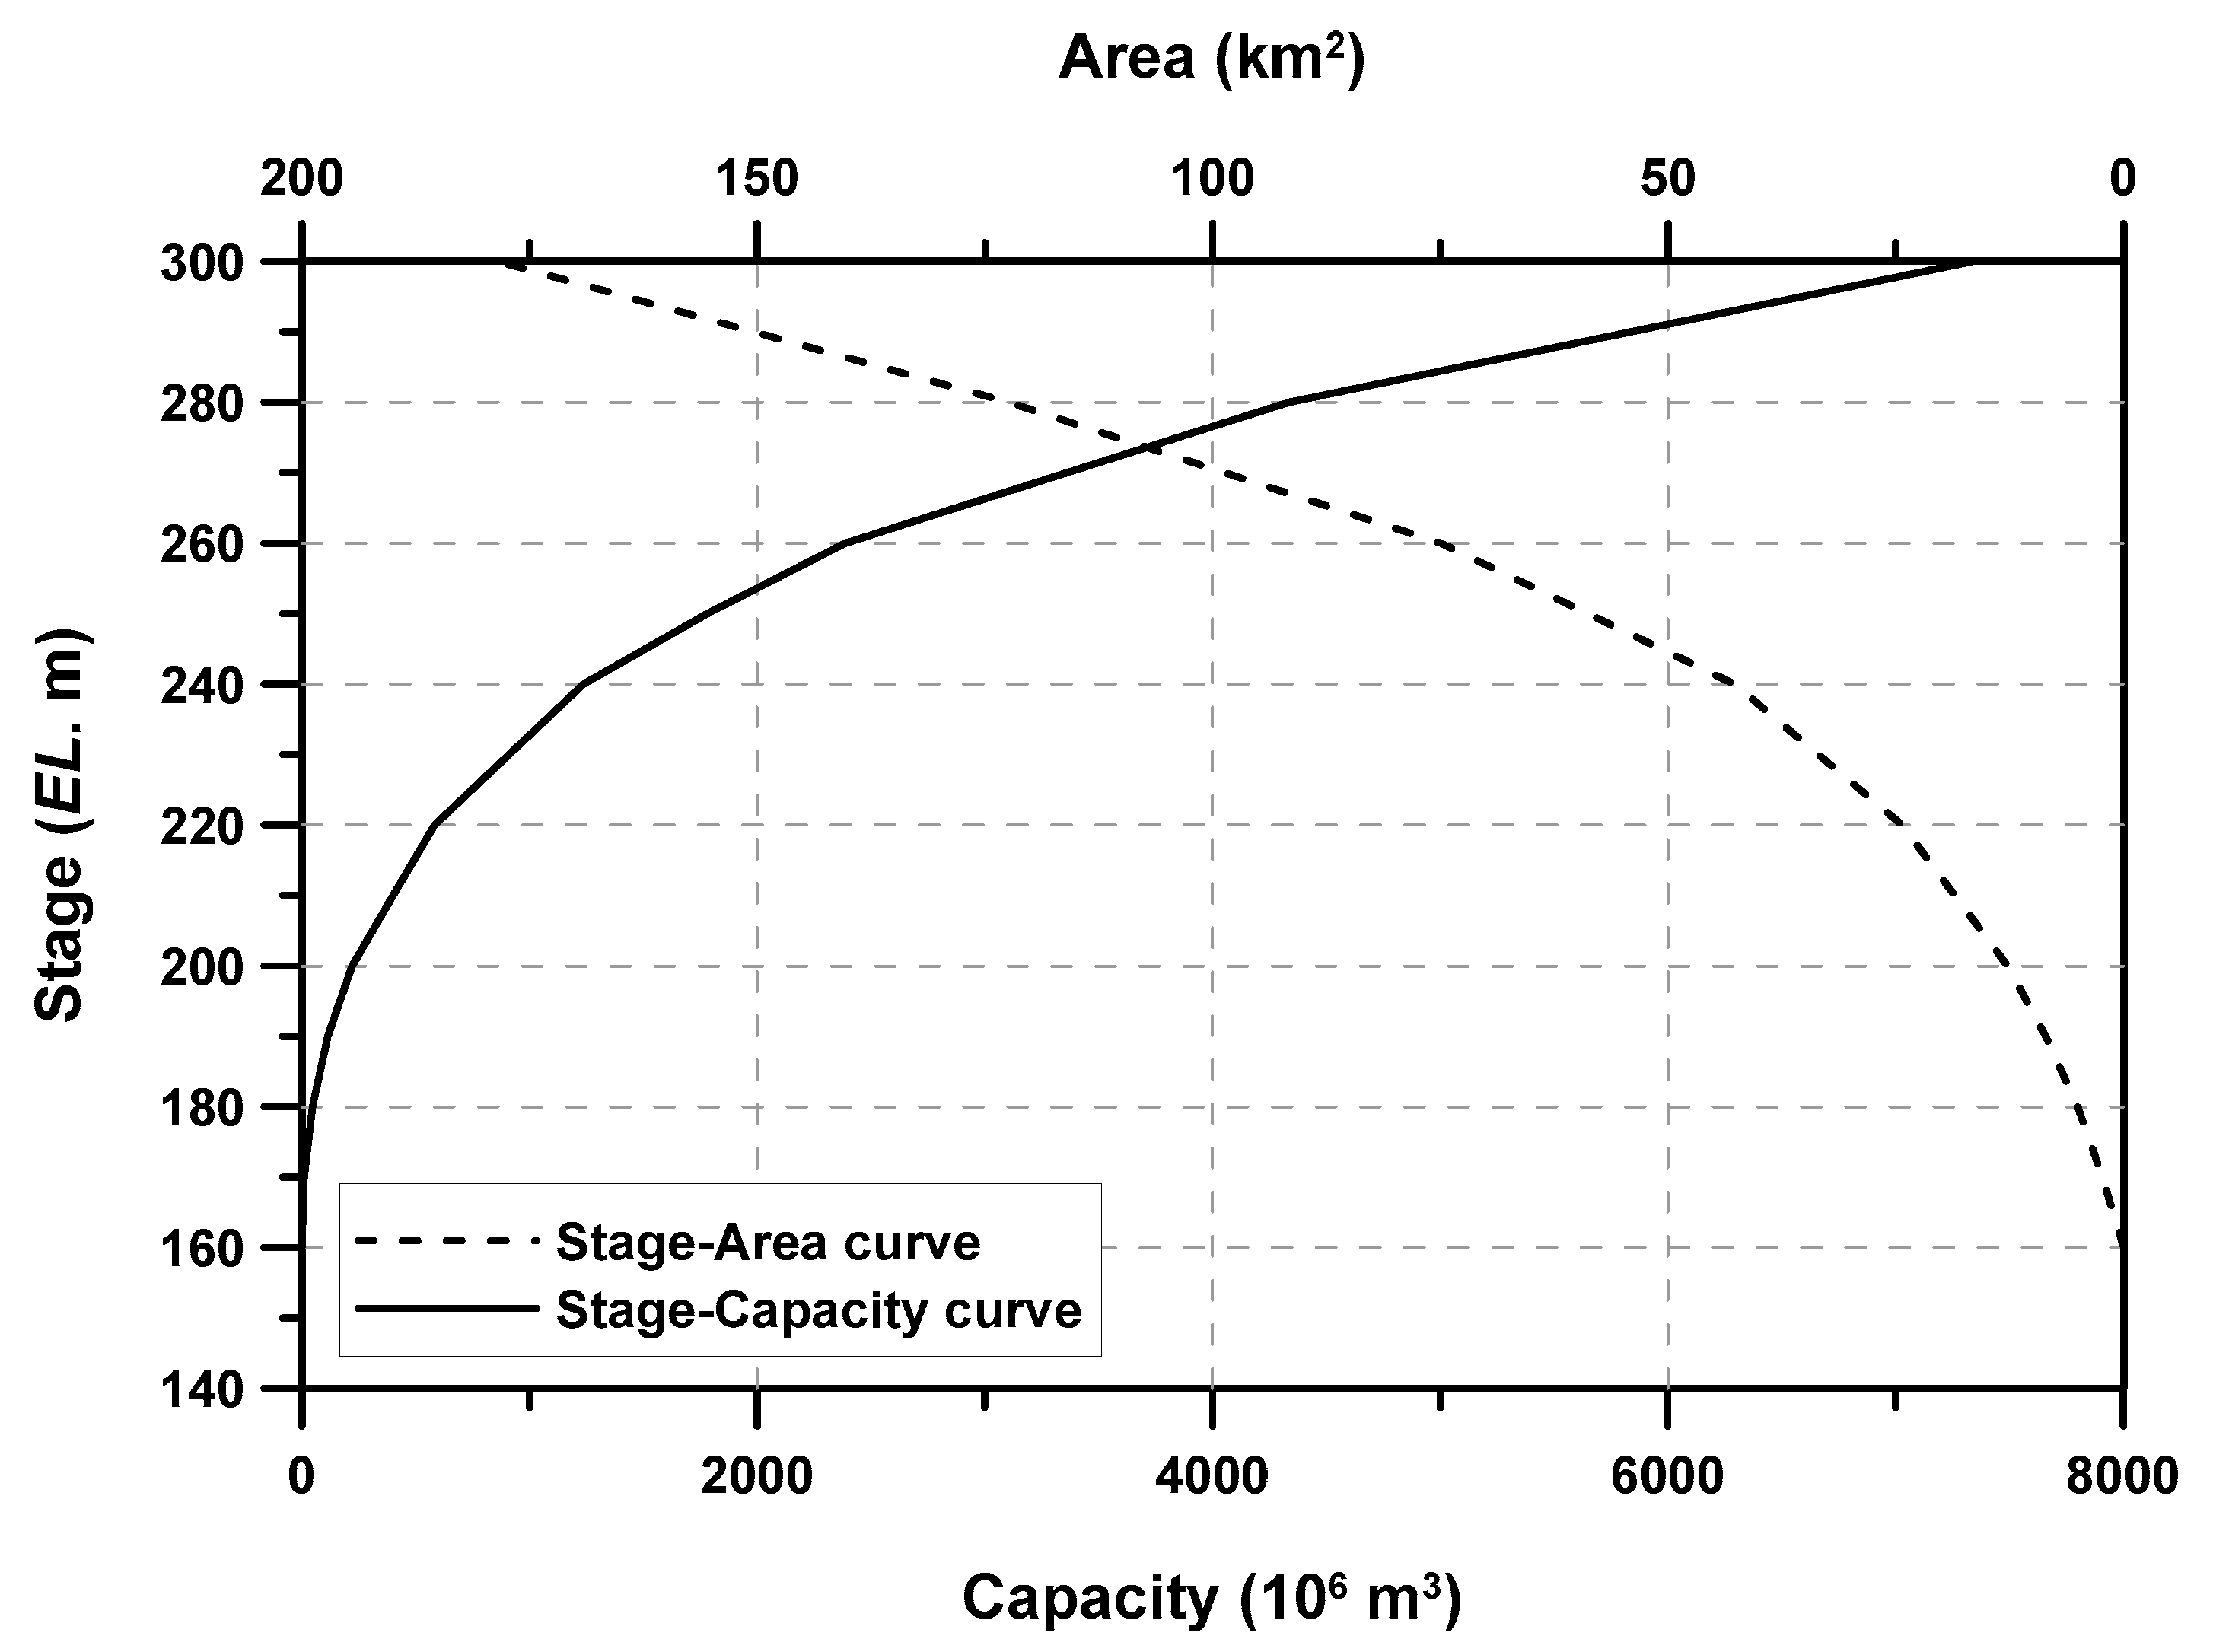
Figure A2.
Procedure for determining the critical rainfall duration in this study.

References
- Ministry of Construction and Transportation. Detailed Design of the PEACE Dam Construction Project (Phase II); Ministry of Construction and Transportation: Seoul, Korea, 2003. [Google Scholar]
- Korea Water Resources Corp. Survey Report of the Han River Basin II-1: General State of Present Condition; Korea Water Resources Corp: Daejeon, Korea, 2004. [Google Scholar]
- K-water. Practice Manual for Dam Operations; K-water: Daejeon, Korea, 2009. [Google Scholar]
- Choi, D.-J.; Lee, M.-H. Applying game theory for strategy transboundary river: The case of Han river in North and South Koreans. J. Korea Water Resour. Assoc. 2008, 41, 353–363. [Google Scholar] [CrossRef] [Green Version]
- Cordell, H.K.; Bergstrom, J.C. Comparison of recreation use values among alternative reservoir water level management scenarios. Water Resour. Res. 1993, 29, 247–258. [Google Scholar] [CrossRef]
- Yannopoulos, P.C.; Demetracopoulos, A.C. A novel methodology for multiple-year regulation of reservoir active storage capacity. Water 2018, 10, 1254. [Google Scholar] [CrossRef] [Green Version]
- Natural Resource Conservation Service. National Engineering Handbook, Section 4: Hydrology; U.S. Department of Agriculture: Washington, DC, USA, 1972. [Google Scholar]
- Jeong, J.H.; Yoon, Y.N. Design Practice in Water Resouces; Goomi Press: Seoul, Korea, 2007. [Google Scholar]
- K-water. Dam Operation Status; K-water: Daejeon, Korea, 2019. [Google Scholar]
- Ministry of Land, Transport and Maritime Affairs. Improvement and Supplement of Probability Rainfall; Ministry of Land, Transport and Maritime Affairs: Seoul, Korea, 2011. [Google Scholar]
- Huff, F.A. Time Distribution of Rainfall in Heavy Storms. Water Resour. Res. 1967, 3, 1007–1019. [Google Scholar] [CrossRef]
- Clark, C.O. Storage and the unit hydrograph. Trans. Am. Soc. Civ. Eng. 1945, 110, 1419–1446. [Google Scholar]
- Kim, N.W.; Lee, J.W.; Lee, J.; Lee, J.E. SWAT application to estimate design runoff curve number for South Korean conditions. Hydrol. Process. 2010, 24, 2156–2170. [Google Scholar] [CrossRef]
- Lee, J.; Yoo, C.; Sin, J. Theoretical backgrounds of basin concentration time and storage coefficient and their empirical formula. J. Korea Water Resour. Assoc. 2013, 46, 155–169. [Google Scholar] [CrossRef] [Green Version]
- Kim, J.; Choi, C.; Yi, J. Development of flood control effect index by using fuzzy set theory. J. Korean Soc. Civ. Eng. 2011, 31, 415–429. [Google Scholar] [CrossRef]
- Richter, B.D.; Thomas, G.A. Restoring environmental flows by modifying dam operations. Ecol. Soc. 2007, 12. [Google Scholar] [CrossRef]
- Yoo, C.; Jun, C.; Lee, J. Storage effect of dam reservoirs: Evaluation of three nonlinear reservoir models. Water Sci. Technol. Water Supply 2017, 17, 1436–1446. [Google Scholar] [CrossRef]
- Ali, M.; Fiori, A.; Bellotti, G. Analysis of the nonlinear storage–discharge relation for hillslopes through 2D numerical modelling. Hydrol. Process. 2013, 27, 2683–2690. [Google Scholar] [CrossRef]
- Charron, C.; Ouarda, T.B. Regional low-flow frequency analysis with a recession parameter from a non-linear reservoir model. J. Hydrol. 2015, 524, 468–475. [Google Scholar] [CrossRef]
- Eris, E.; Wittenberg, H. Estimation of baseflow and water transfer in karst catchments in Mediterranean Turkey by nonlinear recession analysis. J. Hydrol. 2015, 530, 500–507. [Google Scholar] [CrossRef]
- Moore, R. Storage-outflow modelling of streamflow recessions, with application to a shallow-soil forested catchment. J. Hydrol. 1997, 198, 260–270. [Google Scholar] [CrossRef]
- Skala, V.; Dohnal, M.; Votrubová, J.; Jelínková, V. The use of simple hydrological models to assess outflow of two green roofs systems. Soil Water Res. 2019, 14, 94–103. [Google Scholar] [CrossRef] [Green Version]
- Corless, R.M.; Jeffrey, D.J. The Wright ω function. In Artificial Intelligence, Automated Reasoning, and Symbolic Computation; Springer: Berlin, Germany, 2002; pp. 76–89. [Google Scholar]
- Sabol, G.V. Clark Unit-Hydrograph and R-Parameter Estimation. J. Hydrol. Eng. 1988, 114, 103–111. [Google Scholar] [CrossRef]
Figure 1.
Locations of the Peace Dam in South Korea and the Imnam Dam in North Korea. These two dams are separated by the demilitarized zone (DMZ).
Figure 1.
Locations of the Peace Dam in South Korea and the Imnam Dam in North Korea. These two dams are separated by the demilitarized zone (DMZ).
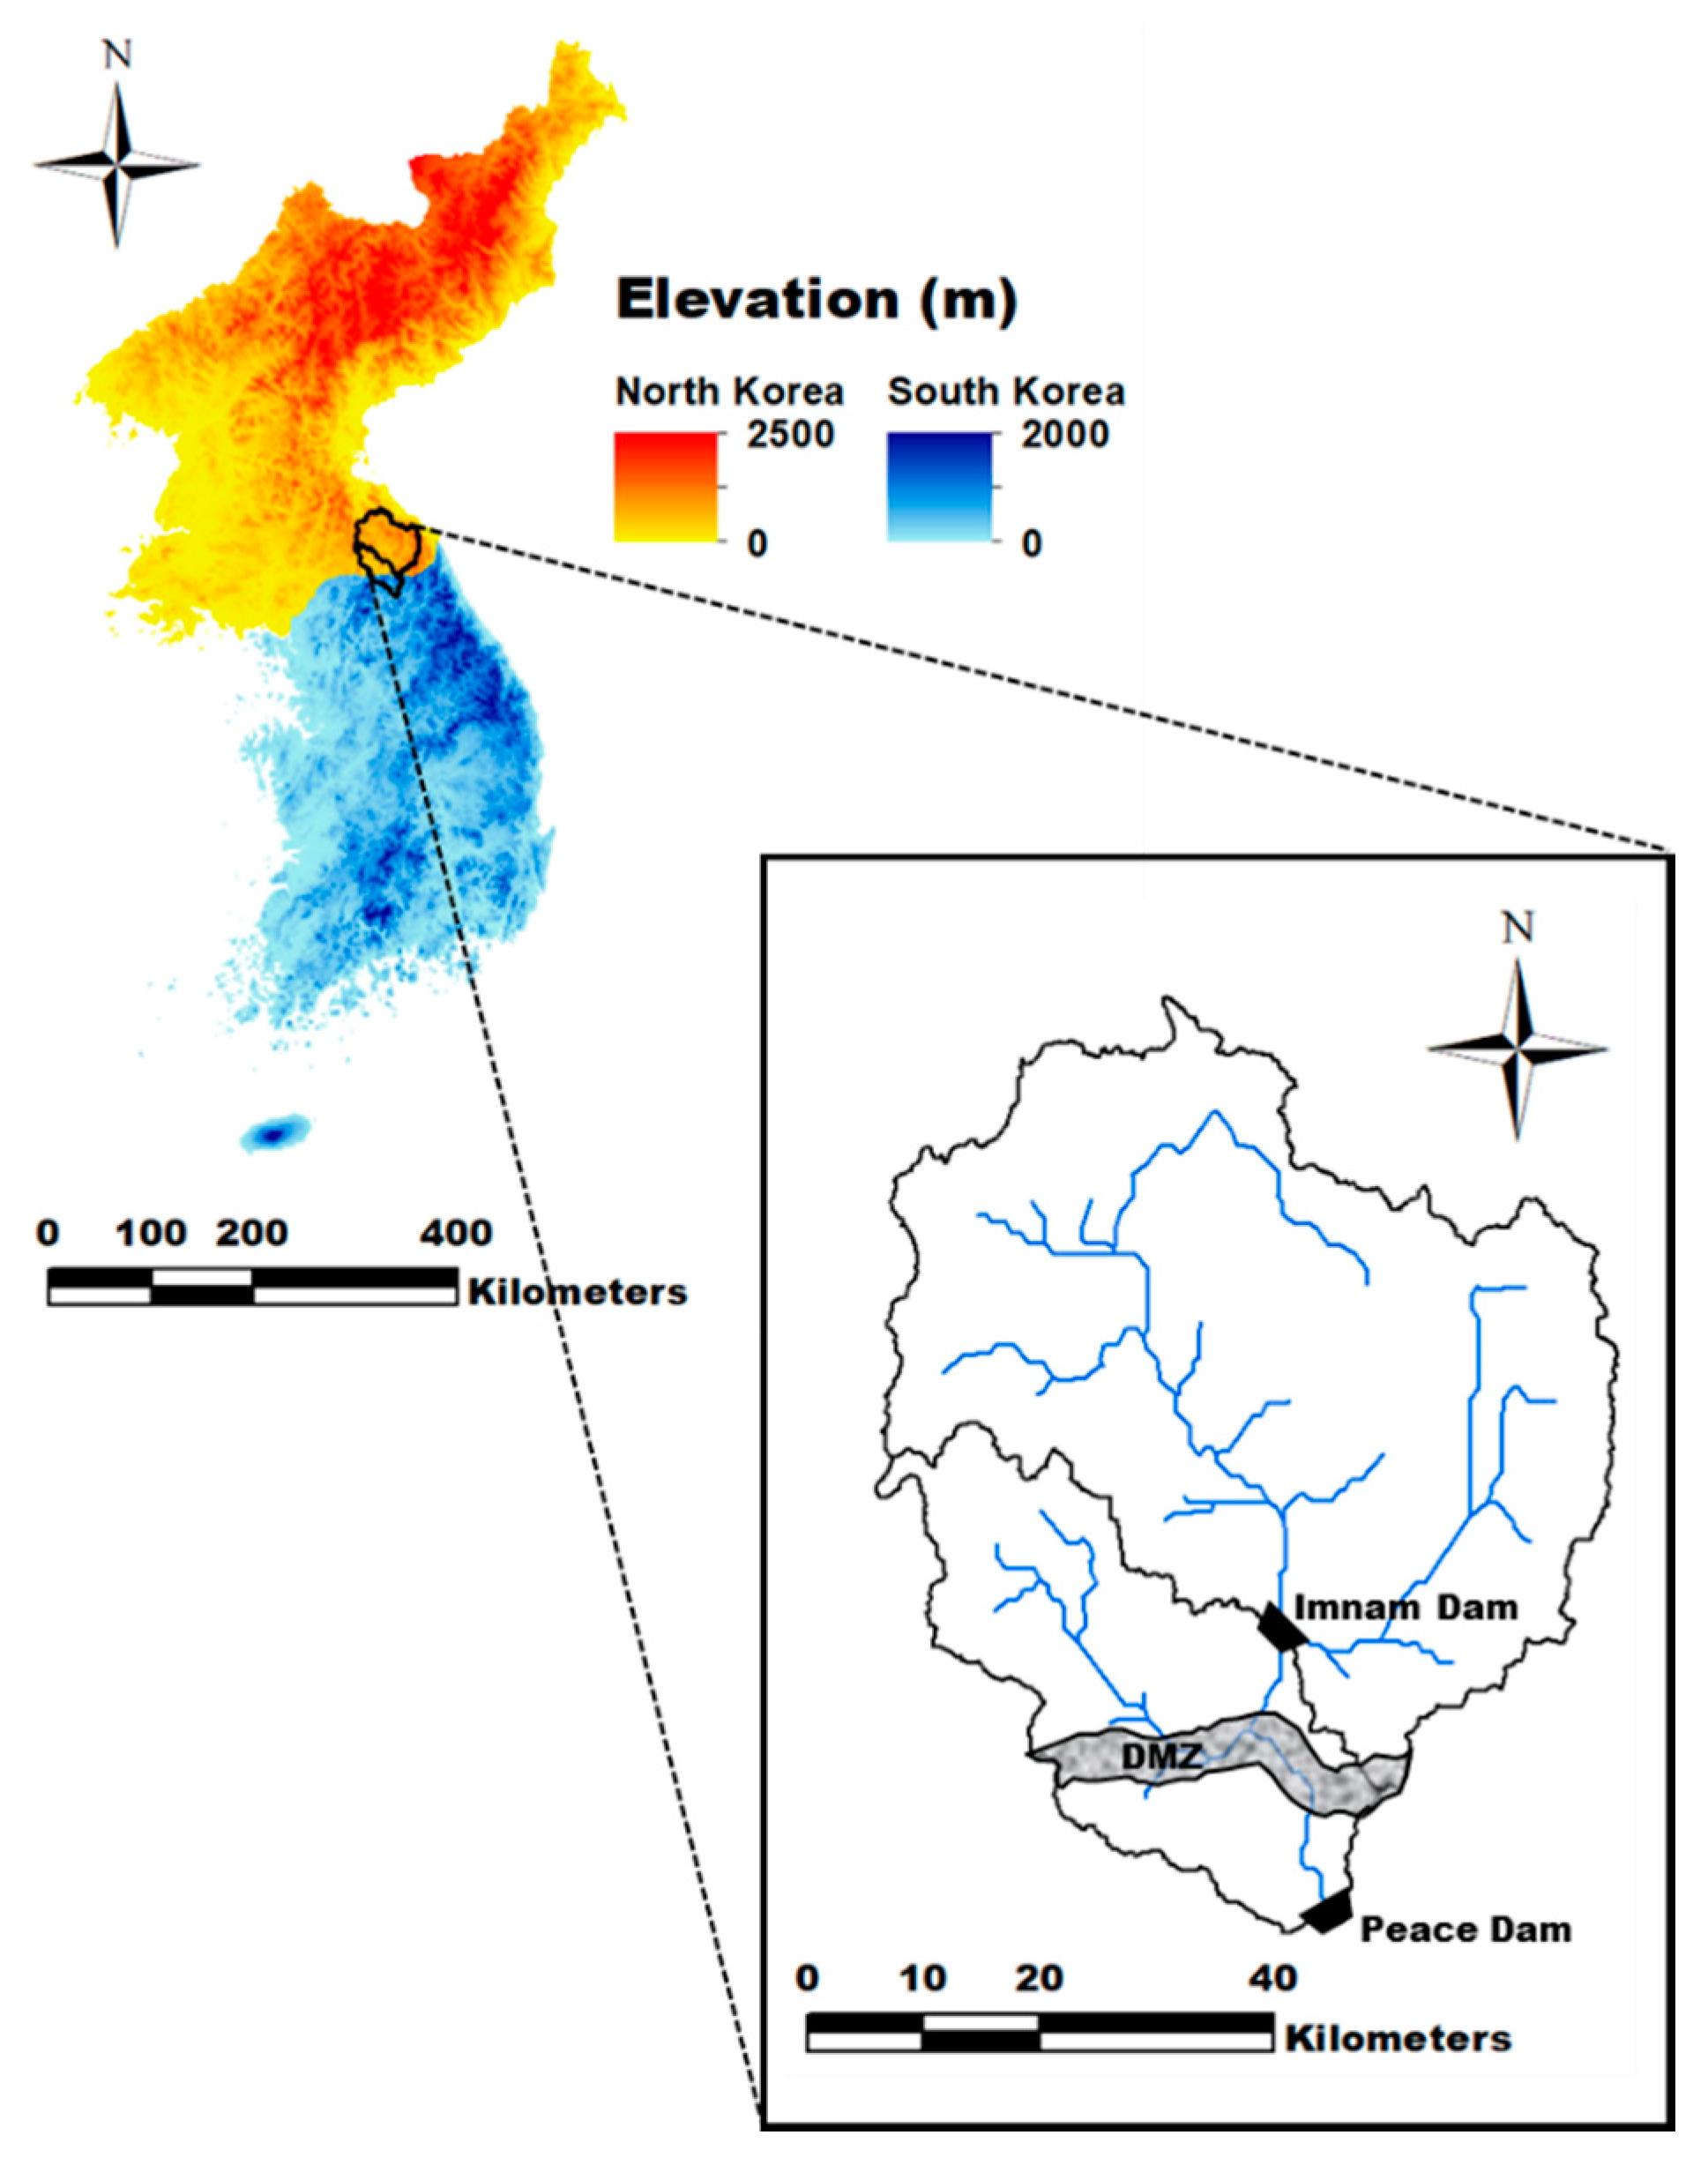
Figure 2.
The main body and the outlet of four spillway tunnels of the Peace Dam (The gate at the center of the dam is a trick art titled “The Gate to Reunification”). (a) Main body; (b) outlet of four spillway tunnels.
Figure 2.
The main body and the outlet of four spillway tunnels of the Peace Dam (The gate at the center of the dam is a trick art titled “The Gate to Reunification”). (a) Main body; (b) outlet of four spillway tunnels.

Figure 3.
Comparison of three reservoir operation methods (ROMs). The discharge is differently determined depending on the adopted ROM. (a) Auto ROM; (b) Technical ROM; (c) Rigid ROM.
Figure 3.
Comparison of three reservoir operation methods (ROMs). The discharge is differently determined depending on the adopted ROM. (a) Auto ROM; (b) Technical ROM; (c) Rigid ROM.
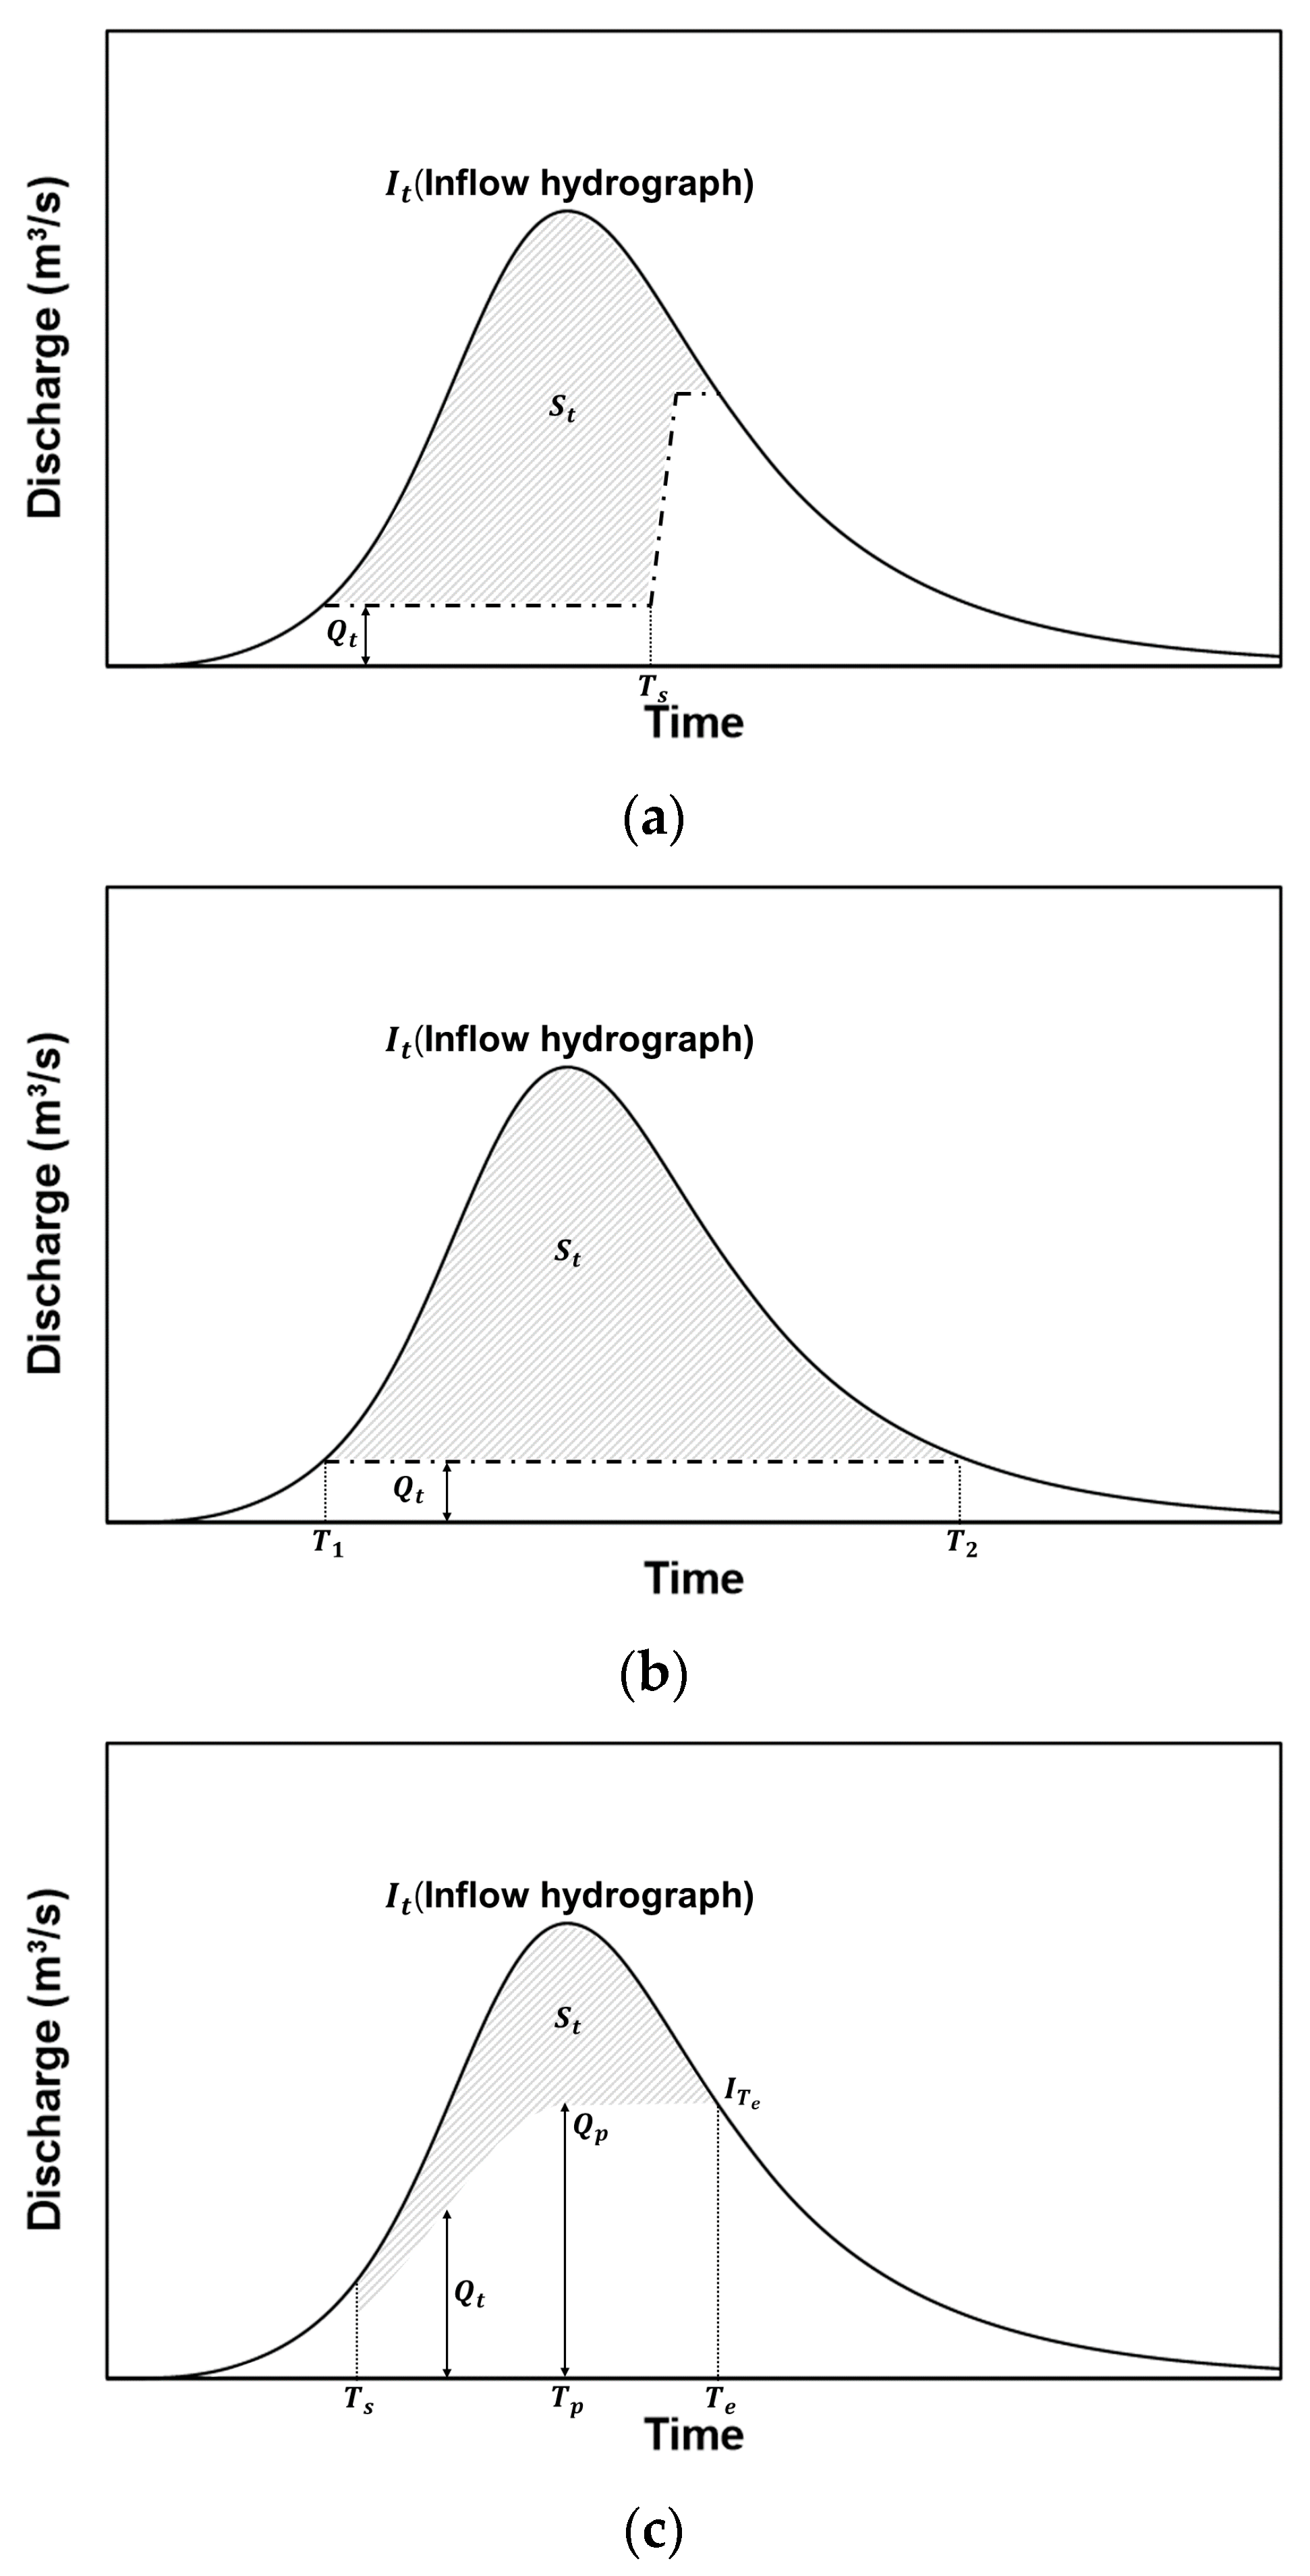
Figure 4.
One-hour unit hydrograph of the Peace Dam basin derived by applying the Clark watershed routing method.
Figure 4.
One-hour unit hydrograph of the Peace Dam basin derived by applying the Clark watershed routing method.

Figure 5.
The inflow hydrograph determined for the operation of Peace Dam, which was derived by applying the 200-year 72-h probable rainfall.
Figure 5.
The inflow hydrograph determined for the operation of Peace Dam, which was derived by applying the 200-year 72-h probable rainfall.

Figure 6.
Comparison of dam operation results (discharge and water level) with different C/F ratios and constant rates of the Rigid ROM. (a) C/F = 3 (RWL: EL. 260.9 m); (b) C/F = 5 (RWL: EL. 264.2 m); (c) C/F = 7 (RWL: EL. 265.6 m); (d) C/F = 9 (RWL: EL. 266.4 m).
Figure 6.
Comparison of dam operation results (discharge and water level) with different C/F ratios and constant rates of the Rigid ROM. (a) C/F = 3 (RWL: EL. 260.9 m); (b) C/F = 5 (RWL: EL. 264.2 m); (c) C/F = 7 (RWL: EL. 265.6 m); (d) C/F = 9 (RWL: EL. 266.4 m).
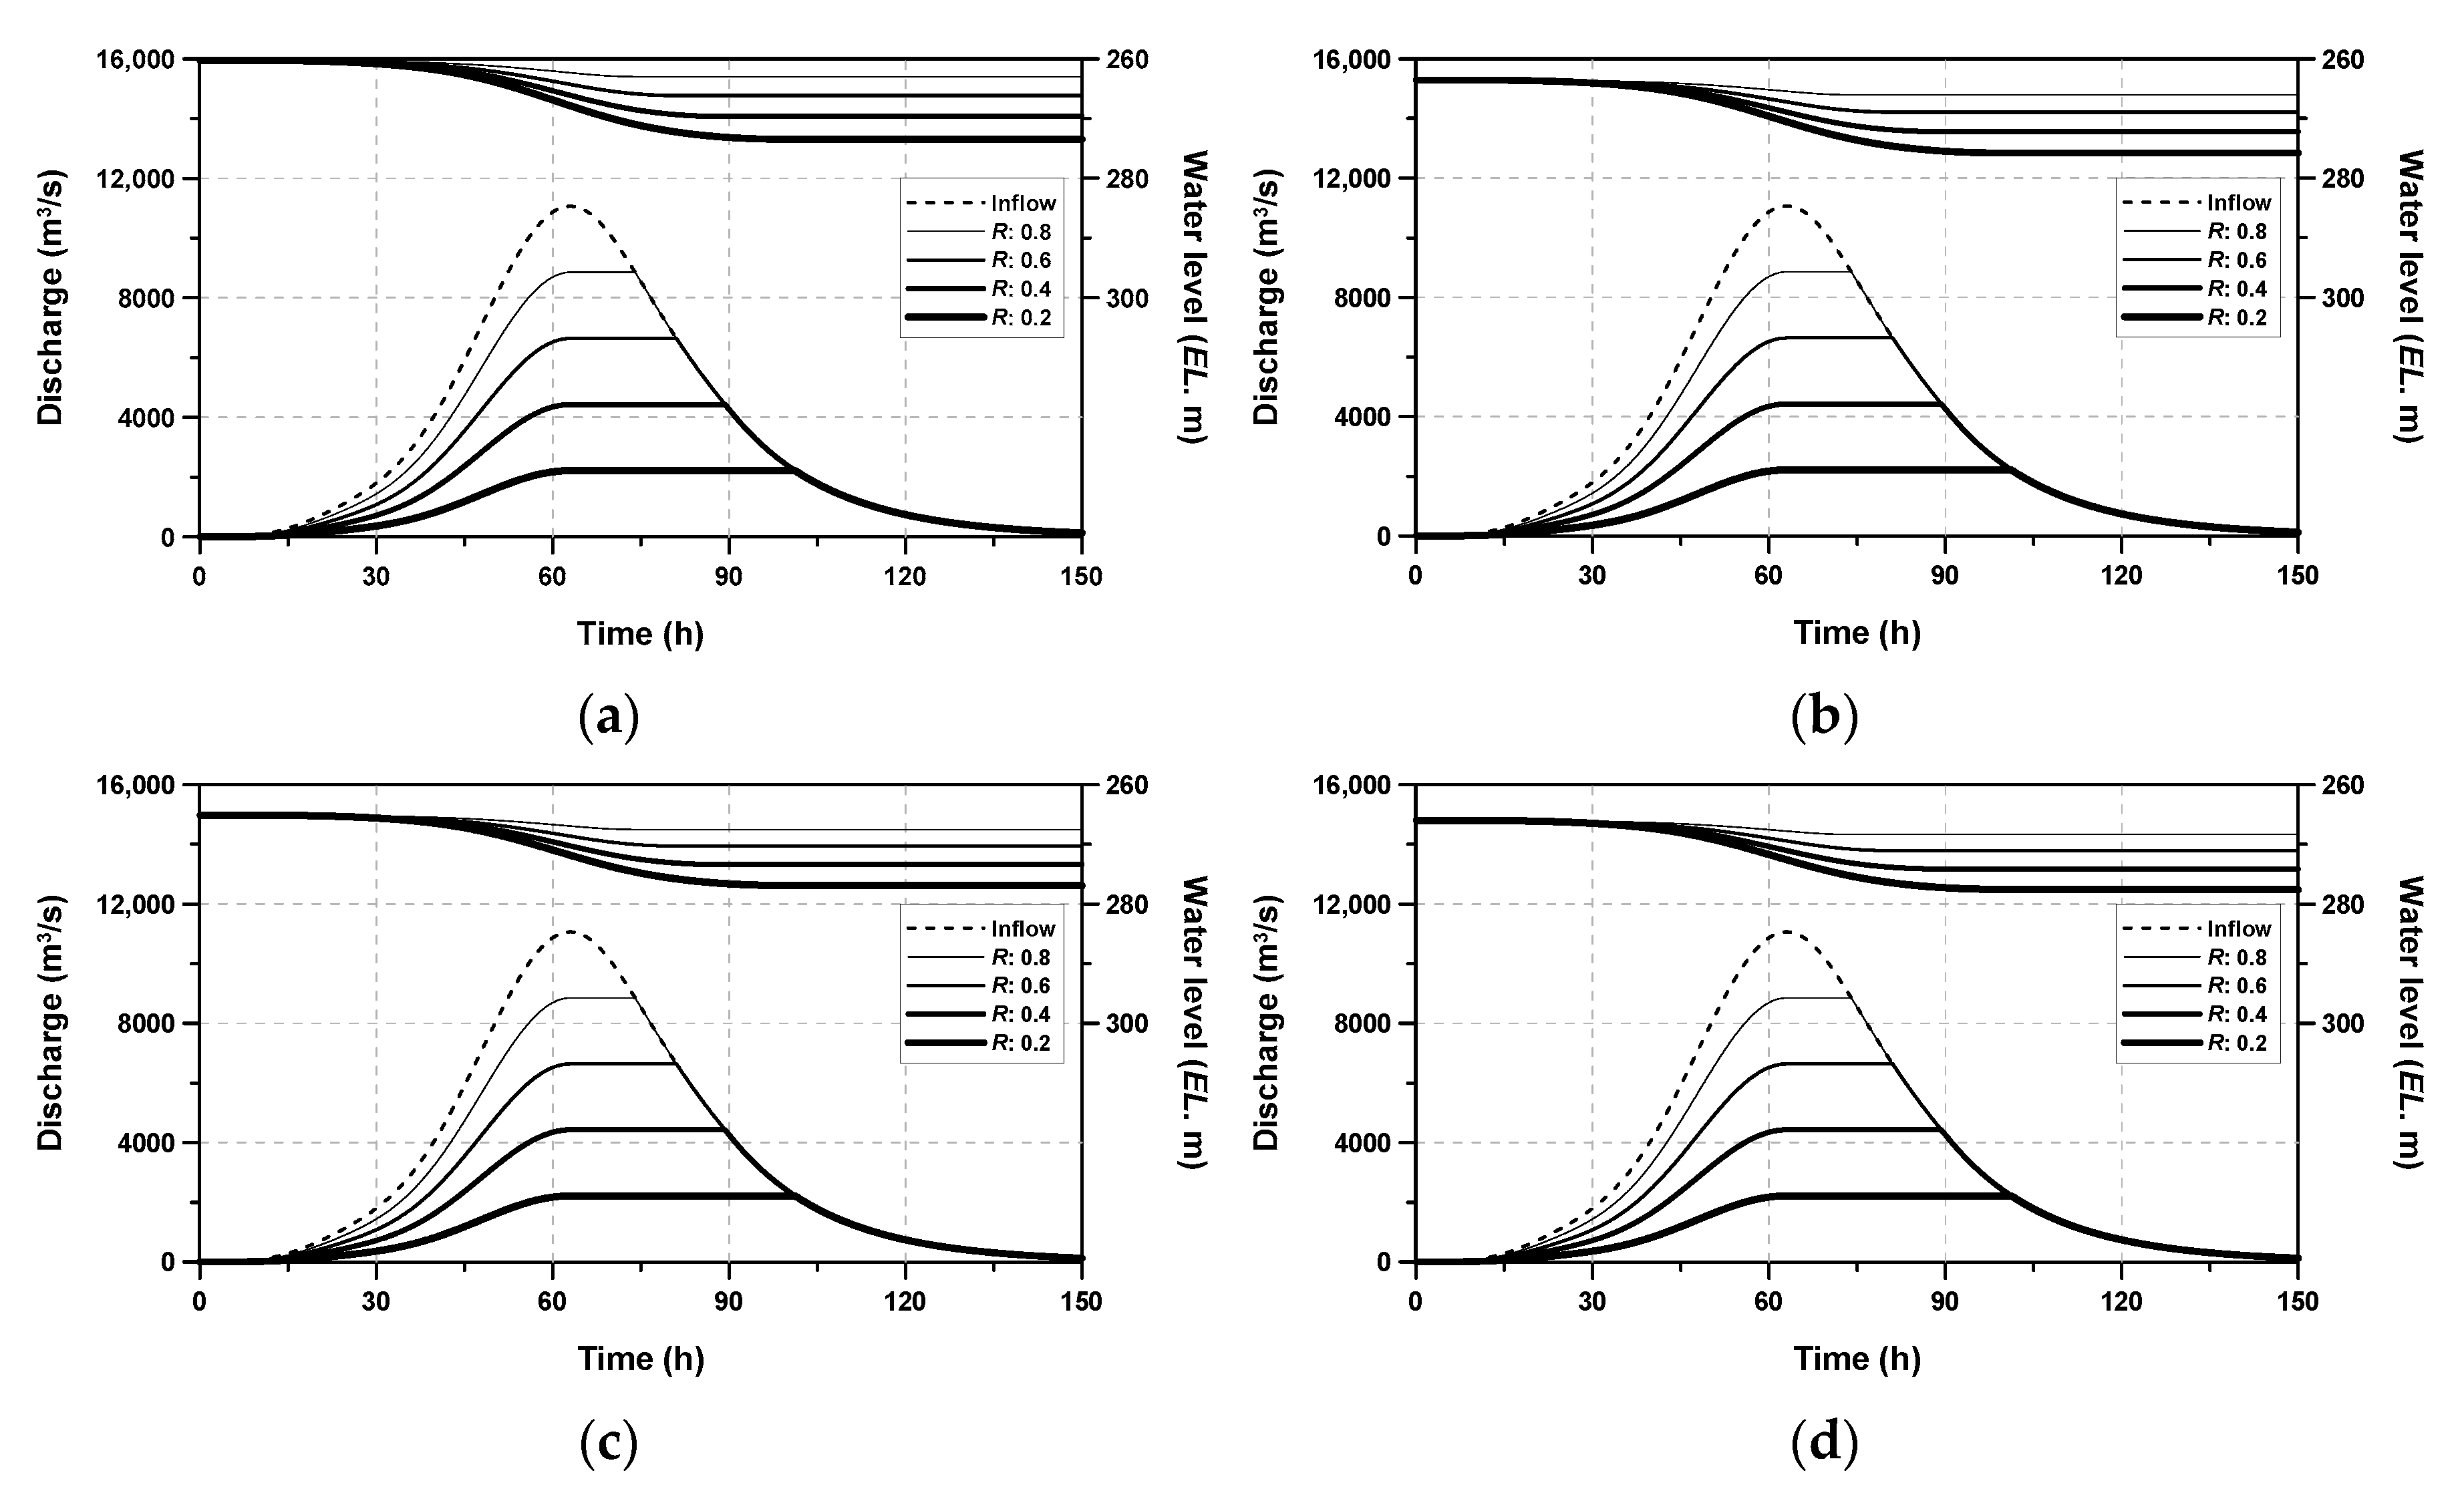
Figure 7.
Storage–discharge relations derived with different C/F ratios and constant rates of the Rigid ROM. (a) C/F = 3 (RWL: EL. 260.9 m); (b) C/F = 5 (RWL: EL. 264.2 m); (c) C/F = 7 (RWL: EL. 265.6 m); (d) C/F = 9 (RWL: EL. 266.4 m).
Figure 7.
Storage–discharge relations derived with different C/F ratios and constant rates of the Rigid ROM. (a) C/F = 3 (RWL: EL. 260.9 m); (b) C/F = 5 (RWL: EL. 264.2 m); (c) C/F = 7 (RWL: EL. 265.6 m); (d) C/F = 9 (RWL: EL. 266.4 m).
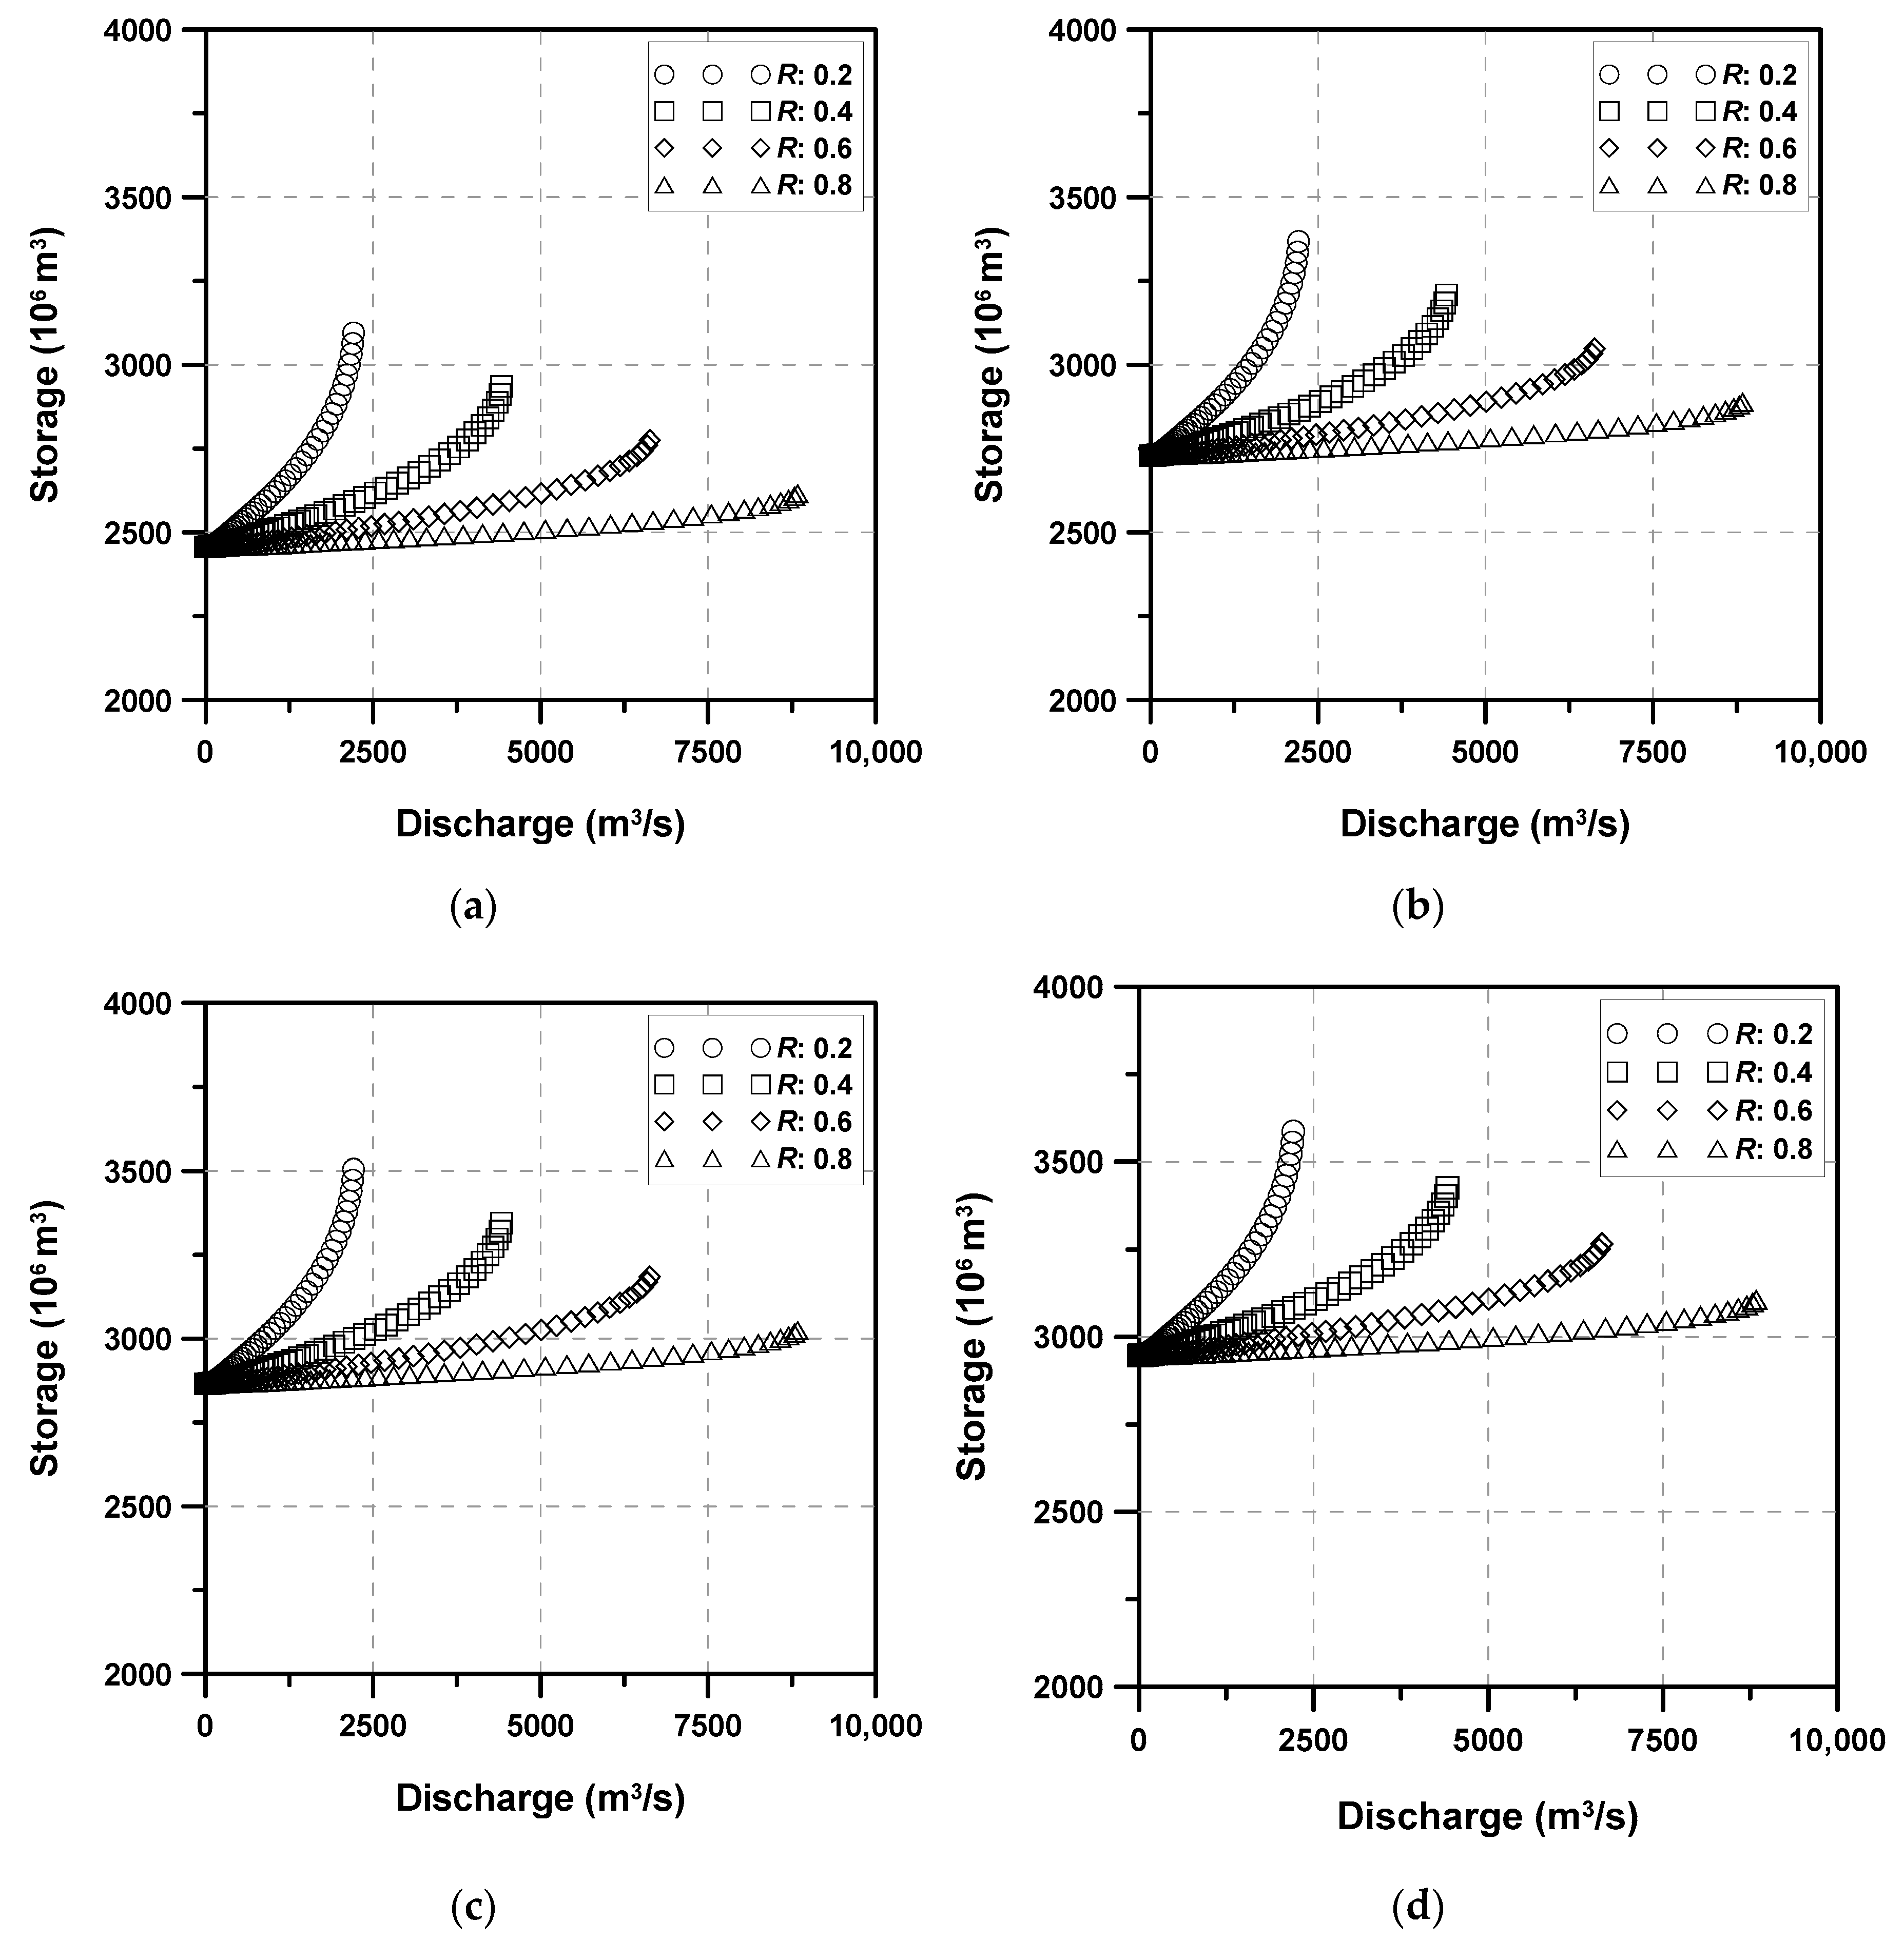
Figure 8.
Curve fitting result for the discharge-storage relation of the current Peace Dam.
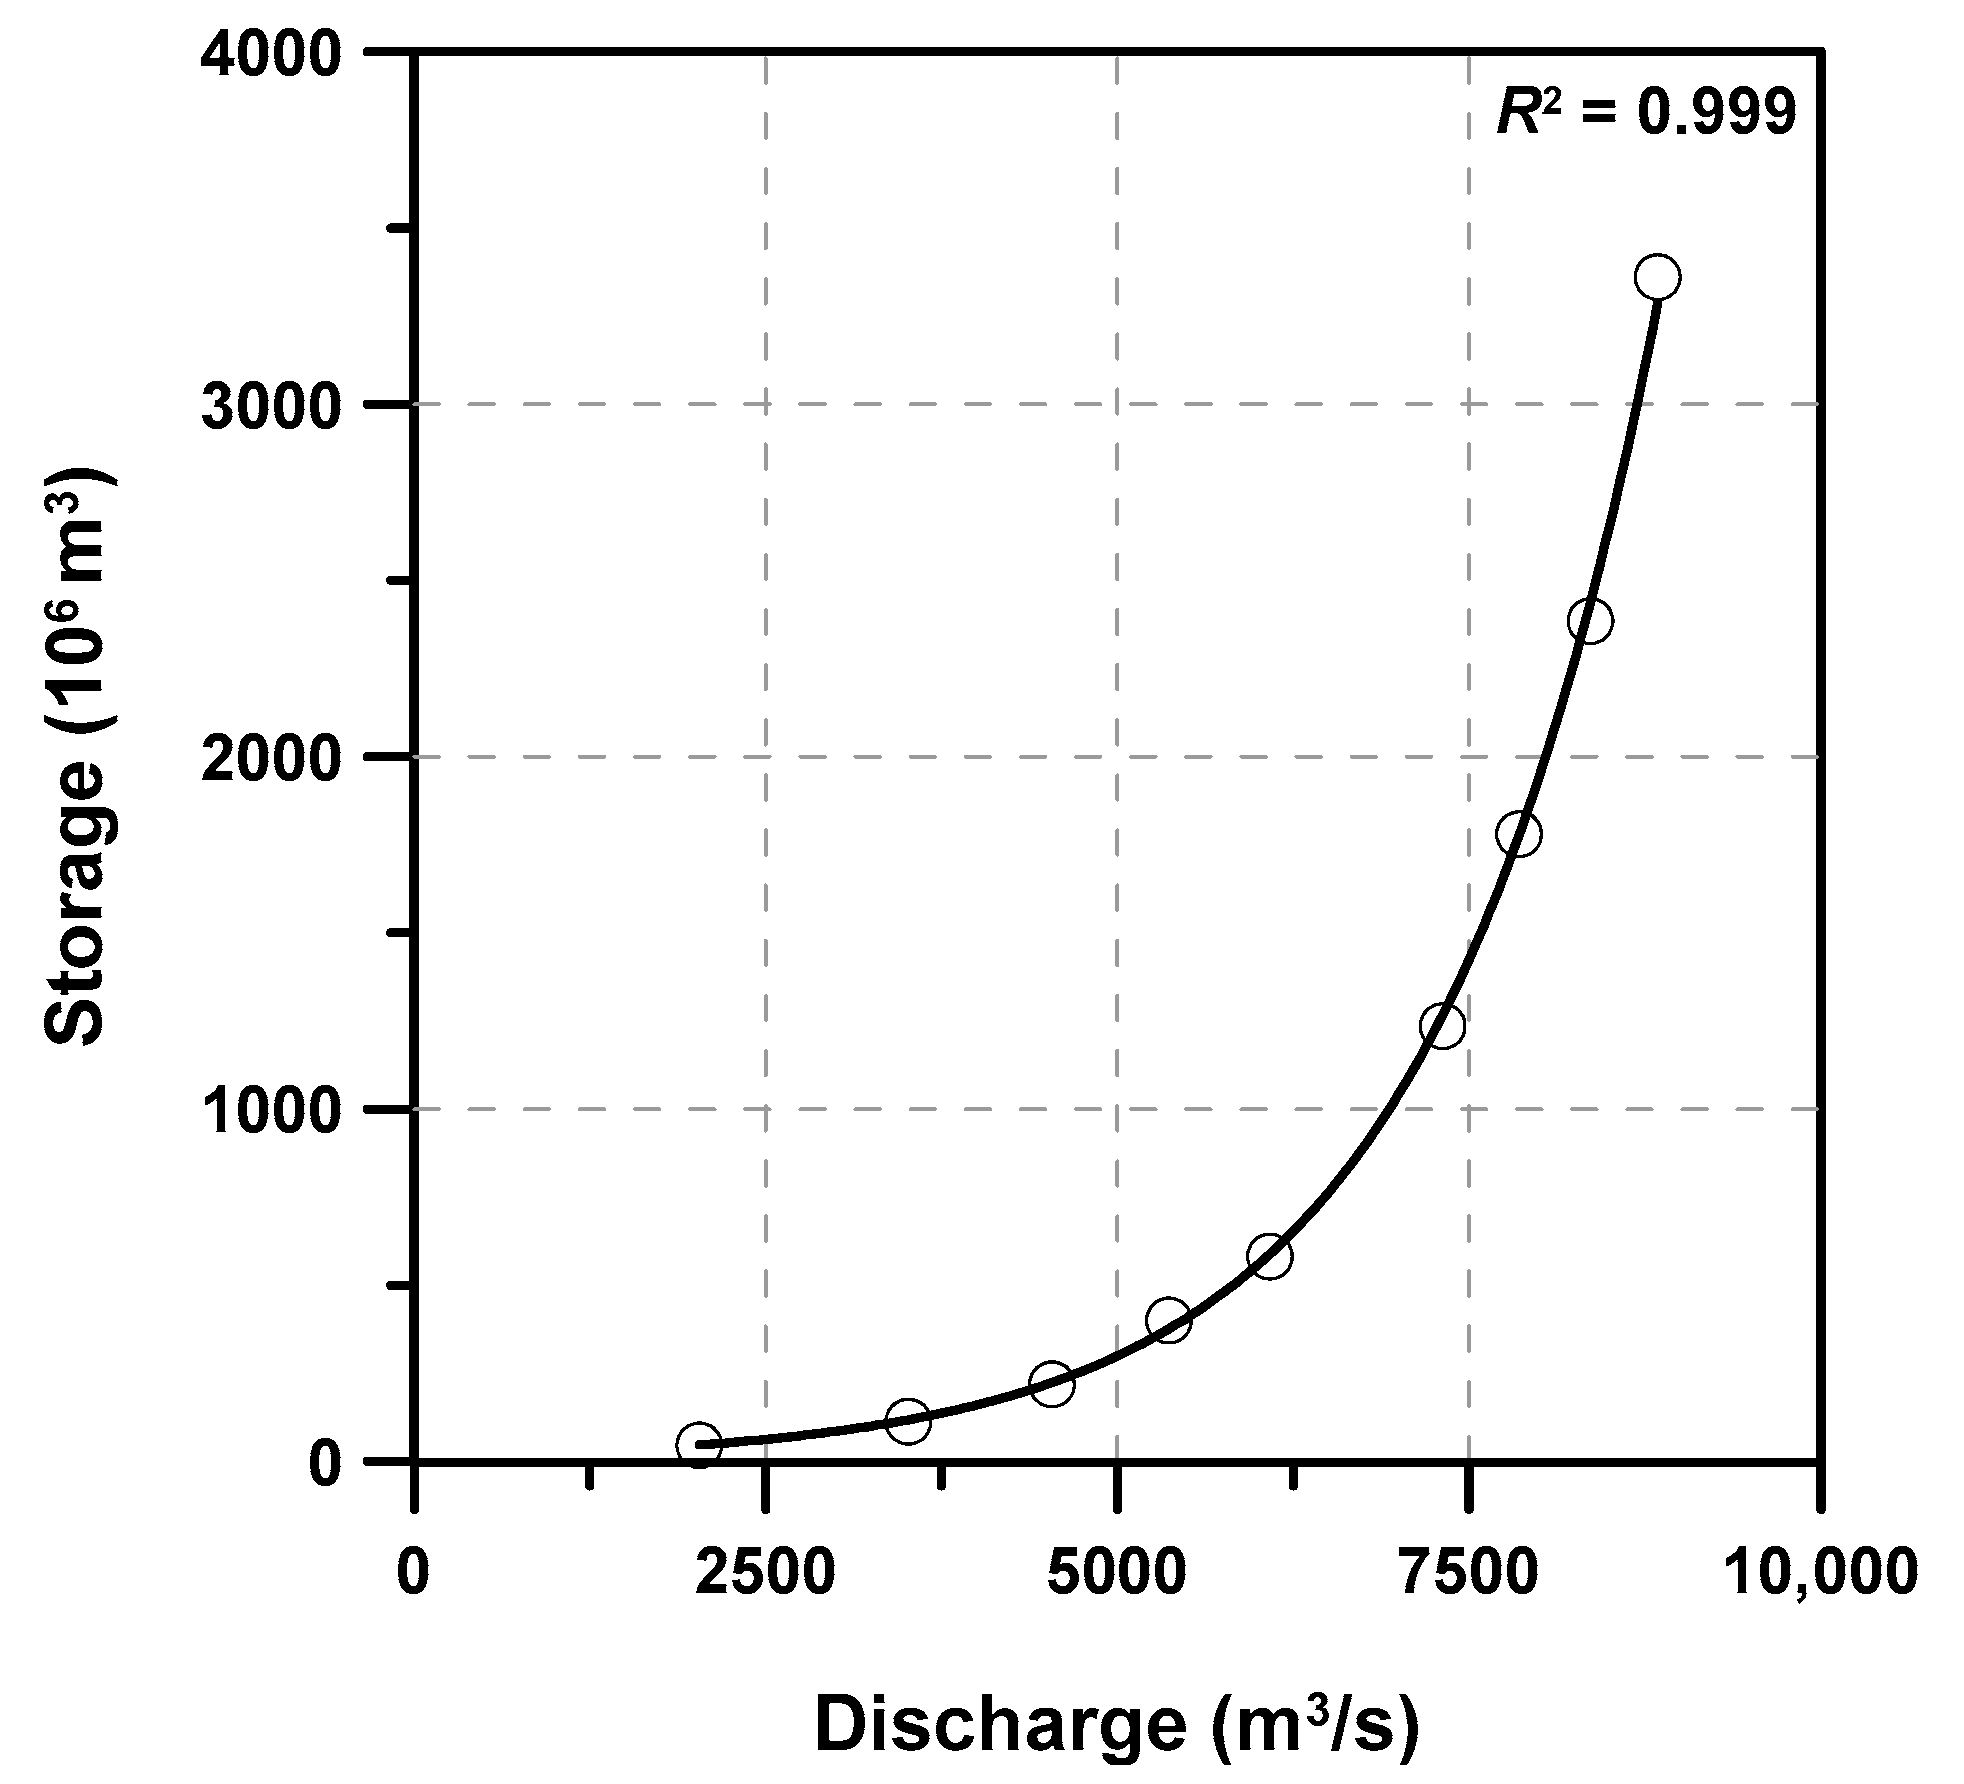
Figure 9.
Empirical relation for estimating the dam storage coefficient by [17] and its comparison to those cases considered in this study. (a) Yoo et al. [17]; (b) Cases in this study (the solid symbols represent the valid cases and the empty symbols non-valid ones based on the safety consideration of the Peace Dam).


Table 1.
Basic information of multi-purpose dams in Korea such as basin area, total storage, allocation of the water conservation storage and the flood control storage, reservoir operation method (ROM), and the constant rate for those dams operated by the Rigid ROM.
Table 1.
Basic information of multi-purpose dams in Korea such as basin area, total storage, allocation of the water conservation storage and the flood control storage, reservoir operation method (ROM), and the constant rate for those dams operated by the Rigid ROM.
| Dam | Basin Area (km2) | Total Storage (106 m3) | Water Conservation Storage (C) (106 m3) | Flood Control Storage (F) (106 m3) | C/F | Reservoir Operation Method (Constant Rate) |
|---|---|---|---|---|---|---|
| Chungju | 6648.0 | 2750.0 | 1789.0 | 616.0 | 2.9 | SRC |
| Daecheong | 3204.0 | 1490.0 | 790.0 | 250.0 | 3.2 | Rigid (0.550) |
| Soyanggang | 2703.0 | 2900.0 | 1900.0 | 770.0 | 2.5 | Rigid (0.519) |
| Namgang | 2285.0 | 309.2 | 299.7 | 269.8 | 1.1 | Empirical |
| Andong | 1584.0 | 1248.0 | 1000.0 | 110.0 | 9.1 | Rigid (0.500) |
| Imha | 1361.0 | 595.0 | 424.0 | 80.0 | 5.3 | Rigid (0.540) |
| Juam | 1010.0 | 457.0 | 352.0 | 60.0 | 5.9 | Rigid (0.645) |
| Yongdam | 930.0 | 815.0 | 672.5 | 137.0 | 4.9 | Rigid (0.560) |
| Hapcheon | 925.0 | 790.0 | 560.0 | 80.0 | 7.0 | Rigid (0.300) |
| Seomjingang | 763.0 | 466.0 | 429.0 | 32.0 | 13.4 | Rigid (0.602) |
| Heongseong | 209.0 | 86.9 | 73.4 | 9.5 | 7.7 | Rigid (0.700) |
| Jangheung | 193.0 | 191.0 | 171.0 | 8.0 | 21.4 | Empirical |
| Boryeong | 163.6 | 116.9 | 108.7 | 10.0 | 10.9 | Rigid (0.586) |
| Milyang | 95.4 | 73.6 | 69.8 | 6.0 | 11.6 | Rigid (0.454) |
| Gunwi | 87.5 | 48.7 | 40.1 | 3.1 | 12.9 | Rigid (0.683) |
| Buhang | 82.0 | 54.3 | 42.6 | 12.3 | 3.5 | Rigid (0.303) |
| Buan | 59.0 | 50.3 | 35.6 | 9.3 | 3.8 | Empirical |
| Seongdeok | 41.3 | 27.9 | 24.8 | 4.2 | 5.9 | Empirical |
| Bohyeonsan | 32.6 | 22.1 | 17.9 | 3.5 | 5.1 | Empirical |
Table 2.
Water conservation storage and flood control storage depending calculated by applying the assumed C/F ratio.
Table 2.
Water conservation storage and flood control storage depending calculated by applying the assumed C/F ratio.
| Case | RWL 1 (EL. m) | Total Storage (106 m3) | Water Conservation (106 m3) | Flood Control (106 m3) |
|---|---|---|---|---|
| LWL 2 (C/F 3 = 0) | 159.5 | 3275.4 | 0.0 | 3275.4 |
| C/F = 3 | 260.9 | 2456.6 | 818.9 | |
| C/F = 5 | 264.2 | 2729.5 | 545.9 | |
| C/F = 7 | 265.6 | 2866.0 | 409.4 | |
| C/F = 9 | 266.4 | 2947.9 | 327.5 | |
| FWL 4 (C/F = ∞) | 269.3 | 3275.4 | 0.0 |
1 restricted water level; 2 low water level; 3 water conservation storage divided by flood control storage; 4 flood water level.
Table 3.
Simulation results of peak water level and peak discharge of the Peace Dam depending on the rainfall duration.
Table 3.
Simulation results of peak water level and peak discharge of the Peace Dam depending on the rainfall duration.
| Rainfall Duration (h) | Peak Inflow (m3/s) | Peak Water Level (EL. m) | Peak Discharge (m3/s) |
|---|---|---|---|
| 12 | 6371.6 | 195.3 | 4148.5 |
| 24 | 9571.2 | 207.6 | 5164.5 |
| 48 | 11,466.1 | 219.0 | 6014.0 |
| 72 | 11,065.6 | 221.9 | 6211.9 |
| 84 | 10,513.8 | 221.2 | 6164.6 |
| 96 | 9962.8 | 220.3 | 6106.6 |
Table 4.
Fitting results (parameters and , dam storage coefficient and coefficient of determination ) of the nonlinear reservoir model to the simulated storage–discharge relations.
Table 4.
Fitting results (parameters and , dam storage coefficient and coefficient of determination ) of the nonlinear reservoir model to the simulated storage–discharge relations.
| Case | Fitting Results | Constant Rate | |||
|---|---|---|---|---|---|
| 0.2 | 0.4 | 0.6 | 0.8 | ||
| C/F = 3 | 2,442,473,864.0 | 2,445,581,238.0 | 2,448,956,082.0 | 2,452,620,675.0 | |
| 0.000000021021 | 0.000000008004 | 0.000000003614 | 0.000000001377 | ||
| 51.3 | 19.6 | 8.9 | 3.4 | ||
| 88.3 | 33.7 | 15.2 | 5.8 | ||
| 0.985 | 0.983 | 0.982 | 0.981 | ||
| C/F = 5 | 2,715,151,198.0 | 2,718,349,626.0 | 2,721,794,526.0 | 2,725,504,455.0 | |
| 0.000000019034 | 0.000000007238 | 0.000000003263 | 0.000000001242 | ||
| 51.7 | 19.7 | 8.9 | 3.4 | ||
| 88.9 | 33.8 | 15.3 | 5.8 | ||
| 0.984 | 0.983 | 0.982 | 0.981 | ||
| C/F = 7 | 2,851,554,317.0 | 2,854,792,554.0 | 2,858,267,928.0 | 2,861,997,473.0 | |
| 0.000000018175 | 0.000000006907 | 0.000000003112 | 0.000000001183 | ||
| 51.8 | 19.7 | 8.9 | 3.4 | ||
| 89.1 | 33.9 | 15.3 | 5.8 | ||
| 0.984 | 0.983 | 0.982 | 0.980 | ||
| C/F = 9 | 2,933,400,121.0 | 2,936,660,679.0 | 2,940,153,098.0 | 2,943,893,586.0 | |
| 0.000000017696 | 0.000000006723 | 0.000000003028 | 0.000000001151 | ||
| 51.9 | 19.7 | 8.9 | 3.4 | ||
| 89.3 | 34.0 | 15.3 | 5.8 | ||
| 0.984 | 0.983 | 0.982 | 0.980 | ||
© 2020 by the authors. Licensee MDPI, Basel, Switzerland. This article is an open access article distributed under the terms and conditions of the Creative Commons Attribution (CC BY) license (http://creativecommons.org/licenses/by/4.0/).
Share and Cite
MDPI and ACS Style
Yoo, C.; Shin, H.; Lee, J. Evaluation of the Storage Effect Considering Possible Redevelopment Options of the Peace Dam in South Korea. Water 2020, 12, 1674. https://doi.org/10.3390/w12061674
AMA Style
Yoo C, Shin H, Lee J. Evaluation of the Storage Effect Considering Possible Redevelopment Options of the Peace Dam in South Korea. Water. 2020; 12(6):1674. https://doi.org/10.3390/w12061674
Chicago/Turabian StyleYoo, Chulsang, Hyunsun Shin, and Jinwook Lee. 2020. "Evaluation of the Storage Effect Considering Possible Redevelopment Options of the Peace Dam in South Korea" Water 12, no. 6: 1674. https://doi.org/10.3390/w12061674
Note that from the first issue of 2016, this journal uses article numbers instead of page numbers. See further details here.