Yerba Mate (Ilex paraguarensis) as Bio-Adsorbent for the Removal of Methylene Blue, Remazol Brilliant Blue and Chromium Hexavalent: Thermodynamic and Kinetic Studies

 , , ,
, , ,  , and
, and
Abstract
:1. Introduction
2. Materials and Methods
2.1. Material Preparation and Characterization
2.1.1. Bio-Adsorbent Preparation
2.1.2. Chemicals
2.1.3. Analysis
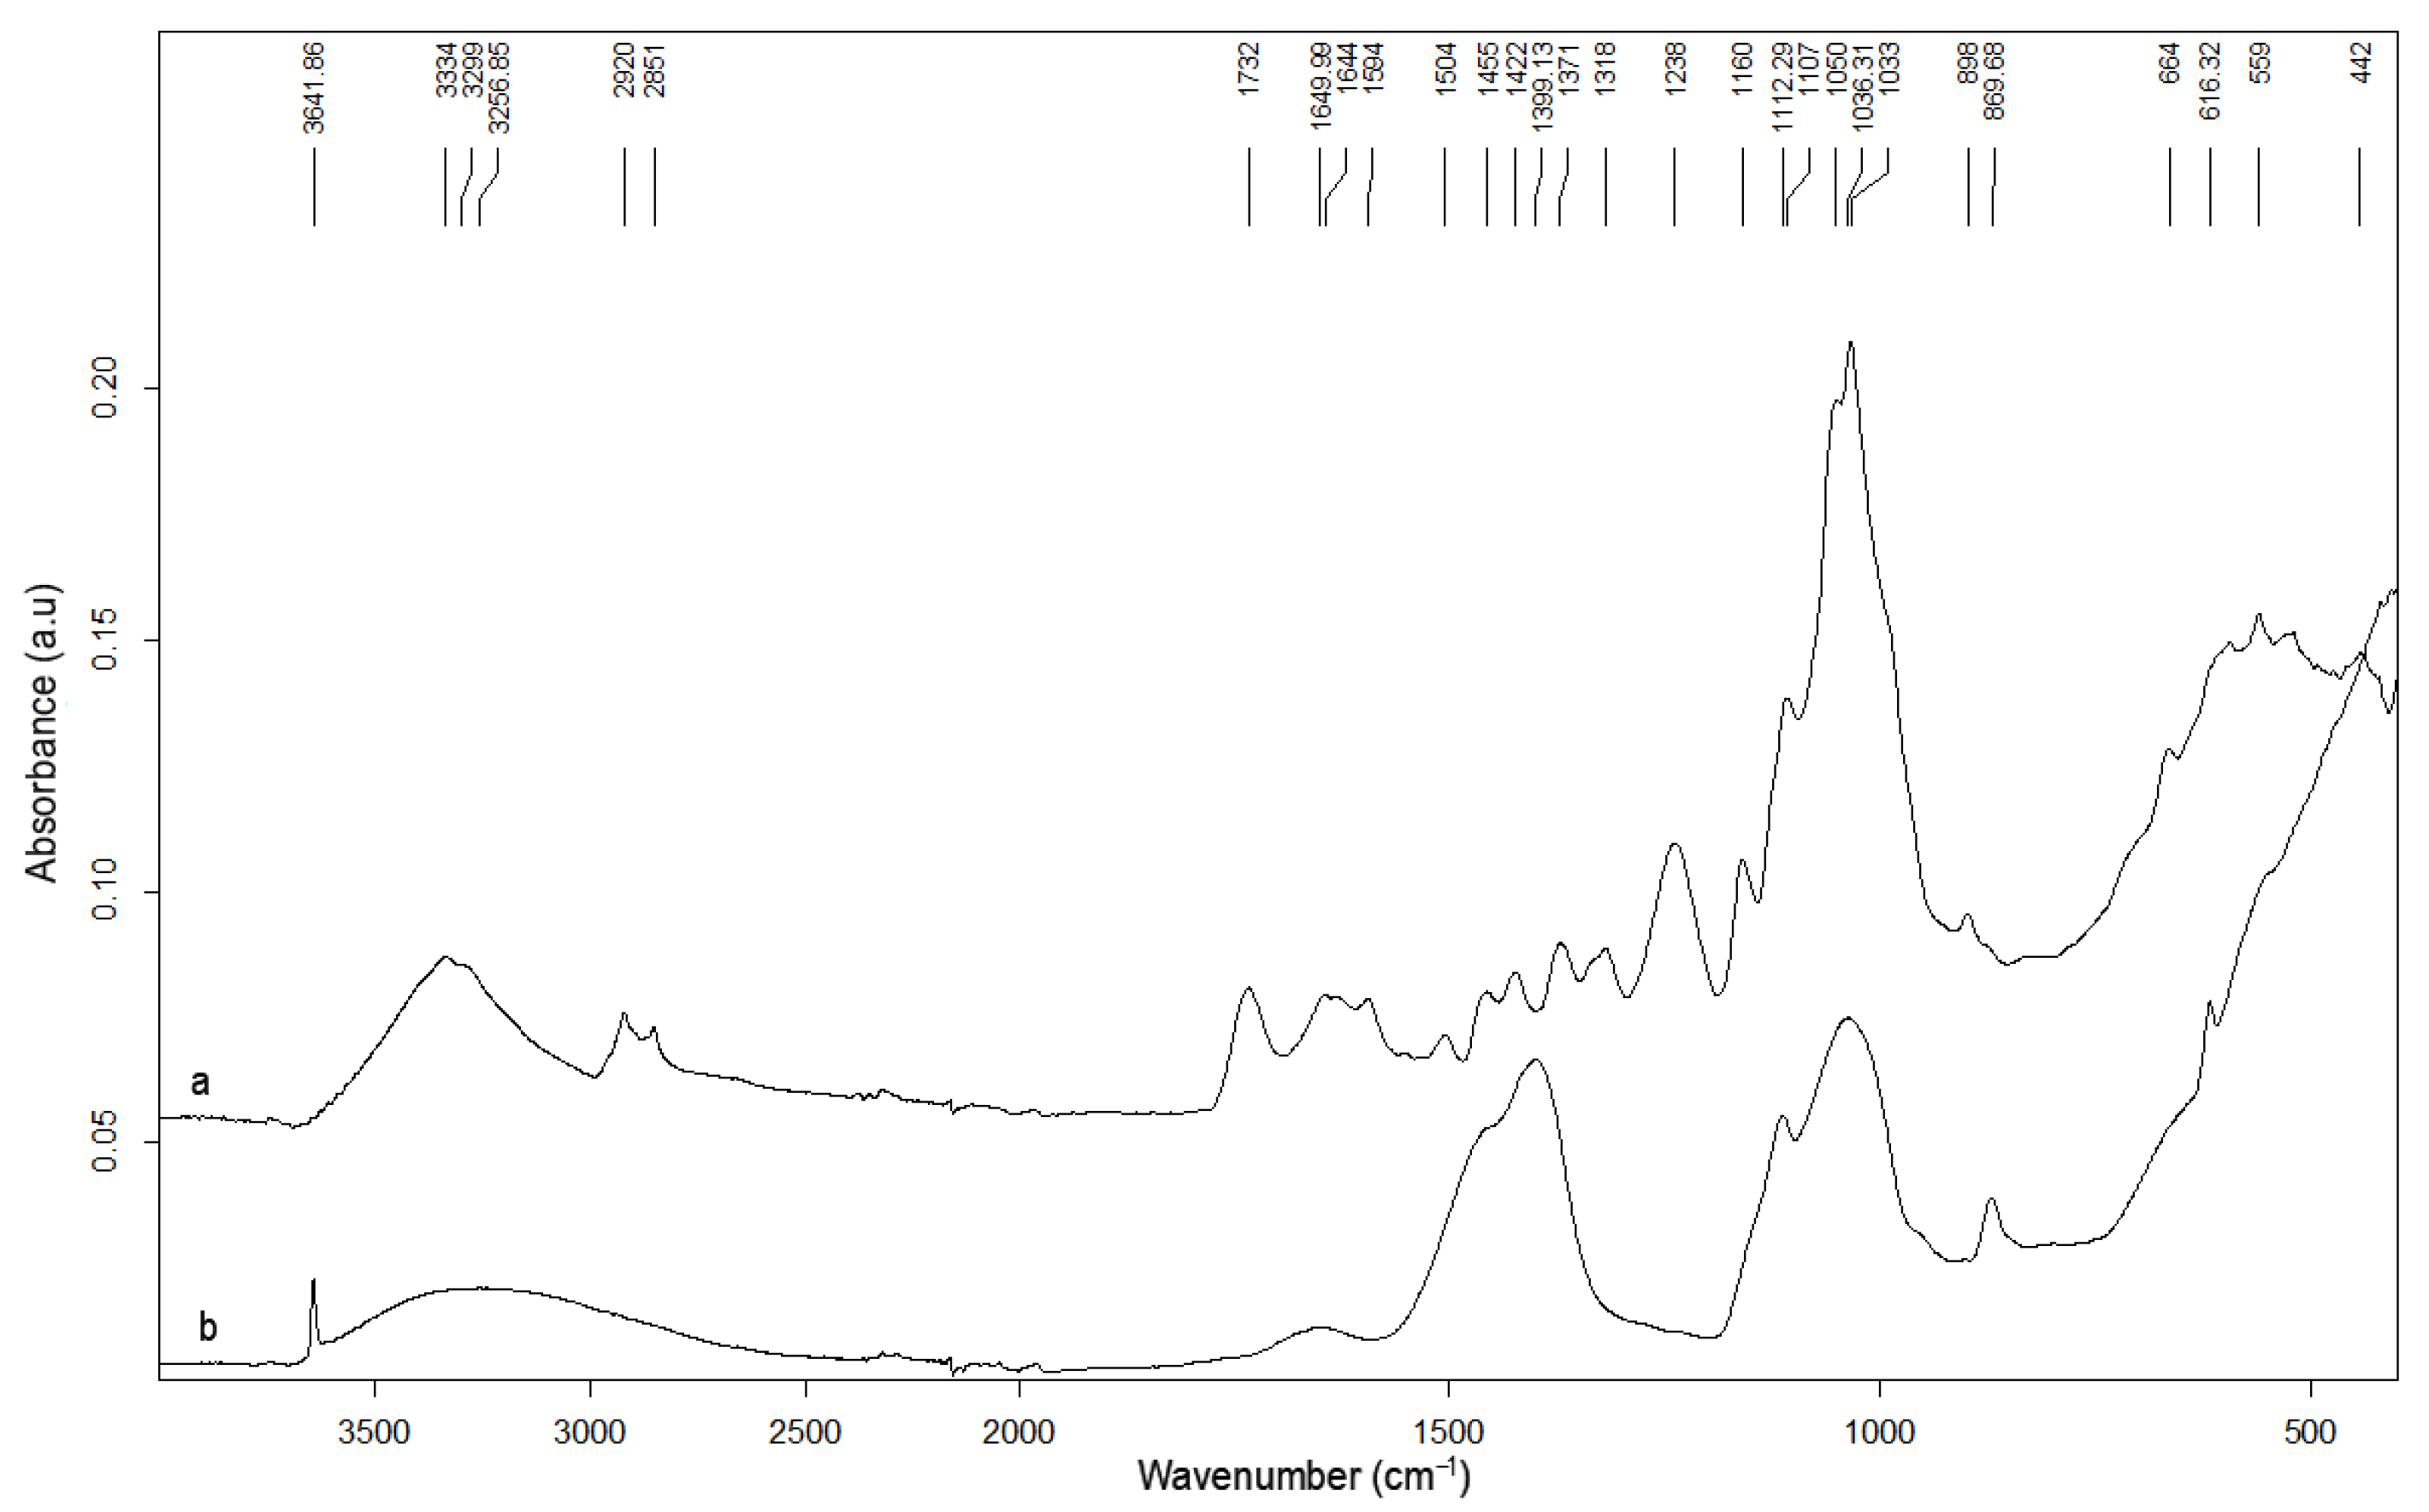
2.1.4. YM Characterization
2.2. Adsorption Tests
2.3. MB Adsorption Batch Tests Using YM
2.3.1. Isotherm and Thermodynamic Studies
2.3.2. Kinetic Studies
- Perfect mixing conditions of the solid/liquid mixture;
- Homogeneous concentration of MB adsorbed through the solid particle:where q is the volume-averaged amount of MB adsorbed per mass of adsorbent (mg/g).q = qe
- The mass rate of MB from the liquid to the solid phase is described by Equation (7), written below:where F is the mass transfer rate (mg/min), kC is the LDF mass transfer coefficient (dm/min), α is the specific surface area of the adsorbent (YM), set equal to 0.108 dm2/mg, as reported in Table 1, xs is the bio-adsorbent concentration (mg/L), CMB is the concentration of MB in the liquid bulk (mg/L), C*MB,e is the MB concentration of a hypothetic liquid phase in equilibrium with the “bulk“ of the solid phase (mg/L) and V is the liquid volume (L).F = kC α xs (CMB − C*MB,e) V
- The system at equilibrium is well represented by the Langmuir isotherm.
- The product of the Langmuir constant (b) and the concentration at equilibrium of MB in the hypothetic liquid solution (C*MB,e) satisfies the condition b C*MB,e ≪ 1, leading to the simplification being verified when the discussing the results.qe = (qmax b C*MB,e)/(1 + b C*MB,e) ≈ qmax b C*MB,e
3. Results and Discussion
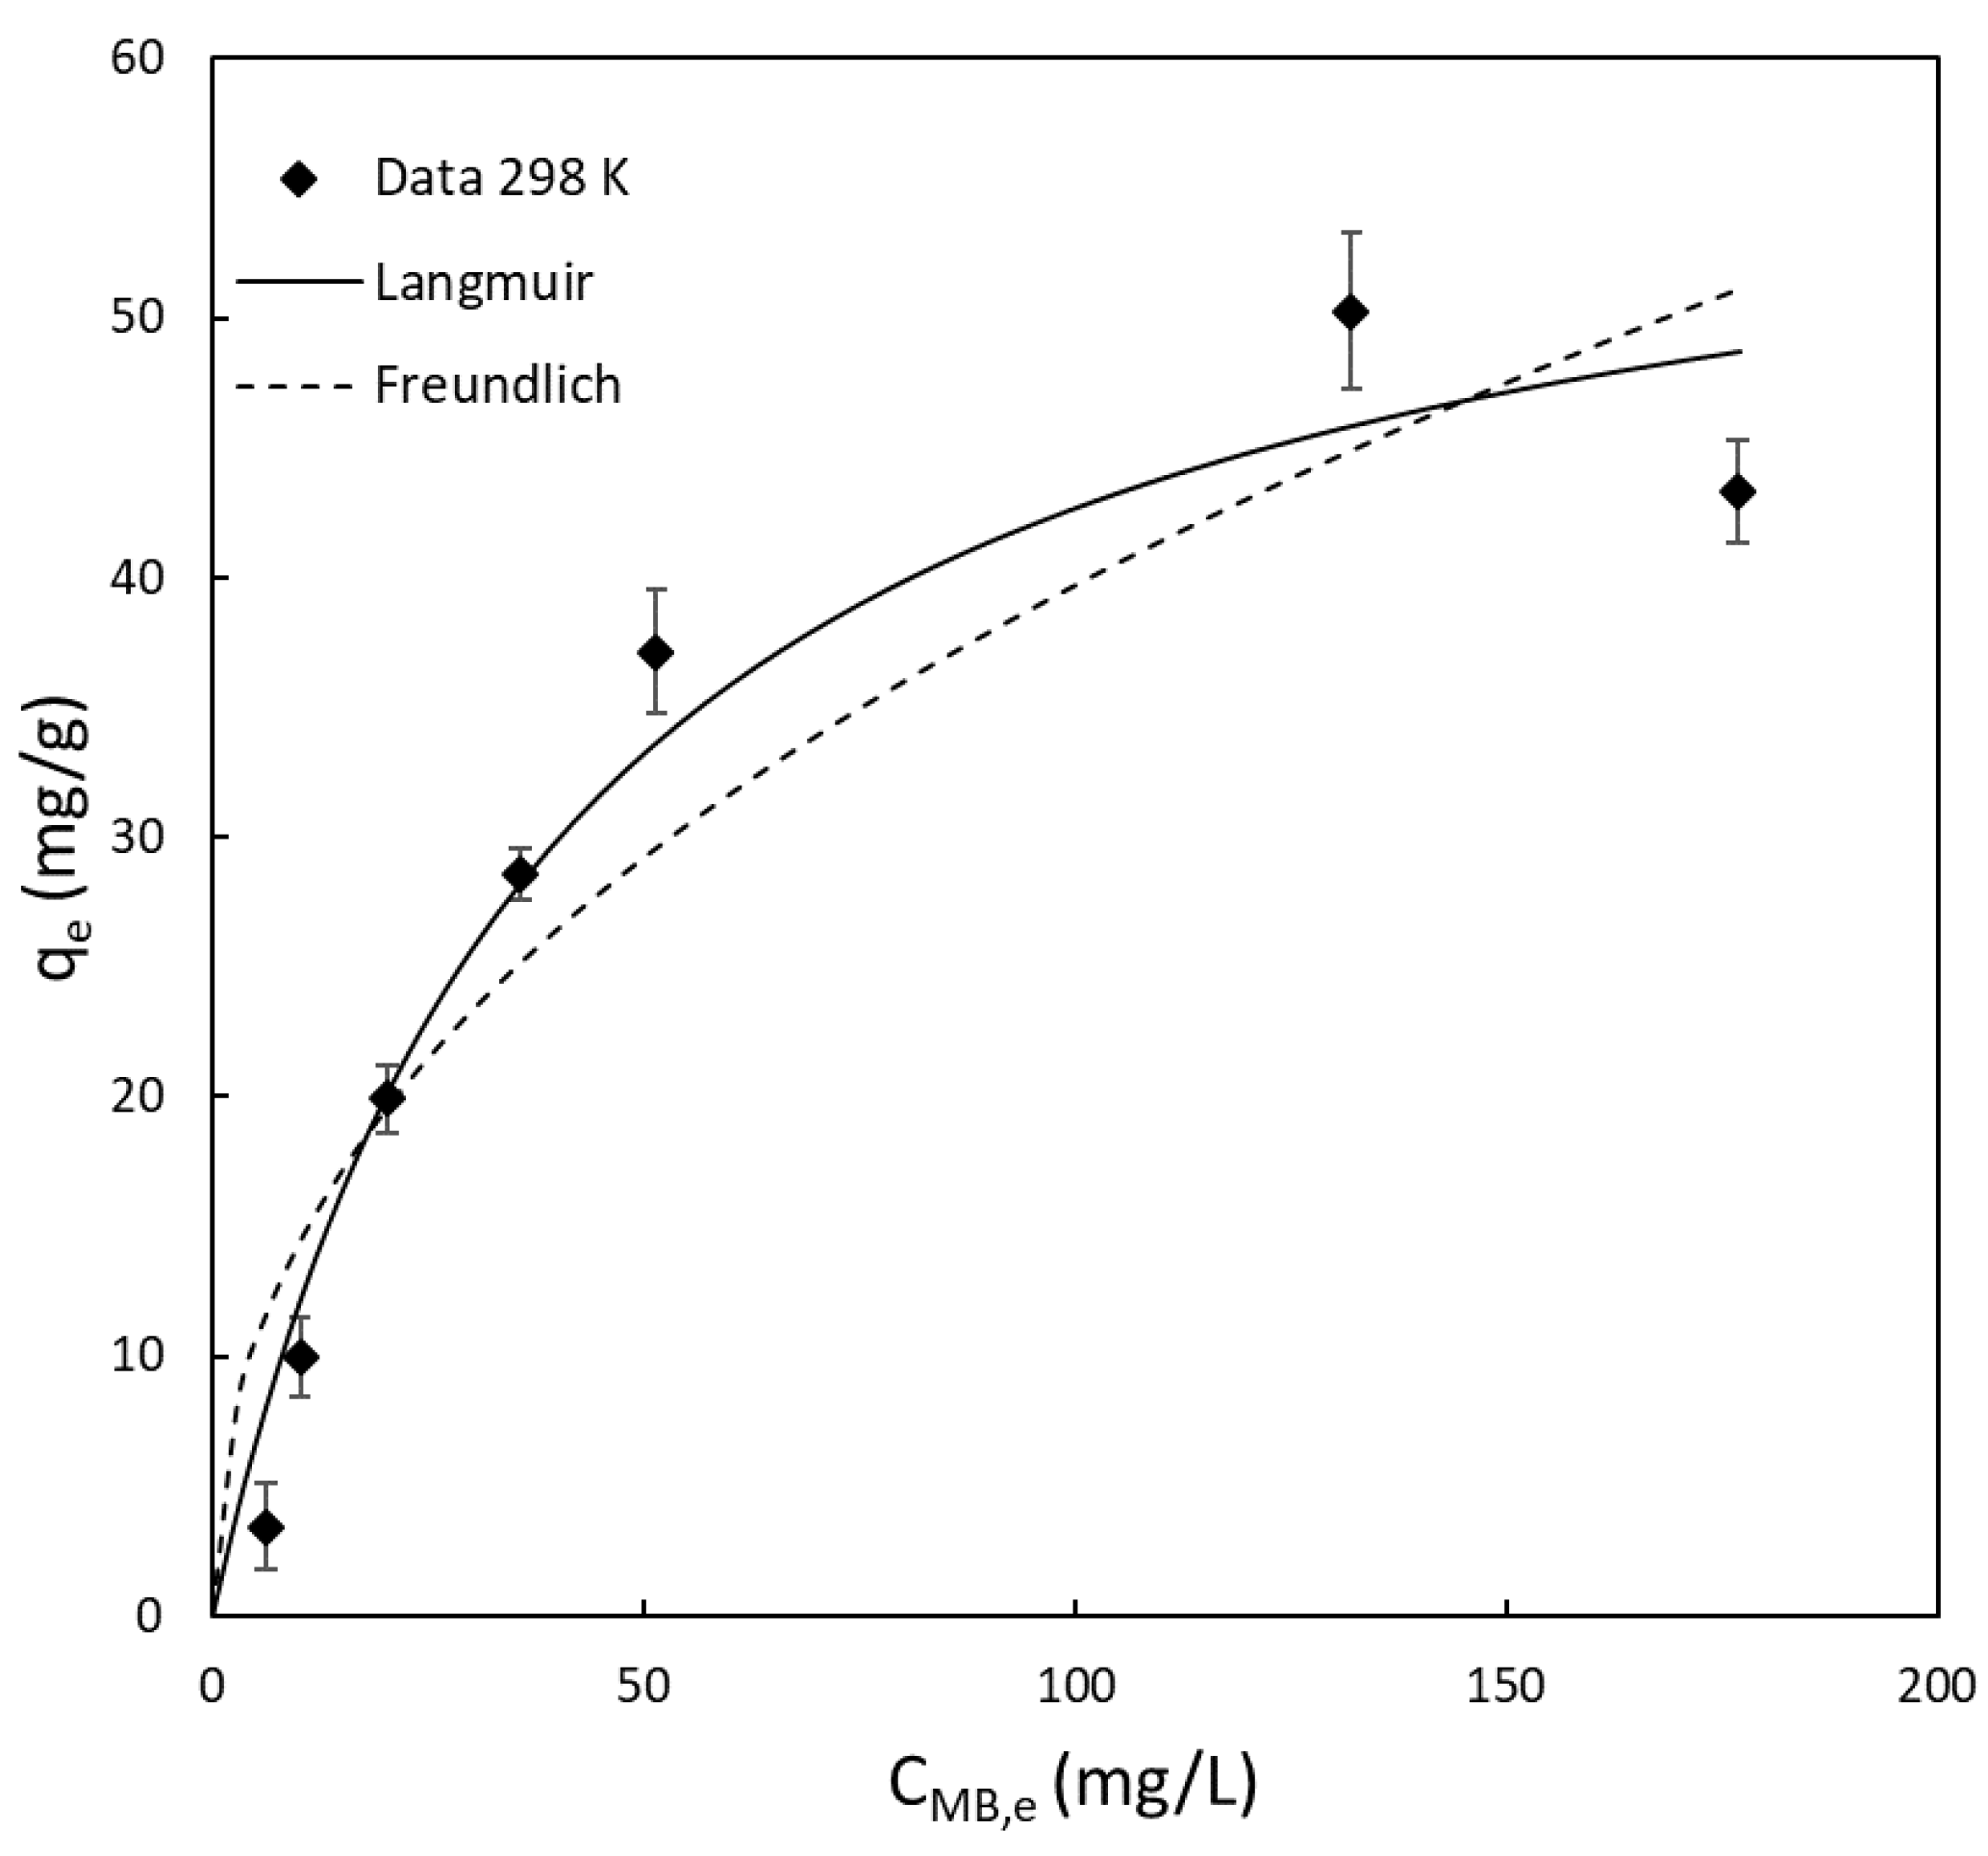
3.1. Isotherm and Thermodynamic Studies
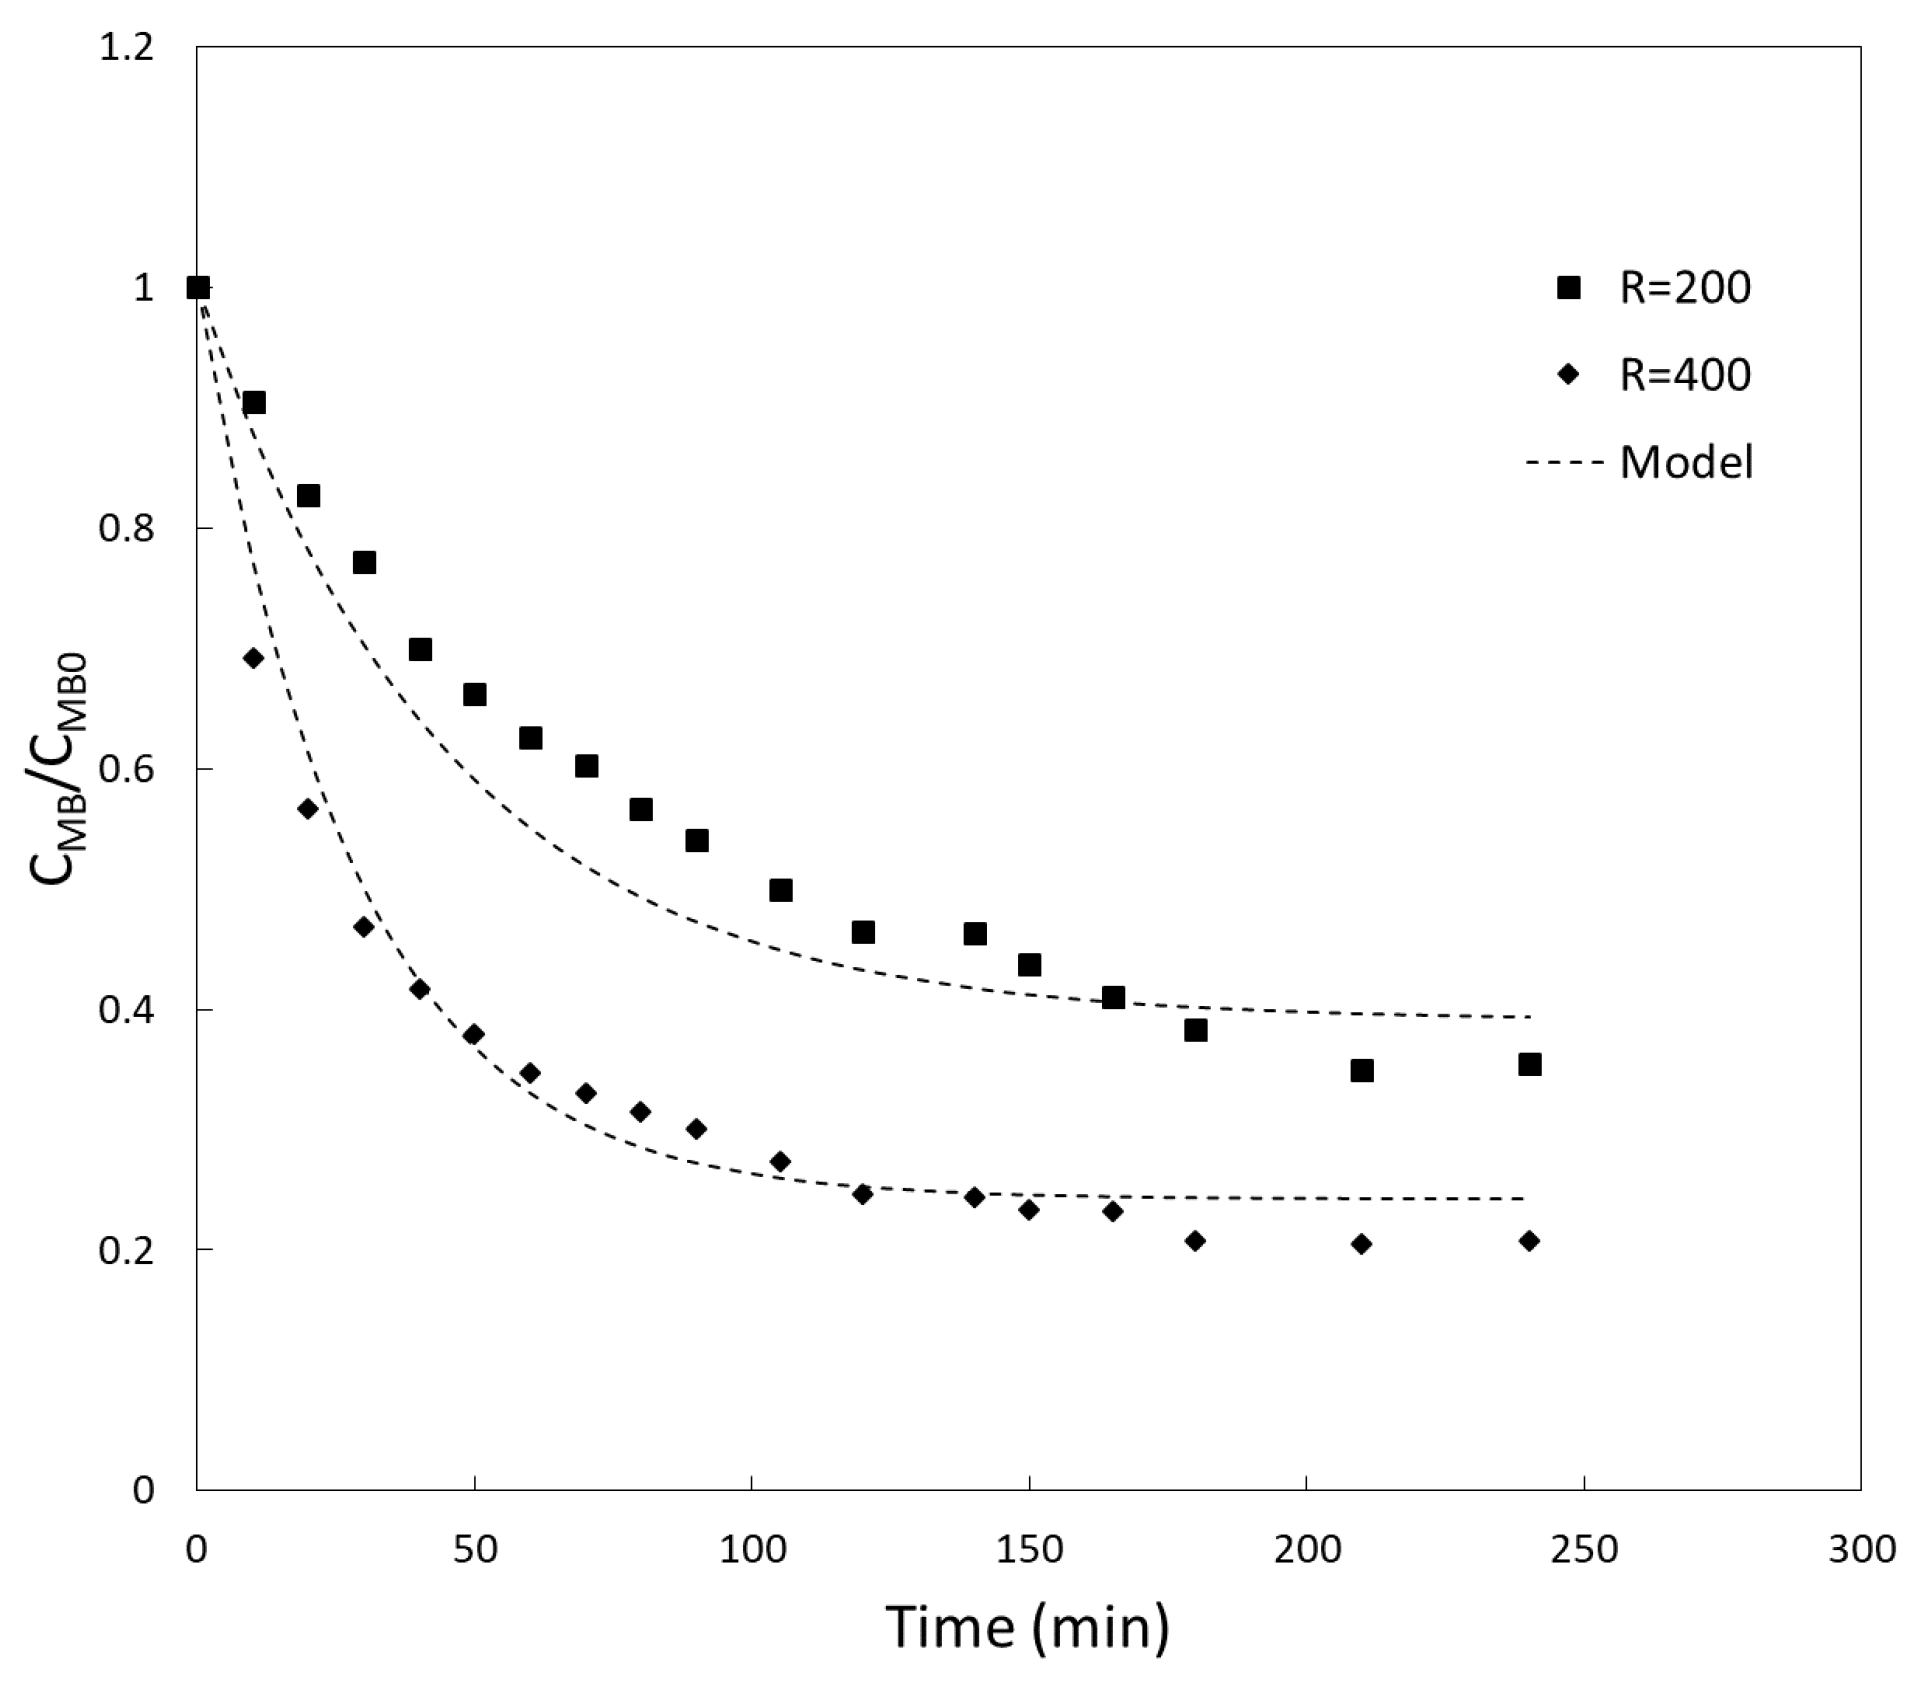
3.2. Kinetics Experiments and Fitting of Model Parameters
- the variation in temperature did not change the liquid properties or the effective diffusivity of MB through YM’s pores, and kC, the overall LDF transport coefficient, remained constant;
- the concentration of MB in the liquid phase at equilibrium was negligible and the variation in the isotherm slope was not appreciable (qmax b remains constant).
3.2.1. Model Validation
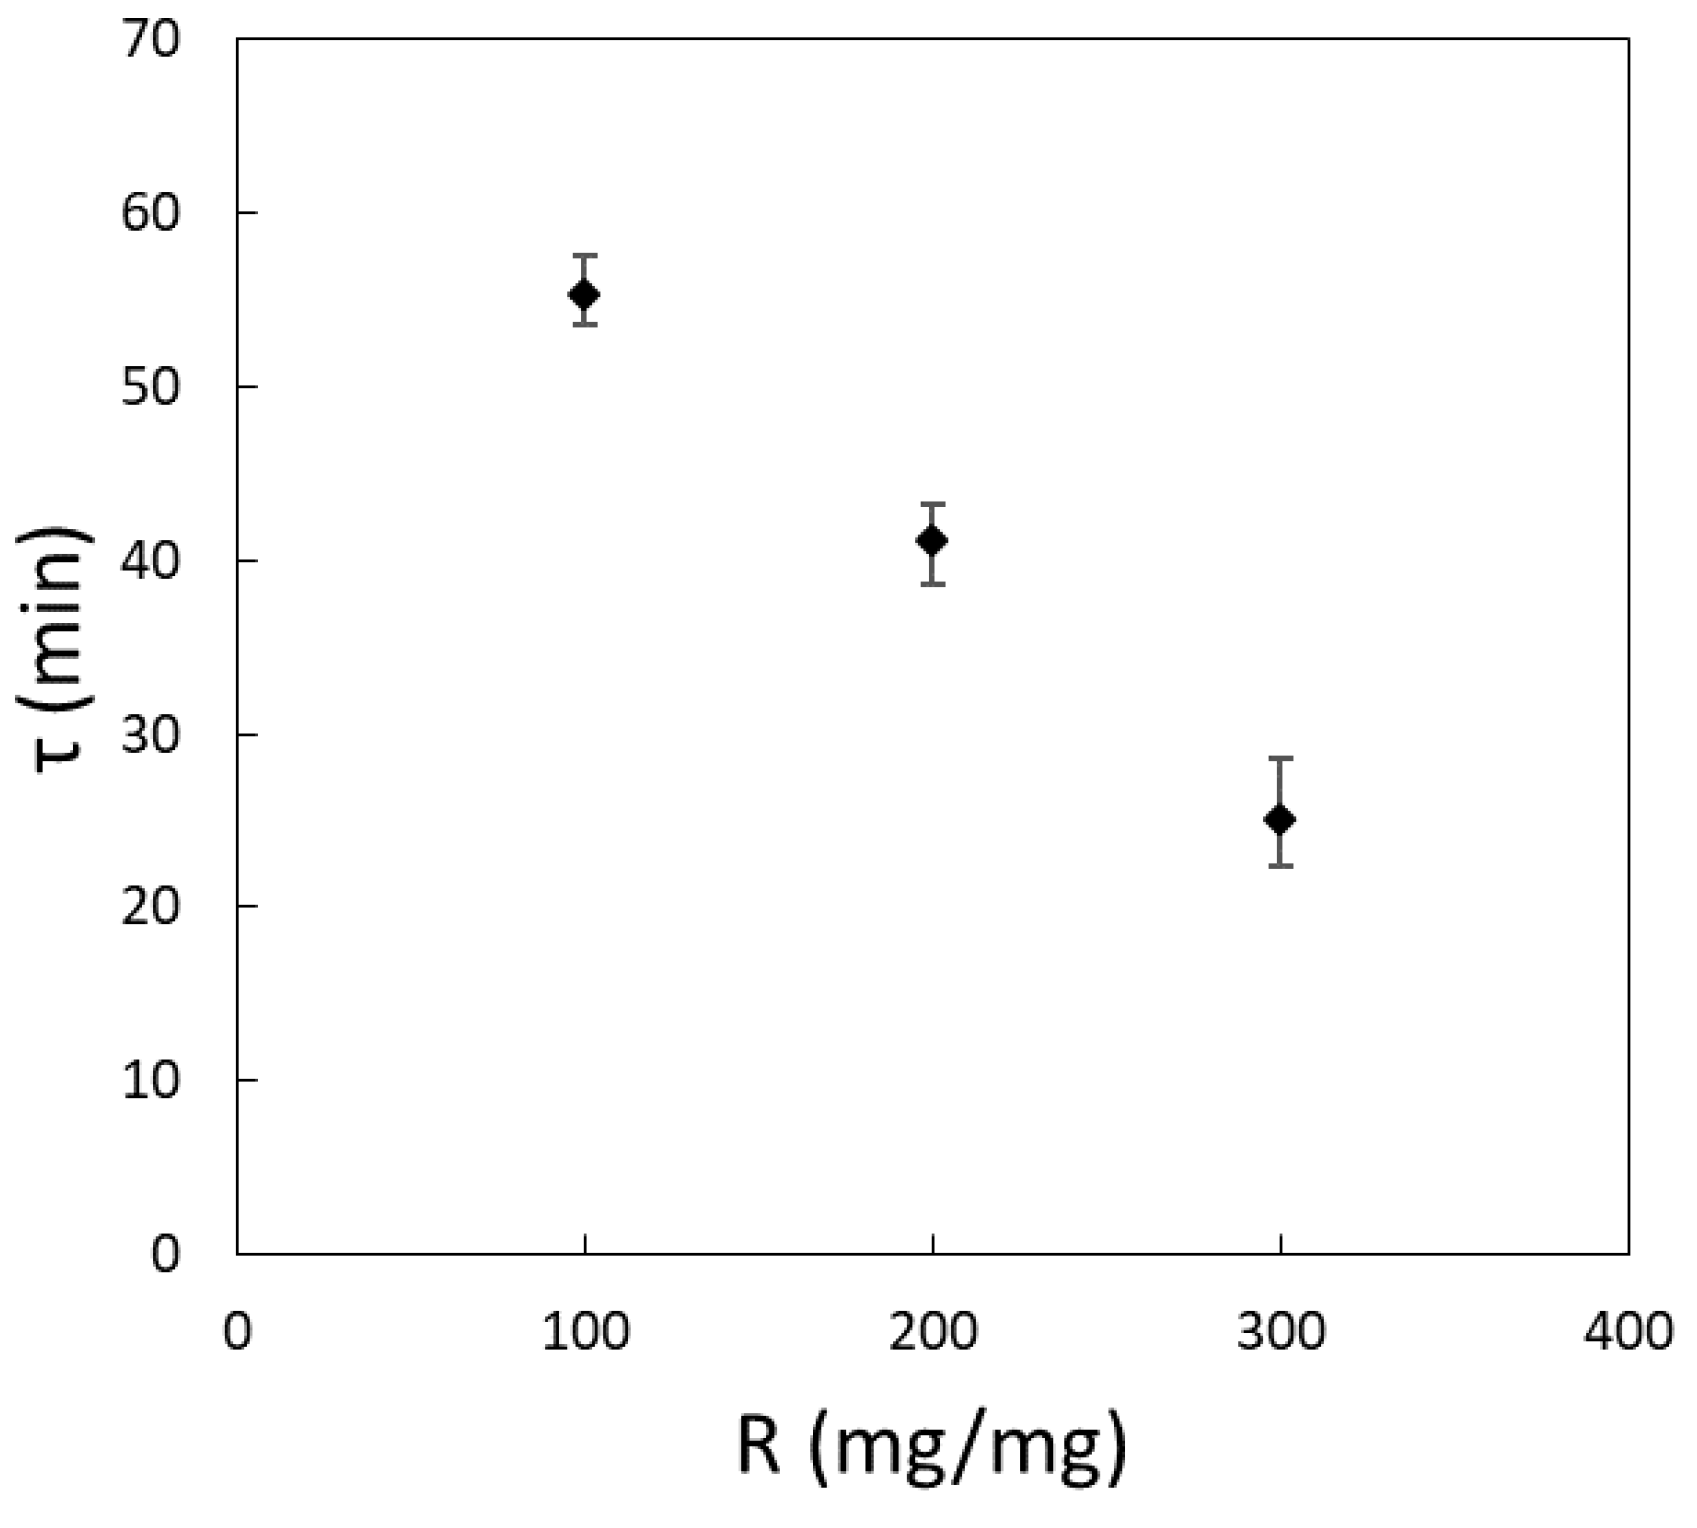
3.2.2. Characteristic Time of Adsorption
3.3. Adsorption of RBB and Cr(VI) Using YM and CYM
4. Conclusions
- Adsorption of MB using YM is a spontaneous process. The adsorption isotherm follows the Langmuir expression, and an adsorption capacity of 59.6 mg/g was calculated. Compared to other food-derived bio-adsorbents tested in the literature, YM shows one of the highest adsorption capacities;
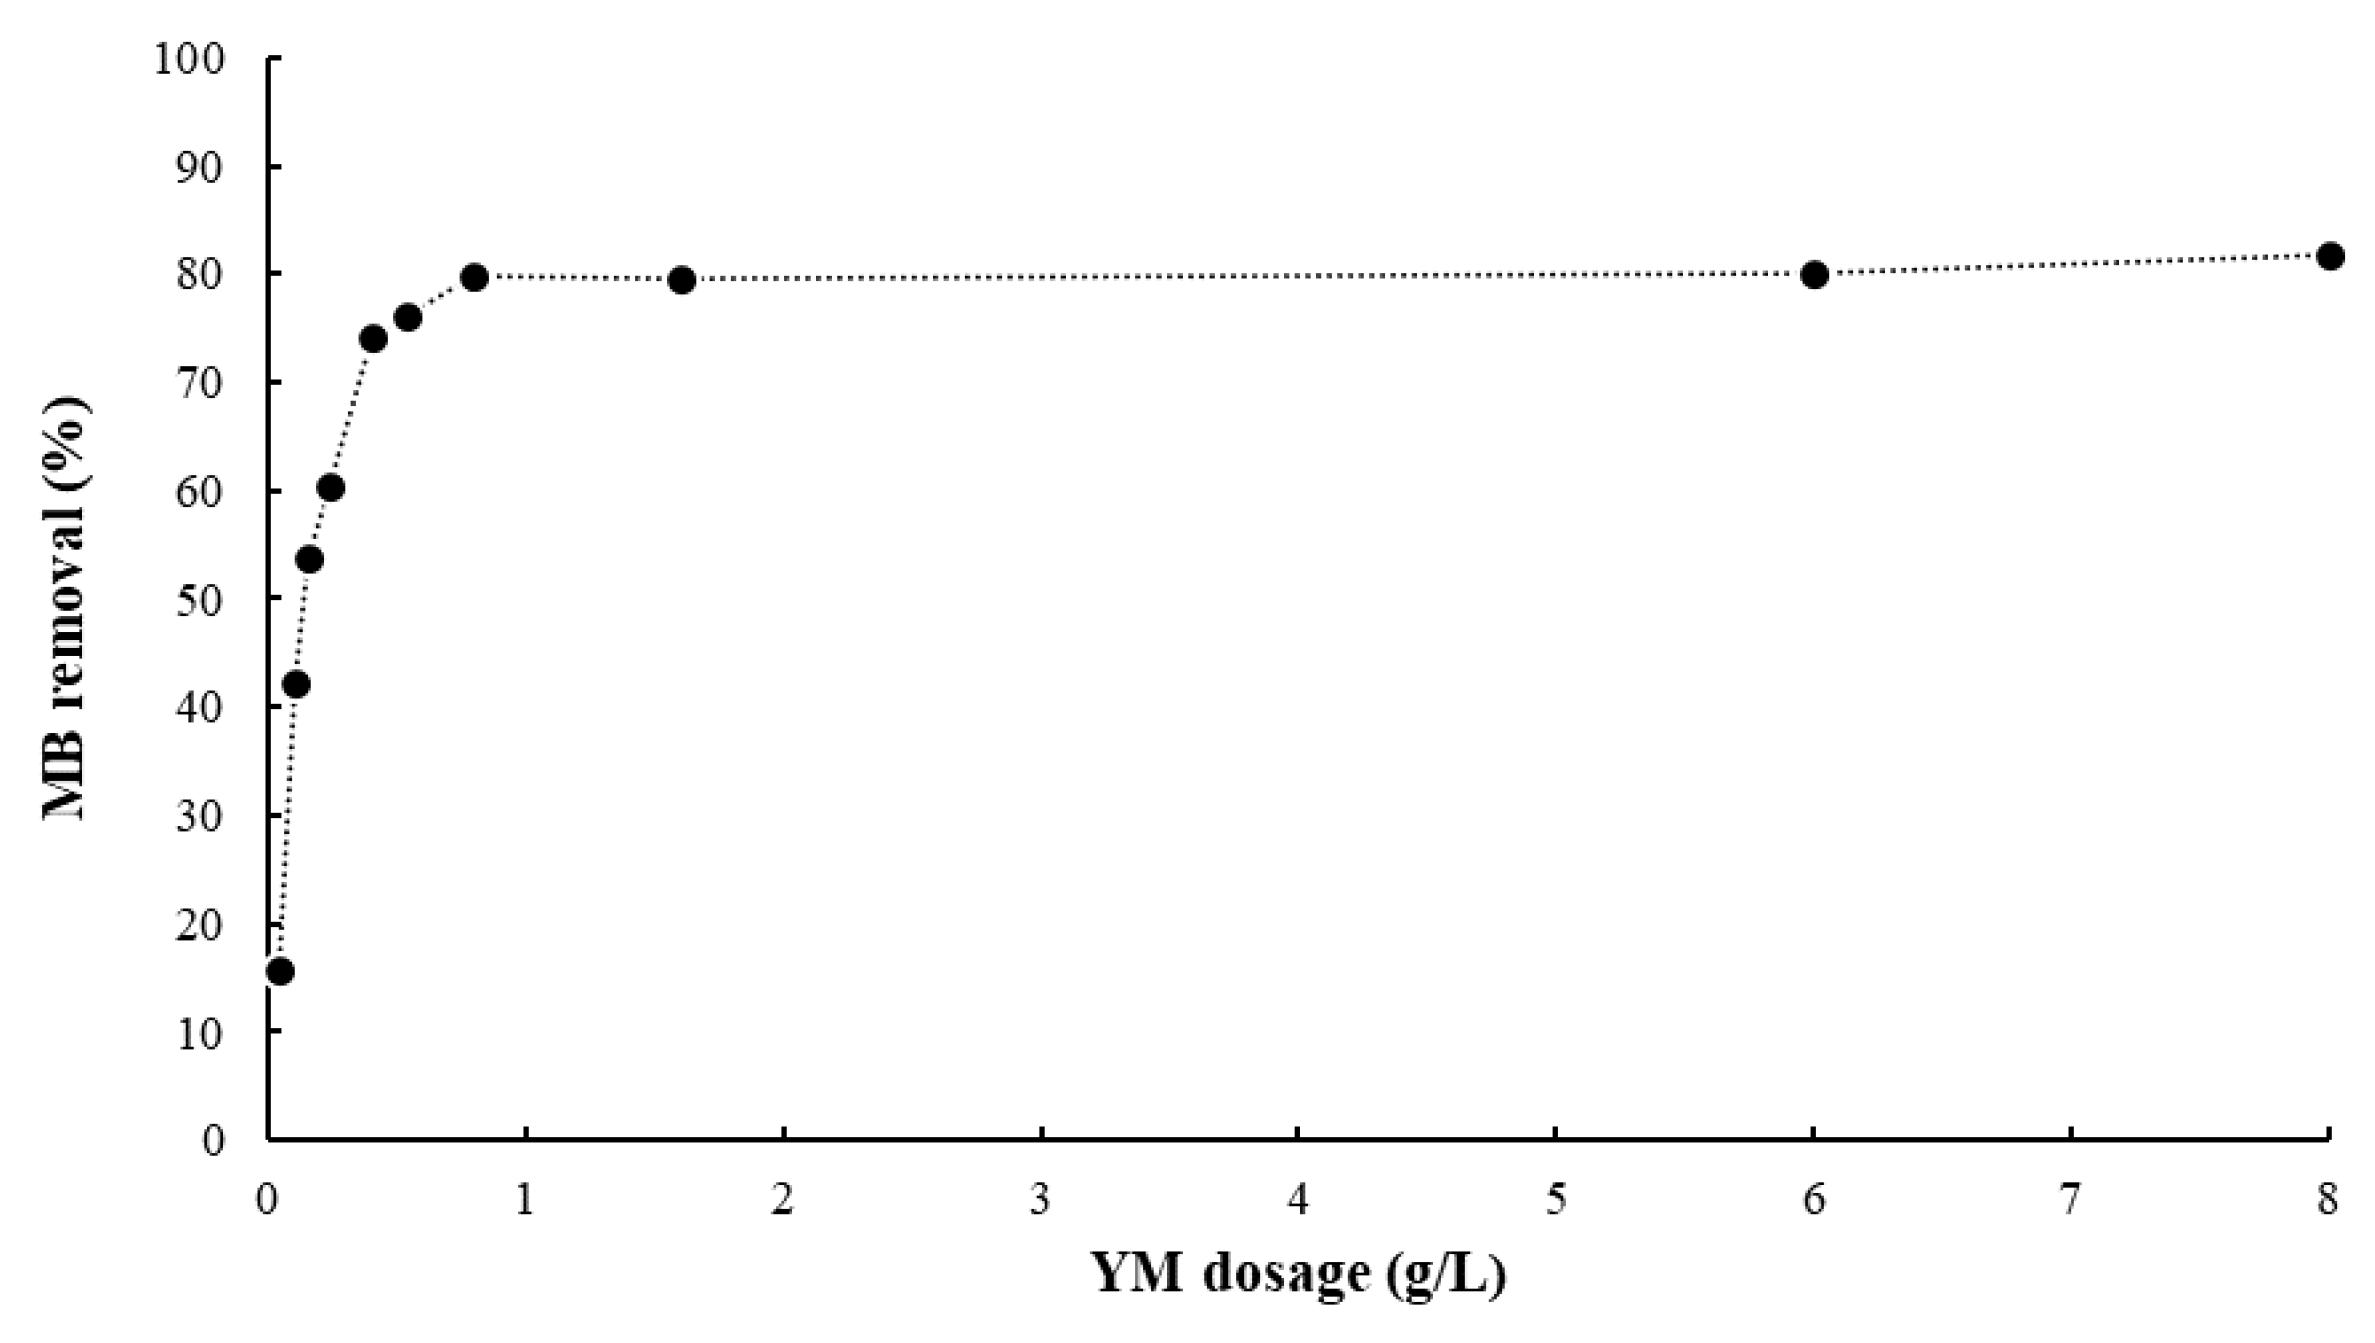
- The concentration of YM is the most important operative parameter of the bio-adsorption process: an increase in bio-adsorbent concentration speeds up the adsorption process and reduces the residual amount of pollutant in the aqueous solution. The effect of temperature and pH are negligible in the range of concentrations of MB considered.
Author Contributions
Funding
Conflicts of Interest
References
- Ahmad, R.; Mirza, A. Synthesis of Guar gum/bentonite a novel bionanocomposite: Isotherms, kinetics and thermodynamic studies for the removal of Pb (II) and crystal violet dye. J. Mol. Liq. 2018, 249, 805–814. [Google Scholar] [CrossRef]
- Shirani, Z.; Santhosh, C.; Iqbal, J.; Bhatnagar, A. Waste Moringa oleifera seed pods as green sorbent for efficient removal of toxic aquatic pollutants. J. Environ. Manag. 2018, 227, 95–106. [Google Scholar] [CrossRef] [PubMed]
- Natarajan, S.; Bajaj, H.C.; Tayade, R.J. Recent advances based on the synergetic effect of adsorption for removal of dyes from waste water using photocatalytic process. J. Environ. Sci. 2018, 65, 201–222. [Google Scholar] [CrossRef] [PubMed]
- Taşar, Ş.; Kaya, F.; Özer, A. Biosorption of lead (II) ions from aqueous solution by peanut shells: Equilibrium, thermodynamic and kinetic studies. J. Environ. Chem. Eng. 2014, 2, 1018–1026. [Google Scholar] [CrossRef]
- Wang, B.; Bai, Z.; Jiang, H.; Prinsen, P.; Luque, R.; Zhao, S.; Xuan, J. Selective heavy metal removal and water purification by microfluidically-generated chitosan microspheres: Characteristics, modeling and application. J. Hazard. Mater. 2019, 364, 192–205. [Google Scholar] [CrossRef] [PubMed] [Green Version]
- Silva, B.; Neves, I.C.; Tavares, T. A sustained approach to environmental catalysis: Reutilization of chromium from wastewater. Crit. Rev. Environ. Sci. Technol. 2016, 46, 1622–1657. [Google Scholar] [CrossRef] [Green Version]
- Rangabhashiyam, S.; Balasubramanian, P. Adsorption behaviors of hazardous methylene blue and hexavalent chromium on novel materials derived from Pterospermum acerifolium shells. J. Mol. Liq. 2018, 254, 433–445. [Google Scholar] [CrossRef]
- Guo, H.; Bi, C.; Zeng, C.; Ma, W.; Yan, L.; Li, K.; Wei, K. Camellia oleifera seed shell carbon as an efficient renewable bio-adsorbent for the adsorption removal of hexavalent chromium and methylene blue from aqueous solution. J. Mol. Liq. 2018, 249, 629–636. [Google Scholar] [CrossRef]
- Van Nguyen, N.; Lee, J.C.; Jeong, J.; Pandey, B.D. Enhancing the adsorption of chromium(VI) from the acidic chloride media using solvent impregnated resin (SIR). Chem. Eng. J. 2013, 219, 174–182. [Google Scholar] [CrossRef]
- Dzakpasu, M.; Wu, K.; Chen, Z.; Yang, Q.; Liu, Z.; Yang, S.; Wang, W. Coagulation performance of cucurbituril for the removal of azo dyes: Effect of solution chemistry and coagulant dose. Water Sci. Technol. 2018, 78, 415–423. [Google Scholar] [CrossRef]
- Petrucci, E.; Montanaro, D. Anodic oxidation of a simulated effluent containing Reactive Blue 19 on a boron-doped diamond electrode. Chem. Eng. J. 2011, 174, 612–618. [Google Scholar] [CrossRef]
- Nidheesh, P.V.; Zhou, M.; Oturan, M.A. An overview on the removal of synthetic dyes from water by electrochemical advanced oxidation processes. Chemosphere 2018, 197, 210–227. [Google Scholar] [CrossRef]
- Fu, F.; Wang, Q. Removal of heavy metal ions from wastewaters: A review. J. Environ. Manag. 2011, 92, 407–418. [Google Scholar] [CrossRef] [PubMed]
- Di Palma, L.; Gueye, M.T.; Petrucci, E. Hexavalent chromium reduction in contaminated soil: A comparison between ferrous sulphate and nanoscale zero-valent iron. J. Hazard. Mater. 2015, 281, 70–76. [Google Scholar] [CrossRef] [PubMed]
- Yagub, M.T.; Sen, T.K.; Afroze, S.; Ang, H.M. Dye and its removal from aqueous solution by adsorption: A review. Adv. Colloid Interface Sci. 2014, 209, 172–184. [Google Scholar] [CrossRef] [PubMed]
- Ramesh, A.; Lee, D.J.; Wong, J.W.C. Thermodynamic parameters for adsorption equilibrium of heavy metals and dyes from wastewater with low-cost adsorbents. J. Colloid Interface Sci. 2005, 291, 588–592. [Google Scholar] [CrossRef]
- Mohan, D.; Pittman, C.U. Activated carbons and low cost adsorbents for remediation of tri- and hexavalent chromium from water. J. Hazard. Mater. 2006, 137, 762–811. [Google Scholar] [CrossRef]
- Ma, Y.; Liu, B.; Sun, N.; Ma, H.; Bao, L.; Cheng, H.; Zhou, J. Adsorption of Cr ions (VI) by modified activated carbon. Chin. J. Environ. Eng. 2014, 8, 2672–2676. [Google Scholar]
- Chen, S.S.; Tung, K.L.; Abdolali, A.; Guo, W.S.; Ngo, H.H.; Nguyen, N.C. Typical lignocellulosic wastes and by-products for biosorption process in water and wastewater treatment: A critical review. Bioresour. Technol. 2013, 160, 57–66. [Google Scholar] [CrossRef]
- Maletić, S.; Radonić, J.; Knudsen, T.S.; Igić, S.M.; Pap, S.; Turk Sekulić, M. Utilization of fruit processing industry waste as green activated carbon for the treatment of heavy metals and chlorophenols contaminated water. J. Clean. Prod. 2017, 162, 958–972. [Google Scholar] [CrossRef] [Green Version]
- Rafatullah, M.; Sulaiman, O.; Hashim, R.; Ahmad, A. Adsorption of methylene blue on low-cost adsorbents: A review. J. Hazard. Mater. 2010, 177, 70–80. [Google Scholar] [CrossRef]
- Ghorbel-Abid, I.; Galai, K.; Trabelsi-Ayadi, M. Retention of chromium (III) and cadmium (II) from aqueous solution by illitic clay as a low-cost adsorbent. Desalination 2010, 256, 190–195. [Google Scholar] [CrossRef]
- Erdem, M.; Orhan, R.; Şahin, M.; Aydin, E. Preparation and Characterization of a Novel Activated Carbon from Vine Shoots by ZnCl2Activation and Investigation of Its Rifampicine Removal Capability. Water Air Soil Pollut. 2016, 227, 226. [Google Scholar] [CrossRef]
- Ozdemir, I.; Şahin, M.; Orhan, R.; Erdem, M. Preparation and characterization of activated carbon from grape stalk by zinc chloride activation. Fuel Process. Technol. 2014, 125, 200–206. [Google Scholar] [CrossRef]
- Agarski, B.; Radonic, J.; Vukelic, D.; Sekulic, M.T.; Budak, I.; Boskovic, N.; Pap, S. Eco-design of a low-cost adsorbent produced from waste cherry kernels. J. Clean. Prod. 2017, 174, 1620–1628. [Google Scholar] [CrossRef]
- Farooq, U.; Kozinski, J.A.; Khan, M.A.; Athar, M. Biosorption of heavy metal ions using wheat based biosorbents—A review of the recent literature. Bioresour. Technol. 2010, 101, 5043–5053. [Google Scholar] [CrossRef] [PubMed]
- Heck, C.I.; De Mejia, E.G. Yerba mate tea (Ilex paraguariensis): A comprehensive review on chemistry, health implications, and technological considerations. J. Food Sci. 2007, 72, R138–R151. [Google Scholar] [CrossRef]
- Arreche, R.A.; de Oca-Vásquez, G.M.; Vega-Baudrit, J.R.; Vázquez, P.G. Synthesis of Silver Nanoparticles Using Extracts from Yerba Mate (Ilex paraguariensis) Wastes. Waste Biomass Valorization 2018, 1–9. [Google Scholar] [CrossRef]
- Vieira, M.A.; Maraschin, M.; Pagliosa, C.M.; Podestá, R.; de Simas, K.N.; Rockenbach, I.I.; Amboni, R.D.D.M.; Amante, E.R. Phenolic acids and methylxanthines composition and antioxidant properties of mate (ilex paraguariensis) residue. J. Food Sci. 2010, 75, C280–C285. [Google Scholar] [CrossRef]
- Anesini, C.; López, P.; Ferraro, G.; Isolabella, S.; Cogoi, L.; Filip, R. Study of the bioactive compounds variation during yerba mate (Ilex paraguariensis) processing. Food Chem. 2010, 122, 695–699. [Google Scholar] [CrossRef]
- Nunes, R.L.C.; Santacruz, G.; Arcaro, S.; Koop, A.A.; Pérez, B.C. Glass Foams Produced from Glass and Yerba Mate (Ilex paraguarinensis) Waste. FME Trans. 2018, 46, 70–79. [Google Scholar] [CrossRef]
- Húmpola, P.; Odetti, H.; Moreno-Piraján, J.C.; Giraldo, L. Activated carbons obtained from agro-industrial waste: Textural analysis and adsorption environmental pollutants. Adsorption 2016, 22, 23–31. [Google Scholar] [CrossRef]
- Albadarin, A.B.; Solomon, S.; Daher, M.A.; Walker, G. Efficient removal of anionic and cationic dyes from aqueous systems using spent Yerba Mate “Ilex paraguariensis”. J. Taiwan Inst. Chem. Eng. 2018, 82, 144–155. [Google Scholar] [CrossRef]
- Afolayan, O. The Efficacy of Banana Peel Activated Carbon in the Removal of Cyanide and Selected Metals from Cassava Processing Wastewater. Adv. Res. 2018, 1–12. [Google Scholar] [CrossRef]
- Bardestani, R.; Patience, G.S.; Kaliaguine, S. Experimental methods in chemical engineering: Specific surface area and pore size distribution measurements—BET, BJH, DFT. Can. J. Chem. Eng. 2019, 97, 2781–2791. [Google Scholar] [CrossRef]
- Selambakkannu, S.; Othman, N.A.F.; Bakar, K.A.; Shukor, S.A.; Karim, Z.A. A kinetic and mechanistic study of adsorptive removal of metal ions by imidazole-functionalized polymer graft banana fiber. Radiat. Phys. Chem. 2018, 153, 58–69. [Google Scholar] [CrossRef]
- United States Environmental Protection Agency (EPA). SW-846 Test Method 7196A: Chromium, Hexavalent (Colorimetric). Available online: http://www.epa.gov/hw-sw846/sw-846-test-method-7196a-chromium-hexavalent-colorimetric (accessed on 26 February 2019).
- Bavasso, I.; Bracciale, M.P.; Sbardella, F.; Tirillò, J.; Sarasini, F.; Di Palma, L. Effect of yerba mate (Ilex paraguariensis ) residue and coupling agent on the mechanical and thermal properties of polyolefin- based composites. Polym. Compos. 2020, 41, 161–173. [Google Scholar] [CrossRef]
- Belhaine, A.; Ghezzar, M.R.; Abdelmalek, F.; Tayebi, K.; Ghomari, A.; Addou, A. Removal of methylene blue dye from water by a spent bleaching earth biosorbent. Water Sci. Technol. 2016, 2534–2540. [Google Scholar] [CrossRef]
- Nogueira, G.D.R.; Duarte, C.R.; Barrozo, M.A.S. Hydrothermal carbonization of acerola (Malphigia emarginata D. C.) wastes and its application as an adsorbent. Waste Manag. 2019, 95, 466–475. [Google Scholar] [CrossRef]
- Gupta, V.K.; Jain, R.; Shrivastava, M.; Nayak, A. Equilibrium and Thermodynamic Studies on the Adsorption of the Dye Tartrazine onto Waste “Coconut Husks” Carbon and Activated Carbon. J. Chem. Eng. Data 2010, 55, 5083–5090. [Google Scholar] [CrossRef]
- Glueckauf, E.; Coates, J.J. Theory of chromatography. Part IV. The influences of incomplete equilibrium on the front boundary of chromatograms and on the effectiveness of separation. J. Chem. Soc. 1947, 1315–1321. [Google Scholar] [CrossRef] [PubMed]
- Shi, J.; Yang, J.; Han, R.; Wang, Y.; Lu, Y.; Han, P. Removal of methylene blue from aqueous solution by chaff in batch mode. J. Hazard. Mater. 2006, 137, 550–557. [Google Scholar] [CrossRef]
- Chen, J.; Yang, C.; Li, M.; Gong, R.; Sun, Y. Removal of cationic dyes from aqueous solution by adsorption on peanut hull. J. Hazard. Mater. 2005, 121, 247–250. [Google Scholar] [CrossRef]
- Annadurai, G.; Juang, R.S.; Lee, D.J. Use of cellulose-based wastes for adsorption of dyes from aqueous solutions. J. Hazard. Mater. 2002, 92, 263–274. [Google Scholar] [CrossRef]
- Vadivelan, V.; Kumar, K.V. Equilibrium, kinetics, mechanism, and process design for the sorption of methylene blue onto rice husk. J. Colloid Interface Sci. 2005, 286, 90–100. [Google Scholar] [CrossRef]
- Sostaric, T.; Mineral, O.; Materials, R.; Milojkovic, J. Biosorption of methylene blue by waste apricot shells from food industry. J. Eng. Process. Manag. 2015, 7, 107–114. [Google Scholar] [CrossRef] [Green Version]
- Bulut, Y.; Ayd, H. A kinetics and thermodynamics study of methylene blue adsorption on wheat shells. Desalination 2006, 194, 259–267. [Google Scholar] [CrossRef]
- Franca, A.S.; Oliveira, L.S.; Ferreira, M.E. Kinetics and equilibrium studies of methylene blue adsorption by spent coffee grounds. Desalination 2009, 249, 267–272. [Google Scholar] [CrossRef]
- Pavan, F.A.; Lima, E.C.; Dias, S.L.P.; Mazzocato, A.C. Methylene blue biosorption from aqueous solutions by yellow passion fruit waste. J. Hazard. Mater. 2008, 150, 703–712. [Google Scholar] [CrossRef]
- Uddin, M.T.; Islam, M.A.; Mahmud, S.; Rukanuzzaman, M. Adsorptive removal of methylene blue by tea waste. J. Hazard. Mater. 2009, 164, 53–60. [Google Scholar] [CrossRef]
- Annesini, M.C.; Marrelli, L.; Piemonte, V.; Turchetti, L. Artificial Organ Engineering; Springer: London, UK, 2017; ISBN 978-1-4471-6442-5. [Google Scholar] [CrossRef] [Green Version]
- Leaist, D.G. The effects of aggregation, counterion binding, and added NaCl on diffusion of aqueous methylene blue. Can. J. Chem. 1988, 66, 2452–2457. [Google Scholar] [CrossRef]
- Xie, Y.; Li, S.; Wang, F.; Liu, G. Removal of perchlorate from aqueous solution using protonated cross-linked chitosan. Chem. Eng. J. 2010, 156, 56–63. [Google Scholar] [CrossRef]
- Gode, F.; Pehlivan, E. Removal of Cr(VI) from aqueous solution by two Lewatit-anion exchange resins. J. Hazard. Mater. 2005, 119, 175–182. [Google Scholar] [CrossRef] [PubMed]


| Sample | Surface Area (m2/g) | Pore Volume (cm3/g) (×10−3) | Average Pore Diameter (Å) |
|---|---|---|---|
| YM | 1.08 | 0.48 | 17.85 |
| CYM | 13.84 | 59 | 183.39 |
| R (mg/mg) | xs (mg/L) × 10−3 | ||
|---|---|---|---|
| 283 K | 293 K | 313 K | |
| 100 | 2.6 | 2.4 | 2.5 |
| 200 | 5.3 | 4.8 | 5.1 |
| 300 | 7.9 | 7.3 | 7.7 |
| Bio-Adsorbent | T (K) | pH | Langmuir | Freundlich | ||
|---|---|---|---|---|---|---|
| qmax (mg/g) | b (L/mg) | KF | n | |||
| Yerba mate (This study) | 298 | 6 | 59.6 | 0.02 | 5.17 | 2.26 |
| Tea waste [51] | 298 | 8 | 85.16 | 1.26 | 46.81 | 1.51 |
| Chaff [43] | 298 | 7 | 20.03 | 0.22 | 4.92 | 2.83 |
| Peanut hull [44] | 293 | 5 | 60.05 | 0.16 | 9.11 | 1.89 |
| Banana peel [45] | 303 | 7 | 20.8 | 0.06 | 1.34 | 3.03 |
| Orange peel [45] | 303 | 7 | 18.6 | 0.05 | 1.75 | 3.85 |
| Rice husk [46] | 305 | 8 | 40.5 | 0.14 | 8.62 | 2.75 |
| Apricot shells [47] | 298 | 5 | 24.31 | 0.002 | 14.66 | 3.44 |
| Wheat shells [48] | 303 | 7 | 16.56 | 0.02 | 1.46 | 2.74 |
| Spent coffee grounds [49] | 298 | 5 | 18.72 | 0.27 | 5.19 | 3.30 |
| Passion fruit waste [50] | 298 | 8 | 44.70 | 0.002 | 0.40 | 1.49 |
| Sample | T (K) | pH | ERBB % | ECr(VI) % | EMB % |
|---|---|---|---|---|---|
| YM | 283 | 3 | 27.00 | 50.00 | 70.00 |
| YM | 298 | 6 | 0 | 2.80 | 74.36 |
| CYM | 298 | 6 | 77.00 | 65.00 | 0 |
© 2020 by the authors. Licensee MDPI, Basel, Switzerland. This article is an open access article distributed under the terms and conditions of the Creative Commons Attribution (CC BY) license (http://creativecommons.org/licenses/by/4.0/).
Share and Cite
Mazzeo, L.; Bavasso, I.; Bracciale, M.P.; Cocchi, M.; Di Palma, L.; Piemonte, V. Yerba Mate (Ilex paraguarensis) as Bio-Adsorbent for the Removal of Methylene Blue, Remazol Brilliant Blue and Chromium Hexavalent: Thermodynamic and Kinetic Studies. Water 2020, 12, 2016. https://doi.org/10.3390/w12072016
Mazzeo L, Bavasso I, Bracciale MP, Cocchi M, Di Palma L, Piemonte V. Yerba Mate (Ilex paraguarensis) as Bio-Adsorbent for the Removal of Methylene Blue, Remazol Brilliant Blue and Chromium Hexavalent: Thermodynamic and Kinetic Studies. Water. 2020; 12(7):2016. https://doi.org/10.3390/w12072016
Chicago/Turabian StyleMazzeo, Leone, Irene Bavasso, Maria Paola Bracciale, Marco Cocchi, Luca Di Palma, and Vincenzo Piemonte. 2020. "Yerba Mate (Ilex paraguarensis) as Bio-Adsorbent for the Removal of Methylene Blue, Remazol Brilliant Blue and Chromium Hexavalent: Thermodynamic and Kinetic Studies" Water 12, no. 7: 2016. https://doi.org/10.3390/w12072016