Factors Controlling of Thermal Water Hydrogeochemical Characteristics in Tatun Volcano Group, Taiwan


Department of Resources Engineering, National Cheng Kung University, Tainan 701, Taiwan
*
Author to whom correspondence should be addressed.
Water 2020, 12(9), 2473; https://doi.org/10.3390/w12092473
Submission received: 11 August 2020
/
Revised: 27 August 2020
/
Accepted: 1 September 2020
/
Published: 3 September 2020
(This article belongs to the Special Issue Urban Environmental Vulnerability under Climate Change and Anthropogenic Impacts)
Abstract
:The Tatun geothermal system is located in Northern Taiwan and is hosted by the Tatun volcano group (TVG). The variation in the geochemical composition of thermal waters is considered to be an important indicator of volcanic activity. In this study, we analyzed the chemical and isotopic compositions of hot springs in the TVG. A chemical and multicomponent geothermometer was used to estimate the reservoir temperature, and hydrogen and oxygen isotopes were used to determine the source of the thermal water. The presence of thick andesite and fractures allowed the formation of different type of springs in the center close each other with lower temperatures and acidic springs with higher temperatures at the northeast and southwest sides of the Tatun geothermal field. The saturation index showed that the concentration of SiO2 in the thermal water was controlled by quartz. The multicomponent geothermometer indicated a reservoir temperature between 130 °C and 190 °C, and the geothermal water in Longfengku, Lengshniken, Matsao and Szehuangping may have mixed with shallow groundwater. Isotope data indicated that the stream water and groundwater originated from meteoric water, and the spring water showed a significant oxygen shift, due to water–rock interaction and evaporation. The isotopes of the fluid in the TVG are also affected by the seasonal monsoon. These results can serve as a reference for designing a conceptual model of the spring in the Tatun geothermal system.
1. Introduction
The variation in the geochemical component of thermal water is considered a key element in volcanic activity [1,2,3]. Based on the water chemistry of springs, we can determine the origin of thermal water [4,5], the degree of mixing between the thermal fluid and shallow groundwater [6,7], migration of the geothermal water [8,9], evaluate the geothermal potential [10,11], and establish a conceptual model of the thermal system [12,13,14]. Moreover, there are studies investigating the reservoir temperature through hydrogeochemistry in Mexico, Spain, and China [2,15,16]. Stable isotopes are useful indicators of the origin of the thermal water; they can also be used to understand the reaction between water and rock or gas [17,18]. Investigating the hydrogeochemical properties, such as hydrogeochemical and isotopic data, can contribute to understanding the water–rock interactions of thermal water, their sources, runoff, and reservoir conditions.
The Tatun thermal system is located in the Tatun volcano group (TVG) in northern Taiwan. Although the Tatun volcano has not erupted in human history, the eruption time is considered to be 20 Ka according to the 14C dating results of sediments [19]. The high 3He/4He ratios in fumarolic gases imply that a magma reservoir exists underneath north Taiwan [20]. The temporal variation of the helium isotopic and volcano-seismic data indicated that a magma chamber existed beneath Tayukeng [21]. There is evidence that the microseismicity is associated with the hydrothermal fluid circulation [22]. The aforementioned studies implied that the TVG remain active. Several scholars have also studied thermal water in the TVG. Ohba suggested the presence of volatile-rich magma beneath the TVG, and stated that two distinctive fluids were distributed in Tayukeng and Hsiaoyukeng, respectively [23]. Dobson developed an updated model of the Tatun geothermal system based on fluid chemistry and magnetotelluric data, suggesting that NE marginal portion of the Tatun geothermal system near the Szehuangping (SHP) may exist as near-neutral fluids, suitable for geothermal exploitation [24]. However, relatively few studies have focused on the geothermal reservoir characteristics of the TVG [1,24]. For geothermal resource exploration, developing conceptual models of geothermal systems is important. The geothermal reservoir characteristics are the key components of such conceptual models. A number of studies have investigated geothermal reservoirs with the equilibrium of silica minerals [7,16]. The multicomponent geothermometer, based on the saturation index of minerals, can also estimate the temperature of the geothermal reservoir [2,6,16]. In order to understand the structure of the thermal system beneath the TVG, the hydrogeochemical characteristics of the thermal water were studied. Various types of geothermometers were applied to estimate the geothermal reservoir temperature, and stable isotopes were used to infer the origin of the thermal water. We hoped to provide information for geothermal reservoirs and thermal water flow systems in the TVG through this research.
2. Study Area
The Tatun volcano group (TVG) is situated on the northern side of the Taipei Basin in the northern part of Taiwan, close to the Taipei metropolis. TVG contains at least 20 volcanic centers, most of which are stratovolcanos, covering an area of 400 km2 [25]. The two major faults in the TVG are the Kanchiao fault and the Chinshan fault, both of which strike NE, dip SW, and penetrate deeply into the sedimentary sequences. These two faults are the bounds of the geothermal area in the TVG over an area of approximately 200 km2. The hot springs and fumaroles are mainly distributed along the Chinshan fault, the hot springs are Tireku (TRK), Tingbiqiao (TBQ), Hoshan (HS), Longfengku (LFK), Matsao (MT), Lengshniken (LSK), Qigu (QG), Tayukeng (TYK), Bayan (BY), Szehuangping (SHP), and Tapu (TP), as shown in Figure 1. The strata are composed of sedimentary deposits, pyrogenetic rock, and alluvium, as shown in Figure 2. The basement below the volcanic body of the TVG is composed of sedimentary sequences. The sedimentary sequences include the Wuchihshan, Mushan, Taliao, Nankang, Wutu, and Tapu formations [26]. Among them, the Wuchishan formation is the most important unit, consisting of well-consolidated quartz-rich sandstone with porosities of up to 23%, and is considered to be a good aquifer. The Mushan formation consists of sandstone, shale, and some coal seams about 0.4 m thick, and porosity of the sandstone is about 15%. The Taliao formation consists of marine sandstone, shales, and siltstones. Due to the shales, this formation has lower porosity. The Nankang, Wutu, and Tapu formations have similar compositions, consist of a lower member of sandstone, shale and coal beds, a second member of coarse grained sandstone, a third member of sandstone with shale and silt interbeds, and an upper member of sandstone with interbeds of shale and siltstone [23]. The volcanic rocks are composed of lava flow, pyroclastic breccias, tuffs, and lahars. The sedimentary basin is covered by volcanic rocks. The alluvia are distributed in the lower reaches of the rivers in the TVG [26]. The TVG is present in a subtropical monsoon region. During the summer, the stifling heat is a result of the southwest monsoon from the South China Sea and the Northern Pacific. Rainfall occurs predominantly during winter, especially in mountainous areas, as part of the northeast monsoon from the Asian continent.
According to the hydrogeochemical characteristics, the thermal water in the TVG can be classified into three types: SO42− acidic water, HCO3− neutral water, and Cl−-rich acidic water. The SO42− acidic water originates from the precipitation that circulates into the deep Wuchishan formation, and is then heated by magmatic fluids or volcanic gases. Subsequently, the thermal water rises to the surface by thermal convection. HCO3− neutral water is generated by the infiltration of meteoric water into shallow andesitic host rocks. After absorbing volcanic gases, the acidic thermal water is neutralized by the andesite. The Cl−-rich acidic water is produced by the mixing of meteoric water, formation water, and magmatic fluid; the reservoir is present in the shallow Wuchishan formation [1]. The thermal water in the TVG has high acidity and temperature, which can then react with andesites. As a result, the rocks undergo physical and chemical alterations. According to the analysis of cores from exploration wells in the TVG, montmorillonite, chlorite, calcite, albite, adularia, illite, anhydrite, chalcedony, and pyrite are rich in the host volcanic rock [1,26].
3. Materials and Methods
The hydrogeochemical and isotopic data of thermal water in the TVG was initially collected [1,23,27,28,29]. Chemical and multicomponent geothermometry were used to estimate the temperature of the geothermal reservoir, and the investigations of stable isotopes provided information about the hydrodynamics of the thermal water. The aim of this study was to apply these methods to discuss the geothermal reservoir and thermal water flow system characteristics in the TVG.
3.1. Geothermometry
3.1.1. Chemical Geothermometry
Chemical geothermometers are empirical or experimental calibrations based on the temperature-dependent mineral fluid equilibrium, which can be used to estimate the temperature of a geothermal reservoir. These geothermometers assume that the equilibrium of the chemical compositions attained in the geothermal reservoir was preserved during the ascent of water to the surface.
Although there are various types of geothermometers, not all are suitable for all types of geothermal systems. These geothermometers have their own advantages and application limitations. Quartz, chalcedony, Na-K, and K-Mg geothermometers provide satisfactory results in a high-temperature (>180 °C) system in which the water reached equilibrium with the host rocks rich in feldspars and aluminosilicates [2]. Hydrogeochemical information related to the reservoir conditions could be lost during the thermal water rising to the surface due to re-equilibrium or secondary processes [16]. Applying several geothermometers simultaneously can help to estimate the subsurface temperature [2,16]. The equations pertaining to the chemical geothermometers used in this study are presented in Table 1.
3.1.2. Multicomponent Geothermometry
Multicomponent geothermometers are based on the equilibrium between the minerals and thermal fluid in the geothermal reservoir, estimating the reservoir temperature through the saturation index of selected minerals. This approach was proposed by Reed and Spycher [34], using the measured chemical composition of thermal water to simulate the equilibrium of minerals at high temperatures on a thermodynamic basis. To determine the equilibrium state of the minerals, the saturation index (SI) was used; it was defined as
Here, IAP and KT are the activity and equilibrium constants of the mineral at a specific temperature T, respectively. When the mineral reached equilibrium with the solution, SI = 0. SI < 0 for undersaturation and SI > 0 for supersaturation. The point where the SI of all minerals converges to 0 is the reservoir temperature. Compared to chemical geothermometers, multicomponent geothermometers are applicable to all geochemical systems, but require detailed aqueous chemistry and mineralogical data, and are thus less frequently applied than chemical geothermometers [15].
In this study, the geochemical reaction model PHREEQC (VA, USA) and the phreeqc thermodynamic database was used to calculate the SI of selected minerals at different temperatures [35]. PHREEQC is often used to simulate the reactions between water and minerals, gases, ion exchangers, and solid solutions. It can also simulate irreversible kinetic reactions [36].
3.2. Oxygen and Hydrogen Isotopes
In hydrological processes, fractionation mainly occurs during a phase change or isotopic exchange between different phases. This leads to the deviation of the ratios of stable hydrogen and oxygen isotopes in water from the initial composition [37].
There is a specific relationship between the δD and δ18O in fresh surface water all over the world, known as the Global Meteoric Water Line (GMWL), which was first defined by Craig [38]. The equation of the Meteoric Water Line (MWL) is defined as
where A is the slope and B is the intercept of the MWL. The slope can represent the ratio of the equilibrium fractionation factors for D and 18O, which is controlled by the condensation temperature. The intercept (d, deuterium excess) is associated with the humidity in the vapor source region. The deuterium excess of the GMWL is 10‰, indicating that water vapor originates in an environment with a humidity of approximately 85% [39]. The local meteoric water line (LMWL) of different areas is influenced by the origin of the vapor and secondary evaporation during rainfall. Therefore, oxygen and hydrogen isotopes are useful tools for understanding the origin of water [40].
δD = A δ18O + B
4. Results and Discussion
4.1. Hydrogeochemistry
Hydrogeochemical characteristics of thermal water can provide useful information about geothermal systems. The chemical composition of the spring water from the TVG is presented in Table 2. The temperature of these springs ranges from 40.2 °C in Lengshniken to 73.7 °C in Tayukeng. In all these springs, the temperature slightly decreased compared to the temperature in 2007 [1], and the spring temperature changed significantly in Tapu, from 90.8 °C to 69.8 °C.
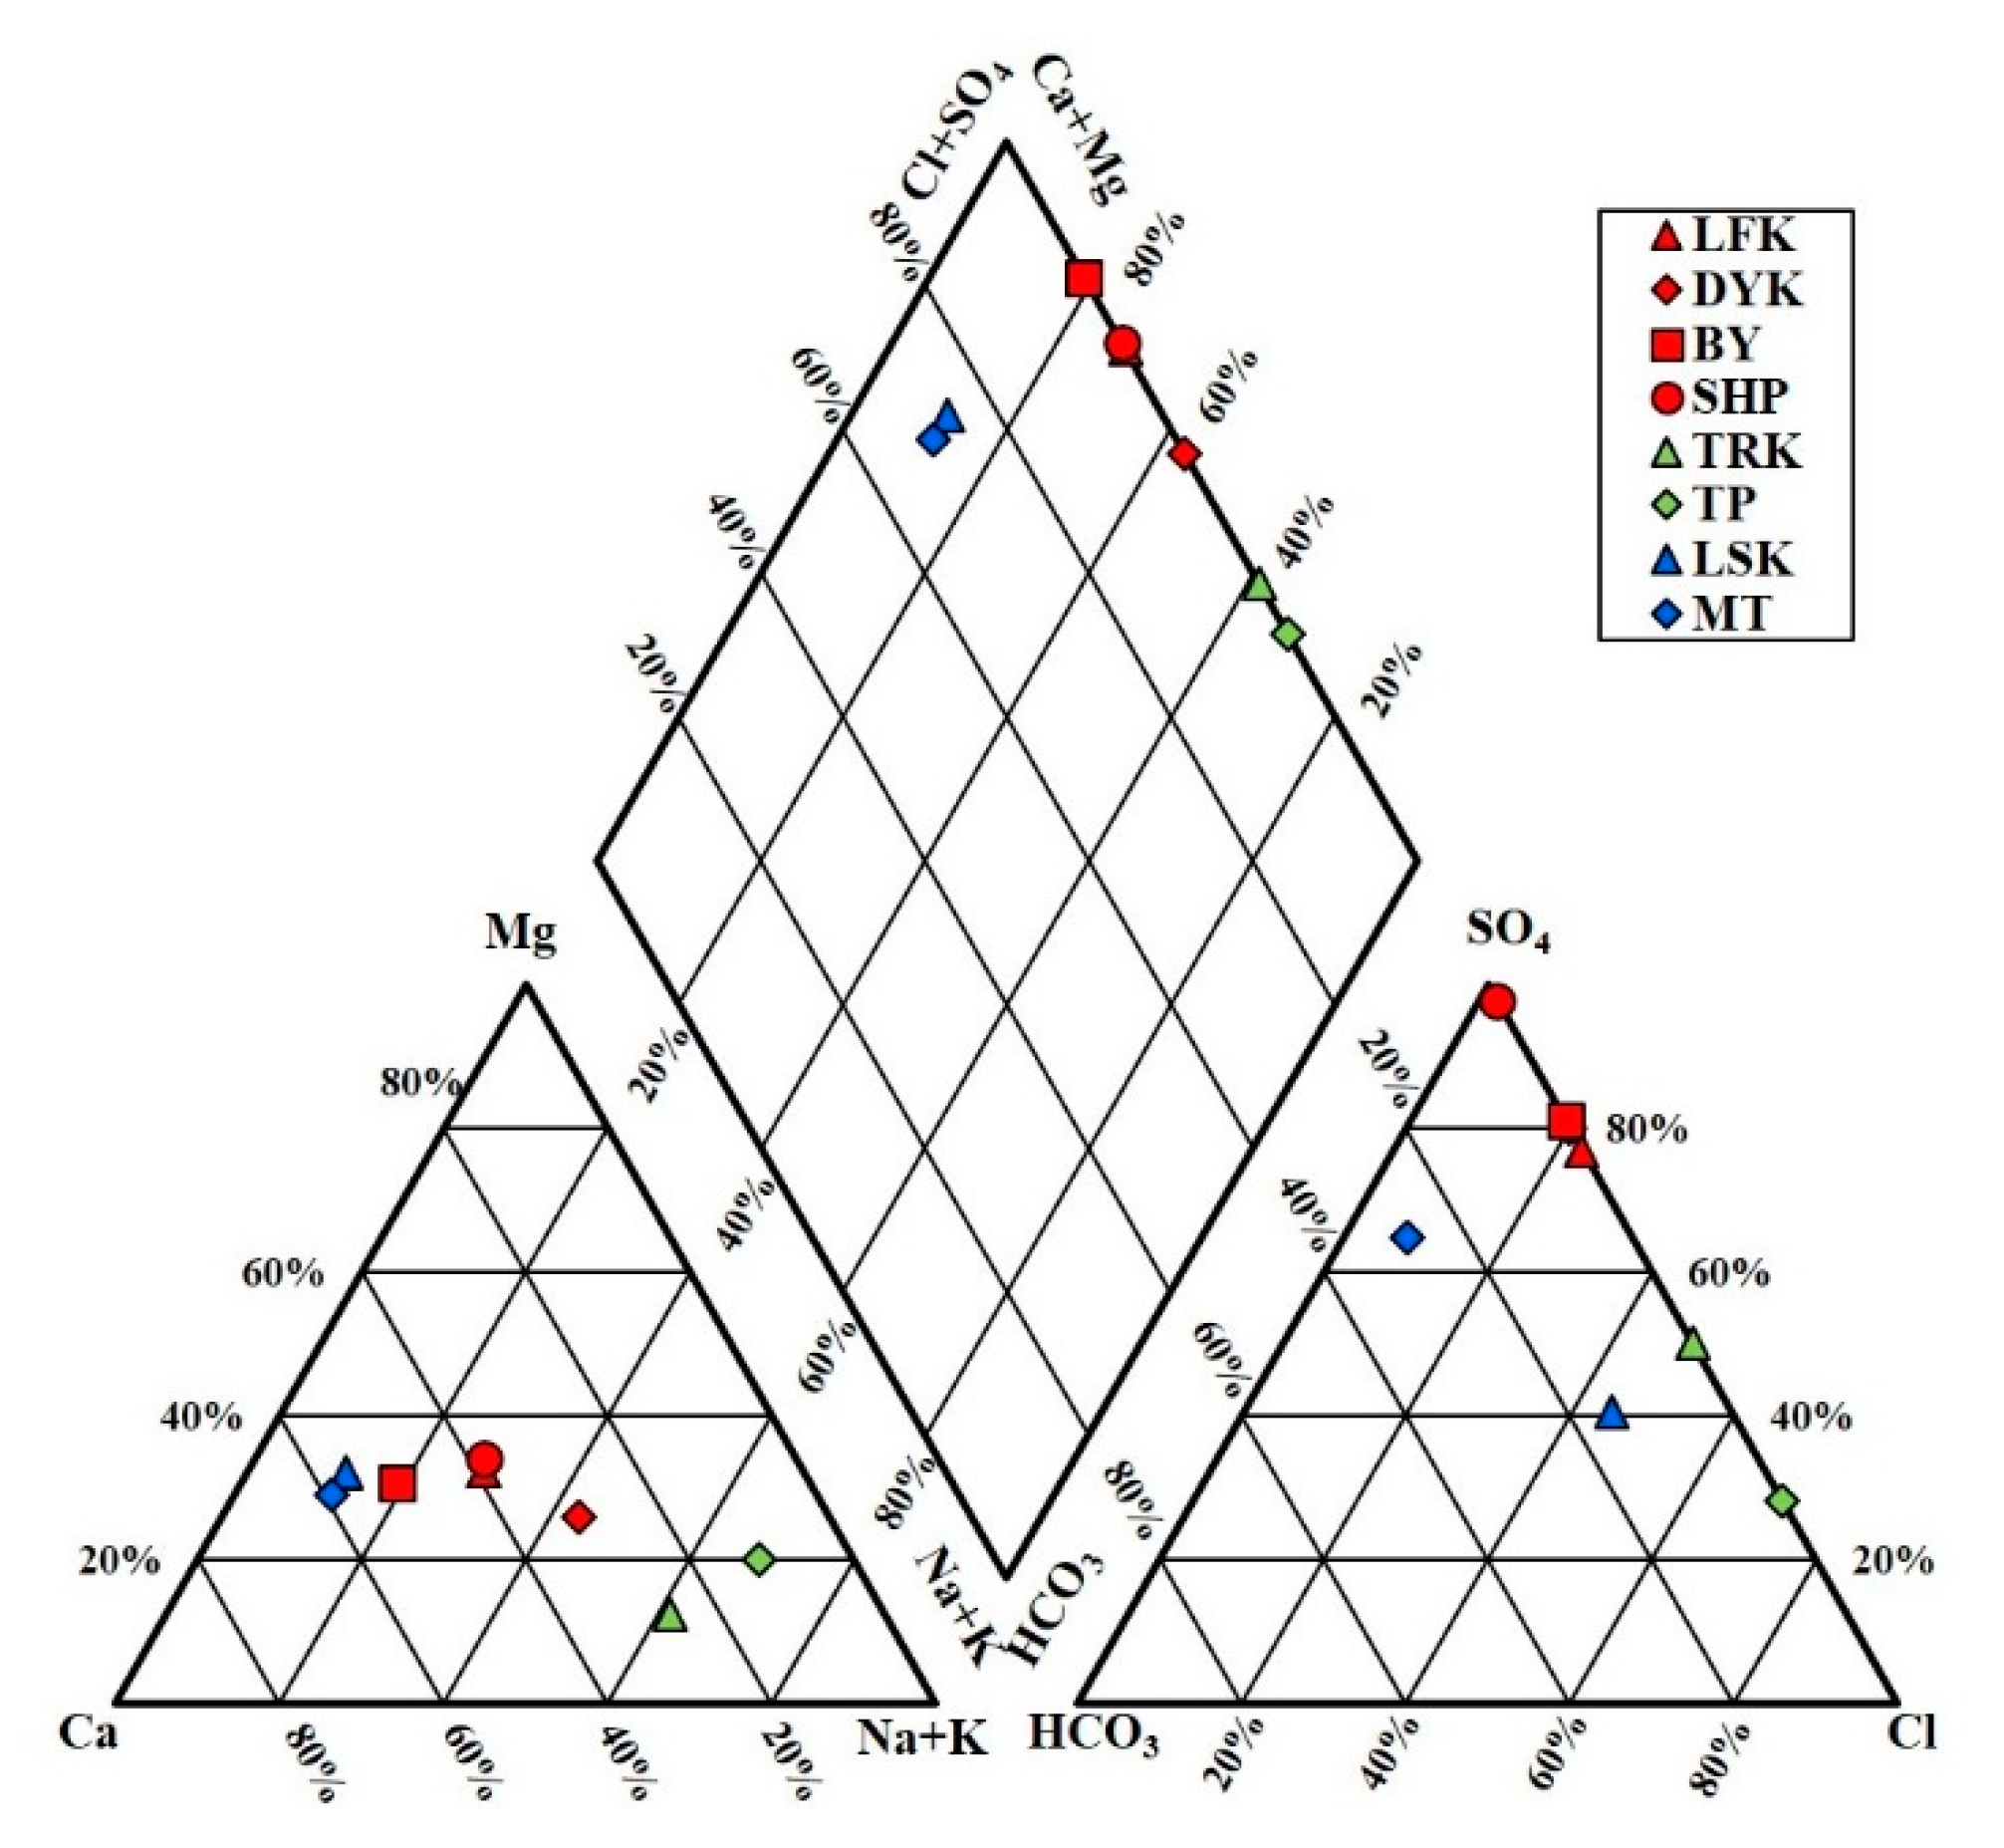
The chemical nature of springs is shown in the piper diagram [41], which is a common and practical method for classifying hydrogeochemical facies. As shown in Figure 3, Longfengku, Tayukeng, Bayan, and Szehuangping are rich in SO42− with concentrations between 104.2 to 5128 mg/L and have low pH values ranging from 1.58 to 2.91 (except Longfengku with a pH for 5.71), the reservoir of this type of water is located in deep Wuchishan formation, and is then heated by magmatic fluids or gases [1]. Tireku and Tapu also have low pH values but are rich in chloride, with concentrations ranging from 2684 to 4284 mg/L. The reservoir of Cl− rich acidic water is located in shallow Wuchishan formation, and is then heated by the gases separated from the boiling water [42]. Lengshniken and Matsao are rich in HCO3−, both of which are close to neutrality with pH values of 6.03 and 3.93, respectively. The HCO3− of these springs is originated from andesite host rock [1].
To investigate the spatial distribution of the thermal water in the TVG, we generated contour maps of temperature and pH for the years 2009, 2010, and 2011, using the inverse distance weighted method (IDW), as shown in Figure 4 and Figure 5. The maps show that the middle of the TVG (near HS and LSK), had an average pH of 6 and an average temperature of 44.5 °C. In the northeast and southwest sides of the TVG, the average pH was 2.2 and 1.3, and the average temperatures were 65.2 °C and 60 °C, respectively. In general, the thermal water in the central part of the TVG was neutral with lower temperatures. In contrast, the thermal water in the northeast and southwest sides were acidic with higher temperatures. The contour maps of the temperature and pH were similar from 2009 to 2011, indicating that the distribution of temperature and pH was nearly constant. The results of the drill-hole data and 3-D geological modeling indicated that the heat source was located between the Mt. Chihsinshan and Tayukeng areas. There was a thick and impermeable andesite layer above the heat source, causing the thermal fluid to be transported towards a NE–SW direction [43]. The thermal water in the central part is neutral with relatively low temperatures, which could be a result of transportation difficulty in andesite. The thermal water had a longer residence time to interact with the andesite. In contrast, the fracture networks were well-developed in the northeast and southwest sides of the TVG, and the thermal water had a shorter residence time and a larger flow rate. The distribution of temperature and pH of the thermal water in the TVG was associated with the geological structures and lithological characteristics.
4.2. Classical Geothermometry
To estimate the reservoir temperature of geothermal waters in the TVG, cation and silica chemical geothermometers were used, and the results are presented in Table 3. Two silica geothermometers were used in this study. The average thermal reservoir temperature was estimated to be 73.3 °C using a chalcedony geothermometer, and the average thermal reservoir temperature estimated by the quartz geothermometer was 102.7 °C. The results of the quartz geothermometer are higher than those of the chalcedony geothermometer. There are other geothermometers based on the relationships among cations.
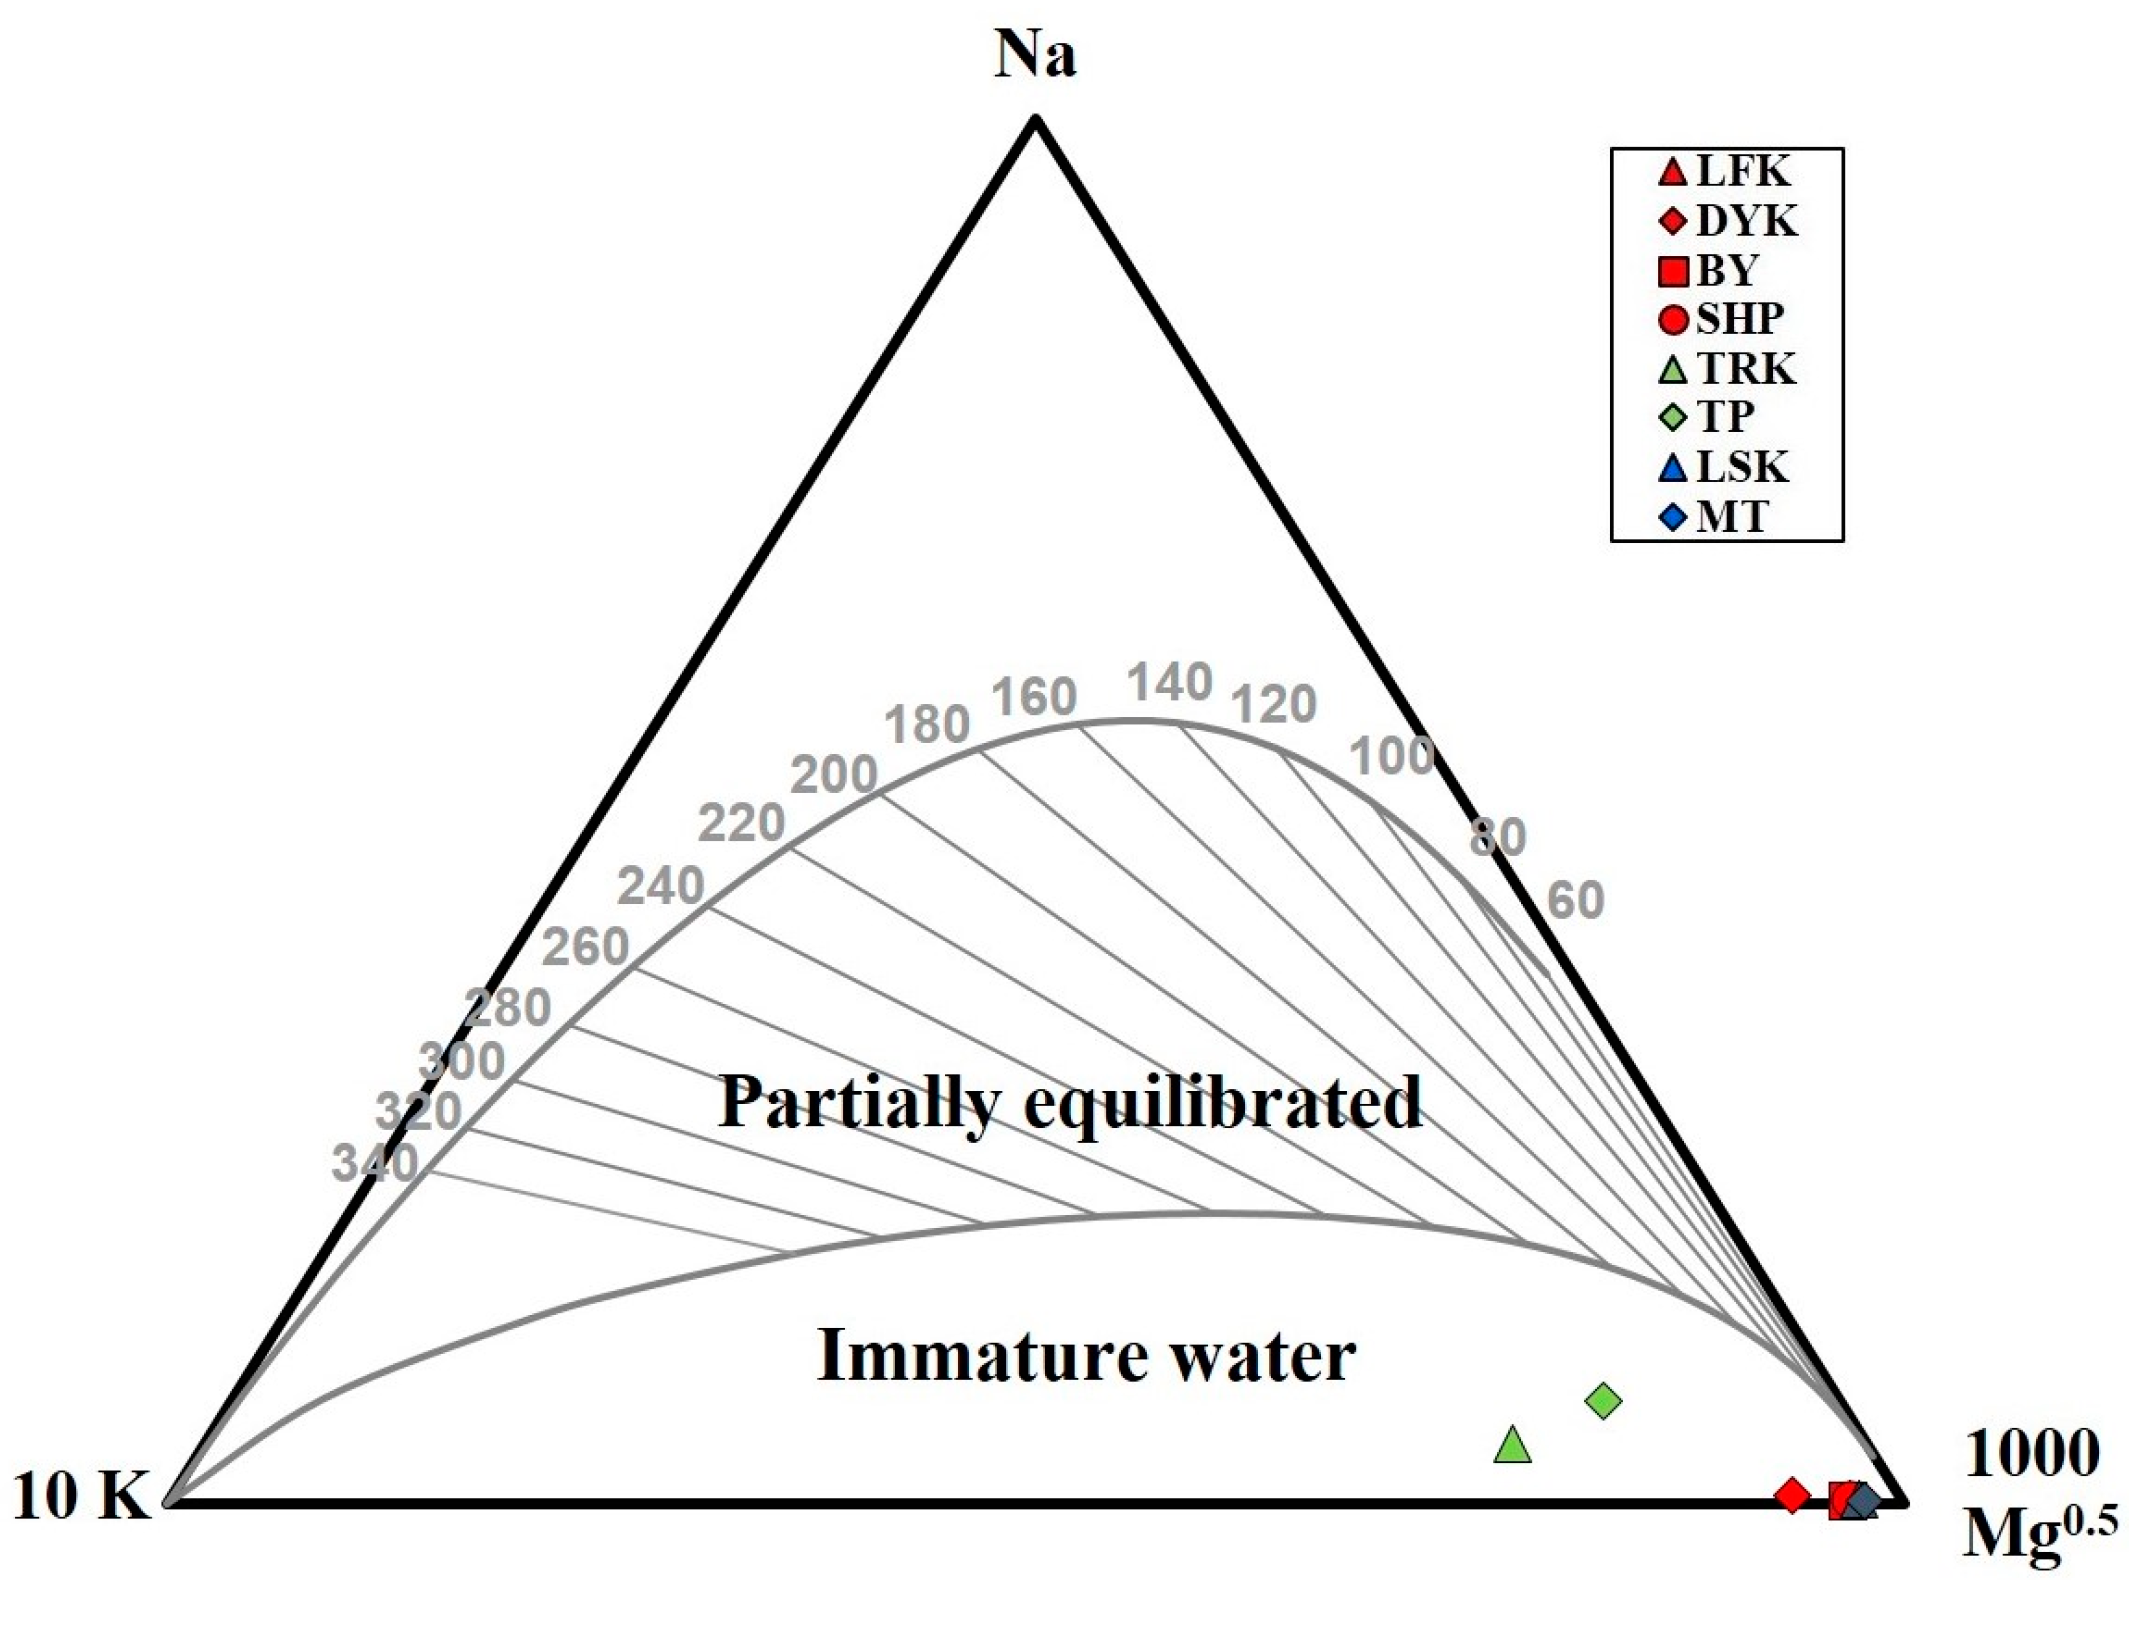
Before applying the cations geothermometers, the Giggenbach Na-K-Mg ternary diagram was used [44]. This ternary diagram is used to recognize the equilibrium degree of water and to estimate the reservoir temperature. If the springs are not in equilibrium, the cation geothermometers may provide uncertain results. As shown in Figure 6, all the springs fell in the area below the immature water curve, indicating that the thermal water had not reached the equilibrium of water–rock interaction or mixed with groundwater. With the cation geothermometers, average temperatures of 504.1 °C and −5.7 °C were obtained with the Na-K and K2-Mg geothermometers, respectively. The highest temperature encountered in the TVG was 293 °C at the deep exploration well in the Matsao area. It is obvious that the temperatures estimated by the cation geothermometers are either too low or too high. Under nonequilibrium conditions, silica geothermometers may provide more reliable results than cation geothermometers [6].
The SI was used to evaluate the state of equilibrium of the minerals in the thermal water. The SI of selected minerals, calculated at the pH and water temperature measured in the field, are presented in Table 4. Most of the springs in the TVG are saturated with quartz and chalcedony. The SI of other minerals are lower than 0 in all springs, indicating that all springs are undersaturated with these minerals. Longfengku and Szehuangping are the only two springs that are undersaturated with chalcedony. They are both far away from the heat source of the TVG. The SI of quartz is larger than that of chalcedony, implying that the equilibrium of silica was controlled by quartz. The SI results also indicate that the quartz geothermometer may provide more reliable predictions than the other geothermometers. In the case of the quartz geothermometer, the estimated temperature ranged from 39.1 to 138.4 °C (Table 3).
4.3. Multicomponent Geothermometry
Multicomponent geothermometry is based on the minerals contained in the geothermal reservoir rock, by using the SI of these minerals to estimate the reservoir temperature. When the SI curves converge in the line of SI = 0, the temperature is inferred to be the reservoir temperature. The results of the multicomponent geothermometry are shown in Figure 7. The estimated temperatures of Bayan, Tapu, and Tireku are in the range of 180–190 °C (Figure 7e,f,h). The estimated temperatures of Longfengku, Lengshniken, Matsao, and Szehuangping are in the range of 130–150 °C (Figure 7a–c,g). There are no points of intersection at SI = 0 in Tayukeng, indicating that there may not be a stable reservoir beneath the spring. The clustering shifted downward in Longfengku, Lengshniken, Matsao, and Szehuangping, indicating that these springs may be affected by dilution [34]. The estimated temperatures of the multicomponent geothermometry are higher than those of quartz geothermometry. The underestimation of temperature with quartz geothermometry may be caused by groundwater mixing.
4.4. Isotope Characteristics
The isotope ratio change (fractionate) mainly occurs during a phase change or isotopic exchange between two phases due to the relative mass differences. Water from different origins and conditions have different isotope ratios. Stable isotope ratios in groundwater are useful tools for hydrological and hydrogeological studies, providing information about the water source. In this study, we analyzed the oxygen and hydrogen isotopes of spring water, river water, and groundwater to understand the origin and chemical evolution of the TVG.
The isotope data are shown in Figure 8. The average values of δD and δ18O are −5.48‰ and −25.48‰, −5.84‰ and −28.23‰, and −4.33‰ and −23.19‰ for river water, groundwater, and spring water, respectively. Groundwater and stream water samples fall close to the GMWL (δD = 8 δ18O + 10; [38]) and the LMWL (δD = 9.3 δ18O + 27; [45]), indicating a meteoric origin. Some of the spring water deviates from the MWL, showing a positive shift in both δD and δ18O, which may be caused by shallow groundwater mixing with geothermal gases, as shown in Figure 8. The slope of the enrichment trend is 4.1. The δD displays dissimilarities between the north and south areas in river water, groundwater, and thermal water. The north and south areas can be divided by Lengshniken and Qigu. In general, δD in the north-area water was higher than −25‰, but lower than −25‰ in the southern area. The isotope characteristics of precipitation in Taiwan are influenced by the moisture sources; the isotopes in summer precipitation are relatively depleted compared to those in winter precipitation [40]. The seasonal variation in the groundwater level indicated that the aquifer in the northern area is recharged in winter and that in the southern area is recharged in the summer [29]. The δD difference in the north and south areas may be caused by seasonal differences in the groundwater recharge.
However, some processes that influence the oxygen and hydrogen isotopes in thermal water include water–rock interaction, exchange with gas, mineral dissolution, and diffusion at high temperatures [18]. There are two types of oxygen and hydrogen isotope enrichment in the TVG. The first is the 18O enrichment with changing hydrogen isotope ratios, usually caused by water–rock interaction or water–steam separation in geothermal conditions. The second is the enrichment in both oxygen and hydrogen isotopes, caused by shallow groundwater mixed with H2S enriched gases separated from boiling fluid, along with evaporation [42,46].
To determine the processes affecting the isotope composition of thermal water, relationships between isotopes and temperature were considered, as shown in Figure 9. During evaporation, 16O and 1H tend to be enriched in the vapor phase and 18O and 2H remain in the water phase, increasing the δD and δ18O values of water. In Figure 9, the correlations show a significant relationship between the water temperature and isotopes. The results show that the stable isotopes of thermal water in the TVG were modified by evaporation at high temperatures.
5. Conclusions
This paper investigates the factors controlling the thermal water hydrogeochemical and isotopic characteristics, based on the hydrogeochemistry and isotopes of hot springs in TVG. According to the geochemical composition analyses from 2009 to 2014, all ion concentrations remained stable, but the temperature slightly decreased. The spatial distribution of the temperature and pH of the hot spring was consistent with the geologic structure. At the center of the Tatun geothermal field, the springs are neutral with a low temperature. In the northeast and southwest of the geothermal field, the spring is acidic with higher temperatures. All springs were immature, indicating that these waters were far from equilibrated. Therefore, the results of cation geothermometry are inaccurate. The only mineral in equilibrium in most of the springs was quartz; therefore, quartz geothermometry may be used as a suitable geothermometer. Multicomponent geothermometry provided an estimate of the reservoir temperature ranging from 130 to 190 °C. The underestimation of temperature with quartz geothermometry may be caused by dilution. Isotope data show that the groundwater and stream water are of meteoric origin. Due to evaporation, the thermal water is enriched in both δ18O and δD. The surface water in the Tatun volcano group was affected by seasonal recharge. The results can provide useful information for building a conceptual thermal model of the Tatun volcano group.
Author Contributions
H.-H.H. contrived the subject of the article, performed the literature review and contributed to the writing of the paper; H.-F.Y. participated in data processing and the elaboration of the statistical analysis and figures. All authors have read and agreed to the published version of the manuscript.
Funding
The authors are grateful for the support from the Headquarters of University Advancement at the National Cheng Kung University, sponsored by the Ministry of Education, Taiwan, ROC. This research received no external funding.
Acknowledgments
The authors wish to thank two anonymous reviewers for their constructive comments, which improved the manuscript.
Conflicts of Interest
The authors declare no conflict of interest.
References
- Liu, C.-M.; Song, S.-R.; Chen, Y.-L.; Tsao, S. Characteristics and Origins of Hot Springs in the Tatun Volcano Group in Northern Taiwan. Terr. Atmos. Ocean. Sci. 2011, 22, 475. [Google Scholar] [CrossRef] [Green Version]
- Blasco, M.; Gimeno, M.J.; Auqué, L.F. Low Temperature Geothermal Systems in Carbonate-Evaporitic Rocks: Mineral Equilibria Assumptions and Geothermometrical Calculations. Insights from the Arnedillo Thermal Waters (Spain). Sci. Total. Environ. 2018, 615, 526–539. [Google Scholar] [CrossRef] [PubMed]
- Su, C.; Ba, J.; Chen, Q.; Pan, X. Hydrogeochemistry and Environmental Isotope Compositions and Their Evolution in Geothermal Groundwater in Yizhang, Hunan Province, China. Environ. Eng. Manag. J. 2019, 18, 765–774. [Google Scholar] [CrossRef]
- Mroczek, E.; Milicich, S.D.; Bixley, P.; Sepulveda, F.; Bertrand, E.; Soengkono, S.; Rae, A. Ohaaki Geothermal System: Refinement of a Conceptual Reservoir Model. Geothermics 2016, 59, 311–324. [Google Scholar] [CrossRef]
- Gao, Z.; Liu, J.; Li, F.; Wang, M.; Feng, J.; Wu, G. Hydrochemical Characteristics and Temporal Variations of Geothermal Water Quality in Tangtou, Shandong, China. Water 2019, 11, 1643. [Google Scholar] [CrossRef] [Green Version]
- Mohammadi, Z.; Bagheri, R.; Jahanshahi, R. Hydrogeochemistry and Geothermometry of Changal Thermal Springs, Zagros Region, Iran. Geothermics 2010, 39, 242–249. [Google Scholar] [CrossRef]
- Li, J.; Yang, G.; Sagoe, G.; Li, Y. Major Hydrogeochemical Processes Controlling the Composition of Geothermal Waters in the Kangding Geothermal Field, Western Sichuan Province. Geothermics 2018, 75, 154–163. [Google Scholar] [CrossRef]
- Wang, X.; Qiao, W.; Chen, J.; Liu, X.; Yang, F. Understanding the Burial and Migration Characteristics of Deep Geothermal Water Using Hydrogen, Oxygen, and Inorganic Carbon Isotopes. Water 2017, 10, 7. [Google Scholar] [CrossRef] [Green Version]
- Vespasiano, G.; Apollaro, C.; De Rosa, R.; Muto, F.; LaRosa, S.; Fiebig, J.; Mulch, A.; Marini, L. The Small Spring Method (SSM) for the Definition of Stable Isotope–Elevation Relationships in Northern Calabria (Southern Italy). Appl. Geochem. 2015, 63, 333–346. [Google Scholar] [CrossRef]
- Apollaro, C.; Vespasiano, G.; Muto, F.; De Rosa, R.; Barca, D.; Marini, L. Use of Mean Residence Time of Water, Flowrate, and Equilibrium Temperature Indicated by Water Geothermometers to Rank Geothermal Resources. Application to the Thermal Water Circuits of Northern Calabria. J. Volcanol. Geotherm. Res. 2016, 328, 147–158. [Google Scholar] [CrossRef]
- Doveri, M.; Lelli, M.; Marini, L.; Raco, B. Revision, Calibration, and Application of the Volume Method to Evaluate the Geothermal Potential of Some Recent Volcanic Areas of Latium, Italy. Geothermics 2010, 39, 260–269. [Google Scholar] [CrossRef]
- Chambefort, I.; Buscarlet, E.; Wallis, I.; Sewell, S.; Wilmarth, M. Ngatamariki Geothermal Field, New Zealand: Geology, Geophysics, Chemistry and Conceptual Model. Geothermics 2016, 59, 266–280. [Google Scholar] [CrossRef]
- Alam, B.Y.C.S.S.S.; Itoi, R.; Taguchi, S.; Saibi, H.; Yamashiro, R. Hydrogeochemical and Isotope Characterization of Geothermal Waters from the Cidanau Geothermal Field, West Java, Indonesia. Geothermics 2019, 78, 62–69. [Google Scholar] [CrossRef]
- Vespasiano, G.; Apollaro, C.; Muto, F.; Dotsika, E.; De Rosa, R.; Marini, L. Chemical and Isotopic Characteristics of the Warm and Cold Waters of the Luigiane Spa near Guardia Piemontese (Calabria, Italy) in a Complex Faulted Geological Framework. Appl. Geochem. 2014, 41, 73–88. [Google Scholar] [CrossRef]
- Xu, T.; Hou, Z.; Jia, X.; Spycher, N.; Jiang, Z.; Feng, B.; Na, J.; Yuan, Y. Classical and Integrated Multicomponent Geothermometry at the Tengchong Geothermal Field, Southwestern China. Environ. Earth Sci. 2016, 75, 1502. [Google Scholar] [CrossRef] [Green Version]
- Martínez-Florentino, A.K.; Esteller, M.; Domínguez-Mariani, E.; Expósito, J.L.; Paredes, J. Hydrogeochemistry, Isotopes and Geothermometry of Ixtapan de la Sal–Tonatico Hot Springs, Mexico. Environ. Earth Sci. 2019, 78, 600. [Google Scholar] [CrossRef]
- Aydin, H.; Karakuş, H.; Mutlu, H. Hydrogeochemistry of Geothermal Waters in Eastern Turkey: Geochemical and Isotopic Constraints on Water-Rock Interaction. J. Volcanol. Geotherm. Res. 2020, 390, 106708. [Google Scholar] [CrossRef]
- Karolytė, R.; Serno, S.; Johnson, G.; Gilfillan, S.M.V. The Influence of Oxygen Isotope Exchange between CO2 and H2O in Natural CO2 -Rich Spring Waters: Implications for Geothermometry. Appl. Geochem. 2017, 84, 173–186. [Google Scholar] [CrossRef]
- Chen, C.H.; Lin, S.B. Eruptions Younger than 20 ka of the Tatun Volcano Group as Viewed from the Sediments of the Sungshan Formation in Taipei Basin. West. Pac. Earth Sci. 2002, 2, 191–204. [Google Scholar]
- Yang, T.; Sano, Y.; Song, S. 3He/4He Ratios of Fumaroles and Bubbling Gases of Hot Springs in Tatun Volcano Group, North Taiwan. Il Nuovo Cim. C 1999, 22, 281–286. [Google Scholar]
- Lee, H.-F.; Yang, T.F.; Lan, T.F.; Chen, C.-H.; Song, S.-R.; Tsao, S. Temporal Variations of Gas Compositions of Fumaroles in the Tatun Volcano Group, Northern Taiwan. J. Volcanol. Geotherm. Res. 2008, 178, 624–635. [Google Scholar] [CrossRef]
- Konstantinou, K.I.; Lin, C.-H.; Liang, W.-T. Seismicity Characteristics of a Potentially Active Quaternary Volcano: The Tatun Volcano Group, Northern Taiwan. J. Volcanol. Geotherm. Res. 2007, 160, 300–318. [Google Scholar] [CrossRef]
- Ohba, T.; Sawa, T.; Taira, N.; Yang, T.F.; Lee, H.F.; Lan, T.F.; Ohwada, M.; Morikawa, N.; Kazahaya, K. Magmatic Fluids of Tatun Volcanic Group, Taiwan. Appl. Geochem. 2010, 25, 513–523. [Google Scholar] [CrossRef]
- Dobson, P.; Gasperikova, E.; Spycher, N.; Lindsey, N.J.; Guo, T.R.; Chen, W.-S.; Liu, C.H.; Wang, C.-J.; Chen, S.-N.; Fowler, A.P. Conceptual Model of the Tatun Geothermal System, Taiwan. Geothermics 2018, 74, 273–297. [Google Scholar] [CrossRef] [Green Version]
- Chen, C.H.; Wu, Y.J. Volcanic Geology of the Tatun Geothermal Area, Northern Taiwan. Proc. Geol. Soc. China 1971, 14, 5–20. [Google Scholar]
- Mining Research and Service Organization. The Geothermal Exploration of the Tatun Volcano Group (III); MRSO Report; MRSO: Taipei, Taiwan, 1971; p. 111. (In Chinese) [Google Scholar]
- Song, M.; Guan, Y. The Electronic Government Performance of Environmental Protection Administrations in Anhui Province, China. Technol. Forecast. Soc. Chang. 2015, 96, 79–88. [Google Scholar] [CrossRef]
- Industrial Technology Research Institute. High Performance Geothermal Power Generation Technology Research Project. 103 D0102. Research Institution Energy Technology Development Program 2014 Executive Report; Ministry of Economic Affairs: Taipei, Taiwan, 2014. (In Chinese)
- Tsai, J.H. Oxygen and Hydrogen Isotope Studies of Surface Water and Groundwaters in the Tatun Volcano Group. Master’s Thesis, Chinese Culture University, Taipei, Taiwan, 2013. (In Chinese). [Google Scholar]
- Fournier, R. Chemical Geothermometers and Mixing Models for Geothermal Systems. Geothermics 1977, 5, 41–50. [Google Scholar] [CrossRef]
- Fournier, R.O.; Potter, R. Revised and Expanded Silica (Quartz) Geothermometer. Geotherm. Resour. Counc. Bull. 1982, 11, 10. [Google Scholar]
- Fournier, R.O. A Revised Equation for the Na/K Geothermometer. J. Water. Resour. Prot. 1979, 3, 221–224. [Google Scholar]
- Fournier, R.O. Water Geothermometers Applied to Geothermal Energy. In Application of Geochemistry in Geothermal Reservoir Development; Center on Small Energy Resources: Rome, Italy, 1991; pp. 37–69. [Google Scholar]
- Reed, M.; Spycher, N. Calculation of pH and Mineral Equilibria in Hydrothermal Waters with Application to Geothermometry and Studies of Boiling and Dilution. Geochim. Cosmochim. Acta 1984, 48, 1479–1492. [Google Scholar] [CrossRef]
- Parkhurst, D.L.; Appelo, C. Description of Input and Examples for PHREEQC Version 3: A Computer Program for Speciation, Batch-Reaction, One-Dimensional Transport, and Inverse Geochemical Calculations; US Geological Survey: Reston, VA, USA, 2013. [CrossRef] [Green Version]
- Charlton, S.R.; Parkhurst, D.L. Modules Based on the Geochemical Model Phreeqc for Use in Scripting and Programming Languages. Comput. Geosci. 2011, 37, 1653–1663. [Google Scholar] [CrossRef]
- Yeh, H.-F.; Lin, H.-I.; Lee, C.-H.; Hsu, K.-C.; Wu, C.-S. Identifying Seasonal Groundwater Recharge Using Environmental Stable Isotopes. Water 2014, 6, 2849–2861. [Google Scholar] [CrossRef]
- Craig, H. Isotopic Variations in Meteoric Waters. Science 1961, 133, 1702–1703. [Google Scholar] [CrossRef]
- Van der Straaten, C.M.; Mook, W.G. Stable Isotopic Composition of Precipitation and Climatic Variability. In Palaeoclimates and Palaeowaters: A Collection of Environ- Mental Isotope Studies; IAEA: Vienna, Austria, 1983. [Google Scholar]
- Peng, T.R.; Wang, C.H.; Huang, C.C.; Fei, L.Y.; Chen, C.T.A.; Hwong, J.L. Stable Isotopic Characteristic of Taiwan’s Precipitation: A Case Study of Western Pacific Monsoon Region. Earth Planet. Sci. Lett. 2010, 289, 357–366. [Google Scholar] [CrossRef]
- Piper, A.M. A Graphic Procedure in the Geochemical Interpretation of Water-Analyses. Trans. Am. Geophys. Union 1944, 25, 914–928. [Google Scholar] [CrossRef]
- Ohsawa, S.; Lee, H.F.; Liang, B.; Komori, S.; Chen, C.H.; Kagiyama, T. Geochemical Characteristics and Origins of Acid Hot Spring Waters in Tatun Volcanic Group, Taiwan. J. Hot Spring Sci. 2013, 62, 282–293. [Google Scholar]
- Tseng, H.C. 3D Geological Structure and Potentials of Geothermal Power in the Tatun Volcano Group. Master’s Thesis, National Taiwan University, Taipei, Taiwan, 2014. (In Chinese). [Google Scholar]
- Giggenbach, W.F. Geothermal Solute Equilibria. Derivation of Na-K-Mg-Ca Geoindicators. Geochim. Cosmochim. Acta 1988, 52, 2749–2765. [Google Scholar] [CrossRef]
- Liu, K.K.; Chen, C.C.; Shieh, Y.N.; Chiang, S.C. Hydrogen and Oxygen Isotopic Compositions of Meteoric Waters from the Tatun Shan Area, Northern Taiwan. Bull. Inst. Earth Sci. 1984, 4, 159–175. (In Chinese) [Google Scholar]
- Ignacio, S.T.-A.; Muharrem, S.; Daniel, P.Z.; Peter, B. Stable Isotope Composition of Hydrothermally Altered Rocks and Hydrothermal Minerals at the Los Azufres Geothermal Field, Mexico. Turk. J. Earth Sci. 2012, 21, 127–143. [Google Scholar]
Figure 1.
Location map of the springs in the Tatun Volcano Group.

Figure 2.
Simplified geological map of the Tatun Volcano Group.

Figure 3.
Piper diagram of the Tatun geothermal field hot spring waters.

Figure 4.
pH contour plots of the Tatun geothermal field hot spring for the three time periods (a) 2009; (b) 2010; (c) 2011.
Figure 4.
pH contour plots of the Tatun geothermal field hot spring for the three time periods (a) 2009; (b) 2010; (c) 2011.

Figure 5.
Temperature contour plots of the Tatun geothermal field hot spring for the three time periods (a) 2009; (b) 2010; (c) 2011.
Figure 5.
Temperature contour plots of the Tatun geothermal field hot spring for the three time periods (a) 2009; (b) 2010; (c) 2011.

Figure 6.
Na-K-Mg diagram for the Tatun geothermal field.

Figure 7.
Multicomponent geothermometry for Tatun geothermal field hot spring waters.


Figure 8.
Relationship between δD and δ18O of groundwater, stream water, and hot spring water in the TVG. The blue and yellow data points indicate the samples in the north and south areas of the TVG, respectively.
Figure 8.
Relationship between δD and δ18O of groundwater, stream water, and hot spring water in the TVG. The blue and yellow data points indicate the samples in the north and south areas of the TVG, respectively.

Figure 9.
The relationship between the spring temperature and (a) δ18O and (b) δD in the TVG.


Table 1.
Temperature equations (in °C) for geothermometers used in this study. Concentration units for the elements are in mg/L.
Table 1.
Temperature equations (in °C) for geothermometers used in this study. Concentration units for the elements are in mg/L.
| Geothermometer | Equation |
|---|---|
| Chalcedony [30] | |
| Quartz [31] | |
| Na-K [32] | |
| K-Mg [33] |
This is a modification from previously study [2].
Table 2.
Chemical composition of springs from the Tatun geothermal field in Taiwan. (T in °C, EC in μs/cm, concentrations in mg/L, -: not detected).
Table 2.
Chemical composition of springs from the Tatun geothermal field in Taiwan. (T in °C, EC in μs/cm, concentrations in mg/L, -: not detected).
| Location | Temp (°C) | EC | pH | TDS | CI− | SO42− | HCO3− | SiO2 | Na+ | Ca2+ | K+ | Mg2+ |
|---|---|---|---|---|---|---|---|---|---|---|---|---|
| LFK | 49.10 | 295.00 | 5.71 | 185.00 | 23.11 | 104.20 | - | 23.50 | 11.60 | 20.50 | 9.84 | 10.30 |
| LSK | 40.20 | 1321.00 | 6.03 | 900.00 | 187.50 | 312.50 | 255.30 | 61.20 | 30.50 | 172.00 | 19.40 | 60.20 |
| MT | 53.40 | 611.00 | 3.93 | 392.00 | 11.26 | 178.60 | 104.30 | 55.40 | 10.30 | 71.30 | 10.10 | 21.20 |
| TYK | 73.70 | 12,960.00 | 2.00 | 10,740.00 | 935.20 | 5128.00 | - | 102.00 | 20.30 | 20.20 | 21.30 | 10.40 |
| TRK | 55.80 | 19,540.00 | 1.58 | 17,080.00 | 2684.00 | 3658.00 | - | 62.40 | 451.00 | 213.00 | 212.00 | 61.20 |
| BY | 65.20 | 2043.00 | 2.50 | 1424.00 | 104.70 | 611.70 | - | 60.30 | 10.40 | 41.30 | 12.50 | 15.30 |
| SHP | 63.80 | 976.00 | 2.91 | 646.00 | 6.54 | 421.10 | - | 10.40 | 11.30 | 20.70 | 10.30 | 11.30 |
| TP | 69.80 | 22.10 | 1.87 | 19.30 | 4284.00 | 2270.00 | - | 91.70 | 1524.00 | 251.00 | 278.00 | 261.00 |
Table 3.
Geothermometer results of Tatun geothermal field hot spring waters.
| Sample | Spring T (°C) | Chalcedony (°C) | Quartz (°C) | Na-K (°C) | K2-Mg (°C) |
|---|---|---|---|---|---|
| LFK | 49.1 | 37.7 | 69.9 | 533.0 | 6.7 |
| LSK | 40.2 | 82.3 | 111.7 | 471.4 | 12.8 |
| MT | 53.4 | 77.1 | 107.0 | 568.1 | 16.9 |
| TYK | 73.7 | 111.7 | 138.4 | 585.6 | −13.9 |
| TRK | 55.8 | 83.3 | 112.7 | 416.0 | −45.0 |
| BY | 65.2 | 81.5 | 111.0 | 622.9 | 5.5 |
| SHP | 63.8 | 7.8 | 39.1 | 550.1 | 6.8 |
| TP | 69.8 | 105.2 | 132.5 | 285.8 | −35.9 |
Table 4.
Mineral saturation index of the Tatun geothermal field.
| Location | Anhydrite | Chalcedony | Chrysotile | Gypsum | Halite | Quartz | Sepiolite | Sylvite | Talc |
|---|---|---|---|---|---|---|---|---|---|
| LFK | −2.05 | −0.11 | −12.74 | −1.99 | −8.14 | 0.24 | −9.72 | −7.86 | −8.98 |
| LSK | −1.12 | 0.39 | −9.02 | −0.98 | −6.86 | 0.78 | −6.11 | −6.69 | −4.35 |
| MT | −1.37 | 0.22 | −21.47 | −1.36 | −8.52 | 0.56 | −5.92 | −8.21 | −17.01 |
| TYK | −1.25 | 0.31 | −33.09 | −1.43 | −6.47 | 0.61 | −23.33 | −6.22 | −28.25 |
| TRK | −0.71 | 0.26 | −34.83 | −0.72 | −4.67 | 0.60 | −24.04 | −4.69 | −30.25 |
| BY | −1.23 | 0.14 | −29.75 | −1.33 | −7.59 | 0.46 | −21.13 | −7.23 | −25.32 |
| SHP | −1.57 | −0.61 | −29.19 | −1.66 | −8.74 | −0.29 | −21.97 | −8.49 | −26.27 |
| TP | −0.67 | 0.31 | −29.48 | −0.82 | −3.97 | 0.61 | −20.81 | −4.46 | −24.67 |
© 2020 by the authors. Licensee MDPI, Basel, Switzerland. This article is an open access article distributed under the terms and conditions of the Creative Commons Attribution (CC BY) license (http://creativecommons.org/licenses/by/4.0/).
Share and Cite
MDPI and ACS Style
Hsu, H.-H.; Yeh, H.-F. Factors Controlling of Thermal Water Hydrogeochemical Characteristics in Tatun Volcano Group, Taiwan. Water 2020, 12, 2473. https://doi.org/10.3390/w12092473
AMA Style
Hsu H-H, Yeh H-F. Factors Controlling of Thermal Water Hydrogeochemical Characteristics in Tatun Volcano Group, Taiwan. Water. 2020; 12(9):2473. https://doi.org/10.3390/w12092473
Chicago/Turabian StyleHsu, Hung-Hsiang, and Hsin-Fu Yeh. 2020. "Factors Controlling of Thermal Water Hydrogeochemical Characteristics in Tatun Volcano Group, Taiwan" Water 12, no. 9: 2473. https://doi.org/10.3390/w12092473
Note that from the first issue of 2016, this journal uses article numbers instead of page numbers. See further details here.