Review

Recent Budget of Hydroclimatology and Hydrosedimentology of the Congo River in Central Africa

1
IRD, GET-UMR CNRS/IRD/UPS—UMR 5562 du CNRS, UMR 234 de l’IRD, 900 rue J.F.Breton, 34090 Montpellier, France
2
LMEI/CUSI/ENSP/Marien N’gouabi University, Brazzaville B.P. 69, Republic of the Congo
3
University of Montpellier, Eco&Sols-UMR IRD/INRA/Cirad/Supagro, UMR210 IRD, Place Viala (Bt. 12), CEDEX 2, 34060 Montpellier, France
4
Department of Physics, Faculty of Sciences (JMT), University of Kinshasa, B.P. 190 (JMT), Kinshasa XI, Democratic Republic of the Congo
5
HydroSciences Montpellier, UMR IRD-CNRS-Université de Montpellier, Maisons des Sciences de l’Eau, 300 avenue Emile Jeanbrau, 34090 Montpellier, France
6
Geography Department, University of Bangui, Bangui, Central African Republic
7
School of Civil Engineering, University of Leeds, Leeds LS2 9JT, UK
8
Departamento Manejo de Bosques y Medio Ambiente, Facultad de Ciencias Forestales, Universidad de Concepción—UdeC, Concepción 407374, Chile
9
International Commission for Congo-Ubangi-Sangha basin (CICOS), Kinshasa B.P. 190, Democratic Republic of Congo
*
Author to whom correspondence should be addressed.
Water 2020, 12(9), 2613; https://doi.org/10.3390/w12092613
Submission received: 15 July 2020 / Revised: 9 September 2020 / Accepted: 10 September 2020 / Published: 18 September 2020

Abstract

:
Although the Congo Basin is still one of the least studied river basins in the world, this paper attempts to provide a multidisciplinary but non-exhaustive synthesis on the general hydrology of the Congo River by highlighting some points of interest and some particular results obtained over a century of surveys and scientific studies. The Congo River is especially marked by its hydrological regularity only interrupted by the wet decade of 1960, which is its major anomaly over nearly 120 years of daily observations. Its interannual flow is 40,500 m3 s−1. This great flow regularity should not hide important spatial variations. As an example, we can cite the Ubangi basin, which is the most northern and the most affected by a reduction in flow, which has been a cause for concern since 1970 and constitutes a serious hindrance for river navigation. With regard to material fluxes, nearly 88 × 106 tonnes of material are exported annually from the Congo Basin to the Atlantic Ocean, composed of 33.6 × 10⁶ tonnes of TSS, 38.1 × 10⁶ tonnes of TDS and 16.2 × 10⁶ tonnes of DOC. In this ancient flat basin, the absence of mountains chains and the extent of its coverage by dense rainforest explains that chemical weathering (10.6 t km−2 year−1 of TDS) slightly predominates physical erosion (9.3 t km−2 year−1 of TSS), followed by organic production (4.5 t km−2 year−1 of DOC). As the interannual mean discharges are similar, it can be assumed that these interannual averages of material fluxes, calculated over the longest period (2006–2017) of monthly monitoring of its sedimentology and bio-physical-chemistry, are therefore representative of the flow record available since 1902 (with the exception of the wet decade of 1960). Spatial heterogeneity within the Congo Basin has made it possible to establish an original hydrological classification of right bank tributaries, which takes into account vegetation cover and lithology to explain their hydrological regimes. Those of the Batéké plateau present a hydroclimatic paradox with hydrological regimes that are among the most stable on the planet, but also with some of the most pristine waters as a result of the intense drainage of an immense sandy-sandstone aquifer. This aquifer contributes to the regularity of the Congo River flows, as does the buffer role of the mysterious “Cuvette Centrale”. As the study of this last one sector can only be done indirectly, this paper presents its first hydrological regime calculated by inter-gauging station water balance. Without neglecting the indispensable in situ work, the contributions of remote sensing and numerical modelling should be increasingly used to try to circumvent the dramatic lack of field data that persists in this basin.

1. Introduction

In terms of area and discharge, the Equatorial Congo River Basin is the second largest river in the world and the largest in Africa, but paradoxically remains one of the least known. This basin can still be considered as almost pristine because, given its size, it is relatively less anthropogenicized. This is at least partly due to the lack of transport infrastructure related to the inaccessibility of its large central swampy ‘Cuvette’ named ‘Cuvette Centrale’ covered by dense rainforest that occupies the heart of the basin. Shem and Dickinson (2006) [1] observed that, despite its crucial position as the third largest deep convection center in the world, the Congo Basin has not yet received adequate attention in the field of climate and hydrological research.
Considering the importance of the Congo Basin to global fluxes of water, energy, carbon, various suspended or dissolved elements to the ocean and to the atmosphere, and the recent renewed interest of the international scientific community, the purpose of this paper is to present a state-of-the-art review of existing studies and a synthesis of new results, especially on hydroclimatology and hydrosedimentology. Significantly, some passages that are useful for the international scientific community have been translated from previous publications, which unfortunately remain little consulted, despite their importance, mainly because they are written in French, the main spoken language in this basin.
Specifically, it presents and discusses: (i) an overview of the Congo Basin; (ii) the history of hydropluviometric networks in the Congo Basin; (iii) the rainfall and hydrologic features of the whole Congo Basin and four important sub-catchments, which have the longest multi-decadal chronology of data, and represent its mean hydro-ecosystems; (iv) the first indirect estimation of the hydrological regime of the mysterious ‘Cuvette Centrale’; (v) water quality sediment transport dynamics on the Congo River from in situ data at its main Brazzaville-Kinshasa Station; and (vi) some hydrological and hydrogeochemical singularities in the Congo catchment. It ends by illuminating the modeling and remote sensing “studies” and their main results and it concludes with the current state of human use and exploitation and the need for a coherent policy for its future protection and management. In this review paper, the methodologies that were used for each parameter studied can be found in the references that are cited as the origin of the results presented.

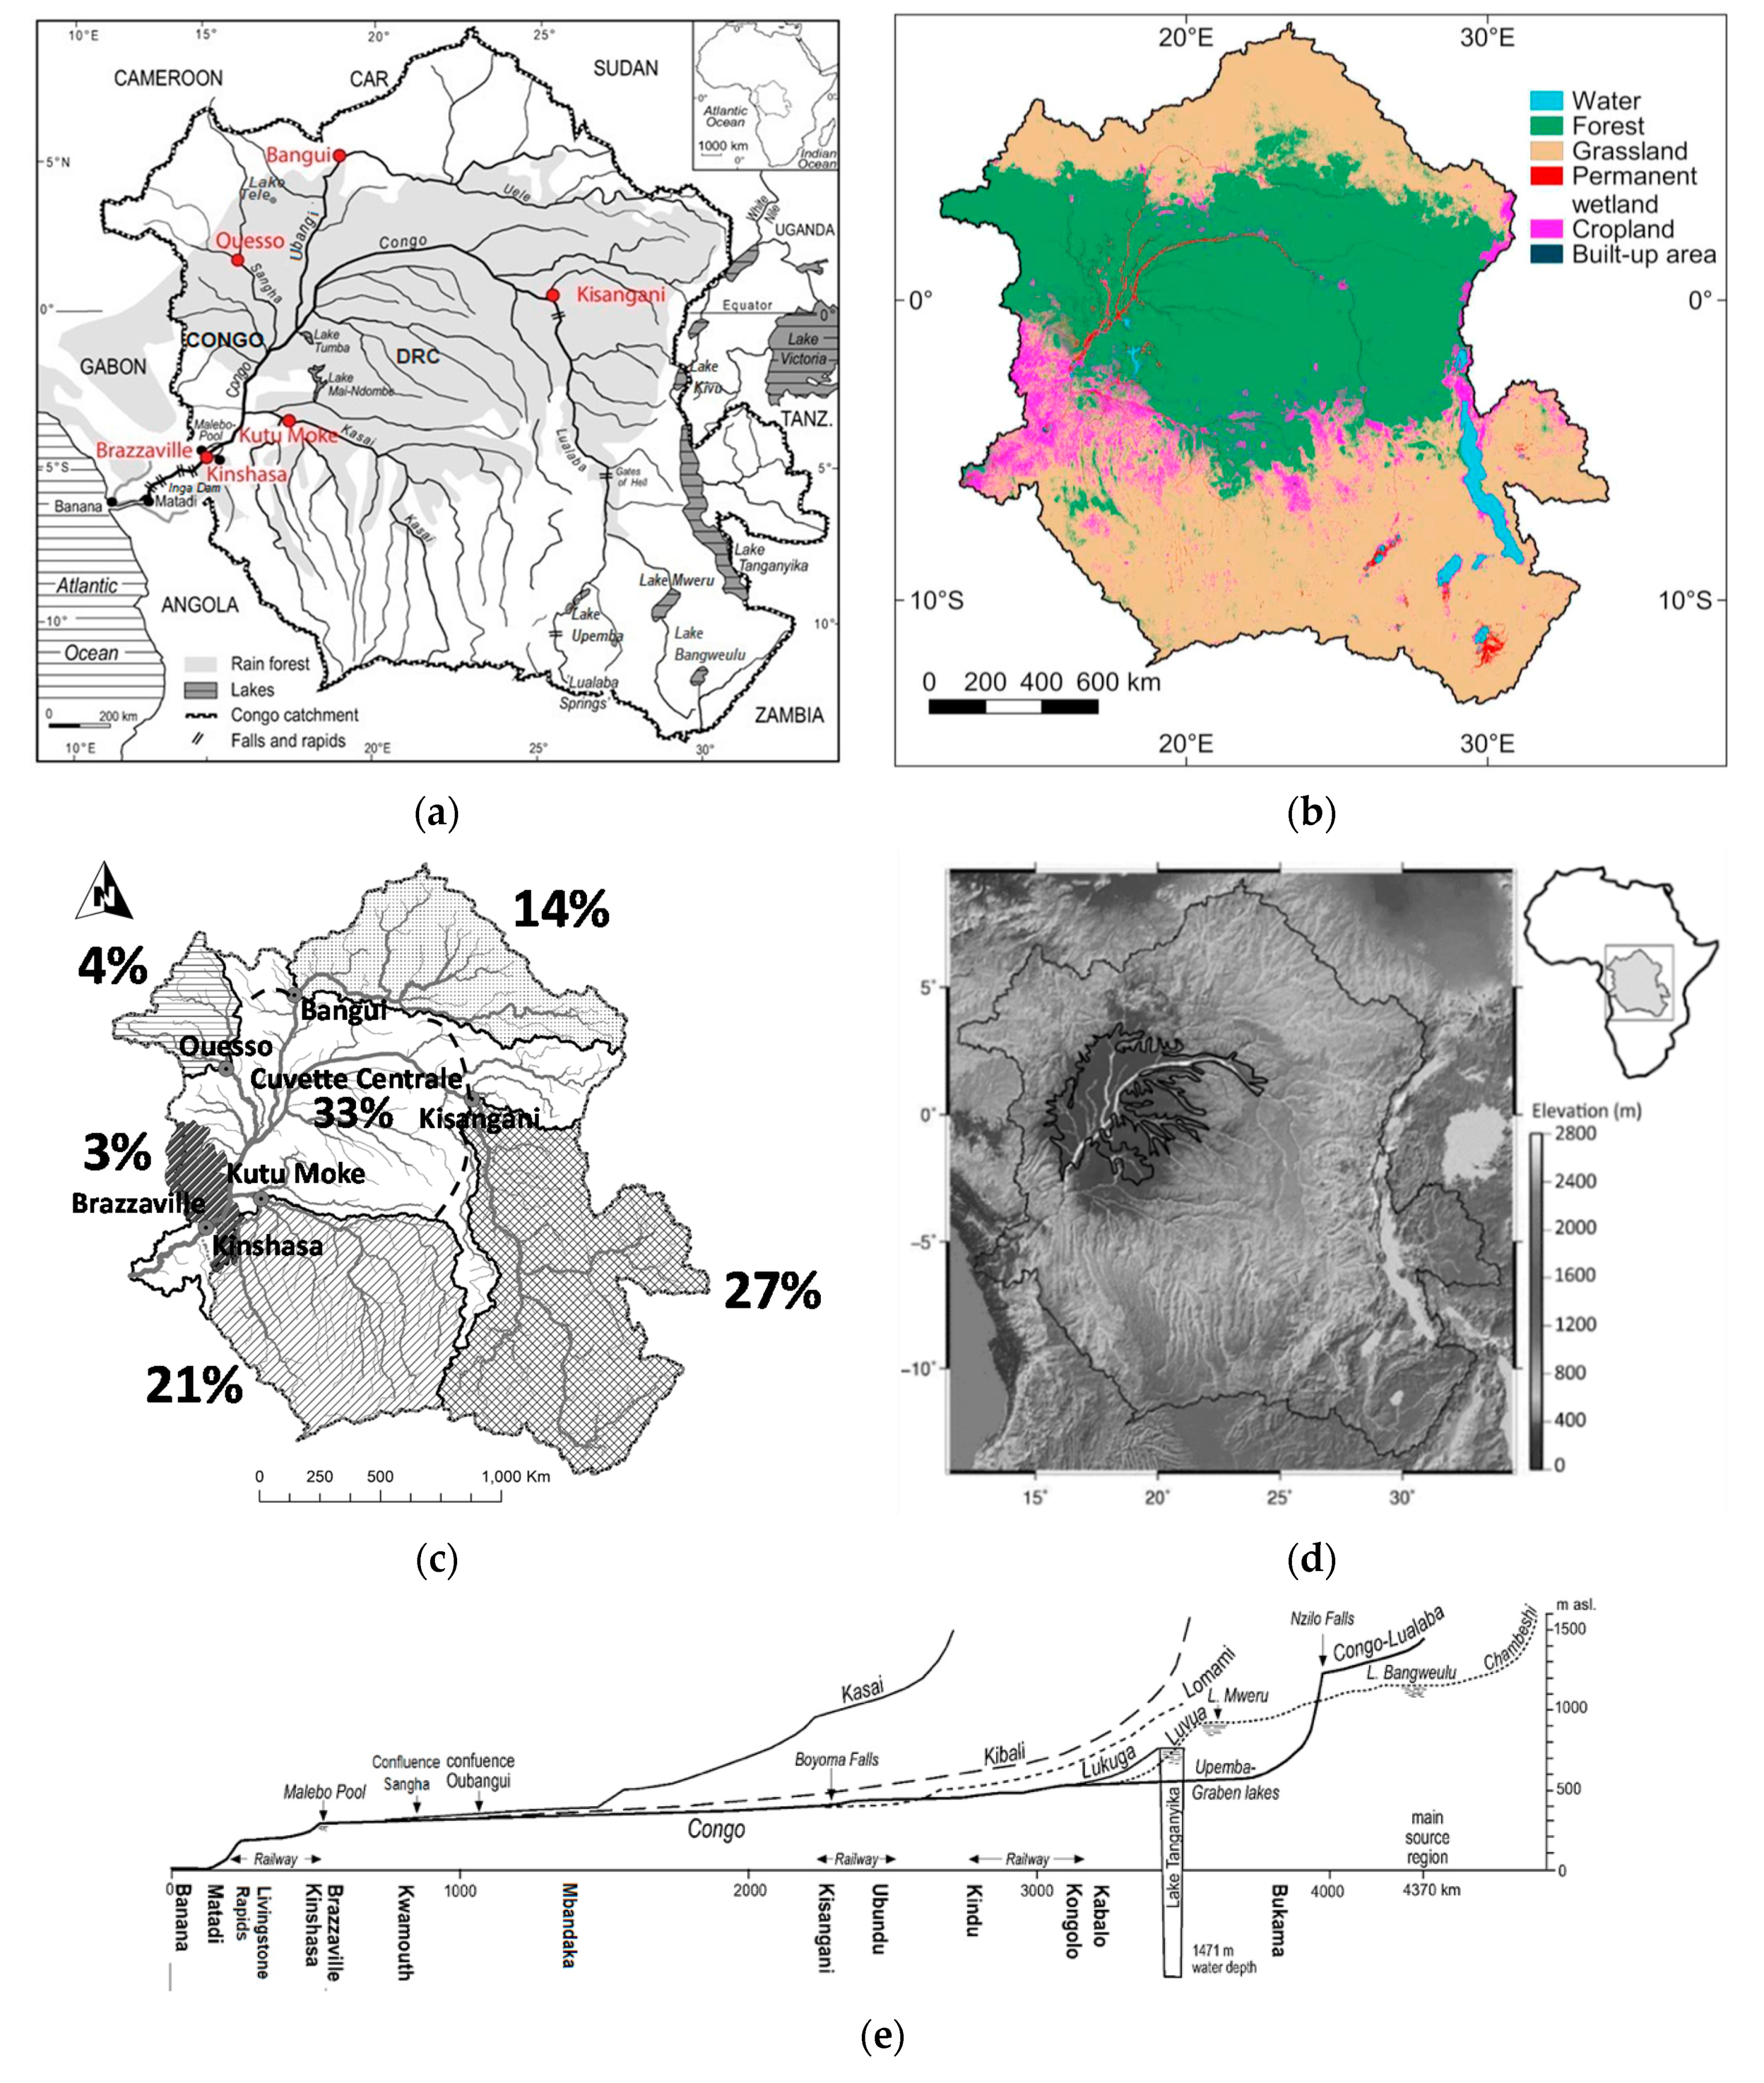
2. Geographical Presentation of the Congo River Basin (CRB)

The Congo is the largest river in the African continent with a basin area of about 3.7 × 10⁶ km2 and a mean annual discharge of 40,500 m3 s−1, calculated using 117 years of data, from 1902 to 2019 at its main hydrological station of Brazzaville-Kinshasa. This station represents 97% of the total basin area, is situated at an altitude of 277 m a.s.l., and is 498 km upstream of the river’s mouth to the Atlantic Ocean (Figure 1a,e). It is the second-largest river in the world in terms of discharge and catchment area. The 4700-km long Congo River provides half of all the river waters discharged from the African continent to the Atlantic Ocean [2]. The source of the Congo is located at 1420 m a.s.l. in the village of Musofi, south of the Katanga region (southeast of the Democratic Republic of Congo).
In the Northern hemisphere, on the right bank, the Ubangi River is the second-most important tributary in terms of discharge [3], after the major tributary, the Kasaï, located further downstream on the left bank (Figure 1). Just upstream of the major hydrometric stations of Brazzaville-Kinshasa, the Congo flows through Malebo Pool (ex. Stanley Pool), which corresponds to a wide channel reach about 20–25 km long, characterized by numerous sand bars, which emerge during low flows. Between Malebo Pool and its mouth, the Congo falls around 280 m over a distance of about 500 km. Here the many narrow channels create the rapids known as the Livingstone Falls. It is within this section of the river that the only important hydropower plant (Inga) was constructed on the Congo River. The Congo Basin spans nine different countries (Angola, Burundi, Cameroon, Democratic Republic of the Congo (DRC), Central Africa Republic (CAR), Republic of Congo, Rwanda, Tanzania and the Zambia). It comprises several thousands of navigable waterways, depending on the hydrologic period and on the draft of the ships and their tonnage.
The form, relief, geology, climate, and vegetation cover of the Congo Basin (Figure 1a–d) are generally concentrically distributed. Surrounded by savannahs on smoothly rounded hills from deeply weathered Mesozoic Precambrian formations [4], less than 44% of the catchment area is covered by rainforest, which promotes the capacity to recycle the basin’s moisture [5]. The basin can be divided into six main hydrologic units (Figure 1c), which are its main distinctive physiographic regions. Their areas and hydroclimatic features are listed in Table 1. Five of the six units are monitored by gauging stations.
The two main overlapping 60-year rainfall study periods are 1940–1999 and 1952–2012, and their data comes from the SIEREM database website (www.hydrosciences.fr/sierem) [6] and BRLi (2016) [7], respectively. This quite concentric shape of Congo watershed presents the following main physiographic characteristics.
Its northern and southern margins are dominated by a set of shield plateaus covered by shrub and tree savannah vegetation and are characterized by a humid tropical transition climate and annual rainfall between 1400 to 1800 mm year−1. The more northerly part of the Congo Basin, which is drained by the Ubangi tributary, is a less humid region, well described by Runge and Nguimalet (2005) [8]. With a total rainfall of around 1500 mm year−1, its watershed benefits from a transitional humid tropical climate with the Sudanese-Sahelian regions farthest north. In the south of the Congo Basin, the sub-basin of the Kasaï River receives rainfall of about 1460 mm year−1.
In the lowlands center of the basin, under an equatorial climate marked by rainfall of 1600 to 1800 mm year−1, the “Cuvette Centrale” is a topographic depression of about 1,176,000 km2 [7]. Its floodplain (Figure 1d) covers about 30%, or 360,000 km2 [9] of the total basin area. This area is characterized by very small topographical slopes (2 cm km−1) on unconsolidated Cenozoic sediments [4], constituted of alluvial deposits. These formations are covered by rainforests, permanently or periodically flooded, according to the hydro-rainfall cycle. There are also extensive but shallow lakes such as Lac Tumba, Lac Maï Ndombe, etc.
In its northwestern part, the Sangha basin is mainly covered by dense rainforest, and under an equatorial climate receives a mean rainfall ranging of 1625 mm year−1.
In the west, the Batéké plateau constitutes a high-altitude sandstone aquifer recharged by rainfall (1800 to 2000 mm year−1), which controls the hydrological regime of the watercourses draining this aquifer. Both the runoff coefficient (50%) and the specific discharge (close to 35 L s−1 km−2) are the highest in this region [10].
In the east is the highest point of the basin, the Karisimbi volcano with 4507 m a.s.l situated in the Virunga mountain chain of the East-African rift. This region is located in the Lualaba basin, which receives between 1110 and 1680 mm year−1 depending on the location [7].
Straddling the Equator, the Congo River shows a poorly-contrasted equatorial regime, with low seasonal discharge variability of 3.3, measured as the ratio between the highest monthly mean discharge of 75,500 m3 s−1 and the lowest of 23,000 m3 s−1. The Congo River also has a relatively low inter-annual variability of 1.66, measured as the ratio between the lowest and highest known annual discharges. The hydrological year, begins in August and is marked by the alternation of two periods of high flows (October–January; April–May) and two periods of low flows (February–March; June–September) and presents an amplitude range of 3.65 m, which can arise 6.54 m at Brazzaville-Kinshasa.

3. Brief History of Hydropluviometric Networks in the Congo Basin

The hydropluviometric networks originate from the colonial era, when Belgium occupied the left bank of the river, which is now the Democratic Republic of Congo (DRC) and France occupied the right bank, now known as the Central African Republic (CAR), the Republic of Congo, and part of Cameroon.

3.1. Rainfall Network

ORSTOM (Office de Recherche Scientifique et Technique d’Outre Mer), known today as IRD (Institut de Recherche pour le Développement), participated in the management of the network of rainfall measurements on the right bank of the Congo river since the 1940s until the independence of the Republic of Congo, the Central African Republic, and Cameroon.
After the independence of these countries at the beginning of the 1960s, climate surveys were continued by ASECNA (Agency for Aerial Navigation Safety in Africa and Madagascar) and by the National Meteorological Departments.
In the DRC, due to the importance of the rainforest vegetation and the very few developed road networks, the density of the rainfall network is scarce in most of the central part of the basin, except on the Ubangi sub-basin area (Figure 2a). Observed rainfall data are also scarce in Angola. Observation data are a little more numerous in Zambia and Tanzania, but rainfall data are poorly available during and after the last years of the 20th century in most of these countries, due to a general decline in support of the networks. In CAR, the pluviometric database was completed through the PIRAT and PEGI programs [16] and then Callède et al. (2009) [17] produced a monograph on the Ubangi basin. In this basin, Nguimalet and Orange (2019) [3] studied a rainfall series from 1940 to 2015.
In the entire Congo Basin, a compilation of available and accessible rainfall data could only be carried out for the period 1940–1999, from the free access SIEREM database website [6] and the annual rainfall map of Africa (Figure 2b) [18] is today the last reference for this basin in addition to the older reference of Bultot (1971) [19].

3.2. Discharges Network

In the entire Congo Basin, during the first half of the 20th century, there were more than 400 functional hydrometric stations (Figure 3a). Since the basin countries’ independence, only fifteen are still operational today (Figure 3b). On the left bank, the hydrometric network was more or less abandoned. It was maintained on the right bank tributaries until the end of the 20th century by ORSTOM (ex. IRD), which had created hydro-pluviometric networks during the 1940s. However, the National Inland Navigation Services, RVF (Régie des Voies Fluviales) on the left bank, and GIE-SCEVN (Groupement d’Intérêt Economique—Service Commun d’Entretien des Voies Navigables) on the right bank, have continued to this day the hydrometric surveys of some stations located on the navigable routes. The CICOS (Commission Internationale du bassin Congo-Oubangui-Sangha) is responsible for the IWRM (Integrated Water Resources Management) within the Basin. Cameroon is the only country to have created a real operational NHS (National Hydrological Service).
An inventory of existing data series can be found on the GRDC (Global Runoff Data Center) [21] and on the SIEREM website [6,20]. Thanks to BRLi (2016) [7] with the authorization of the CICOS, the Observatory Service SO-HYBAM [22] presents some daily and monthly hydrometric data today realized by the GIE-SCEVN and the RVF, on the five key stations with regular measurements from the beginning and from the second half of the past century, which are chosen for this study:
(1) The main station of Brazzaville-Kinshasa (BZV/KIN) on Congo River represents 97% of the entire Congo Basin. Measurements began in March 1902 in Kinshasa on its left bank, while measurements at Brazzaville on the other bank, opposite of Kinshasa, began in 1947.
Observed data on the Congo River, at the Kinshasa left bank station (1902–1983) are available from the GRDC and in the Mateba 22 report (1984) [23].
These data have been used to extend the water-stage data series from the Brazzaville station on the right bank, back to 1902 [14,24] to produce a single time series discharge of 117 years from 1902 to today, available on https://hybam.obs-mip.fr/ [22].
(2) On the mainstream of the Congo River (Figure 1), apart from the main gauging station of Brazzaville-Kinshasa (BZV/KIN), there exists only the Kisangani gauging station with a good daily discharge data record, for the period from 1951–2012 [7]. From upstream of the Bayoma falls (ex. Stanley Falls) at Kisangani, the river is known as Lualaba River.
(3) There are very little discharge data for left bank tributaries, although at many former gauging stations, water heights have been acquired during several decades. However, they have no known discharge time series associated with them, due mainly to the lack of gauging and rating curves. Fortunately, daily discharge from the Kasai River, the largest tributary of Congo, are available at its main Kutu Moke station for the period of 1948–2012 [7].
The main right bank hydrometric stations that are still active, and with a long time series of daily discharges are:
(4) Bangui on the Ubangi River (the second largest tributary to the Congo River, available from 1936) and,
(5) Ouesso on the Sangha River, available from 1948, both on https://hybam.obs-mip.fr/ [22].
A remarkable gap remains in understanding the hydro-climate processes in this region, thus leading to uncertainties and risks in decision-making for the major water resources development plans currently under discussion.

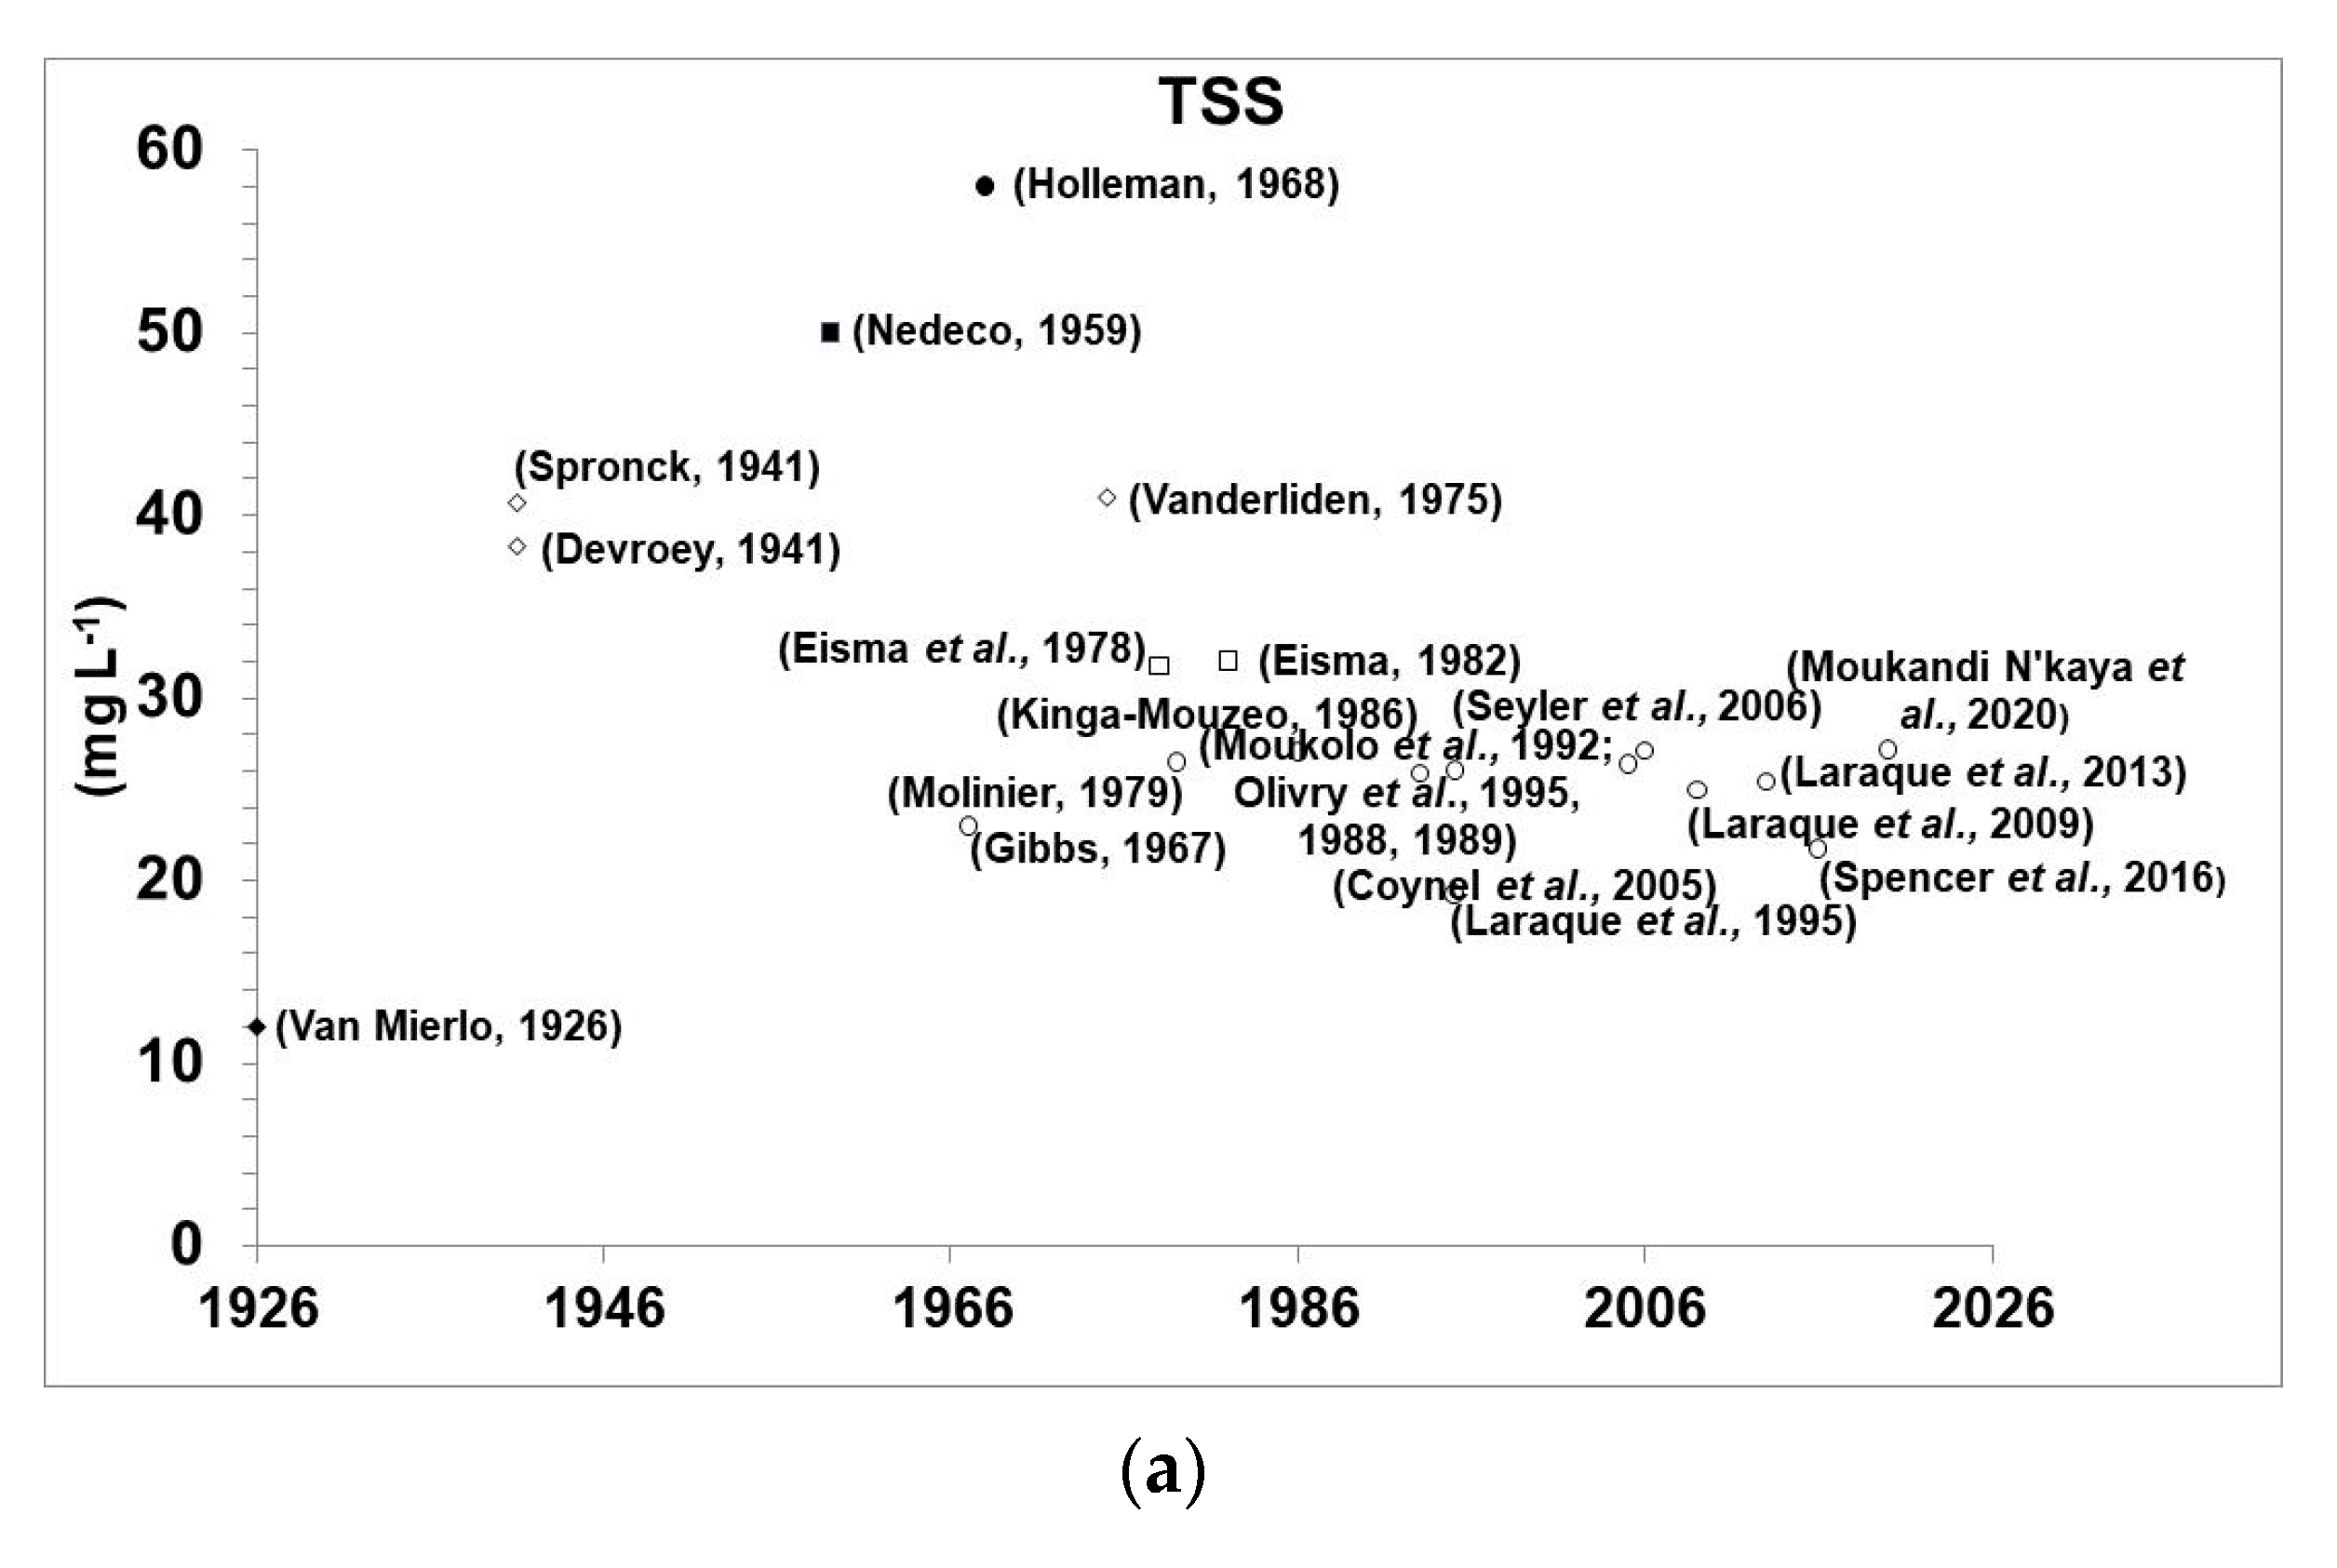
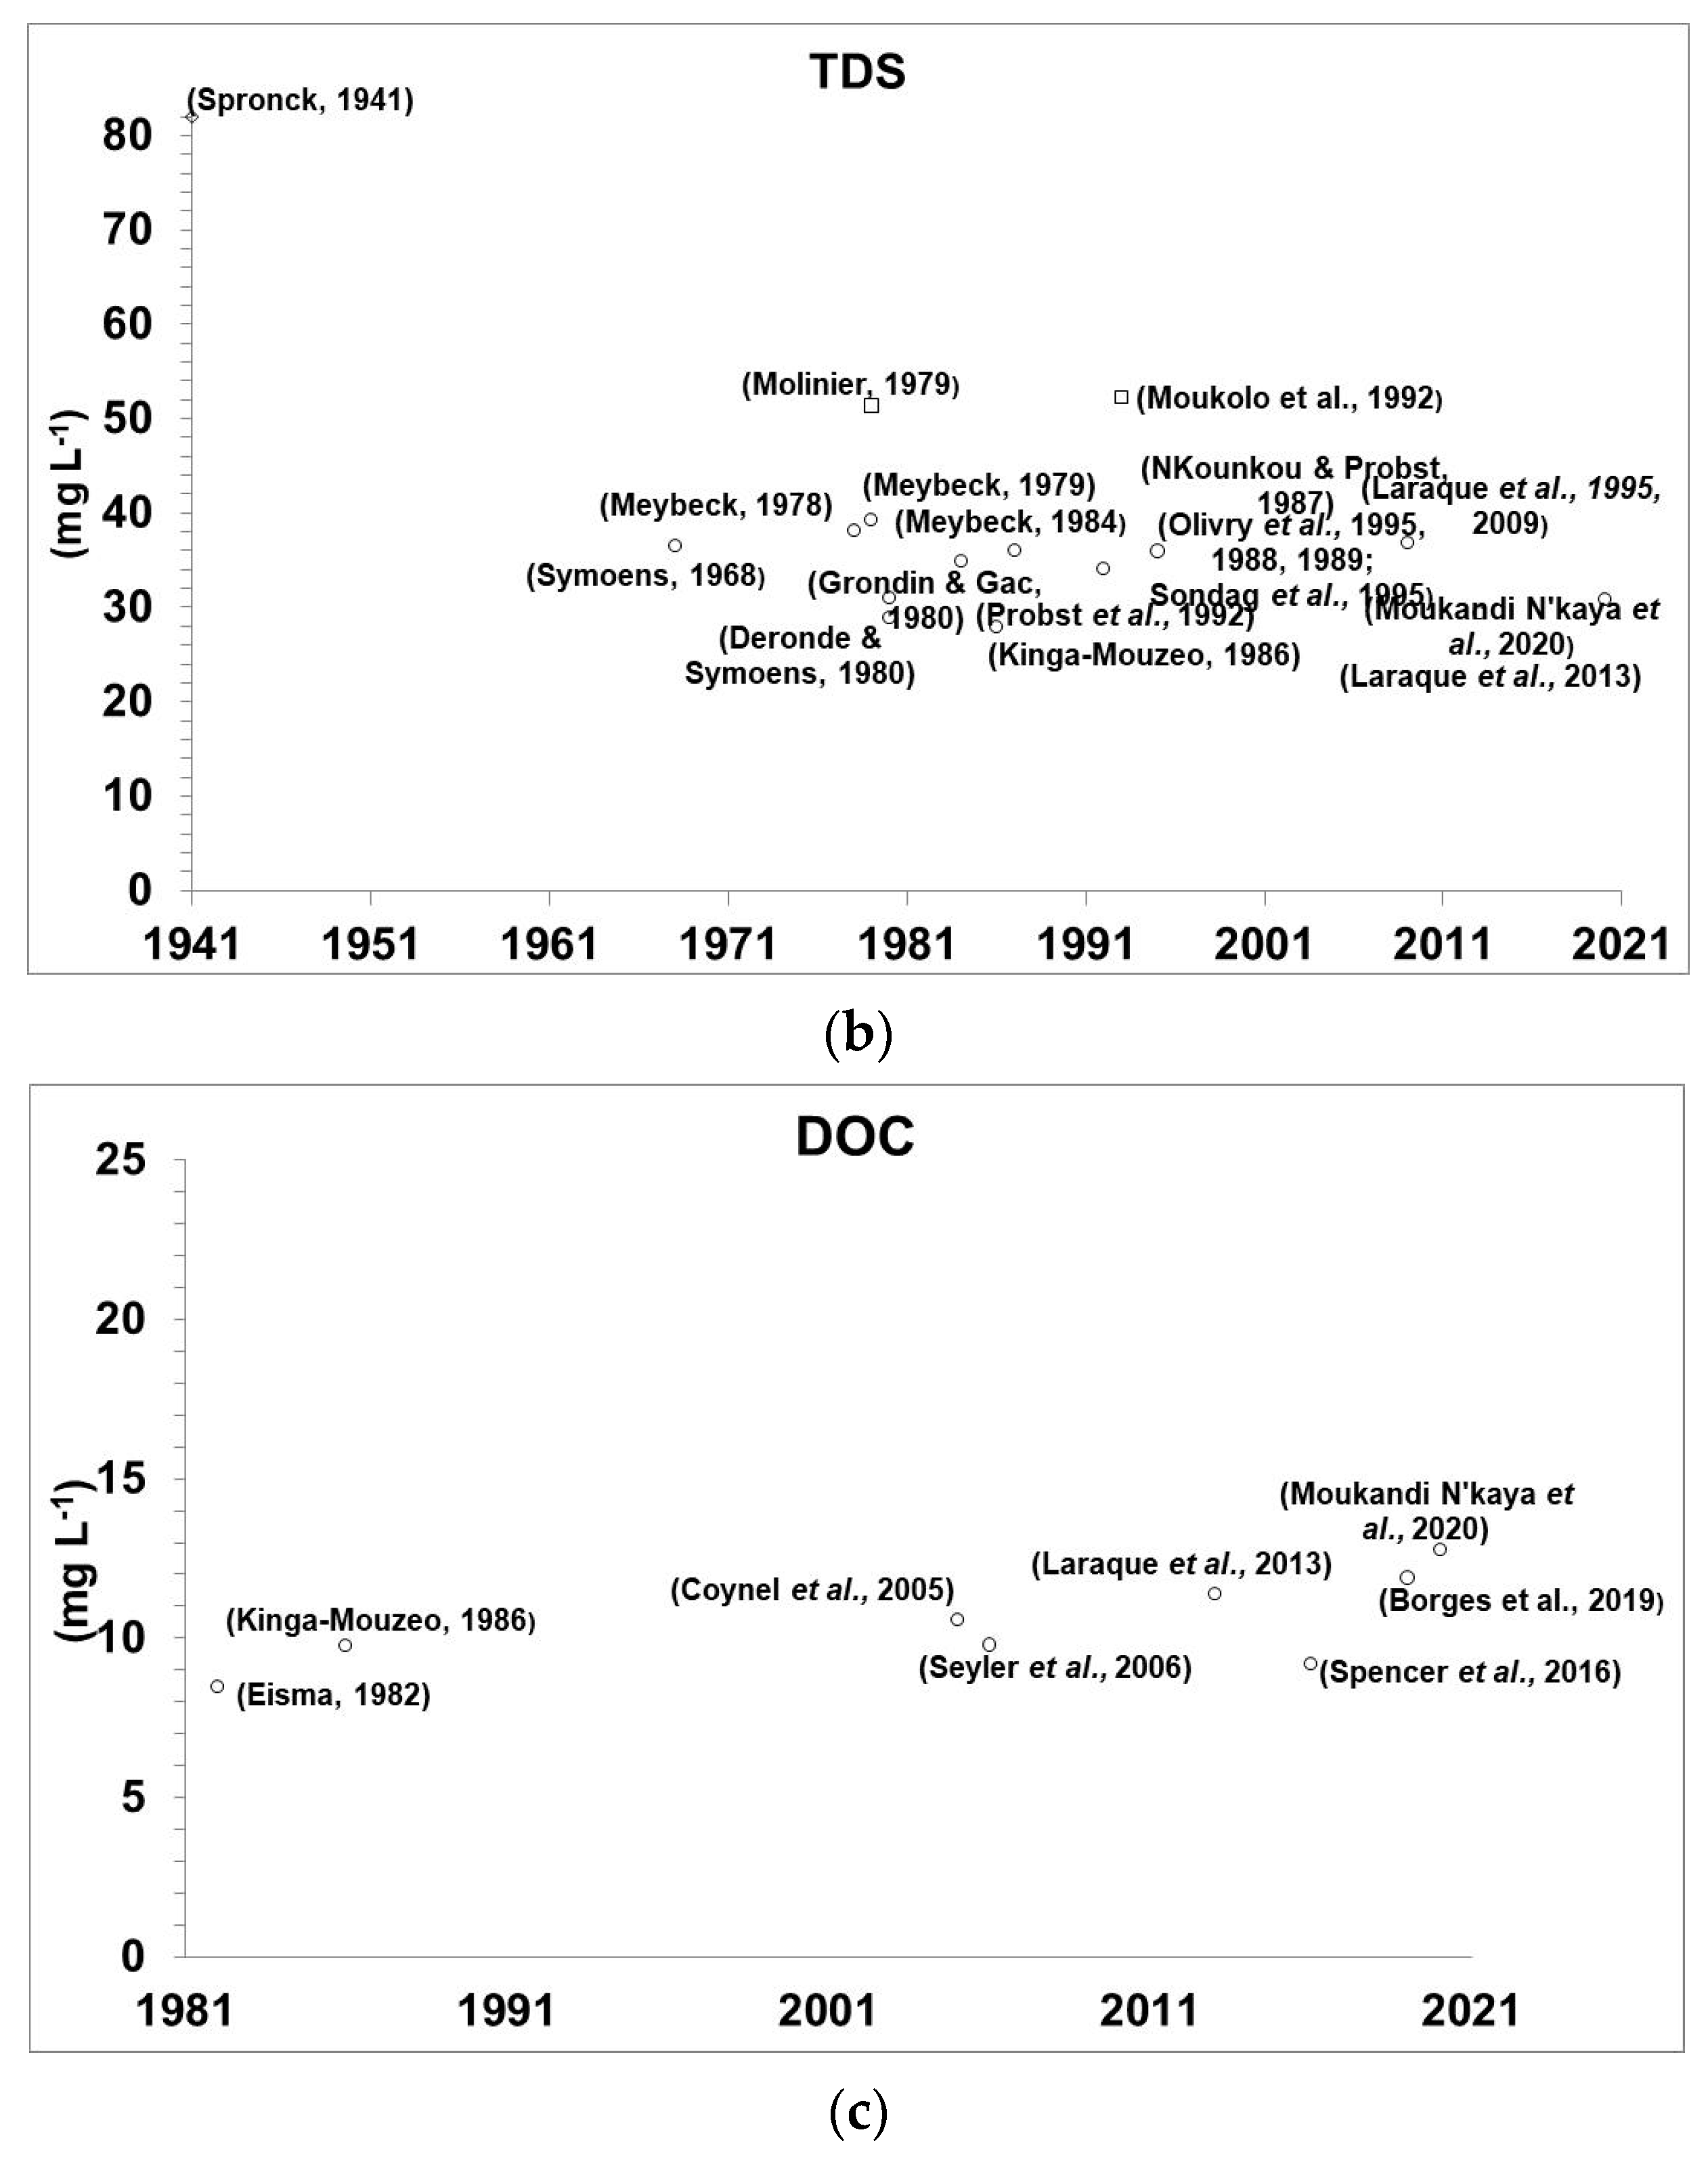
3.3. TSS, TDS, DOC Data

From 2005, with the continuous efforts of French and Congolese hydrologists, the SO-HYBAM (Observatory Service of larges rivers around the Atlantic intertropical ocean) was launched in the Congo Basin to preserve and continue acquisition of numerous varieties of data at the station of Brazzaville, such as daily discharge and monthly concentrations of total suspended solids (TSS), total dissolved solid (TDS), dissolved organic carbon (DOC), trace and rare earth elements, and also to ensure a free dissemination of data to the wider community [22].
This latest hydro-sediment-geo-chemical database at Brazzaville Station was completed with similar data coming from the previous PEGI/GBF (Programme Environnement Géosphère Intertropicale/opération Grands Bassins Fluviaux) Research program that monitored 10 stations on the right bank tributaries of the Congo River initially compiled and presented in the work of Laraque et al. (1995) [25]; Laraque et Orange (1996) [26]; Laraque et al. (1996 and 1996) [27,28], and Orange et al. (1996 and 1996) [29,30].
A non-exhaustive bibliographical summary of the work on the five categories of data mentioned above (Rainfall, flow and ‘TSS, TDS, DOC’) is presented in the next chapter.

4. State-of-the Art Hydroclimatological and Hydrosedimentological Studies of the Congo River Basin

4.1. Hydroclimatologial Studies

Over the entire Congo Basin, the annual average of rainfall for the 1940–99 period is 1500 mm year−1 [31,32]. The rainfall variability over the basin has been studied by many authors [18,33,34,35,36,37,38]. For example, Riou (1983) [39] studied the potential evapotranspiration in Central Africa. Samba Kimbata (1991) [40] quantified the water budget between 1951 and 1980 using monthly data, and Matsuyama et al. (1994) [41] studied the relationship between seasonal variations in the Congo Basin’s water balance and the atmospheric vapor flow. From the Congo Basin’s left bank data, Kazadi and Kaoru (1996) [42] proposed that the climatic variations over this basin can be related to solar activity. However, if the hydro-climatology of the basin presents similar cycles of 10–12 years, starting from the second half of the 20th century as shown by Laraque et al. (2013) [43], how can we explain their absence during the first half of this same century? Orange et al. (1997) [44] and Mahé et al. (2000, 2013) [45,46] linked the effects of the rainfall shortage since the 70s drought with the reduction of the groundwater reserves, leading to a decrease in the discharges in both humid and dry seasons. On the basis of the evolution of the regimes of major West and Central African rivers [47,48], some authors such as Olivry et al. (1993) [49], Mahé and Olivry (1999, 1995) [2,50] have noticed that the discharge reduction during the last decades is stronger in tropical Sudanian areas than in humid Equatorial areas, thus having an impact on the northern part of the Congo Basin.
Bricquet (1995) [51], categorized the main types of hydrograph that exist in the entire Congo Basin and proposed maps (Figure 4) to identify the hydrology contributions and times of water transit from upstream to downstream, according to different locations in the basin and during the different phases of the hydrological cycle of the Congo River at the Brazzaville-Kinshasa station. One of his maps shows the spatially contrasting values of specific flows, which can vary between extremes values of 0.5 (outlet of Lake Tanganyika) to 35 L s−1 km−2 (Batéké plateau).
In their study of the inter-tropical regions of Africa during the 1950–90s period, Bricquet et al. (1997) [52] highlights, that since the 1970s there has been a hydrological step change, which is thought to be a memory effect of the drought in the flow of the large river basins, reflecting a change in contribution of base flow to the flood hydrograph. Bricquet et al. (1997) [52] specify that this effect is more accentuated in the Sudano/Sahelian region. In the equatorial area, where the example studied was the Sangha River in Congo Basin, the secondary flood (named also spring flood) was more affected than the annual principal flood (or autumn flood). The authors hypothesize that there is a specific stream drought, which could be referred to as a “phreatic drought”, in addition to the climatic drought.
Nguimalet and Orange (2019) [3] suggest that rainfall runoff ratios over the Ubangi Basin at Bangui do not vary in time and also comment on the impact of phreatic drought. They studied rainfall data from 1935 to 2015 over the basin and confirmed a single discontinuity in 1971 causing a decrease (<5%) in the rainfall data series (Figure 5). As Laraque et al. (2013) [42], they identified three hydrological discontinuities (1960, 1971, 1982), with the strongest decrease of 22% in 1982. At last, they underlined a probable change in the relationship between surface flows and groundwater flows, before and after 1970 and after 2000.
Moukandi N’kaya et al. (accepted and in press) [13] show that the high flow period of the 1960s is the major hydrological anomaly of the Congo River over its 116 years continuous record. They show that the hydropluviometric discontinuity in 1970 is common in most of the tributaries of the Congo River basin, accompanied by significant reductions in flows, depending on various factors (geographical location, vegetation cover, surface conditions and land use, etc.).
Although this synthesis prioritizes field data, it is worth mentioning the complementary studies of Lee et al. (2011, 2014) [53,54] focused on terrestrial water dynamics on the “Cuvette Centrale”, using gravimetry data from the GRACE satellite and also using satellite radar altimetry. Becker et al. (2014) [55] presents the largest altimetry dataset of water levels ever published over the entire Congo Basin. This dataset, based on a total of 140 water level time series extracted using ENVISAT altimetry over the period of 2003 to 2009, allows illustration of the hydrological regimes of various tributaries of the Congo River. This analysis reveals nine distinct hydrological regions, a number similar to the ten zones of Bricquet (1995) [51], based on fields measurement. The proposed regionalization scheme is validated and therefore considered reliable for estimating monthly water level variations in the Congo Basin.

4.2. Hydrosedimentological and Biogeochemical Studies

Here, we consider TSS measurement and its extension to the other main complementary parameters like TDS, DOC, pH and EC (Electrical Conductivity).
Within the Congo Basin, the first solid (TSS) and dissolved transport (TDS + DOC) analyses were carried out during the first half of the 20th century at the main hydrological station of BZV/KIN. Table 2 summarizes their results in chronological order.
For BZV/KIN, this paper presents the mean results of the study of Moukandi N’Kaya et al. (2020) [56], about the comparison of the only two longer multiannual monthly chronicles of available data (1987–1993 versus 2006–2017) issued respectively from two French-Congolese projects, i.e., 8 years (1987–1993) of PEGI and 12 years of SO-HYBAM (during 2006–2017 period), the latter still operating. The parameters studied are TSS, TDS, DOC, pH and EC.

5. Recent Results

5.1. Spatially Interpolated Rainfall Data

The collected rainfall data were stored, analyzed, and spatialized using the inverse distance weighted method to obtain a rainfall value for every half a square degree (Figure 2b). Over the 60 year period 1940–1999, the inter-annual averaged rainfall on the Congo Basin ranges between 1000 and 2000 mm year−1. Over one-third of the surface of the basin receives more than 1500 mm year−1 of rainfall, mainly in the area of the “Cuvette Centrale”. The monthly rainfall regime (Figure 6) has changed slightly over time, as during the last 20 years of the time series, rainfall has decreased from February to April, while it has increased in July and August, and did not change much from September to December. This decrease of rainfall during the ‘Spring’ has provoked a decrease of the ‘Spring’ flood, which has also been observed in other equatorial rivers like the Ogooué River in Gabon and the Kouilou-Niari River in Congo [46,57], and the South Cameroon rivers [58].
Two sets of gridded rainfall data have been used, from CRU and from SIEREM_HSM [32]; both time series are quite close, except for the 1940s where SIEREM is slightly higher, and the 1980s where the differences are a bit higher. These two periods correspond to low density of the observed stations, which can explain these differences when the interpolation exacerbates some smaller differences between raw data in each grid. However, a comparison with the Congo discharge time series shows that its variability closely follows the SIEREM rainfall time series. Therefore, for this study, we use the SIEREM gridded data, which are based on a larger number of observed stations.

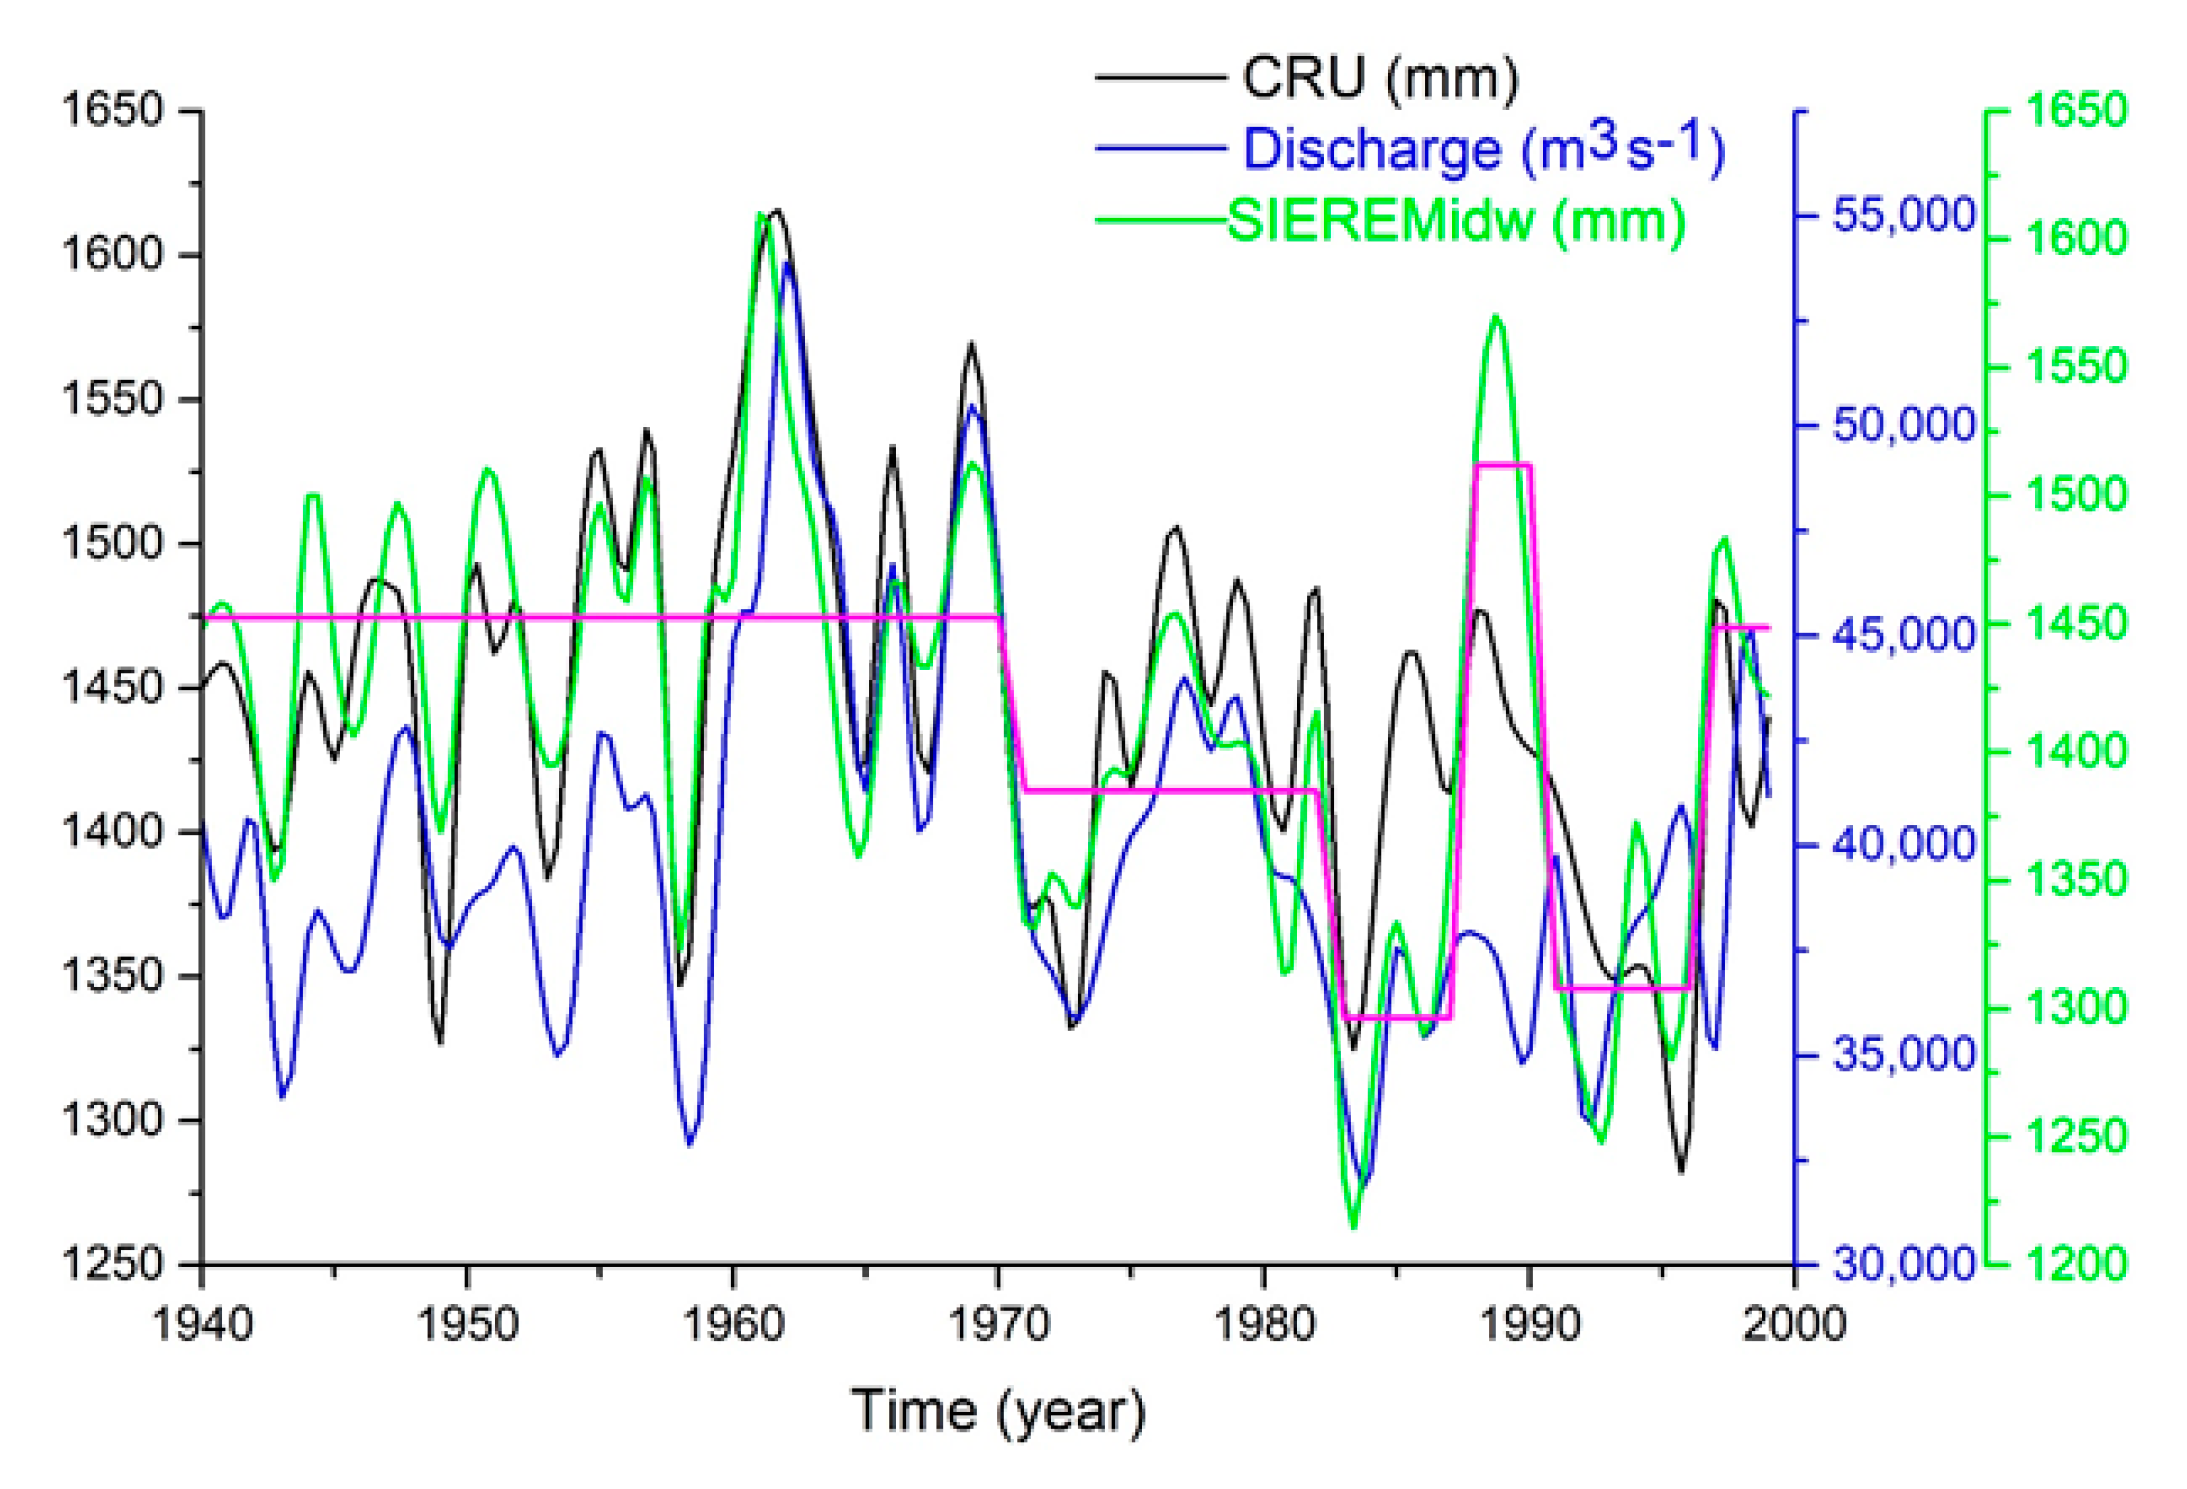
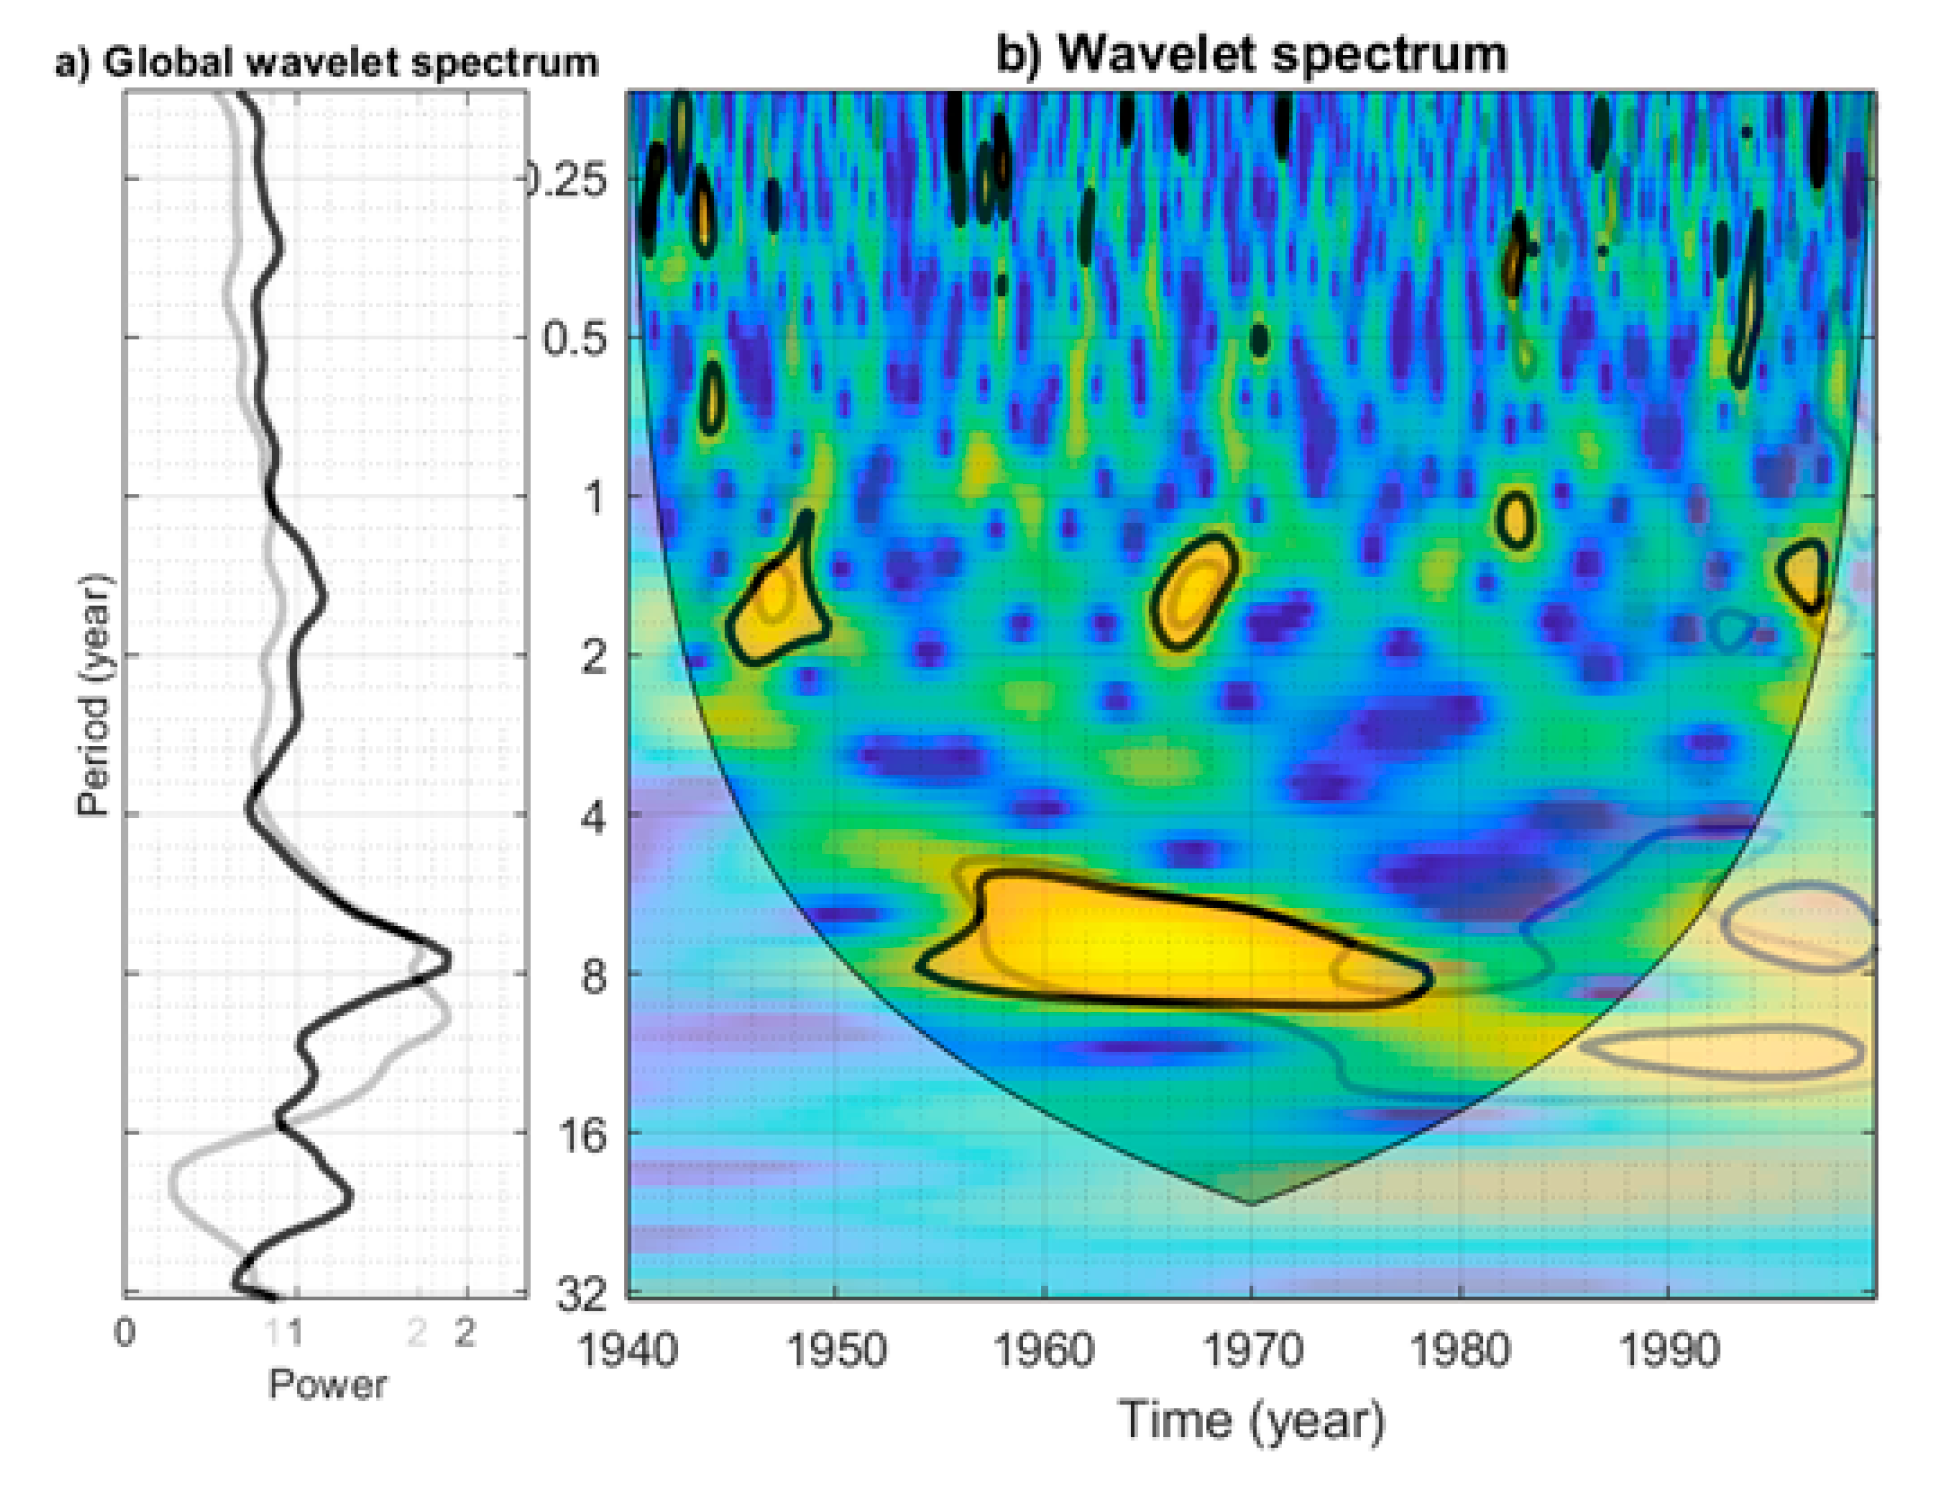
5.2. Stationarity and Step Changes in Time Series and Wavelet Analysis of Rainfall Series

Statistical tests were performed on rainfall time series to detect segments, indicated by step changes, in the rainfall regimes [59]. Hubert’s segmentation of regionalized annual rainfall (Figure 7) shows four steps in the time series, which occurred in 1970, 1983, 1987, and 1990. The main change in time series over the 60 years is found in 1983, which corresponds to the worst drought year in West and Central Africa in the 20th century. The time series presented in Figure 7 shows an increase of annual rainfall in 1987 and 1988, which seems exaggerated, as this change is not observed in the discharge time series, even if the discharge of 1988 shows a slightly higher value than the other years of the 1980s. This difference is mainly due to the lack of data over large parts of the Congo basin since the end of the 1980s.
Following the work of Moron et al. (1995) [60], linking rainfall variability in sub-equatorial America and Africa with STT (Sea Surface Temperature), it is interesting to operate wavelet analysis on this rainfall time series, to detect periods with higher energy and possible associated features. The spectrum analysis (Figure 8) reveals a frequency shift that occurs by the mid-1970s, from the 4–8 year band to the 8–16 year band, and in 1983, when the 4–8 year band re-appears while the 8–16 year band is still observed. This increase of the energy since the mid-70s in the 8–16 years band also corresponds to a high level of correlation between annual rainfall and SST in the South Atlantic [61]. Both CRU and SIEREM databases give the same period for this shift, around the mid-70s, but there is a difference after this date, i.e., the CRU rainfall does not show a signal in the 8–16 band, which is the case for the SIEREM base, and moreover, the SIEREM base also shows a return of a signal in the 4–8 band from the mid-80s onward.

5.3. Rainfall and Discharge Trends in the Congo River Basin

In Figure 9a,b, the graphs illustrate the synthesis of the study of Moukandi N’Kaya et al. (accepted and in press) [13] on the trends of multi-decadal rainfall records and the evolution of hydrological regimes during different homogeneous periods within the Congo Basin.
The multi-decadal rainfall and hydrological records were analyzed by various statistical tests available in Khronostat software [62,63]. The tests included in the software are largely taken from the technical note of the World Meteorological Organization [64]. The description of these tests is presented in Laraque et al. (2013 and 2001) [42,65] and Moukandi N’Kaya et al. (accepted and in press) [13].
This preliminary study by catchment area will then make it possible to compare their hydro-pluviometric behaviors for the purpose of better understanding the hydrological responses within the Congo River Basin (CRB).
It can be concluded for the rainfall records between 1940 and 1999 (except for Ubangi basin with data from 1936 to 2018), that:
(i)
the rains have globally decreased on the Ubangi, Kasaï, and entire Congo Basin, with the main change around 1970. Nevertheless, for the Ubangi basin, Nguimalet et Orange (under review) [66] note a resumption of rainfall from 2007 onwards (Figure 5);
(ii)
the Lualaba basin shows high rainfall in the early 1960s and a decreasing rainfall trend around the 1980s;
(iii)
in the Sangha basin, annual rainfall has not significantly changed;
(iv)
for all the basins analyzed, the end of the 1980s and the beginning of the 1990s seem to have experienced relatively more rain, in a context of declining rainfall since 1970;
(v)
trends and changes in the rainfall can also be seen in the runoff record, sometimes with a time lag of a few years.
In Equatorial Africa, rainfall has returned to previous annual total and the runoff variability does not show any long-term trend, compared to the high runoff decrease observed in West African rivers. After the 1980s’ drought years, the runoff of the Central African rivers returns to average values. The Congo River presents a certain hydrological inertia due to its vast surface area distributed on both sides of the Equator, more than 40% of which is covered by rainforest under the influence of the Atlantic and Indian Oceans and continental southern Africa.
The statistical “sequencing” of river flow records available (Figure 9b), shows one to three discontinuities, depending on the river analyzed (1970 for the equatorial Sangha River at Ouesso; 1960, 1971, 1983 for Ubangi at Bangui; 1960, 1964 for Lualaba at Kisangani; 1980 and 1990 for Kasaï at Kutu Moke and 1960, 1970 for Congo River at BZV/KIN gauging stations. Unfortunately, due to the lack of in situ data, one cannot estimate with accuracy, how river flows are changing on the left-bank tributaries since 2012. However, for the Kasaï basin, the later occurrence of hydrologic discontinuities in comparison with the rainfall ones can be explained mainly by a lag in groundwater flows.
The first analysis of the 1902–1996 record of annual discharge of the Congo River at Brazzaville and of the Ubangi River at Bangui made by Laraque et al. (2001) [65] identifies four homogeneous periods: the first period before 1960 showed no significant trend; 1960–70 experienced high flows and was followed by two periods of successive flow drops, in 1971–81 and 1982–95, the periods of lowest flows ever recorded.
The most recent analysis of the longest hydrological series of the Congo River at BZV/KIN and the Ubangi River at Bangui until 2019 (Figure 9b), shows that the wet decade of the 1960s with an interannual discharge of 48,000 m3 s−1 separates two periods of equivalent mean flows for Congo River, 39,710 versus 39,740 m3 s−1 [13].
Indeed, since 1996, measured values are close to the overall mean annual discharge of 40,500 m3 s−1, and a renewal of runoff is observed from 1990 onwards, after almost 15 years of deficit flow.
For the Ubangi River at Bangui, the same wet decade of the 1960s preceded a decline in flows in 1970, which in 1981 became more pronounced and remained stabilized until 2013; it seems to have a rising wave from this recent date.
In recent years, the presence of monthly extremes has been noted. For example, in 2011, the lowest levels for 65 years were observed in Brazzaville (with 23,550 m3 s−1 in August) and in 2012, the Ubangi reached its lowest level for 100 years (with 207 m3 s−1 in April), with new sandbanks appearing, which present fluvial navigation obstacles.
The end of 2019 was marked by an extreme rising stage on Ubangi River at Bangui, with a daily discharge of 12,400 m3 s−1 in November, which correspond to a return period of a dozen years. This event seems to confirm a new humid period announced by the discontinuity in 2014 [3]. One month later, this flood reached Brazzaville-Kinshasa, where the maximum December discharge of the annual hydrologic cycle reached 70,000 m3 s−1 for an mean monthly flow in this month of around 56,000 m3 s−1. The high flow events caused catastrophic flooding and affected thousands of people in the three capitals of Bangui, Brazzaville, and Kinshasa, in addition to the damage suffered by others localities along the rivers’ courses.
These hydropluviometric recoveries are found in other regions of Africa like in the endoreic basin of Lake Chad [67] and in East Africa [68].

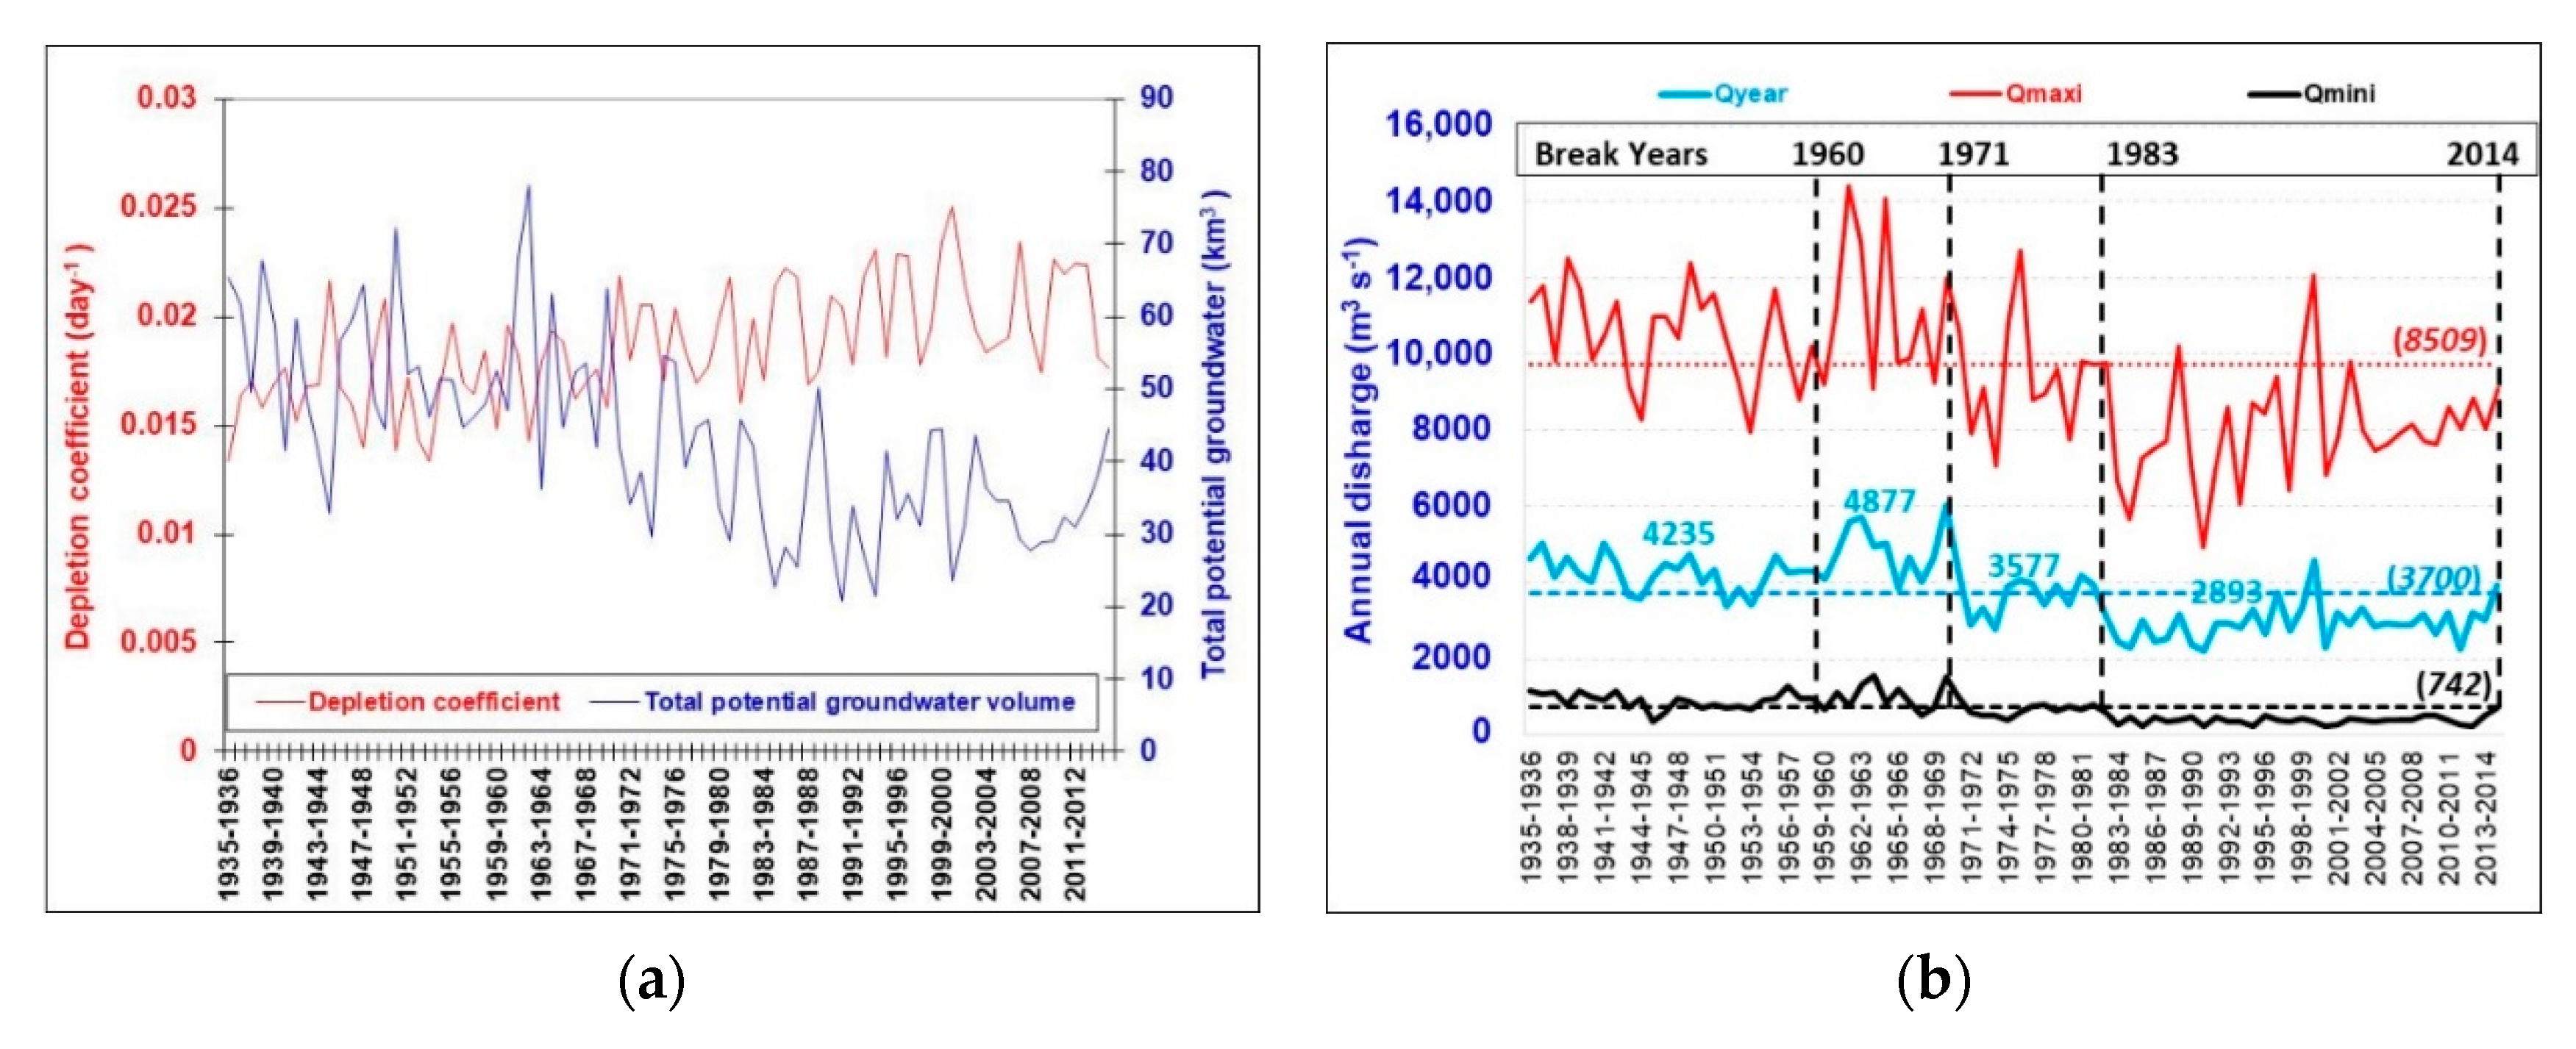
5.4. Hydrological Regimes of the Congo River and the Special Case of Ubangi River

Mahé et al. (2013) [46] highlighted that in West Africa and in a part of Central Africa, climate has changed since 1970, with the beginning of an intense and long dry period, but this change is less active since the 1980s in Central Africa. Nevertheless, a change in the intra-seasonal rainfall distribution (a slight rainfall decrease from March to May) most probably led to one of the biggest changes in the hydrological regimes in Africa, mainly visible in the Ogooue, Kouilou-Niari, and South Cameroonian rivers [58], but also visible partly in the Congo River. This reduction of the spring flood since the 1980s is therefore visible at the sub-continental scale. It might be associated with a change in global weather regime, linked to ITCZ (Intertropical Convergence Zone) changes in seasonal variability.
Figure 10 shows the hydrological regimes at the main gauging stations of the six main drainage units of the Congo Basin and of the whole Congo Basin at BZV/KIN.
The hydrological regime of the remote, swampy ‘Cuvette Centrale’, which is very difficult to measure in situ, has been deduced from the budget between the BZV/KIN gauging station and the other main stations (Ouesso, Bangui, Kisangani, Kutu Moke, …) with long hydrological records available, situated around its location. The results are in agreement with the reconstitution by hydropluviometric modelling made by BRLi (2016) [7]. The Congo River regime at BZV/KIN is the combination of the alternating inputs of its tributaries from both hemispheres. The local regime is strongly influenced and attenuated by the more regular equatorial regime of the Central Basin. Although its flows are much lower, the stable hydrological regime of the Batéké plateau (illustrated here with Nkéni R.) also mitigates low flows in the Congo River.
The evolution of hydrological regimes by periods of homogeneous flow for the studied drainage entities, according to their available flow records are presented in Moukandi N’kaya et al. (accepted and in press) [13]. The two longest records (Congo at BZV/KIN and Ubangi at Bangui) are now detailed.
The Congo River at BZV/KIN (Figure 11a) has a bimodal regime with its rising stage usually starting in October and ending in February. Afterwards, a large recession period begins and ends in October. During this recession stage, a secondary smaller flood appears with a slightly rounded peak in May.
The variations of hydrological regimes by periods of homogeneous flows of the Congo River in BZV/KIN (Figure 11a) does not show any clear trend except for the 1960s humid period, with runoff during all the hydrological cycle always higher than that of the two other homogenized periods. During the wet phase from 1960 to 1970, the secondary flood greatly exceeded the interannual mean discharge calculated since 1903, but since 1970, it has fallen below this.
The Ubangi River is monitored by the Bangui gauging station in the northern hemisphere and flow peaks are in end November-early-December. The falling stage occupies the rest of the year and lasts seven months.
In contrast to Congo River at BZV/KIN (Figure 11a), the variations of hydrological regimes by periods of homogeneous flows of the Ubangi River at Bangui (Figure 11b) shows clear trend, except for the 1960s humid period, with runoff during all the hydrological cycle always higher than from the others ones. The volume of water flowing out of the Ubangi almost halved between 1936 and 2018. Since 1982, the current period presents an important decrease of total runoff. This is due to the reduction of the magnitude and duration of the floods, but also due to a reduction of low flows. It is this latter period that presents the most altered hydrological regime for the Ubangi River.
As a complement to the study of Bricquet et al. (1997) [52], which showed the increase of its baseflow recession constant since the 1970s’ break, Nguimalet and Orange (2019) [3] carried out some analyses of one hydropluviometric time series from 1935 to 2015 for the Ubangi River.
The average rainfall-runoff relationship did not change during the four hydroclimatic periods already identified by Laraque et al. (2013) [43], suggesting that the hydrological functioning of the Ubangi has not changed during the climate disruption. However, this is not the same pattern seen from its annual depletion coefficients, which continuously increased from 1935 to 2015 with an emphasis in 1970, but has declined since (Figure 12a). Nothing in the recent evolution of the annual rainfall helps explain this change of trend. The recent changes in the baseflow recession constant indicate that the support of baseflows by groundwater inflows is no longer assured. For this river, Nguimalet and Orange (2019) [3] showed the parallel responses of the changes of daily flood flows, as well as mean and low annual flows (Figure 12b). Nevertheless, these authors find that its mean daily flow in Bangui fell by 30% between the wet (1959–1970) and dry (1982–2013) periods. On the other hand, the mean daily low water flow fell by about 60%, which probably underlines a significant drop in the contribution of the water table of the Ubangi basin.

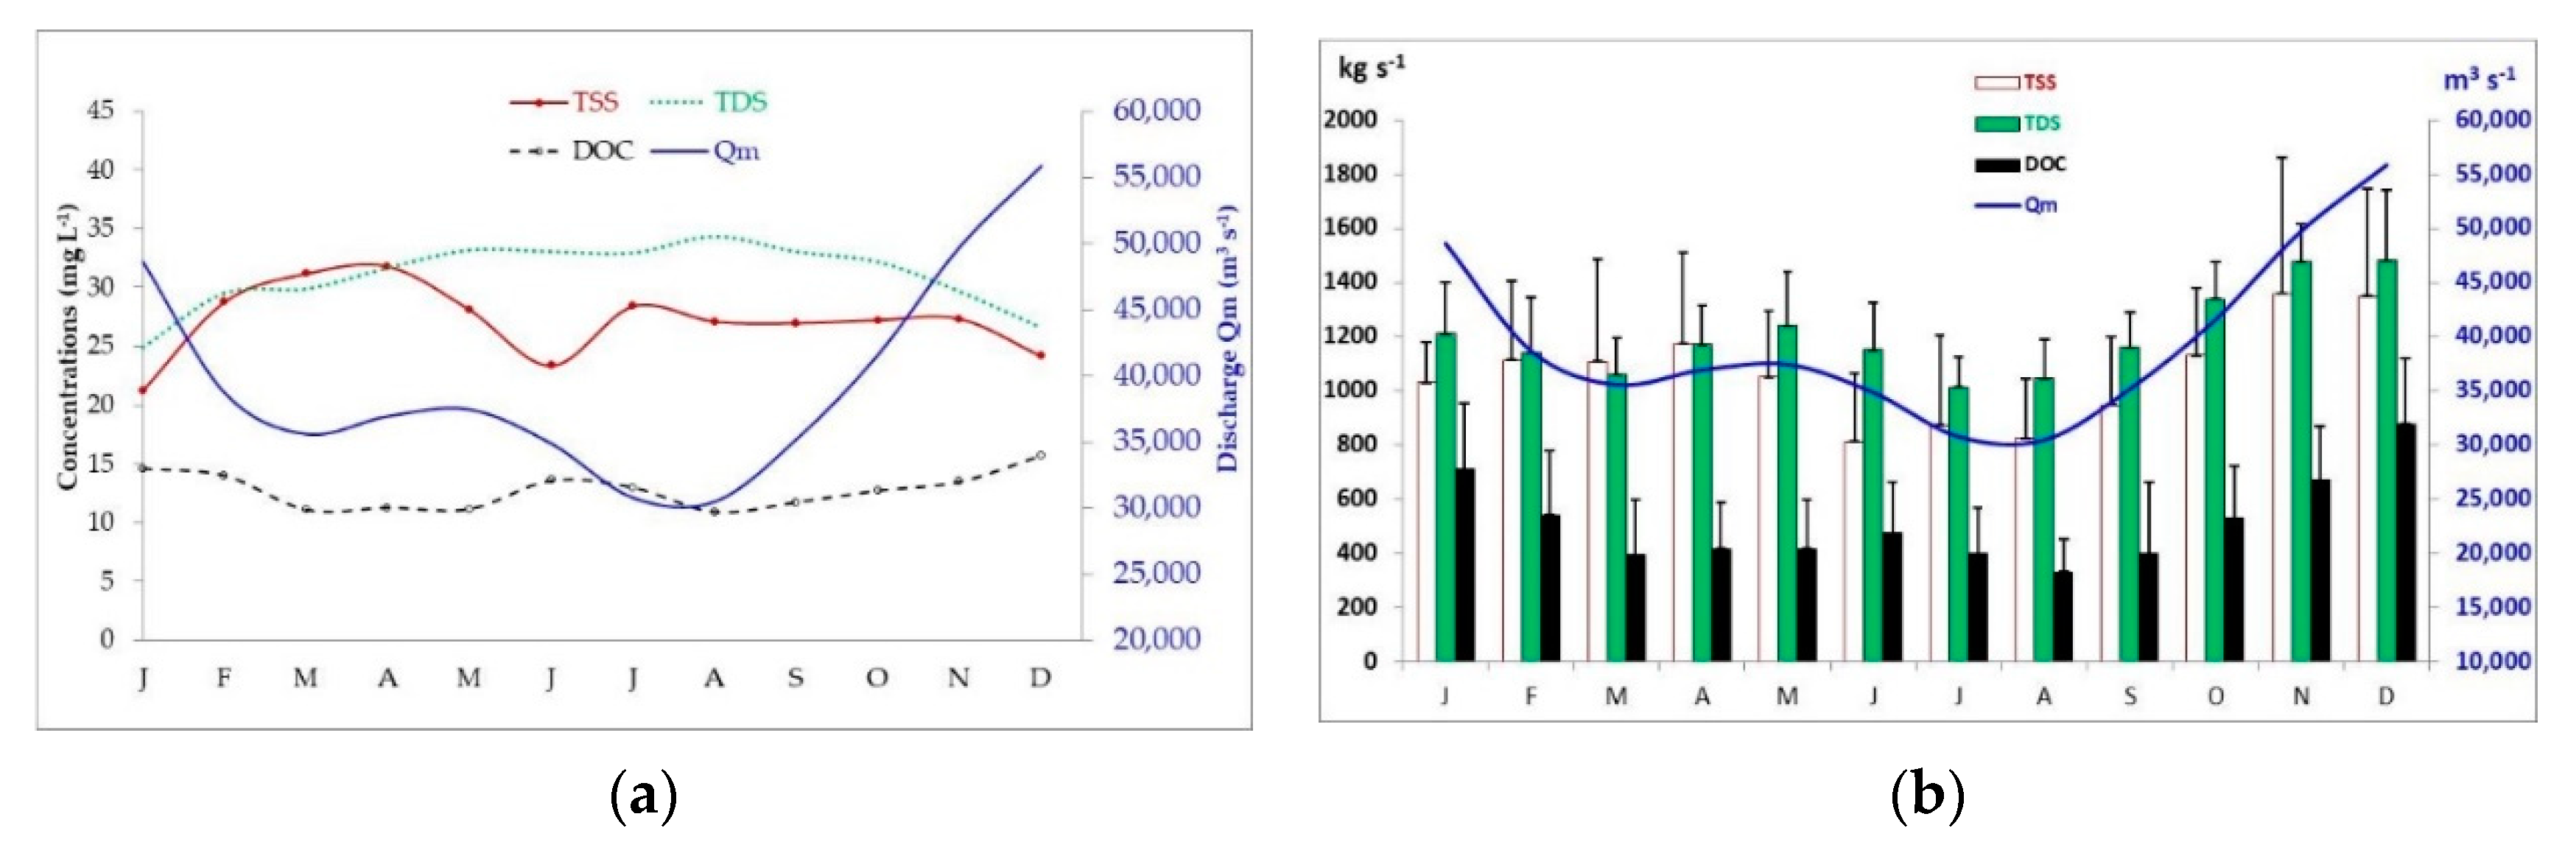
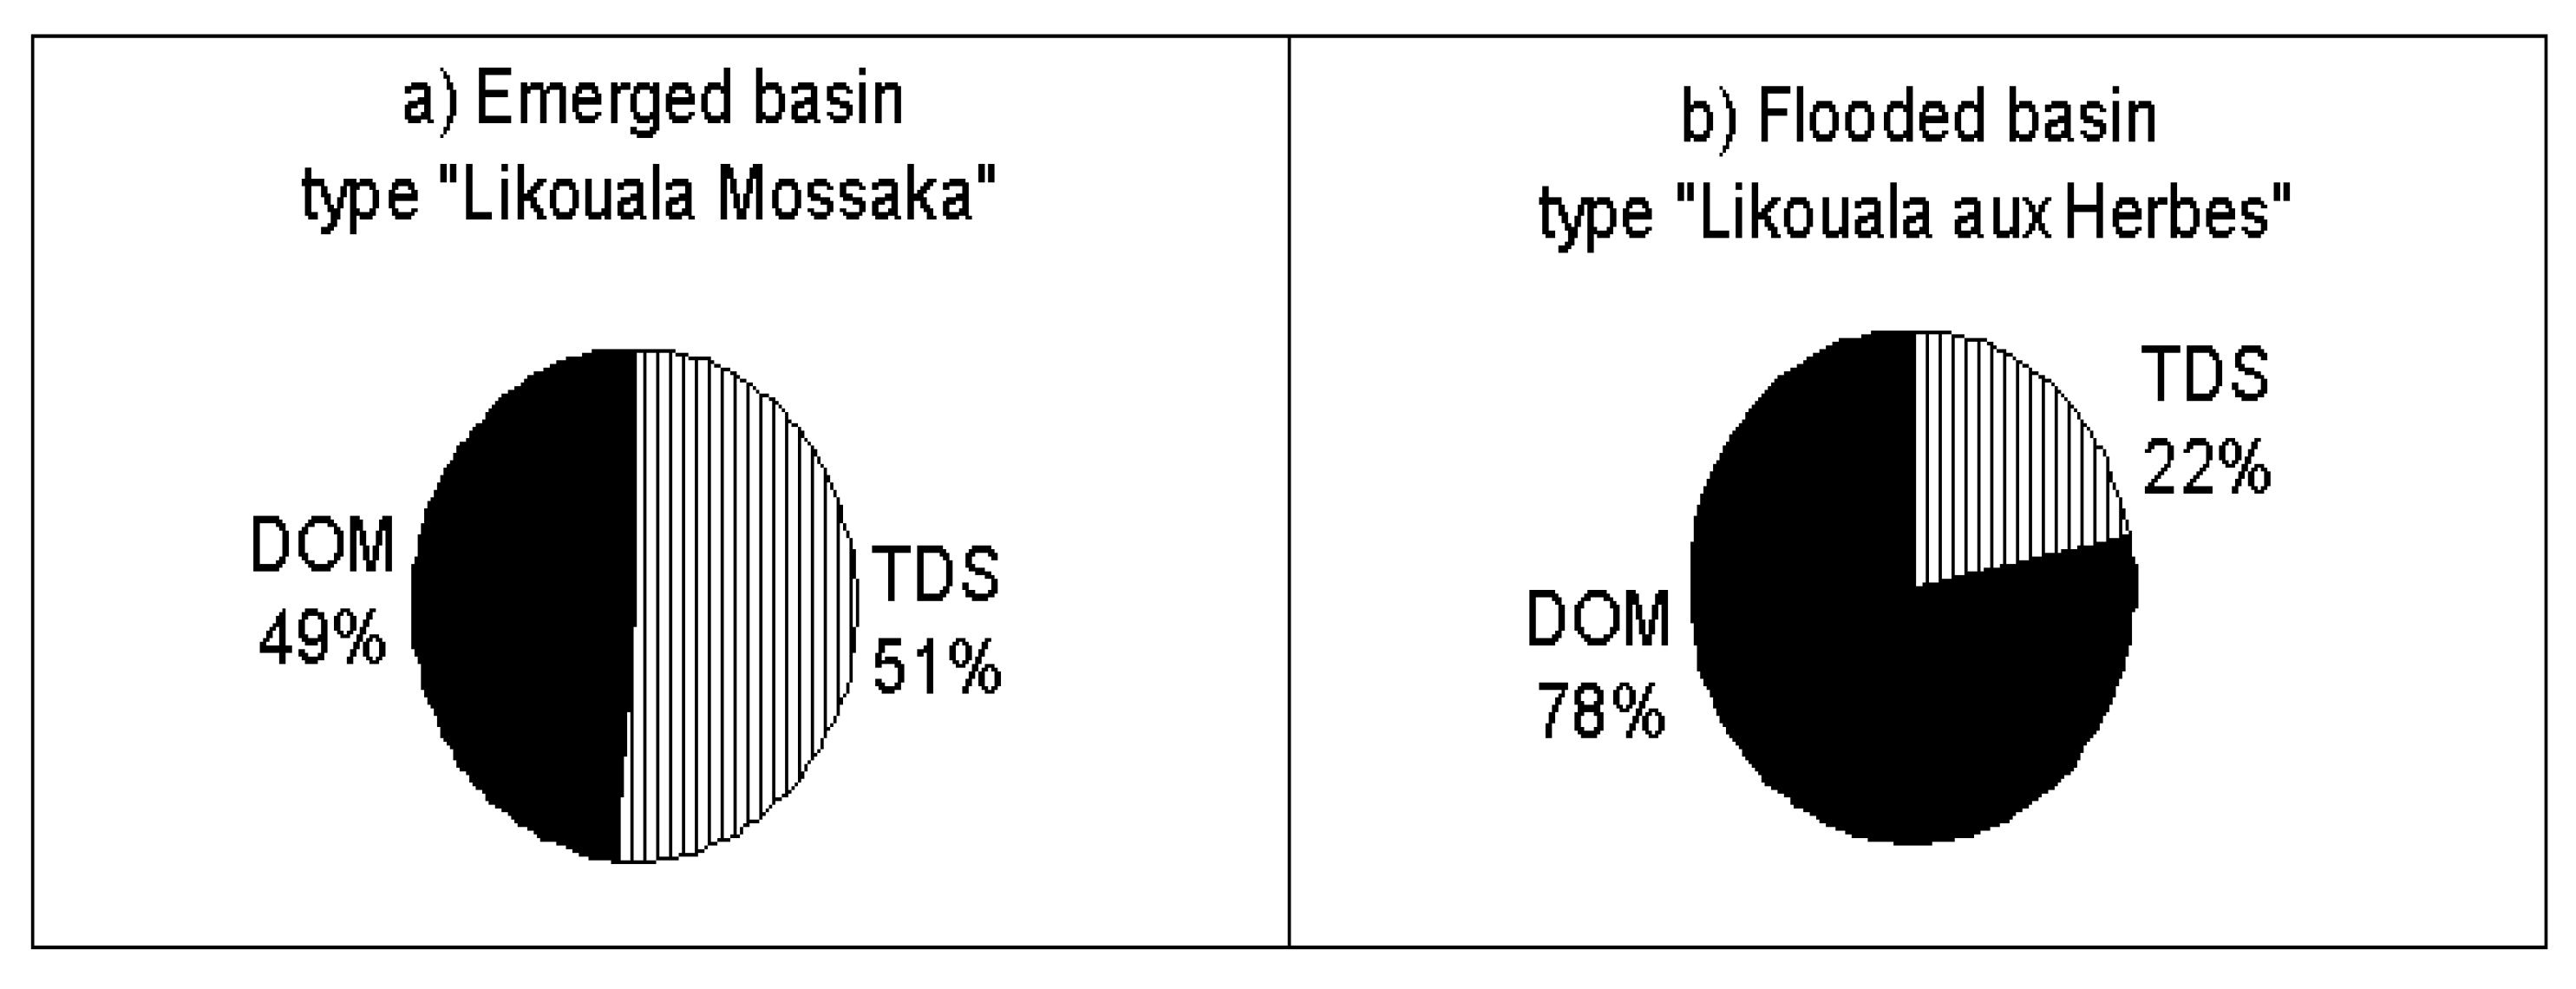
5.5. Main Features, Concentrations, and Fluxes of the Congo River

On the Congo River, in the year 1980, African and French researchers continued the studies pioneered by Belgian scientists on TSS and TDS, by Van Mierlo (1926) [69] and Spronck (1941) [70] and then later on DOC by Eisma et al. (1978) [71]. Figure 13 presents their historical and recent results, also available in Table 2. These show that since 1967, a majority of authors, 12 versus 19, present TSS values with a relatively good convergence, between 20 and 30 mg L−1. For TDS, it is similar, with 13 versus 16 authors presenting values between 30 and 40 mg L−1 since 1968. For DOC, all the authors found values between 8 and 13 mg L−1 for analysis carried out from 1982. For TSS and TDS, the measurement of pre-1968 data results from less accurate sampling protocols and laboratory analyses, with samples that do not regularly cover the entire hydrological cycle.
Moukandi et al. (2020) [56] show that in comparison with the PEGI data, SO-HYBAM data presents a slight increase (+7.5%) of interannual mean TSS concentrations, from 25.3 to 27.2 mg L−1, a lower TDS concentration in the current period, i.e., −15% with a drop from 36.5 to 31.1 mg L−1 and a DOC concentration increase (+28%) from 9.9 to 12.8 mg L−1. These variations appear to be essentially due to the increase in flows (nearly 4.5%), from 38,000 to 39,660 m3 s−1 (inter-annual average), respectively for the two study periods. Indeed, generally the increase in discharge causes an increase of TSS by basin leaching and a decrease of TDS by dilution effect. For DOC, always in the absence of significant anthropogenic impacts in the Congo Basin, we suspect that its relatively high increase is due to the leaching of the vast ‘Cuvette Centrale’ covered by flooded forests and swamps rich in organic matter, with more water during the recent period (2006–2017).
We present in Table 3 the main statistics of Congo River water quality parameters collected by the SO-HYBAM project at the BZV/KIN gauging station.
The Congo River at the BZV/KIN section is characterized by a slightly acid mean pH value of 6.8, a mean specific electrical conductivity of 28.4 μS cm−1 at 25 °C, and a mean temperature of 27.7 °C. The total matter transported (TSS + TDS + DOC) is around 71 mg L−1, with 38% TSS (27.2 mg L−1) and 62% of Total Dissolved Matter (TDM = TDS + DOC = 43.8 mg L−1). TDM comprises 29% of DOC (12.7 mg L−1) and 71% of TDS (31.1 mg L−1). The TDS comprises 20.2 mg L−1 of ionic load (cations + anions) and 10.9 mg L−1 of neutral mineral oxides, in which silica concentrations (10.5 mg L−1) predominate. Consequently, the Congo River channel surface waters at Brazzaville contain relatively low concentrations of TSS and ionic load, but are rich in concentrations of SiO2 and DOC with a mixed-bicarbonate geochemical facies.
Unfortunately, POC (Particulate Organic Carbon) was not sampled during the SO-HYBAM project, but was studied by a few authors like Coynel et al. (2005) [72] and Spencer et al. (2012 and 2016) [73,74]. This last author carried out a monthly study for the period from September 2009 to November 2010 and found a mean POC concentration of 1.46 mg L−1 with extreme low and high values of 1.01 and 1.97 mg L−1, respectively. For comparison purposes, from 1992 to 1993, Seyler et al. (2006) [75] found an almost constant POC on the Ubangi River at Bangui, around 1.4 mg L−1. More recently, based on 15-day sampling over the hydrological cycle (2011–2012), Bouillon et al. (2014) [76] found a lower average of 0.9 mg L−1.
Laraque et al. (2013) [97] explained the variations of TSS, TDS, and DOC, as follows: (i) the low monthly variation in TSS concentrations, a ratio of 5 (Table 3), during the hydrological year (Figure 14a) reflects the different timing and successive contributions of the different tributaries from one sub-basin to another, on each side of the Equator, within the overall Congo Basin; (ii) TDS concentration (Figure 14a) decreases during the rising stage of the annual flood. This decrease is due to the well-known TDS dilution effect during the rainy season. Conversely, TDS concentrations increase during the falling stage, due to the concentration effect; (iii) DOC concentrations show a ratio of monthly variation of 5.6 (Table 3) over the hydrological year. The highest DOC concentrations are generally observed during the main flood period (December–January). This logically comes from the leaching of the marshes and flooded forests in the ‘Cuvette Centrale’.
In conclusion, TSS, TDS, and DOC (without correction for atmospheric inputs) exhibit low concentrations and limited seasonal variation for the Congo at Brazzaville, which is not always synchronous with discharge variations (Figure 14a). However, due to their weak concentrations, TSS, TDS, and DOC monthly fluxes are mainly controlled by the magnitude of the discharge and show temporal variations more like those of the hydrograph (Figure 14b).
As discussed by Laraque et al. (2013) [97], within the Congo catchment, the TSS load is lower than the dissolved load, due to the ancient and peneplaned landscape, protected by a dense rainforest cover. Moreover, the higher contribution of dissolved matter is due to the dominating geochemical weathering (TDS) and the biochemical contribution (DOC concentrations) produced by the equatorial rain forest.
The “Cuvette Centrale” has a strong influence on the biogeochemical characteristics of the rivers crossing it, diluting the TSS and TDS, increasing organic matter concentrations, and lowering the pH due to the release of acids from the forest and swamps. Although this is a gradual process, differences were observed in Dissolved Organic Matter (DOM) production load. They are lower for semi-terra firma belt (Figure 15a) around the central flooded “Cuvette”, illustrated respectively by the examples of the Likouala Mossaka River (Figure 15a), with DOM = 32 mg L−1 and pH = 5 to 6, and by the Likouala aux Herbes River (Figure 15b), with DOM = 80 mg L−1 and pH = 3.5 to 5 [15]. DOM corresponds to the difference between the weight of the dry residue at 105 °C and of the total dissolved solids (TDS = Σ(cations, anions, silica)) determined in laboratory.
These observations were confirmed by measurements along the river course of the Ubangi Rivers. During the scientific cruise of November 1992, at 350 km from its confluence with the Congo River, Figure 16 shows at the same time a progressive increase of TDM and a decrease of TDS. The difference is due to the increase of DOM when the river leaves a mixed zone of shrubby and woody savannah, before entering the dense forest covering the ‘Cuvette Centrale’. This last system corresponds to a real DOM reservoir that releases almost 25 t km−2 year−1 of organic matter after slow maceration due to the soaking of the forest litter [15].
For material fluxes, nearly 88 × 106 tonnes of material are exported annually from the Congo Basin to the Atlantic Ocean, composed of 33.6 × 10⁶ tonnes of TSS, 38.1 × 10⁶ tonnes of TDS and 16.2 × 10⁶ tonnes of DOC for the study period (2006–2017). These values are in accordance with the first TSS fluxes given by Gibbs (1967) [79] and with those obtained during the period 1987–93 by Olivry et al. (1989, 1988, 1995) [24,92,95], Coynel et al. (2006) [72] and Laraque et al. (2009) [15], taking account of the discharge differences between these two periods.
In the case of the Congo, chemical weathering (10.6 t km−2 year−1 of TDS) slightly predominates physical weathering (9.3 t km−2 year−1 of TSS), followed by biological production (4.5 t km−2 year−1 of DOC).
Finally, thanks to these previous in situ studies and the use of remote sensing, Mushi et al. (2019) [99] was able to carry out a first assessment of soil erosion at the scale of the Congo River basin. They conclude that it is necessary to develop a program of high-frequency water and sediment collection at several strategic points in the basin, in order to understand its different transport dynamics.

5.6. Hydrological and Hydrogeochemical Anomalies Congo River Basin

The work of Laraque et al. (1998) [10] carried out on the right bank tributaries of the Congo river in Republic of Congo shows two close regions with very different hydrological regimes: the Batéké plateau and the ‘Cuvette Centrale’ (Figure 17), although they present similar annual rainfall amounts (1700 versus 1900 mm year−1). The first region lies upon Tertiary sandstones formations of about 200 to 400 m in thickness, covered by savannah. The second one corresponds to the floodplain of the lowest sector of the wide Congo depression, according to Burgis and Symoens (1987) [100], and lies upon Quaternary alluvial deposits, covered with swamps and dense equatorial rain forests (Figure 1b).
The hydrological regimes of the Batéké rivers are a representative example of a hydrologic paradox. Indeed, their flow regimes are almost independent of the regional rainfall regime because of the great infiltration capacity of the thick aquifer, which regulates their flows. This region holds some of the most regular rivers of the world, as illustrated by Figure 18a. In contrast, in the “Cuvette Centrale”, the lower permeability of the soils, the interception of rainwaters, the evapotranspiration of the forest cover, and the direct evaporation on the floodplain areas as well as the swamps, lead to an important water deficit. The hydrological regime here is closer to the rainfall seasonality (Figure 18b).
From a qualitative point of view, these two regions are also very distinct. On one side, after crossing an important sandy aquifer whose alterable minerals have been totally washed out, the Batéké rivers are ‘clear waters’ with remarkably few minerals, but relatively hypersiliceous. These waters, with dissolved inorganic matter ranging from 1 to 3 mg L−l (not taking into account the dissolved silica), have similar TDS concentrations to rainfall waters (Figure 19a). These are among the most dilute surface waters of the world. On the other side, waters outflowing from the “Cuvette Centrale” stay for a long time under the forest cover and passes through the swamp. These are very rich in organic matter (up to 44% of particulate organic carbon) and very acid (pH can be lower than 4) and correspond to the typical ‘black water rivers’. Their mineralization, although relatively low for rivers (11 to 30 mg L−l, without dissolved silica), can be considered high when compared to the Batéké plateau waters (Figure 19b). These particularities point to the dominant roles of the geological formations and of the vegetation cover on the runoff of the concerned rivers, as well as on their water quality.
For the Batéké rivers, the interannual runoff coefficient (ratio between the runoff and the rainfall) ranges between 45–60%, versus 20–30% for the “Cuvette Centrale”. The average seasonal variability of discharges (mean ratio between the highest and lowest monthly discharge for each studied year) ranges between 1.1 and 1.5 for the Batéké rivers, versus 2.5 and 5.5 for the “Cuvette Centrale” rivers. The specific discharges of the first region varies from 25 to 35 L s−1 km−2, versus 10 to 15 L s−1 km−2 for the second region. These considerations allowed Laraque et al. (1998) [10] to propose an original hydrological classification of the Congolese right bank tributaries, based on these two hydrological parameters. Their variability can be explained by the physiographic characteristics of the drained basin (Figure 20). In this last figure, the Kouyou River presents an intermediate hydrological regime. Indeed, it originates in the Batéké Plateau with important annual runoff coefficients due to a strong and rapid infiltration in the aquifer, which will smooth the seasonal variability of its flows. It ends its course in the ‘Cuvette Centrale’ where, in the absence of a buffer aquifer and in the presence of a significant forest cover favoring evapotranspiration, the annual runoff coefficient becomes weaker and the seasonal variability of its flows, higher.
Another anomaly in the “Cuvette Centrale”, emphasized by Lee et al. (2011; 2014) [53,54] using remote sensing, is the difference between water levels in the river mainstem and the floodplain, which are lower by 0.5 to 3.0 m than the adjacent wetlands. Moreover, the mean seasonal variation of water levels on the mainstem of the Congo river, 3.5, 2.5, and 2.5 m, respectively at Kinshasa, Mbandaka, and Kisangani, repeated from decades of stage value studies by O’Loughlin et al. (2013) [101] and Betbeder et al. (2013) [102], are not matched with the seasonal variation of water levels in the adjacent wetlands of only 0.5 to 1.0 m, measured by Envisat radar altimetry [53,54]. This range of about 1 m of amplitude (Figure 21), presented in Alsdorf et al. (2016) [103], was also observed by in situ observations on the Télé Lake on the right bank wetland by Laraque et al. (1998) [104]. When taking into consideration, these studies conducted using remote sensing and ground observations on shallow lakes of the “Cuvette Centrale”, such as the Mai Dombe and Tumba lakes [100,105] on the left bank and the Télé Lake on the right bank of Congo River, it appears that the vertical water exchange (rainfall versus PET) is dominant in the center of the Congo Basin. Laraque et al. (1998) [104], already stated that mainly meteorological contributions (~1650 mm year−1) were largely compensated for (>80%) by evaporation (~1300 mm year−1) in the wetland area of Télé Lake, where convective thunderstorms vertically recycle moisture. The “Cuvette Centrale” is filled mostly by rain (which accumulates in the depression) rather than by the overflowing of the river. In the low flow period, this place seems to drain slowly by gravity, through seepage, drainage, and desaturation of its spongy peat soils towards the mainstem river situated at a lower elevation.
Obviously, its water exchange with the river mainstem is different from those of other great rivers with vast lateral floodplains like the Amazon River, where most exchanges are assured by several interconnected channels [106,107,108,109,110], named locally as “furos”.

6. Hydrological Modeling in the Congo River Basin

In this basin, one of the most complete rainfall-runoff modeling approaches which is well calibrated with all the in situ parameters available, is the work of BRLi (2016) [7], which uses the GR4J ‘rainfall-ETP-Q daily’ and Mike Hydro Basin models.
However, it is necessary to recall that hydrological modeling is used to address many water resource management issues, as models can be used with limited data, but generate sufficiently reliable information for management purposes. Tshimanga (under review) [111] provides a comprehensive review of hydrological model applications in the Congo Basin during the two last decades. This review reveals that there has been a great deal of effort from the past modeling studies to address both data issues and process understanding, and to establish models that represent the basin’s hydrological processes. The author argues that many hydrological models’ development during the past two decades in the basin have been initiated mainly in an experimental phase, testing the models’ performance in a new and data scarce environment, and not for solving the real hydrological and water resources management issues of day-to-day life. For this reason, it has been difficult to use the models in support of policy decisions for river basin management and development. There are still a number of issues and uncertainties that should attract the attention of future modeling studies—right modeling for the right reason. The author’s findings collectively reveal that researchers need to change their mindsets and to look for adequate or novel approaches to model hydrology and generate knowledge at appropriate scales of policy decision and management in the Congo Basin.
As mentioned above, the review of hydrological modeling studies in the Congo Basin shows that both data issues and processes understanding have been at the heart of model’s development in the basin. With regard to data, and given a critical lack of in-situ data, there have been efforts made towards the use of global datasets, including global climate (both reanalysis and satellite-based) and physical basin properties datasets as well as satellite altimetry for prediction of water level and discharge. With regard to process understanding, a number of functions have been developed to improve existing model structures, most specifically to address the issues of modeling natural storages of wetlands and lakes that dominate the hydrology of the Congo Basin as well as the routing functions of the large river channels [112,113,114,115]. However, there have also been a number of problems that challenged the various modeling exercises. These problems relate to a lack of appropriate data as well as the lack of a thorough understanding of climate-hydrology processes, the lack of integration of this understanding in model structures and therefore, the lack of integrated and critical model assessment [111]. Currently, there is a number of studies that focus on model development to address some of these problems. Some of these studies include the use of the LISFLOOD-FP model to inform the wetland functions of the GW-Pitman model [116]; the use of SWAT (Soil and Water Assessment Tool) to highlight the attenuation functions of the ‘Cuvette Centrale’ and its hydrological budget [117]; the application of the MGB model to develop rating curves and derive river discharge in real time based on satellite altimetry [118]; and the development of a hydraulic and bathymetric HEC-RAS 2D channel model, which allowed Carr et al. (under review) [119] to create high-definition bathymetric maps of a complex and anastomosing section along a 120-km reach of the Congo River, downstream of the Ubangi confluence (Figure 22). This HEC-RAS model is a key step in the simulation of the river hydrodynamics necessary to facilitate and secure navigation on the main river “highway” in the basin [120].
Based on old navigational charts, made sometime between 1917 and 1931 and recent remote sensing images, these last authors were able to quantify river planform change on the same place over the last century.
On a longer timescale, a study by Molliex et al. (2019) [121] focused on a reconstitution of the water and sediment flows during the 155 ka BP, thanks to the cross-analysis of the evolutions of various proxies (geochemical and isotopic on the sedimentary cores of the submarine canyon of the Congo oceanic outlet) and by using the HydroTrend model calibrated in particular for the hydrological data of the last 116 years. Figure 23 presents the results focused on the last 23 ka. This study gives an idea of the long-term variations in the Congo’s flows, according to the glacial and interglacial cycles that have affected our planet.

7. Human Use, Integrated Management, and the Future

7.1. Human Use Exploitation

Some works such as Shem and Dickinson (2006) [1] relate to the alteration of the water cycle under the effects of deforestation in the Congo Basin, but until now, the most part of the Congo River basin hydrology is still natural and relatively little affected by a population, whose standard of life is generally based on subsistence activities. Upstream of the Brazzaville-Kinshasa capitals, there are only a few hydropower dams on relatively small rivers like Lobaye, Léfini, Nzoro. There is no bridge over the course of the main river upstream or even between the two capitals, which are the nearest in the world, separated by only 3 km of river width. There are very few large cities upstream and no major industrial activities. However, there are some impacts from mining activities, especially for gold and diamonds near Kisangani city and copper near the town of Lubumbashi in the Precambrian massifs, which border the wide central sedimentary basin. There is also some wood exploitation, but deforestation is limited for example in comparison with other intertropical catchments like the Amazon basin. A large part of the Congo Basin is difficult to reach because of the lack of transport infrastructure, and large insecure areas, especially in the North-East. With the absence of a substantial road network, the fluvial navigation, even though precarious, is often the only way for the population to circulate and exchange goods, especially between states. Until the end of the 20th century, the wood was transported by floating rafts descending the river to Brazzaville to then be transported to the Congo delta by one of the few railways line, the “Congo-Ocean”, from Brazzaville.
Under these conditions, the human impact is still very weak and probably much lower than that of climate changes.
We have already noted the longer duration of the recession stage, which reduces the fluvial navigation, especially on the Ubangi tributary (Figure 11b), where the runoff deficit is responsible for the degradation of the navigation conditions since 1975 [122]. This causes increases in sandbanks, which need huge dredging operations. The length of the annual interruption period of the navigation of large boats on the Ubangi river has increased from 9 days (period 1935–1977) to 84 days (period 1978–1991), and then to 108 days (period 1983–1991) according to the ATC, ACCF, SCEVN (2000) [123] report, and has been more than 200 days since 2002. The same report indicates a critical situation for the Sangha River, a right bank tributary on which the navigation was interrupted for 30 days per year for the 2002–2004 period, when it was only 2 days a year during the years 1954–1977.
More recently, the Congo Basin Atlas of CICOS (2016) [124] pointed out that the severe low water levels that have affected the Ubangi and Sangha rivers for several years have caused navigation to stop for 4 to 6 months a year.
Fluctuations in discharges and TSS fluxes need to be monitored for the PANAV project of regional navigation and for the next steps of the construction of the “Grand” Inga Dam on the Congo River in RDC, downstream of Brazzaville and Kinshasa. This project could produce twice the electricity generating capacity as the Three Gorges Dam [125].

7.2. Need for a Coherent Policy for Future Protection and Management

Despite its size and its importance and in the context of current climate change, the Congo River is poorly known and monitored, since the almost abandonment of the hydrological network after 1960 for left bank tributaries and 1993 for right bank tributaries.
As a consequence, the countries of the Congo Basin need coordination and organization to restore/create functional hydrological services, which have to reactivate operational hydrological stations and collaborate in the management of shared databases. The hydrological and hydrosedimentological information will serve in particular to improve the fluvial navigation, which is crucial for the economy of the neighboring states.
For these reasons, CICOS was created in 1999, and has objectives to promote inland interstate waterway transport and also to coordinate programs of regional importance like the Congo-HYCOS for the Hydrological Cycle Observation System on the Congo Basin, under the WMO (World Meteorological Organization) framework, AMESD for the African Monitoring of the Environment for Sustainable Development, etc., to estimate and better manage the water resources of this vast catchment and to strengthen capacity building of the NHS, especially with the use of the remote sensing. CICOS has the mandate of the six riparian countries, occupying more than 80% of the basin, to promote the integrated management of the water resources of the Congo Basin. This institution is also responsible for coordination of the hydrological monitoring of the basin and could take advantage of the results of this publication in order to further improve its scheme for the development and management of water resources and update its management tools, especially its Hydrological Information System and Water Resources Allocation tools, with the help of other national institutions of each country.

8. Conclusions

As the longest river in Africa after the Nile, and the second-largest global river in discharge after the Amazon, the Congo represents half of the African water input to the Atlantic Ocean. The understanding of its hydro-meteorological functioning, as well as that of its solid and dissolved matter flows is essential for water, material, and energy transfer modeling on a global scale and also for the sustainable implementation of the world’s largest hydroelectric dam, the ‘Grand Inga’, which has been in the project planning stage for the last few decades.
Nguimalet and Orange (2019) [3] show that it is on the Ubangi river that the drought is the strongest, especially in this last decade, where the maximum flow rates are the most affected.
It raises an increasing problem for inland navigation, as the annual duration of which is reduced due to the longer annual period of low flows. This is crucial because it is the key method of exchanging goods and persons between the nearby countries in the absence of any good road network.
These considerations also call into question the usefulness of the TRANSAQUA project for the construction of a channel between the northeastern Ubangi tributary of the Congo and the Logone-Chari Rivers to offset water deficits in Lake Chad and highlight the possible impacts of such a huge project [126]. The polemic on this pharaonic project is amplified by the return of the backfilling of Lake Chad, which has historically experienced several natural water level fluctuations [67]. It is a wave-like phenomenon of irregular frequency. In addition, the use and management of the resources of this ecosystem is complex because the issues are political, environmental, economic, and security-related [127]. Therefore, it is necessary to take into account the socio-environmental disruption, which the TRANSAQUA project could lead to, as this is one of world’s last fairly ‘natural’ large inter-tropical hydro-eco-systems present in central Africa.
Within the Congo Basin, the wet decade of the 1960s was the most striking anomaly in the river’s hydraulic behavior over the last 118 years, which separates two symmetrical periods (1902–1959 versus 1970–2017), with equivalent mean flows around 39,700 m3 s−1 for the Congo River at BZV/KIN. As the results of the 2006–2017 period of the recent SO-HYBAM monthly survey correspond to this same mean interannual discharge, it can also be considered representative of these two periods, which cover 104 years. The recent budget over the last 12 years of the SO-HYBAM survey shows specific discharge of 10.8 L s−1 km−2, with specific fluxes of 9.3 × 10⁶ t km−2 year−1 (i.e., 33.6 × 10⁶ t year−1) for TSS; 10.6 t km−2 year−1 (i.e., 38.1 × 10⁶ t year−1) for TDS; 4.5 t km−2 year−1 (i.e., 16.2 × 10⁶ t year−1) for DOC. These fluxes need to be constantly documented on a regular basis and at a more regional scale by taking into account technological improvements like remote sensing in data collection and possible changes due to climate and human impacts.
These results are consistent with those of past periods, illustrating the significant inertia of this basin by: (i) being located on both sides of the equator line, (ii) the virtue of its very large area which may mitigate further possible changes, and (iii) highlighting the buffering role of the vast forest cover and of the huge ‘sponge’ formed by the ‘Cuvette Centrale’, which helps to sustain flows. Even if the drought has been particularly severe in the northern part of its basin, this paper underlines that its hydrological functioning was not very impacted due to its large untouched ‘cuvette’, which is the opposite of the Amazon rainforest where the impact of deforestation on the basin and on the flows of the Amazon River had begun to be suspected by Callède et al. (2008) [128], who indicated a 5% increase in the mean annual discharge over the 22 years from 1981 to 2003 and a number of strong floods five time higher during this period than before. Since then, the situation has continued to worsen.
Of course, short-term observations (one century) on large basins such as the Congo, should not obscure the relativity of the hydrological standards that have been established on the concepts of flow stationarity. This concept shows that our temporal myopia is moreover questioned [129,130] and must therefore be revised, as shown by the study of highly reactive sub-basins such as the Ubangi, which has evidenced accentuated hydropluviometric regime changes since 1970.
To face its future challenges like IWRM, the Congo Basin urgently needs the emergence of a true regional hydrological awareness to ensure the sustainable and balanced development of one of the last and rare regions of the world, which is still relatively pristine.

Author Contributions

Conceptualization, A.L., and G.D.M.N.; methodology, A.L., G.D.M.N., and D.O.; software, A.L., G.D.M.N., and J.M.T.; validation, A.L., D.O., R.T., and J.M.T.; formal analysis, A.L., G.D.M.N., R.T., and J.M.T.; investigation, A.L., G.D.M.N., D.O., R.T., J.M.T., G.M., C.R.N., M.A.T., and S.Y.; resources, A.L., G.D.M.N., D.O., R.T., J.M.T., G.M., C.R.N., M.A.T., S.Y. and G.G.; data curation, A.L. and G.D.M.N.; writing—original draft preparation, A.L.; writing—review and editing, all authors.; visualization, all authors; supervision, A.L. All authors have read and agreed to the published version of the manuscript.

Funding

This research received no external funding.

Acknowledgments

“On the eve of my retirement, and to use an African expression, I dedicate this summary to my ORSTOM “Dads”, Jean Claude Olivry and Bernard Pouyaud, who entrusted me with the responsibility of the last hydrology laboratory at the ORSTOM Centre in Brazzaville. On the Congolese side, my “Dad” was Paul Bassema, an intrepid hydrologist technician, capable of solving everything in the bush. I also dedicate this paper to Bienvenu Maziezoula, endowed with the wisdom of a great Chief with whom I shared this direction. I cannot forget the generations of ORSTOM hydrologists who have succeeded one another in Congo and CAR since the 1940s to set up and manage their hydrological networks under epic and very difficult conditions. This synthesis has been made possible thanks to data from international projects such as PIRAT, PEGI/GBF & SO-HYBAM, (https://hybam.obs-mip.fr/), SIEREM (www.hydrosciences.fr/sierem), and the ECHOBACO/AUF project, thanks to the international and inter-institutional collaboration and cooperation between various institutions such as BRLi, CICOS, the Directorate of Meteorology and Hydrology of CAR, GET, GIE-SCEVN, HSM, IRD (e.g., ORSTOM), RVF, UMNG, and UNIKIN. Special thanks go to L. Ayissou, A. Carr, S. Délichère, P. Datok, G. Mokando, A. Pandi, N. Rouché, A. Yambélé, and S. Yepez for their various collaborations. Finally, I would also like to warmly thank Doug Alsdorf, specialist in remote sensing at the Ohio State University, for his initiative to relaunch research in the Congo Basin. With the AGU Chapman Conference in Washington in 2018 and this special issue on the Congo Basin, which he is leading, he has been keen to involve the nationals of this basin, so that they can be actors in their own destiny”.

Conflicts of Interest

The authors declare no conflict of interest.

References

  1. Shem, O.W.; Dickinson, R.E. How the Congo basin deforestation and the equatorial monsoonal circulation influences the regional hydrological cycle. In Proceedings of the 86th Annual American Meteorological Society Meeting, Atlanta, GA, USA, 29 January–2 February 2006; Available online: http://www.ametsoc.org/ (accessed on 4 June 2020).
  2. Mahé, G.; Olivry, J.-C. Assessment of freshwater yields to the ocean along the intertropical Atlantic coast of Africa. Comptes Rendus de l’Académie des Sci. Ser. IIAEarth Planet. Sci. 1999, 328, 621–626. [Google Scholar]
  3. Nguimalet, C.R.; Orange, D. Caractérisation de la baisse hydrologique actuelle de la rivière Oubangui à Bangui, République Centrafricaine. La Houille Blanche 2019, 1, 78–84. [Google Scholar] [CrossRef]
  4. Runge, J. The Congo River, Central Africa. In Large Rivers: Geomorphology and Management; Gupta, A., Ed.; Wiley and Sons: London, UK, 2007; pp. 293–309. [Google Scholar]
  5. De Wasseige, C.; Marshall, M.; Mahé, G.; Laraque, A. Interactions between climate characteristics and forests. In The Forests of the Congo Basin-Forest and Climate Change; De Wasseige, C., Tadoum, M., Atyi, E.A., Doumenge, C., Eds.; Weyrich: Neufchâteau, Belgium, 2015; Volume 3, pp. 53–64. [Google Scholar]
  6. SIEREM (Système d’Informations Environnementales sur les Ressources en Eau et leur Modélisation), mai. Available online: www.hydrosciences.fr/sierem (accessed on 20 May 2020).
  7. BRLi (Bas Rhône Languedoc Ingénierie). Développement et Mise en Place de L’outil de Modélisation et D’allocation des Ressources en eau du Bassin du Congo. Rapport Technique de Construction et Calage du Modèle. Rapport d’étude Pour le Compte de la CICOS; Commission Internationale du bassin Congo-Oubangui-Sangha: Kinshasa, Democratic Republic of the Congo, 2016; p. 210. [Google Scholar]
  8. Runge, J.; Nguimalet, C.R. Physiogeographic features of the Ubangi catchment and environmental trends reflected in discharge and floods at Bangui 1911–1999, Central African Republic. Geomorphology 2005, 70, 311–324. [Google Scholar] [CrossRef]
  9. Bwangoy, J.-R.B.; Hansen, M.C.; Roy, D.P.; de Grandi, G.; Justice, C.O. Wetland mapping in the Congo Basin using optical and radar remotely sensed data and derived topographical indices. Remote Sens. Environ. 2010, 114, 73–86. [Google Scholar] [CrossRef]
  10. Laraque, A.; Mietton, M.; Olivry, J.C.; Pandi, A. Impact of lithological and vegetal covers on flow discharge and water quality of Congolese tributaries from the Congo River. Rev. Des Sci. De L Eau 1998, 11, 209–224. [Google Scholar]
  11. USGS. Africa Land Cover Characteristics database Version 2.0. 2000. Available online: https://www.usgs.gov/media/files/africa-land-cover-characteristics-data-base-version-20 (accessed on 5 May 2020).
  12. Farr, T.G.; Rosen, P.A.; Caro, E.; Crippen, R.; Duren, R.; Hensley, S.; Kobrick, M.; Paller, M.; Rodriguez, E.; Roth, L.; et al. The Shuttle Radar Topography Mission. Rev. Geophys. 2007, 45. [Google Scholar] [CrossRef] [Green Version]
  13. Moukandi N’kaya, G.D.; Laraque, A.; Paturel, J.M.; Gulemvuga, G.; Mahé, G.; Tshimanga Muamba, R. A new look at hydrology in the Congo Basin, based on the study of multi-decadal chronicles. In Congo Basin-Hydrology, Climate, and Biogeochemistry: A Foundation for the Future; Alsdorf, D., Tshimanga Muamba, R., Moukandi N’kaya, G.D., Eds.; AGU, John Wiley & Sons Inc.: Malden, MA, USA, 2021; Unpublished work. [Google Scholar]
  14. Laraque, A.; Maziezoula, B. Banque de Données Hydrologiques des Affluents Congolais du Fleuve Congo-Zaïre et Informations Physiographiques-programme PEGI/GBF, Volet Congo-UR22/DEC; ORSTOM-Laboratoire d’hydrologie: Montpellier, France, 1995; p. 250. [Google Scholar]
  15. Laraque, A.; Bricquet, J.-P.; Pandi, A.; Olivry, J.-C. A review of material transport by the Congo River and its tributaries. Hydrol. Process. 2009, 23, 3216–3224. [Google Scholar] [CrossRef]
  16. Orange, D.; Sigha-Nkamdjou, L.; Mettin, J.-L.; Malibangar, D.; Debondji, D.; Feizouré, C. Evolution Menuselle de la Lame D’eau Précipitée sur le Bassin de L’Oubangui Depuis 1972. Rapport ORSTOM, Bangui; Géographie, La Faculté des Lettres et Sciences Humaines, Université de Bangui: Bangui, Central African Republic, 1994; p. 132. [Google Scholar]
  17. Callède, J.; Boulvert, J.; Thiébaux, J.P. Le Bassin de l’Oubangui; IRD: Marseille, France, 2009; ISBN 978-2-7099-1680-6. Available online: https://horizon.documentation.ird.fr/exl-doc/pleins_textes/divers16-07/010050233.pdf (accessed on 16 December 2019).
  18. Mahé, G.; Rouché, N.; Dieulin, C.; Boyer, J.F.; Ibrahim, B.; Crès, A.; Servat, E.; Valton, C.; Paturel, J.E. Carte des Pluies Annuelles en Afrique/Annual Rainfall Map of Africa; IRD: Bondy, France, 2012. [Google Scholar]
  19. Bultot, F. Atlas climatique du bassin congolais-les composantes du bilan de l’eau-t. 1971. Available online: https://donum.uliege.be/handle/2268.1/2165 (accessed on 5 May 2020).
  20. Boyer, J.F.; Dieulin, C.; Rouché, N.; Crès, A.; Servat, E.; Paturel, J.E.; Mahé, G. SIEREM: An environmental information system for water resources. In Water Resource Variability: Processes, Analyses and Impacts; IAHS Publications: La Havana, Cuba, 2006; Volume 308, pp. 19–25. [Google Scholar]
  21. UNH/GRDC Composite Runoff Fiels. Available online: http://www.grdc.sr.unh.edu (accessed on 20 May 2020).
  22. SO-HYBAM Amazon Basin Water Resources Observation Service Website. Available online: https://hybam.obs-mip.fr/ (accessed on 25 February 2020).
  23. Mateba 22 Report, Observations Limnimétriques: Kinshasa-Matadi-Boma, Inventaire 1903–1983 Navigabilité du Bief Maritime du Fleuve Zaïre; Laboratoire de Recherches Hydrauliques: Chatelet, Belgium, 1984; 50p.
  24. Olivry, J.-C.; Bricquet, J.-P.; Thiébaux, J.-P. Bilan annuel et variations saisonnières des flux particulaires du Congo à Brazzaville et de l’Oubangui à Bangui. La Houille Blanche. 1989, 3, 311–316. [Google Scholar] [CrossRef] [Green Version]
  25. Laraque, A.; Bricquet, J.-P.; Olivry, J.-C.; Berthelot, M. Transports solides et dissous du fleuve Congo (Bilan de six années d’observations). In Grands Bassins Fluviaux Périatlantiques: Congo, Niger, Amazone-Actes du Colloque PEGI-INSU-CNRS-ORSTOM; Olivry, J.-C., Boulègue, J., Eds.; ORSTOM Editions: Paris, France, 1995; pp. 133–145. [Google Scholar]
  26. Laraque, A.; Orange, D. Banque de Données Hydrochimiques Des Eaux de Surface d’Afrique Centrale (Congo et Oubangui) de 1987 à 1994-Programme PEGI/GBF; Volet Afrique Centrale-Laboratoire d’hydrologie, ORSTOM: Montpellier, France, 1996; p. 145. [Google Scholar]
  27. Laraque, A.; Orange, D.; Gries, S. Typologie Géochimique des Eaux de Surface Congolaises du Fleuve Congo-Statistique Descriptive par Population Géographique (SYSTAT) et Analyses Qualitatives et Temporelles par Station (EXCEL)-Tome 1; Lab. Hydrologie, ORSTOM: Montpellier, France, 1996; p. 204. Available online: https://horizon.documentation.ird.fr/exl-doc/pleins_textes/divers16-09/010051468.pdf (accessed on 20 May 2020).
  28. Laraque, A.; Orange, D.; Gries, S. Typologie Géochimique des Eaux de Surface Congolaises du Fleuve Congo-Systématique des Eaux par Station (SYSEAU). Tome 2; Lab. Hydrologie, ORSTOM: Montpellier, France, 1996; p. 193. Available online: https://horizon.documentation.ird.fr/exl-doc/pleins_textes/divers16-09/010051468.pdf (accessed on 20 May 2020).
  29. Orange, D.; Laraque, A.; Gries, S. Typologie Géochimique des Eaux de Surface de L’Oubangui-Statistique Descriptive par Population Géographique (SYSTAT) et Analyses Qualitatives et Temporelles par Station (EXCEL). Tome 1; Lab. Hydrologie, ORSTOM: Montpellier, France, 1996; p. 240. [Google Scholar] [CrossRef]
  30. Orange, D.; Laraque, A.; Gries, S. Typologie Géochimique Des Eaux de Surface de L’Oubangui-Systématique Des Eaux Par Station (SYSEAU). Tome 2; Hydrologie, ORSTOM: Montpellier, France, 1996; p. 136. [Google Scholar] [CrossRef]
  31. Tshimanga, R.M.; Tshitenge, J.M.; Kabuya, P.; Alsdorf, D.; Mahe, G.; Kibukusa, G.; Lukanda, V. A regional perceptive of flood forecasting and disaster management systems for the Congo River basin. In Flood Forecasting: An International Perspective; Adams, T.E., Pagano, T.C., Eds.; Academic Press: Cambridge, MA, USA; Elsevier: Amsterdam, The Netherlands, 2016; pp. 87–124. [Google Scholar]
  32. Dieulin, C.; Mahe, G.; Paturel, J.E.; Ejjiyar, S.; Tramblay, Y.; Rouche, N.; El Mansouri, B. A new 60-year 1940–1999 monthly gridded rainfall data set for Africa. Water 2019, 11, 387. [Google Scholar] [CrossRef] [Green Version]
  33. Lempicka, M. Bilan Hydrique du Bassin du Fleuve Zaïre. I: Ecoulement du Bassin 1950–1959; Office National de la Recherche et du Développement: Kinshasa, Democratic Republic of the Congo, 1971. [Google Scholar]
  34. Anthony, C.; Hirst, A.C.; Hastenrath, S. Diagnostics of hydrometeorological anomalies in the Zaïre (Congo) basin. J. R. Met. Soc. 1983, 109, 881–892. [Google Scholar]
  35. Janicot, S. Spatio-temporal variability of West African rainfall; part I: Regionalizations and typing. J. Clim. 1992, 5, 489–511. [Google Scholar] [CrossRef] [Green Version]
  36. Mahé, G. Modulation annuelle et fluctuations interannuelles des précipitations sur le bassin-versant du Congo. In Grands Bassins Fluviaux Périatlantiques: Congo, Niger, Amazone-Actes du colloque PEGI-INSU-CNRS-ORSTOM; Olivry, J.-C., Boulègue, J., Eds.; ORSTOM: Paris, France, 1995; pp. 13–26. [Google Scholar]
  37. Bigot, S.; Moron, V. Synchronism between temporal discontinuities in African rainfall and sea-surface temperatures. In Climate Dynamics; Tellus: Stockholm, Sweden, 1997; p. 26. [Google Scholar]
  38. Samba, G.; Nganga, D.; Mpounza, M. Rainfall and temperature variations over Congo Brazzaville between 1950 and 1998. Theor. Appl. Climatol. 2008, 91, 85–97. [Google Scholar] [CrossRef]
  39. Riou, C. Experimental study of potential evapotranspiration (PET) in Central Africa. J. Hydrol. 1983, 72, 88. [Google Scholar] [CrossRef]
  40. Samba Kimbata, M.-J. Précipitations et bilans de l’eau dans le bassin forestier du Congo et ses marges. Ph.D. Thesis, Université de Bourgogne, Dijon, France, 1991. [Google Scholar]
  41. Matsuyama, H.; Oki, T.; Shinoda, M.; Masuda, K. The seasonnal change of the Water Budget in the Congo River Basin. J. Meteorol. Soc. Jpn. 1994, 72, 281–299. [Google Scholar] [CrossRef] [Green Version]
  42. Kazadi, S.N.; Kaoru, F. Interannual and long term climate variability over the Zaïre River Basin during the last thirty years. J. Geophys. Res. Atmos. 1996, 101, 351–360. [Google Scholar] [CrossRef]
  43. Laraque, A.; Bellanger, M.; Adele, G.; Guebanda, S.; Gulemvuga, G.; Pandi, A.; Paturel, J.E.; Robert, A.; Tathy, J.P.; Yambélé, A. Recent evolutions of Congo, Ubangi and Sangha rivers flows. Geo-Eco-Trop 2013, 37, 93–99. [Google Scholar]
  44. Orange, D.; Wesselink, A.; Mahé, G.; Feizouré, C.T. The effects of climate changes on river baseflow and aquifer storage in Central Africa. In Sustainability of Water Resources under Uncreasing Uncertainty; Rosbjerg, D., Boutayeb, N., Gustard, A., Kundzewicz, Z., Rasmussen, P., Eds.; IAHS: Wallingford, UK, 1997; Volume 240, pp. 113–123. ISBN 1-901502)05-8. [Google Scholar]
  45. Mahé, G.; Olivry, J.-C.; Dessouassi, R.; Orange, D.; Bamba, F.; Servat, E. Relations eaux de surface–eaux souterraines d’une rivière tropicale au Mali. C. R. Acad. Sci. 2000, 330, 689–692. [Google Scholar] [CrossRef]
  46. Mahé, G.; Lienou, G.; Descroix, L.; Bamba, F.; Paturel, J.E.; Laraque, A.; Meddi, M.; Moukolo, N.; Hbaieb, H.; Adeaga, O.; et al. The rivers of Africa: Witness of climate change and human impact on the environment. Hydrol. Process. 2013. [Google Scholar] [CrossRef]
  47. Sircoulon, J. Variations des débits des cours d’eau et des niveaux des lacs en Afrique de l’Ouest depuis le 20ième siècle. In The Influence of Climate Change and Climatic Variability on the Hydrologic Regime and Water Ressources; Solomon, S., Beran, M., Hogg, W., Eds.; IAHS: Waterloo, ON, Canada, 1987; Volume 168, pp. 13–25. [Google Scholar]
  48. Wesselink, A.; Orange, D.; Feizouré, C.; Randriamiarisoa. Les régimes hydroclimatiques et hydrologiques d’un bassin versant de type tropical humide: L’Oubangui (République Centrafricaine). In L’hydrologie Tropicale: Géosciences et Outil Pour le Développement: Mélanges à la Mémoire de Jean Rodier; Chevallier, P., Pouyaud, B., Eds.; IAHS: Wallingford, UK, 1996; Volume 238, pp. 179–194. [Google Scholar]
  49. Olivry, J.-C.; Bricquet, J.-P.; Mahé, G. Vers un appauvrissement durable des ressources en eau de l’Afrique humide. In Hydrology of Warm Humid Regions. (Proc. Yokohama Symp., July 1993); Gladwell, J.S., Ed.; IAHS: Paris, France, 1993; Volume 216, pp. 67–78. [Google Scholar]
  50. Mahé, G.; Olivry, J.-C. Variations des précipitations et des écoulements en Afrique de l’Ouest et centrale de 1951–1989. Sci. et Chang. planétaires/Sécheresse 1995, 6, 109–117. [Google Scholar]
  51. Bricquet, J.-P. Les écoulements du Congo à Brazzaville et la spatialisation des apports. In Grands Bassins Fluviaux Périatlantiques: Congo, Niger, Amazone-Actes du colloque PEGI-INSU-CNRS-ORSTOM; Olivry, J.-C., Boulègue, J., Eds.; ORSTOM: Paris, France, 1995; pp. 27–38. [Google Scholar]
  52. Bricquet, J.-P.; Bamba, F.; Mahe, G.; Toure, M.; Olivry, J.C. Evolution récente des ressources en eau de l’Afrique atlantique. Rev. des Sci. de l’Eau 1997, 3, 321–337. [Google Scholar]
  53. Lee, H.; Beighley, R.E.; Alsdorf, D.; Jung, H.C.; Shum, C.K.; Duan, J.; Guo, J.; Yamazaki, D.; Andreadis, K. Characterization of terrestrial water dynamics in the Congo Basin using GRACE and satellite radar altimetry. Remote Sens. Environ. 2011, 115, 3530–3538. [Google Scholar] [CrossRef] [Green Version]
  54. Lee, H.; Jung, H.-C.; Yuan, T.; Beighley, R.E.; Duan, J. Controls of terrestrial water storage changes over the central Congo Basin determine by integrating PalSAR scanSAR, EnviSat altimetry, and GRACE data. In Proceedings of the Chapman Conference, Washington, DC, USA, 25 September 2018; Volume 2014. [Google Scholar]
  55. Becker, M.; Santos da Silva, J.; Calmant, S.; Robinet, V.; Linguet, L.; Seyler, F. Water Level Fluctuations in the Congo Basin Derived from ENVISAT Satellite Altimetry. Remote Sens. 2014, 6, 9340–9358. [Google Scholar] [CrossRef] [Green Version]
  56. Moukandi N’kaya, G.D.; Orange, D.; Bayonne Padou, S.; Datok, P.; Laraque, A. Temporal Variability of Sediments, Dissolved Solids and Dissolved Organic Matter Fluxes in the Congo River at Brazzaville/Kinshasa. Geosciences 2020, 10, 341. [Google Scholar] [CrossRef]
  57. Mahé, G.; Lerique, J.; Olivry, J.-C. L’Ogooué au Gabon. Reconstitution des débits manquants et mise en évidence de variations climatiques à l’équateur. Hydrol. Continent. 1990, 5, 105–124. [Google Scholar]
  58. Liénou, G.; Mahé, G.; Paturel, J.E.; Servat, E.; Sighomnou, D.; Sigha-Nkamdjou, L.; Ekodeck, G.E.; Dezetter, A.; Dieulin, C. Impact de la variabilité climatique en zone équatoriale: Exemple de modification de cycle hydrologique des rivières du sud-Cameroun. Hydrol. Sci. J. Sci. Hydrol. 2008, 53, 789–801. [Google Scholar] [CrossRef]
  59. Hubert, P. The segmentation procedure as a tool for discrete modeling of hydro-meteorological regimes. Stoch. Environ. Res. Risk Assess. 2000, 14, 297–304. [Google Scholar] [CrossRef]
  60. Moron, V.; Bigot, S.; Roucou, P. Rainfall variability in subequatorial America and Africa and relationships with the main sea-surface temperatures modes (1851–1990). Int. J. Clim. 1995, 15, 1297–1322. [Google Scholar] [CrossRef]
  61. Tshitenge Mbuebue, J.-M.; Lukanda Mwamba, V.; Tshimanga Muamba, R.; Javaux, M.; Mahe, G. Wavelet Analysis on the Variability and the Teleconnectivity of the Rainfall of the Congo Basin for 1940–1999. In Proceedings of the Conférence Internationale sur l’hydrologie des grands bassins Fluviaux d’Afrique, Hammamet, Tunisia, 26–30 October 2015. [Google Scholar]
  62. Lubes Niel, H.; Masson, J.M.; Paturel, J.E.; Servat, E. Variabilité climatique et statistiques. Etude par simulation de la puissance et de la robustesse de quelques tests utilisés pour vérifier l’homogénéité de chroniques. Rev. des Sci. de l’Eau 1998, 11, 383–408. [Google Scholar] [CrossRef] [Green Version]
  63. KHRONOSTAT. Logiciel D’analyse Statistique de Séries Chronologiques; IRD Ex: Paris, France; Available online: http://www.hydrosciences.org/spip.php?article239 (accessed on 14 October 1999). (In French)
  64. WMO. World Meteorological Organization, Climatic Change. Report of a Working Group of the Commission for Climatology; WMO 195, TP 100, Tech. note n°79; WMO: Geneva, Switzerland, 1966. [Google Scholar]
  65. Laraque, A.; Mahé, G.; Orange, D.; Marieu, B. Spatiotemporal Variations in hydrological regimes within Central Africa during the XXth century. J. Hydrol. 2001, 245, 104–117. [Google Scholar] [CrossRef]
  66. Nguimalet, C.R.; Orange, D. Evolution annuelle de l’indice pluviométrique sur le bassin de l’Oubangui à Mobaye (1938–2015). In Congo Basin-Hydrology, Climate, and Biogeochemistry: A Foundation for the Future; Alsdorf, D., Tshimanga, M.R., Moukandi N’kaya, G.D., Eds.; AGU, John Wiley & Sons Inc.: Malden, MA, USA, 2021; Unpublished work. [Google Scholar]
  67. Pham-Duc, B.; Sylvestre, F.; Papa, F.; Frappart, F.; Bouchez, C.; Crétaux, J.-F. The Lake Chad hydrology under current climate change. Nat. Sci. Rep. 2020, 10, 5498. [Google Scholar] [CrossRef] [Green Version]
  68. Nicholson, S. Climate and climatic variability of rainfall over eastern Africa. Rev. Geoph. 2017. [Google Scholar] [CrossRef] [Green Version]
  69. van Mierlo, J.G. Le mécanisme des alluvions du Congo. Annls. Ass. Ingrs. Éc Gand. 1926, 5, 349–354. [Google Scholar]
  70. Spronck, R. Mesures hydrographiques dans la région divagante de bief maritime du fleuve Congo. Mém. Inst. R. Colon. Sect. Sci. Technol. 1941, 3, 56. [Google Scholar]
  71. Eisma, D.; Kalf, J.; Vandergaast, S.J. Suspended Matter in the Zaire Estuary and the Adjacent Atlantic Ocean. Neth. J. Sea Res. 1978, 12, 382–406. [Google Scholar] [CrossRef]
  72. Coynel, A.; Seyler, P.; Etcheber, H.; Meybeck, M.; Orange, D. Spatial and seasonal dynamics of total suspended sediment and organic carbon species in the Congo River. Glob. Biogeochem. Cycles 2005, 19, GB4019. [Google Scholar] [CrossRef]
  73. Spencer, R.G.M.; Hernes, P.J.; Aufdenkampe, A.K.; Baker, A.; Gulliver, P.; Stubbins, A.; Aiken, G.R.; Dyda, R.Y.; Butler, K.D.; Mwamba, V.L.; et al. An initial investigation into the organic matter biogeochemistry of the Congo River. Geochim. Cosmochim. Acta 2012, 84, 614–627. [Google Scholar] [CrossRef]
  74. Spencer, R.G.M.; Hernes, P.J.; Dinga, B.; Wabakanghanzi, J.N.; Drake, T.W.; Six, J. Origins, seasonality, and fluxes of organic matter in the Congo River. Glob. Biogeochem. Cycles 2016, 30. [Google Scholar] [CrossRef]
  75. Seyler, P.; Coynel, A.; Moreira-Turcq, P.; Etcheber, H.; Colas, C.; Orange, D.; Bricquet, J.-P.; Laraque, A.; Guyot, J.L.; Meybeck, M. Organic carbon transported by the equatorial rivers: Example of Zaire-Congo and Amazon Rivers. In Soil Erosion and Carbon Dynamics; Roose, E.J., Lal, R., Feller, C., Barthes, B., Stewart, B.A., Eds.; CRC Press: Boca Raton, FL, USA, 2006; Volume 15, pp. 255–274. [Google Scholar]
  76. Bouillon, S.; Yambélé, A.; Gillikin, D.P.; Teodoru, C.; Darchambeau, F.; Lambert, T.; Borges, A.V. Contrasting biogeochemical characteristics of the Oubangui River and tributaries (Congo River basin). Sci. Rep. 2014, 4, 5402. [Google Scholar] [CrossRef]
  77. Devroey, E. Le Bassin Hydrographique Congolais; Coll Mémoires in-8° de la Section des Sciences Techniques Institut Royal Colonial Belge: Bruxelles, Belgium, 1941; p. 172. [Google Scholar]
  78. Nedeco (Netherlands Engineering Company). River Studies, Niger and Benué; North Holland Publishing Co.: Amsterdam, The Netherlands, 1959. [Google Scholar]
  79. Gibbs, R.J. Amazon river-environmental factors that control Iits dissolved and suspended load. Science 1967, 156, 1203–1232. [Google Scholar] [CrossRef]
  80. Symoens, J.J. La minéralisation des eaux naturelles. Résultats scientifiques. Explor. Hydrobiol. Bassin du Lac Bangwelo et du Luapula 1968, 2, 1–199. [Google Scholar]
  81. Holleman, J.N. The sediment yield of major rivers of the world. Water Resour. Res. 1968, 4, 737–747. [Google Scholar] [CrossRef]
  82. Vanderlinden, M.J.H. Reactions between Acids and Leaf Literi; Premier colloque Int. Biodegradation et humification. Ph.D. Thesis, Univ. Nancy, Nancy, France, 1975. [Google Scholar]
  83. Meybeck, M. Note on e1ementa1 contents of the Zaïre River. Neth. J. Sea Res. 1978, 12, 293–295. [Google Scholar] [CrossRef]
  84. Meybeck, M. Concentrations des eaux fluviales en éléments majeurs et apports en solution aux océans. Revue de Géologie Dyn. Géogr. Phys. 1979, 21, 215–246. [Google Scholar]
  85. Molinier, M. Note sur les débits et la qualité des eaux du Congo à Brazzaville. Cah. ORSTOM Série Hydrol. 1979, 16, 55–66. [Google Scholar]
  86. Deronde, L.; Symoens, J.J. L’exportation des éléments dominants du bassin du fleuve Zaïre: Une réévaluation. Ann. Limnol. 1980, 16, 183–188. [Google Scholar] [CrossRef]
  87. Grondin, J.L.; Gac, J.Y. Apports de matières aux océans: Bilan des six principaux fleuves d’Afrique. 1980; unpublished work. [Google Scholar]
  88. Eisma, D. Suspended matter as a carrier for pollutants in estuaries and the sea. In Marine Environmental Pollution, 2. Mining and Dumping; Geyer, R.A., Ed.; Elsevier: Amsterdam, The Netherlands, 1982; Volume 27, pp. 281–295. [Google Scholar]
  89. Meybeck, M. Carbon, nitrogen and phosphorus transport by world rivers. Am. J. Sci. 1982, 282, 401–450. [Google Scholar] [CrossRef]
  90. Kinga-Mouzeo. Transport Particulaire Actuel du Fleuve Congo et de Quelques Affluents; Enregistrement Quaternaire dans L’éventail Détritique Profond (Sédimentologie, Minéralogie et Géochimie). Ph.D. Thesis, Université de Perpignan, Perpignan, France, 1986; p. 251. [Google Scholar]
  91. Nkounkou, R.; Probst, J.-L. Hydrology and geochemistry of the Congo River system. SCOPE/UNEP Sonderband 1987, 64, 483–508. [Google Scholar]
  92. Olivry, J.-C.; Bricquet, J.-P.; Thiébaux, J.-P.; Sigha-Nkamdjou, L. Transport de matière sur les grands fleuves des régions intertropicales: Les premiers résultats des mesures de flux particulaires sur le bassin du fleuve Congo. In Sediment Budgets; AISH 174: Porto-Alegre, Brazil, 1988; pp. 509–521. [Google Scholar]
  93. Probst, J.-L.; Nkounkou, R.; Krempp, G.; Bricquet, J.-P.; Thiebaux, J.-P.; Olivry, J.-C. Dissolved major elements exported by the Congo and the Ubangi rivers during the period 1987–1989. J. Hydrol. 1992, 135, 237–257. [Google Scholar] [CrossRef]
  94. Moukolo, N.; Laraque, A.; Olivry, J.-C.; Bricquet, J.-P. Transport en solution et en suspension par le fleuve Congo (Zaïre) et ses principaux affluents de la rive droite. Hydrol. Sci. J. 1993, 38, 133–145. [Google Scholar] [CrossRef]
  95. Olivry, J.-C.; Bricquet, J.-P.; Laraque, A.; Guyot, J.-L.; Bourges, J.; Roche, M.A. Flux liquides, dissous et particulaires de deux grands bassins intertropicaux: Le Congo à Brazzaville et le Rio Madeira à Villabella. In Grands Bassins Fluviaux Périatlantiques: Congo, Niger, Amazone-Actes du Colloque PEGI-INSU-CNRS-ORSTOM; Olivry, J.-C., Boulègue, J., Eds.; ORSTOM: Paris, France, 1995; pp. 345–355. [Google Scholar]
  96. Sondag, F.; Laraque, A.; Riandey, C. Chimie des eaux du fleuve Congo à Brazzaville et de l’Oubangi à Bangui (années 1988 à 1992). In Grands Bassins Fluviaux Périatlantiques: Congo, Niger, Amazone-Actes du colloque PEGI-INSU-CNRS-ORSTOM; Olivry, J.-C., Boulègue, J., Eds.; ORSTOM: Paris, France, 1995; pp. 121–131. [Google Scholar]
  97. Laraque, A.; Castellanos, B.; Steiger, J.; Lopez, J.-L.; Pandi, A.; Rodriguez, M.; Rosales, J.; Adèle, G.; Perez, J.; Lagane, C. A comparison of the suspended and dissolved matter dynamics of two large inter-tropical rivers draining into the Atlantic Ocean: The Congo and the Orinoco. Hydrol. Process. 2013. [Google Scholar] [CrossRef]
  98. Borges, A.V.; Darchambeau, F.; Lambert, T.; Morana, C.; Allen, G.H.; Tambwe, E.; Toengaho Sembaito, A.; Mambo, T.; Nlandu Wabakhangazi, J.; Descy, J.-P.; et al. Variations in dissolved greenhouse gases (CO2, CH4, N2O) in the Congo River network overwhelmingly driven by fluvial-wetland connectivity. Biogeoscience 2019, 16, 3801–3834. [Google Scholar] [CrossRef] [Green Version]
  99. Mushi, C.A.; Ndomba, P.M.; Trigg, M.A.; Tshimanga, R.M.; Mtalo, F. Assessment of basin-scale soil erosion within the Congo River Basin: A review. Catena 2019, 178, 64–76. [Google Scholar] [CrossRef]
  100. Burgis, M.J.; Symoens, J.J. African Wetlands and Shallow Water Bodies-Zones Humides et lacs peu Profonds d’Afrique; ORSTOM: Paris, France, 1987; p. 650. [Google Scholar]
  101. O’Loughlin, F.; Trigg, M.A.; Schumann, G.J.-P.; Bates, P.D. Hydraulic characterization of the middle reach of the Congo River. Water Res. Resear. 2013, 49, 5059–5070. [Google Scholar] [CrossRef]
  102. Betbeder, J.; Gond, V.; Frappart, F.; Baghdadi, N.N.; Briant, G.; Bartholomé, E. Mapping of central Africa forested wetlands using remote sensing. IEEE J. Sel. Top. Appl. Earth Obs. Remote Sens. 2013. [Google Scholar] [CrossRef] [Green Version]
  103. Alsdorf, D.; Beighley, D.; Laraque, A.; Lee, H.; Tshimanga, R.; O’Loughlin, F.; Mahé, G.; Dinga, B.; Moukandi N’kaya, G.; Spencer, R.G.M. Opportunities for hydrologic research in the Congo Basin. Rev. Geophys. 2016, 54. [Google Scholar] [CrossRef] [Green Version]
  104. Laraque, A.; Pouyaud, B.; Rocchia, R.; Robin, R.; Chaffaut, I.; Moutsambote, J.M.; Maziezoula, B.; Censier, C.; Albouy, Y.; Elenga, H.; et al. Origin and function of a closed depression in equatorial humid zones: The lake Tele in the north Congo. J. Hydrol. 1998, 207, 236–253. [Google Scholar] [CrossRef]
  105. Marlier, G. Limnology of the Congo and Amazon Rivers. In Tropical Forest Ecoystems in Africa and South America: A Comparative Review; Meggers, B.J., Ayensu, E.S., Duckworth, W.D., Eds.; Smithsonian Institution Press: Washington, DC, USA, 1973; pp. 223–238. [Google Scholar]
  106. Alsdorf, D.; Bates, P.; Melack, J.; Wilson, M.; Dunne, T. The spatial and temporal complexity of the Amazon flood measured from space. Geophys. Res. Lett. 2007, 34, L08402. [Google Scholar] [CrossRef]
  107. Rudorff, C.M.; Melack, J.M.; Bates, P.D. Flooding dynamics on the lower Amazon floodplain: 2 Seasonal and interannual\hydrological variability. Water Resour. Res. 2014, 50, 635–649. [Google Scholar] [CrossRef]
  108. Bonnet, M.-P.; Barroux, G.; Seyler, P.; Pecly, G.; Moreira-Turcq, P.; Lagane, C.; Cochoneau, G.; Viers, J.; Seyler, F.; Guyot, J.-L. Seasonal links between the Amazon corridor and its flood plain: The case of the varzea of Curuai. In Dynamics and Biogeochemistry of River Corridors and Wetlands. In Proceedings of the Symposiums Held During the Seventh IAHS Scientific Assembly, Foz do Iguaçu, Brazil, 3–9 April 2005; p. 294. [Google Scholar]
  109. Martinez, J.M.; Le Toan, T. Mapping of flood dynamics and vegetation spatial distribution in the Amazon floodplain using multitemporal SAR data. Remote Sens. Environ. 2007, 108, 209–223. [Google Scholar] [CrossRef]
  110. Trigg, M.A.; Bates, P.D.; Wilson, M.D.; Schumann, G.; Baugh, C. Floodplain channel morphology and networks of the middle Amazon River. Water Resour. Res. 2012, 48. [Google Scholar] [CrossRef] [Green Version]
  111. Tshimanga, R.M. Two decades of hydrologic modeling and predictions in the Congo River Basin: Progress and prospect for future investigations. In Congo Basin-Hydrology, Climate, and Biogeochemistry: A Foundation for the Future; Alsdorf, D., Tshimanga Muamba, R., Moukandi N’kaya, G.D., Eds.; AGU, John Wiley & Sons Inc.: Malden, MA, USA, 2021; Unpublished work. [Google Scholar]
  112. Beighley, R.E.; Ray, R.L.; He, Y.; Lee, H.; Schaller, L.; Andreadis, K.M.; Durand, M.; Alsdorf, D.; Shum, C.K. Comparing satellite derived precipitation datasets using the Hillslope River Routing (HRR) model in the Congo River Basin. Hydrol. Process. 2011, 25, 3216–3229. [Google Scholar] [CrossRef]
  113. Tshimanga, R.M.; Hughes, D.A. Basin scale performance of a semi distributed rainfall runoff model for hydrological predictions and water resources assessment of large rivers: The Congo River. Water Resour. Res. 2014. [Google Scholar] [CrossRef]
  114. Aloysius, N.; Saiers, J. Simulated hydrologic response to projected changes in precipitation. Hydrol. Earth Syst. Sci. 2017, 21, 4115–4130. [Google Scholar] [CrossRef] [Green Version]
  115. Munzimi, Y. Satellite-Derived Rainfall Estimates (TRMM Products) Used for Hydrological Predictions of the Congo River Flow: Overview and Preliminary Results. START Report. 2008. Available online: http://start.org/alumni-spotlight/yolande-munzimi.html (accessed on 12 January 2020).
  116. Kabuya, P.M.; Hughes, D.A.; Tshimanga, R.M.; Trigg, M.A. Understanding factors influencing the wetland parameters of a monthly rainfall-runoff model in the Upper Congo River Basin. In Proceedings of the EGU Conference Presentation, EGU2020-642, (in the Format Sharing Geoscience Online). 4–8 May 2020. [Google Scholar]
  117. Datok, P.; Fabre, C.; Sauvage, S.; Moukandi N’kaya, G.D.; Paris, A.; Dos Santos, V.; Laraque, A.; Sánchez Pérez, J.M. Investigating the role of the central cuvette of the Congo River in the hydrology of the basin. In Congo Basin-Hydrology, Climate, and Biogeochemistry: A Foundation for the Future; Alsdorf, D., Tshimanga Muamba, R., Moukandi N’kaya, G.D., Eds.; AGU, John Wiley & Sons Inc.: Malden, MA, USA, 2021; Unpublished work. [Google Scholar]
  118. Paris, A.; Calmant, S.; Gosset, M.; Fleischmann, A.; Conchy, T.; Garambois, P.A.; Bricquet, J.-P.; Papa, F.; Tshimanga, R.; Moukandi N’kaya, G.D.; et al. Monitoring hydrological variables from remote sensing and modelling in the Congo River basin. In Congo Basin-Hydrology, Climate, and Biogeochemistry: A Foundation for the Future; Alsdorf, D., Tshimanga Muamba, R., Moukandi N’kaya, G.D., Eds.; AGU, John Wiley & Sons Inc.: Malden, MA, USA, 2021; Unpublished work. [Google Scholar]
  119. Carr, A.; Trigg, M.A.; Tshimanga, R.; Smith, M.W.; Borman, D.J.; Bates, P.D. Modelling the Bathymetry and Hydraulics of the Congo River Multichannel Mainstem using Spatially Limited In-situ Data. In Congo Basin-Hydrology, Climate, and Biogeochemistry: A Foundation for the Future; Alsdorf, D., Tshimanga Muamba, R., Moukandi N’kaya, G.D., Eds.; AGU, John Wiley & Sons Inc.: Malden, MA, USA, 2021; Unpublished work. [Google Scholar]
  120. Trigg, M.; Carr, A.B.; Smith, M.W.; Tshimanga, R. Measuring Geomorphological Change on the Congo River Using Century Old Navigation Charts. Geomorphological Change on the Congo River. In Congo Basin-Hydrology, Climate, and Biogeochemistry: A Foundation for the Future; Alsdorf, D., Tshimanga Muamba, R., Moukandi N’kaya, G.D., Eds.; AGU, John Wiley & Sons Inc.: Malden, MA, USA, 2021; Unpublished work. [Google Scholar]
  121. Molliex, S.; Kettner, A.J.; Laurent, D.; Droz, L.; Marsset, T.; Laraque, A.; Rabineau, M.; Moukandi N’Kaya, G.D. Simulating sediment supply from the Congo watershed over the last 155 ka. Q. Sci. Rev. 2019, 203, 38–55. [Google Scholar] [CrossRef]
  122. Pandi, A.; Ibiassi, G.; Tondo, B.; Ladel, J.; Laraque, A. Impact de la variabilité des écoulements sur la navigabilité de l’Oubangui, un affluent du fleuve Congo. In Proceedings of the International Conference, (WCCCAA: Water issues/challenges and Climate Change Adaptation in Africa), Bangui, Central African Republic, 24–28 October 2012; pp. 38–39. [Google Scholar]
  123. ATC; ACCF; SCEVN. Renseignements Sur Les Conditions de Navigabilité du Fleuve Congo et Rivières du Bassin Congo-Oubangui-Sangha; Rapport Technique: Brazzaville, République du Congo, 2000; p. 69. [Google Scholar]
  124. CICOS. Atlas du Bassin du Congo; CICOS: San Jose, CA, USA, 2016; p. 95. [Google Scholar]
  125. Wachter, S.J. Giant Dam Projects Aim to Transform African Power Supplies. The New York Times. 19 June 2007. Available online: https://www.nytimes.com/2007/06/19/business/worldbusiness/19iht-rnrghydro.1.6204822.html (accessed on 25 February 2020).
  126. Umolu, J.C. Macro perspectives for Nigeria’s water resources planning. Discussion of Ubangi-Lake Chad diversion schemes. In Proceedings of the First Biennial National Hydrology Symposium, Maiduguri, Nigeria, 26–28 November 1990; pp. 218–262. [Google Scholar]
  127. Kiari Fougou, H.; Lemoalle, J. Variabilité du lac Tchad: Quelle gestion hydraulique pour préserver les ressources naturelles? In Congo Basin-Hydrology, Climate, and Biogeochemistry: A Foundation for the Future; Alsdorf, D., Tshimanga Muamba, R., Moukandi N’kaya, G.D., Eds.; AGU, John Wiley & Sons Inc.: Malden, MA, USA, 2021; Unpublished work. [Google Scholar]
  128. Callède, J.; Ronchail, J.; Guyot, J.L.; Oliveira, E. Amazonian deforestation: Its influence on the Amazon discharge at Óbidos (Brasil). Rev. Sci. L Eau 2008, 21, 59–72. [Google Scholar]
  129. Milly, P.C.D.; Betancourt, J.; Falkenmark, M.; Hirsch, R.M.; Kundzewicz, Z.W.; Lettenmaier, D.P.; Stouffer, R.J. Stationarity is dead: Whither water management? Science 2008, 319, 573–574. [Google Scholar] [CrossRef]
  130. Milly, P.C.D.; Betancourt, J.; Falkenmark, M.; Hirsch, R.M.; Kundzewicz, Z.W.; Lettenmaier, D.P.; Stouffer, R.J.; Dettinger, M.D.; Krysanova, V. On critiques of ‘Stationarity is Dead: Whither water management?’. Water Res. Resear. 2015, 51, 7785–7789. [Google Scholar] [CrossRef] [Green Version]
Figure 1. (a) Overview of Congo basin (adapted from Runge, 2007) [4], (b) Land cover on Congo basin [11], (c) Main drainage units studied in Congo basin: Lualaba at Kisangani St., Kasaï at Kutu Moke St., Sangha at Ouesso St., Ubangi at Bangui St., Batéké plateau and ‘Cuvette Centrale’, with their percentage of area of Congo basin represented by the BZV/KIN station. Legend: the dashed line encircles the general area of the ‘Cuvette Centrale’. The area with inclined dark hatching is that of the Batéké plateau, (d) Topography of the Congo Basin and of the flooded portion of the Central Basin. The topography comes from the SRTM [12] and the flooded portion of the Central Cuvette (the black polygon) is generalized by Bwangoy et al. (2010) [9], (e) Longitudinal profiles of the Congo River and its main tributaries (adapted from Runge, 2007) [4].
Water 12 02613 g001
Figure 2. (a) Density of observed rainfall stations over the Congo River Basin area [18], (b) Inter-annual averaged rainfall over the Congo River Basin, period 1940–1999, from the SIEREM database [6,20].
Water 12 02613 g002
Figure 3. Hydrological network in Congo basin. (a) Past, before 1960 versus (b) Actual, after 1960 [7].
Water 12 02613 g003
Figure 4. Participation of the different hydrological zones of the Congo Basin in the flow observed in Brazzaville/Kinshasa at different periods of the hydrological cycle (modified from Bricquet, 1995) [51] in March (a), May (b), August (c), and December (d). The area of the circles is proportional to the flow, and the percentage specifies the relative contribution of each zone to the flow in Brazzaville. For each zone, the flow retained takes into account its transfer time at the outlet. The units values are in m3 s−1.
Water 12 02613 g004
Figure 5. Discontinuities in the annual rainfall series for Ubangi basin, which comes from Nguimalet & Orange (2019) [3].
Water 12 02613 g005
Figure 6. Mean monthly rainfall regime on the Congo River Basin over two different hydroclimatic periods (1940–1979 versus 1980–1999) and over the whole 1940–1999 period.
Water 12 02613 g006
Figure 7. Regionalized annual rainfall over the whole Congo River Basin with phases of homogeneous rainfall (horizontal red lines). CRU (black) and SIEREM (green) gridded data set are compared, together with discharges time series (blue).
Water 12 02613 g007
Figure 8. Graph overlay of (a) Global wavelet spectrum and (b) wavelet spectrum of the regionalized monthly rainfall over the Congo river basin (from CRU (dark line) and SIEREMv1 gridded rainfall) (gray line) (1940–1999).
Water 12 02613 g008
Figure 9. Graph discontinuities in the annual (a) rainfall and (b) hydrological chronicles of the five main drainage units studied from field data, including that of the entire Congo Basin. Legend: Values in italics are the interannual averages of the entirety of each series studied. (Rainfall series comes from www.hydrosciences.fr/sierem) [6] and Discharges series from https://hybam.obs-mip.fr/database [22].
Water 12 02613 g009
Figure 10. Graph Comparison of the hydrological regimes of the six main drainage units of the Congo Basin and of the whole Congo basin [13]. Legend: the dashed line encircles the ‘Cuvette Centrale’.
Water 12 02613 g010
Figure 11. (a) Changes in mean daily hydrological regimes by homogeneous flow periods for Congo River at BZV/KIN, (b) and Ubangi at Bangui. The total periods of available daily Q are presented for each station.
Water 12 02613 g011
Figure 12. (a) Interannual evolution of the baseflow recession constant of the Ubangi River at Bangui and of the volume mobilized by the groundwater contribution of its catchment, from 1935 to 2015 hydrological cycles [3]. (b) Comparative evolution of annual (Qyear), maximum daily flood (Qmax), and minimum daily flood (Qmini) of the Ubangi at Bangui, from 1935 to 2015 [3].
Water 12 02613 g012
Figure 13. (a) TSS, (b) TDS, and (c) DOC concentrations versus time on the Congo River at BZV/KIN from different authors.
Water 12 02613 g013aWater 12 02613 g013b
Figure 14. (a) Mean monthly discharge (Q), Total Suspended-Sediment (TSS), Total Dissolved Solid (TDS) and Dissolved Organic Carbon (DOC) concentrations and their (b) fluxes of the Congo River at Brazzaville (for the period 2006–2017) [56].
Water 12 02613 g014
Figure 15. Distribution of dissolved matter (mg L−1) in the emerged (a) and flooded (b) part of the ‘Cuvette Centrale” [15].
Water 12 02613 g015
Figure 16. Evolution of dissolved matters during the Ubangi cruise in November 1992 [15].
Water 12 02613 g016
Figure 17. Congolese tributaries of the Congo River and smoothed contours of the Batéké plateau and of the “Cuvette Centrale’ on the right bank of the Congo River [10]”. Legend: ‘Plateaux Tékés’ = Batéké plateau’; ‘Principales stations hydrométriques’ = Main gauging stations; ‘Stations pluviométriques représentatives’ = Representative rainfall stations.
Water 12 02613 g017
Figure 18. Mean monthly typical rainfall histogram and hydrological regimes of the (a) Batéké Plateau and the (b) “Cuvette Centrale” (adapted from Laraque et al., 2001) [65].
Water 12 02613 g018
Figure 19. Composition of dissolved mineral phases (issue from mean concentration in mmol.l−1, of (a) Batéké Plateau rivers versus (b) “Cuvette Centrale” rivers (adapted from Laraque et al., 1998) [10].
Water 12 02613 g019
Figure 20. Hydrological classification of the Congolese tributaries of the Congo River [10].
Water 12 02613 g020
Figure 21. Water surface elevations for the Congo River and immediately adjacent wetlands of the Cuvette Centrale at 17.54° E, 0.74° S. Elevations are from the EnviSat radar altimeter, pass number 973. Elevations are with respect to the EGM08 geoid model [103].
Water 12 02613 g021
Figure 22. Water surface output plot of flow velocity downstream of the Ubangi confluence, from the Hec-Ras 2D channel model, described by Carr et al. (under review) [119].
Water 12 02613 g022
Figure 23. Water and suspended sediment simulation results focused over the last 23 ka. Gray curves represent annual data, while black curves are running means over 100 years. Three climatic periods (interglacial, post-glacial, and glacial) are individualized by the light gray/white bands in background. (A) Water discharge. (B) Mean suspended sediment load taking into account vegetation changes [121].
Water 12 02613 g023
Table 1. The hydro-climatic characteristics in the Congo basin represented at its main hydrological stations [13].
Geographical CoordinatesBasin Area
km2
Hydro-Climatic Characteristics
LatitudeLongitude EAltitude
m
Station OutletRatio
st./ex.
% CRB
at
BZV/KIN
Rainfall
mm
Interannual Average Discharge
m3 s−1
Specific Discharge
L s−1 km−2
Seasonal Variation
Flow
Lualaba 1Kisangani00°30′11″ N25°11′30″373974,140974,1401.0026.62130776407.81.9
Kasaï 2Kutu-Moke03°11′50″ S17°20′45″303750,000897,5400.8420.491456807010.81.9
Sangha 3Ouesso01°37′00″ N16°03′00″326159,480213,6700.754.36162515509.72.3
Ubangi 4Bangui04°22′00″ N18°35′00″345494,090650,4800.7613.50149936607.42.9
Batéké Plateau 5---30542,57090,0000.471.161900133031.241.1–1.5
‘Cuvette Centrale’ 6---305–335 1,192,190 32.571700- -
Congo 7BZV/KIN04°16′21.5″ S15°17′37.2″3143,659,9003,730,7400.98100144740,50011.071.7
The interannual modules are calculated at the different periods studied: 1 1951 to 2012; 2 1948 to 2012; 3 1947 to 2018; 4 1936 to 2018; 5&6 1947 to 1994, and 7 1903 to 2018. For the 1940–1999 period, the rainfall comes from the SIEREM database website [6], except for 5 & 6 from Laraque et al. (1998) [10]. Legend: st. = hydrometric station, ex. = outlet. The hydro-climatic characteristics of the Forest Central Basin and the Bateké plateau are derived from Laraque et Maziezoula (1995) [14] and Laraque et al. (1998 and 2009) [10,15], about right bank tributaries of Congo River represented by hydrologic stations. The coordinates X, Y, Z are those of the hydrological stations.
Table 2. Chronological compilation of TSS, TDS, and DOC concentrations since the beginning of the studies on Congo River quality at Brazzaville/Kinshasa gauging stations.
ReferencesTSSTDSDOC
(mg L−1)(mg L−1)(mg L−1)
(Van Mierlo, 1926) [69]12
(Spronck, 1941) [70]40.782
(Devroey, 1941) [77]38.2
(Nedeco, 1959) [78]50
(Gibbs, 1967) [79]23
(Symoens, 1968) [80] 36.6
(Holeman, 1968) [81]58
(Vanderliden, 1975) [82]41
(Eisma et al., 1978) [71]31.8
(Meybeck, 1978) [83] 38.25
(Meybeck, 1979) [84] 39.3
(Molinier, 1979) [85]26.551.4
(Deronde & Symoens, 1980) [86] 28.93
(Grondin & Gac, 1980) [87] 31
(Eisma, 1982) [88] 32 8.5
(Meybeck, 1984) [89] 34.99
(Kinga-Mouzeo, 1986) [90]2727.939.8
(NKounkou & Probst, 1987) [91] 36.05
(Olivry et al., 1988) [92]25.459
(Olivry et al., 1989) [24]25.459
(Probst et al., 1992) [93] 34.18
(Moukolo et al., 1992) [94]25.952.3
(Laraque et al., 1995) [25]19.2736.35
(Olivry et al., 1995) [95]2636
(Sondag et al., 1995) [96] 36
(Coynel et al., 2005) [72]26.3 10.6
(Seyler et al., 2006) [75]27.1 9.8
(Laraque et al., 2009) [15]24.9836.89
(Laraque et al., 2013) [97]25.429.411.4
(Spencer et al., 2016) [74]21.7 9.2
(Borges et al., 2019) [98] 11.9
(Moukandi N’kaya et al., 2020) [56]27.1330.9212.78
Table 3. Interannual Yearly discharge (Qy) and main surface water quality parameters for the Congo River at BZV/KIN gauging station, for the 2006–2017 period.
Parameters & UnitsMean ± StdMaxMinMax/Min
Qy (m3 s−1)39,660 ± 8.7061,33022,7102.7
Temperature (T °C)27.7 ± 1.631.720.01.6
pH6.8 ± 0.78.95.11.8
EC (µs cm−1 at 25 °C)28.4 ± 4.9836.0 20.01.8
Ionic load (mg L−1)20.3 ± 4.127.611.62.4
SiO210.5 ± 1.114.45.72.5
TSS (mg L−1)27.2 ± 7.953.210.65.0
TDS (mg L−1)31.1 ± 3.839.518.22.2
DOC (mg L−1)12.7 ± 5.029.35.25.6
TOTAL (mg L−1)71.0---
TOTAL = TDS + DOC + TSS; Std: Standard deviation.

