Article

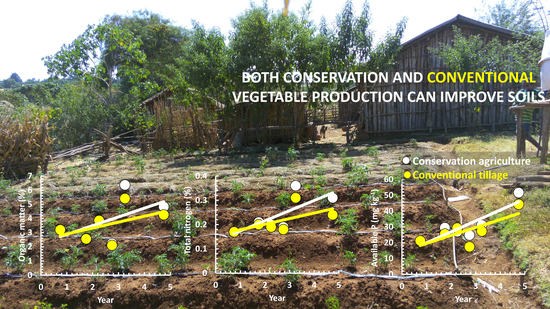
Conservation and Conventional Vegetable Cultivation Increase Soil Organic Matter and Nutrients in the Ethiopian Highlands

1
Faculty of Civil and Water Resources Engineering, Bahir Dar Institute of Technology, Bahir Dar University, Bahir Dar, Ethiopia
2
Blackland Research Center, Texas A&M AgriLife Research, Temple, TX 76502, USA
3
Department of Biological and Environmental Engineering, Cornell University, Ithaca, NY 14850, USA
4
International Water Management Institute, Yangon 11081, Myanmar
5
Sustainable Intensification Innovation Laboratory, Department of Agronomy, Kansas State University, Manhattan, Kansas, KS 66506, USA
*
Author to whom correspondence should be addressed.
Water 2022, 14(3), 476; https://doi.org/10.3390/w14030476
Submission received: 20 November 2021 / Revised: 29 January 2022 / Accepted: 1 February 2022 / Published: 5 February 2022
(This article belongs to the Special Issue Hydrology and Sedimentology of Hilly and Mountainous Landscapes)

Abstract

:
Agriculture in Africa is adversely affected by the loss of soil fertility. Conservation agriculture (CA) was introduced to curb the loss of soil fertility and water shortages and improve crop productivity. However, information on how CA practices enhance soil quality and nutrients is scarce in the sub-Saharan Africa context. The objective of this study was to investigate the effects of CA and conventional tillage (CT) on soil organic matter and nutrients under irrigated and rainfed vegetable on-farm production systems. During the dry and wet monsoon phases in the northern Ethiopian Highlands, a four-year experiment with CA and CT was carried out on ten vegetable farms under rainfed and irrigated conditions. Although the increase in concentration of organic matter in CA was generally slightly greater than in CT, the difference was not significant. The average organic matter content in the top 30 cm for both treatments increased significantly by 0.5% a−1 from 3% to almost 5%. The increase was not significant for the 30–60 cm depth. The total nitrogen and available phosphorus concentrations increased proportionally to the organic matter content. Consequently, the extended growing season, applying fertilizers and livestock manure, and not removing the crop residue increased the nutrient content in both CA and CT. The increase in CA was slightly greater because the soil was not tilled, and hay was applied as a surface cover. Although CA increased soil fertility, widespread adoption will depend on socioeconomic factors that determine hay availability as a soil cover relative to other competitive uses.

Graphical Abstract

1. Introduction

The quality and health of soils are the basis for improved livelihoods and poverty-alleviation worldwide [1]. Soils of sub-Saharan Africa (SSA), particularly in the Ethiopian Highlands, are largely degraded due to high pressure on land that increases nutrient mining and land degradation, and there is limited application of organic or inorganic fertilizers [2]. Conventional tillage (CT) practices with the Marisha plow are common in Ethiopia under irrigated and rainfed conditions and have resulted in increased soil erosion and declined soil quality. For example, organic matter has decreased to 1.7% [3,4], which is lower than the critical level of 3.5% for healthy soils [5]. This organic matter reduction in high rainfall areas resulted in increased soil acidity, erosion above 50 Mg ha−1 year−1, and bulk density [4,6,7]. In addition, it lowered cation exchange capacity and exchangeable base cations. The effect was most significant in the northern parts of Ethiopia, where the population pressure is high [8]. The rise of the population has led to smaller land sizes decreasing the food production per family [9]. The removal of crop residues from the fields for fuel, fodder, and construction materials and a lack of macro-nutrient replacement decreases the availability of plant nutrients [10]. Moreover, irrigated vegetable fields are most susceptible to nutrient depletion because the whole plant is often harvested, leaving no residue on the farm field.
Nitrogen and phosphorus are the most common limiting macronutrients in the soil for plant growth [3]. These and other nutrients are lost by erosion, runoff, and leaching, coupled with the removal of crop residues [10]. Adding organic matter such as compost, crop residues, or other organic mulches facilitates soil nutrient enrichment [11]. The use of organic mulch cover and no-tillage practice with proper crop rotations is called conservation agriculture [3]. It increases soil organic matter and consequently soil fertility through biological processes [12], enhances water and crop productivity [3,13,14], and encourages environmental sustainability by reducing soil erosion, groundwater contamination, and greenhouse gas emissions [4,15]. Consequently, conservation agriculture (CA) is proposed as a practical solution in the northern Ethiopian Highlands to improve crop productivity and enhance environmental sustainability [16].
While CA practice effectively increases soil fertility and crop productivity using chemical fertilizers [3,13,17], successful implementation requires integrating with local indigenous practices [18]. In addition to water-saving and soil fertility enhancements, the combined use of all components of CA has been shown to increase vegetable yield by approximately 40% compared with CT [19] when fertilizers are used. However, the suitability and adoption of CA technology in one place does not often necessarily justify its adoption elsewhere. Besides, the potential benefits of CA practices in the northern Ethiopian Highlands have only been evaluated by one- or two-year-long experiments and biophysical modeling [20,21]. Consequently, the impact of CA on soil organic matter and macro-nutrients should be quantified over extended periods by farmers in their fields to understand their benefits.
Therefore, the objective of this study was to evaluate the effects of CA and CT practices on soil organic matter and nutrients under irrigated and rainfed vegetable on-farm production. Ten vegetable farms in the Dengeshita county (called Kebele in Ethiopia) in the northern Ethiopian Highlands were selected. CA and CT plots were established on each farm, monitored, evaluated for four years, and their impacts quantified. No-till treatments were not considered because they increased runoff, soil erosion, and nutrient loss in a three-year experiment in the same area [22,23]. No-till also decreased crop yield [22,23].

2. Materials and Methods

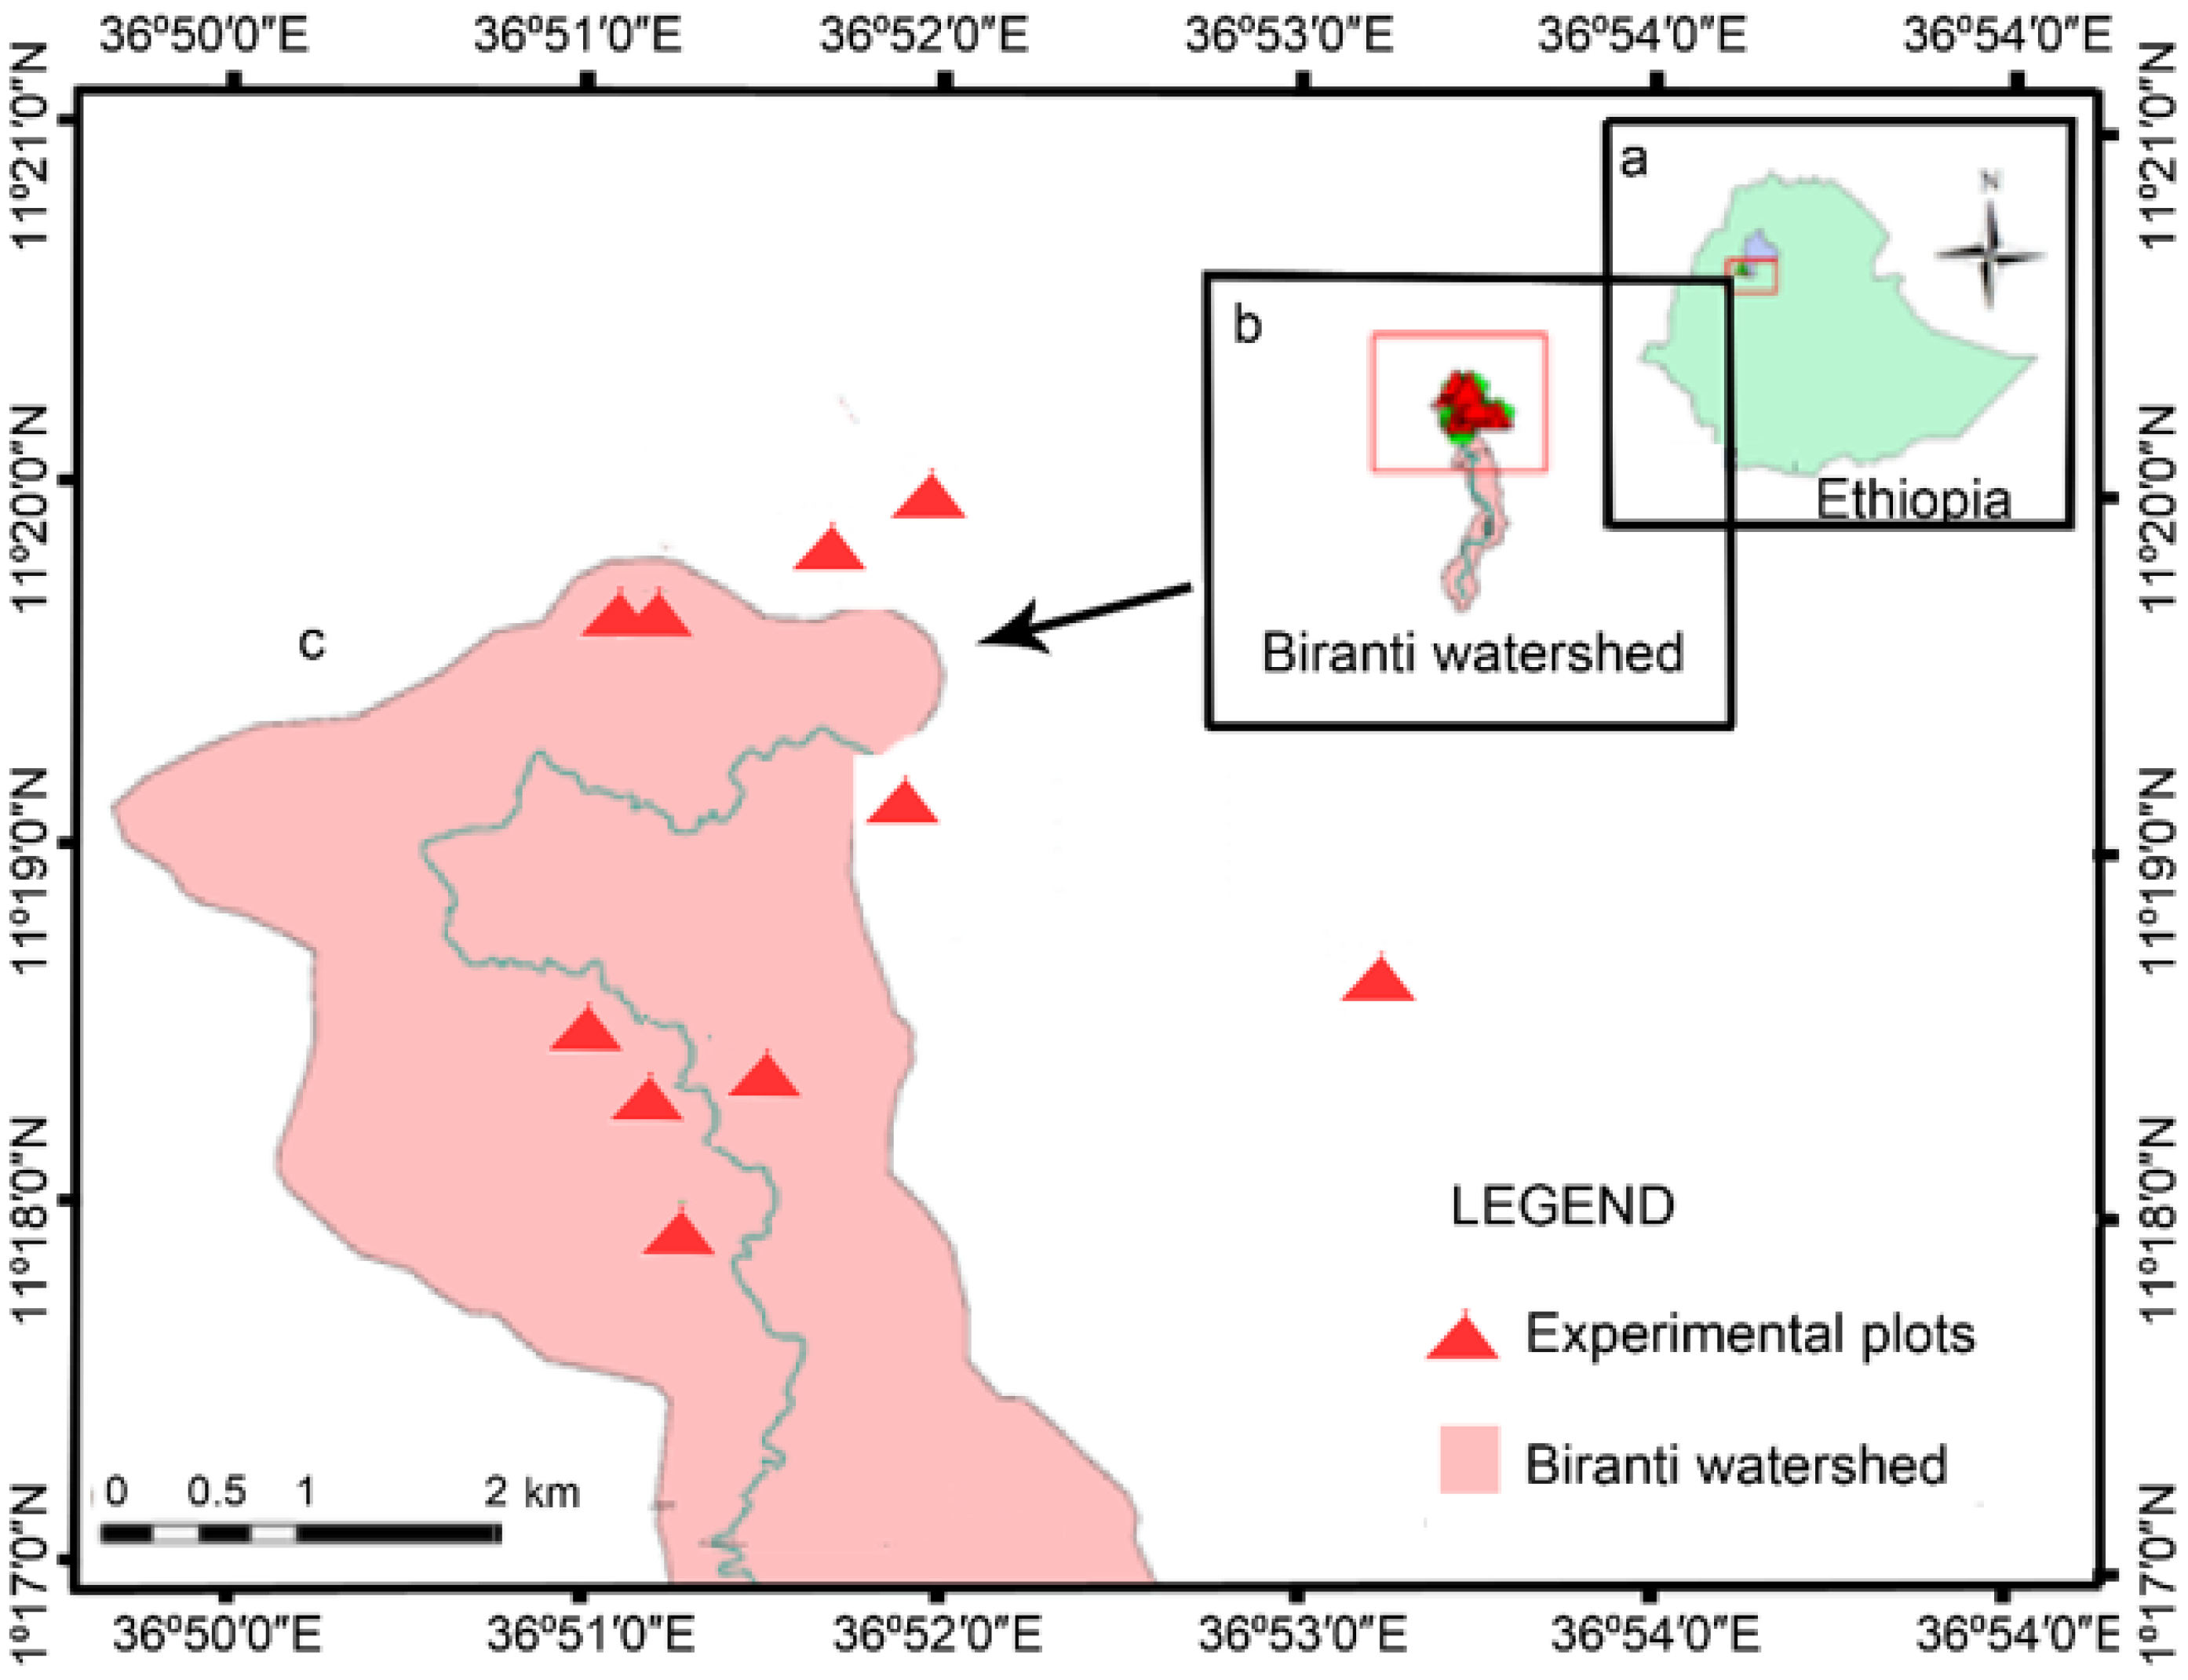
2.1. Site Description

The experimental study was conducted in Dengeshita Kebele (11.32° N, 36.85° E) in the Biranti watershed, which is part of the Gilgel Abay watershed in the upper Blue Nile Basin in Northern Ethiopia (Figure 1). The mean annual rainfall (1995–2019) was 1400 mm in Dangila town in the Kebele. More than 80% of the mean annual rainfall is from June to September. The mean monthly minimum temperature ranges from 5 to 12 °C and the maximum temperature varies from 18 to 29 °C. The slopes are between 2% to 5%. The volcanic soils have a loamy texture and are slightly acidic. Infiltration rates are greater than the prevailing rainfall intensities in unsaturated soils [6]. Before the study started, the experimental sites were used primarily for growing corn (maize, Zea mays L.) in the rain phase. Soil samples were obtained from the field and analyzed using standard laboratory procedures.

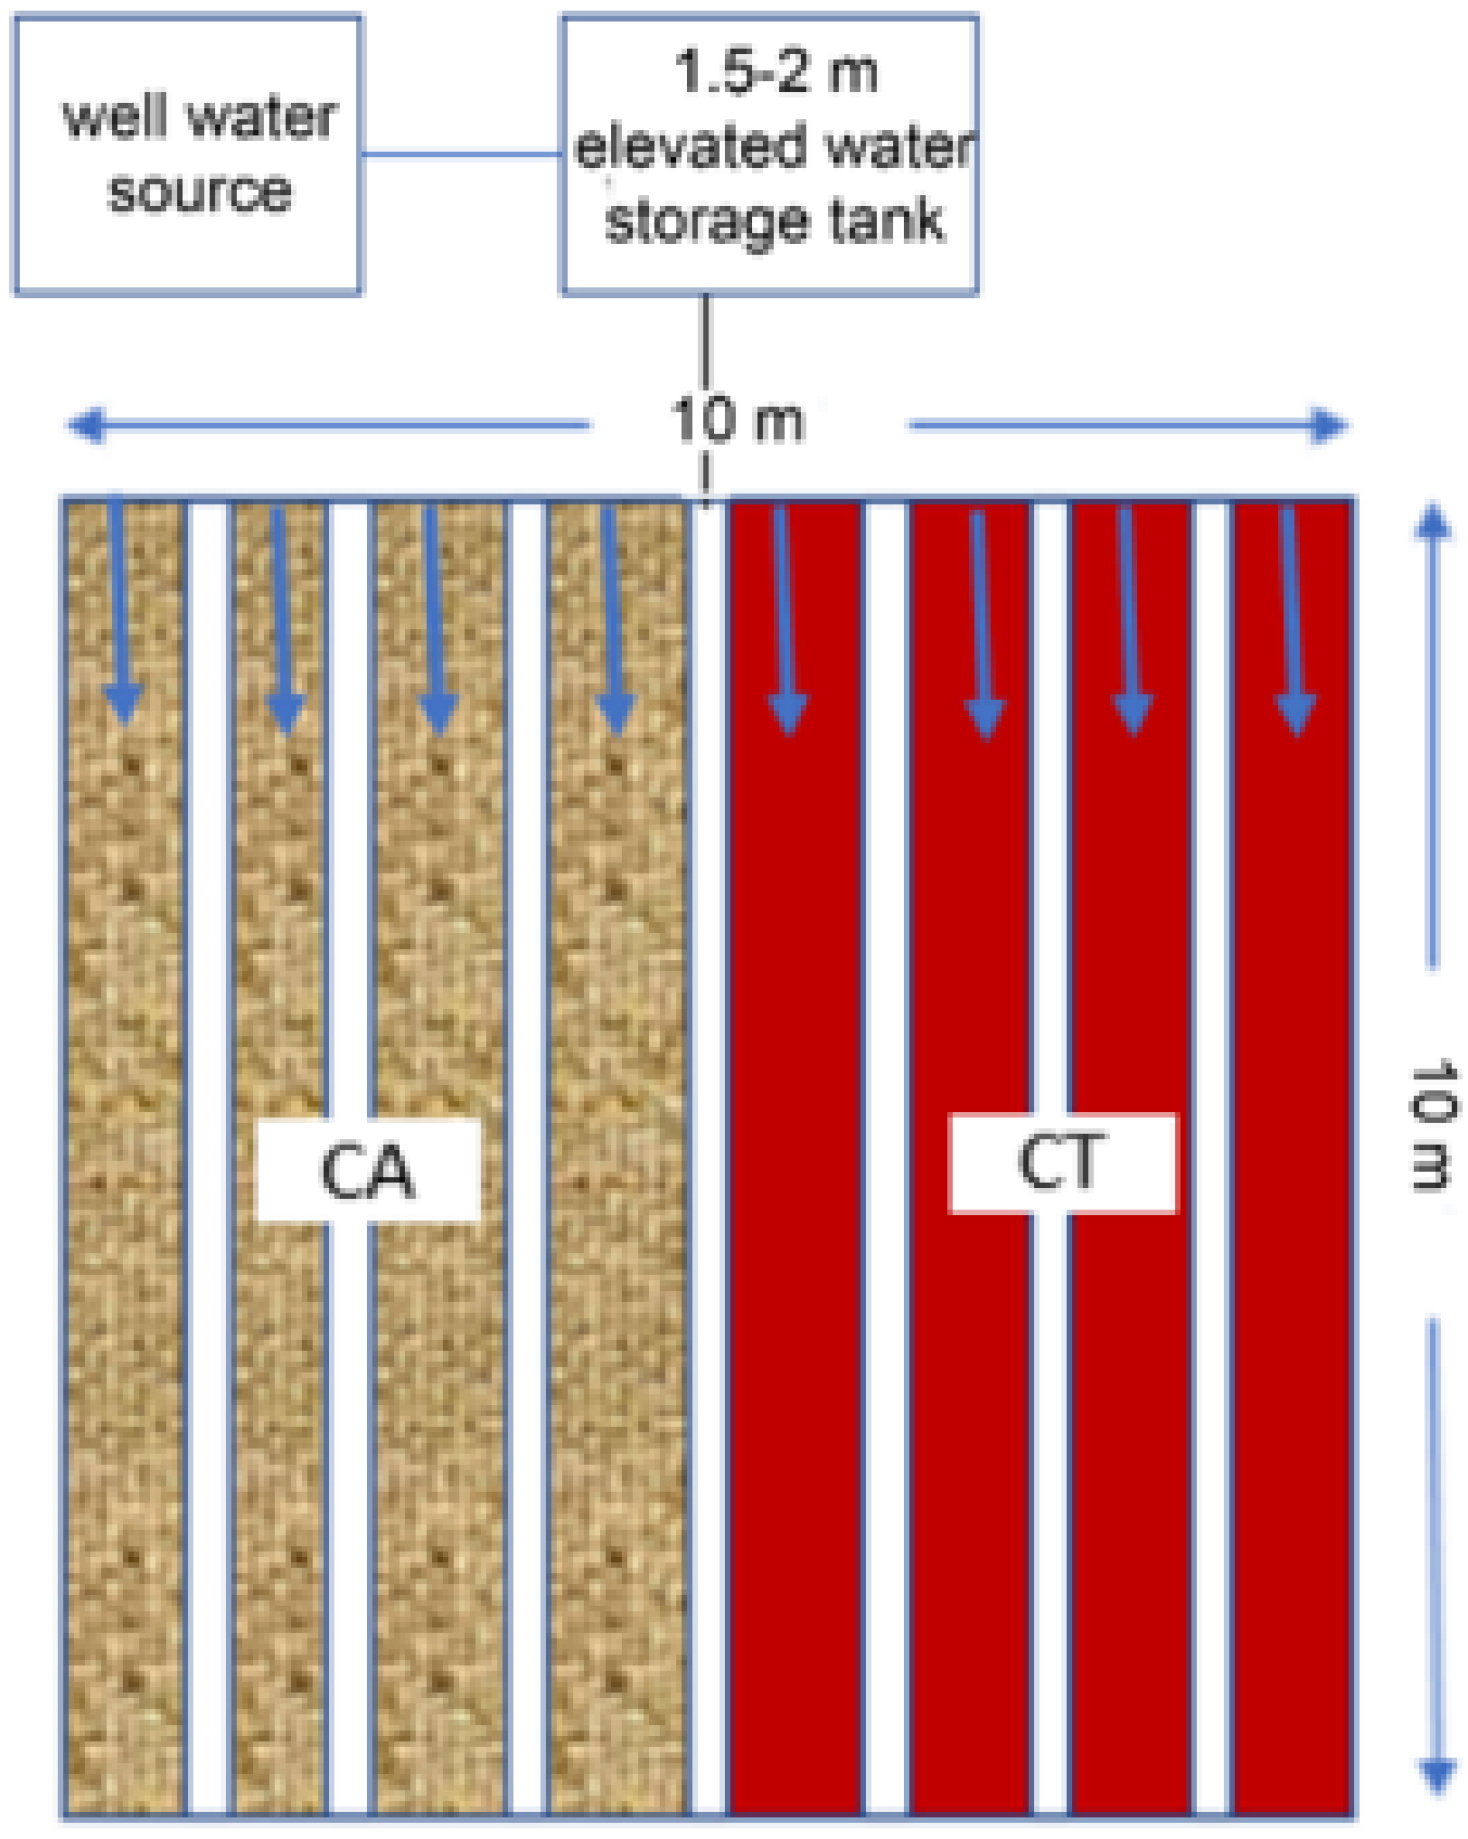
2.2. Experimental Design and Layout

In this study, on-farm field plots of size 10 m by 10 m (100 m2), all located within a 3 by 4 km area, were established to conduct the field experiments on irrigated CA during the dry and wet monsoon phases from October 2016 to August 2019 (Figure 2). CA and CT treatments were established, as shown in Figure 2. The CA treatment consisted of no-tillage and application of grass mulch, while CT plots were tilled four to six times according to existing farmer practice with a tillage depth (between 15 and 25 cm) and without grass mulch cover. Crops, rotation, on-farm activities, soil sampling, and fertilizer and manure application (Table 1) were similar in CA and CT treatments. The CA and CT plots were irrigated during the dry phase from October to February. From March to August, fields were irrigated initially and rainfed after the rains started in late May or the beginning of June.
The CA and CT treatments were carried out on each of the ten plots. Half of the plot (50 m2) was randomly assigned to the CA treatment and half to the CT treatment (Figure 2). Vegetables were irrigated with a watering can for the first 1.5 years and drip irrigation for the remaining years.
Urea (46-0-0) fertilizer was applied at the rate of 200 kg ha−1 in both CA and CT treatments based on the local farmer practices (Table 1). Local grass (Pennisetum macrourum Trin.) was harvested before seed development and dried before utilizing it as a mulch on the CA plots. The dried grass was applied at the rate of 4 Mg ha−1 as mulch cover twice per cropping period (i.e., 8 Mg ha−1 year−1) throughout the experiment period. Livestock (i.e., cow) manure was applied on five occasions in both CA and CT (Table 1) at a rate of 5 Mg ha−1. The manure, on average, contained 42% organic matter, 2.1% total nitrogen, and 82 ppm available P [24,25]). Onion and garlic were harvested from February to March and pepper from July to August (Table 1). Crop residues from both management systems were not removed. Vegetable yield for conservation agriculture was greater than for CT, as shown in Table 2 [13,19].

2.3. Soil Sampling and Analysis

Soil samples were collected six times—before crops were planted, after harvesting the second to the fifth crop, and at the end of the experiment in 2020 (Table 2). Two soil depths were sampled—the top 0–30 cm and 30–60 cm. Composite samples were made by mixing five sub-samples from the same treatment and depth (Figure 3). About 1 kg of soil was used for determining the soil physical and chemical properties at the Amhara Design and Supervisory Works Enterprise.
To determine bulk density, a cylinder, drop-hammer core sampler with 5 cm height and 5 cm diameter was driven into the soil with a hammer. The core sampler was driven to 20 cm depth for the upper 0–30 cm soil layer and to 40 cm depth for the next 30 cm layer. The cylinder containing an undisturbed soil core was removed and trimmed. The weight of the soil core was determined after drying in an oven at 105 °C for 24 h [26].
Soil samples were air-dried, sieved by a 2 mm sieve, and analyzed using standard laboratory procedures. The major soil properties included pH (H2O), cation exchange capacity (cmol (+) kg−1), available P (mg kg−1), available K (g kg−1), total N (g kg−1), field capacity (m3 m−3), permanent wilting point (m3 m−3), clay (g kg−1), silt (g kg−1), and sand (g kg−1). Soil pH was determined in 1:2.5 soil water suspension using a glass electrode at 25 °C, organic carbon by wet oxidation method [26], and available P was extracted by the Bray 2 method for acidic soils [25,27]. The Bray 2 method uses the standard reagent combination of HCl and NH₄F to extract or easily remove acid-soluble and adsorbed P bound to Al– and Fe– in a soil sample. The detection of P concentration in the extract was done by the standard molybdenum blue method at 880 nm. The standard phosphate KH2PO₄ was used as reference material during each run. The Kjeldahl method was used to determine the total N in the soil, which involved digestion of the sample in converting organic nitrogen to NH4+–N and determining NH4+–N in the digest through titration [26]. Digestion was accomplished by heating the sample with the presence of concentrated sulfuric acid (H2SO4) and the addition of potassium sulfate (K2SO4). The distilled water was used as blank reference material, and the blank sample was incorporated during each run. We use the acronym TN for total Kjeldahl nitrogen.
The total carbon content of the soil was measured according to Walkley [26] method. In this procedure, digestion was done by moderate heating of the sample with concentrated sulfuric acid (H2SO4) and adding a salt such as potassium dichromate (K2Cr2O7). The distilled and deionized water was used as blank reference material, and the blank sample was incorporated during each run. Available K was extracted by Morgan’s solution, and K in the extract was measured by a flame photometer [28]. Cation exchange capacity (CEC) was determined at pH equal to 7 using ammonium acetate [29].
Field capacity and permanent wilting point were determined in the laboratory using a pressure-plate apparatus by applying 33 kPa pressure to a saturated soil sample for field capacity and applying 1500 kPa pressure to determine the permanent wilting point. The soil moisture was determined gravimetrically [30].

2.4. Data Analysis

The treatment means were compared using built-in statistical software for Excel using a paired t-test analysis to compare the effects of different soil management (CA and CT) on initial and final soil physical and chemical characteristics. The normality test showed that the data had a normal distribution. To test whether the organic matter, total N, and available P increased over the experimental period, linear regression in Excel was employed to find the trend line. Since the differences between CA and CT were not significant, we pooled the data of the two treatments. The data displayed in the tables and figures are the mean values of the ten replicates. A probability greater than 0.05 (P > 0.05) was considered not statistically significant.

3. Results

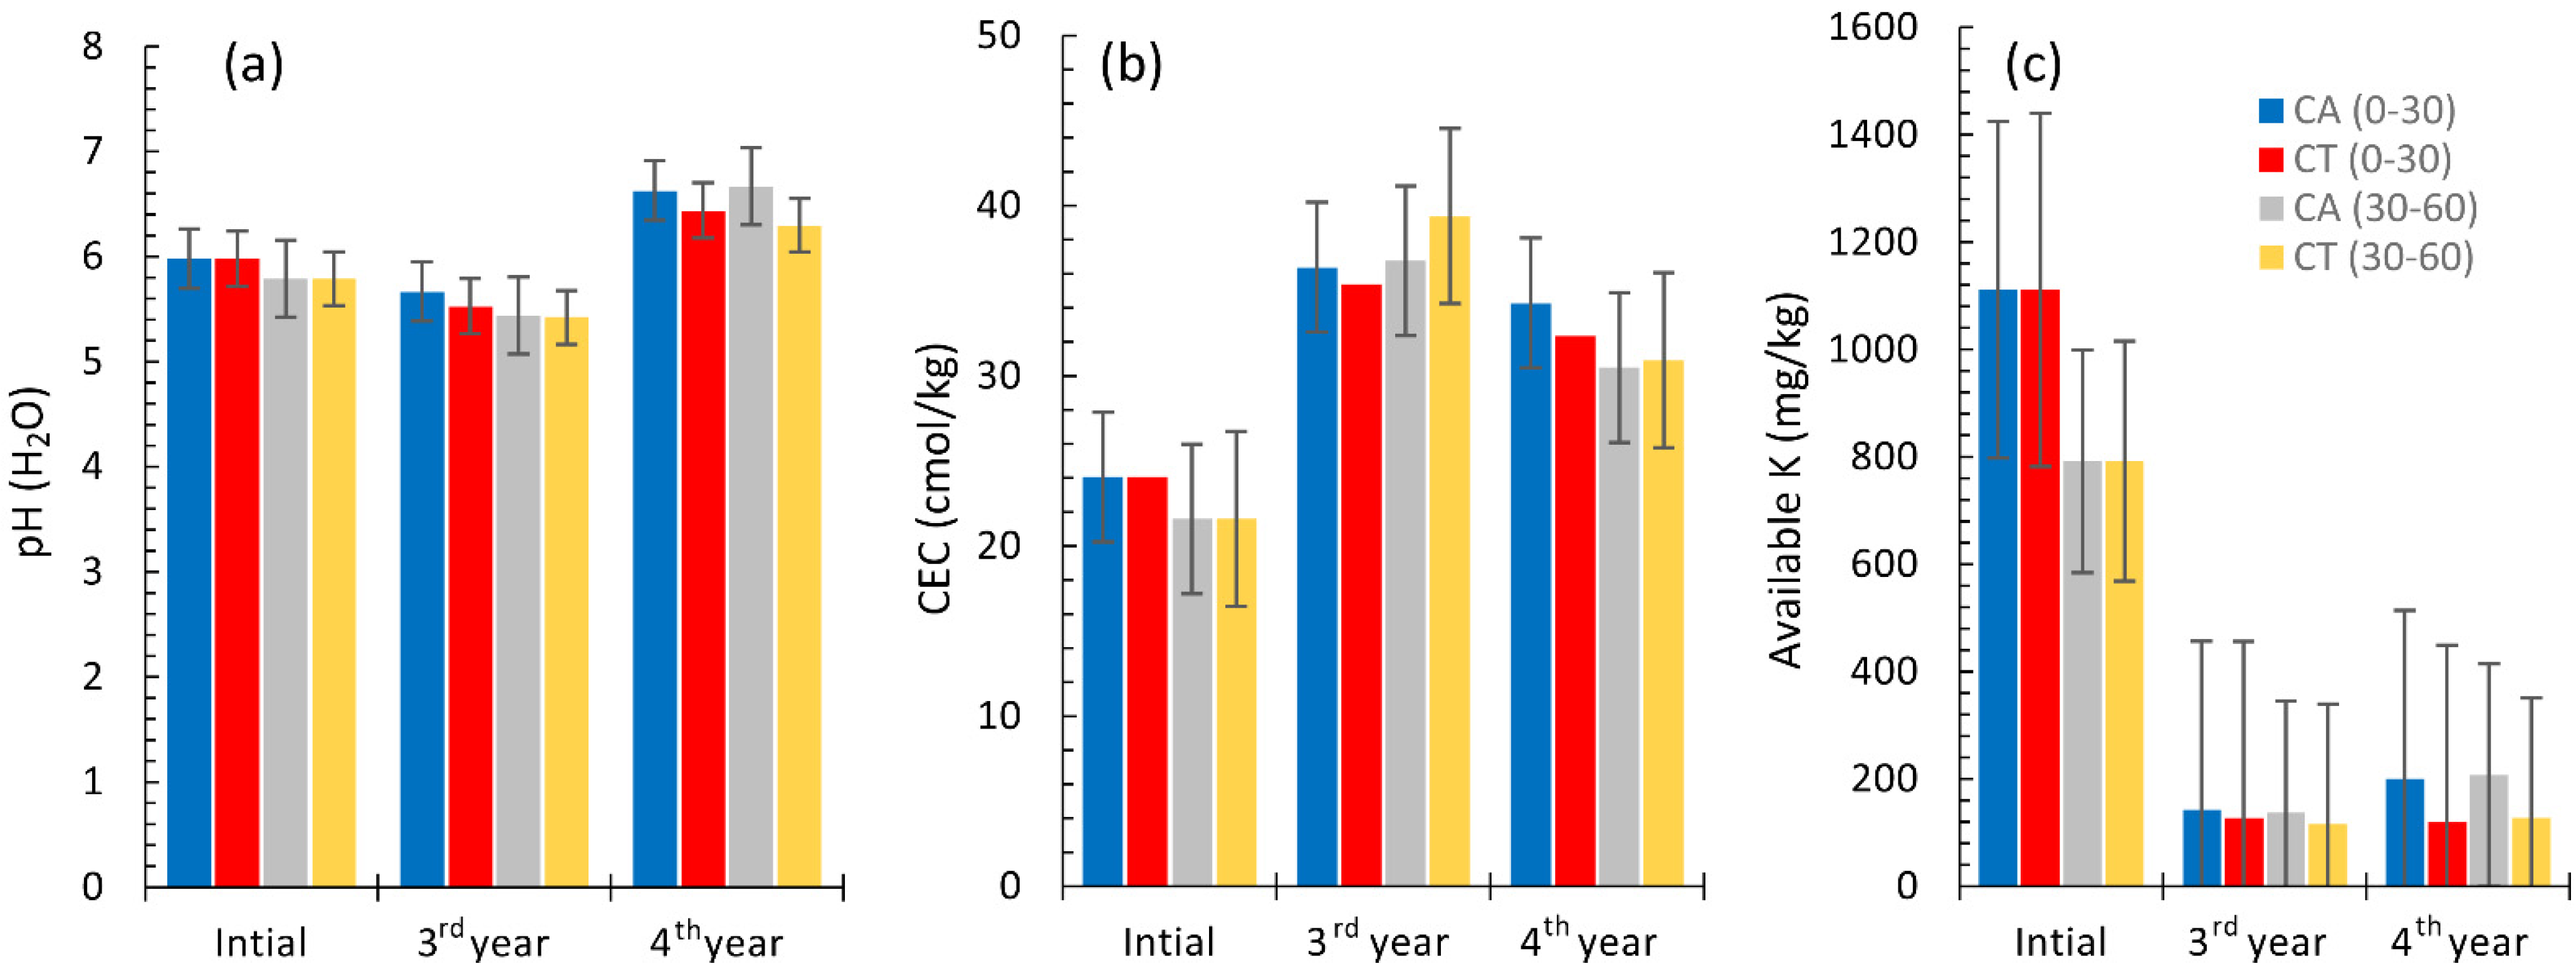
3.1. Initial Soil Characteristics

The texture of the top 30 cm was a loam soil (39% sand, 27% silt, and 35% clay), and texture variability was not significant across experimental plots. The 30–60 cm soil layer texture was mostly a clay loam (22% sand, 25% silt, and 54% clay). In a few plots, it was a sandy loam. The soil was slightly acidic with a pH of approximately 6. The top 30 cm layer had a field capacity of 0.31 cm3 cm−3, permanent wilting point of 0.22 cm3 cm−3, bulk density of 1.25 g cm−3, total nitrogen (TN) of 0.17%, available phosphorus (P) of 21 mg kg−1, and potassium (K) of 1114 mg kg−1. Additional details are given in Table 3.

3.2. Effects of CA on Soil Characteristics after Three and Four Years

For both CA and CT, the increases in pH and CEC from the first to the fourth year were not significant (Figure 4a,b). With time, the decrease in available K was significant because K fertilizers were not used, and the initial concentrations were high (Figure 4c). Differences were not significant between CA and CT plots for pH, CEC, and available K for the two soil depths (Figure 4).

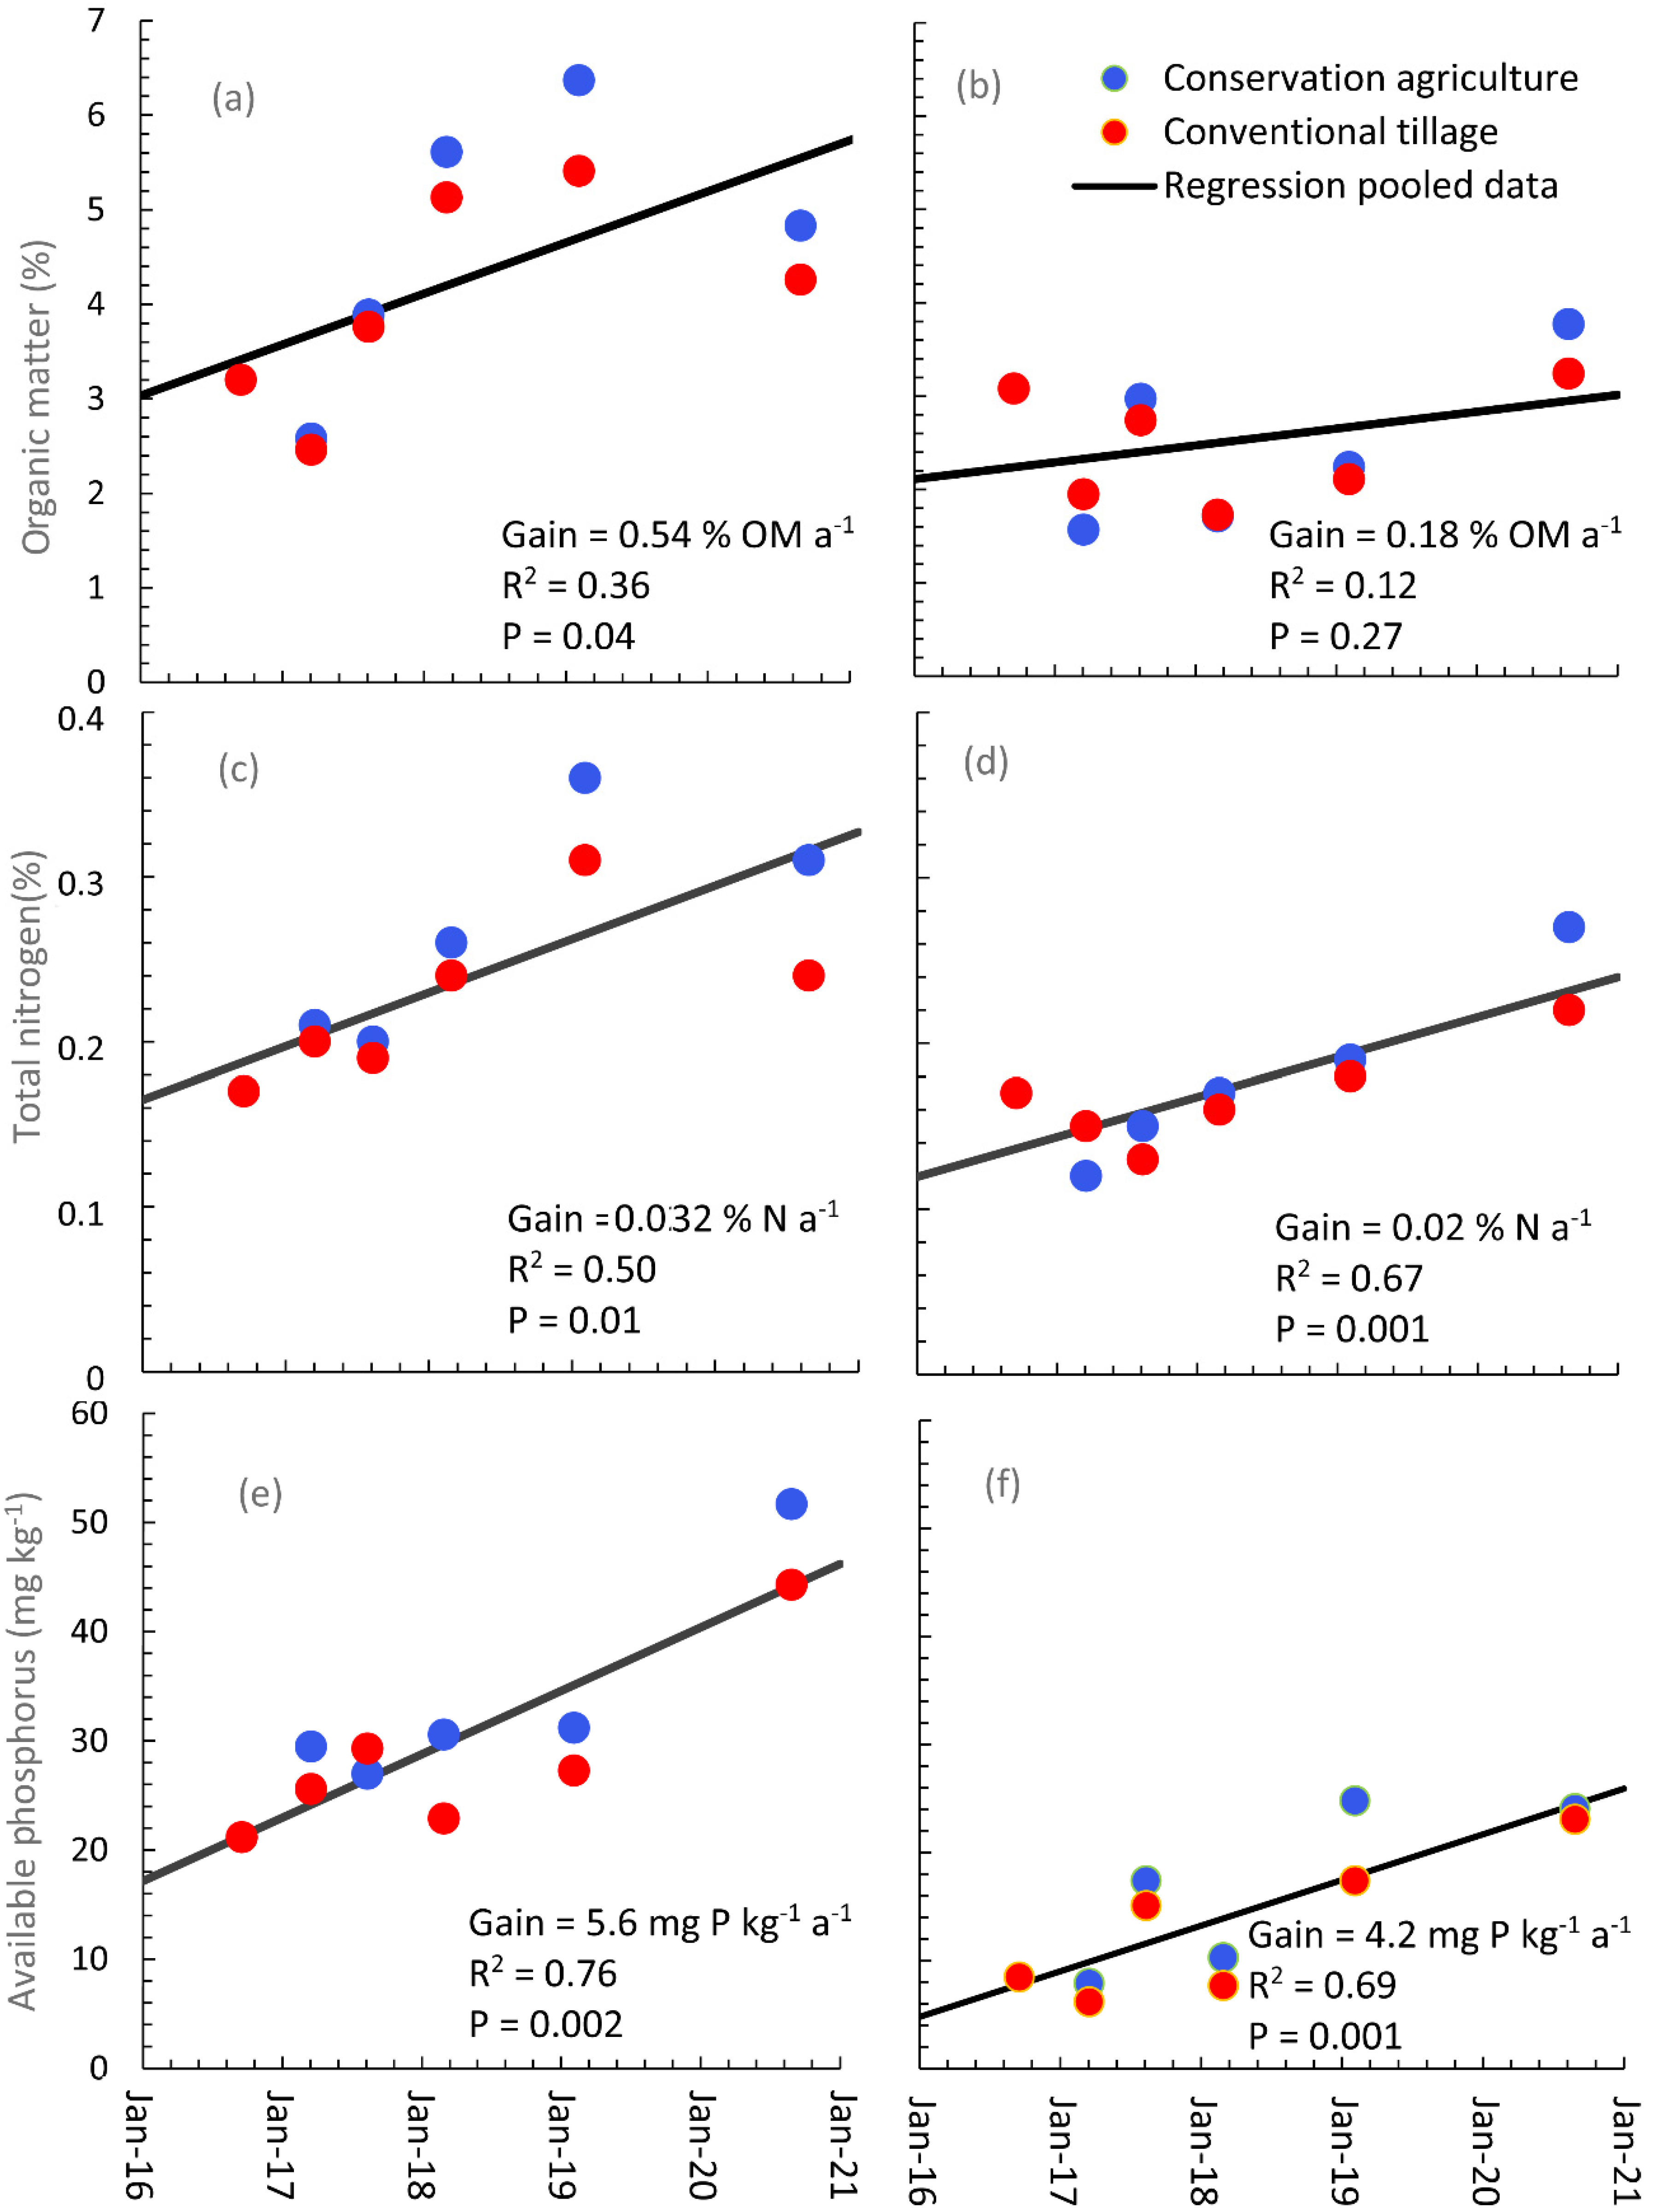
3.2.1. Organic Matter (OM)

After four years, the average OM concentration in ten plots in the topsoil (0 to 30 cm depth) was increased in the CA treatment from the initial 3.2% to 4.8% and in CT to 4.3% (Table 4). In the subsoil (30 to 60 cm depth), the OM increase was small compared to the topsoil. It increased from the initial concentration of 3.1% to the final concentration of 3.8% in CA and to 3.2% in CT (Table 4). The half-percent increase in OM per year in the topsoil was significant when the data were pooled for the CA and CT treatments (Figure 5a). However, the R2 was only 36%. Bryhn and Dimberg [31] posed that the trend is statistically meaningful when R2 > 0.65 and P < 0.05 although the authors [31] note that the proportions might vary by discipline. Thus, the upward trend for organic matter was likely not meaningful. At the 30 to 60 cm depth, the slight increase in organic matter was not significant at a probability of P = 0.27 (Figure 5b).

3.2.2. Total Soil Nitrogen (TN)

For the four-year experimental period, the average TN concentration in the top 30 cm soil for CA was 0.26% and for CT 0.23%, which was greater than the initial concentration of 0.17% in both CA and CT (Table 4). Despite the scatter in the data, the trend for the pooled date was significant, with an average increase of 0.032% N a−1 (Figure 5c). In the subsoil from 30–60 cm, the increase in total N was 0.02% N a−1.

3.2.3. Available Phosphorus (P)

Soil-available P under CA and CT treatments over the two soil depths more than doubled after four years from 21 to 52 mg kg−1 in CA and to 44 mg kg−1 in CT for the 0 to 30 cm depth, and from 8.5 to 24 mg kg−1 in CA and to 23 mg kg−1 in CT for the 30 to 60 cm depth (Table 4, Figure 5). Even though available P in the subsoil increased over time, the concentration of available P in the subsoil was much lower than in the topsoil. The slope of the trend line for the increase in available P was meaningful for CA and CT in both soil layers. (Figure 5e,f).
The soil organic matter, TN, and available P varied systematically between wet and dry phases (Table 4). The concentrations were relatively greater in the dry phase when the temperatures were generally greater. Possible reasons could be the rate of decomposition of roots [11,32]. Moreover, soil erosion by surface runoff and leachate on the plots during the rain phase influences soil organic matter and nutrients [13].

4. Discussion

We performed a four-year experiment with three vegetable crops under conservation agriculture, CA, and conventional tillage, CT. The OM, TN, and available P contents in the root zone increased for CA (Figure 5) with the addition of approximately 27 Mg ha−1 from hay (85% of that is organic matter), 8 Mg ha−1 in cow manure, and 9 Mg ha−1 pepper residue (Table 1 and Table 3 and Figure 5). The OM, TN, and available P increased in CT but were less because the hay was not applied and the soil was tilled, causing loss of organic matter [13]. The soil fertility increase in CT is interesting because more fertilizer was applied than in traditional agriculture, where tillage reduces the amount of organic matter in the soil [33,34]. In addition, the fields were irrigated, making it possible to grow two crops per year. Although the fertilizer and irrigation will not increase organic matter, they will increase the amount of crop residue. This increased crop residue, together with the manure, was responsible for the increase in the CT. Traditionally, farmers use the crop residue for feeding their livestock and not as soil mulch. Thus, CA might be feasible for vegetable production. Still, as long as livestock remains one of the main sources of cash for the farmer, it is unlikely that crop residues on a large-scale basis will be incorporated.
Soil nutrient analysis results in Table 3 indicated that the change over the four years in OM in the soil under CA was 58 Mg ha−1 and 40 Mg ha−1 for CT. The OM added in CA and listed in Table 2 (including the pepper residue) was 44 Mg ha−1. The difference in soil OM between added and that in the soil could be partly due to the residues from onion, garlic, and weeds that were not included in the calculations of the added OM. In addition, differences in sampling the soil with strong contrast in the organic matter might have caused seasonal variability. Soil loss during the intense monsoon storms could also have lowered the concentration at the end of the rain phase [35].
The annual rates of increase in OM and total N with CA in our experiments (Figure 5, Table 4) were greater than those of experiments conducted in temperate regions such as in Poland [34] and the USA [35] but are in the same order with other experiments in tropical monsoon regions where two crops per year are grown with supplemental irrigation such as in Ethiopia [3,20,21], Nigeria [36], and Brazil [37,38]. However, the OM increase in our experiment was less than the OM increase in the Mediterranean region of Spain using organic farming and avoiding pesticide application [39].

Bottlenecks to the Implementation of Conservation Agriculture

One of the many bottlenecks in the widespread implementation of CA is producing sufficient organic mulch to cover the soil [2]. Unlike many other locations in the world, the subhumid and humid highlands, including Ethiopia, can grow some of the grasses needed in the valley bottoms that are too wet during the rain phase (June to September) to grow crops and vegetables [40,41,42,43,44,45,46]. The valley bottoms are traditionally used for communal grazing. Recent studies have shown that by planting special grasses and excluding livestock from these areas, gully initiation (common in the valley bottoms), which causes soil erosion, can be stopped, and grass production can be greatly increased [42,43,44]. The yield of grass in these so-called exclosures exceeds what is needed for feeding livestock, which otherwise would have used the land for grazing. The additional plant growth and biomass yield could, among others, be used for mulch. In addition to being in situ, the cut and carry system can employ youth and women [47,48]. Overall, this can be a win, win solution [49]. However, despite the promise of the exclosures and other soil- and water-conservation practices, few successful examples exist because of socioeconomic conditions and lack of efficient communication of added value and clearly defined responsibilities between farmers, benefit-sharing arrangements, and other associated social factors. These need to be understood and resolved before implementing more exclosures [47,49,50].
Reducing livestock pressure would be another way to increase the availability of organic matter for mulching [51], although this may be challenging due to the importance of livestock systems for resilience and nutrition. A few alternatives, such as the current practice of growing eucalyptus (Eucalyptus globus) trees, might help reduce livestock pressure as they serve as a cash source [52,53]. In addition, using eucalyptus wood for cooking can help the organic matter supply by replacing the burning of dung and plant residue as fuel [2,52,53]. However, growing such trees can put pressure on groundwater resources that can impact grain crop production systems in the region [54].
Intercropping practices should also be considered for additional organic matter. Although intercropping decreases the yield of the main crop in some areas, overall system yield and other associated benefits of diversity, nutrition, breaking pests, diseases, and weeds are noteworthy. Intercropping of pigeon pea (Cajanus cajan) in maize has minimally decreased maize yield [2]. In the Ethiopian Highlands, maize interplanted with beans (Phaseolus sp.) increased yields over solo maize [55,56]. Jaleta [56] found that plots with maize–legume intercropping/rotation had the highest average maize yield. In addition, Fenta [23] showed that the benefits of maize production intercropping pigeon pea for the mixed-crop livestock smallholder systems.
Consequently, promising intercropping practices can boost mulch availability, especially in years with high rainfall [2]. However, competition with livestock for the intercropped forage must be evaluated and considered. Therefore, intercropping for mulch for conservation tillage likely will be challenging when livestock pressure is high.
Overall obtaining the organic matter for CA might be feasible in the humid and subhumid Ethiopian Highlands when the right socioeconomic factors exist and farmers are involved in the decision to include this practice in the watershed plan [4,51,56]. For example, the implementation of CA for growing vegetables for the local markets by instituting enclosures with high-yielding grasses in the valley bottom might be successful in the watershed with access to the market in close-by large towns. Although more socioeconomic research is needed, this could be the case where growing vegetables could be more profitable.

5. Conclusions

Agriculture in sub-Saharan Africa, particularly in the Ethiopian Highlands, has been hampered by the loss of soil fertility and failure to replenish critical nutrients leading to severe soil degradation. To find a way to ameliorate the degraded soils, a four-year experiment was conducted on ten farms growing vegetables with conventional tillage (CT) and conservation agriculture (CA). Both practices increased soil organic matter and nutrients over time. The average soil organic matter (OM) in the top 30 cm of the CA and CT fields gained 0.5% per year. Although the increase in OM was slightly greater in CA than CT, it was not significant.
Similarly, the total N (TN) increase for CA and CT mirrored the organic matter. The available P doubled over the four years and showed a statistically significant increment for CA and CT treatment. Finally, soil pH, available K, and CEC increased under CA compared with the CT treatment. The rate of OM, TN, and P increase was greater in this study than in most studies elsewhere conducted without manure application. Irrigation allowed growing of two crops per year, increasing the biomass returned to the soil above trials with one crop per year.
Our findings and other studies have proven that CA in vegetable production systems may aid in greater food security by improving soil organic matter and soil nutrient content. Although CA practices have many benefits agronomically, socioeconomic research efforts are lacking and are needed to identify potential barriers to adoption and to create enabling environments. Therefore, widespread implementation is not expected until socioeconomic issues have been identified and resolved. In the meantime, conventional vegetable production that includes the application of fertilizer, manure, and limited plant residue incorporated in the soil could be used for soil improvement.

Author Contributions

Conceptualization, S.A.B., T.S.S., M.R.R. and S.A.T.; data collection, S.A.B.; formal analysis, S.A.B. and T.T.A.; funding acquisition, A.W.W., M.R.R. and P.V.V.P.; methodology, S.A.B., T.T.A., P.S. and S.A.T.; project administration, S.A.T.; supervision, T.S.S., P.S., M.R.R. and S.A.T.; Writing—original draft, S.A.B.; Writing—review and editing, T.T.A., A.W.W., T.S.S., P.S., P.V.V.P. and S.A.T. All authors have read and agreed to the published version of the manuscript.

Funding

This research was funded by the American people through support from the United States Agency for International Development’s (USAID) Feed the Future Innovation Lab for Collaborative Research on Sustainable Intensification (Cooperative Agreement No. AID-OAA-L-14-00006, Kansas State University) through Texas A&M University’s Sustainably Intensified Production Systems and Nutritional Outcomes, and University of Illinois Urbana-Champaign’s Appropriate Scale Mechanization Consortium projects. The research was also co-funded by Land and Water Solutions for Sustainable Intensification (LWS) of the CGIAR Research Program on Water, Land and Ecosystems (WLE) and supported by Funders contributing to the CGIAR Trust Fund (https://www.cgiar.org/funders/). The contents are the authors’ sole responsibility and do not necessarily reflect the views of funding agencies or related organizations.

Informed Consent Statement

Not applicable.

Data Availability Statement

The data are available on request from the first author.

Acknowledgments

The authors would like to acknowledge the Blue Nile Water Institute and Bahir Dar Institute of Technology for sponsoring the project. The contribution number is 21-086-J from the Kansas Agricultural Experiment Station.

Conflicts of Interest

The authors declare that they do not have a conflict of interest.

References

  1. Keesstra, S.; Mol, G.; de Leeuw, J.; Okx, J.; de Cleen, M.; Visser, S. Soil-related sustainable development goals: Four concepts to make land degradation neutrality and restoration work. Land 2018, 7, 133. [Google Scholar] [CrossRef] [Green Version]
  2. Giller, K.E.; Witter, E.; Corbeels, M.; Tittonell, P. Conservation agriculture and smallholder farming in Africa: The heretics’ view. Field Crops Res. 2009, 114, 23–34. [Google Scholar] [CrossRef]
  3. Assefa, T.; Jha, M.; Reyes, M.; Worqlul, A.; Doro, L.; Tilahun, S. Conservation agriculture with drip irrigation: Effects on soil quality and crop yield in sub-Saharan Africa. J. Soil Water Conserv. 2020, 75, 209–217. [Google Scholar] [CrossRef]
  4. Araya, T.; Cornelis, W.; Nyssen, J.; Govaerts, B.; Bauer, H.; Gebreegziabher, T.; Oicha, T.; Raes, D.; Sayre, K.D.; Haile, M. Effects of conservation agriculture on runoff, soil loss and crop yield under rainfed conditions in Tigray, Northern Ethiopia. Soil Use Manag. 2011, 27, 404–414. [Google Scholar] [CrossRef]
  5. Bationo, A.; Kihara, J.; Vanlauwe, B.; Waswa, B.; Kimetu, J. Soil organic carbon dynamics, functions and management in West African agro-ecosystems. Agric. Syst. 2007, 94, 13–25. [Google Scholar] [CrossRef] [Green Version]
  6. Tebebu, T.Y.; Bayabil, H.K.; Stoof, C.R.; Giri, S.K.; Gessess, A.A.; Tilahun, S.A.; Steenhuis, T.S. Characterization of degraded soils in the humid Ethiopian Highlands. Land Degrad. Dev. 2016, 28, 1891–1901. [Google Scholar] [CrossRef] [Green Version]
  7. Nyssen, J.; Vandenreyken, H.; Poesen, J.; Moeyersons, J.; Deckers, J.; Haile, M.; Salles, C.; Govers, G. Rainfall erosivity and variability in the Northern Ethiopian Highlands. J. Hydrol. 2005, 311, 172–187. [Google Scholar] [CrossRef]
  8. Berakhi, O.; Brancaccio, L.; Calderoni, G.; Coltorti, M.; Dramis, F.; Umer, M.M. The Mai Maikden sedimentary sequence: A reference point for the environmental evolution of the Highlands of Northern Ethiopia. Geomorphology 1998, 23, 127–138. [Google Scholar] [CrossRef]
  9. Gebre-Selassie, A.; Bekele, T. A Review of Ethiopian Agriculture: Roles, Policy and small-Scale Farming Systems; Oxfam International: Oxford, UK, 2012; pp. 36–65. [Google Scholar]
  10. Solomon, D.; Fritzsche, F.; Lehmann, J.; Tekalign, M.; Zech, W. Soil organic matter dynamics in the subhumid agroecosystems of the Ethiopian Highlands: Evidence from natural 13C abundance and particle-size fractionation. Soil Sci. Soc. Am. J. 2002, 66, 969–978. [Google Scholar] [CrossRef] [Green Version]
  11. Richardson, A.E.; Simpson, R. Soil microorganisms mediating phosphorus availability update on microbial phosphorus. Plant Physiol. 2011, 156, 989–996. [Google Scholar] [CrossRef] [Green Version]
  12. Limon-Ortega, A.; Sayre, K.D.; Francis, C.A. Wheat nitrogen use efficiency in a bed planting system in Northwest Mexico. Agron. J. 2000, 92, 303–308. [Google Scholar] [CrossRef]
  13. Belay, S.A.; Assefa, T.T.; Prasad, P.; Schmitter, P.; Worqlul, A.W.; Steenhuis, T.S.; Reyes, M.R.; Tilahun, S.A. The Response of Water and Nutrient Dynamics and of Crop Yield to Conservation Agriculture in the Ethiopian Highlands. Sustainability 2020, 12, 5989. [Google Scholar] [CrossRef]
  14. Nyborg, M.; Solberg, E.; Izaurralde, R.; Malhi, S.; Molina-Ayala, M. Influence of long-term tillage, straw and N fertilizer on barley yield, plant-N uptake and soil-N balance. Soil Tillage Res. 1995, 36, 165–174. [Google Scholar] [CrossRef]
  15. Giller, K.E.; Corbeels, M.; Nyamangara, J.; Triomphe, B.; Affholder, F.; Scopel, E.; Tittonell, P. A research agenda to explore the role of conservation agriculture in African smallholder farming systems. Field Crops Res. 2011, 124, 468–472. [Google Scholar] [CrossRef] [Green Version]
  16. Lanckriet, S.; Araya, T.; Cornelis, W.; Verfaillie, E.; Poesen, J.; Govaerts, B.; Bauer, H.; Deckers, J.; Haile, M.; Nyssen, J. Impact of conservation agriculture on catchment runoff and soil loss under changing climate conditions in May Zeg-zeg (Ethiopia). J. Hydrol. 2012, 475, 336–349. [Google Scholar] [CrossRef] [Green Version]
  17. Vanlauwe, B.; Wendt, J.; Giller, K.E.; Corbeels, M.; Gerard, B.; Nolte, C. A fourth principle is required to define conservation agriculture in sub-Saharan Africa: The appropriate use of fertilizer to enhance crop productivity. Field Crops Res. 2014, 155, 10–13. [Google Scholar] [CrossRef]
  18. Erenstein, O. Smallholder conservation farming in the tropics and sub-tropics: A guide to the development and dissemination of mulching with crop residues and cover crops. Agric. Ecosyst. Environ. 2003, 100, 17–37. [Google Scholar] [CrossRef]
  19. Belay, S.A.; Schmitter, P.; Worqlul, A.W.; Steenhuis, T.S.; Reyes, M.R.; Tilahun, S.A. Conservation Agriculture Saves Irrigation Water in the Dry Monsoon Phase in the Ethiopian Highlands. Water 2019, 11, 2103. [Google Scholar] [CrossRef] [Green Version]
  20. Assefa, T.; Jha, M.; Reyes, M.; Tilahun, S.; Worqlul, A.W. Experimental Evaluation of Conservation Agriculture with Drip Irrigation for Water Productivity in Sub-Saharan Africa. Water 2019, 11, 530. [Google Scholar] [CrossRef] [Green Version]
  21. Yimam, A.Y.; Assefa, T.T.; Adane, N.F.; Tilahun, S.A.; Jha, M.K.; Reyes, M.R. Experimental Evaluation for the Impacts of Conservation Agriculture with Drip Irrigation on Crop Coefficient and Soil Properties in the Sub-Humid Ethiopian Highlands. Water 2020, 12, 947. [Google Scholar] [CrossRef] [Green Version]
  22. Abidela, H.M.; Muche, H.; Schmitter, P.; Nakawuka, P.; Tilahun, S.A.; Langan, S.; Barron, J.; Steenhuis, T.S. Deep tillage improves degraded soils in the (sub) humid Ethiopian Highlands. Land 2019, 8, 159. [Google Scholar] [CrossRef] [Green Version]
  23. Fenta, H.M.; Hussein, M.A.; Tilahun, S.A.; Nakawuka, P.; Steenhuis, T.S.; Barron, J.; Adie, A.; Blummel, M.; Schmitter, P. Berken plow and intercropping with pigeon pea ameliorate degraded soils with a hardpan in the Ethiopian Highlands. Geoderma 2022, 407, 115523. [Google Scholar] [CrossRef]
  24. Juo, A. Selected Methods for Soil and Plant Analysis, 2nd ed.; International Institute of Tropical Agriculture: Ibadan, Nigeria, 1978. [Google Scholar]
  25. Sertsu, S.; Bekele, T. Procedures for Soil and Plant Analysis; National Soil Research Organization: Technical Paper No. 74; Ethiopian Agricultural Research Organization: Addis Ababa, Ethiopia, 2000; p. 110. [Google Scholar]
  26. Walkley, A.; Black, I.A. An examination of the Degtjareff method for determining soil organic matter, and a proposed modification of the chromic acid titration method. Soil Sci. 1934, 37, 29–38. [Google Scholar] [CrossRef]
  27. Bray, R.H.; Kurtz, L. Determination of total, organic, and available forms of phosphorus in soils. Soil Sci. 1945, 59, 39–46. [Google Scholar] [CrossRef]
  28. Macdonald, G.; Peck, N.; Vittum, M.J. Relationship between ammonium acetate-acetic acid and Morgan’s solution for determining extractable P, K, Ca, and Mg in soils derived from calcareous glacial till. Commun. Soil Sci. Plant Anal. 1978, 9, 717–728. [Google Scholar] [CrossRef]
  29. Rengel, Z.; Robinson, D. Determination of cation exchange capacity of ryegrass roots by summing exchangeable cations. Plant Soil 1989, 116, 217–222. [Google Scholar] [CrossRef]
  30. Cassel, D.; Nielsen, D.J.; Methods, M. Field capacity and available water capacity. Phys. Mineral. Methods 1986, 5, 901–926. [Google Scholar]
  31. Bryhn, A.C.; Dimberg, P.H. An operational definition of a statistically meaningful trend. PLoS ONE 2011, 6, e19241. [Google Scholar] [CrossRef] [Green Version]
  32. Redel, Y.D.; Rubio, R.; Rouanet, J.L.; Borie, F. Phosphorus bioavailability affected by tillage and crop rotation on a Chilean volcanic derived Ultisol. Geoderma 2007, 139, 388–396. [Google Scholar] [CrossRef]
  33. Shi, P.; Schulin, R. Erosion-induced losses of carbon, nitrogen, phosphorus and heavy metals from agricultural soils of contrasting organic matter management. Sci. Total Environ. 2018, 618, 210–218. [Google Scholar] [CrossRef]
  34. Malecka, I.; Blecharczyk, A.; Sawinska, Z.; Dobrzeniecki, T. The effect of various long-term tillage systems on soil properties and spring barley yield. Turk. J. Agric. For. 2012, 36, 217–226. [Google Scholar]
  35. Poudel, D.D.; Horwath, W.R.; Mitchell, J.P.; Temple, S.R. Impacts of cropping systems on soil nitrogen storage and loss. Agric. Syst. 2001, 68, 253–268. [Google Scholar] [CrossRef]
  36. Busari, M.A.; Kukal, S.S.; Kaur, A.; Bhatt, R.; Dulazi, A.A. Conservation tillage impacts on soil, crop and the environment. Int. Soil Water Conserv. Res. 2015, 3, 119–129. [Google Scholar] [CrossRef] [Green Version]
  37. Metay, A.; Moreira, J.A.A.; Bernoux, M.; Boyer, T.; Douzet, J.M.; Feigl, B.; Feller, C.; Maraux, F.; Oliver, R.; Scopel, E. Storage and forms of organic carbon in a no-tillage under cover crops system on clayey Oxisol in dryland rice production (Cerrados, Brazil). Soil Tillage Res. 2007, 94, 122–132. [Google Scholar] [CrossRef]
  38. Sisti, C.P.; dos Santos, H.P.; Kohhann, R.; Alves, B.J.; Urquiaga, S.; Boddey, R.M. Change in carbon and nitrogen stocks in soil under 13 years of conventional or zero tillage in southern Brazil. Soil Tillage Res. 2004, 76, 39–58. [Google Scholar] [CrossRef]
  39. Novara, A.; Pulido, M.; Rodrigo-Comino, J.; Di Prima, S.; Smith, P.; Gristina, L.; Keesstra, S. Long-term organic farming on a citrus plantation results in soil organic matter recovery. Cuad. Investig. Geogr. 2019, 45, 271–286. [Google Scholar] [CrossRef] [Green Version]
  40. Amare, S.; Keesstra, S.; van der Ploeg, M.; Langendoen, E.; Steenhuis, T.S.; Tilahun, S. Causes and Controlling Factors of Valley Bottom Gullies. Land 2019, 8, 141. [Google Scholar] [CrossRef] [Green Version]
  41. Yibeltal, M.; Tsunekawa, A.; Haregeweyn, N.; Adgo, E.; Meshesha, D.T.; Masunaga, T.; Tsubo, M.; Billi, P.; Ebabu, K.; Fenta, A.A.; et al. Morphological characteristics and topographic thresholds of gullies in different agro-ecological environments. Geomorphology 2019, 341, 15–27. [Google Scholar] [CrossRef]
  42. Ayele, G.K.; Gessess, A.A.; Addisie, M.B.; Tilahun, S.A.; Tebebu, T.Y.; Tenessa, D.B.; Langendoen, E.J.; Nicholson, C.F.; Steenhuis, T.S. A Biophysical and Economic Assessment of a Community-based Rehabilitated Gully in the Ethiopian Highlands. Land Degrad. Dev. 2016, 27, 270–280. [Google Scholar] [CrossRef]
  43. Ayele, G.K.; Addisie, M.B.; Langendoen, E.J.; Tegegne, N.H.; Tilahun, S.A.; Moges, M.A.; Nicholson, C.F.; Steenhuis, T.S. Evaluating erosion control practices in an actively gullying Watershed in the highlands of Ethiopia. Earth Surf. Process. Landf. 2018, 43, 2835–2843. [Google Scholar] [CrossRef]
  44. Ayele, G.K.; Gessess, A.A.; Addisie, M.B.; Tilahun, S.A.; Tenessa, D.B.; Langendoen, E.J.; Steenhuis, T.S.; Nicholson, C.F. The economic cost of upland and gully erosion on subsistence agriculture for a watershed in the Ethiopian Highlands. Afr. J. Agric. Resour. Econ. 2015, 10, 265–278. [Google Scholar]
  45. Addisie, M.B.; Langendoen, E.J.; Aynalem, D.W.; Ayele, G.K.; Tilahun, S.A.; Schmitter, P.; Mekuria, W.; Moges, M.M.; Steenhuis, T.S. Assessment of practices for controlling shallow valley-bottom gullies in the sub-Humid Ethiopian Highlands. Water 2018, 10, 389. [Google Scholar] [CrossRef] [Green Version]
  46. Yibeltal, M.; Tsunekawa, A.; Haregeweyn, N.; Adgo, E.; Meshesha, D.T.; Masunaga, T.; Tsubo, M.; Billi, P.; Ebabu, K.; Berihun, M.L. Effect of subsurface water level on gully headcut retreat in tropical Highlands of Ethiopia. Earth Surf. Process. Landf. 2021, 46, 1209–1222. [Google Scholar] [CrossRef]
  47. Sosina, B.; Holden, S. Are Rural Youth in Ethiopia Abandoning Agriculture? World Dev. 2014, 64, 259–272. [Google Scholar] [CrossRef] [Green Version]
  48. Duguma, L.A.; Minang, P.A.; Freeman, O.E.; Hager, H. System wide impacts of fuel usage patterns in the Ethiopian Highlands: Potentials for breaking the negative reinforcing feedback cycles. Energy Sustain. Dev. 2014, 20, 77–85. [Google Scholar] [CrossRef]
  49. Rossiter, J.; Minale, M.W.; Andarge, W.; Twomlow, S. A communities Eden–grazing Exclosure success in Ethiopia. Int. J. Agric. Sustain. 2017, 15, 514–526. [Google Scholar] [CrossRef]
  50. Haregeweyn, N.; Berhe, A.; Tsunekawa, A.; Tsubo, M.; Meshesha, D.T. Integrated Watershed Management as an Effective Approach to Curb Land Degradation: A Case Study of the Enabered Watershed in Northern Ethiopia. Environ. Manag. 2021, 50, 1219–1233. [Google Scholar] [CrossRef]
  51. El-Shater, T.; Yigezu, Y.A. Can Retention of Crop Residues on the Field Be Justified on Socioeconomic Grounds? A Case Study from the Mixed Crop-Livestock Production Systems of the Moroccan Drylands. Agronomy 2021, 11, 1465. [Google Scholar] [CrossRef]
  52. Nigussie, Z.; Tsunekawa, A.; Haregeweyn, N.; Tsubo, M.; Adgo, E.; Ayalew, Z.; Abele, S. Small-Scale Woodlot Growers’ Interest in Participating in Bioenergy Market in Rural Ethiopia. Environ. Manag. 2021, 68, 553–565. [Google Scholar] [CrossRef]
  53. Enku, T.; Melesse, A.M.; Ayana, E.K.; Tilahun, S.A.; Abate, M.; Steenhuis, T.S. Groundwater use of a small Eucalyptus patch during the dry monsoon phase. Biologia 2020, 75, 853–864. [Google Scholar] [CrossRef]
  54. Alemayehu, A.; Tamado, T.; Nigussie, D.; Yigzaw, D.; Kinde, T.; Wortmann, C. Maize–common bean intercropping to optimize maize-based crop production. J. Agric. Sci. 2017, 155, 1124–1136. [Google Scholar] [CrossRef]
  55. Jaleta, M.; Marenya, P.; Beshir, B.; Erenstein, O. Does crop diversification reduce downside risk of external maize yield-enhancing technology? Evidence from Ethiopia. Afr. J. Agric. Resour. Econ. 2020, 15, 95–110. [Google Scholar] [CrossRef]
  56. Preissel, S.; Reckling, M.; Schläfke, N.; Zander, P. Magnitude and farm-economic value of grain legume pre-crop benefits in Europe: A review. Field Crops Res. 2015, 175, 64–79. [Google Scholar] [CrossRef] [Green Version]
Figure 1. Location map of the study area. (a) Ethiopia, (b) Biranti watershed, and (c) Dengeshita experimental sites depicting the experimental plots.
Water 14 00476 g001
Figure 2. Experimental design layout for conservation agriculture (CA) and conventional tillage (CT) and irrigation water access (Note: larger water storage constructed after February 2018 for drip, and it was overhead irrigation accessing water from the well).
Water 14 00476 g002
Figure 3. Composite soil sampling at two soil layers (0–30 cm and 30–60 cm) from both the conservation agriculture and conventional tillage plots;(a) initial soil sampling before the plots were established (b), soil sampling from CA and CT after the plots were established, (c) pictures of soil sampling.
Water 14 00476 g003
Figure 4. Average soil properties of the initial baseline and the third and fourth years of ten farms for the 0–30 cm and 30–60 cm depth under CA and CT for (a) soil pH, (b) cation exchange capacity (CEC), and (c) available K; error bars indicate one standard deviation (n = 10).
Water 14 00476 g004
Figure 5. Average concentration for ten plots of organic matter, total nitrogen, and available phosphorus at two soil depths during a four-year experiment with vegetables grown under conservation agricultural (blue symbols) and conventional tillage practices (red symbols) starting from 2016. Organic matter: (a) 0 to 30 cm soil depth, (b) 30 to 60 cm soil depth; total nitrogen (c) 0 to 30 cm soil depth, and (d) 30 to 60 cm soil depth. Available phosphorus in (e) 0 to 30 cm soil depth and (f) 30 to 60 cm soil depth under CA and CT. The trend line (black) shows the pooled CA and CT concentrations are significant when the probability p < 0.05. In addition, the R2 > 0.65 shows that the trend is meaningful [31]. The slope of the trendline is the "gain" and expresses the increase in concentration per year.
Water 14 00476 g005
Table 1. Timeline of crops grown, on-farm activities, and soil sampling and weights of mulch fertilizer and manure applied for conservation (CA) and conventionally tilled vegetable fields from 2016 to 2020. Mulch was only applied to the CA fields.
Crop *
(Year)
TillageTransplantingFertilizer ApplicationMulch ApplicationHarvestingSoil SamplingManure Application
Onion (2016/2017)Date9/25/2016–3/30/201612/20/201612/25/201601/05/20173/22/20183/25/20173/25/2017
Amount
(kg ha−1)
--2004000--5000
Pepper
(2017)
Date2/20/2017–4/25/201705/01/2017-05/01/20177/10/2017–8/10/201708/10/2017
Amount (kg ha−1)-- 4000--
Garlic
(2017/2018)
Date10/18/201710/27/201710/27/201715/27/20172/26/20182/26/20182/27/2018
Amount (kg ha−1)--2004000--5000
Pepper
(2018)
Date2/15/20183/13/201803/12/201807/05/20186/1/2018–8/25/20188/25/2018
Amount (kg ha−1)--1004000--
Onion
(2018/2019)
Date10/15/201810/27/201810/27/201811/05/201802/02/201902/02/201902/05/2019
Amount (kg ha−1)--2004000--5000
Pepper
(2019)
Date2/15/20193/02/20193/02/20197/15/20196/20/2019--
Amount (kg ha−1)--2004000--5000
Onion
(2019/2020)
Date02/15/201903/11/201903/11/201907/15/20196/20/2019--
Amount (kg ha−1)--2004000--5000
Pepper
(2020)
Date2/15-25/20203/25/20206/30/2004/05/20206/15/2020–8/25/20208/25/2020-
Amount (kg ha−1)--1004000--
* The crop varieties were Adama red onion (Allium cepa L.), local-variety garlic (Allium Sativium L.), and local-variety Mareko pepper (Capsicum annuum L.).
Table 2. Irrigation water applied in mm per growing period and average yield in Mg/ha of vegetable crops grown on ten conventional tilled (CT) plots and ten conservation agriculture (CA) plots from 2016 to 2010 [13,19].
VegetableYear
(Dry Irrigated or Rainfed)
Irrigation Water Added (mm /Growing Season)Vegetable Fresh Yield (Mg ha−1)
CACTCA CT
Onion2016/2017 (dry)52052024.317.9
Pepper2017 (wet)50505.15.5
Garlic2017/2018 (dry)2603095.33.8
Pepper2018 (wet)36747511.79.1
Onion2018/2019 (dry)40847910.28.5
Pepper20192552886.35.9
Pepper2020 (wet)28935512.39.8
Table 3. Soil characteristics (mean ± standard deviation) at the beginning of the experiment (samples collected on 11 November 2016) for two soil depths (0 to 30 cm and 30 to 60 cm).
Soil CharacteristicsSoil DepthSoil Depth
0–30 cm30–60 cm
Bulk density (g cc−1)1.14 ± 0.101.22 ± 0.13
pH (H2O, 1:2.5)6.0 ± 0.645.8 ± 0.63
Electrical conductivity (EC) (dS m−1)1.13 ± 0.120.09 ± 0.05
Cation exchange capacity (CEC) (meq kg−1)24.0 ± 4.025.3 ± 4.5
Available potassium (g kg−1)1.11 ± 0.570.79 ± 0.54
Available phosphorus (mg kg−1)21.2 ± 12.38.5 ± 4.8
Total nitrogen (%)0.17 ± 0.050.17 ± 0.06
Organic matter (%)3.18 ± 0.913.08 ± 1.06
Organic carbon (%)1.84 ± 0.531.79 ± 0.62
Field capacity (%)31.4 ± 3.928.8 ± 2.8
Permanent wilting point (%)22.2 ± 3.621.6 ± 1.93
Bulk density (g cm−3)1.25 ± 0.81.32 ± 1.1
Sand (%)39 ± 1722 ± 10
Silt (%)27 ± 525 ± 4
Clay (%)35 ± 1754 ± 14
Table 4. Organic matter content (OM), total nitrogen concentration (TN), and available phosphorus (P) in the topsoil (0 to 30 cm) and subsoil (30 to 60 cm) under conservation agriculture (CA) and conventional tillage (CT) treatments for the four-year on-farm experiment in the sub-humid Ethiopian Highlands.
VegetableYear
(Phase)
0–30 cm30–60 cm
CACTCACT
Organic Matter Content (%)
2016 (initial)3.2 ± 0.93.2 ± 0.93.1 ± 1.13.1 ± 1.1
Pepper2017 (wet)2.6 ± 0.82.5 ± 0.7 1.6 ± 0.31.9 ± 0.6
Garlic2017/2018 (dry)3.9 ± 1.3 3.8 ± 1.0 3.0 ± 1.12.7 ± 0.5
Pepper2018 (wet)5.6 ± 3.0 5.1 ± 0.9 1.7±0.61.7 ± 0.6
Onion2018/2019 (dry)6.4 ± 2.93 5.4± 3.02.2 ± 1.82.1 ± 0.9
Pepper2020 (wet)4.8 ± 0.09 4.3 ± 0.63.8± 0.83.2 ± 0.7
Mean 4.4 ± 1.2 4.0 ± 1.212.7 ± 0.90 2.5 ± 0.99
Four-year change (%) *5033225
Total Nitrogen (%)
2016 (initial)0.17 ± 0.050.17 ± 0.050.17 ± 0.060.17 ± 0.06
Pepper2017 (wet)0.21 ± 0.060.20 ± 0.050.12 ± 0.03 0.15 ± 0.04
Garlic2017/2018 (dry)0.20 ± 0.060.19 ± 0.050.15 ± 0.05 0.13 ± 0.02
Pepper2018 (wet)0.26 ± 0.100.24 ± 0.14 0.17 ±0.03 0.16 ± 0.05
Onion2018/2019 (dry)0.36 ± 0.16 0.31 ± 0.140.19 ± 0.07 0.18 ± 0.08
Pepper2020 (wet)0.31 ± 0.03 0.24 ± 0.06 0.27 ± 0.04 0.22 ± 0.04
Mean0.26 ± 0.080.23 ± 0.080.18 ± 0.05 0.17 ± 0.06
Four-year change (%) *82415929
Available Phosphorus (mg kg−1)
2016 (initial)21 ± 1221 ± 128.5 ± 4.7 8.5 ± 4.7
Pepper2017 (wet)29 ± 3826 ± 26 7.9 ± 10 6.2 ± 3.9
Garlic2017/2018 (dry)27 ± 17 29 ± 1817 ± 16 15 ± 11
Pepper2018 (wet)31 ± 3123 ± 2110 ± 107.7 ± 5
Onion2018/2019 (dry)31 ± 2527± 2325 ± 18 17 ± 11
Pepper2020 (wet)52 ± 25 44 ± 2624 ± 14 23 ± 14
Mean32 ± 2528 ± 2116 ±16.113 ± 11
Four-year change (%) *14429183172
* The increase in concentration in percent over the four years divided by the initial concentration. ‘Wet’ indicates the rain phase when the crops were initially irrigated and then rainfed, and ‘dry’ indicates the dry phase when the plots were irrigated the entire growing period.
Publisher’s Note: MDPI stays neutral with regard to jurisdictional claims in published maps and institutional affiliations.

