

Stormwater Harvesting Potential for Local Reuse in an Urban Growth Area: A Case Study of Melton Growth Area in the West of Melbourne
 , and
, and
Abstract
:1. Introduction
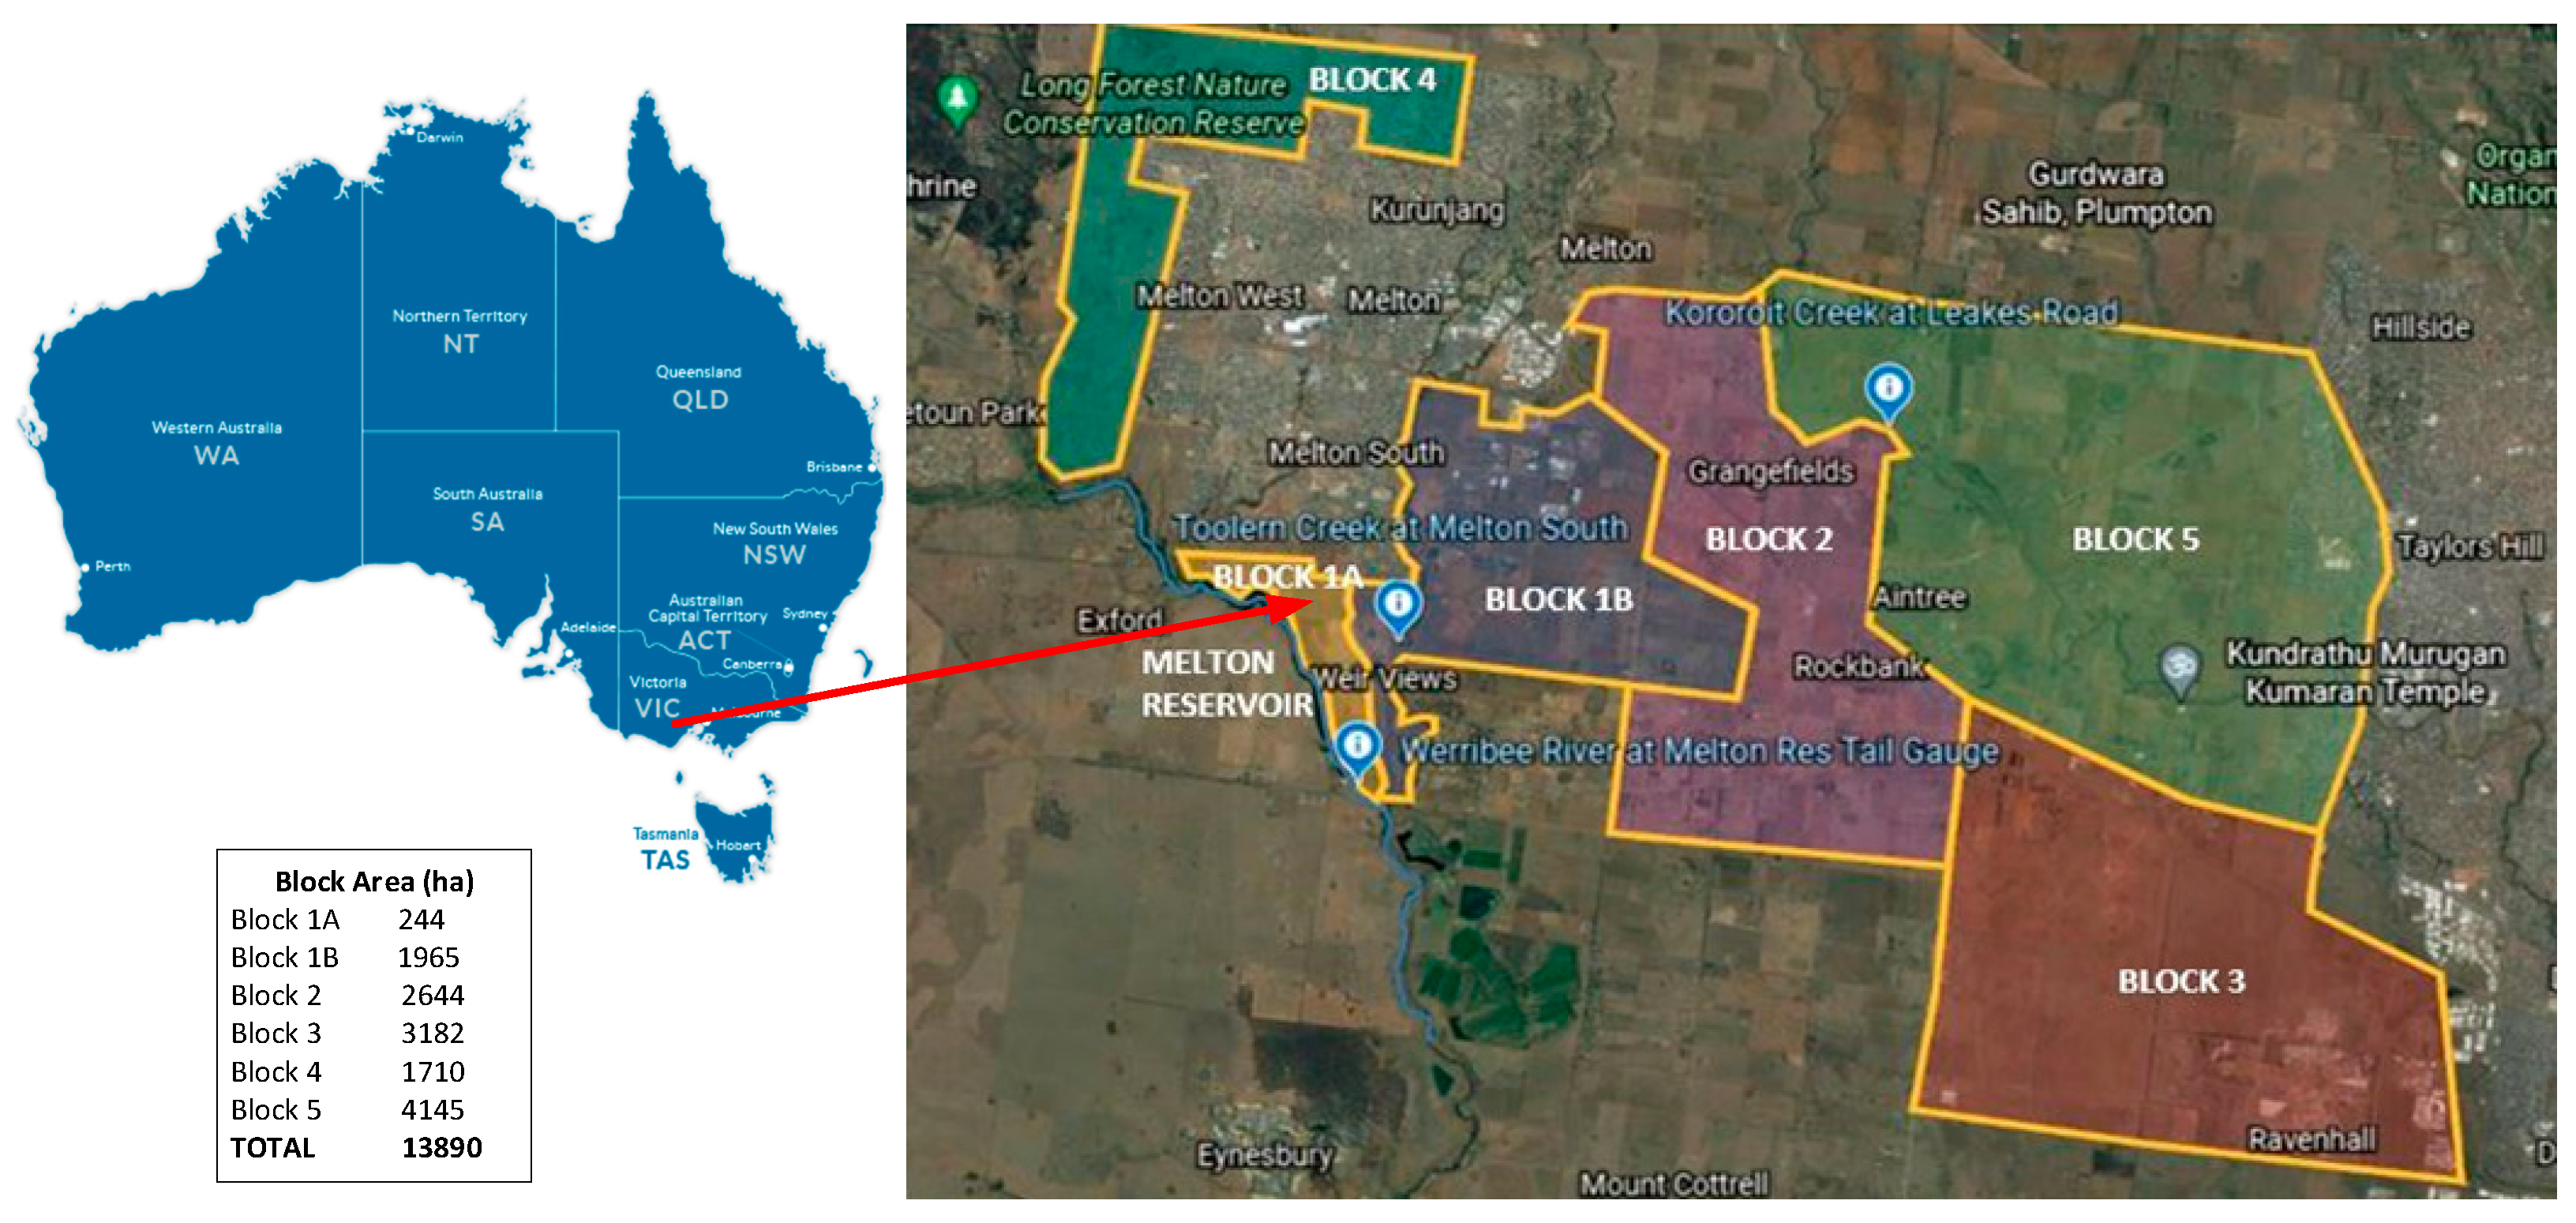
2. Case Study Area
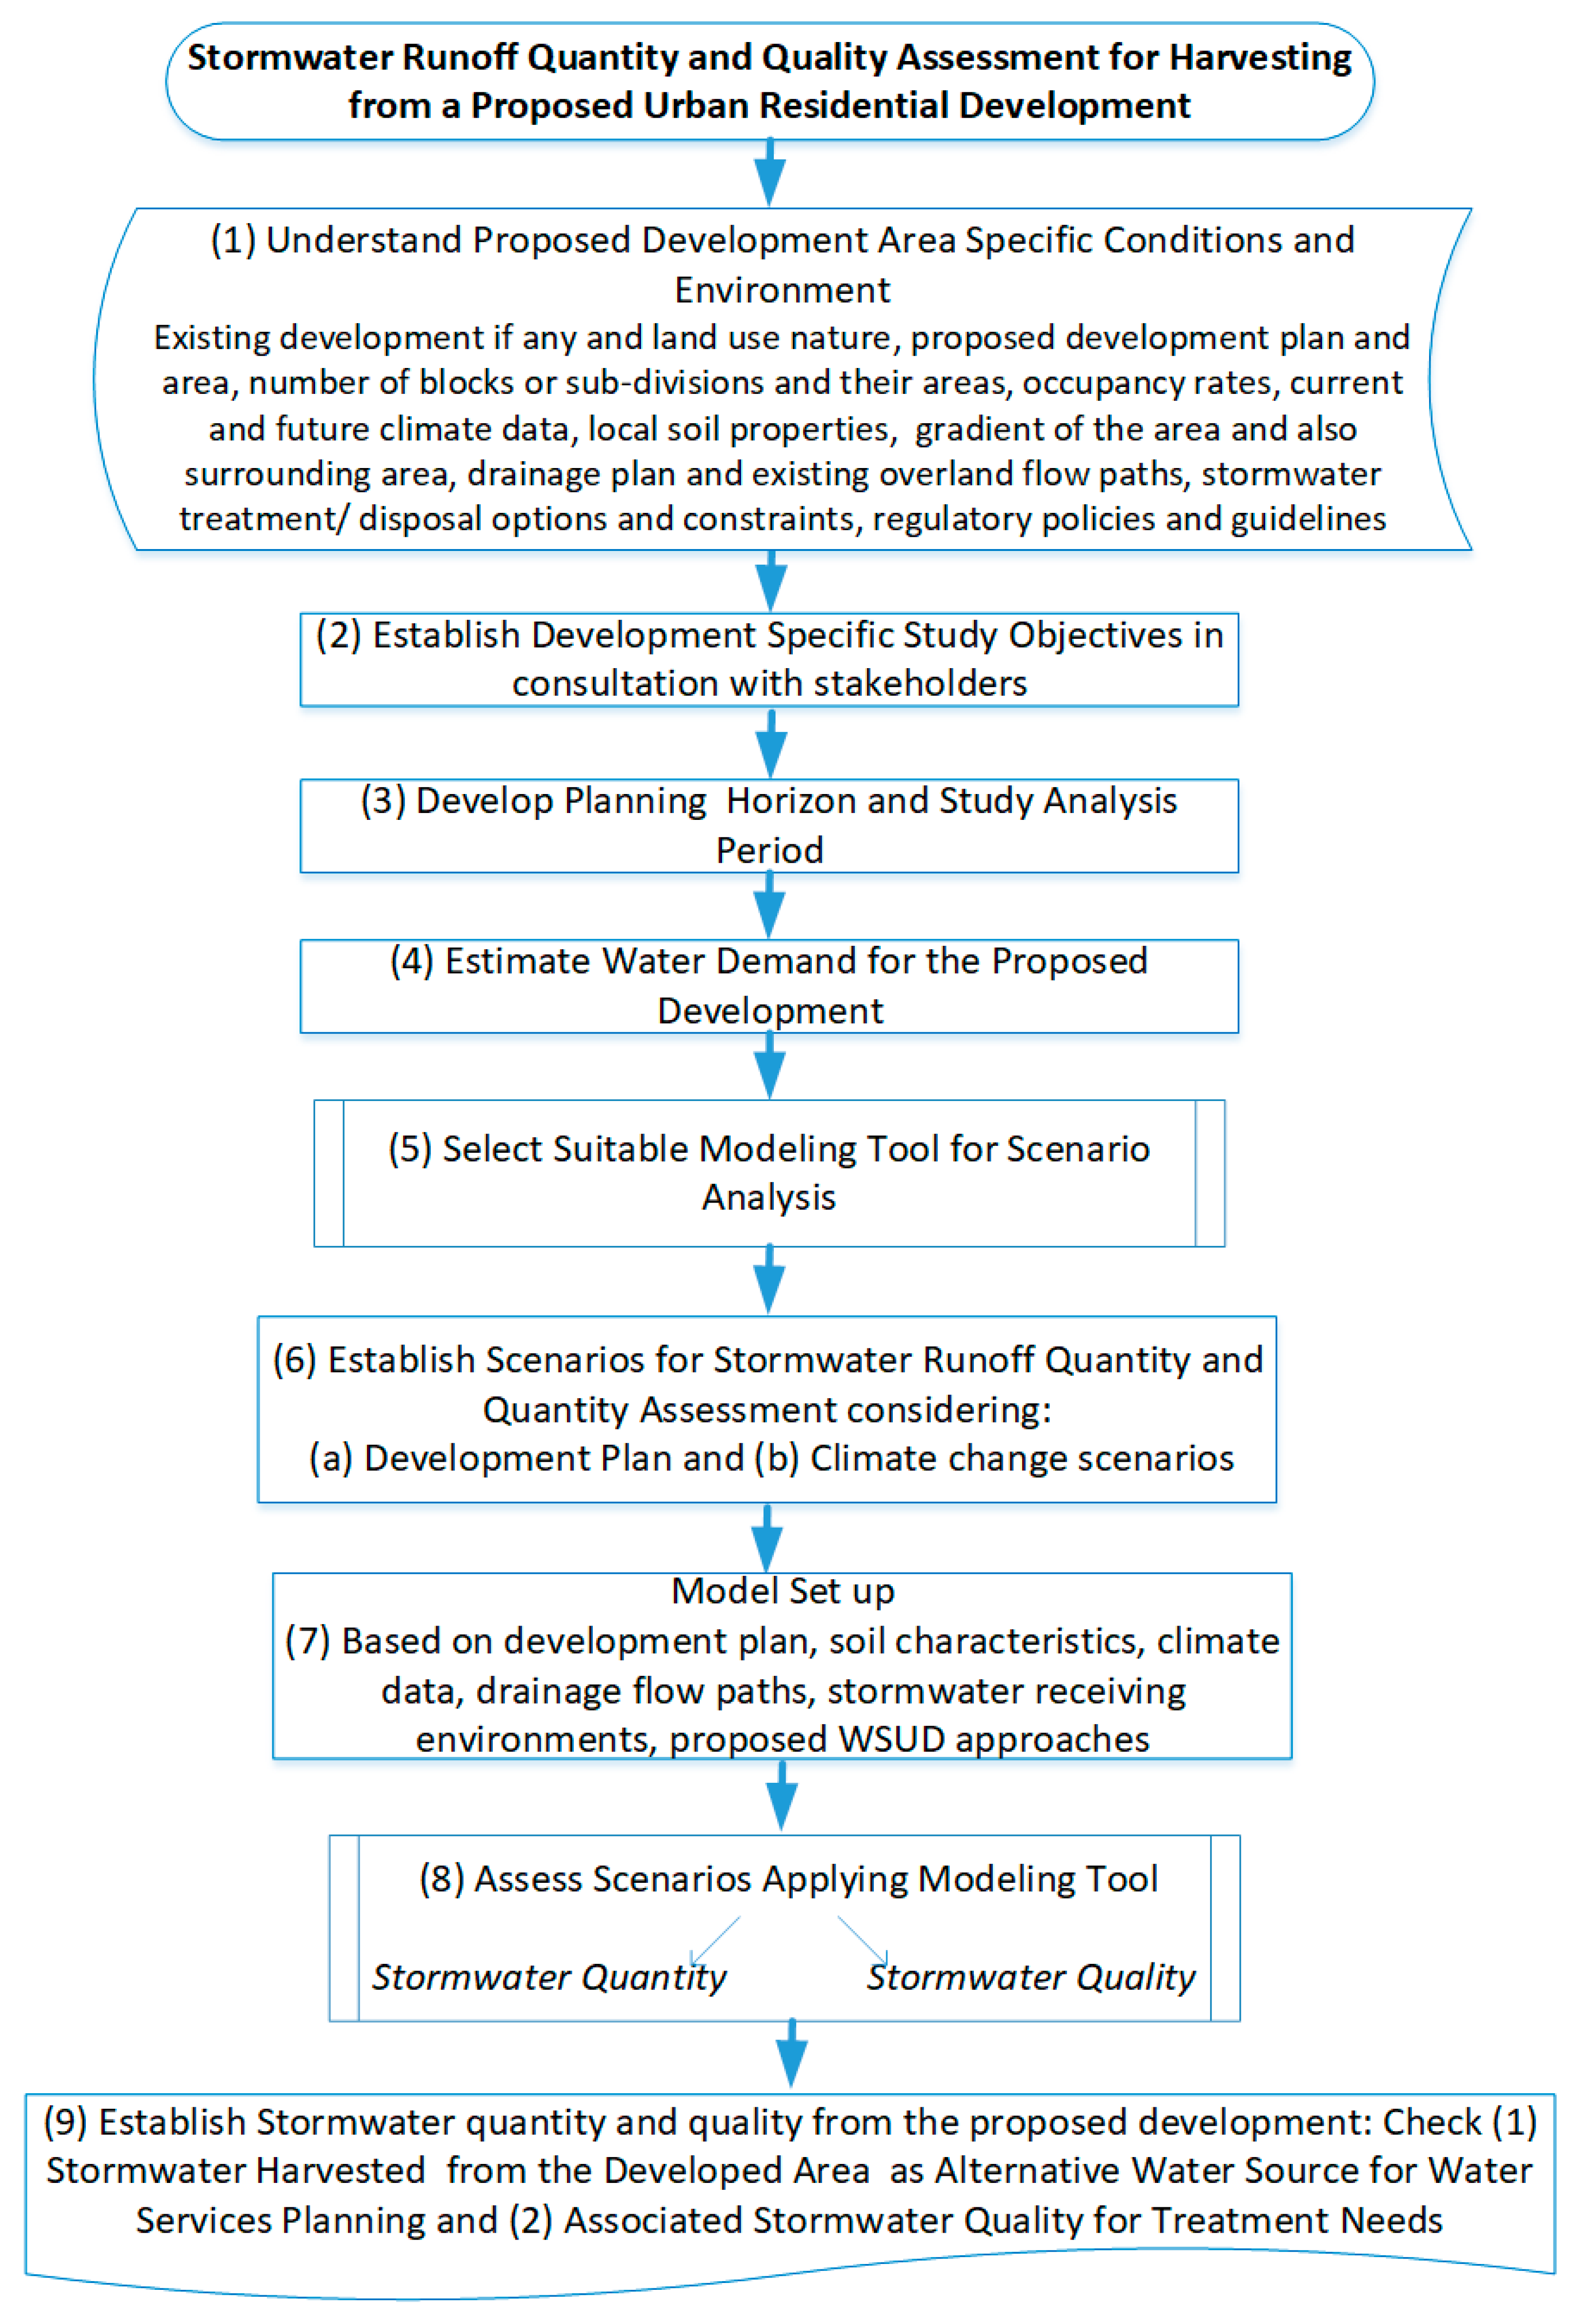
3. Proposed Methodology for Assessing Stormwater Harvesting Potential and Associated Water Quality
- (1)
- Understand Specific Development Area Conditions and Environment: This step involves the collection of development-specific information for planning and executing the study. This will include, but not be limited to, existing development, if any, in the proposed area and the nature of existing land use, development plan and its area, number of blocks or sub-divisions and their areas, current and future climate data, local soil properties, household occupancy rates, industrial and commercial developments in the area, stormwater treatment/disposal options and constraints, and regulatory policies and guidelines. Engagement with project-specific stakeholders, e.g., local water utility, local government, and environmental agencies, should be made for information on the development of specific policies and guidelines, including establishing study objectives.
- (2)
- Establish Development-Specific Study Objectives in consultation with local stakeholders: Study-specific objectives should be developed in consultation with stakeholders. These are generally based on site specific constraints such as the availability of limited fresh water resources, disposal of stormwater, and wastewater limitations in the area. These objectives can be quantitative or qualitative in nature. For example, the reduction in annual stormwater flow by 40% from the development is a quantitative objective, while minimizing stormwater flow from the development is qualitative. Some examples of objectives for the new development area can be maximizing application of local alternative water resources, minimizing the pressure on the freshwater resources, low or minimum impact on existing natural environment, minimizing waste/contaminants to natural environment, and low cost to community and wider social acceptance of the development specific objectives for the proposed study. Local project objective-specific guidelines should be considered for developing qualitative and quantitative objectives.
- (3)
- Develop Planning Horizon and Study Analysis Period: This will include understanding the planning horizon of the proposed development, timeline of development phases, and associated development sizes including nature of development (residential, commercial, industrial, and recreational). The study analysis period will be decided based on the overall development plan and timeline of development phases over the planning horizon.
- (4)
- Estimate Water Demand for the Proposed Development: The proposed nature of development (residential, commercial, industrial, and recreational) should be used to estimate the annual water demand over the planning horizon and development timelines based on local water consumption guidelines for various intended usages. The breakdown between potable and non-potable demand should also be conducted to estimate the potential for alternative water source applications.
- (5)
- Select Suitable Modeling Tool for Analysis: The selection of the most appropriate modeling tool is generally dependent on model capabilities for intended applications to meet study objectives, professionals’ preferred models at geographic locations and data requirements, ease of availability, and associated cost.
- (6)
- Establish Scenarios for Stormwater Runoff Quantity and Quantity Assessment: The scenarios for modeling stormwater runoff and associated water quality are developed considering existing land use, provision of water-sensitive urban design approaches, future urban land use, climate change impacts (low, medium, and high), and natural/manmade flow of stormwater from various blocks (sub-catchments) to the receiving environment.
- (7)
- Model Set-up: The selected modeling tool is applied for developing a model for the development area based on the development plan, soil characteristics, drainage flow paths, stormwater-receiving environment, and proposed WSUD approaches.
- (8)
- Assess Scenarios Applying Modeling Tool: The selected scenarios are modelled using the selected tool for the estimation of stormwater runoff as the maximum harvesting potential under various climatic conditions and scenarios. The stormwater quality is also modelled under various scenarios.
- (9)
- Establish Stormwater Quantity and Quality from the Proposed Development: Check stormwater harvesting potential under various scenarios as water resources for the proposed urban development for water services planning and associated water quality to develop appropriate treatment trains.
4. Application of Assessment Methodology
4.1. Understanding of Development Area Specific Conditions and Environment
4.1.1. Existing Land Use and Proposed Urban Development
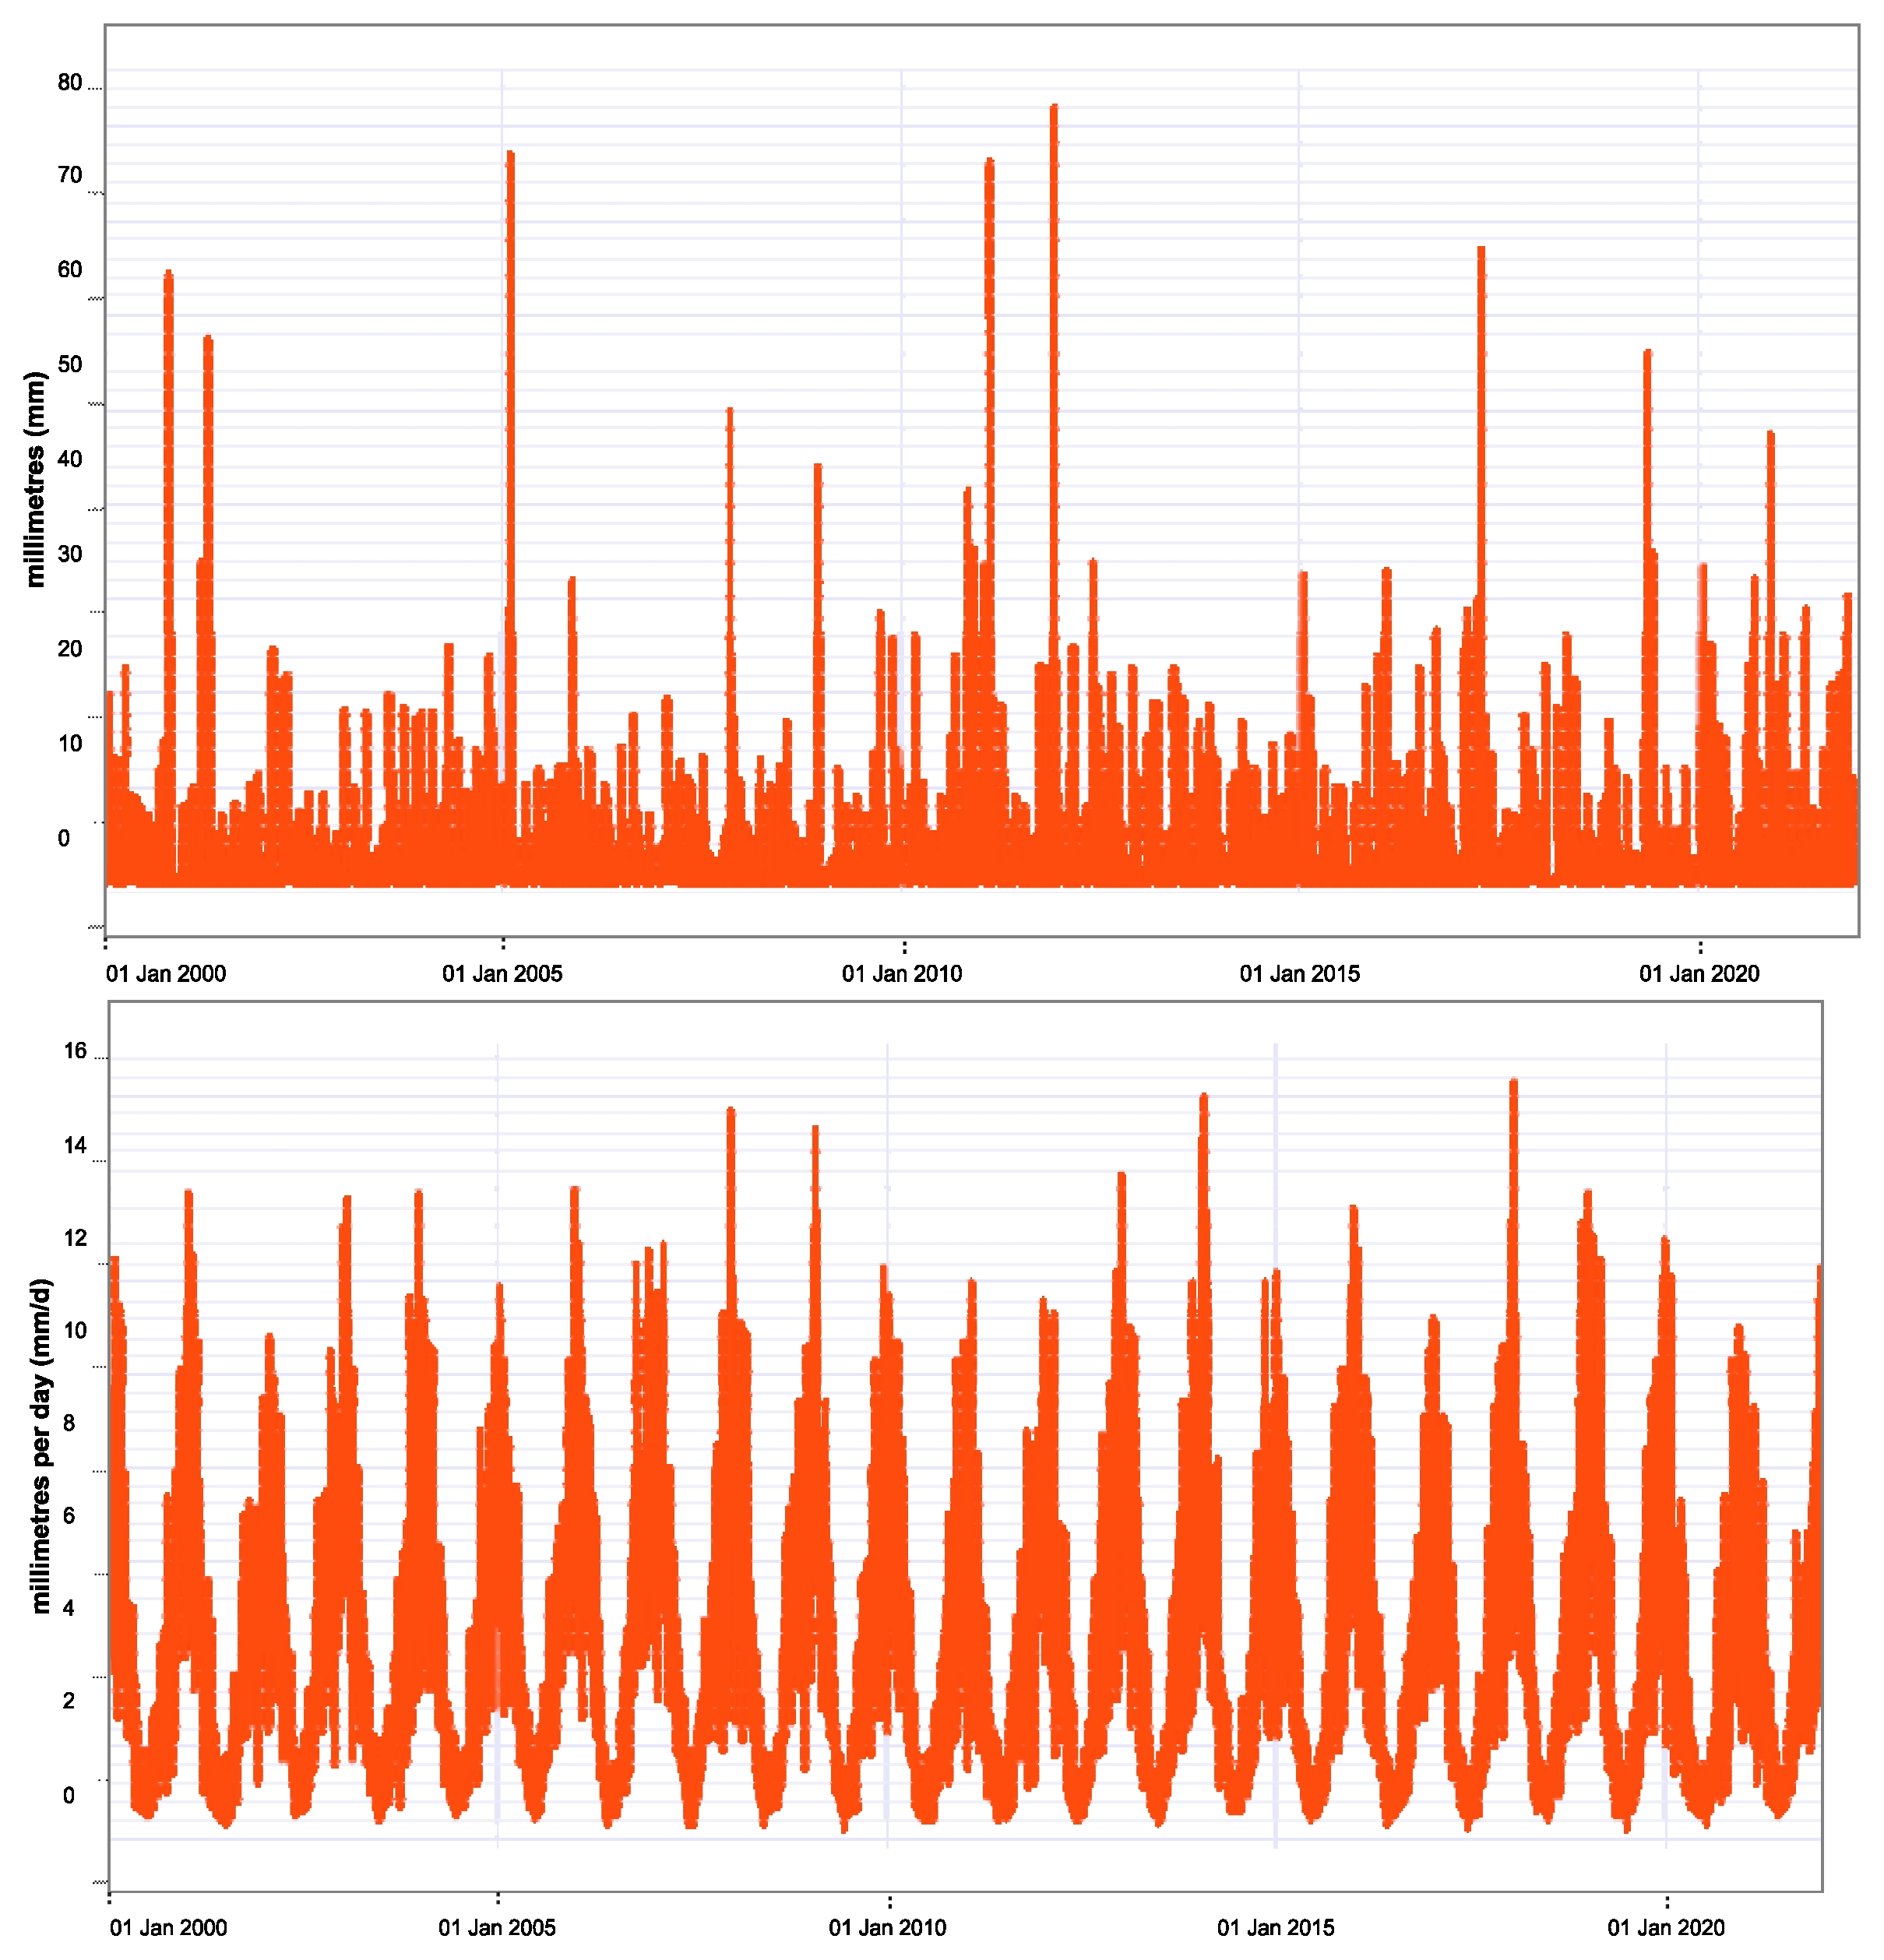
4.1.2. Climate Data
- Low-impact climate change: current rainfall and PET factored up by 2.2% and 2.9%, respectively
- Medium-impact climate change: current rainfall factored down by 2.7% and PET factored up by 4.7%.
- High-impact climate change: current rainfall factored down by 11.7% and PET factored up by 5.9%.
4.1.3. Soil Type: Soil Parameters for Modeling
4.2. Establishment of Development Specific Study Objectives in Consultation with Stakeholders
- (a)
- Investigate the stormwater harvesting potential under current and future land use changes as well as low, medium, and high climate change impacts without and with the planed provisions of wetlands in each of the development blocks.
- (b)
- Investigate the stormwater quality parameters under various conditions as mentioned in (a) for future investigation on the treatment train to treat water for fit-for-purpose applications.
4.3. Development of Plan Timeline and Analysis Period
4.4. Estimation of Water Demand for Proposed Development
4.5. Selection of a Suitable Tool for Hydrological and Water Quality Modeling
4.6. Establishment of Scenarios for Stormwater Runoff Quality and Quantity Assessment Considering Development Plan and Future Climate Change Impacts
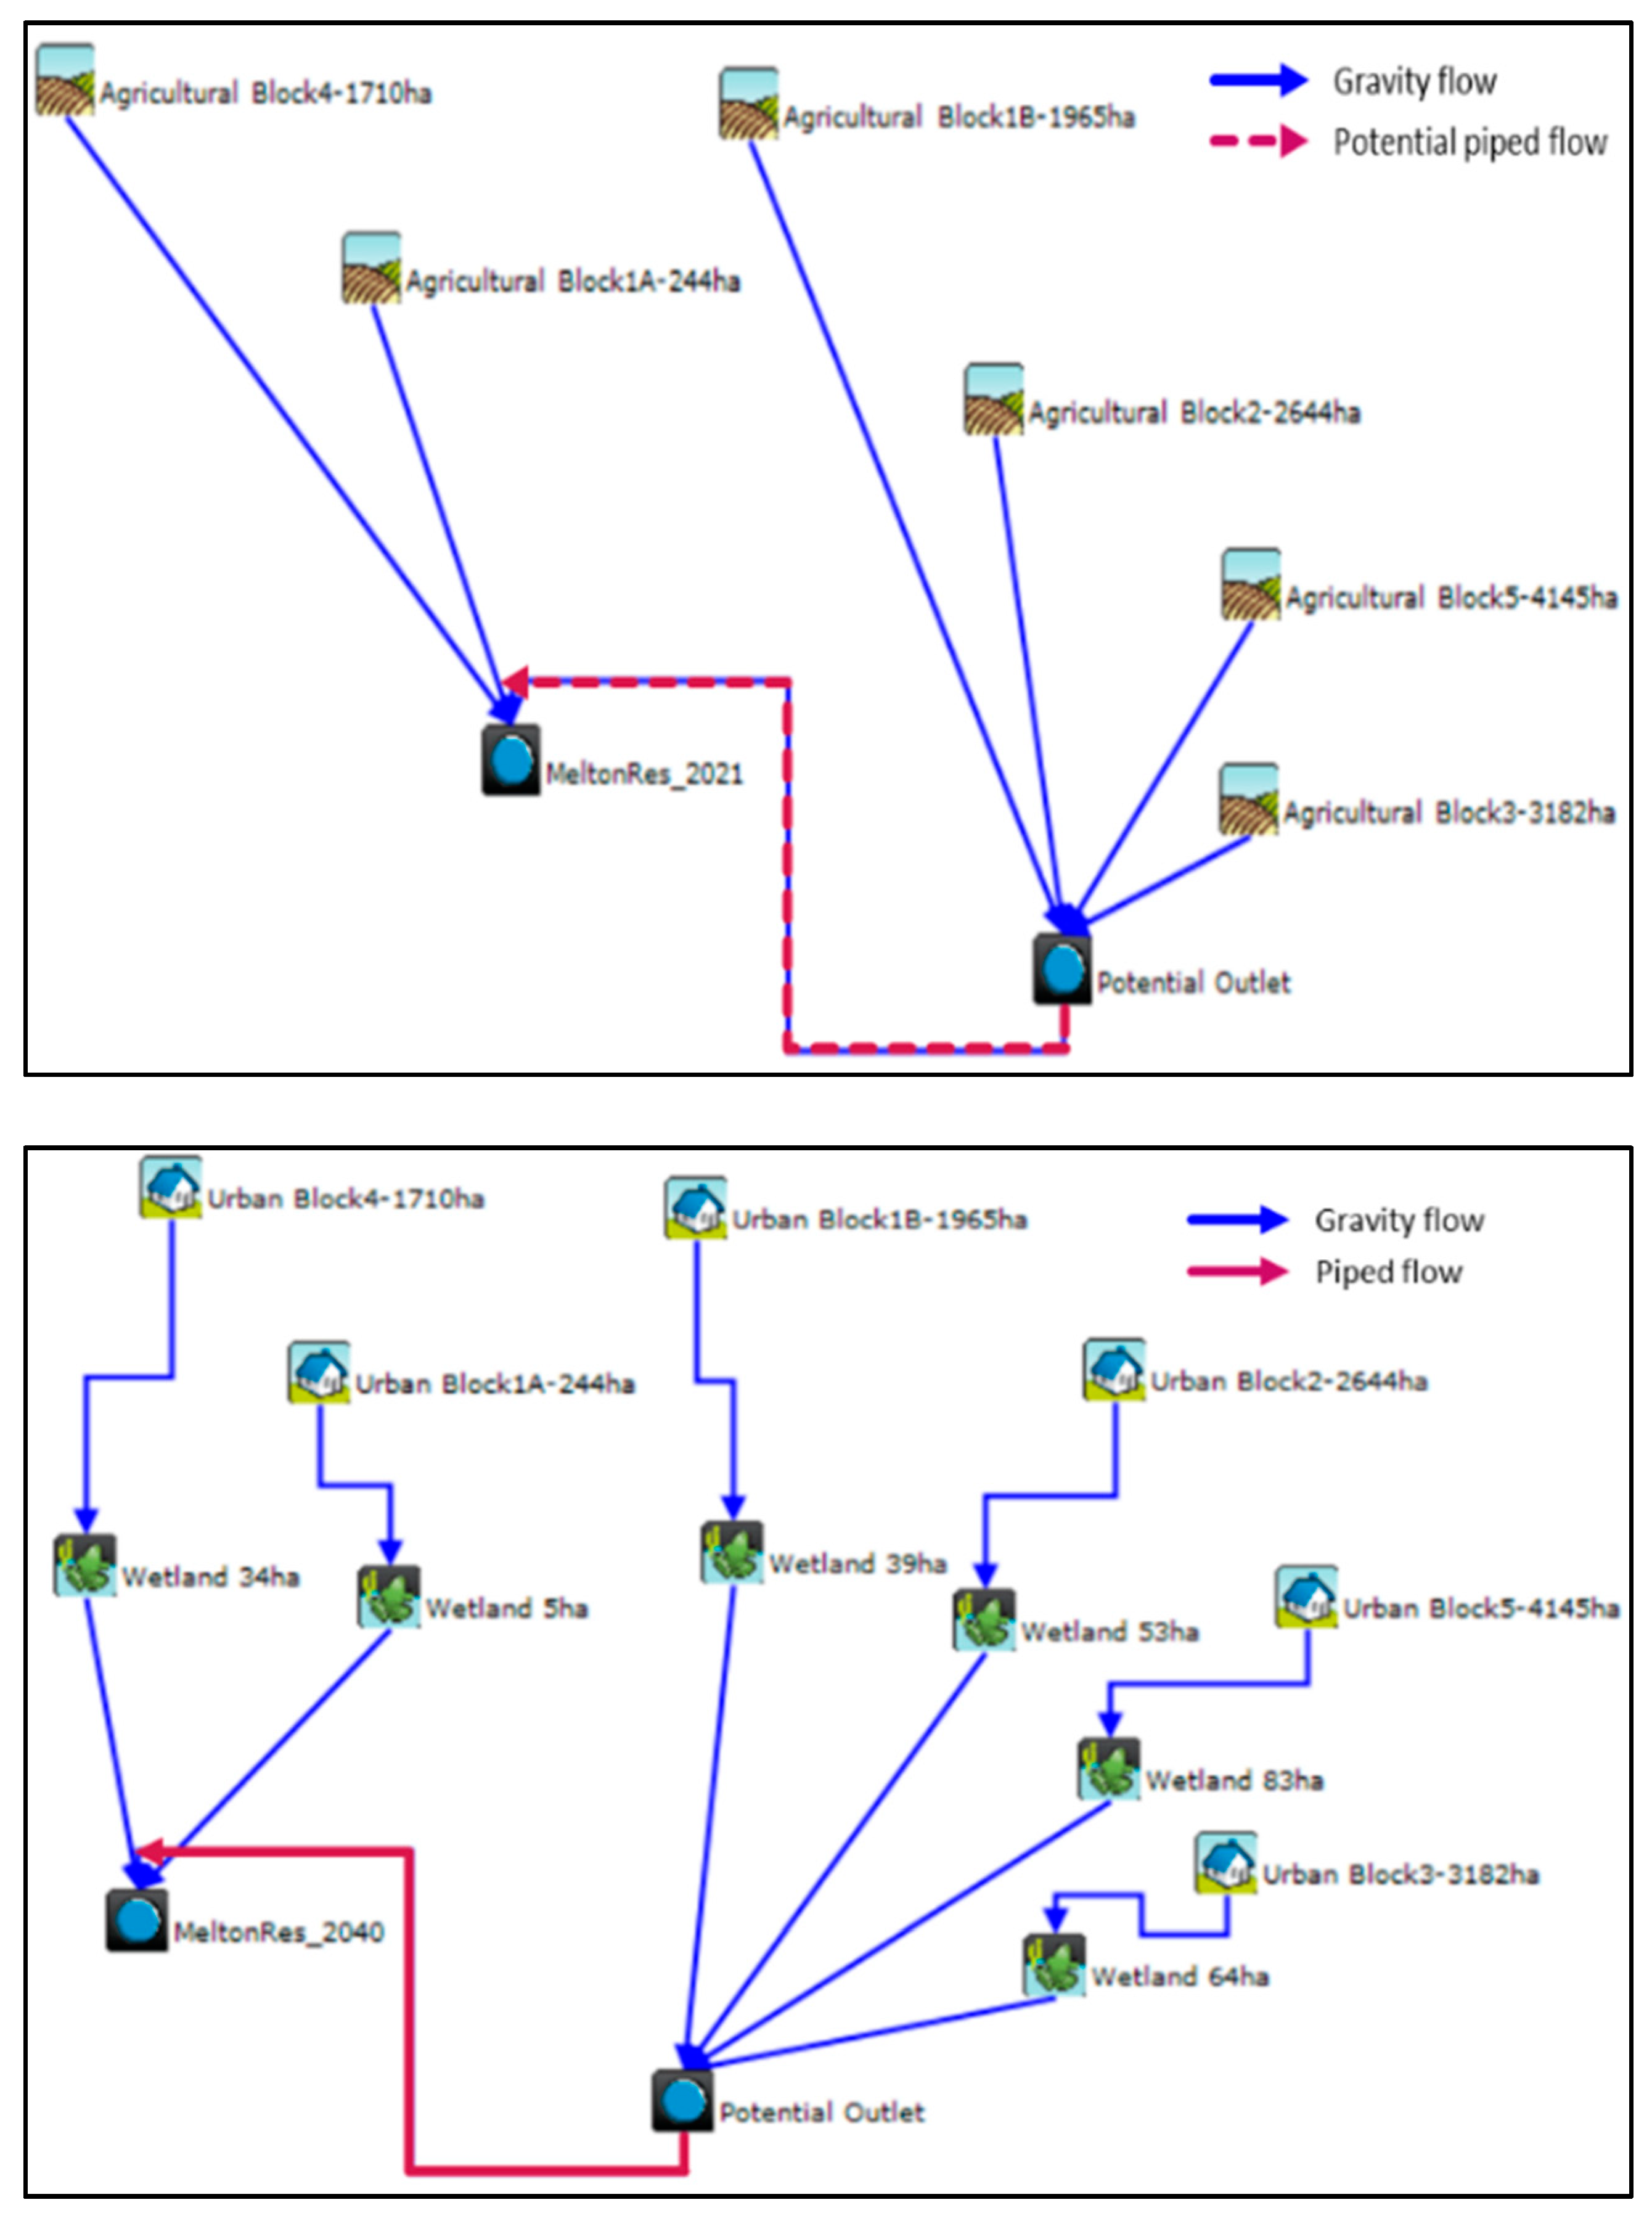
- Current agricultural land use and climate with and without the impacts of wetlands where stormwater from specific agricultural blocks flowed naturally into the Melton Reservoir with no stormwater being harvested and diverted to storage from some of the other blocks.
- Future (2040) fully urbanised land use with the impact of climate change scenarios in the absence and presence of wetlands, where additional stormwater from specific urban blocks was also captured and piped into the Melton Reservoir.
- The current climate data are based on a 2000–2021 time series and its modification to reflect climate change impacts are described in Section 4.1.2.
4.7. MUSIC Model Set-Up
4.7.1. Development Area Representation in MUSICX Model
4.7.2. Wetland Parameters for Modelling
- 80% retention of the typical urban annual load for total suspended solids (TSS).
- 45% retention of the typical urban annual load for total phosphorus (TP).
- 45% retention of the typical urban annual load for total nitrogen (TN).
4.7.3. Stormwater Quality Parameters for Modeling
4.8. Assessment of Options–Stormwater Runoff Quantity and Associated Quality
4.8.1. Stormwater Runoff Quantity from Various Scenarios
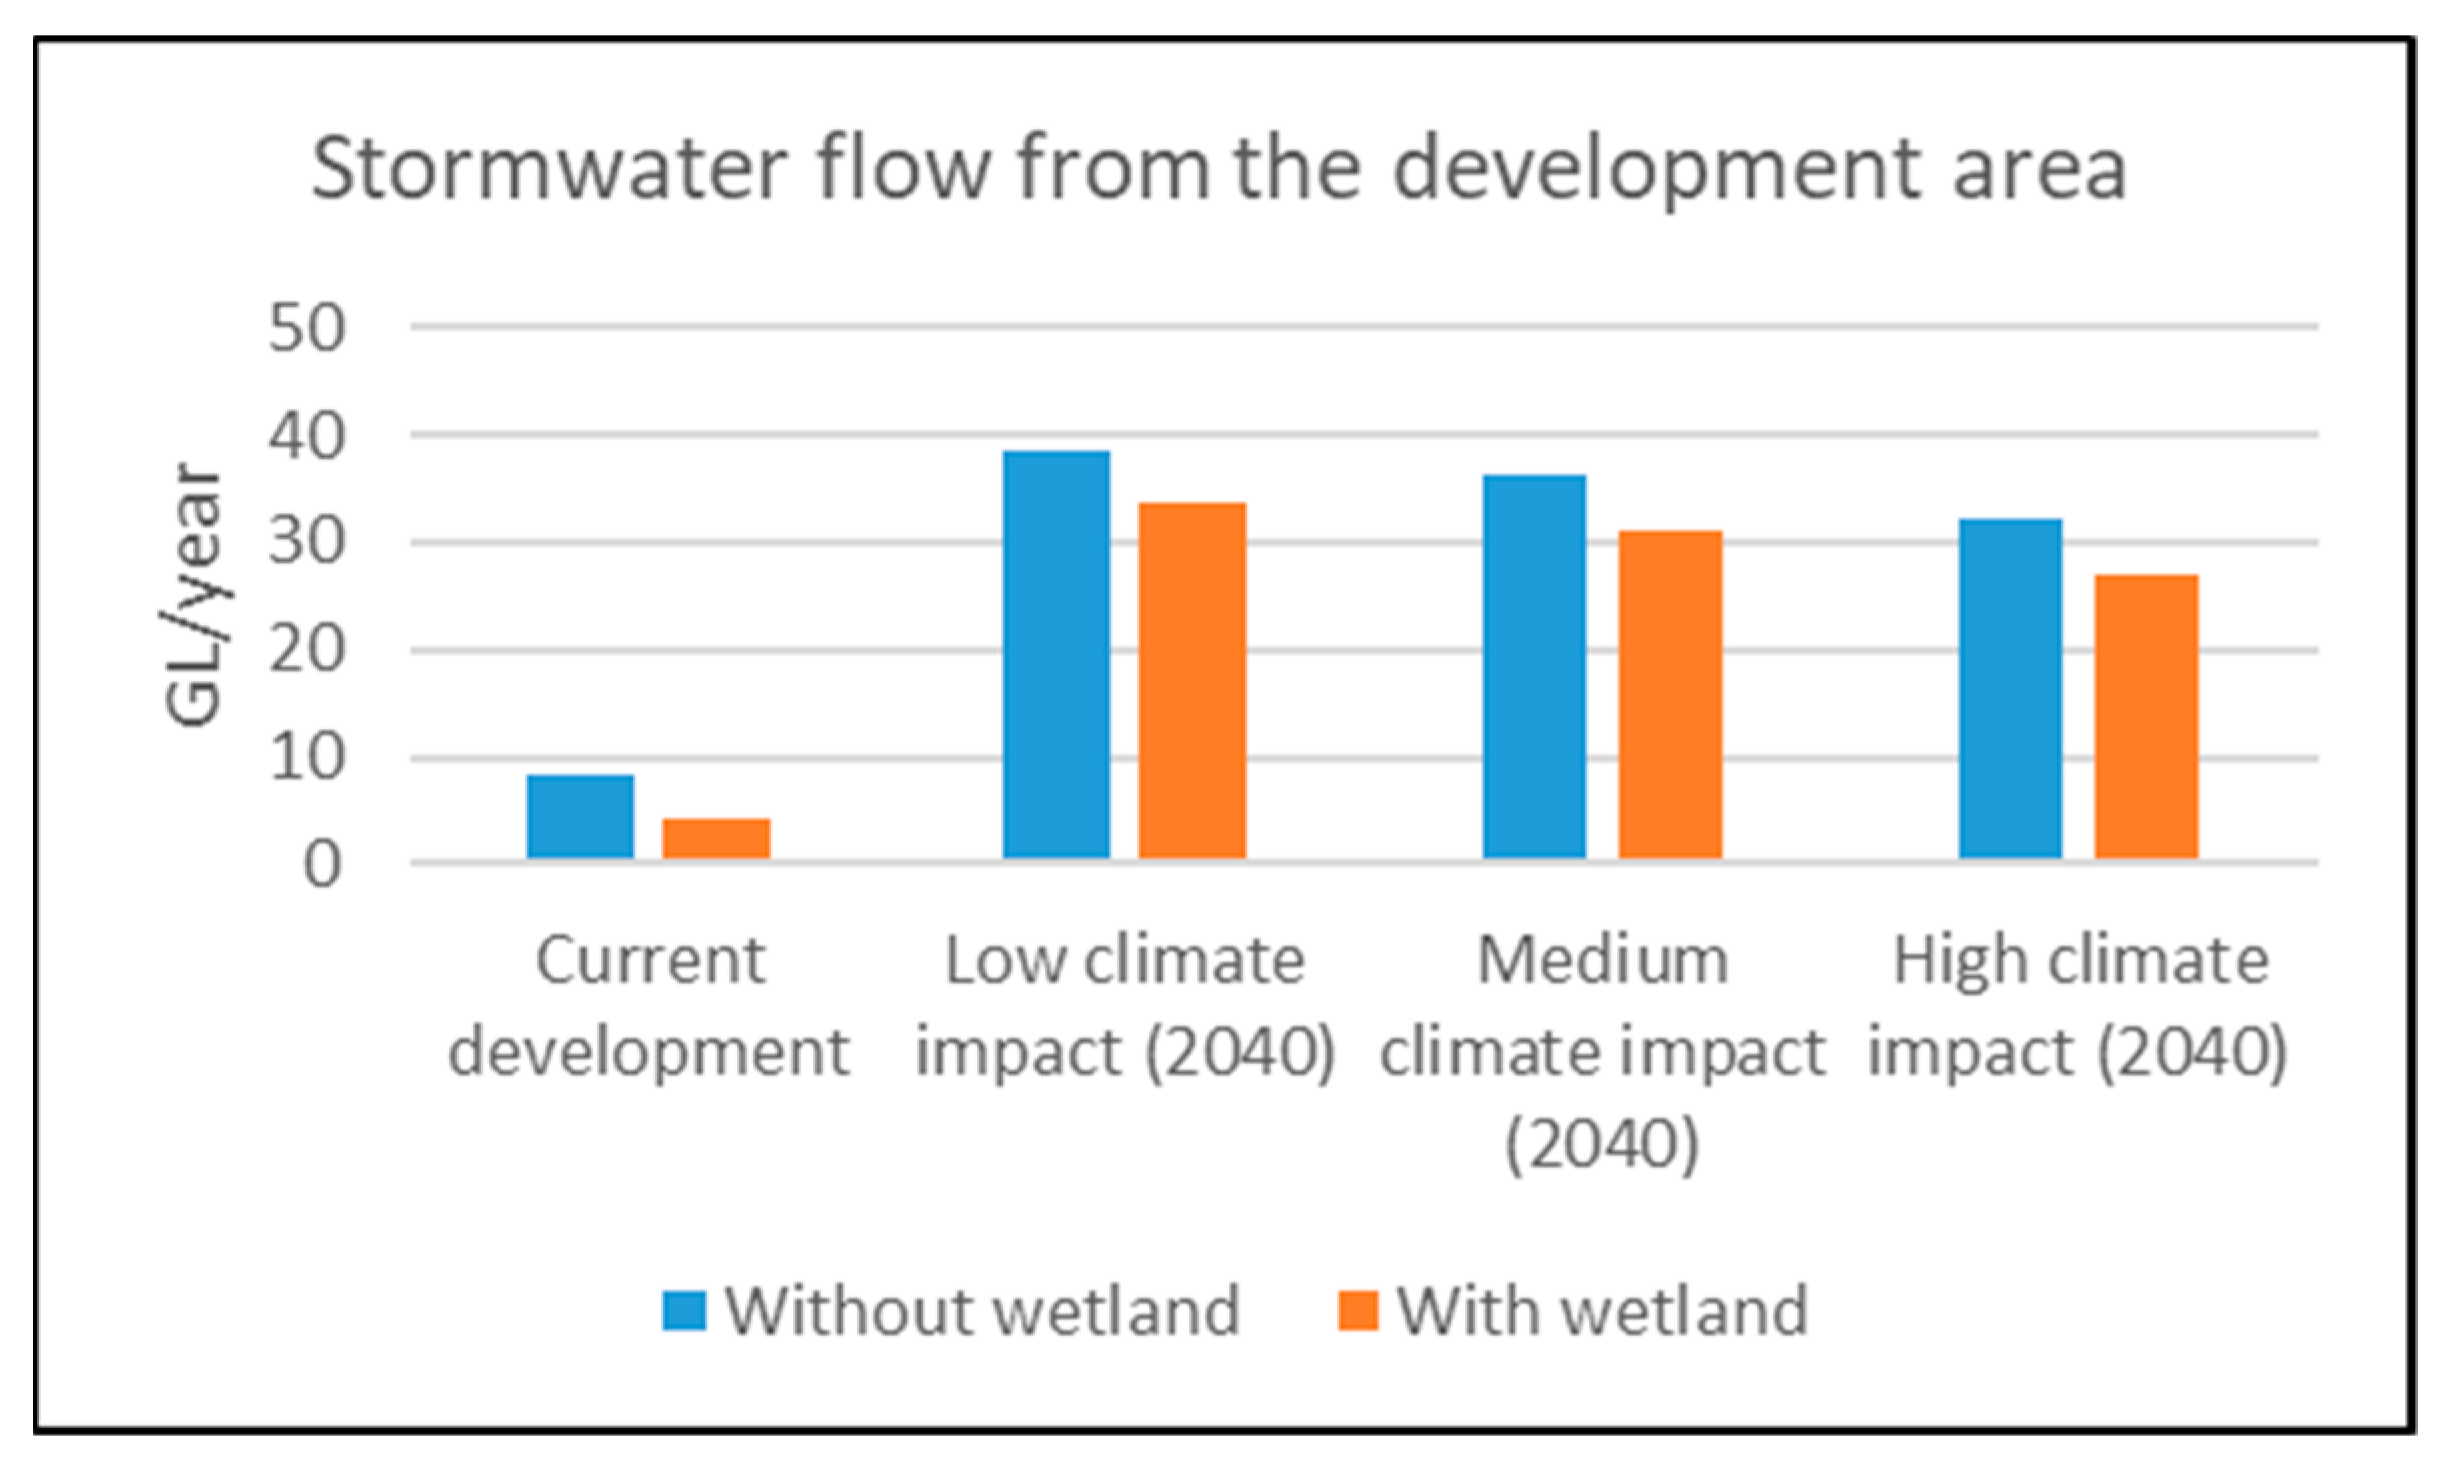
- All future urban development scenarios resulted in a higher stormwater runoff volume due to increases in the impervious surface compared with the existing agricultural land use. For instance, stormwater runoff increased by nearly four times to be 32 GL/year under the 2040 full urban land use with high climate change (most conservative scenario) compared with 8.39 GL/year of stormwater generated today, assuming there were no wetlands built out there.
- The volume of stormwater available in the region decreased after the construction of wetlands, mainly due to ET losses in the wetlands under various scenarios.
- Assuming no wetlands are constructed in the region, annual average stormwater volume increased to be 38.62 GL under the 2040 full urban land use with the low-impact climate. This decreased by 6% and 17% to 36.25 and 32 GL with the medium and high-impact climates, respectively.
- With the construction of wetlands in each block, annual average stormwater volume increased to 33.53 GL under the 2040 full urban land use with low-impact climate. This decreased by 7% and 20% to 31.08 GL and 26.78 GL with the medium and high-impact climates, respectively.
- The 8.39 GL/year of stormwater available today (if completely harvested) contributed to meeting the required amount of potable and Class B recycled water (7.5 GL/year, reported by Greater Western Water), which is mainly used for irrigation of open spaces in the Melton growth area. Here, 26.78 GL/year stormwater generated under the 2040 full urban land use with a high-climate impact and the provision of wetlands was sufficient to meet residential potable water demand of 23 GL/year if 100% stormwater is captured and treated for potable standard.
4.8.2. Stormwater Pollutant Load from Various Scenarios
- The annual average loads of TSS were found to increase by over four times under the 2040 full urban land use with high climate change (most conservative scenario) compared with that of today. The same increasing trend occurred for both TP and TN, with larger loads of over three times in future urban development for the high-climate scenario compared with the existing agricultural land use (Figure 7a,b). This is likely due to the very high rate of stormwater runoff generated in all future cases than the default initial concentrations of the pollutant loads for current and future land uses. Even though the initial mean storm flow concentrations of the pollutants were higher for agricultural land use compared with urban-mixed land use (Table 5), higher pollutant loadings are expected for future urban scenarios as a result of the significantly higher stormwater volume generated in the future.
- The wetlands were found to be efficient at removing TSS, TP, and TN and were in line with the objectives of the Urban Stormwater BPEMG [40] with target removal percentages of 80% for TSS, and 45% for nutrient loads for TP and TN (see Table 7). It can be observed from this table that wetlands, at worst, were able to retain over 90% of TSS, 77% of TP, and 52% of TN in all scenarios. The sizes of wetlands in blocks could be reduced from 2% of the block area to meet best practice stormwater management current guidelines.
5. Conclusions
Author Contributions
Funding
Data Availability Statement
Acknowledgments
Conflicts of Interest
References
- Ayeni, A.; Kapangaziwiri, E.; Soneye, A.; Engelbrecht, F. Assessing the impact of global changes on the surface water resources of Southwestern Nigeria. Hydrol. Sci. J. 2015, 60, 1956–1971. [Google Scholar] [CrossRef]
- Tacoli, C.; McGranahan, G.; Satterthwaite, D. Urbanisation, Rural-Urban Migration and Urban Poverty: JSTOR; Human Settlements Group, International Institute for Environment and Development: London, UK, 2015. [Google Scholar]
- World Population Prospects 2022: Summary of Results; UN DESA/POP/2022/TR/NO. 3; United Nations Department of Economic and Social Affairs, Population Division: New York, NY, USA, 2022.
- Australian Bureau of Statistics. Population Projections, Australia, 2017 (Base) to 2066: Catalogue. 2017. Available online: https://www.abs.gov.au/statistics/people/population/population-projections-australia/latest-release#:~:text=Australia’s%20population%20in%202017%20(24.6,between%2039.5%20and%2043.0%20years (accessed on 25 March 2023).
- Timbal, B.; Abbs, D.; Bhend, J.; Chiew, F.; Church, J.; Ekström, M.; McInnes, K. Murray basin cluster report. In Climate Change in Australia Projections for Australia’s Natural Resource Management Regions: Cluster Reports; CSIRO and Bureau of Meteorology: Canberra, Australia, 2015. [Google Scholar]
- DELWP. Guidelines for Assessing the Impact of Climate Change on Water Supplies in Victoria Final Report. December 2016. Available online: https://nla.gov.au/nla.obj-385683871/view (accessed on 25 March 2023).
- CSIRO; BOM. Climate Change in Australia Information for Australia’s Natural Resource Management Regions: Technical Report, CSIRO and Bureau of Meteorology, Australia. 2015. Available online: https://www.climatechangeinaustralia.gov.au/media/ccia/2.2/cms_page_media/168/CCIA_2015_NRM_TechnicalReport_WEB.pdf (accessed on 25 March 2023).
- Wang, X.-J.; Zhang, J.-Y.; Shahid, S.; Guan, E.-H.; Wu, Y.-X.; Gao, J.; He, R.-M. Adaptation to climate change impacts on water demand. Mitig. Adapt. Strateg. Glob. Chang. 2016, 21, 81–99. Available online: https://link.springer.com/article/10.1007/s11027-014-9571-6 (accessed on 30 March 2023). [CrossRef]
- Staben, N.; Nahrstedt, A.; Merkel, W. Securing safe drinking water supply under climate change conditions. Water Sci. Technol. Water Supply 2015, 15, 1334–1342. [Google Scholar] [CrossRef]
- Vörösmarty, C.J.; Green, P.; Salisbury, J.; Lammers, R.B. Global water resources: Vulnerability from climate change and population growth. Science 2000, 289, 284–288. [Google Scholar] [CrossRef] [Green Version]
- The Senate-Environment and Communications References Committee. Stormwater Management in Australia; Commonwealth of Australia: Canberra, Australia, 2015. Available online: https://www.aph.gov.au/Parliamentary_Business/Committees/Senate/Environment_and_Communications/Stormwater/Report (accessed on 10 March 2023).
- Luthy, R.G.; Sharvelle, S.; Dillon, P. Urban Stormwater to Enhance water Supply. Environ. Sci. Technol. 2019, 53, 5534–5542. [Google Scholar] [CrossRef] [PubMed]
- King, R.S.; Baker, M.E.; Kazyak, P.F.; Weller, D.E. How novel is too novel? Stream community thresholds at exceptionally low levels of catchment urbanization. Ecol. Appl. 2011, 21, 1659–1678. [Google Scholar] [CrossRef]
- Vietz, G.J.; Sammonds, M.J.; Walsh, C.J.; Fletcher, T.D.; Rutherfurd, I.D.; Stewardson, M.J. Ecologically relevant geomorphic attributes of streams are impaired by even low levels of watershed effective imperviousness. Geomorphology 2014, 206, 67–78. [Google Scholar] [CrossRef]
- Wright, I.A.; Davies, P.J.; Findlay, S.J.; Jonasson, O.J. A new type of water pollution: Concrete drainage infrastructure and geochemical contamination of urban waters. Mar. Freshw. Res. 2011, 62, 1355–1361. [Google Scholar] [CrossRef]
- Hoban, A. Water sensitive design approaches and their description. In Approaches to Water Sensitive Urban Design: Potential, Design, Ecological Health, Economics, Policies and Community Perceptions; Sharma, A.K., Begbie, D., Gardner, T., Eds.; Elsevier: Amsterdam, The Netherlands, 2019; ISBN 9780128128435. Available online: https://www.elsevier.com/books/approaches-to-water-sensitive-urban-design/sharma/978-0-12-812843-5 (accessed on 10 March 2023).
- Inamdar, P.M.; Cook, S.; Sharma, A.; Corby, N.; O’Connor, J.; Perera, B.J.C. A GIS based screening tool for locating and ranking suitable stormwater harvesting sites in urban areas. J. Environ. Manag. 2013, 128, 363–370. [Google Scholar] [CrossRef] [Green Version]
- Inamdar, P.M.; Sharma, A.; Cook, S.; Perera, B.J.C. Evaluation of stormwater harvesting sites using multi criteria decision methodology. J. Hydrol. 2018, 562, 181–192. [Google Scholar] [CrossRef]
- Sapkota, M.; Arora, M.; Malano, H.; Sharma, A.; Moglia, M. Integrated Evaluation of Hybrid Water Supply Systems Using a PROMETHEE–GAIA Approach. Water 2018, 10, 610. [Google Scholar] [CrossRef] [Green Version]
- Sharma, A.; Grant, A.; Grant, T.; Pamminger, F.; Opray, L. Environmental and economic assessment of urban water services for a Greenfield development. Environ. Eng. Sci. 2009, 26, 921–934. [Google Scholar] [CrossRef]
- Sanciolo, P.; Behroozi, A.; Navaratna, D.; Sharma, A.K.; Muthukumaran, S. The Potential for Stormwater Harvesting and Reuse in the Urban Growth Area: A Case Study in the West of Melbourne; Technical Report; Institute for Sustainable Industries and Liveable Cities, Victoria University: Melbourne, Australia, 2022. [Google Scholar]
- Goonetilleke, A.; Thomas, E.; Ginn, S.; Gilbert, D. Understanding the role of land use in urban stormwater quality management. J. Environ. Manag. 2005, 74, 31–42. [Google Scholar] [CrossRef] [Green Version]
- Goonetilleke, A.; Lampard, J.-L. Stormwater quality, pollutant sources, processes, and treatment options. In Approaches to Water Sensitive Urban Design; Sharma, A.K., Gardner, T., Begbie, D., Eds.; Elsevier: Amsterdam, The Netherlands, 2019; pp. 49–74. [Google Scholar]
- Hamlyn-Harris, D.; McAlister, T.; Dillon, P. Water harvesting potential of WSUD approaches. In Approaches to Water Sensitive Urban Design; Sharma, A.K., Gardner, T., Begbie, D., Eds.; Elsevier: Amsterdam, The Netherlands, 2019; pp. 177–208. [Google Scholar]
- Jacobs. Werribee E-Flows with Alternative Water from the Melton Growth Area—Report for WESTERN WATER-Flow Recommendations Report—Final 26 May 2020. Unpublished.
- Hellstrom, D.; Jeppsson, U.; Karrman, E. A framework for systems analysis of sustainable urban water management. Environ. Impact Assess. Rev. 2000, 20, 311–321. [Google Scholar] [CrossRef]
- Ashley, R.M.; Blackwood, D.; Butler, D.; Jowitt, P. Sustainable Water Services: A Procedural Guide; Sustainable Water Industry Asset Resources Decisions Project; IWA Publishing: London, UK, 2004; Available online: https://www.iwapublishing.com/books/9781843390657/sustainable-water-services (accessed on 1 March 2023).
- Lundie, S.; Ashbolt, N.; Livingston, D.; Lai, E.; Kärrman, E.; Blaikie, J.; Anderson, J. Sustainability Framework. Methodology for Evaluating the Overall Sustainability of Urban Water Systems; Paper for the Water Services Association of Australia by the University of New South Wales. 2008. Available online: https://water360.com.au/wp-content/uploads/2022/02/200807_WSAA_Occasional_Paper_17_PP040_Sustainability_Framework.pdf (accessed on 1 March 2023).
- Shire of Melton. Landscape Guidelines for the Shire of Melton. 2010. Available online: https://www.melton.vic.gov.au/files/assets/public/services/building-planning-amp-transport/statutory-planning/melton_landscape_guidelines.pdf (accessed on 1 March 2023).
- Melbourne Water. MUSIC (Model for Urban Stormwater Improvement Conceptualisation) Guideline. 2022. Available online: https://clearwatervic.com.au/user-data/resource-files/am-gui-music-guideline_2022_release-a.pdf (accessed on 9 March 2023).
- DSE. Achieving Target 155, Our Water Our Future; Victorian Government Department of Sustainability and Environment: Melbourne, Australia, 2009. [Google Scholar]
- Melbourne Water. Permanent Water Saving Rules and Target 155. 2021. Available online: https://www.melbournewater.com.au/water-data-and-education/environmental-issues/why-we-need-save-water/permanent-water-saving-rules (accessed on 27 July 2022).
- Devia, G.K.; Ganasri, B.P.; Dwarakish, G.S. A Review on Hydrological Models. Aquat. Procedia 2015, 4, 1001–1007. [Google Scholar] [CrossRef]
- Hämäläinen, R.P. Behavioural issues in environmental modelling–The missing perspective. Environ. Model. Softw. 2015, 73, 244–253. [Google Scholar] [CrossRef]
- Beven, K.; Young, P. A guide to good practice in modeling semantics for authors and referees. Water Resour. Res. 2013, 49, 5092–5098. [Google Scholar] [CrossRef] [Green Version]
- Elga, S.; Jan, B.; Okke, B. Hydrological modelling of urbanized catchments: A review and future directions. J. Hydrol. 2015, 529, 62–81. [Google Scholar]
- Dotto, C.B.S.; Kleidorfer, M.; Deletic, A.; Rauch, W.; McCarthy, D.T.; Fletcher, T.D. Performance and sensitivity analysis of stormwater models using a Bayesian approach and long-term high resolution data. Environ. Model. Softw. 2011, 26, 1225–1239. [Google Scholar] [CrossRef]
- Imteaz, M.A.; Ahsan, A.; Rahman, A.; Mekanik, F. Modelling stormwater treatment systems using MUSIC: Accuracy. Resour. Conserv. Recycl. 2013, 71, 15–21. [Google Scholar] [CrossRef]
- Shahzad, H.; Myers, B.; Hewa, G.; Johnson, T.; Boland, J.; Mujtaba, H. Characterizing the Stormwater Runoff Quality and Evaluating the Performance of Curbside Infiltration Systems to Improve Stormwater Quality of an Urban Catchment. Water 2022, 14, 14. [Google Scholar] [CrossRef]
- Stormwater Committee. Urban Stormwater Best Practice Environment Management Guidelines; CSIRO Publication: Clayton, Australia, 1999; Available online: https://www.publish.csiro.au/book/2190/ (accessed on 5 March 2023).


| Blocks | Area (Hectare) |
|---|---|
| Block 1A | 244 |
| Block 1B | 1965 |
| Block 2 | 2644 |
| Block 3 | 3182 |
| Block 4 | 1710 |
| Block 5 | 4145 |
| Total | 13,890 |
| Scenario | Scenario Description | Analysis Year | Land Use | Climate Change Impact | Wetlands | Stormwater Flow |
|---|---|---|---|---|---|---|
| S 1 | Current land use and climatic conditions and no wetland in blocks | 2022 | 100% agricultural use–10% Imperviousness | No climate impact Use 2000–2021 climate data | None proposed | Blocks 1A and 4 flows naturally into the Melton Reservoir (MR) |
| S 2 | Current land use and climatic conditions and wetland in blocks | 2022 | 100% agricultural use–10% Imperviousness | No climate impact Use 2000–2021 climate data | Proposed in blocks 2% of block area | Blocks 1A and 4 flows naturally into the MR |
| S 3 | Future 100% urban land use and low impact climate and no wetland in blocks | 2040 | 100% urban land use–75% Imperviousness | Low climate impact | None proposed | Blocks 1A and 4 flows naturally into the MR while stormwater from block 1B, 2, 3, and 5 is captured and pumped to MR |
| S 4 | Future 100% urban land use and low climate impact and wetland in blocks | 2040 | 100% urban land use–75% Imperviousness | Low climate impact | Proposed in blocks 2% of block area | Same as for Scenario 3 |
| S 5 | Future 100% urban land use and medium climate impact and no wetland in blocks | 2040 | 100% urban land use–75% Imperviousness | Medium climate impact | None proposed | Same as for Scenario 3 |
| S 6 | Future 100% urban land use and medium climate impact and wetland in blocks | 2040 | 100% urban land use–75% Imperviousness | Medium climate impact | Proposed in blocks 2% of block area | Same as for Scenario 3 |
| S 7 | Future 100% urban land use and high climate impact and no wetland in blocks | 2040 | 100% urban land use–75% Imperviousness | High climate impact | None proposed | Same as for Scenario 3 |
| S 8 | Future100% urban land use and high climate impact and wetland in blocks | 2040 | 100% urban land use–75% Imperviousness | Medium climate impact | Proposed in blocks 2% of block area | Same as for Scenario 3 |
| Rainfall-Runoff Parameters | MW Guidelines, 2022 [30] |
|---|---|
| Soil storage capacity (mm) | 120 |
| Field capacity (mm) | 50 |
| Zone description | Normal range |
| Large Residential (Lot size 601–1000 m2) | 0.5–0.8 |
| Standard densities (Lot size 300–600 m2) | 0.7–0.8 |
| High densities (Lot size < 300 m2) | 0.8–0.95 |
| Wetland Design Parameter | Block 1A | Block 1B | Block 2 | Block 3 | Block 4 | Block 5 |
|---|---|---|---|---|---|---|
| Low flow bypass (m3/s) | 0 | 0 | 0 | 0 | 0 | 0 |
| High flow bypass (m3/s) | 100 | 100 | 100 | 100 | 100 | 100 |
| Inlet pond volume (m3) | 5000 | 39,000 | 53,000 | 64,000 | 34,000 | 83,000 |
| Surface area (m2) | 50,000 | 390,000 | 530,000 | 640,000 | 340,000 | 830,000 |
| Extended detention depth (m) | 0.35 | 0.35 | 0.35 | 0.35 | 0.35 | 0.35 |
| Permanent pool volume (m3) | 20,000 | 156,000 | 212,000 | 256,000 | 136,000 | 332,000 |
| Initial volume (m3) | 20,000 | 156,000 | 212,000 | 256,000 | 136,000 | 332,000 |
| Exfiltration rate (mm/h) | 0 | 0 | 0 | 0 | 0 | 0 |
| Evaporative Loss as % of PET | 125 | 125 | 125 | 125 | 125 | 125 |
| Equivalent Pipe Diameter (mm) | 220 | 600 | 700 | 775 | 575 | 875 |
| Overflow Weir width (m) | 3 | 3 | 3 | 3 | 3 | 3 |
| Notional Detention Time (h) | 73 | 76 | 76 | 75 | 73 | 77 |
| Land Use | Event | Concentration (mg/L) | |||||
|---|---|---|---|---|---|---|---|
| TSS | TP | TN | |||||
| Mean | St. Dev | Mean | St. Dev | Mean | St. Dev | ||
| Agricultural | Base flow | 25.12 | 1.35 | 0.13 | 1.35 | 1.18 | 1.35 |
| Storm flow | 199.53 | 2.04 | 0.54 | 2.00 | 3.89 | 1.82 | |
| Urban–mixed | Base flow | 12.59 | 1.48 | 0.15 | 1.55 | 2.09 | 1.32 |
| Storm flow | 158.49 | 2.09 | 0.35 | 1.78 | 2.63 | 1.55 | |
| Description | Water Balance (ML/Year) | |||||||
|---|---|---|---|---|---|---|---|---|
| Block 1A | Block 1B | Block 2 | Block 3 | Block 4 | Block 5 | Total | ||
| Existing Agricultural and climate scenarios 1 and 2 | (S 1) Total outflow without wetlands | 147.46 | 1187.56 | 1597.91 | 1923.06 | 1033.45 | 2505.05 | 8394 |
| ET Loss from wetlands | 73.43 | 579.45 | 784.72 | 946.41 | 504.78 | 1229.36 | 4118 | |
| (S 2) Total outflow with wetlands | 74.03 | 608.11 | 813.19 | 976.65 | 528.67 | 1275.69 | 4276 | |
| Future Urban Development, Low Climate Impact Scenarios 3 and 4 | (S 3) Total outflow without wetlands | 678.45 | 5463.75 | 7351.74 | 8847.67 | 4754.72 | 11,525.32 | 38,622 |
| ET Loss from wetlands | 91.41 | 713.61 | 969.80 | 1171.17 | 622.00 | 1518.95 | 5087 | |
| (S 4) Total outflow with wetlands | 578.04 | 4750.14 | 6381.94 | 7676.50 | 4132.72 | 10,006.37 | 33,526 | |
| Future Urban Development, Medium Climate Impact Scenarios 5 and 6 | (S 5) Total outflow without wetlands | 636.87 | 5128.88 | 6901.15 | 8305.39 | 4463.30 | 10,818.93 | 36,255 |
| ET Loss from wetlands | 92.91 | 725.52 | 985.98 | 1190.66 | 632.35 | 1544.33 | 5172 | |
| (S 6) Total outflow with wetlands | 543.96 | 4403.36 | 5915.17 | 7114.73 | 3830.95 | 9274.60 | 31,083 | |
| Future Urban Development, High Climate Impact Scenarios 7 and 8 | (S 7) Total outflow without wetlands | 562.18 | 4527.36 | 6091.77 | 7331.33 | 3939.84 | 9550.08 | 32,002 |
| ET Loss from wetlands | 93.72 | 731.95 | 994.69 | 1201.09 | 637.94 | 1558.02 | 5217 | |
| (S 8) Total outflow with wetlands | 468.46 | 3795.41 | 5097.08 | 6130.24 | 3301.90 | 7992.06 | 26,785 | |
| Development Condition & Climate Impact and Blocks (B) | TSS (Tons/Year) | TP (Tons/Year) | TN (Tons/Year) | |||||||
|---|---|---|---|---|---|---|---|---|---|---|
| Load without Weland | Load with Wetland | % Removal | Load without Wetland | Load with Wetland | % Removal | Load without Wetland | Load with Wetland | % Removal * | ||
| Existing Agricultural | B 1A | 25.6 | 0.5 | 98.04 | 0.06 | 0.004 | 92.97 | 0.49 | 0.08 | 84.23 |
| B 1B | 203.8 | 3.8 | 98.11 | 0.58 | 0.037 | 93.55 | 4.00 | 0.66 | 83.47 | |
| B 2 | 240.7 | 5.1 | 97.87 | 0.75 | 0.050 | 93.32 | 5.19 | 0.85 | 83.68 | |
| B 3 | 321.6 | 6.1 | 98.09 | 0.86 | 0.060 | 93.03 | 6.13 | 1.01 | 83.45 | |
| B 4 | 172.7 | 3.4 | 98.05 | 0.47 | 0.032 | 93.00 | 3.51 | 0.56 | 83.91 | |
| B 5 | 406.8 | 8.0 | 98.04 | 1.14 | 0.078 | 93.12 | 8.38 | 1.33 | 84.06 | |
| Future Urban Development—Low-Impact Climate Scenario | B 1A | 131.7 | 12.4 | 90.55 | 0.28 | 0.06 | 77.53 | 1.89 | 0.90 | 52.33 |
| B 1B | 1048.4 | 79.9 | 92.38 | 2.23 | 0.44 | 80.44 | 15.89 | 6.64 | 58.21 | |
| B 2 | 1468.8 | 91.2 | 93.79 | 2.95 | 0.55 | 81.48 | 21.72 | 8.98 | 58.64 | |
| B 3 | 1736.4 | 106.6 | 93.86 | 3.63 | 0.66 | 81.81 | 25.54 | 10.27 | 59.78 | |
| B 4 | 954.3 | 73.2 | 92.33 | 1.91 | 0.38 | 80.18 | 13.26 | 5.59 | 57.80 | |
| B 5 | 2484.3 | 134.5 | 94.58 | 4.58 | 0.83 | 81.90 | 32.90 | 13.07 | 60.29 | |
| Future Urban Development—Medium-Impact Climate Scenario | B 1A | 128.29 | 12.1 | 90.60 | 0.25 | 0.06 | 77.57 | 1.84 | 0.85 | 53.97 |
| B 1B | 1045.5 | 76.9 | 92.64 | 2.09 | 0.39 | 81.18 | 14.83 | 6.03 | 59.36 | |
| B 2 | 1451.7 | 92.5 | 93.62 | 2.81 | 0.52 | 81.38 | 19.45 | 7.72 | 60.33 | |
| B 3 | 1668.7 | 93.8 | 94.37 | 3.44 | 0.60 | 82.54 | 23.63 | 9.37 | 60.32 | |
| B 4 | 904.7 | 60.5 | 93.32 | 1.77 | 0.33 | 81.35 | 12.71 | 5.19 | 59.14 | |
| B 5 | 2186.0 | 134.2 | 93.86 | 4.42 | 0.76 | 82.84 | 30.41 | 12.07 | 60.28 | |
| Future Urban Development—High-Impact Climate Scenario | B 1A | 112.8 | 8.7 | 92.24 | 0.23 | 0.04 | 80.12 | 1.66 | 0.72 | 56.56 |
| B 1B | 918.4 | 56.2 | 93.87 | 1.93 | 0.34 | 82.53 | 13.07 | 5.09 | 61.03 | |
| B 2 | 1160.8 | 63.1 | 94.56 | 2.55 | 0.43 | 83.05 | 17.92 | 6.85 | 61.80 | |
| B 3 | 1510.3 | 78.8 | 94.78 | 2.92 | 0.48 | 83.39 | 21.28 | 8.05 | 62.18 | |
| B 4 | 803.3 | 55.5 | 93.09 | 1.65 | 0.28 | 82.78 | 11.51 | 4.48 | 61.06 | |
| B 5 | 1878.3 | 91.3 | 95.14 | 3.97 | 0.62 | 84.49 | 27.32 | 9.90 | 63.77 | |
Disclaimer/Publisher’s Note: The statements, opinions and data contained in all publications are solely those of the individual author(s) and contributor(s) and not of MDPI and/or the editor(s). MDPI and/or the editor(s) disclaim responsibility for any injury to people or property resulting from any ideas, methods, instructions or products referred to in the content. |
© 2023 by the authors. Licensee MDPI, Basel, Switzerland. This article is an open access article distributed under the terms and conditions of the Creative Commons Attribution (CC BY) license (https://creativecommons.org/licenses/by/4.0/).
Share and Cite
Sharma, A.K.; Sanciolo, P.; Behroozi, A.; Navaratna, D.; Muthukumaran, S. Stormwater Harvesting Potential for Local Reuse in an Urban Growth Area: A Case Study of Melton Growth Area in the West of Melbourne. Water 2023, 15, 2093. https://doi.org/10.3390/w15112093
Sharma AK, Sanciolo P, Behroozi A, Navaratna D, Muthukumaran S. Stormwater Harvesting Potential for Local Reuse in an Urban Growth Area: A Case Study of Melton Growth Area in the West of Melbourne. Water. 2023; 15(11):2093. https://doi.org/10.3390/w15112093
Chicago/Turabian StyleSharma, Ashok K., Peter Sanciolo, Amir Behroozi, Dimuth Navaratna, and Shobha Muthukumaran. 2023. "Stormwater Harvesting Potential for Local Reuse in an Urban Growth Area: A Case Study of Melton Growth Area in the West of Melbourne" Water 15, no. 11: 2093. https://doi.org/10.3390/w15112093