
Design of Cost-Effective and Sustainable Treatments of Old Landslides Adapted to the Moroccan Road Network: A Case Study of Regional Road R410 Crossing the Rifan Structural Domain


Abstract
:1. Introduction
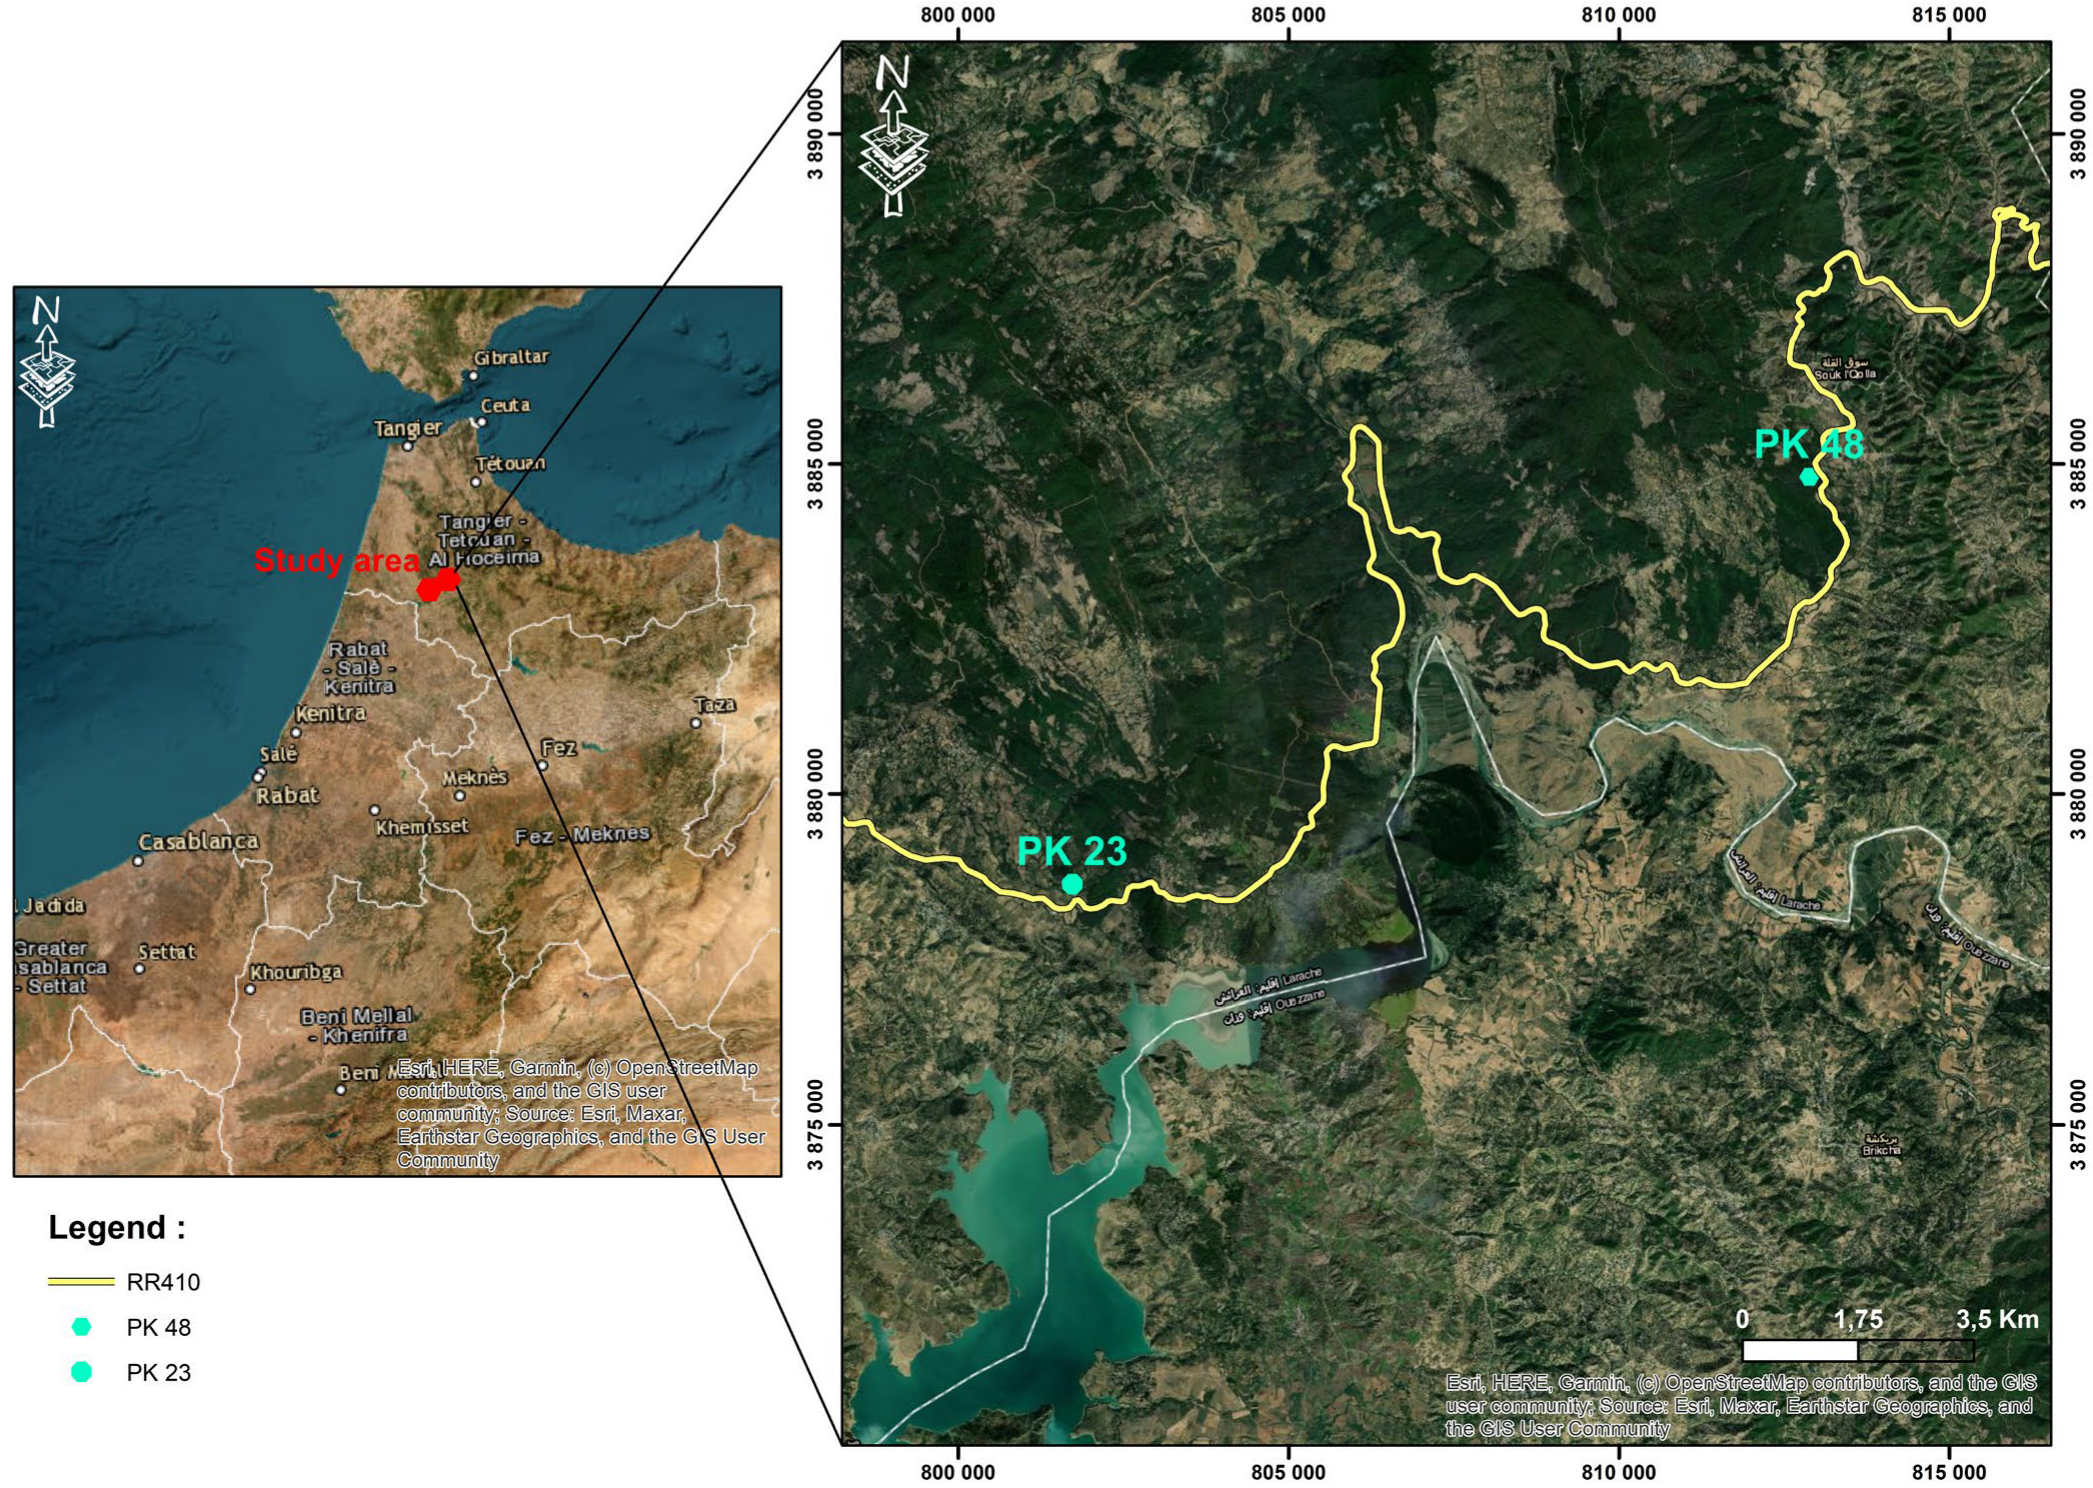
2. Study Area
2.1. Location
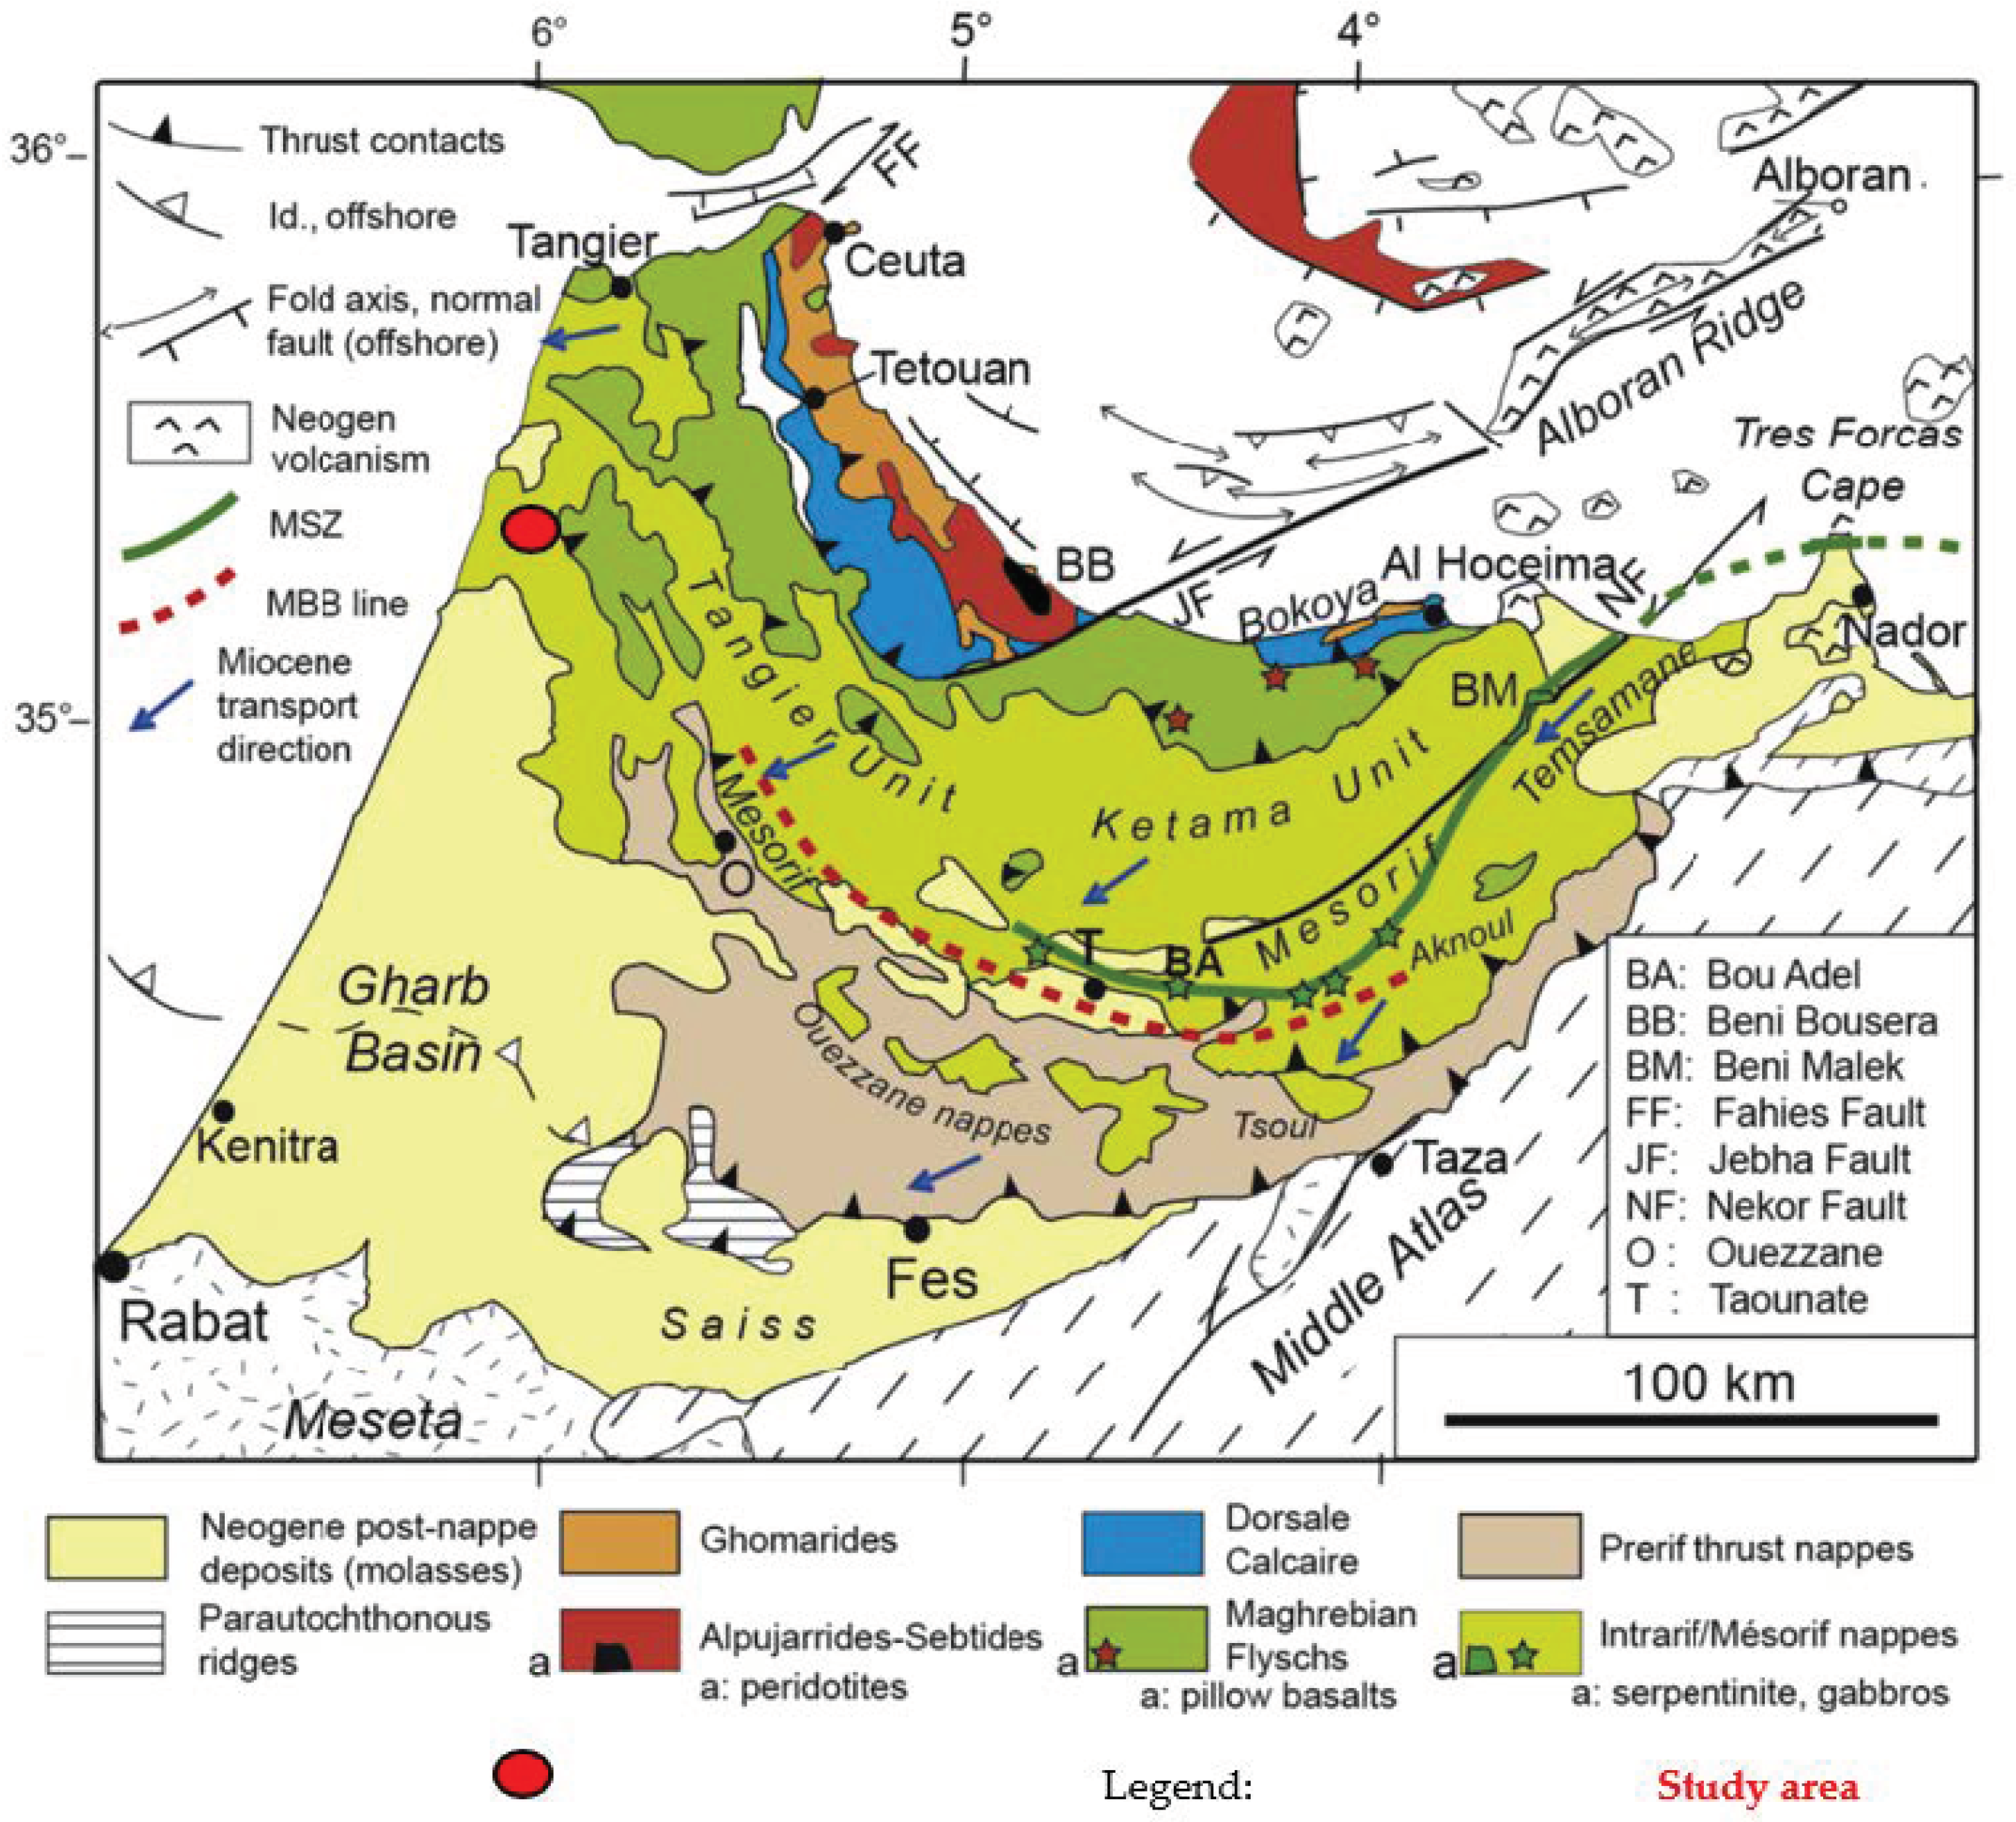
2.2. Geological Context of the Study Area
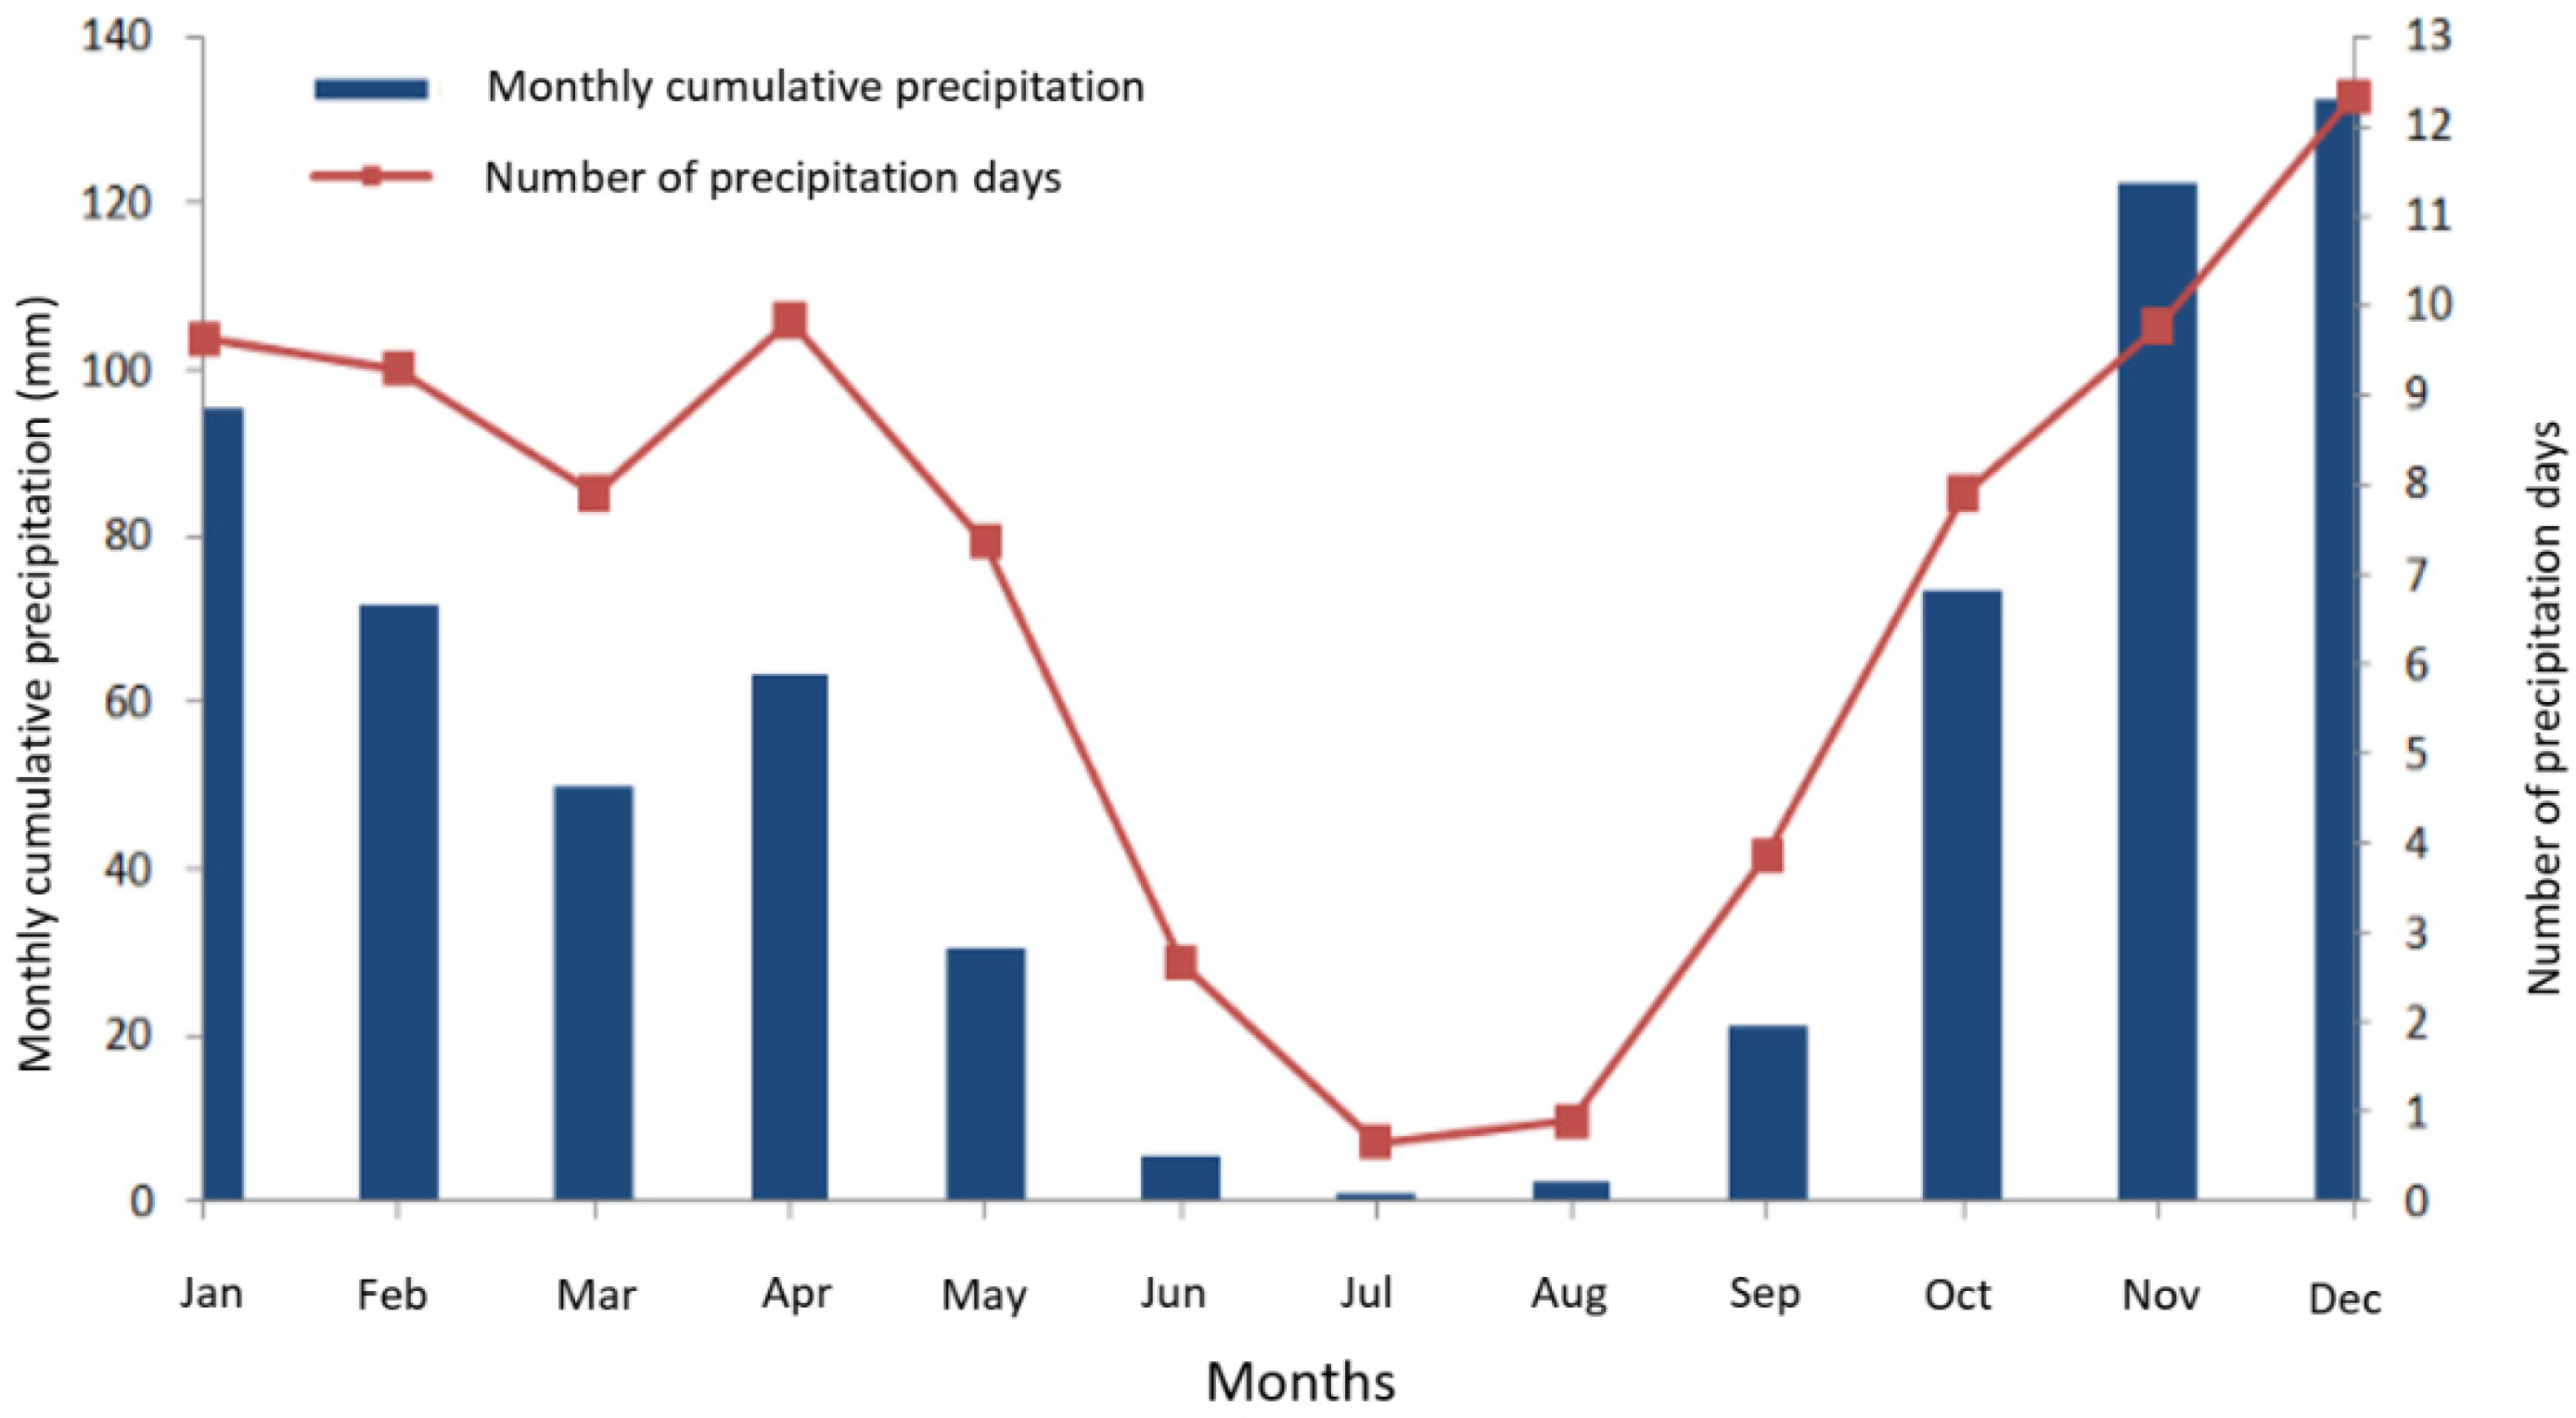
2.3. Rainfall Characteristics
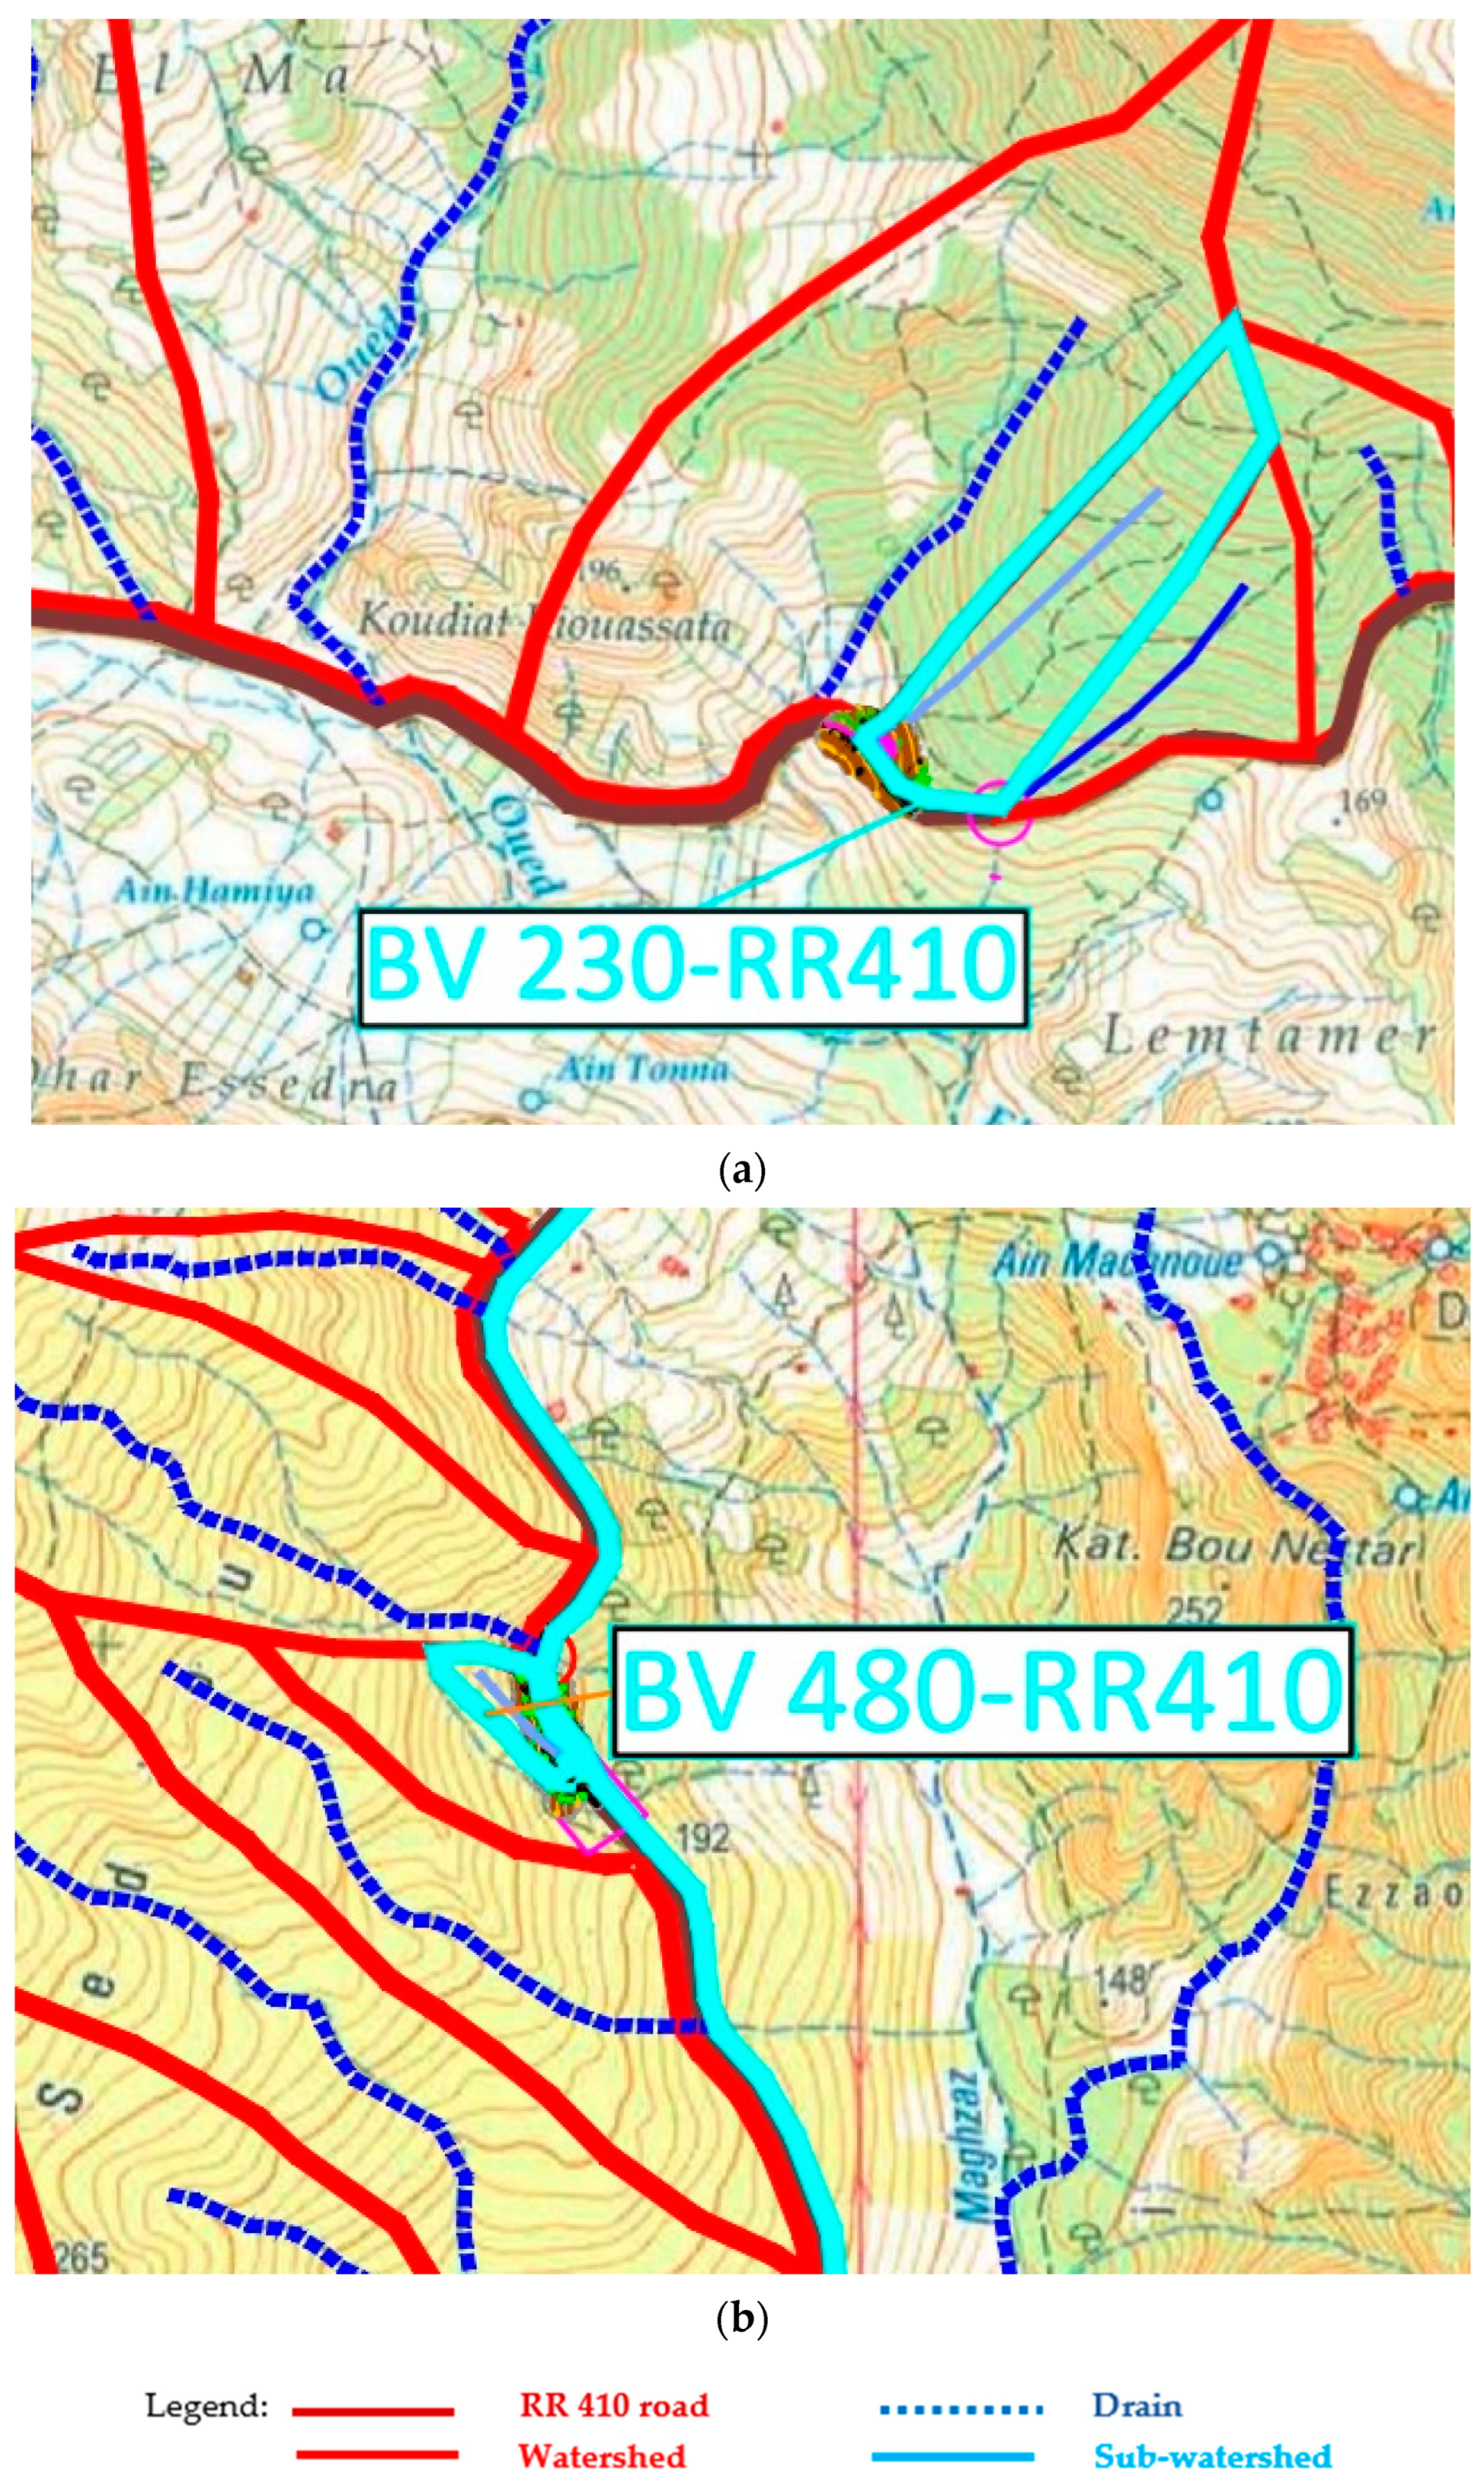
2.4. Hydrological Parameters
- The basin is broken down into subbasins with the same runoff capacity (same plant cover and same type of soil) for which the runoff coefficients are calculated.
- The surface runoff coefficients of these subbasins are weighted.
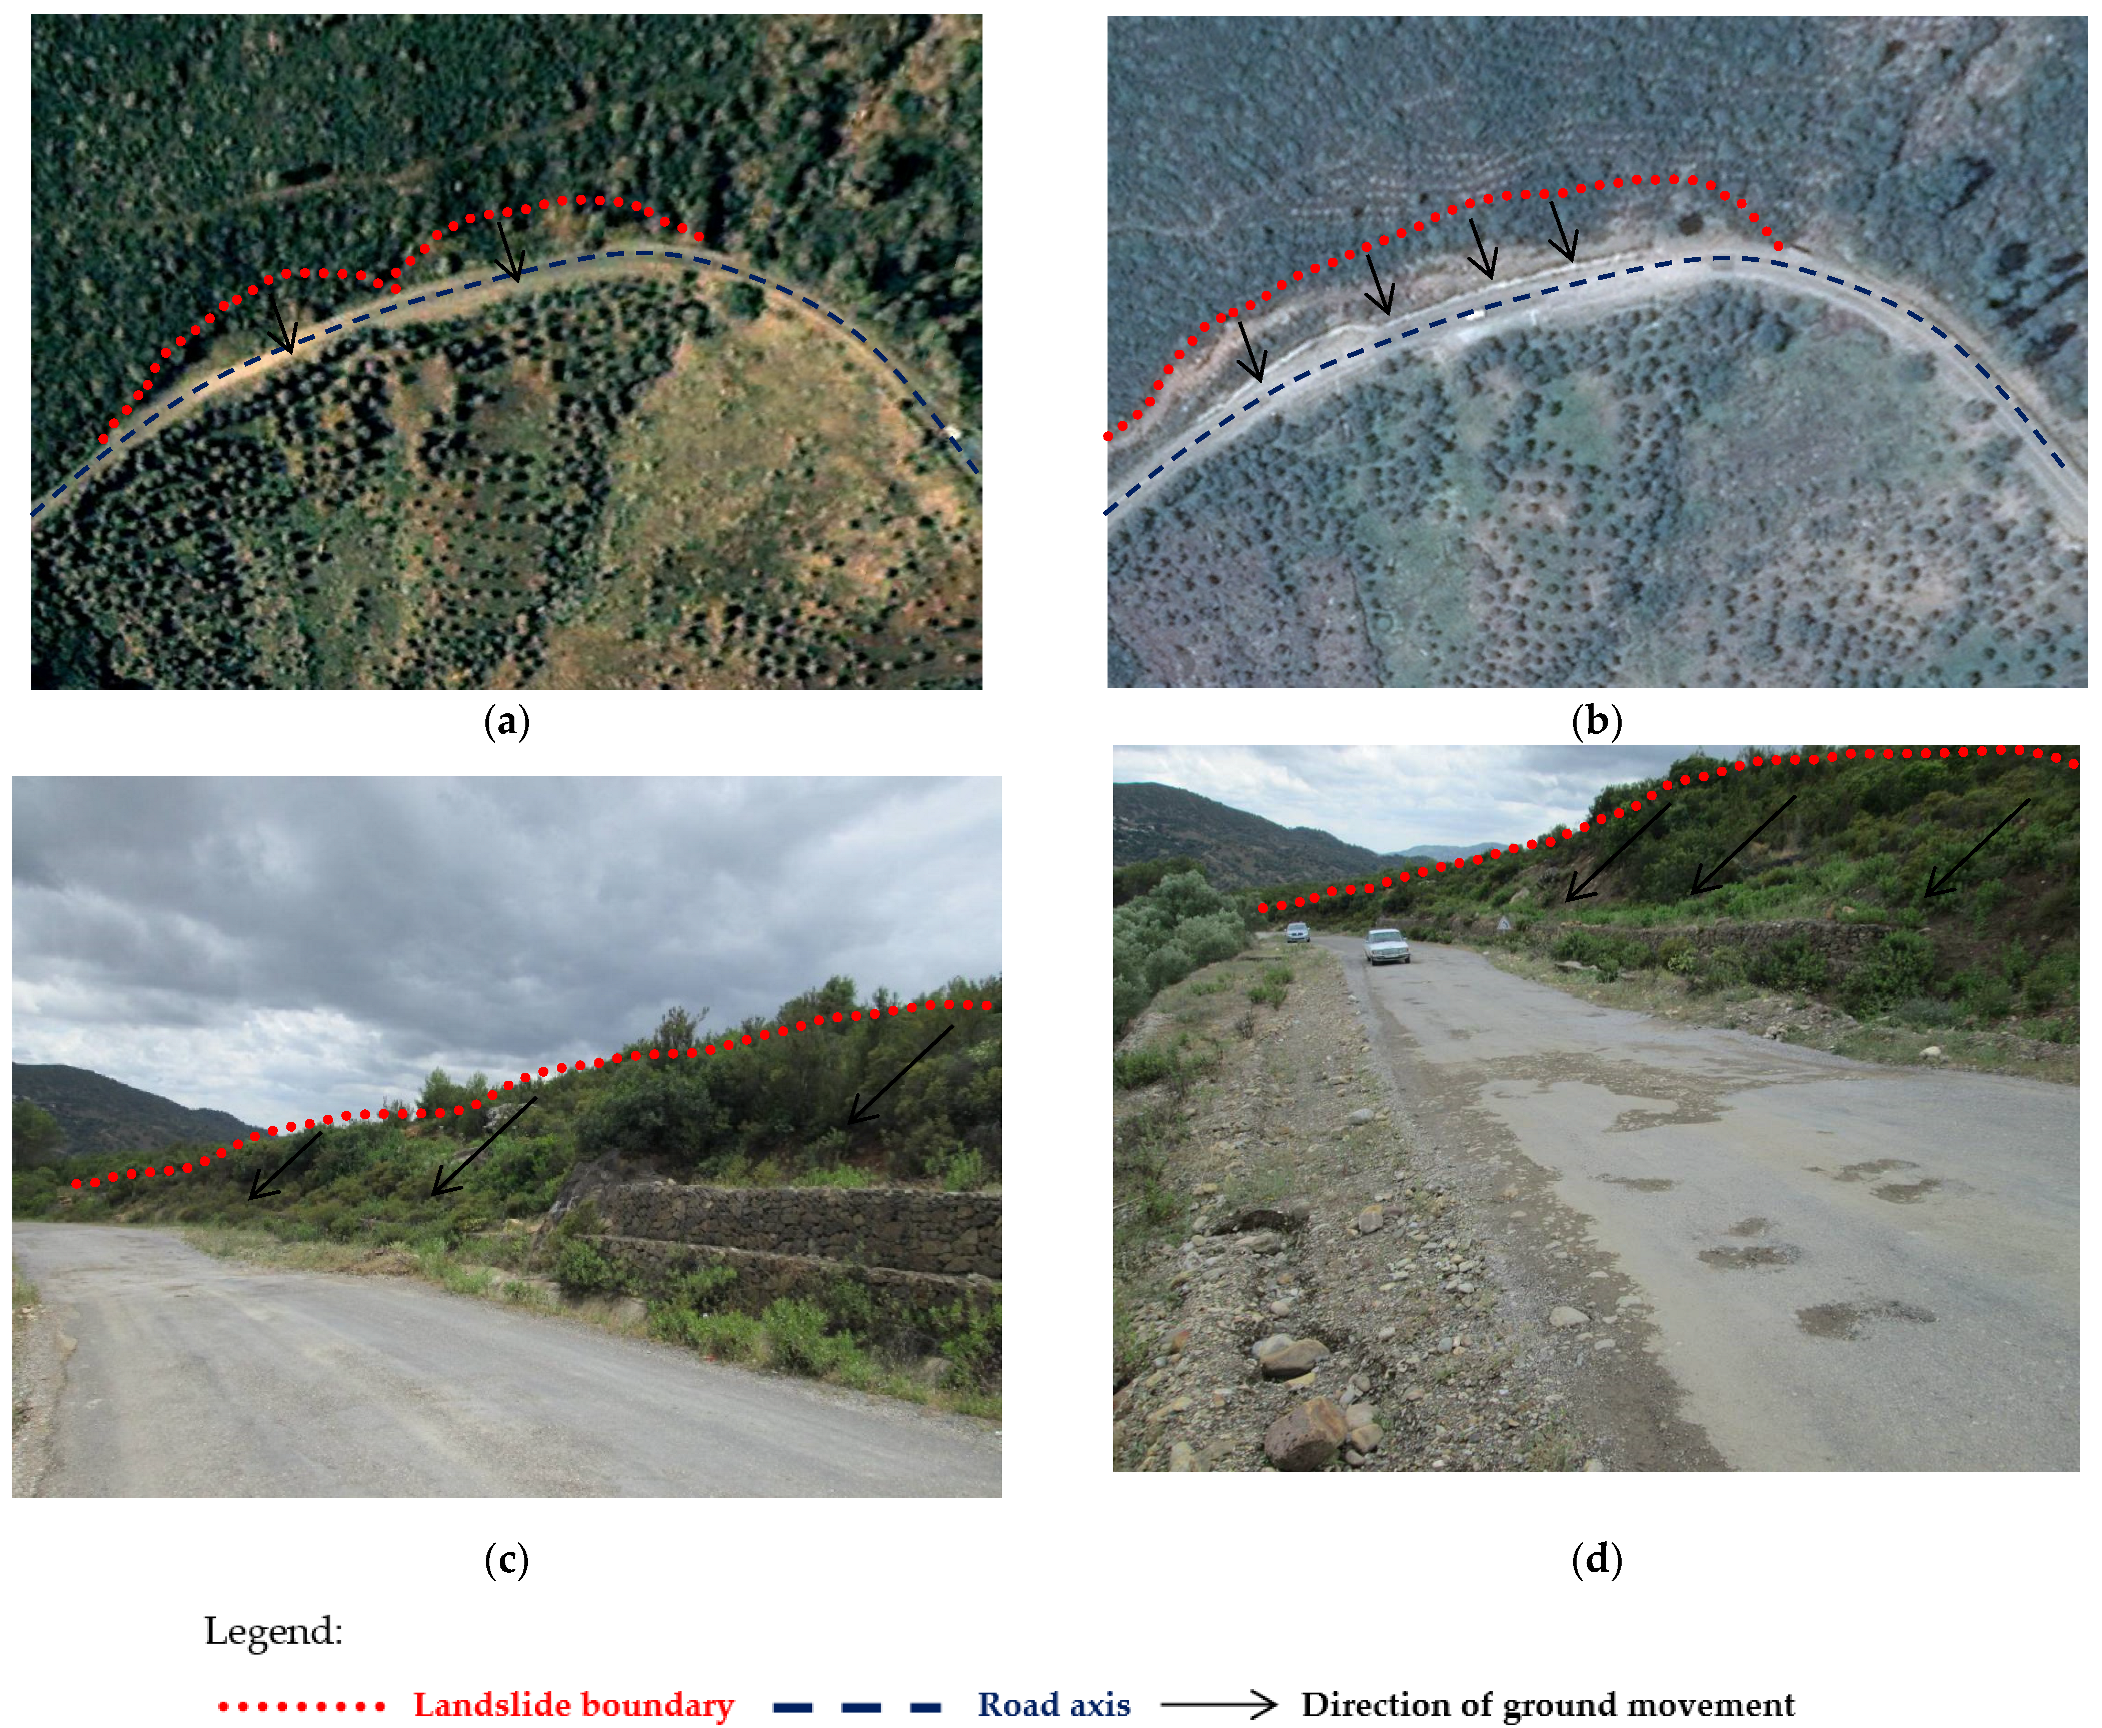
3. Observed Disorders
3.1. Kilometric Point 23
3.2. Kilometric Point 48
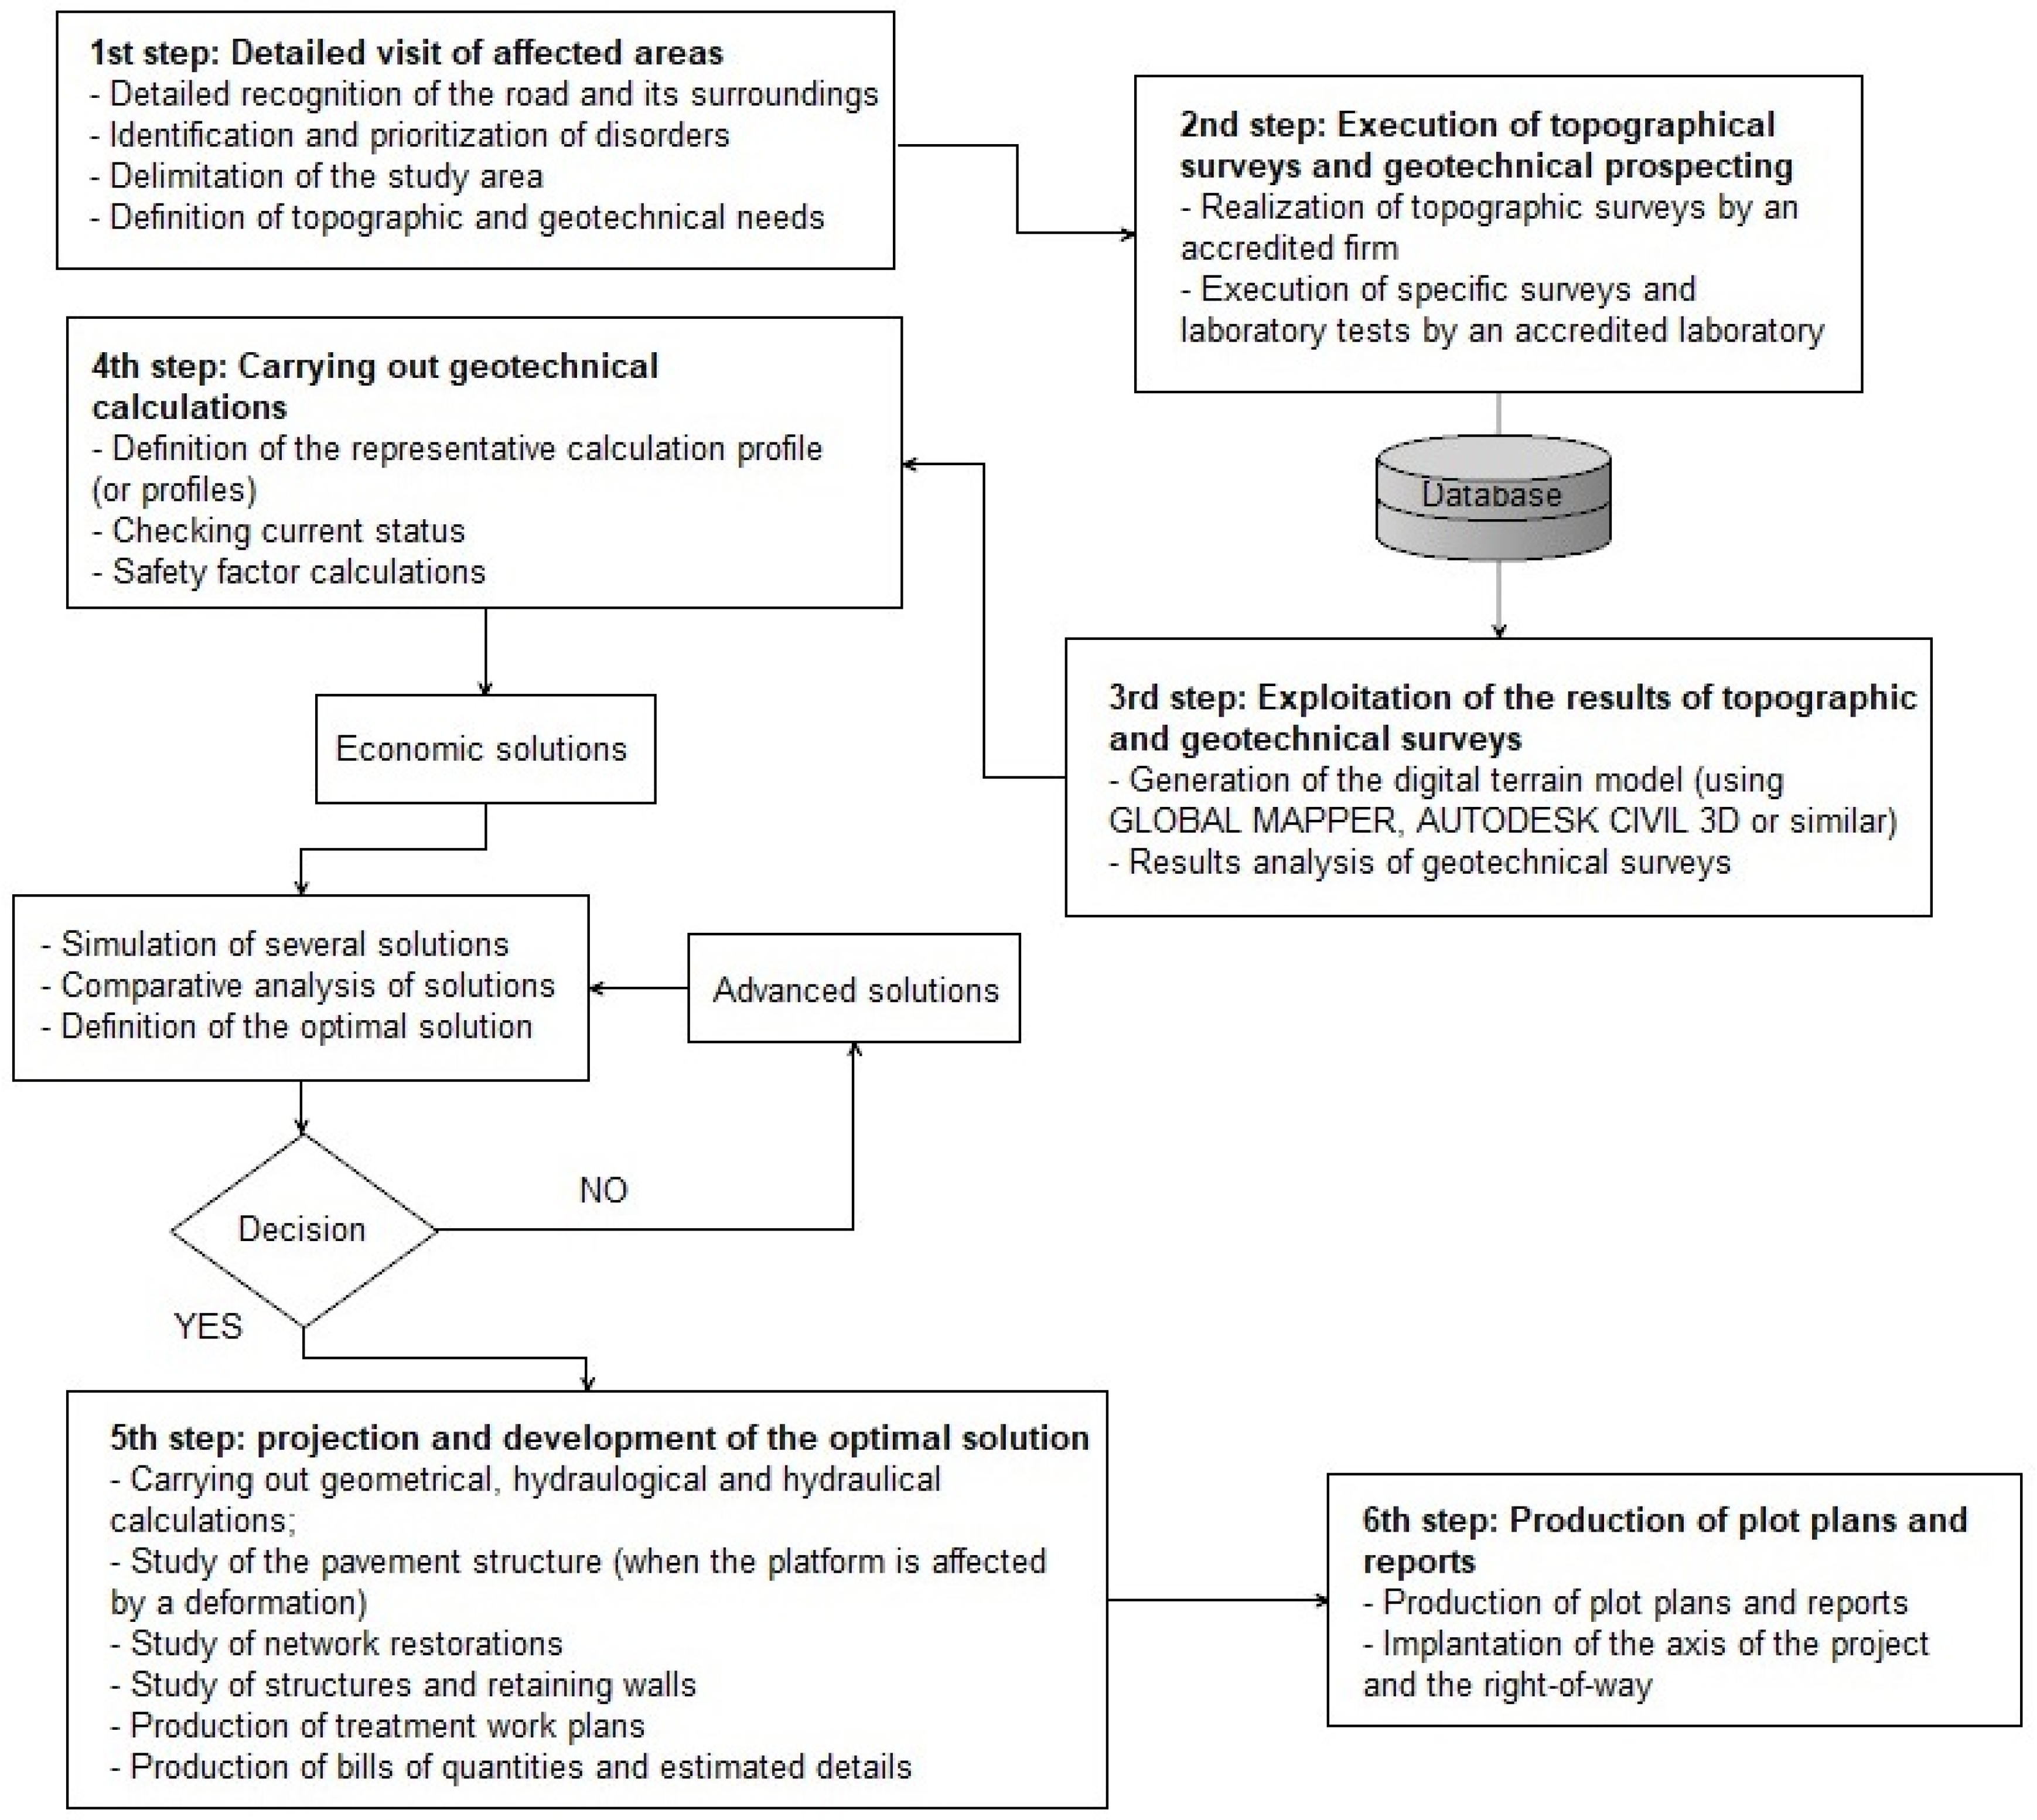
4. General Methodology
5. Field Investigations
5.1. Topographic Works
- Ground survey of the strip quoted at 1/1000: consisted of establishing a strip quoted at 1/1000 lifted on the ground, showing all the visible details in the defined strip (buildings, networks, roads, tracks, ridge lines, thalwegs, etc.);
- 1/500-rated plan: this task concerns hydraulic structures, crossroads, and restoration of various networks;
- Survey implementation: they were installed at X, Y, and Z coordinates, at the locations defined by the geotechnical program;
- Implementation and materialization of the project axis: this task is usually programmed at the end of the project and consists of the implementation and materialization of sustainable landmarks of the axis by the topographical team.
5.2. Hydrological Investigations
- Clogging of lateral water structures;
- Inadequate hydraulic openings for OH and grooves;
- Low flow velocity (too low gradient) leads to lack of self-cleaning of drains and promotes solids buildup;
- Inadequate capture of crest outflow;
- The embankment body is inadequately drained.
5.3. Geotechnical Investigations
- From 0 to 7 m depth: a first layer essentially formed of gravelly silts, with limiting pressures ranging from 0.49 to 1.03 MPa and pressure moduli ranging from 0.95 to 3.64 MPa;
- From 7 to 17 m depth: the ground is constituted of sandy silts, having limit pressures varying from 1.4 to 1.36 MPa and pressiometric modules between 3.1 and 13.11 MPa.
- From 0 to 5 m depth: a first layer of gravelly silt with limiting pressures of 0.78 to 1.11 MPa and pressure moduli varying from 2.67 MPa to 6.38 MPa;
- From 5 to 14.5 m depth: a second layer of friable shale with limiting pressures varying from 1.53 to 3.43 and pressure moduli between 2.86 and 5.45 MPa.
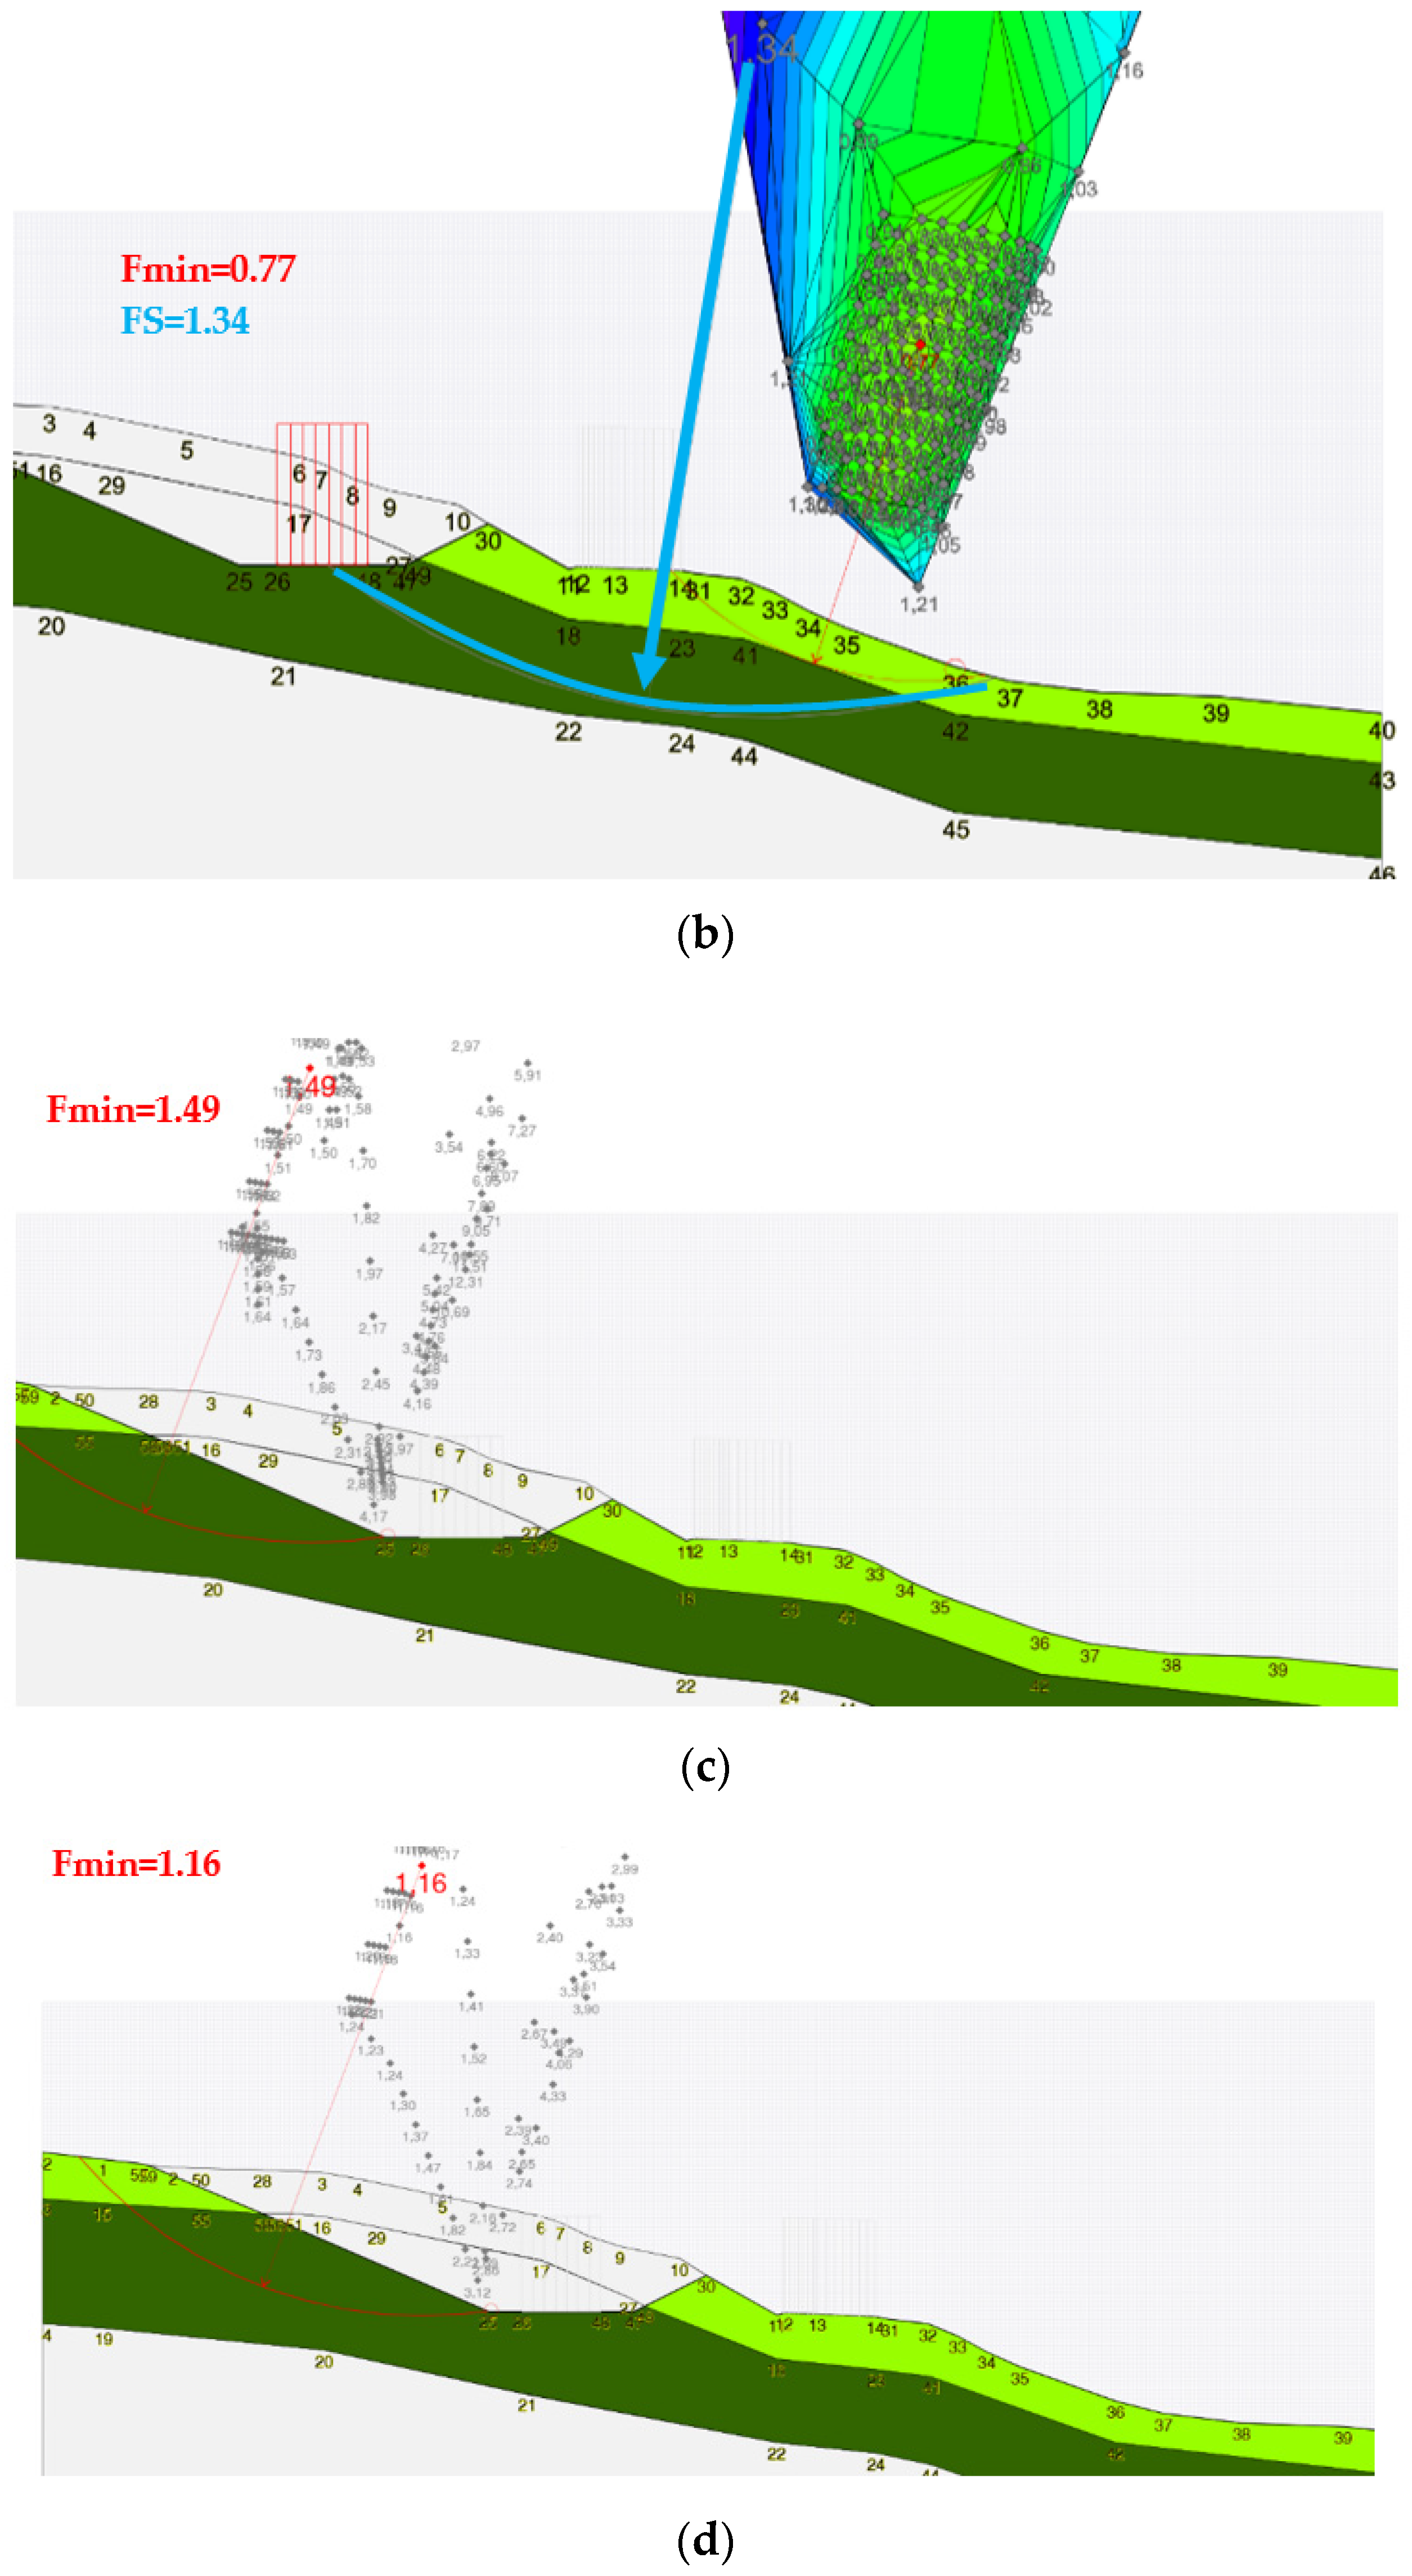
6. Slope Stability Analysis
6.1. General Calculation Assumptions
6.2. Initial Conditions
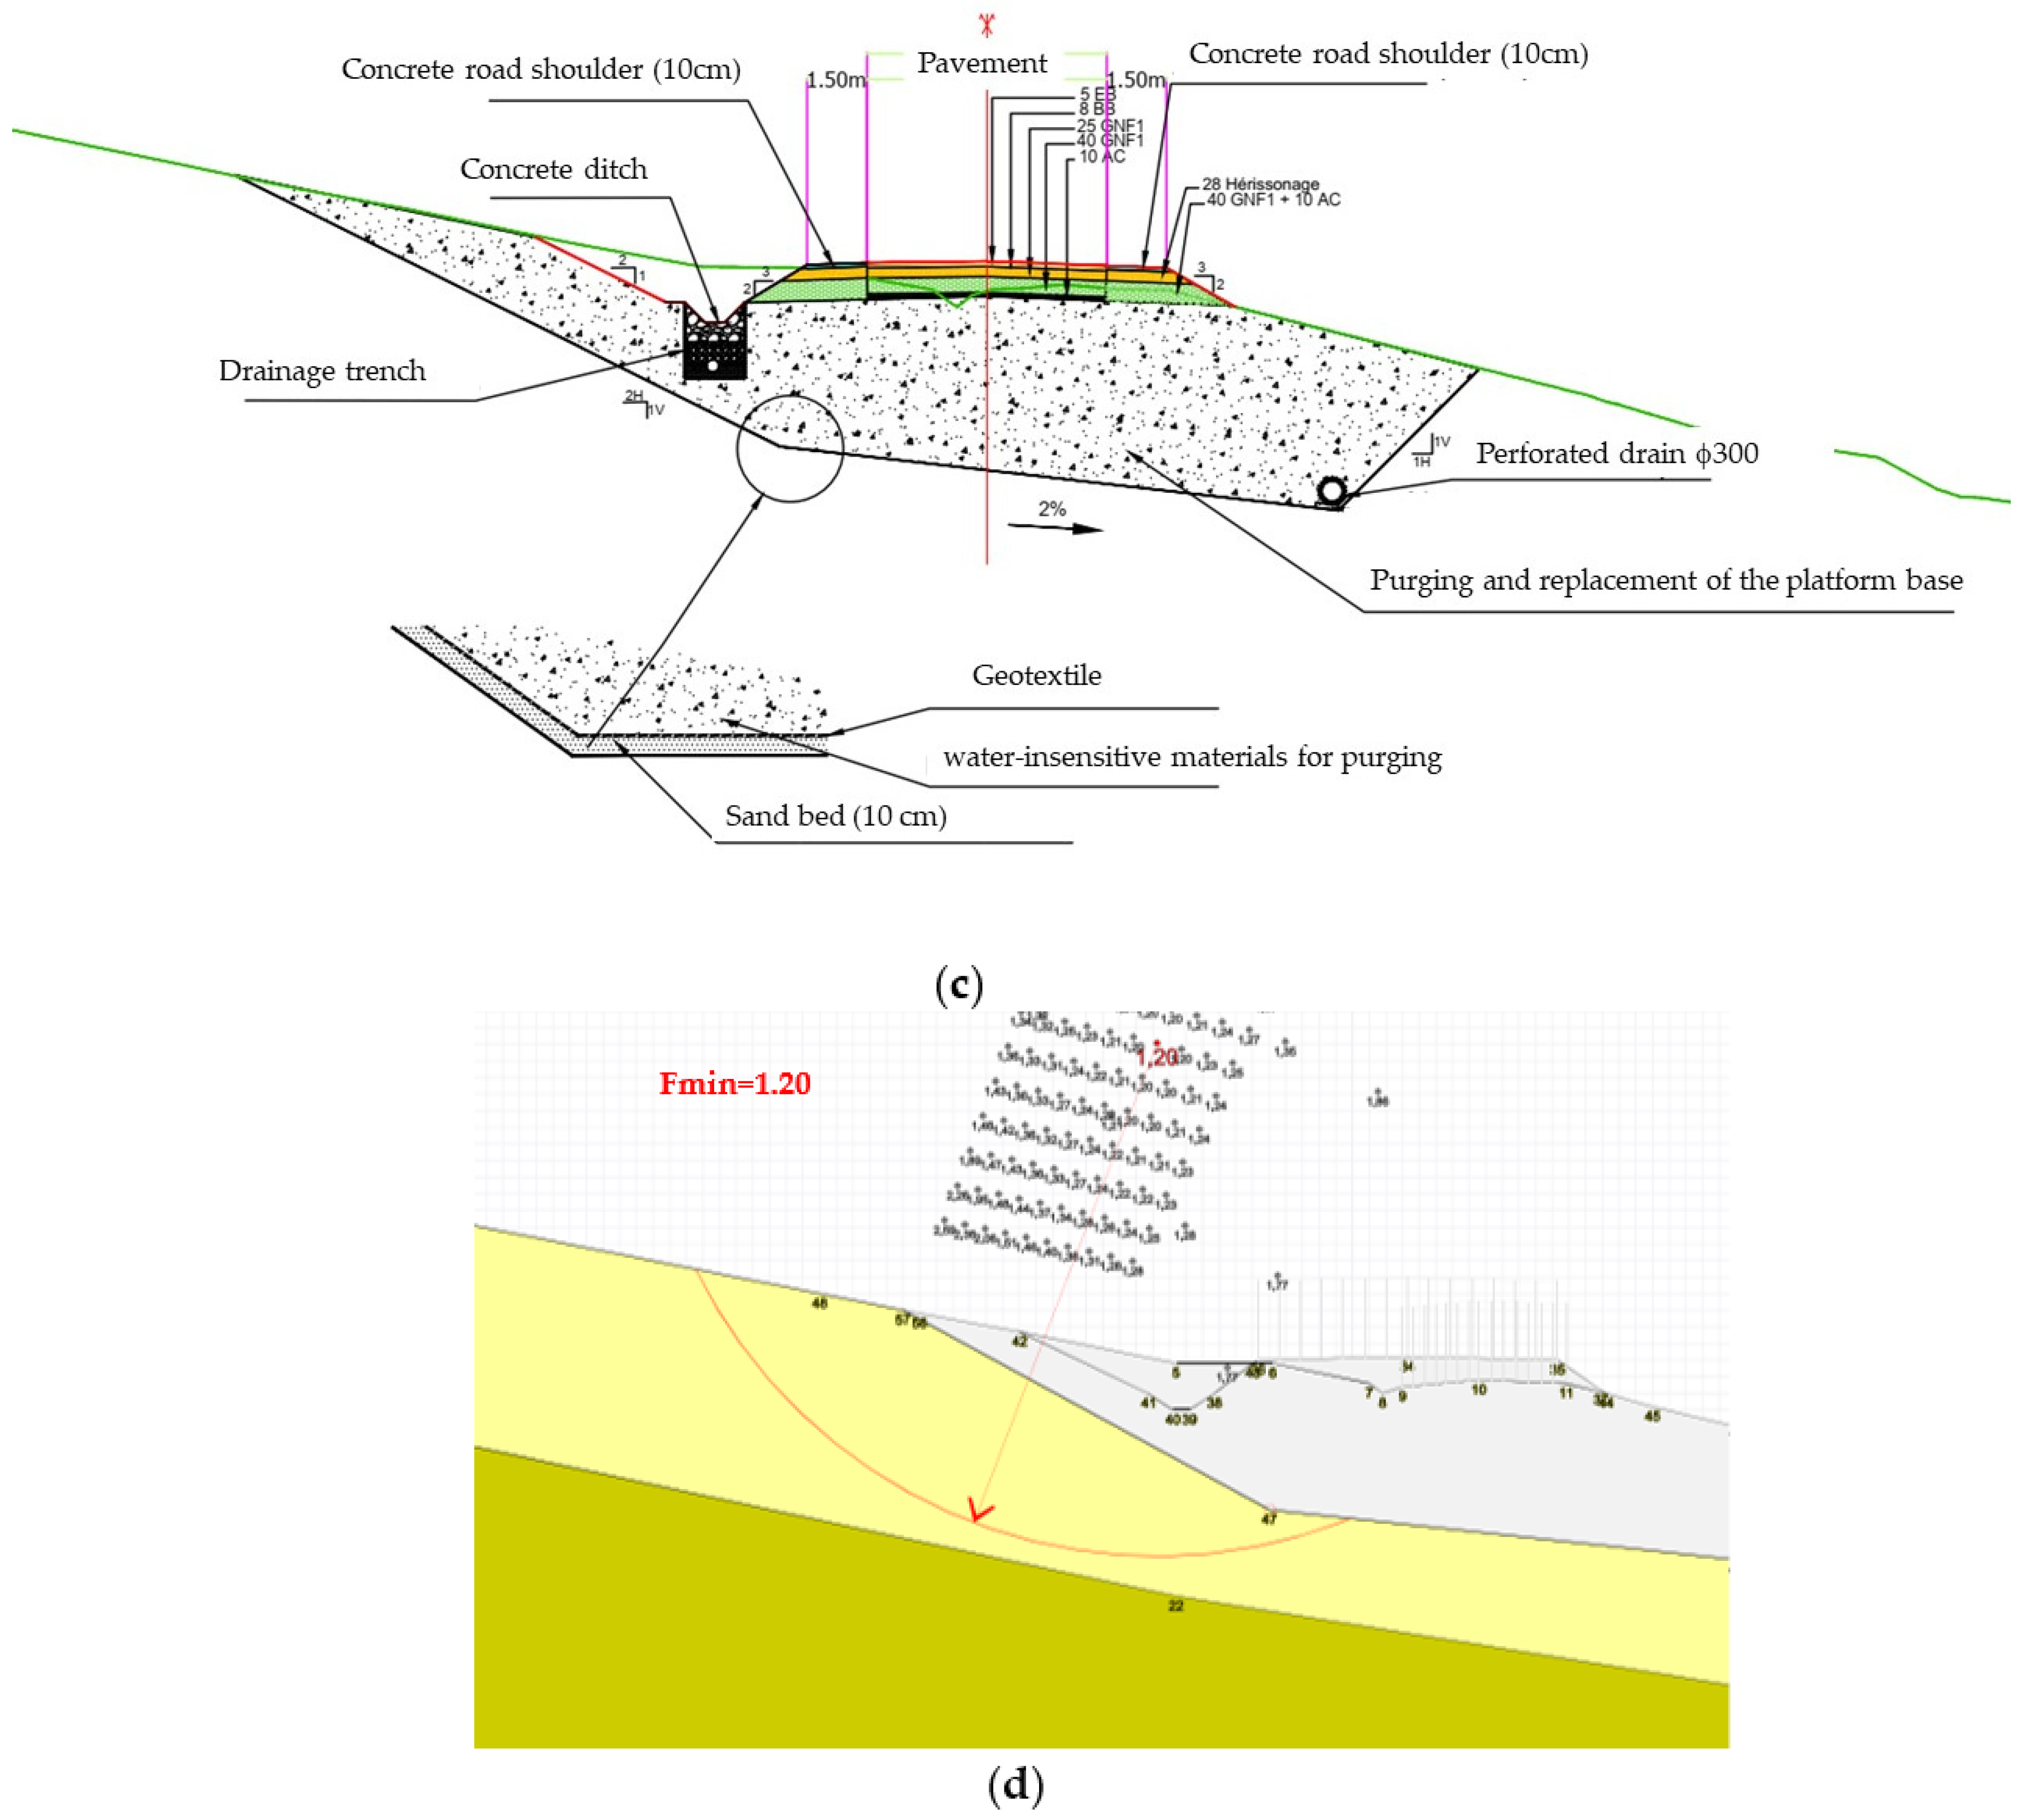
6.3. Result and Discussion
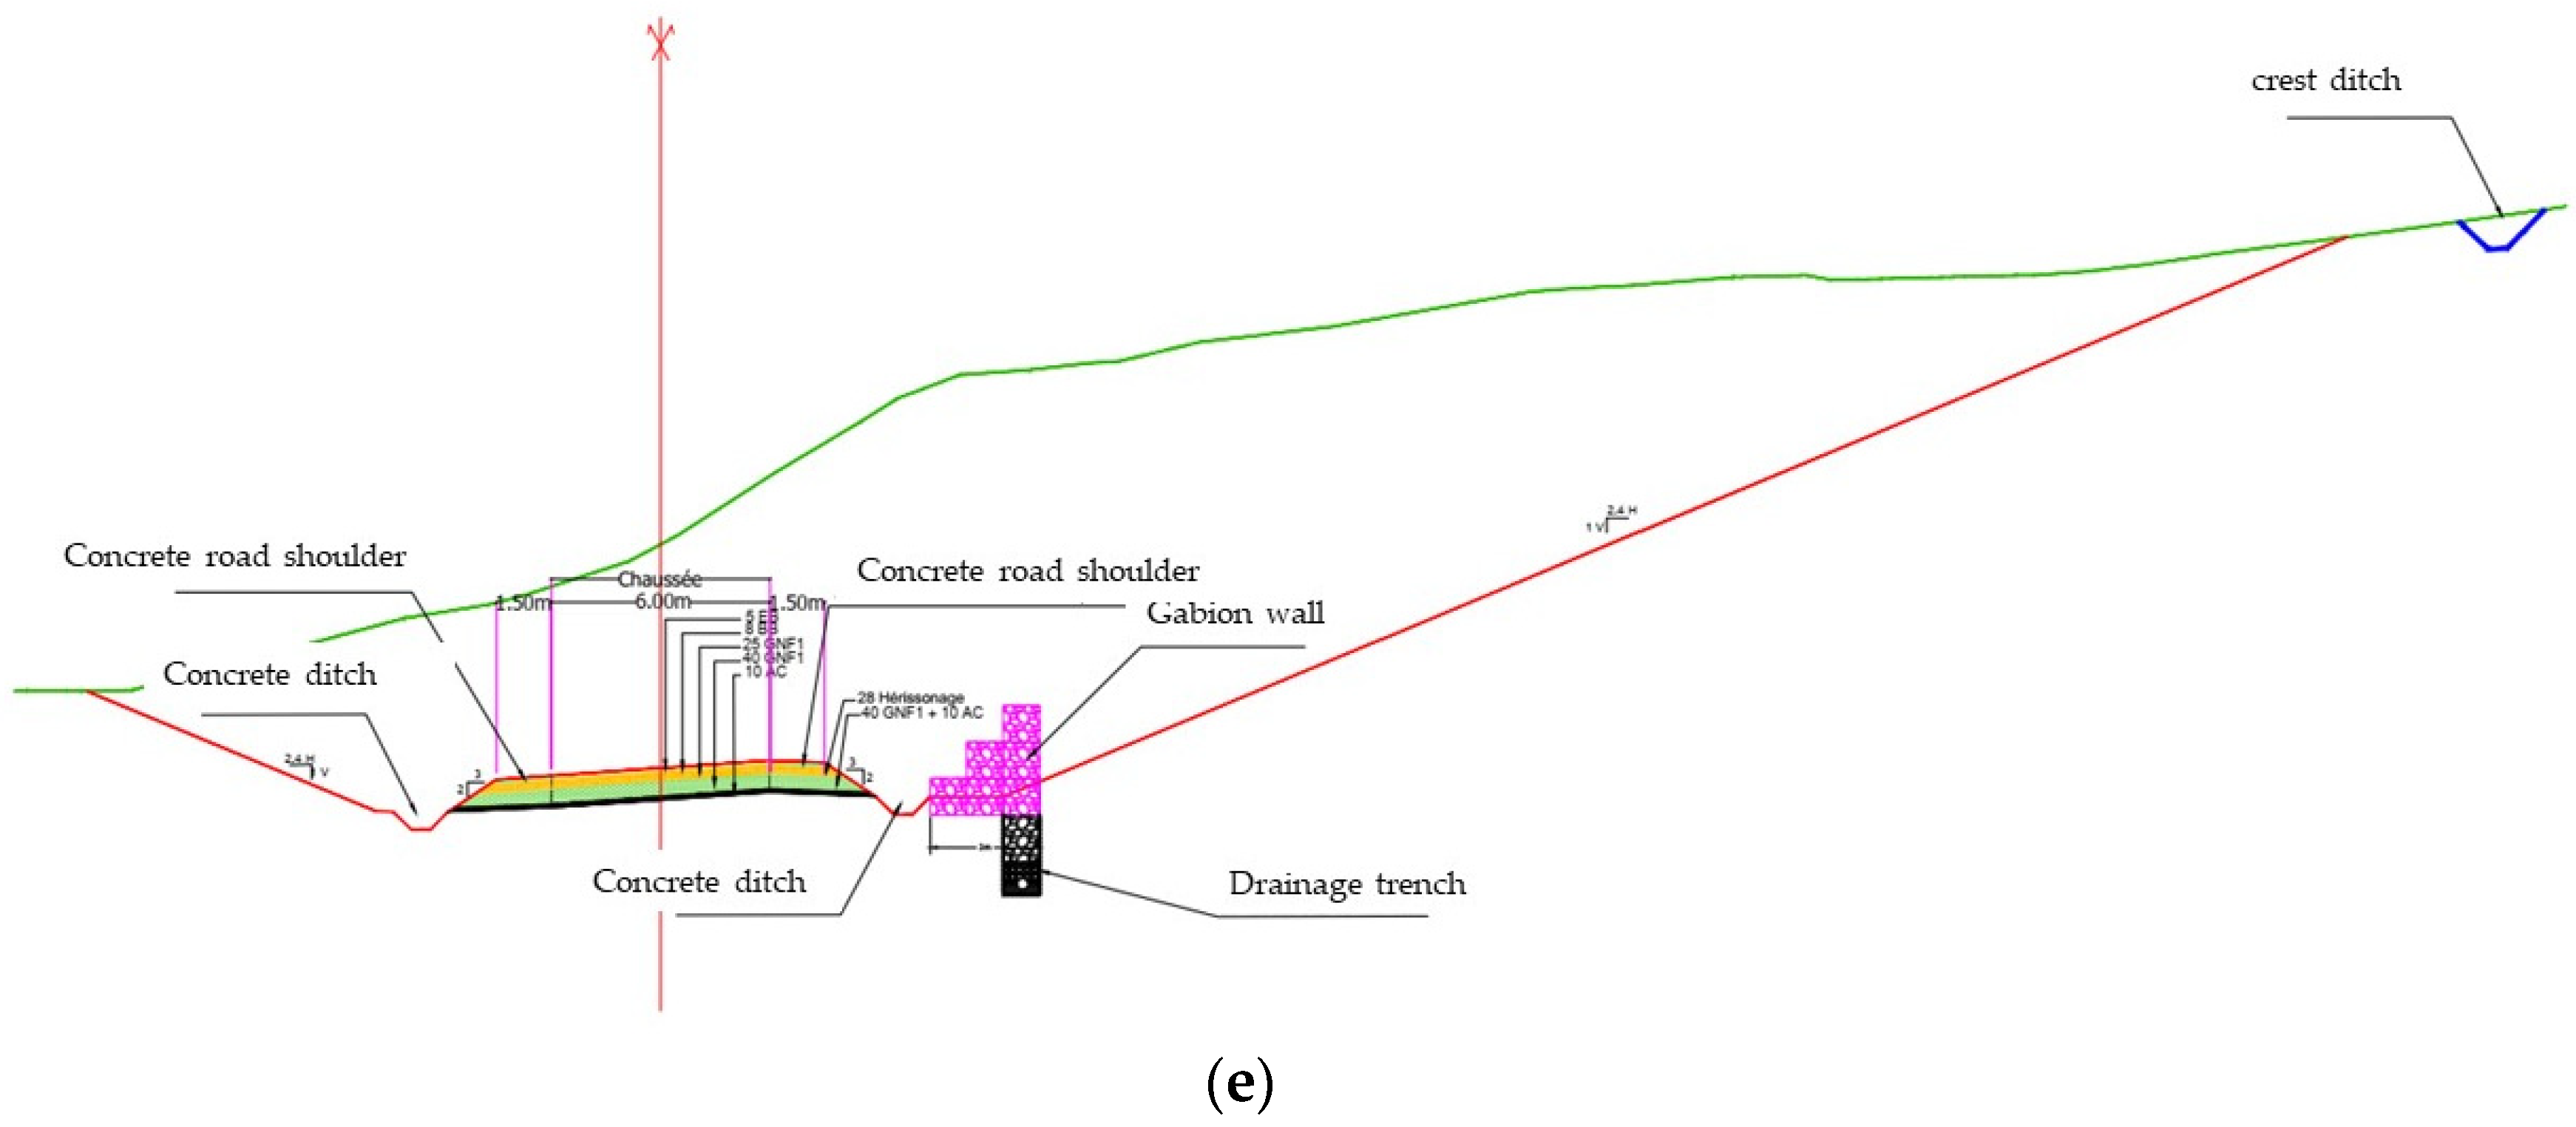
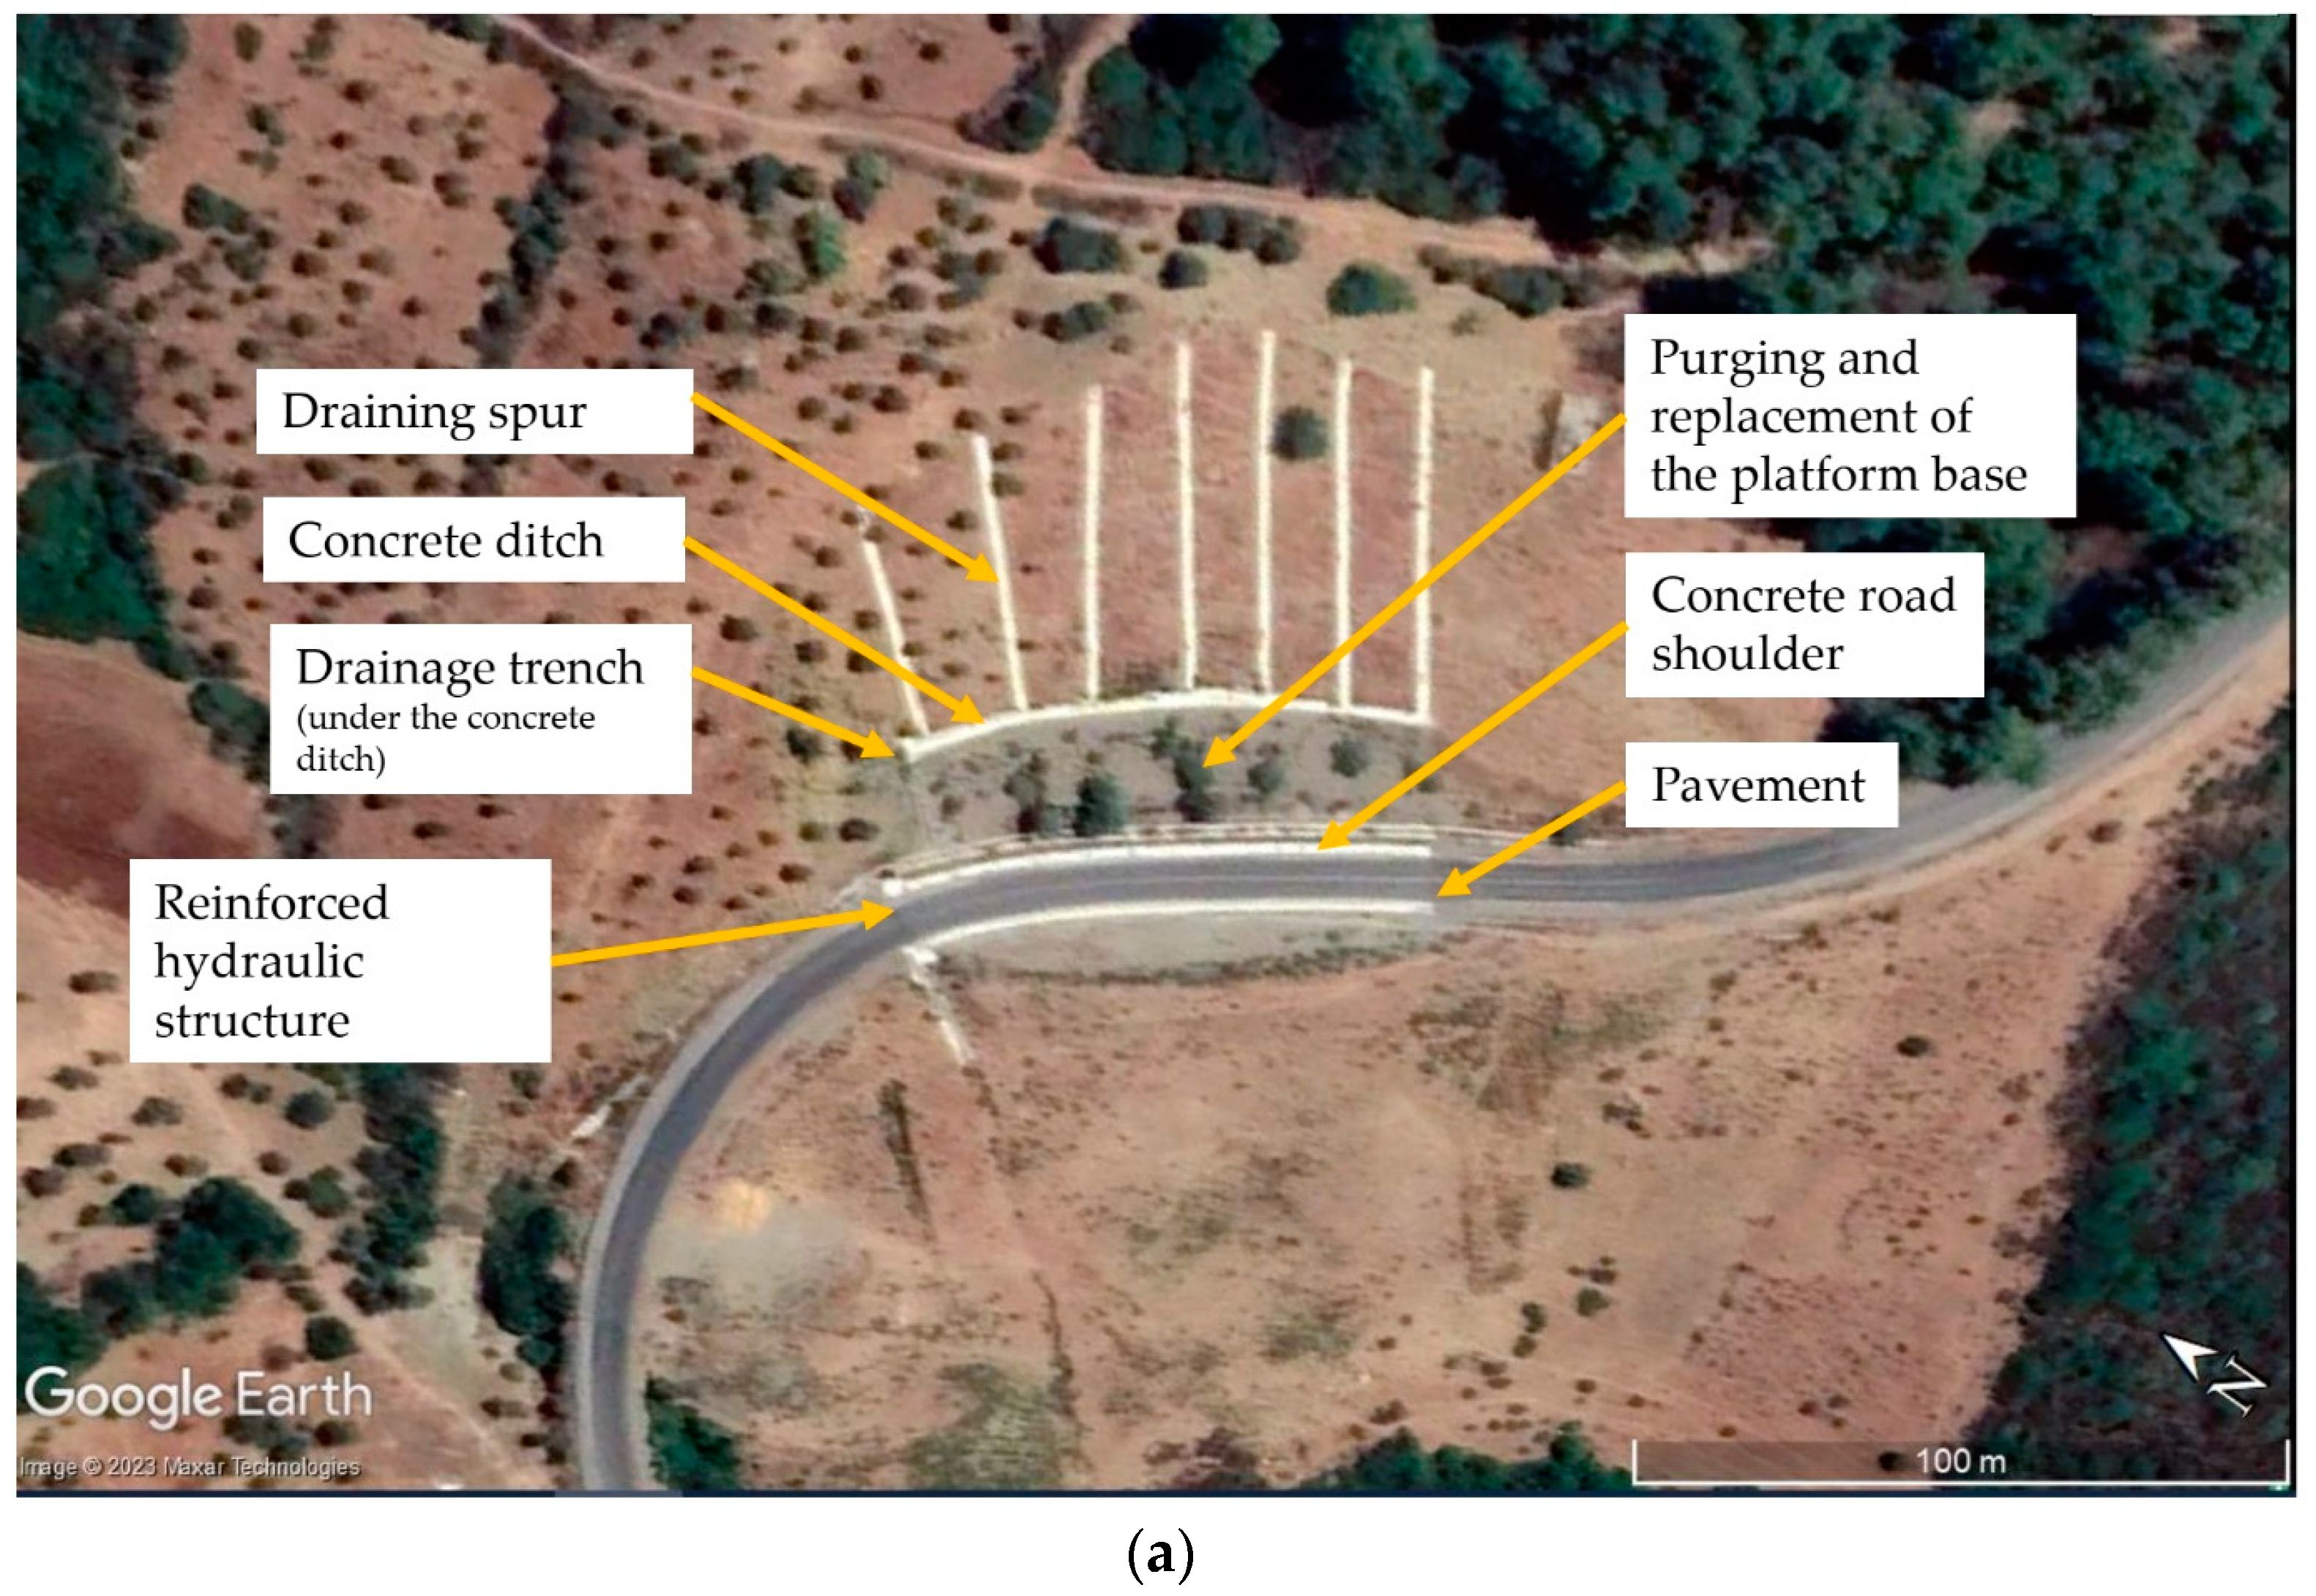
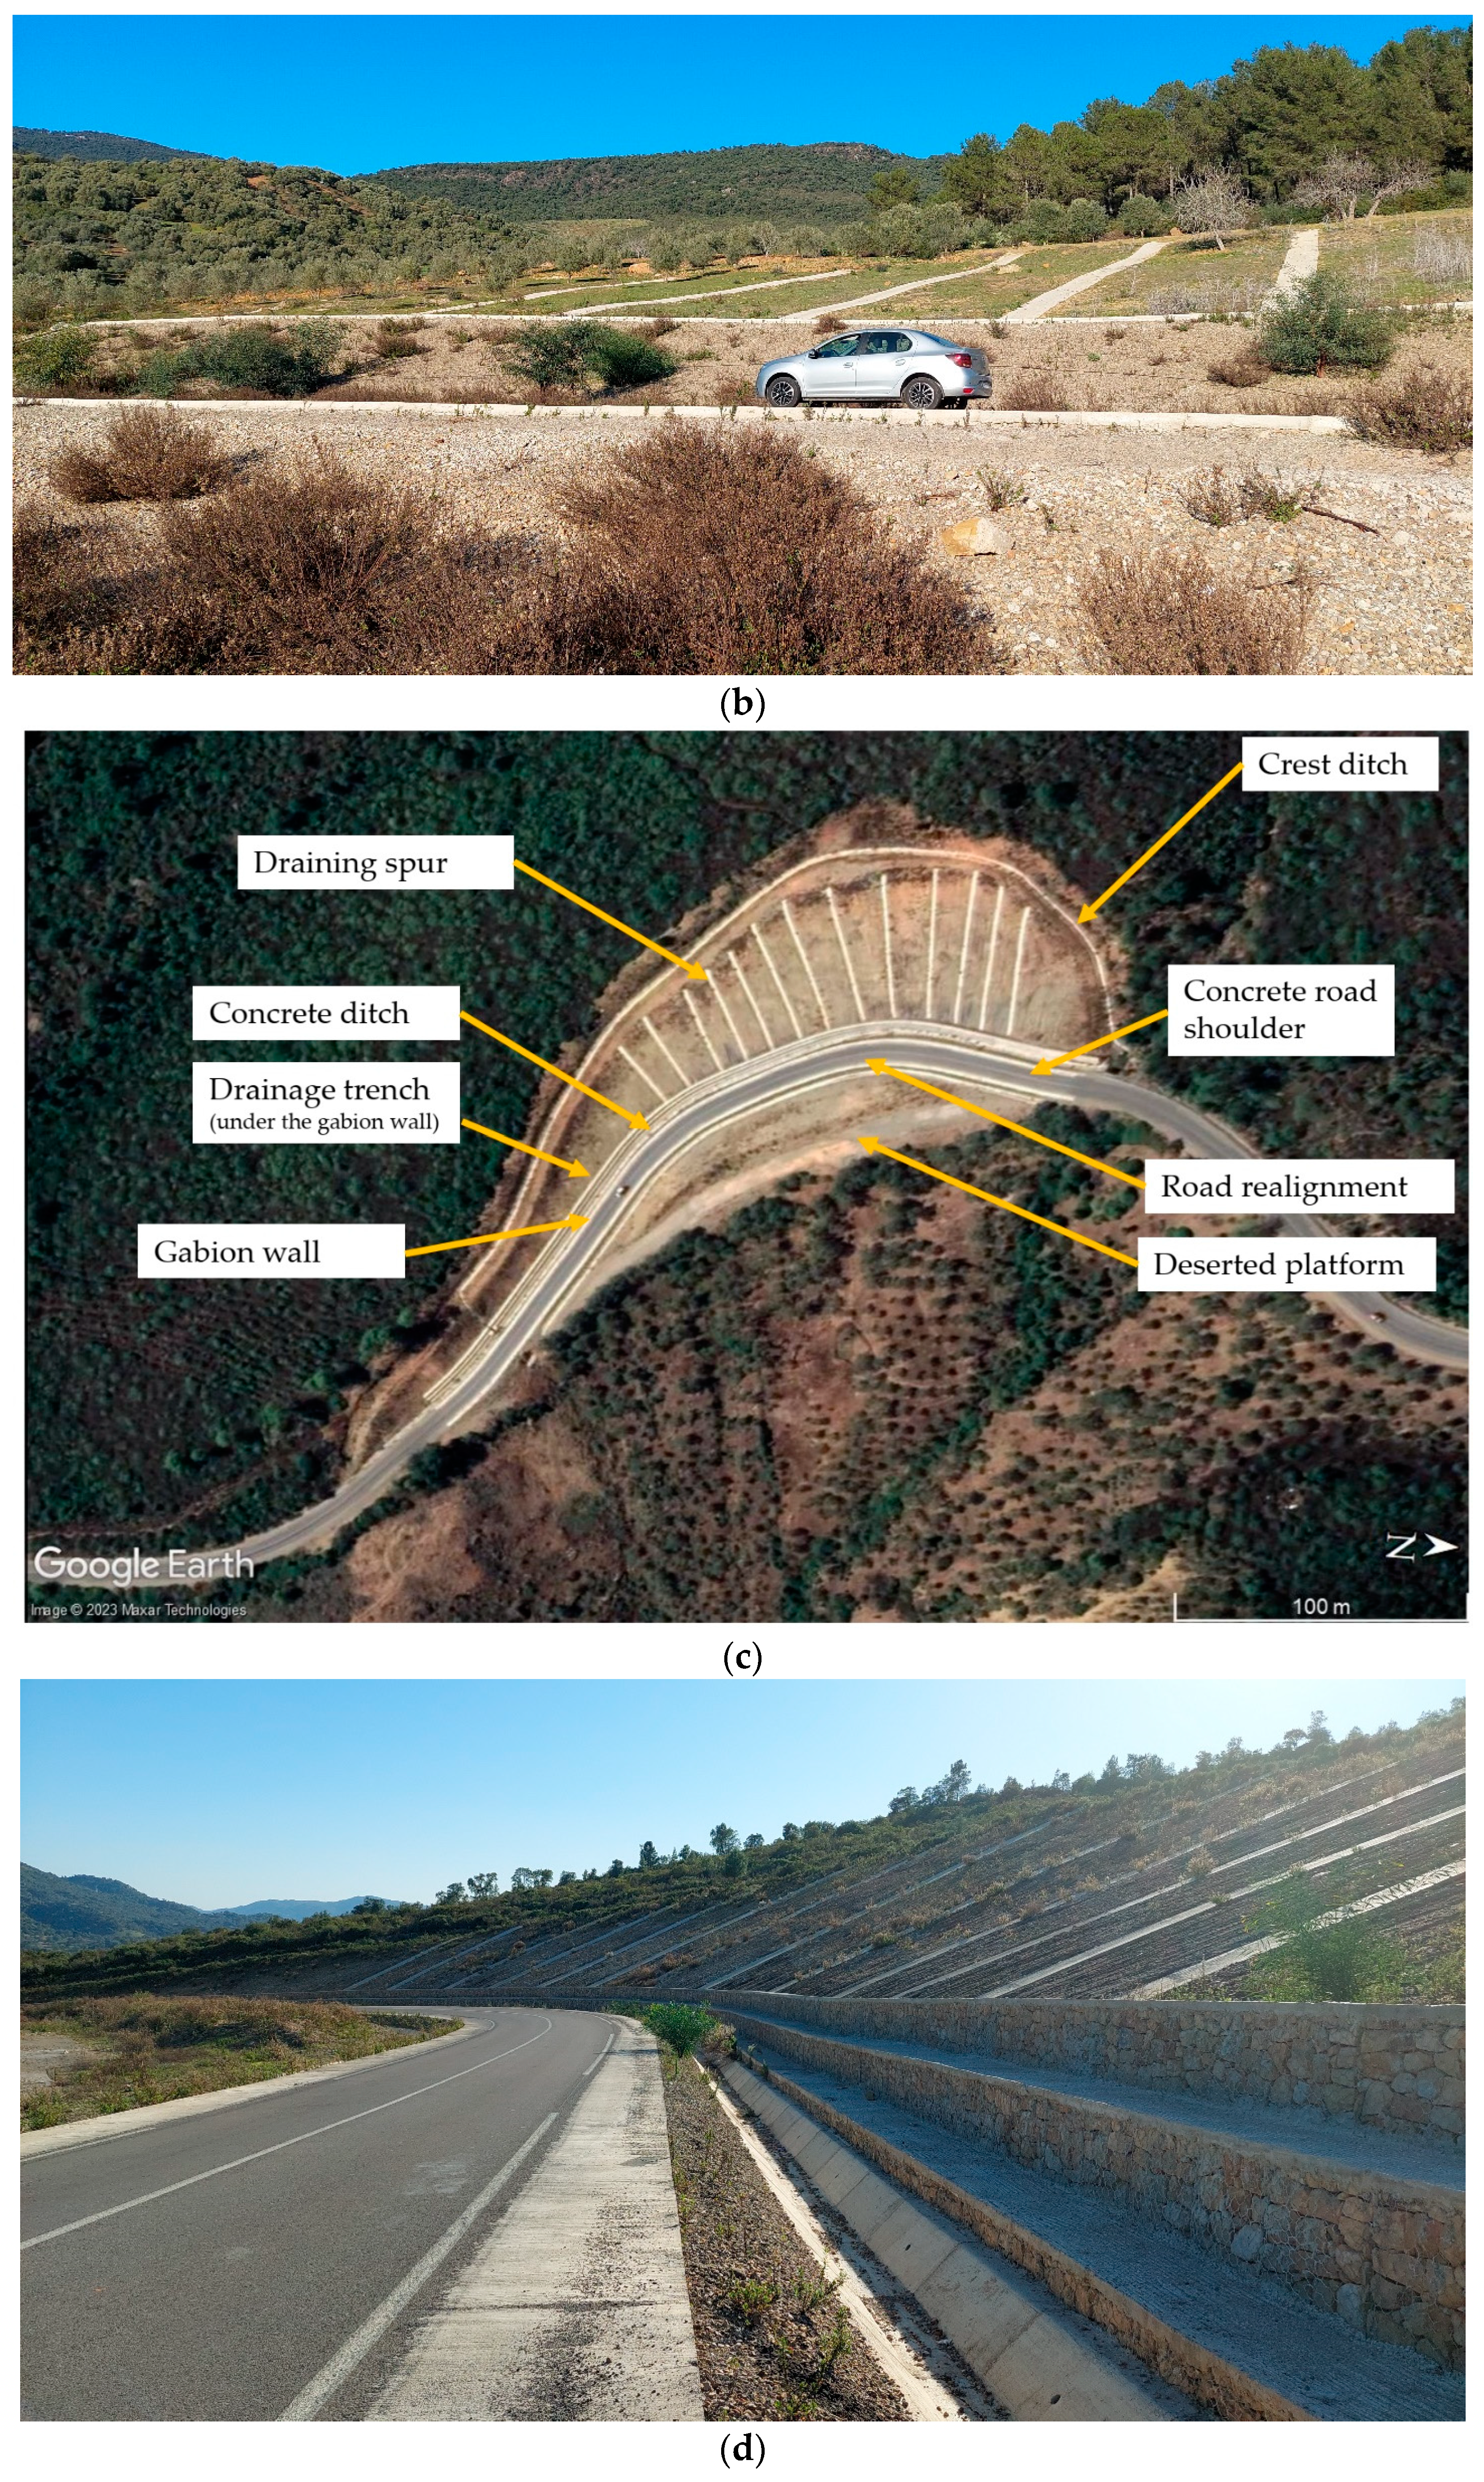
7. Execution of Works and Status after Completion
8. Conclusions
Author Contributions
Funding
Data Availability Statement
Acknowledgments
Conflicts of Interest
References
- Hungr, O.; Leroueil, S.; Picarelli, L. The Varnes Classification of Landslide Types, an Update. Landslides 2014, 11, 167–194. [Google Scholar] [CrossRef]
- Guo, Z.; Chen, L.; Yin, K.; Shrestha, D.P.; Zhang, L. Quantitative Risk Assessment of Slow-Moving Landslides from the Viewpoint of Decision-Making: A Case Study of the Three Gorges Reservoir in China. Eng. Geol. 2020, 273, 105667. [Google Scholar] [CrossRef]
- Petrucci, O. Landslide Fatality Occurrence: A Systematic Review of Research Published between January 2010 and March 2022. Sustainability 2022, 14, 9346. [Google Scholar] [CrossRef]
- Haque, U.; da Silva, P.F.; Devoli, G.; Pilz, J.; Zhao, B.; Khaloua, A.; Wilopo, W.; Andersen, P.; Lu, P.; Lee, J.; et al. The Human Cost of Global Warming: Deadly Landslides and Their Triggers (1995–2014). Sci. Total Environ. 2019, 682, 673–684. [Google Scholar] [CrossRef]
- Yazidi, M.; Benziane, F.; Yazidi, A.; Nabih, K.; Eloutassi, N. Gestion des instabilités de terrain au Maroc (cartographie et sécurité) [Management of landslide risks in Morocco (cartography and security)]. Int. J. Innov. Appl. Stud. 2017, 21, 25–36. [Google Scholar]
- Mohamed, Y.; Noureddine, E.; Khadija, N.; Hadi, H.A.; Abdelaziz, Y.; Fouad, B. Gestion Des Risques Majeurs Au Maroc: Les Instabilités De Terrain. Eur. Sci. J. ESJ 2017, 13, 46–59. [Google Scholar] [CrossRef] [Green Version]
- Chuaiwate, P.; Jaritngam, S.; Panedpojaman, P.; Konkong, N. Probabilistic Analysis of Slope against Uncertain Soil Parameters. Sustainability 2022, 14, 14530. [Google Scholar] [CrossRef]
- Bishop, A.W. The Use of the Slip Circle in the Stability Analysis of Slopes. Géotechnique 1955, 5, 7–17. [Google Scholar] [CrossRef]
- Wubalem, A. Comparison of General Limit Equilibrium Methods for Slope Stability Analysis. Ethiop. J. Nat. Comput. Sci. 2022, 2, 271–290. [Google Scholar] [CrossRef]
- Cai, F.; Ugai, K. Discussion: Slope Stability Analysis by Finite Elements. Géotechnique 2001, 51, 653–654. [Google Scholar] [CrossRef]
- Rotaru, A.; Bejan, F.; Almohamad, D. Sustainable Slope Stability Analysis: A Critical Study on Methods. Sustainability 2022, 14, 8847. [Google Scholar] [CrossRef]
- Keskin, M.S.; Kezer, S. Stability of MSW Landfill Slopes Reinforced with Geogrids. Appl. Sci. 2022, 12, 11866. [Google Scholar] [CrossRef]
- Baba, K.; Bahi, L.; Ouadif, L.; Akhssas, A. Slope Stability Evaluations by Limit Equilibrium and Finite Element Methods Applied to a Railway in the Moroccan Rif. Open J. Civ. Eng. 2012, 2, 27–32. [Google Scholar] [CrossRef] [Green Version]
- Göktepe, F.; Keskin, I. A Comparison Study between Traditional and Finite Element Methods for Slope Stability Evaluations. J. Geol. Soc. India 2018, 91, 373–379. [Google Scholar] [CrossRef]
- Memon, M.Y. A Comparison between Limit Equilibrium and Finite Element Methods for Slope Stability Analysis; Missouri University of Science and Technology: Rolla, MI, USA, 2018. [Google Scholar] [CrossRef]
- Khabbaz, H.; Fatahi, B.; Nucifora, C. Finite Element Methods against Limit Equilibrium Approaches for Slope Stability Analysis. In Australia New Zealand Conference on Geomechanics; Geomechanical Society and New Zealand Geotechnical Society: Wellington, New Zealand, 2012. [Google Scholar]
- Nagy-Göde, F.; Török, Á.; Horváth-Kálmán, E. The Stability Analysis of a Steep Slope at a Lake; Hungary. In Proceedings of the 6th International Conference on Geotechnical and Geophysical Site Characterization (ISC2020), Online, 26–29 September 2021; Available online: https://doi.org/10.53243/ISC2020-531 (accessed on 26 June 2023).
- Rabie, M. Comparison Study between Traditional and Finite Element Methods for Slopes under Heavy Rainfall. HBRC J. 2014, 10, 160–168. [Google Scholar] [CrossRef] [Green Version]
- Mansour, Z.S.; Kalantari, B. Traditional Methods vs. Finite Difference Method for Computing Safety Factors of Slope Stability. Electron. J. Geotech. Eng. 2011, 16, 1119–1130. [Google Scholar]
- Igwe, O.; Fukuoka, H. The Effect of Water-Saturation on the Stability of Problematic Slopes at the Iva Valley Area, Southeast Nigeria. Arab. J. Geosci. 2015, 8, 3223–3233. [Google Scholar] [CrossRef]
- Li, Y. A Review of Shear and Tensile Strengths of the Malan Loess in China. Eng. Geol. 2018, 236, 4–10. [Google Scholar] [CrossRef]
- Zhang, S.; Xu, Q.; Hu, Z. Effects of Rainwater Softening on Red Mudstone of Deep-Seated Landslide, Southwest China. Eng. Geol. 2016, 204, 1–13. [Google Scholar] [CrossRef]
- Ahmed, M.F.; Khan, M.S.; Raza, M.A.; Saqib, S.; Saadat, H. Slope failure analysis of havelian landslide, abbottabad pakistan. Pak. J. Sci. 2016, 68, 462–469. [Google Scholar]
- Roccati, A.; Paliaga, G.; Luino, F.; Faccini, F.; Turconi, L. Rainfall Threshold for Shallow Landslides Initiation and Analysis of Long-Term Rainfall Trends in a Mediterranean Area. Atmosphere 2020, 11, 1367. [Google Scholar] [CrossRef]
- Cevasco, A. Individuazione delle soglie pluviometriche di innesco di frane superficiali sul territorio comunale di genova: Il caso della val bisagno/evaluation of rainfall thresholds for triggering shallow landslides on the genoa municipality area (Italy): The case study of the bisagno valley. Ital. J. Eng. Geol. Environ. 2010, 1, 35–50. [Google Scholar] [CrossRef]
- Aleotti, P. A Warning System for Rainfall-Induced Shallow Failures. Eng. Geol. 2004, 73, 247–265. [Google Scholar] [CrossRef]
- Cannon, S.H.; Gartner, J.E.; Wilson, R.C.; Bowers, J.C.; Laber, J.L. Storm Rainfall Conditions for Floods and Debris Flows from Recently Burned Areas in Southwestern Colorado and Southern California. Geomorphology 2008, 96, 250–269. [Google Scholar] [CrossRef]
- Sengani, F.; Mulenga, F. Influence of Rainfall Intensity on the Stability of Unsaturated Soil Slope: Case Study of R523 Road in Thulamela Municipality, Limpopo Province, South Africa. Appl. Sci. 2020, 10, 8824. [Google Scholar] [CrossRef]
- Ait Lemkademe, A.; Michelot, J.-L.; Benkaddour, A.; Hanich, L.; Heddoun, O. Origin of Groundwater Salinity in the Draa Sfar Polymetallic Mine Area Using Conservative Elements (Morocco). Water 2022, 15, 82. [Google Scholar] [CrossRef]
- Adiguna, G.A.; Wijaya, M.; Rahardjo, P.P.; Sugianto, A.; Satyanaga, A.; Hamdany, A.H. Practical Approach for Assessing Wetting-Induced Slope Failure. Appl. Sci. 2023, 13, 1811. [Google Scholar] [CrossRef]
- Islam, M.A.; Islam, M.S.; Jeet, A.A. A Geotechnical Investigation of 2017 Chattogram Landslides. Geosciences 2021, 11, 337. [Google Scholar] [CrossRef]
- Lazzari, M.; Gioia, D.; Anzidei, B. Landslide Inventory of the Basilicata Region (Southern Italy). J. Maps 2018, 14, 348–356. [Google Scholar] [CrossRef] [Green Version]
- Martín-Martín, M.; Guerrera, F.; Hlila, R.; Maaté, A.; Maaté, S.; Tramontana, M.; Serrano, F.; Cañaveras, J.C.; Alcalá, F.J.; Paton, D. Tectono-Sedimentary Cenozoic Evolution of the El Habt and Ouezzane Tectonic Units (External Rif, Morocco). Geosciences 2020, 10, 487. [Google Scholar] [CrossRef]
- El Hamdouni, I.; Ait Brahim, L.; El Mahsani, A.; Abdelouafi, A. The Prevention of Landslides Using the Analytic Hierarchy Process (AHP) in a Geographic Information System (GIS) Environment in the Province of Larache, Morocco. Geomat. Environ. Eng. 2022, 16, 77–93. [Google Scholar] [CrossRef]
- Michard, A.; Mokhtari, A.; Lach, P.; Rossi, P.; Chalouan, A.; Saddiqi, O.; Rjimati, E.-C. Liassic Age of an Oceanic Gabbro of the External Rif (Morocco): Implications for the Jurassic Continent–Ocean Boundary of Northwest Africa. Comptes Rendus Geosci. 2018, 350, 299–309. [Google Scholar] [CrossRef]
- Khaddor, I.; Achab, M.; Soumali, M.R.; Alaoui, A.H. Rainfall-Runoff Calibration for Semi-Arid Ungauged Basins Based on the Cumulative Observed Hyetograph and SCS Storm Model: Application to the Boukhalef Watershed (Tangier, North Western Morocco). J. Mater. Environ. Sci. 2017, 8, 3795–3808. [Google Scholar]
- Hosseiny, H.; Crimmins, M.; Smith, V.B.; Kremer, P. A Generalized Automated Framework for Urban Runoff Modeling and Its Application at a Citywide Landscape. Water 2020, 12, 357. [Google Scholar] [CrossRef] [Green Version]
- Şen, Z. Hydrological Methodology Evolution for Runoff Estimations at Ungauged Sites. Water 2023, 15, 702. [Google Scholar] [CrossRef]
- Granata, F.; Gargano, R.; de Marinis, G. Support Vector Regression for Rainfall-Runoff Modeling in Urban Drainage: A Comparison with the EPA’s Storm Water Management Model. Water 2016, 8, 69. [Google Scholar] [CrossRef]
- GMTR. Direction des Routes et de la Circulation Routière. 2002. Guide Marocain pour les Terrassements Routier. Fascicule 1; Royaume du Maroc; Ministère de l’Equipement: Rabat, Morocco, 2002; 106p.
- NF P94-110; Soil: Investigation and Testing. Recognition and Tests—Menard Pressuremeter Test. French Standards Association: Paris, France, 1991.
- NF P94-114; Soil: Investigation and Testing. Recognition and Tests—Dynamic Penetration Test Type A. French Standards Association: Paris, France, 1990.
- NF-P94-056; Soil: Investigation and Testing. Granulometric Analysis. Dry Sieving Method after Washing. French Standards Association: Paris, France, 1996.
- NF-P94-052-1; Soil: Investigation and Testing. Atterberg Limit Determination. Part 1: Liquid Limit. Cone Penetrometer Method. AFNOR Editions: La Plaine Saint-Denis, France, 1995.
- NF-P94-053; Soil: Determination of the Density of Fine Soils in the Laboratory—Cutting Kit. Mould and Water Immersion Methods. AFNOR Editions: La Plaine Saint-Denis, France, 1991.
- NF-P94-071-1; Soil Investigation and Testing. Direct Shear Test with Shearbox Apparatus. Part 1: Direct Shear. French Standards Association: Paris, France, 1994.


| Precipitation Recurrence Interval | Maximum Daily Rainfall |
|---|---|
| 5 years | 71 mm |
| 10 years | 83 mm |
| 20 years | 95 mm |
| 50 years | 110 mm |
| 100 years | 121 mm |
| Return Period | Montana Coefficient a | Montana Coefficient b |
|---|---|---|
| 2 years | 4.688 | 0.662 |
| 5 years | 6.586 | 0.674 |
| 10 years | 7.878 | 0.680 |
| 20 years | 9.130 | 0.685 |
| 50 years | 10.760 | 0.690 |
| Properties Value | Used Standard | Unit | Kilometric Point 23 | Kilometric Point 48 | ||
|---|---|---|---|---|---|---|
| Upper Layer | Bottom Layer | Upper Layer | Bottom Layer | |||
| Dmax | NF P 94-056 [43] | mm | 63 | 25 | 63–80 | 40–63 |
| Particle size analysis | ||||||
| <80 µm | NF P 94-056 [43] | % | 40.9–42.9 | 53.4–53.2 | 33.5–36.2 | 11–23.6 |
| >2 mm | % | 22.7–25.1 | 7–7.2 | 45.5–47.2 | 40–68 | |
| >50 mm | % | 4.2–5.9 | - | 1.4–3.4 | 0–5.7 | |
| PI | NF P 94-051 [44] | % | 10–12 | 17–18 | 20–22 | 11–25 |
| Natural density (γh) | NF P 94-053 [45] | KN/m3 | 18.7 | 18.5 | 18.8–19 | 18.8–19.3 |
| Shearing parameters | ||||||
| Cohesion (c’) | NF P 94-071 [46] | KPa | 16–21 | 35–38 | 15–24 | 15–27 |
| Friction angle (Ø’) | ° | 22–24 | 30–31 | 30–35 | 29–35 | |
| GMTR classification | Moroccan guide for road earthworks [40] | C1A1 | A2 | C1A2 /C1B6 | B5 /C1B6 | |
| Location | Layers | Thickness (m) | Density (KN/m3) | Cohesion (KN/m2) | Friction Angle (°) |
|---|---|---|---|---|---|
| Kilometric point 23 | Clay loam | 7 | 18 | 10 | 15 |
| Sandy loam | 10 | 18.7 | 18 | 22 | |
| Substrate | Infinite | Infinite | Infinite | Infinite | |
| Kilometric point 48 | Gravelly loam | 5 | 18 | 12 | 16 |
| Friable shale | 9.5 | 18.4 | 16 | 20 |
Disclaimer/Publisher’s Note: The statements, opinions and data contained in all publications are solely those of the individual author(s) and contributor(s) and not of MDPI and/or the editor(s). MDPI and/or the editor(s) disclaim responsibility for any injury to people or property resulting from any ideas, methods, instructions or products referred to in the content. |
© 2023 by the authors. Licensee MDPI, Basel, Switzerland. This article is an open access article distributed under the terms and conditions of the Creative Commons Attribution (CC BY) license (https://creativecommons.org/licenses/by/4.0/).
Share and Cite
Inabi, O.; Attou, M.; Benzaazoua, M.; Qachar, M. Design of Cost-Effective and Sustainable Treatments of Old Landslides Adapted to the Moroccan Road Network: A Case Study of Regional Road R410 Crossing the Rifan Structural Domain. Water 2023, 15, 2423. https://doi.org/10.3390/w15132423
Inabi O, Attou M, Benzaazoua M, Qachar M. Design of Cost-Effective and Sustainable Treatments of Old Landslides Adapted to the Moroccan Road Network: A Case Study of Regional Road R410 Crossing the Rifan Structural Domain. Water. 2023; 15(13):2423. https://doi.org/10.3390/w15132423
Chicago/Turabian StyleInabi, Omar, Mustapha Attou, Mostafa Benzaazoua, and Mohamed Qachar. 2023. "Design of Cost-Effective and Sustainable Treatments of Old Landslides Adapted to the Moroccan Road Network: A Case Study of Regional Road R410 Crossing the Rifan Structural Domain" Water 15, no. 13: 2423. https://doi.org/10.3390/w15132423